Article

Balancing Employment and Environmental Goals: Evidence from BRICS and Other Emerging Economies, 1991–2020

1
School of Business, University of Petroleum and Energy Studies, Kandoli Campus, Dehradun 248007, Uttarakhand, India
2
Department of Management Science and Engineering, Khalifa University of Science and Technology, Abu Dhabi P.O. Box 127788, United Arab Emirates
3
Department of Economics and Finance, Birla Institute of Technology and Science (BITS), Pilani 333031, Rajasthan, India
4
School of Economics and Finance, Queensland University of Technology, Brisbane, QLD 4000, Australia
*
Author to whom correspondence should be addressed.
Sustainability 2025, 17(19), 8635; https://doi.org/10.3390/su17198635
Submission received: 9 July 2025 / Revised: 10 September 2025 / Accepted: 10 September 2025 / Published: 25 September 2025

Abstract

This paper examines how emerging markets balance the seemingly conflicting objectives of higher employment generation and improved environmental quality, with particular attention to the pivotal roles of trade openness and natural resource endowments. Utilizing a balanced panel dataset from 20 emerging economies that include all BRICS nations (except Ethiopia) and 10 other major emerging economies such as Mexico, Malaysia and Thailand spanning 1991–2020, the analysis applies the cross-section augmented autoregressive distributed lag (CS-ARDL) model to estimate both short- and long-run relationships. The findings indicate that increased trade openness and greater natural resource rents do not intensify the employment–environment trade-off; instead, they may facilitate simultaneous improvements in both areas, resulting in a win–win scenario. The results show that effective trade and resource management policies can reduce conflicts between unemployment and environmental issues, benefiting both the economy and the environment. This study also highlights the importance of integrated policies that connect trade liberalization, resource governance, and sustainability, offering useful guidance for emerging economies aiming for the Sustainable Development Goals (SDGs).

1. Introduction

The escalating threat of environmental degradation, largely driven by rising CO2 emissions in emerging economies, has intensified the urgency to examine the underlying factors that link economic development to ecological harm. Emerging economies such as Brazil, Russia, and India rank among the world’s largest carbon emitters, highlighting the scale of the challenge [1]. These trends underscore the need for policy frameworks that simultaneously address environmental deterioration and support inclusive growth. The issue is particularly acute given that economic expansion in developing nations often relies heavily on energy-intensive production, natural resource extraction, and trade-driven industrialization, all of which have direct implications for sustainability.
Researchers examining the nexus between environmental quality and macroeconomic variables have been particularly concerned with balancing employment generation and environmental sustainability. Recent studies provide both theoretical and empirical evidence of a potential conflict between these two goals. This tension arises because efforts to reduce unemployment often depend on policies that stimulate industrial activity, which can, in turn, increase pollution and carbon emissions. The trade-off has been conceptualized through the Environmental Phillips Curve (EPC) [2]. While the conventional Phillips Curve captures the short-run inverse relationship between unemployment and inflation, the EPC reflects a long-run structural trade-off between employment generation and environmental quality [3].
Parallel to this theoretical development, the policy landscape has been shaped by the United Nations Sustainable Development Goals (SDGs), which explicitly call for job creation (SDG 8), environmental action (SDG 13), and responsible resource management (SDG 12). These targets highlight the need for an integrated policy approach in emerging economies, particularly those endowed with substantial natural resources. The role of natural resource rents (NRR), revenues from the extraction and sale of oil, minerals, and timber has received heightened attention in this regard. While resource wealth has the potential to accelerate growth, evidence suggests it often comes with significant drawbacks, including environmental degradation [4,5,6]. Resource dependency tends to amplify emissions, delay the transition to renewable energy, and exacerbate ecological pressures, especially in labor-abundant economies with weaker institutional capacities [7]. Thus, the governance of natural resources becomes a pivotal factor in determining whether they serve as a blessing or a curse for both economic and environmental outcomes.
Another critical dimension shaping the employment generation and environmental quality is trade openness. The relationship between trade and the environment has long been debated, with scholars pointing to three principal channels of influence [8,9]. The scale effect suggests that trade expansion, by boosting output, increases emissions. The technology effect highlights the diffusion of cleaner and more efficient production methods through international trade, which can mitigate environmental harm. The composition effect reflects structural changes in production and trade patterns, which may either favor environmentally sustainable goods or exacerbate ecological damage [10,11,12,13,14]. The net outcome depends on the relative strength of these channels, making the trade–environment–employment relationship highly context-dependent.
This paper seeks to contribute to this ongoing debate by investigating the evolving interrelationship between employment generation, environmental sustainability, and macroeconomic policy in emerging markets. Specifically, it examines how trade openness and natural resource rents interact to shape the unemployment–environment trade-off across 20 emerging economies. Unlike prior studies that have analyzed growth, trade, or natural resources in isolation, this study adopts a more integrated approach by explicitly situating these variables within the Environmental Phillips Curve framework. The novelty of this research lies in exploring how trade-oriented growth strategies, when combined with resource endowments, alter the dynamics of the employment–environment nexus.
Accordingly, the present work is set out as follows: Section 2 discusses the theoretical background and empirical literature on the environment, employment, trade and growth links. The data and methodologies utilized in the investigation are elaborated in Section 3. The discussion of results and policy implications are presented in Section 4, and Section 5 concludes the study.

2. Theoretical Background and Empirical Literature on the Environment, Employment, Trade and Growth Links

The interlinkages between employment generation, environmental quality (EQ), trade openness (TO), natural resource rents (NRR), and economic growth have long been debated in both theoretical and empirical research. While the individual relationships among these variables are well documented, the literature remains divided on the joint effects they produce when analyzed together. One of the most established findings in macroeconomics is the inverse relationship between economic growth and unemployment, often captured by Okun’s law, which posits that unemployment falls during economic expansions and rises during contractions. However, this traditional growth–employment nexus largely overlooks environmental constraints, assuming resource availability and ecological capacity as given. In reality, sustained economic growth is frequently accompanied by energy-intensive industrialization that undermines environmental sustainability, thus generating a tension between unemployment reduction and environmental preservation.
Trade openness adds another dimension to this debate, as it shapes the growth–employment relationship by expanding market size, enhancing specialization, and improving resource allocation. Many studies find that more open economies tend to experience higher growth and lower unemployment [15,16,17,18,19]. However, other evidence highlights trade liberalization’s potentially adverse effects on employment when domestic industries lack competitiveness, especially in labor-abundant economies [20,21]. Empirical findings reveal strong heterogeneity depending on factor endowments, industrial structures, and labor market flexibility. For instance, some studies show that trade openness reduces unemployment in lower-income OIC countries but contributes to rising unemployment in higher-income counterparts [22,23]. Similarly, others emphasize the importance of flexible labor markets in ensuring that openness generates employment. These mixed findings underscore that trade’s employment effects are far from universal [24].
The literature on trade openness and environmental quality is equally inconclusive. Some works conceptualize three channels scale, technology, and composition effects through which trade liberalization influences environmental outcomes [8,25]. Depending on which effect dominates, trade can either worsen or improve environmental sustainability. Much of the empirical evidence points toward adverse consequences, with studies showing that liberalization increases carbon emissions in BRICS, Pakistan, the United States, and emerging economies more broadly [10,26,27,28,29,30,31]. However, others suggest that in capital-intensive economies, openness may facilitate emissions reduction [32]. These findings collectively suggest that the trade–environment nexus is mediated by institutional quality, energy structures, and industrial specialization.
Natural resource rents represent another important factor influencing the employment–environment–growth nexus. Defined as revenues from extracting and selling natural resources [33], NRR can reduce unemployment by creating jobs in extraction industries [34], but may simultaneously trigger “Dutch disease” by appreciating exchange rates and harming non-resource sectors such as manufacturing and agriculture. Empirical findings again reveal mixed outcomes. Some find both positive and negative effects of NRR on growth in developing economies [35], while others famously argue that resource dependence often results in a “resource curse,” slowing long-term development [36]. Later work emphasizes the role of institutional quality, showing that resource rents promote growth only in strong institutional settings [37,38]. Evidence on employment is also inconsistent: while some observe a negative relationship between NRR and unemployment in Pakistan [34], others find a positive association in OPEC countries, highlighting the role of structural and regional differences [24].
The environmental implications of NRR further complicate the picture. Resource-dependent economies often experience higher emissions and ecological degradation [39], particularly when resource windfalls discourage investment in renewable alternatives. Empirical findings are diverse: some report that NRR worsen ecological footprints in Asian economies [40], while others find that rents combined with renewable energy improve sustainability in OECD nations [41]. Similarly, some observe positive links between NRR and environmental quality in BRICS [42], whereas others report such outcomes only in industrialized countries [43]. These mixed results suggest that the resource–environment relationship is heavily conditioned by institutional quality, policy frameworks, and energy mix.
A more recent contribution to this literature is the Environmental Phillips Curve (EPC), developed by Kashem and Rahman [2]. Drawing from the classical Phillips Curve, which reflects the unemployment–inflation trade-off, the EPC posits a negative relationship between unemployment and environmental quality. Lower unemployment achieved through economic expansion, according to this framework, often comes at the cost of higher emissions and environmental degradation. Empirical evidence across diverse contexts including OECD, NICs, BRICST, and South Asian countries—generally supports this hypothesis [2,44,45,46,47,48,49]. These findings highlight the pressing challenge for policymakers: fostering job creation while maintaining environmental sustainability.
Despite the growing body of literature, several gaps remain. Findings on employment–environment linkages are inconsistent, varying by income levels, resource dependence, and labor market structures. Research on the direct relationship between NRR and employment is limited, with most studies focusing primarily on growth outcomes. Moreover, while the EPC framework has gained empirical traction, few studies have integrated the roles of trade openness and natural resource rents into this relationship. Finally, emerging economies where these dynamics are often most pronounced remain underrepresented in the existing literature.

3. Data and Methodology

This paper utilizes a panel dataset comprising 30 years of data from 1991 to 2020, gathered from 20 emerging nations and the data is gathered from two primary sources: World Development Indicators (WDI) generated from the World Bank and the Financial Development (FD) statistics from the International Monetary Fund (IMF) database. We employ the IMF World Economic Outlook Classification [50] to define emerging economies, namely Argentina, Brazil, Chile, China, Colombia, Egypt, Hungary, India, Indonesia, Iran, Malaysia, Mexico, Philippines, Poland, Russia, Saudi Arabia, South Africa, Thailand, Turkey, and the United Arab Emirates.
As outlined in the introduction, this study examines the interrelationships between unemployment, CO2 emissions, trade openness (TO), and natural resource rents (NRR) across 20 selected emerging economies over a 30-year period. Figure 1 displays the trend lines corresponding to the mean values of these variables. As indicated, trade openness (TO), carbon dioxide (CO2) emissions, and total net reproduction rate (NRR) have demonstrated a consistent upward trajectory, whereas unemployment rates have steadily decreased across the selected emerging economies over the past three decades. These patterns highlight the challenge faced by such nations: as they strive to strengthen their global presence, they must carefully balance sustainable growth with employment generation, placing particular emphasis on the efficient use of natural resources.
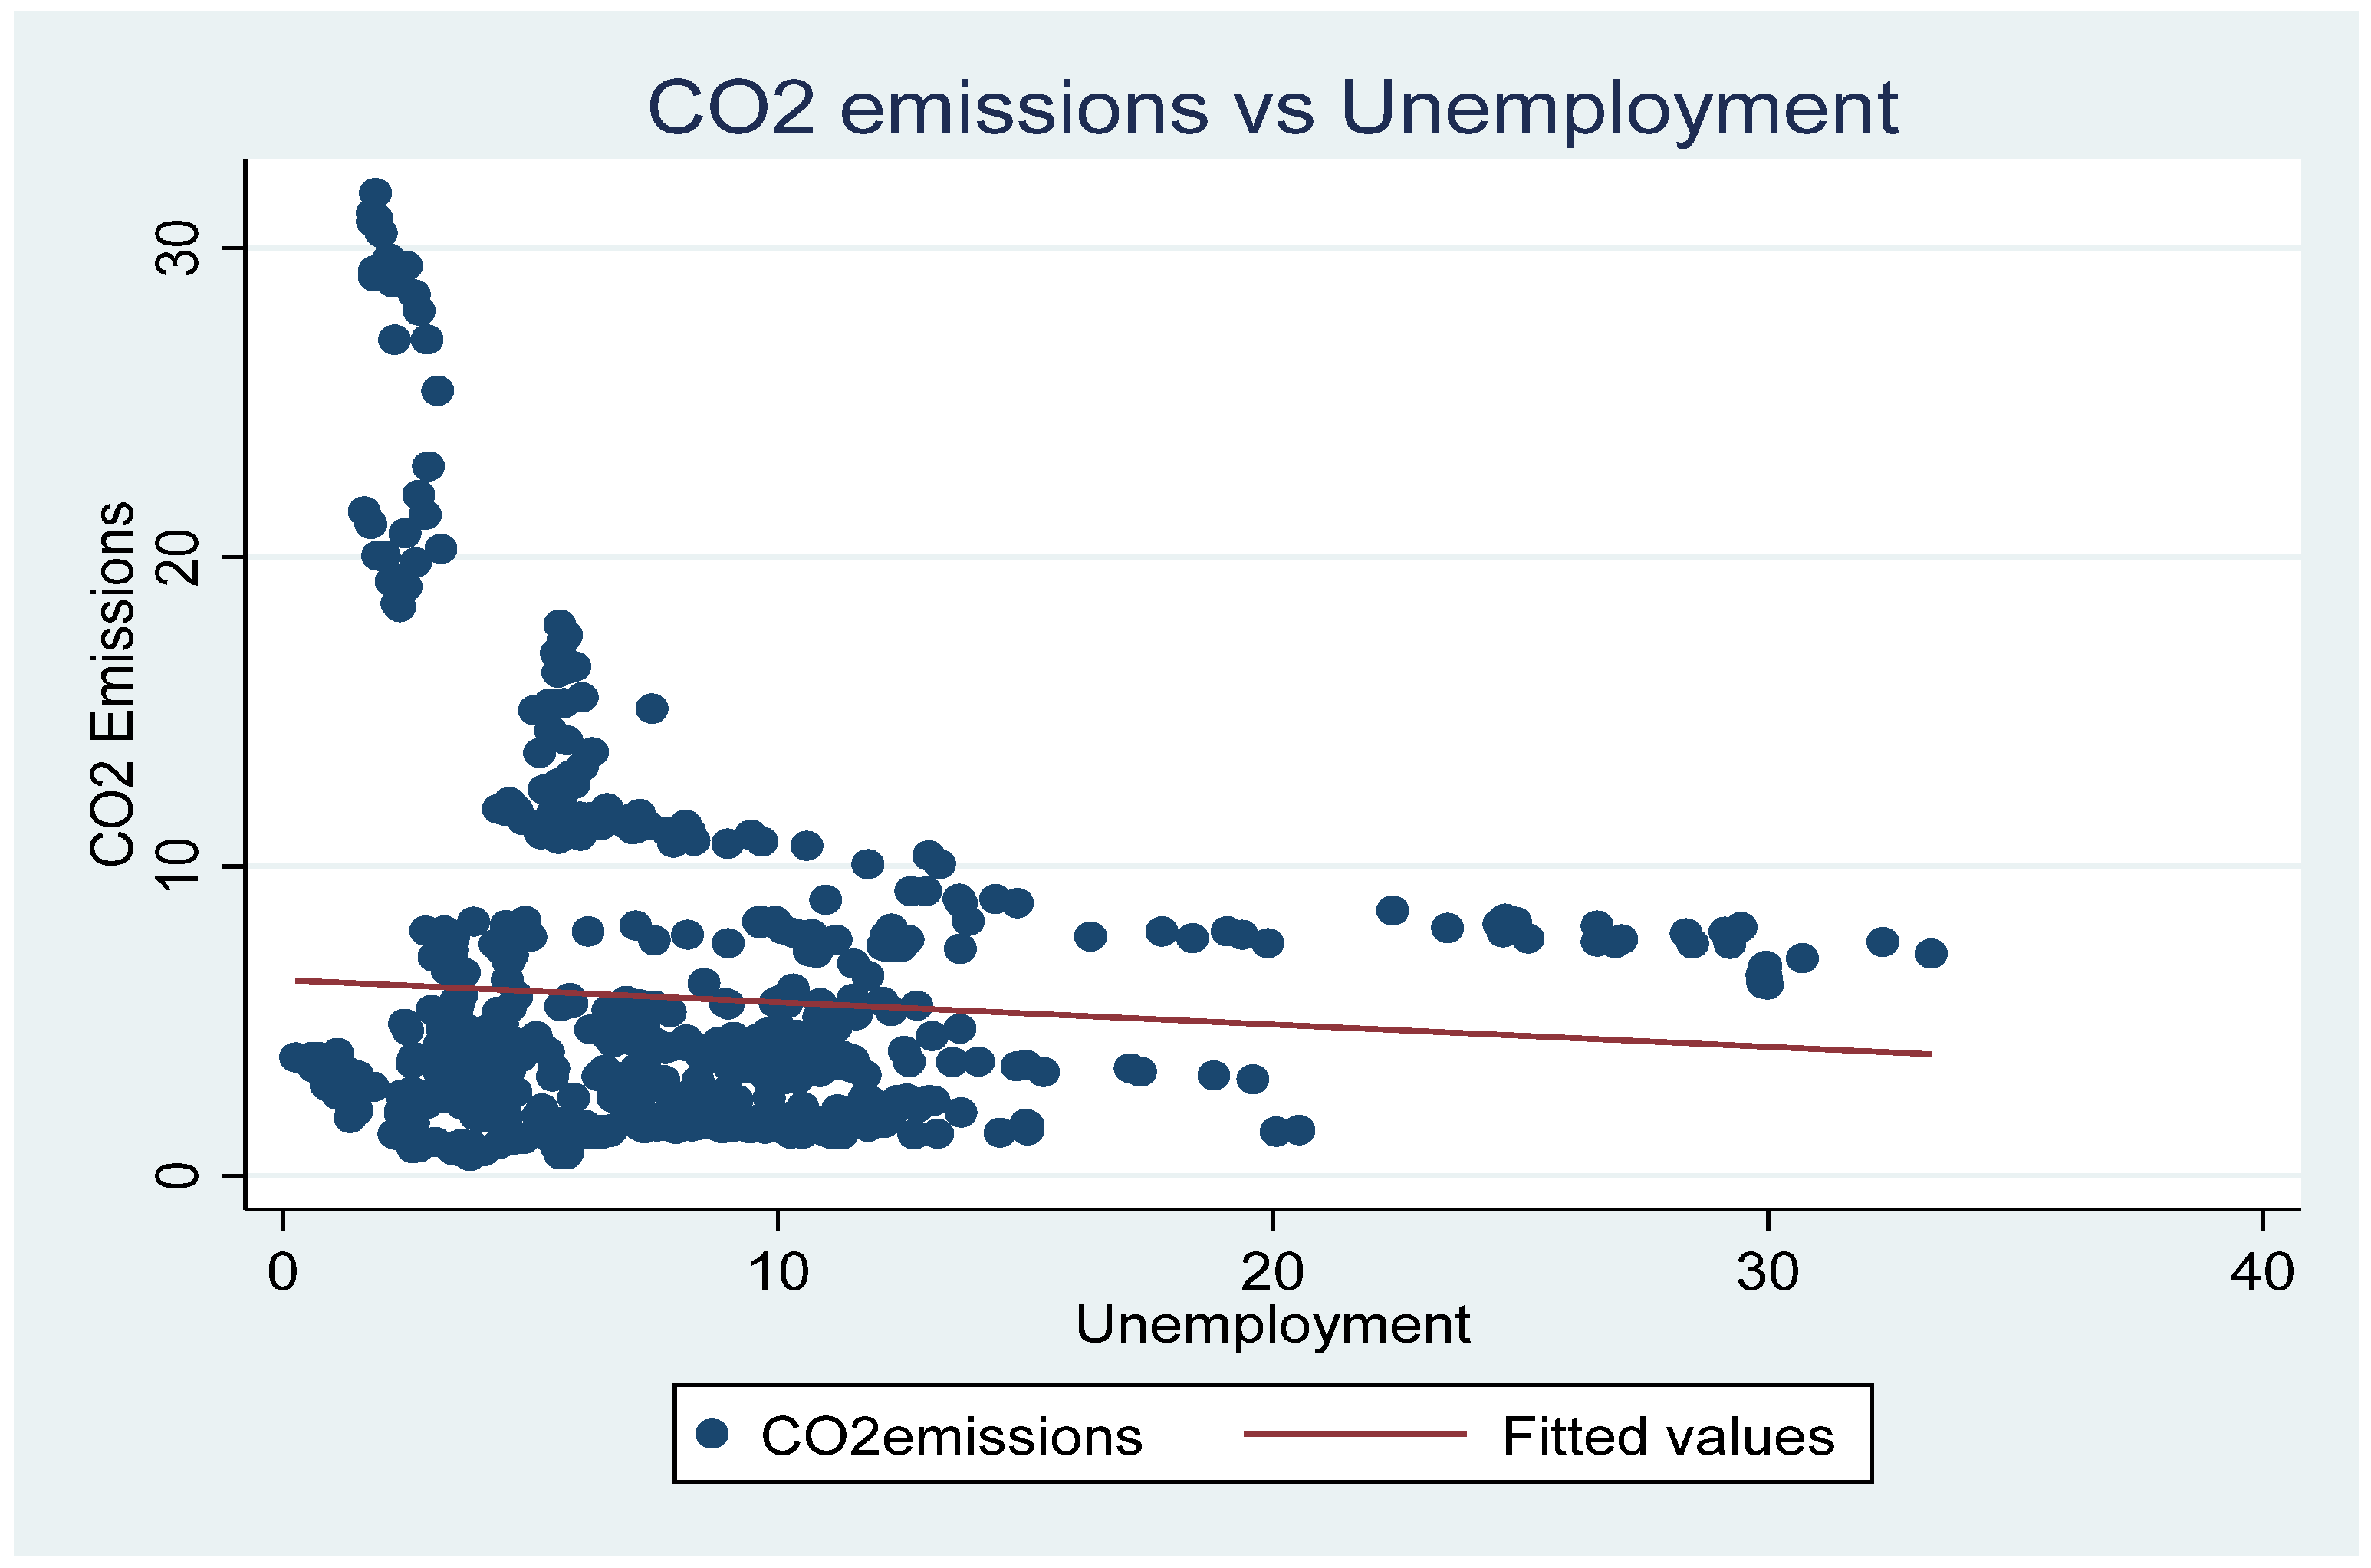
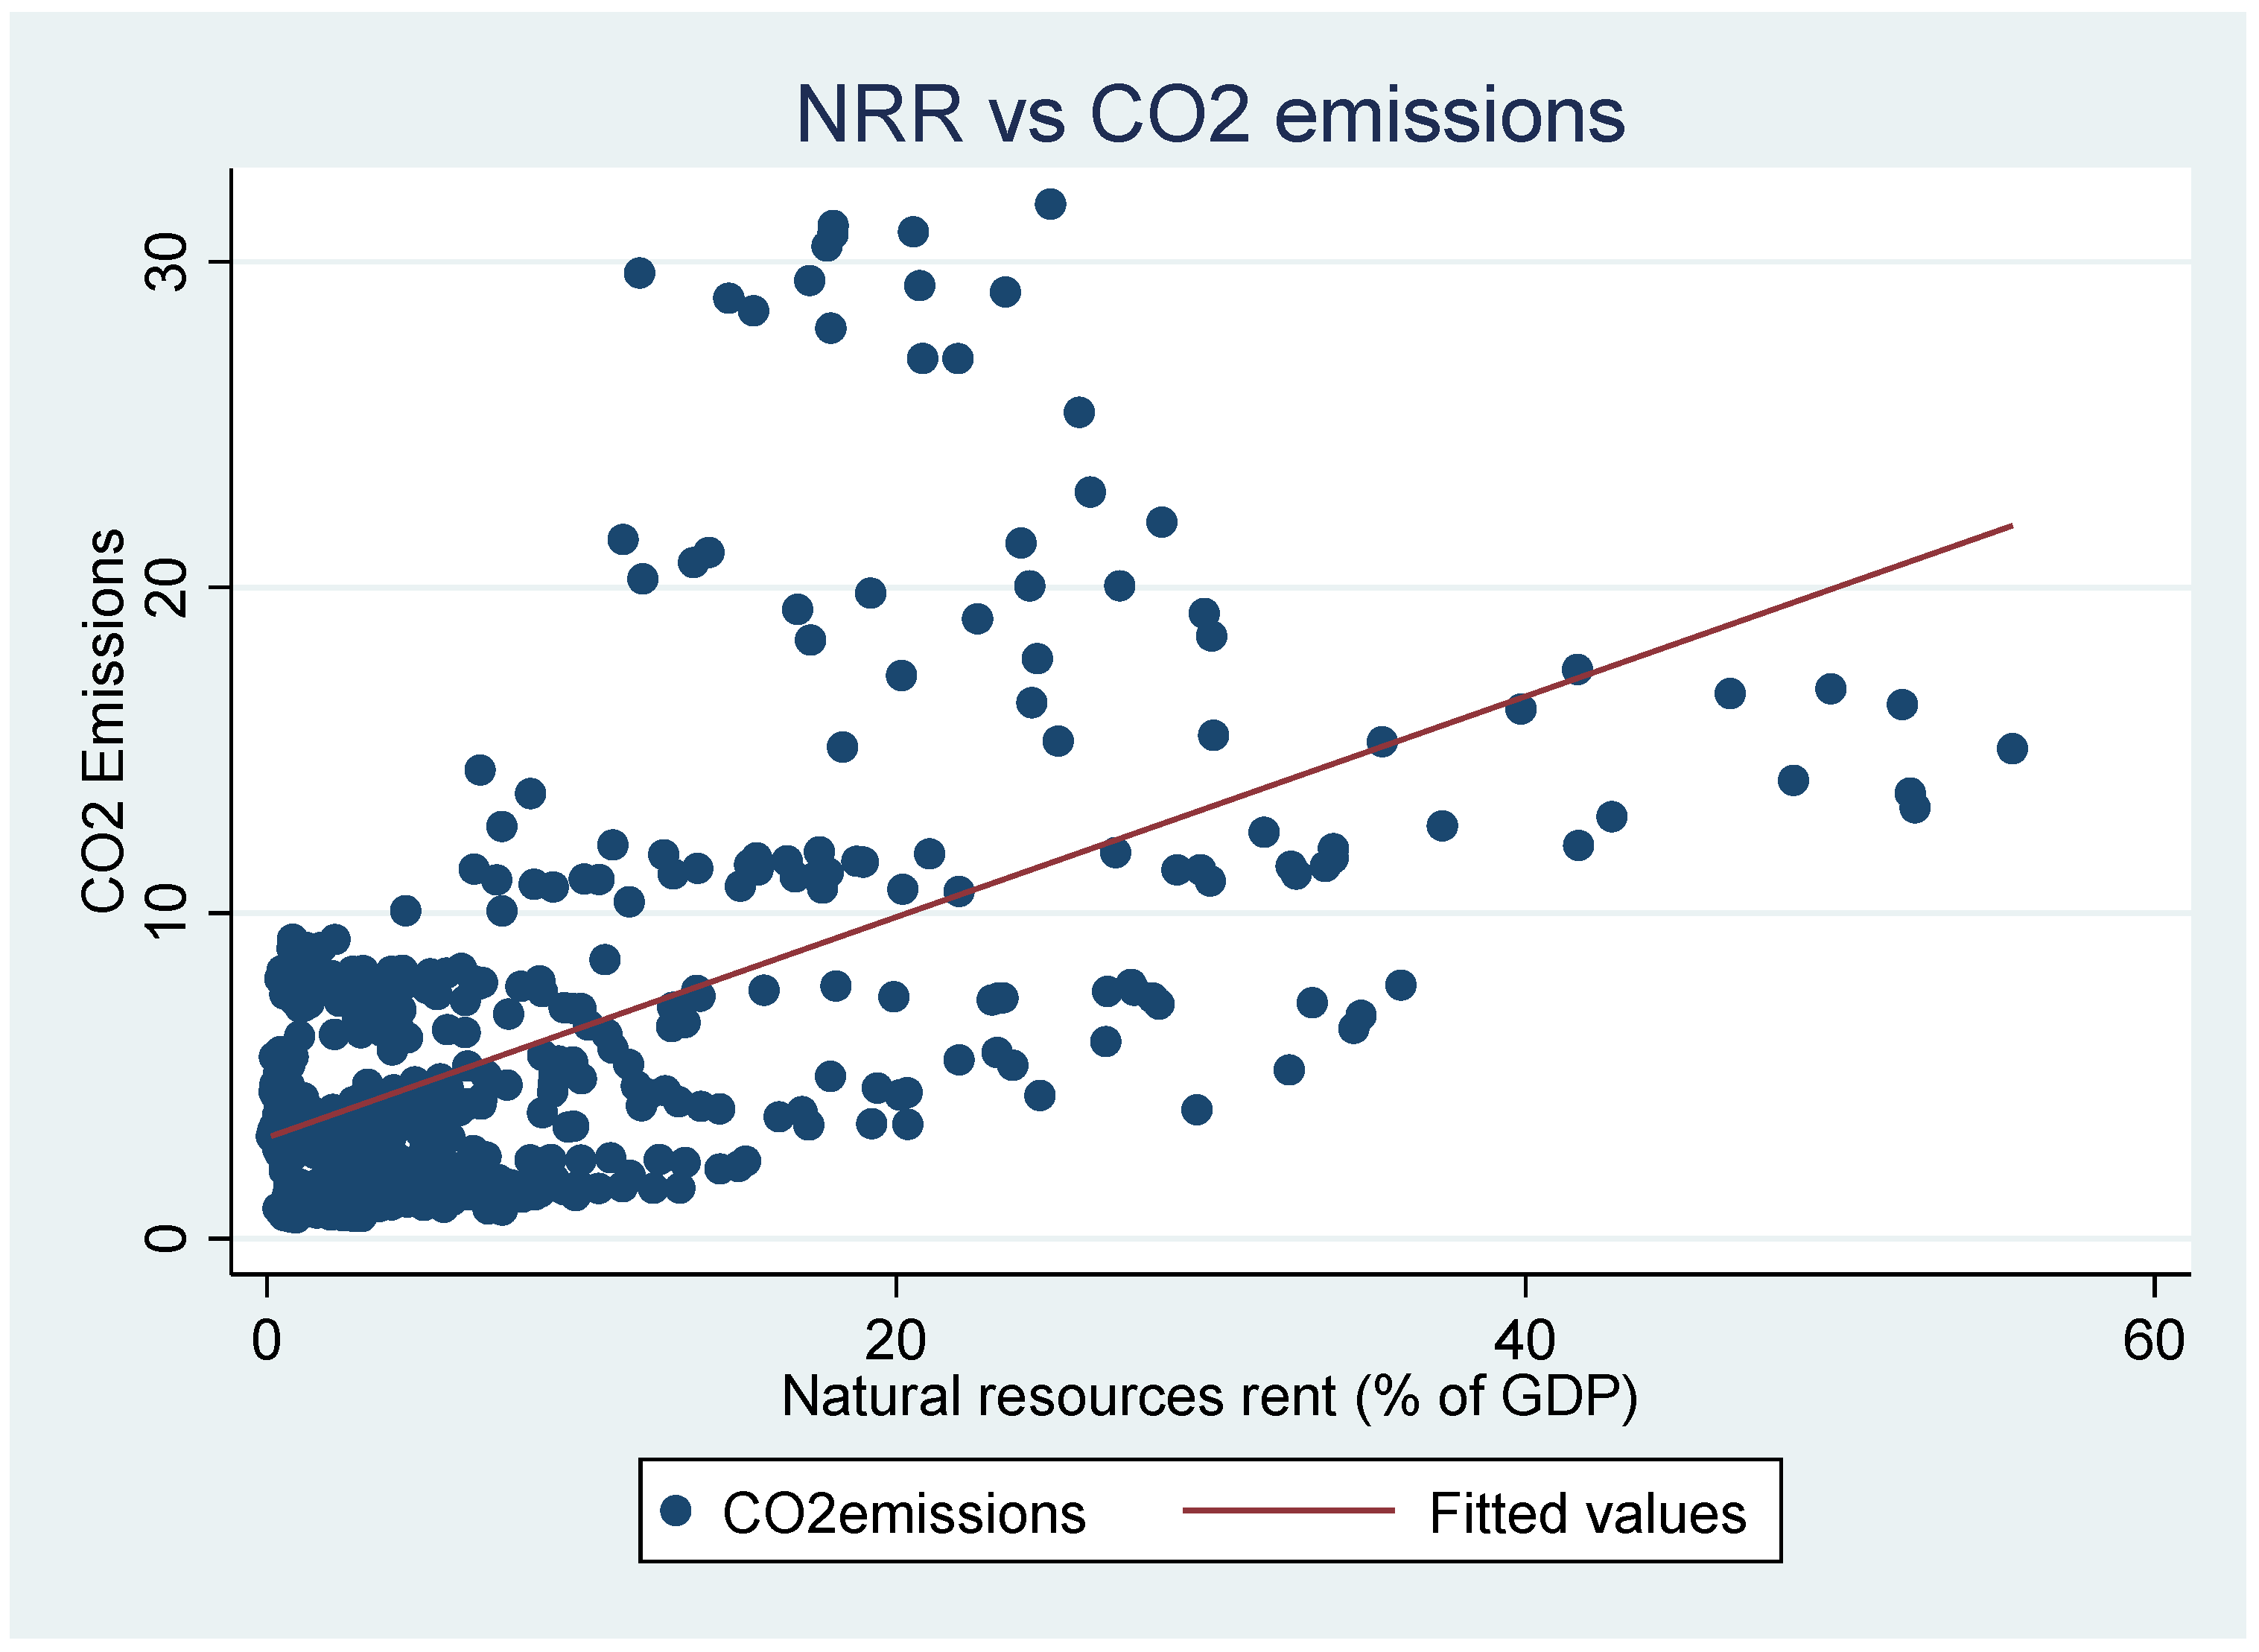
To further illustrate the preliminary interrelationships among these variables in our dataset, Figure 2 demonstrates the association between unemployment and environmental quality, while Figure 3 illustrates the linkage between natural resource rents and CO2 emissions within emerging economies. Figure 2 indicates that economic growth in these regions is often associated with reductions in unemployment rates, leading to increased energy consumption and higher CO2 emission levels. Conversely, Figure 3 demonstrates a potential positive correlation between natural resource rents and CO2 emissions in emerging economies. Greater dependence on resources such as oil, gas, coal, and minerals generates substantial rents, but also accelerates fossil fuel extraction, energy use, and industrial activity, all of which contribute to elevated emission levels.
This study conducts a systematic analysis of the impact of trade openness and natural resource rents on two United Nations Sustainable Development Goals: employment generation (SDG 8) and environmental quality (SDG 13) within emerging economies. To rigorously explore the intricate relationships among these factors and establish a foundation for empirical investigation, three distinct econometric models are employed and briefly outlined below.
Model 1 investigates the effect of unemployment on CO2 emissions, focusing on the potential trade-off between labor market outcomes and environmental sustainability. This specification essentially tests the validity of the Environmental Phillips Curve (EPC) in the context of emerging economies. The dependent variable is CO2 emissions, while the key explanatory variable is the unemployment rate. Several control variables are included, namely GDP, renewable energy consumption (REC), population growth, and foreign direct investment (FDI). The literature suggests that these factors exhibit noteworthy associations with CO2 emissions. For example, economic growth is generally linked to higher emissions due to increased industrial activity, whereas renewable energy mitigates this effect by substituting fossil fuels [51,52,53,54]. Similarly, population growth—locally or due to tourism—heightens energy and resource demand, thereby contributing to higher emissions [55,56,57]. Foreign direct investment may enhance environmental quality through the transfer of cleaner technologies; however, it can also exacerbate emissions if investment flows gravitate toward countries with weaker environmental regulations [58].
Model 2 considers unemployment as the dependent variable, with trade openness (TO), natural resource rents (NRR), GDP per capita, and inflation included as explanatory variables. The literature identifies multiple, and at times contradictory, channels through which NRR influences unemployment. On one hand, an increase in NRR may trigger the so-called “Dutch Disease,” whereby resources shift from tradable to non-tradable sectors, leading to de-industrialization and subsequent job losses [59]. On the other hand, resource-led job creation in extraction and related industries may help to reduce unemployment [60,61]. Similarly, trade openness generally improves resource allocation and promotes technology transfer, thereby lowering unemployment. However, in capital-abundant economies, trade openness may raise the demand for capital relative to labor, potentially leading to higher unemployment [19].
Model 3 represents the core specification of this study. It employs CO2 emissions as the dependent variable, with unemployment, natural resource rents (NRR), and trade openness (TO) as the principal explanatory variables, thereby providing a comprehensive assessment of their joint impact on environmental outcomes. Theoretical and empirical evidence suggests that the relationship between these factors and environmental quality is multifaceted. Consistent with endogenous growth theory, technological innovation may simultaneously foster economic performance and reduce environmental degradation through efficiency gains and cleaner production processes [62,63,64]. However, innovation can also exacerbate emissions by stimulating industrial expansion and resource-intensive activities [65,66]. Institutional quality and emerging technologies further condition this relationship. For instance, some demonstrate that stronger corruption control influences energy structures in favor of sustainability [67], while others emphasize the role of financial technologies in accelerating the transition toward clean energy [68]. Similarly, financial development has heterogeneous effects across Sub-Saharan Africa, underscoring the importance of policy frameworks that reconcile economic growth objectives with environmental sustainability [69].
The three models that we have discussed are represented in the following form
l C O 2 i t = β 0 + β 1 l u n e m p i t + β 2 l g d p p c i t + β 3 l r e c i t + β 4 P G i t + β 5 F D I i t + ε i t
l u n e m p i t = β 0 + β 1 l g d p p c i t + β 2 l t n r r i t + β 3 l t r a d e i t + β 4 l i n f l a t i o n i t + ε i t
l C O 2 i t = β 0 + β 1 l u n e m p i t + β 2 l g d p p c i t + β 3 l r e c i t + β 4 l t r a d e i t + β 5 l t n r r i t + β 6 F D i t + β 7 l i n n o v i t + ε i t
All these variables, except for population growth (PG), foreign direct investment (FDI), and financial development (FD) have been transformed using a logarithm. Hence, the prefix ‘l’ in these variables indicates the logarithmic transformation. Table 1 presents a description of each variable and the data source.
Panel data models are typically estimated using either fixed effects or random effects methods, both of which assume slope homogeneity across cross-sections. While this assumption simplifies estimation, prior studies highlight that if slope heterogeneity exists, estimators based on homogeneity may yield biased and inconsistent results, leading to unreliable inferences [70]. To address this concern, the study first applied slope homogeneity and cross-sectional dependence (CSD) tests. The results, reported in Table 2 and Table 3, indicate significant cross-sectional heterogeneity in the dataset.
Given these findings, the study employed the Cross-Sectionally Augmented Autoregressive Distributed Lag (CS-ARDL) model developed by Chudik and Pesaran [70]. This approach offers distinct advantages over traditional panel methods such as Pedroni [71], Kao [72], and Johansen’s system-based techniques. In particular, the CS-ARDL framework accommodates cross-sectional dependence by accounting for unobserved common factors such as energy price shocks which are especially relevant for resource-rich emerging economies. Additionally, CS-ARDL is flexible with respect to variable integration orders, handling both I(0) and I(1) series, provided none are I(2). Unlike conventional VAR or VECM approaches, CS-ARDL permits heterogeneous short-run dynamics and long-run relationships, making it more suitable for diverse panels.
Before estimating the three specified models, it is also essential to test the stationarity of the panel data, as the CS-ARDL methodology requires that none of the variables be integrated of order two. The results, reported in Table 4, indicate a mix of I(0) and I(1) processes across the variables.
The diagnostic test results indicate that the cross-section autoregressive distributed lag (CS-ARDL) approach is suitable for estimating both short-run and long-run relationships [71]. Nonetheless, it should be acknowledged that the CS-ARDL framework relies on the assumption of weak exogeneity, which limits its capacity to fully address issues of potential endogeneity among variables. To address this limitation, future research could employ panel structural vector autoregression (SVAR) models or simultaneous equation techniques, which are better suited to capturing feedback effects and disentangling causal mechanisms among the variables.

4. Discussion of Results and Policy Implications

4.1. Discussion of Results

As outlined earlier, the empirical analysis is based on three econometric models. Model 1 specifies CO2 emissions as the dependent variable, with unemployment as the key explanatory factor. Model 2 considers unemployment as the dependent variable, with natural resource rents and trade openness as the main regressors. Model 3 integrates the insights from the first two models by examining the determinants of CO2 emissions, with unemployment, natural resource rents, and trade openness serving as the principal explanatory variables. The estimated short-run and long-run coefficients for these models are presented in Table 5 and Table 6, respectively.
Model 1: Employment–Environment Trade-Off
The estimation results from Model 1 reveal intriguing dynamics. In the short run, the unemployment coefficient is negative and significant at the 10% level. This provides moderate statistical evidence that higher unemployment is associated with reduced CO2 emissions in the short run. The interpretation is intuitive: during periods of elevated unemployment, economic activity slows, resulting in lower industrial output, decreased energy consumption, and, consequently, fewer emissions.
More striking is the long-run effect. The coefficient of unemployment is larger in magnitude and highly statistically significant, suggesting that persistently higher unemployment contributes to an even greater reduction in emissions over time. This long-term relationship likely reflects structural changes: prolonged joblessness dampens industrial activity, suppresses aggregate demand, and discourages energy-intensive investments, resulting in consistently lower emissions.
From a policy perspective, this evidence underscores a classical employment–environment trade-off. While reducing unemployment is crucial for social welfare and economic development, doing so without environmental safeguards risks higher carbon emissions. These findings resonate with the conclusions of Kashem and Rahman [2] and Shastri et al. [73], who similarly document that labor market improvements, unless paired with green technologies or regulatory oversight, tend to elevate environmental pressures.
Model 2: Employment, Resource Dependence, and Trade Openness
Model 2 examines the impact of natural resource rents and trade openness on employment. The short-run coefficient for natural resource rents is positive and moderately significant, indicating that an increase in resource rents may initially result in higher unemployment. While this finding might seem counterintuitive since resource booms are typically associated with job creation, it is consistent with the “Dutch disease” phenomenon. A sudden influx of resource revenues can lead to currency appreciation, reducing the competitiveness of non-resource exports and consequently lowering employment in those sectors. Additionally, labour markets may encounter short-term frictions as workers transition between industries. These transitional dynamics help explain why unemployment may rise temporarily following an increase in resource rents.
In contrast, the long-run coefficient of natural resource rent is negative and significant. Over time, resource rents contribute to lower unemployment, suggesting that once economies adjust, resource revenues are harnessed to create employment opportunities. Governments may use these revenues to finance infrastructure, expand public services, or develop downstream industries, all of which create jobs. This finding aligns with Fattah [74], who finds beneficial long-run effects of resource wealth on employment.
Trade openness significantly reduces unemployment in both the short and long term. In the short run, increased openness quickly lowers unemployment, likely due to export growth and greater efficiency from global integration. Over time, a 1% rise in openness cuts unemployment by nearly 0.4%, supporting structural improvements in labour markets. These findings align with classical trade theory and studies like Carere et al. [75] showing that global integration fosters sustained employment growth.
Model 3: Determinants of Environmental Degradation
The third model integrates the insights of Models 1 and 2, taking CO2 emissions as the dependent variable while including unemployment, resource rents, and trade openness as main explanatory variables. Results from the model suggest that the short-run impacts of unemployment on CO2 emissions positive and statistically significant. This is interesting and one plausible explanation is that during times of high unemployment, governments may relax environmental regulations or prioritize stimulus programs, often relying on energy-intensive projects, to boost job creation leading to increased emissions. Over the long run, however, the relationship reverses indicating that persistently high unemployment reduces CO2 emissions. This shift in signs between short- and long-run estimates underscores the complexity of labor market–environment linkages.
For natural resource rents, both short-run (−0.002) and long-run (−0.019) coefficients are negative and moderately significant. This suggests that higher resource rents are associated with lower emissions, albeit modestly. This relationship could arise because resource revenues enhance government capacity to invest in cleaner technologies, promote renewable energy, or enforce environmental standards. However, the small magnitude indicates that these effects are highly dependent on governance quality.
Trade openness also shows a consistent negative relationship with emissions, both in the short run and long run. These results imply that openness allows countries to access cleaner technologies, shift toward less polluting industries, and benefit from international environmental standards. However, the modest statistical significance suggests that trade alone is insufficient to guarantee environmental improvements. Without complementary policies such as environmental regulations and technology transfers the potential of trade openness to reduce emissions remains limited.
Finally, per capita GDP exerts a positive and significant impact on emissions, with coefficients of 0.25 (short run) and 0.28 (long run). This finding highlights the classic “scale effect”: economic growth, unless decoupled from fossil fuel use, exacerbates emissions. This result echoes findings by Sun et al. [28] and Chien et al. [27] who report that economic expansion in emerging economies intensifies environmental degradation. However, it contrasts with studies such as Chhabra et al. [13] which emphasize that in certain contexts, trade openness can increase emissions, supporting the pollution haven hypothesis.
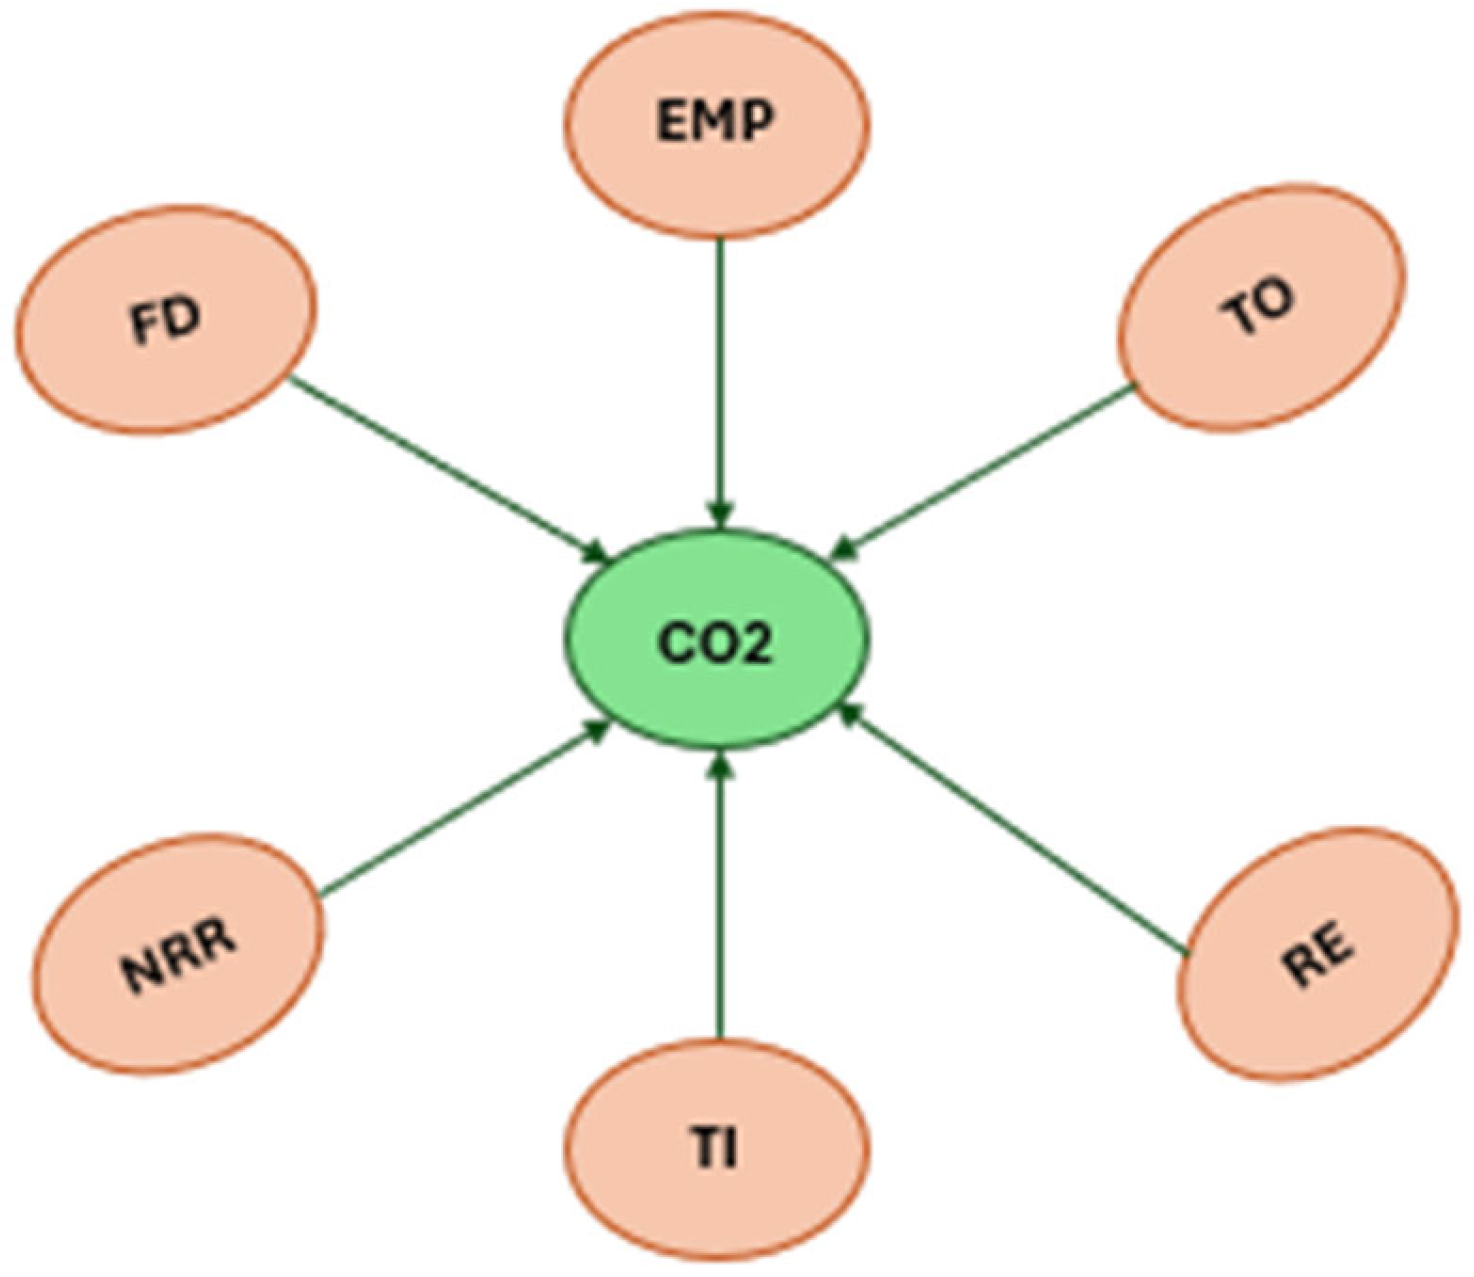
A Dumitrescu–Hurlin Granger non-causality test [76] was conducted to assess causal links between variables. As shown in Table 7 and Figure 4, results indicate that trade openness, natural resource rents, and unemployment each Granger-cause CO2 emissions, but not the reverse.

4.2. Policy Implications

The findings from this study offer several policy-related observations. First, Model 3 identifies short- and long-term relationships between unemployment and CO2 emissions that have implications for labour and environmental policies. In the short term, increased unemployment correlates with higher emissions, which may be due to slower adoption of clean technologies and reduced enforcement of environmental regulations during economic downturns. In contrast, prolonged unemployment is associated with lower emissions because of decreased industrial activity and energy usage. These results indicate that employment growth and environmental sustainability can be addressed simultaneously. Investment in green job creation within sectors such as renewable energy, energy efficiency, and sustainable infrastructure may help reduce unemployment while contributing to emission reductions over time.
Second, findings show a negative and statistically significant effect of natural resource rents on emissions in both the short and long term, suggesting that resource dependence, if managed effectively, may support environmental improvements. Resource-rich economies, such as the United Arab Emirates, can allocate natural resource rents toward cleaner technology, economic diversification, carbon capture, and sustainable urban development. Governance and reinvestment strategies are thus important for leveraging resource wealth to enhance both economic and environmental resilience.
Finally, the study reports that greater trade openness is linked to lower emissions, challenging the assumption that trade liberalization necessarily harms environmental outcomes. Including environmental provisions in trade agreements, promoting the importation of low-carbon technologies, and supporting export sectors with smaller carbon footprints are potential ways to use trade openness to facilitate sustainable growth.

5. Conclusions

This study investigates the relationship between unemployment, CO2 emissions, trade openness, and natural resource rents in 20 emerging economies from 1991 to 2020 using the CS-ARDL approach. Results indicate that, in the short term, higher unemployment is linked to increased emissions, likely due to delayed technology adoption and weaker regulatory enforcement. Conversely, in the long run, unemployment reduces emissions through decreased industrial activity. This highlights the importance of developing green employment policies that address both labor market challenges and environmental objectives.
Natural resource rents are found to reduce emissions modestly in both time horizons, suggesting that effective management and governance of such revenues can support environmental improvements. Trade openness consistently correlates with lower emissions, reflecting the positive environmental impact of “clean trade,” including technology transfer and the adoption of international standards.
These findings suggest that promoting green jobs, sound resource management, and sustainable trade can support simultaneous progress on economic growth and emission reduction, aligning with SDGs 8 and 13. However, sustained economic growth remains closely tied to fossil fuel emissions, underscoring the need for integrated policy strategies.
Limitations of the study include potential endogeneity, omission of factors like urbanization, and limited labor market data. Future research should employ broader datasets and advanced models to further clarify these complex relationships.

Author Contributions

Conceptualization, G.M.; Methodology, A.W. and G.M.; Formal analysis, A.W. and C.W.; Writing—original draft, N.J.; Writing—review & editing, G.M. and C.W. All individuals who meet the criteria for authorship have been included as authors and affirm their significant contributions to the work. Each author confirms their involvement in key aspects of the research, including the conception, design, analysis, drafting, or revision of the manuscript, and accepts public responsibility for its content. Additionally, all authors certify that the material presented has not been previously published or submitted for publication elsewhere and collectively agree to take responsibility for all aspects of the work. All authors have read and agreed to the published version of the manuscript.

Funding

The authors hereby declare that no funding or financial support was received from any individual, organization, or institution for the conduct of this research or the preparation of this manuscript.

Conflicts of Interest

The authors listed in this manuscript declare that they have no affiliations or involvement with any organization or entity that has a financial interest or a non-financial interest in the subject matter or materials presented in this manuscript.

References

  1. Durani, F.; Bhowmik, R.; Sharif, A.; Anwar, A.; Syed, Q.R. Role of economic uncertainty, financial development, natural resources, technology, and renewable energy in the environmental Phillips curve framework. J. Clean. Prod. 2023, 420, 138334. [Google Scholar] [CrossRef]
  2. Kashem, M.A.; Rahman, M.M. Environmental Phillips curve: OECD and Asian NICs perspective. Environ. Sci. Pollut. Res. 2020, 27, 31153–31170. [Google Scholar] [CrossRef] [PubMed]
  3. Rahman, M.M.; MiçOoğulları, S.A.; Değirmen, S.; Alancıoğlu, E.; Moalla, M. Exploring the environmental Phillips Curve: How do globalization, economic growth, and institutional quality shape load capacity factors in highly globalized European countries? J. Environ. Manag. 2025, 390, 126322. [Google Scholar] [CrossRef] [PubMed]
  4. Jain, N.; Mohapatra, G. Examining the trade-led Kuznets hypothesis for emerging economies: A multivariate framework. Int. J. Emerg. Mark. 2023, 20, 961–979. [Google Scholar] [CrossRef]
  5. Masi, T.; Savoia, A.; Sen, K. Is there a fiscal resource curse? Resource rents, fiscal capacity and political institutions in developing economies. World Dev. 2024, 177, 106532. [Google Scholar] [CrossRef]
  6. Hayat, A.; Tahir, M. Foreign direct investment, natural resources and economic growth: A threshold model approach. J. Econ. Stud. 2021, 48, 929–944. [Google Scholar] [CrossRef]
  7. Shao, S.; Yang, L. Natural resource dependence, human capital accumulation, and economic growth: A combined explanation for the resource curse and the resource blessing. Energy Policy 2014, 74, 632–642. [Google Scholar] [CrossRef]
  8. Grossman, G.M.; Krueger, A.B. The inverted-U: What does it mean? Environ. Dev. Econ. 1996, 1, 119–122. [Google Scholar] [CrossRef]
  9. Mahmood, H. Spatial effects of trade, foreign direct investment (FDI), and natural resource rents on carbon productivity in the GCC region. PeerJ 2023, 11, e16281. [Google Scholar] [CrossRef]
  10. Dou, Y.; Zhao, J.; Malik, M.N.; Dong, K. Assessing the impact of trade openness on CO2 emissions: Evidence from China-Japan-ROK FTA countries. J. Environ. Manag. 2021, 296, 113241. [Google Scholar] [CrossRef]
  11. Jain, N. A comparative analysis of export-led and domestic demand-led growth hypotheses in BRICS economies. Theor. Appl. Econ. 2022, 29, 125–138. [Google Scholar]
  12. Udeagha, M.C.; Ngepah, N. Does trade openness mitigate the environmental degradation in South Africa? Environ. Sci. Pollut. Res. 2022, 29, 19352–19377. [Google Scholar] [CrossRef]
  13. Chhabra, M.; Giri, A.K.; Kumar, A. Do trade openness and institutional quality contribute to carbon emission reduction? Evidence from BRICS countries. Environ. Sci. Pollut. Res. 2023, 30, 50986–51002. [Google Scholar] [CrossRef]
  14. Jain, N.; Verma, A.; Mohapatra, G. Driving human development through ecological impact for emerging economies: The role of trade openness. Environ. Sci. Pollut. Res. 2024, 31, 54804–54814. [Google Scholar] [CrossRef] [PubMed]
  15. Felbermayr, G.; Prat, J.; Schmerer, H.-J. Trade and unemployment: What do the data say? Eur. Econ. Rev. 2011, 55, 741–758. [Google Scholar] [CrossRef]
  16. Gozgor, G. The impact of trade openness on the unemployment rate in G7 countries. J. Int. Trade Econ. Dev. 2013, 23, 1018–1037. [Google Scholar] [CrossRef]
  17. Raifu, I.A. On the determinants of unemployment in Nigeria: What are the roles of trade openness and current account balance? Rev. Innov. Compet. A J. Econ. Soc. Res. 2017, 3, 5–30. [Google Scholar] [CrossRef]
  18. Onifade, S.T.; Ay, A.; Asongu, S.; Bekun, F.V. Revisiting the trade and unemployment nexus: Empirical evidence from the Nigerian economy. J. Public Affairs 2020, 20, 40–55. [Google Scholar] [CrossRef]
  19. Jain, N.; Mohapatra, G. Dynamic linkages between trade, growth, inequality, and poverty in emerging countries: An application of panel ARDL approach. J. Int. Trade Econ. Dev. 2023, 33, 1074–1090. [Google Scholar] [CrossRef]
  20. Madanizadeh, S.A.; Pilvar, H. The impact of trade openness on labour force participation rate. Appl. Econ. 2019, 51, 2654–2668. [Google Scholar] [CrossRef]
  21. Awad, A.; Yussof, I. International trade and unemployment: Evidence from selected Arab countries. Middle East Dev. J. 2016, 8, 198–229. [Google Scholar] [CrossRef]
  22. Liu, Z.; Ngo, T.Q.; Saydaliev, H.B.; He, H.; Ali, S. How do trade openness, public expenditure and institutional performance affect unemployment in OIC countries? Evidence from the DCCE approach. Econ. Syst. 2022, 46, 101023. [Google Scholar] [CrossRef]
  23. Ali, S.; Yusop, Z.; Kaliappan, S.R.; Chin, L.; Meo, M.S. Impact of trade openness, human capital, public expenditure and institutional performance on unemployment: Evidence from OIC countries. Int. J. Manpow. 2022, 43, 1108–1125. [Google Scholar] [CrossRef]
  24. Huang, S.-Z.; Sadiq, M.; Chien, F. The impact of natural resource rent, financial development, and urbanization on carbon emission. Environ. Sci. Pollut. Res. 2023, 30, 42753–42765. [Google Scholar] [CrossRef]
  25. Hasan, R.; Mitra, D.; Ranjan, P.; Ahsan, R.N. Trade liberalization and unemployment: Theory and evidence from India. J. Dev. Econ. 2012, 97, 269–280. [Google Scholar] [CrossRef]
  26. Lopez, R. The environment as a factor of production: The effects of economic growth and trade liberalization 1. In International Trade and the Environment; Routledge: London, UK, 2017; pp. 239–260. [Google Scholar]
  27. Chien, F.; Ajaz, T.; Andlib, Z.; Chau, K.Y.; Ahmad, P.; Sharif, A. The role of technology innovation, renewable energy and globalization in reducing environmental degradation in Pakistan: A step towards sustainable environment. Renew. Energy 2021, 177, 308–317. [Google Scholar] [CrossRef]
  28. Sun, Y.; Yesilada, F.; Andlib, Z.; Ajaz, T. The role of eco-innovation and globalization towards carbon neutrality in the USA. J. Environ. Manag. 2021, 299, 113568. [Google Scholar] [CrossRef]
  29. Ertugrul, H.M.; Cetin, M.; Seker, F.; Dogan, E. The impact of trade openness on global carbon dioxide emissions: Evidence from the top ten emitters among developing countries. Ecol. Indic. 2016, 67, 543–555. [Google Scholar] [CrossRef]
  30. Appiah, K.; Worae, T.A.; Yeboah, B.; Yeboah, M. The causal nexus between trade openness and environmental pollution in selected emerging economies. Ecol. Indic. 2022, 138, 108872. [Google Scholar] [CrossRef]
  31. Khan, H.; Weili, L.; Khan, I. Environmental innovation, trade openness and quality institutions: An integrated investigation about environmental sustainability. Environ. Dev. Sustain. 2022, 24, 3832–3862. [Google Scholar] [CrossRef]
  32. Yu, C.; Nataliia, D.; Yoo, S.-J.; Hwang, Y.-S. Does trade openness convey a positive impact for the environmental quality? Evidence from a panel of CIS countries. Eurasian Geogr. Econ. 2019, 60, 333–356. [Google Scholar] [CrossRef]
  33. Canh, N.P.; Schinckus, C.; Thanh, S.D. The natural resources rents: Is economic complexity a solution for resource curse? Resour. Policy 2020, 69, 101800. [Google Scholar] [CrossRef]
  34. Ali, A.; Zulfiqar, K. An assessment of association between natural resources agglomeration and unemployment in Pakistan. MPRA Pap. 2018, 89022, 1–15. [Google Scholar]
  35. Yu, Y. Role of Natural resources rent on economic growth: Fresh empirical insight from selected developing economies. Resour. Policy 2023, 81, 103326. [Google Scholar] [CrossRef]
  36. Sachs, J.D.; Warner, A.M. The curse of natural resources. Eur. Econ. Rev. 2001, 45, 827–838. [Google Scholar] [CrossRef]
  37. Mehlum, H.; Moene, K.; Torvik, R. Institutions and the resource curse. Econ. J. 2006, 116, 1–20. [Google Scholar] [CrossRef]
  38. James, A.; Aadland, D. The curse of natural resources: An empirical investigation of US counties. Resour. Energy Econ. 2011, 33, 440–453. [Google Scholar] [CrossRef]
  39. Shittu, W.; Adedoyin, F.F.; Shah, M.I.; Musibau, H.O. An investigation of the nexus between natural resources, environmental performance, energy security and environmental degradation: Evidence from Asia. Resour. Policy 2021, 73, 102227. [Google Scholar] [CrossRef]
  40. Tu, Y.T. Drivers of Environmental Performance in Asian economies: Do natural resources, green innovation and Fintech really matter? Resour. Policy 2024, 90, 104832. [Google Scholar]
  41. Nathaniel, S.P.; Yalçiner, K.; Bekun, F.V. Assessing the environmental sustainability corridor: Linking natural resources, renewable energy, human capital, and ecological footprint in BRICS. Resour. Policy 2021, 70, 101924. [Google Scholar] [CrossRef]
  42. Ali, Q.; Yaseen, M.R.; Anwar, S.; Makhdum, M.S.A.; Khan, M.T.I. The impact of tourism, renewable energy, and economic growth on ecological footprint and natural resources: A panel data analysis. Resour. Policy 2021, 74, 102365. [Google Scholar] [CrossRef]
  43. Anser, M.K.; Apergis, N.; Syed, Q.R.; Alola, A.A. Exploring a new perspective of sustainable development drive through environmental Phillips curve in the case of the BRICST countries. Environ. Sci. Pollut. Res. 2021, 28, 48112–48122. [Google Scholar] [CrossRef] [PubMed]
  44. Ng, C.-F.; Yii, K.-J.; Lau, L.-S.; Go, Y.-H. Unemployment rate, clean energy, and ecological footprint in OECD countries. Environ. Sci. Pollut. Res. 2022, 30, 42863–42872. [Google Scholar] [CrossRef] [PubMed]
  45. Rayhan, I.; Al Nahian, M.A.; Siddika, A. Re-evaluating the environmental Kuznets curve and environmental Phillips curve in Bangladesh: An augmented ARDL bounds test approach with a structural break. Jahangirnagar Econ. Rev. 2020, 31, 109–134. [Google Scholar]
  46. Tanveer, A.; Song, H.; Faheem, M.; Chaudhry, I.S. Validation of environmental Philips curve in Pakistan: A fresh insight through ARDL technique. Environ. Sci. Pollut. Res. 2022, 29, 25060–25077. [Google Scholar] [CrossRef]
  47. Bhowmik, R.; Syed, Q.R.; Apergis, N.; Alola, A.A.; Gai, Z. Applying a dynamic ARDL approach to the environmental Phillips curve (EPC) hypothesis amid monetary, fiscal, and trade policy uncertainty in the USA. Environ. Sci. Pollut. Res. 2022, 29, 14914–14928. [Google Scholar] [CrossRef]
  48. Tariq, S.; Mehmood, U.; Haq, Z.U.; Mariam, A. Exploring the existence of environmental Phillips curve in South Asian countries. Environ. Sci. Pollut. Res. 2022, 29, 35396–35407. [Google Scholar] [CrossRef]
  49. Duttagupta, R.; Pazarbasioglu, C. MILES to Go. Finance & Development, International Monetary Fund. 2021. Available online: https://www.imf.org/external/pubs/ft/fandd/2021/06/the-future-of-emerging-markets-duttagupta-and-pazarbasioglu.htm (accessed on 10 March 2025).
  50. Zaman, Q.U.; Wang, Z.; Zaman, S.; Rasool, S.F. Investigating the nexus between education expenditure, female employers, renewable energy consumption and CO2 emission: Evidence from China. J. Clean. Prod. 2021, 312, 10–1016. [Google Scholar] [CrossRef]
  51. Wijeweera, A.; Wilson, C.; Athukorala, W.; Rajapaksa, D.; Managi, S. Demand for electricity and its determinants in Australia: Policy implications. J. Dev. Areas 2025, 59, 115–128. [Google Scholar] [CrossRef]
  52. Pata, U.K. Renewable energy consumption, urbanization, financial development, income and CO2 emissions in Turkey: Testing EKC hypothesis with structural breaks. J. Clean. Prod. 2018, 187, 770–779. [Google Scholar] [CrossRef]
  53. Rehman, A.; Alam, M.M.; Ozturk, I.; Alvarado, R.; Murshed, M.; Işık, C.; Ma, H. Globalization and renewable energy use: How are they contributing to upsurge the CO2 emissions? A global perspective. Environ. Sci. Pollut. Res. 2023, 30, 9699–9712. [Google Scholar] [CrossRef]
  54. Yang, T.; Wang, Q. The nonlinear effect of population aging on carbon emission-Empirical analysis of ten selected provinces in China. Sci. Total Environ. 2020, 740, 140057. [Google Scholar] [CrossRef]
  55. Sharma, M.; Mohapatra, G.; Giri, A.K.; Wijeweera, A.; Wilson, C. Examining the tourism-induced environmental Kuznets curve hypothesis for India. Environ. Dev. Sustain. 2025, 27, 9107–9126. [Google Scholar] [CrossRef]
  56. Wang, Q.; Li, L. The effects of population aging, life expectancy, unemployment rate, population density, per capita GDP, urbanization on per capita carbon emissions. Sustain. Prod. Consum. 2021, 28, 760–774. [Google Scholar] [CrossRef]
  57. Pham, P.M.H.; Nguyen, T.D.; Nguyen, M.; Tran, N.T. FDI inflows and carbon emissions: New global evidence. Discov. Sustain. 2025, 6, 432. [Google Scholar] [CrossRef]
  58. Omojolaibi, J.A.; Egwaikhide, F.O. Oil price volatility, fiscal policy and economic growth: A panel vector autoregressive (PVAR) analysis of some selected oil-exporting African countries. OPEC Energy Rev. 2014, 38, 127–148. [Google Scholar] [CrossRef]
  59. Dartey-Baah, K.; Amponsah-Tawiah, K.; Aratuo, D. Emerging―Dutch disease in emerging oil economy: Ghana‘s perspective. Soc. Buses Rev. 2012, 7, 185–199. [Google Scholar] [CrossRef]
  60. Weber, J.G. The effects of a natural gas boom on employment and income in Colorado, Texas, and Wyoming. Energy Econ. 2012, 34, 1580–1588. [Google Scholar] [CrossRef]
  61. Pack, H. Endogenous growth theory: Intellectual appeal and empirical shortcomings. J. Econ. Perspect. 1994, 8, 55–72. [Google Scholar] [CrossRef]
  62. Sun, Y.; Li, H.; Andlib, Z.; Genie, M.G. How do renewable energy and urbanization cause carbon emissions? Evidence from advanced panel estimation techniques. Renew. Energy 2022, 185, 996–1005. [Google Scholar] [CrossRef]
  63. Zhang, W.; Li, G. Environmental decentralization, environmental protection investment, and green technology innovation. Environ. Sci. Pollut. Res. 2020, 29, 12740–12755. [Google Scholar] [CrossRef]
  64. Hsu, C.-C.; Quang-Thanh, N.; Chien, F.; Li, L.; Mohsin, M. Evaluating green innovation and performance of financial development: Mediating concerns of environmental regulation. Environ. Sci. Pollut. Res. 2021, 28, 57386–57397. [Google Scholar] [CrossRef]
  65. Ju, S.; Andriamahery, A.; Qamruzzaman; Kor, S. Effects of financial development, FDI and good governance on environmental degradation in the Arab nation: Dose technological innovation matters? Front. Environ. Sci. 2023, 11, 1094976. [Google Scholar] [CrossRef]
  66. Xu, R. How does control of corruption determine the structure of energy consumption? New empirical insights from ASEAN countries. J. Environ. Manag. 2025, 390, 126373. [Google Scholar] [CrossRef] [PubMed]
  67. Xu, R.; Chen, X.; Dong, P. Nexus among financial technologies, oil rents, governance and energy transition: Panel investigation from Asian Economies. Resour. Policy 2024, 90, 104746. [Google Scholar] [CrossRef]
  68. Acheampong, A.O. Modelling for insight: Does financial development improve environmental quality? Energy Econ. 2019, 83, 156–179. [Google Scholar] [CrossRef]
  69. Baltagi, B.H.; Jung, B.C.; Song, S.H. Testing for heteroskedasticity and serial correlation in a random effects panel data model. J. Econom. 2010, 154, 122–124. [Google Scholar] [CrossRef]
  70. Chudik, A.; Pesaran, M.H. Common correlated effects estimation of heterogeneous dynamic panel data models with weakly exogenous regressors. J. Econom. 2015, 188, 393–420. [Google Scholar] [CrossRef]
  71. Pedroni, P. Critical values for cointegration tests in heterogeneous panels with multiple regressors. Oxf. Bull. Econ. Stat. 1999, 61 (Suppl. S1), 653–670. Available online: https://onlinelibrary.wiley.com/doi/abs/10.1111/1468-0084.0610s1653 (accessed on 25 January 2025).
  72. Kao, C. Spurious regression and residual-based tests for cointegration in panel data. J. Econom. 1999, 90, 1–44. [Google Scholar] [CrossRef]
  73. Shastri, S.; Mohapatra, G.; Giri, A.K. The Environmental Philips Curve from a gender perspective: Empirical evidence from India. Environ. Sci. Pollut. Res. 2023, 30, 17487–17496. [Google Scholar] [CrossRef]
  74. Fattah, E.R.A. Natural resource rents and unemployment in oil exporting countries. Asian Econ. Financ. Rev. 2017, 7, 952. [Google Scholar] [CrossRef]
  75. Carrère, C.; Fugazza, M.; Olarreaga, M.; Robert-Nicoud, F. On the Heterogeneous Effect of Trade on Unemployment (No. P180). FERDI. 2016. Available online: https://unctad.org/publication/heterogeneous-effect-trade-unemployment (accessed on 25 January 2025).
  76. Dumitrescu, E.-I.; Hurlin, C. Testing for Granger non-causality in heterogeneous panels. Econ. Model. 2012, 29, 1450–1460. [Google Scholar] [CrossRef]
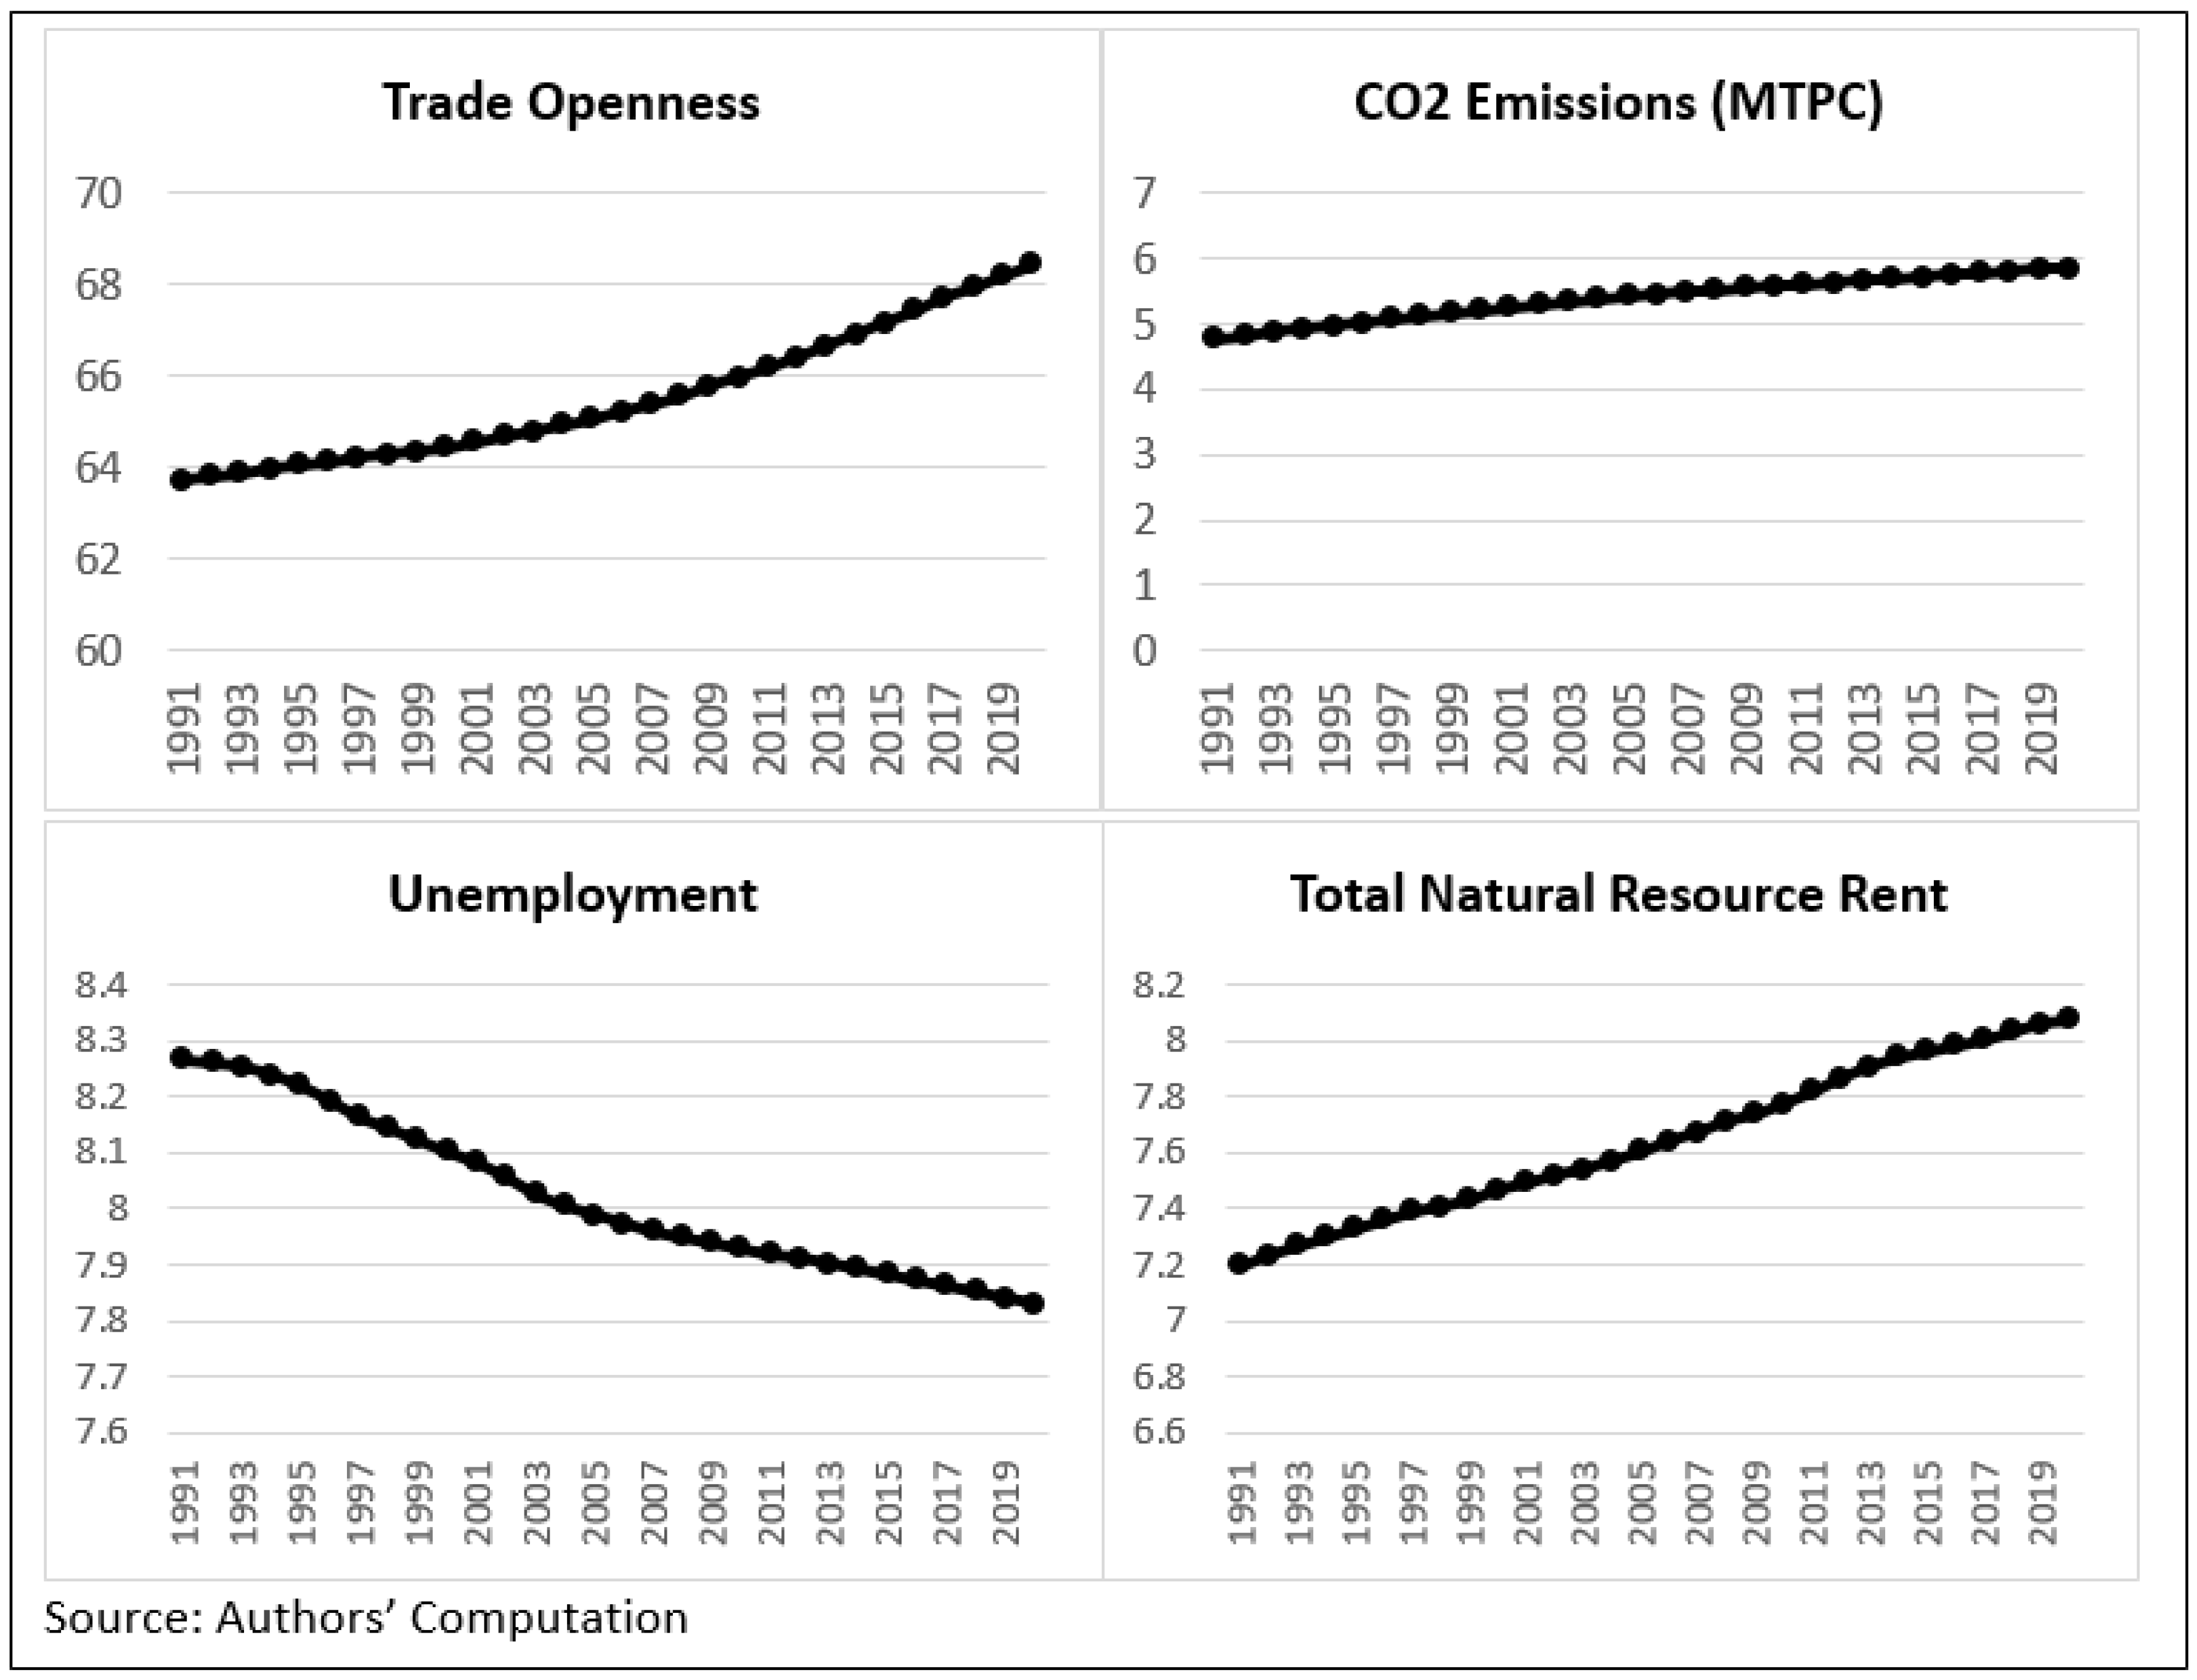
Figure 1. Mean values of KEY variables in Emerging Economies,1991–2019.
Sustainability 17 08635 g001
Figure 2. CO2 Emissions and Unemployment in Emerging Economies.
Sustainability 17 08635 g002
Figure 3. NRR and CO2 Emissions in Emerging Economies.
Sustainability 17 08635 g003
Figure 4. Results of the causality test.
Sustainability 17 08635 g004
Table 1. Variables’ definition and data sources.
Terminology Parameter NameScale of Measurement Data Extracted
lCO2 Growth in CO2 emissions Per person carbon dioxide emissions (metric tons)World Development Indicators (WDI), World Bank
lunemp Unemployment RateThe labor force that is not finding work but is available for and are job seekers (in percentage)
ltnrr Total natural resource rent Total revenue generated from extracting natural resources as a share of Gross Domestic Product
ltradeTrade opennessSummation of exports and imports of goods and services as a proportion of Gross Domestic Product
lgdppcEconomic growthGrowth in per head gross domestic product (constant 2010 USD)
lrecUse of renewable energyProportion of renewable energy in aggregate final energy consumption
linnovInnovationResearch and development expenditure (% of GDP)
PG Population growthYearly percentage
FDI Foreign direct investmentFDI net inflows (BoP, current US dollars)
linflation InflationGDP deflator (yearly percentage)
FD Financial developmentThe relative ranking of countries based on access, depth, and efficiency of their financial institutions and financial markets is the Financial Development Index.International Monetary Fund (IMF)
Table 2. Empirical results of slope homogeneity test.
DeltaDelta adj.p-Value
Model 123.759 ***27.162 ***0.000
Model 217.576 ***19.659 ***0.000
Model 319.307 ***23.332 ***0.000
Source: authors’ computation. Note: *** presents a significance level at 1 percent.
Table 3. Empirical results of cross-section dependence test.
VariablesCD-Testp-Value
lCO220.36 ***0.000
lunemp4.93 ***0.000
lgdppc53.26 ***0.000
ltnrr40.04 ***0.000
ltrade24.79 ***0.000
lrec16.23 ***0.000
FD39.26 ***0.000
linnov25.49 ***0.000
PG30.99 ***0.000
FDI7.51 ***0.000
linflation23.49 ***0.000
Source: authors’ computation. Note: *** presents a significance level at 1 percent.
Table 4. CADF stationarity test results.
VariablesAt LevelFirst Difference
lCO2−1.716−4.316 ***
lunemp−1.529−3.860 ***
lgdppc−1.794−3.434 ***
ltnrr−1.876−5.357 ***
ltrade−2.056 *
lrec−2.305 ***
FD−2.635 ***
linnov−2.789 ***
PG−1.992−2.642 ***
FDI−2.642 ***
linflation−3.523 ***
Source: authors’ computation. Note: ***, * presents significance levels at 1 and 10 percentages, respectively.
Table 5. CS-ARDL: Short-run coefficients.
ParametersModel 1 (lCO2)Model 2 (lunemp)Model 3 (lCO2)
lunemp−0.035 *
(0.019)
0.059 **
(0.024)
lgdppc0.356 ***
(0.106)
−1.112 **
(0.456)
0.250 **
(0.117)
lrec−0.284 ***
(0.060)
−0.363 ***
(0.070)
PG−0.032
(0.040)
FDI0.000
(0.002)
ltnrr 0.006 *
((0.049)
−0.002 *
(0.023)
ltrade −0.329 ***
(0.076)
−0.027 *
(0.035)
linflation −0.034
(0.047)
FD 0.068
(0.128)
linnov −0.009
(0.014)
ECT(−1)−0.866 ***
(0.038)
−0.665 ***
(0.147)
−0.821 ***
(0.041)
Source: authors’ own computation. Note: *, **, and *** show 10, 5, and 1 percent levels of significance, respectively; Numbers in parentheses indicate the standard errors.
Table 6. CS-ARDL: Long-run coefficients.
VariablesModel 1 (lCO2)Model 2 (lunemp)Model 3 (lCO2)
lunemp−0.044 *
(0.023)
−0.082 **
(0.036)
lgdppc0.389 ***
(0.129)
−3.412 **
(1.471)
0.282 **
(0.129)
lLrec−0.330 ***
(0.075)
−0.499 ***
(0.142)
PG−0.039
(0.050)
FDI0.000
(0.002)
ltnrr −0.074 *
(0.094)
−0.019 *
(0.034)
ltrade −0.388 **
(0.155)
−0.040 *
(0.062)
linflation 0.088
(0.140)
FD 0.139
(0.170)
linnov −0.015
(0.018)
Source: authors’ computation. Note: Numbers in parentheses indicate the standard errors. *, **, and *** show significance levels at 10, 5 and 1 percent, respectively.
Table 7. Dumitrescu–Hurlin causality test results.
VariablesZ-Bar Statisticsp-Value
FD→CO27.883 ***0.000
REC→CO25.483 **0.032
NRR→CO28.638 ***0.000
TO→CO214.641 ***0.000
TI→CO24.346 ***0.000
UNEMP→CO27.955 ***0.000
Source: Authors’ computation. Note: **, and *** show significance levels at 5 and 1 percent, respectively.
Disclaimer/Publisher’s Note: The statements, opinions and data contained in all publications are solely those of the individual author(s) and contributor(s) and not of MDPI and/or the editor(s). MDPI and/or the editor(s) disclaim responsibility for any injury to people or property resulting from any ideas, methods, instructions or products referred to in the content.