Abstract
This study evaluates China’s civil aviation total factor productivity (TFP) in 2000–2021, treating carbon emissions as undesirable output via the Global Malmquist–Luenberger (GML) index, with a modified carbon emission estimation coefficient to boost calculation accuracy. Static and dynamic time series regression models analyze short/long-term effects of influencing factors. Results show civil aviation TFP grows ~0.3% annually, stable with cyclical fluctuations, and exhibits dynamic adjustment and mean reversion. Market demand/competition significantly positively affect TFP in both models; technological innovation and capital investment have substantial lagged effects (not significant in the static model). The contributions include three aspects. First, methodological innovation through a revised carbon emission coefficient. Second, theoretical expansion by combining static and dynamic models. Third, macro policy guidance for balancing economic-environmental performance under China’s dual carbon strategy.
1. Introduction
Global climate change was recognized as an increasingly urgent issue that attracted widespread global attention, making carbon reduction a key priority worldwide. As a high-energy-consuming and high-carbon-emitting industry, the civil aviation sector faced growing pressure to pursue energy conservation and emissions reduction under the framework of the “dual carbon” strategy. In 2021, carbon emissions resulting from China’s energy activities totaled approximately 10.1 billion tons, with the transportation sector accounting for over 1 billion tons. Civil aviation emissions accounted for nearly 10% of the transportation sector’s total carbon emissions. Within China’s transportation sector, civil aviation emissions are a significant contributor. In 2023, China’s civil aviation sector experienced significant year-on-year increases in total freight tonnage, passenger volume, and cargo and mail volume, recovering to 91.9%, 93.9%, and 97.6% of 2019 levels, respectively. Under the “dual carbon” goals, China’s civil aviation sector continues to see a steady increase in carbon emissions, with a significant gap remaining between current levels and the targets for carbon peaking and carbon neutrality. This poses a major challenge for the sector in formulating emission reduction plans and achieving emission reduction targets. The civil aviation sector is a vital component of China’s national economy. The coordination between its industrial development and environmental performance has become increasingly critical. Total factor productivity (TFP) serves as a key metric for evaluating the sector’s efficiency. When carbon emissions are incorporated as an undesirable output, TFP plays a pivotal role in facilitating the low-carbon transition. Existing research has progressed along the following lines: the evolution of TFP measurement methods, the incorporation of environmental constraints, and the identification of influencing factors. The literature review below will be organized according to this framework to clearly identify research gaps.
Research on TFP measurement methods has evolved from neglecting to emphasizing environmental factors. In the early stages of TFP research in the aviation industry, primary attention had been given to traditional productivity indicators. Duke and Torres [1] examined changes in civil aviation TFP and emphasized its crucial role in driving sectoral growth. Russell [2] demonstrated that between 1997 and 2014, the aviation sector ranked second among 63 industries in terms of TFP growth. Brits [3] measured the TFP of South Africa’s civil aviation sector and analyzed efficiency changes following industry liberalization. While these studies laid a foundational basis for TFP evaluation in aviation, environmental concerns were largely disregarded.
As environmental factors gain increasing prominence in efficiency assessments, incorporating pollutants as undesirable outputs into analytical frameworks has become a key focus of methodological innovation. Kumar [4] proposed an environmentally sensitive productivity growth framework and applied the Malmquist–Luenberger index to account for environmental impacts. Oh [5] extended the Global Malmquist–Luenberger (GML) index to address feasibility limitations in conventional models. Jeon and Sickles [6] investigated the role of environmental variables in productivity growth, thereby providing a theoretical basis for integrating carbon emissions into the TFP framework.
A number of empirical studies assessed environmental efficiency in the civil aviation sector at both global and regional levels. Arjomandi and Seufert [7] evaluated the technical and environmental performance of major international airlines, observing relatively high environmental efficiency among European carriers. Scotti and Volta [8] empirically analyzed CO2-sensitive productivity across European airlines from 2000 to 2010 and found that environmentally sensitive productivity increased at a slower rate than traditional productivity. Xu et al. [9] applied the directional distance function DEA method to assess environmental efficiency in the U.S. civil aviation sector, confirming that airline type and route structure significantly influenced efficiency. Ali and See [10] re-examined global airline environmental efficiency using a parametric enhanced hyperbolic distance function, identifying average segment length and payload factors as key determinants.
Beyond improvements in measurement methods, identifying the drivers of carbon emissions and exploring pathways for reduction constitute another key research focus. Several studies further explored the relative impacts of various drivers of carbon emissions Liu et al. [11] identified transport capacity and revenue as the primary drivers of emission changes in aviation. Kito et al. [12] revealed that the emission-reducing effects of fuel-efficient aircraft in Japan were offset by increased flight frequency. Wang et al. [13] highlighted energy intensity as a key factor in reducing transport-related emissions in China. Timilsina and Shrestha [14] investigated CO2 emission growth in Latin America’s transport sector, concluding that economic growth and energy intensity were the dominant contributors, with the latter playing a more significant role. Lin and Xie [15] further examined emission reduction potential within China’s transport industry.
Strategies for emissions reduction have been studied from multiple perspectives. Hu et al. [16], employing a life-cycle approach, emphasized demand-side management, technological advancement, and alternative fuels as three essential pathways. Sharma et al. [17] explored the impact of CORSIA implementation on U.S. airline emissions, stressing the importance of biofuel alternatives. Kaya and Kayalica [18] assessed the efficiency of emissions reductions under CORSIA within the EU and noted strong technical performance in Eastern European countries, though globalization hindered overall effectiveness. Moreira et al. [19] analyzed the life-cycle emissions of sugarcane-based renewable jet fuel, offering new perspectives on aviation-related emission reductions.
A diverse range of methodological tools and evaluation frameworks for assessing aviation TFP has also been proposed. Zhang Peiwen et al. [20] examined airline operational efficiency using a three-stage DEA model. Sang Meiying and Gao Hongwei [21] reviewed measurement methods for TFP in the transport sector. Vasigh and Fleming [22], Assaf [23], Zou [24], and others contributed analytical frameworks for evaluating airline productivity, production changes, and fuel efficiency. Huang Ganxiang et al. [25] analyzed changes in airline TFP under carbon constraints in China. Liu et al. [26] investigated the relationships among factor market distortions, technological change, and green growth in the civil aviation sector, identifying market distortions as key drivers. Moreover, studies by Öztürk and Serin [27], Queiroz Júnior et al. [28], Chen et al. [29], and Ju and Chen [30] offered multidimensional insights into environmental efficiency, CO2 emissions comparisons, and ecological performance in the transportation field. Yu Zhaoyu [31] also incorporated carbon emissions in a study of TFP within China’s transportation industry.
Recent research has further expanded the theoretical framework and methodologies for assessing industrial efficiency under carbon emission constraints. Chang et al. [32] analyzed data from 30 provinces in China to confirm that green technological innovations have a significant effect on reducing CO2 emissions, with environmental regulations playing a crucial regulatory role in this process. Fu et al. [33] analyzed COVID-19 pandemic data to identify the dynamic interconnections between environmental concerns and green financial instruments, offering a new perspective on how external shocks impact environmentally sensitive industries. Xia and Phillips et al.’s [34] research indicates that the combination of environmental leadership and artificial intelligence technology can effectively promote the adoption of carbon capture technology by enterprises. In terms of digital technology applications, Wang et al. [35] proposed a ResNet-BIGRU-TPA network model based on deep learning, significantly improving the accuracy of anomaly detection during the carbon neutrality process. Wang et al. [36] further revealed the complex interplay between public environmental concerns, government environmental regulations, and urban carbon emission reductions, finding that green finance and industrial agglomeration play important regulatory roles. These studies lay an important foundation for an in-depth analysis of the evolution mechanism of total factor productivity (TFP) in the aviation industry under the synergistic effects of technological innovation, policy guidance, and market mechanisms.
This study is based on the concept of total factor productivity (TFP) in Solow’s growth theory, with TFP serving as the core indicator for measuring technological progress and efficiency changes. The production possibility set theory in environmental economics provides a theoretical basis for incorporating non-desirable outputs such as carbon emissions, while the weak disposability assumption ensures the scientific validity of productivity measurement under environmental constraints. The Global Malmquist-Luenberger productivity index is constructed using a global reference technology, effectively addressing the issue of measuring productivity in the presence of both desirable and non-desirable outputs. The mechanisms through which technological innovation and human capital influence productivity in endogenous growth theory provide the theoretical basis for static and dynamic time series regression model analysis frameworks. These theories lay a solid foundation for systematically analyzing the evolution of TFP under carbon constraints in the aviation industry.
In summary, existing research has made significant progress in improving TFP measurement methods, assessing environmental efficiency, and analyzing influencing factors, yet there remains room for further exploration. Methodologically, while approaches like the GML index are widely applied, carbon emission estimation remains reliant on a single fuel consumption coefficient, overlooking contributions from other energy sources and leading to systematic underestimation. Analytically, existing studies predominantly employ static analysis, with insufficient attention to TFP’s dynamic adjustment mechanisms and long-term evolution patterns. Regarding theoretical integration, a systematic analytical framework remains absent for understanding how the lagged effects of technological innovation and market competition mechanisms jointly influence TFP under carbon constraints. Addressing these research gaps, this study focuses on three core questions: (1) constructing a more accurate carbon emissions estimation model for the aviation sector; (2) revealing the dynamic evolution patterns of China’s aviation TFP under carbon constraints; and (3) distinguishing the short-term and long-term mechanisms of various influencing factors.
2. TFP Indicator Selection and Data Sources
2.1. Input and Output Indicators for TFP Measurement
The input and output indicators served as the foundation for measuring total factor productivity (TFP). These indicators were required to accurately reflect the production process of the civil aviation industry, particularly in terms of resource inputs and performance outputs. The framework for the indicator system was primarily derived from existing literature concerning the efficiency of the civil aviation sector. As an industry characterized by multiple inputs and outputs, civil aviation is aligned with the TFP theoretical framework within the context of economic growth theory. Based on this theoretical foundation and relevant empirical research [20,21,22,23,24,25,26], the input indicators were selected to include labor input, fixed asset investment, and energy consumption, while the expected output indicators comprised total turnover and revenue. In consideration of the environmental impact of carbon emissions on the civil aviation industry, energy consumption was additionally treated as an input indicator, and carbon emissions were incorporated into the model as an undesirable output.
Descriptions of the input indicators are as follows:
- Number of Employees.
The number of employees refers to the total personnel engaged in civil aviation transport and related services throughout the year. It was regarded as a core indicator for evaluating labor input in the civil aviation sector. This workforce encompassed pilots, flight attendants, aircraft maintenance personnel, and professionals involved in ground services, air traffic management, security inspection, and administrative functions. This indicator directly represented the level of labor input and served as a key metric for assessing human capital investment. Additionally, it reflected the operational scale and service quality of the civil aviation industry during the year.
- 2.
- Fixed Asset Investment.
Fixed asset investment denoted the total annual investment made by the civil aviation industry for the acquisition of aircraft, the construction of airport infrastructure, and the maintenance of related facilities. It was considered a key indicator for measuring capital input. This metric directly revealed the level of capital investment and reflected the industry’s capital accumulation capacity and development potential. Fixed asset investment played a significant role in enhancing the operational efficiency of the sector.
- 3.
- Energy Consumption.
Energy consumption was defined as the total amount of energy consumed for production and operational activities within the civil aviation sector during the year, including fuel consumption and electricity usage at airports and terminals. This indicator functioned as a critical measure of energy input. It reflected the level of energy input, illustrated the structure of operational costs, and indicated the carbon emission foundations of the industry. Furthermore, it highlighted the sector’s responsiveness to global low-carbon and sustainable development strategies and supported the evaluation of technological progress and the effectiveness of energy-saving and emission-reduction initiatives.
Descriptions of the output indicators were as follows:
- Total Turnover Volume.
Total turnover volume was defined as the total transportation output completed by the civil aviation industry within a given year, encompassing both passenger and cargo turnover. It was recognized as a key indicator for measuring the sector’s output level. This indicator directly reflected the transport capacity of the industry and illustrated its operational scale, network efficiency, and service capabilities. It also supported the assessment of the industry’s economic performance and social contribution.
- 2.
- Business Revenue.
Business revenue refers to the total annual income generated by civil aviation enterprises from transport-related services, including passenger transport, cargo transport, and airport services. It served as a key indicator for evaluating the operating status and economic performance of the industry. This metric reflected the industry’s financial outcomes and, to some extent, indicated its market competitiveness and service capability.
- 3.
- Carbon Emissions.
Carbon emissions were defined as the total amount of CO2 emissions generated by the civil aviation industry during the year as a result of energy consumption. This indicator acted as a core measure of the industry’s environmental impact and green production efficiency. It reflected the environmental burden imposed by the sector and indicated its performance in achieving green and sustainable development goals.
It should be noted that this study focuses on CO2 emissions as the primary greenhouse gas, and does not currently consider other air pollutants generated by the civil aviation industry, such as nitrogen oxides (NOx), particulate matter (PM), and sulfur oxides (SOx). Although these pollutants are significantly smaller in total volume than CO2 and are not considered in this analysis, they may amplify environmental impacts through synergistic effects. Future research could develop a comprehensive environmental index to incorporate the interactions of multiple pollutants into the TFP assessment framework.
Annual time series data covering the entire Chinese civil aviation industry from 2000 to 2021, were used as the empirical foundation for this study. The data were primarily obtained from the Civil Aviation Statistics Yearbook, the Statistical Bulletin on the Development of the Civil Aviation Industry (2000–2021), and the National Bureau of Statistics of China. Specifically, data on fixed asset investment, energy consumption, route mileage, total turnover volume, and business revenue were collected from the Civil Aviation Statistics Yearbook and the Statistical Bulletin on the Development of the Civil Aviation Industry. Information on the number of employees was derived from the National Bureau of Statistics of China. However, data on CO2 emissions in civil aviation were not directly available and were instead estimated through computational methods.
2.2. Estimation and Analysis of Carbon Emissions in China’s Civil Aviation Industry
Carbon emissions in the civil aviation industry were treated as a key undesirable output in this study, and the corresponding data were derived through estimation. According to the 2006 IPCC Guidelines for National Greenhouse Gas Inventories, two general approaches for carbon emission estimation were outlined: the “top-down” and “bottom-up” methods. However, due to the complexity of emission sources and the mobile nature of emissions in the civil aviation sector, direct and precise measurement was not practically feasible. As a result, the “top-down” approach was commonly employed in empirical research for estimating carbon emissions in the aviation industry.
Given that kerosene served as the primary fuel consumed by civil aircraft, a calculation method based on energy consumption was adopted for the estimation of carbon emissions. The specific formula used was as follows:
where Ci represents the total carbon emissions of the civil aviation industry in year i; Ei denotes the total consumption of aviation kerosene in year i; and I is the carbon emission coefficient of aviation kerosene, which was generally taken as 3.15 kg/kg according to the IPCC guidelines.
If other energy sources were excluded and estimation relied solely on emissions from aviation kerosene, the calculated carbon emissions of the civil aviation industry would have been underestimated. To reduce this estimation bias, the aforementioned formula was refined through the introduction of a carbon emission correction coefficient, denoted as α, which was defined as the ratio of primary energy consumption from other sources to the consumption of aviation kerosene. Considering the industry representativeness and data completeness of China Eastern Airlines as a leading carrier, its energy consumption profile was regarded as reflective of broader industry characteristics. Therefore, data from China Eastern Airlines were employed in the calculation of the correction coefficient α.
The selection of China Eastern Airlines data to calculate the correction coefficient α is justified by several factors. First, China’s civil aviation industry exhibits a highly concentrated oligopoly pattern. According to Civil Aviation Administration statistics, China Eastern Airlines, Air China, and China Southern Airlines collectively hold over 70% of the domestic air transport market share, with China Eastern accounting for approximately 23%. These three carriers exhibit high consistency in fleet structure, route networks, and operational models, primarily operating mainstream Boeing and Airbus aircraft types. They maintain similar proportions of domestic and international routes and share fundamentally identical energy consumption structures. Furthermore, detailed corporate-level energy consumption data is rarely disclosed in China’s civil aviation sector. This is particularly true for non-aviation fuel energy data. China Eastern Airlines is one of the few airlines providing comprehensive data. Their records span from 2010 to 2023 and include multiple energy types. This data is sourced from the airline’s official corporate social responsibility reports, lending it high credibility. In addition, as the market environment for listed companies became increasingly standardized after 2010—and this period marked a critical stage for low-carbon technological advancement in the civil aviation sector—data spanning from 2010 to 2023 were selected to compute α. During this period, China Eastern Airlines’ consumption of electricity, natural gas, gasoline, diesel, and aviation kerosene was compiled and converted into standard coal equivalents in accordance with the General Principles for Calculation of Comprehensive Energy Consumption. The standard coal equivalents for electricity, natural gas, gasoline, and diesel were aggregated and compared with the standard coal equivalent of aviation kerosene. The average value of this ratio over the ten-year period was adopted as the value of the α.
The Formula (1) was therefore adjusted as follows:
The calculated value of the correction coefficient α was 0.006475.
It is worth noting that the carbon emission correction coefficient method proposed in this study exhibits significant methodological originality in the following aspects:
First, the originality of the coefficient construction. Existing studies generally use the single IPCC standard coefficient of 3.15 kg/kg for carbon emission estimation. This paper is the first to construct a correction coefficient α = 0.006475 based on actual operational data from China’s civil aviation industry. The calculation of this coefficient takes into account the consumption of multiple energy sources such as electricity, natural gas, gasoline, and diesel, addressing the shortcomings of existing methods that overlook non-aviation fuel energy sources. Second, the technical approach is innovative. This study uniquely combines standard coal equivalent conversion with carbon emission coefficients to establish a new carbon emission estimation model tailored to China’s civil aviation industry.
Due to the limited availability of publicly accessible data on non-aviation fuel energy consumption by civil aviation enterprises, this study selected China Eastern Airlines as the sample for calculating α, primarily based on its industry representativeness as one of the three major backbone airlines, and assuming that its energy consumption structure can approximately reflect the overall characteristics of the industry. Additionally, the calculated α value (0.006475) indicates that the proportion of non-aviation fuel energy is extremely low (approximately 0.65%), and its impact on the estimation of total carbon emissions is minimal, thereby causing limited interference in the analysis of the core trend of TFP.
Figure 1 illustrates the estimated values of the carbon emission correction coefficient for China’s civil aviation industry. As shown in Figure 1, from a long-term perspective, carbon emissions in the industry exhibited a consistent upward trajectory. However, distinct temporal phases were observed, with varying growth rates across different periods. During the initial development stage of the industry, carbon emissions remained relatively low and increased at a moderate pace. Following the onset of the 21st century, a sharp escalation in emissions occurred, driven by the rapid growth in air transport demand and the sector’s accelerated expansion. Between 2010 and 2015, the average annual growth rate of carbon emissions exceeded 12%, with total emissions surpassing 30 million tons. From 2015 to 2021, the overall trend of carbon emissions continued to rise, despite temporary fluctuations during the exceptional period of 2020–2021.
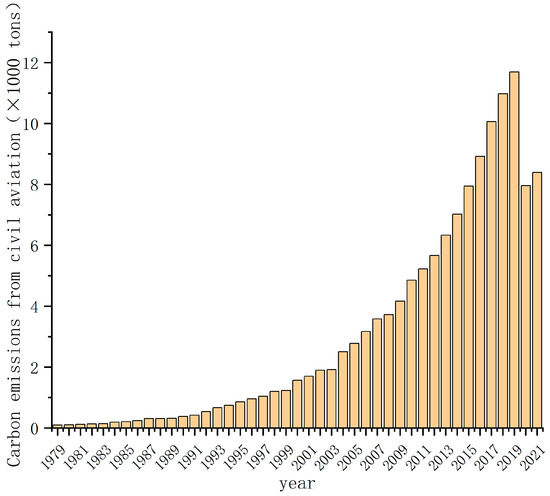
Figure 1.
Estimation Results of the Carbon Emission Correction Coefficient.
Figure 2 presents a comparison of the growth rates of carbon emissions and total turnover volume in China’s civil aviation industry from 2000 to 2021. The two indicators displayed broadly synchronized trends throughout most of the period, indicating a strong correlation between carbon emissions and transport activity. Before 2005, both indicators experienced substantial fluctuations and diverged significantly. From 2005 to 2019, their trajectories became more aligned, and volatility was notably reduced. In most years during this period, the growth rate of carbon emissions remained consistently below that of total turnover volume. This pattern became particularly evident after 2012, suggesting that improvements in energy efficiency had been achieved within the civil aviation sector. In 2020, both indicators experienced a sharp decline, reaching approximately −0.35. In 2021, they rebounded to positive values, with the growth rate of carbon emissions remaining slightly below that of total turnover volume. This outcome reflected gains in carbon efficiency during the post-pandemic recovery phase. Given the heightened expectations for green development under the dual carbon strategy, incorporating carbon emissions as an undesirable output was deemed imperative when calculating the TFP of the civil aviation industry.
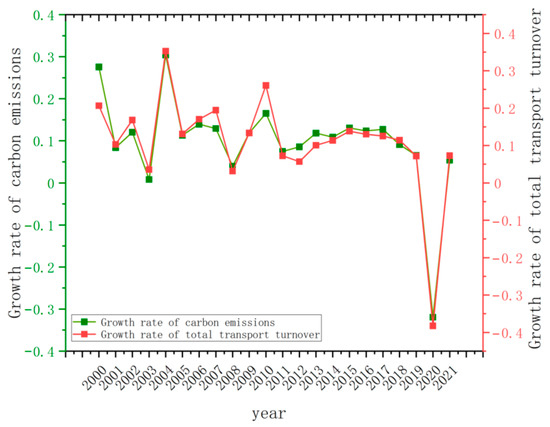
Figure 2.
Comparison of Growth Rates of Carbon Emissions and Total Turnover Volume.
3. Selection of Influencing Variables and Data Sources
3.1. Selection of Influencing Variables
The selection of influencing variables was intended to analyze the driving forces behind TFP in the civil aviation industry. These variables served as explanatory factors for variations in TFP, facilitating the identification of elements that exerted either significant promoting or inhibiting effects. Although not directly involved in the measurement of TFP, they were utilized to interpret its fluctuations. To further investigate the underlying causes of changes in civil aviation TFP under carbon emission constraints, the calculated TFP of the civil aviation industry was adopted as the dependent variable. A time series regression model was constructed to examine the determinants of TFP in China’s civil aviation sector within the context of carbon emission limitations. The selection of influencing variables followed the theoretical framework and empirical findings established in the civil aviation productivity literature [1,2,3,7,8,11,20,22,23,24,25,26]. Based on the existing literature and data availability, the selected influencing variables encompassed key dimensions such as investment in technological innovation, capital input, labor quality, market demand and competition, and the degree of openness to international markets.
The explanatory variables were selected as follows:
- Fuel Consumption per Unit of Turnover (FUEL).
Fuel consumption per unit of turnover was defined as the ratio of total annual fuel consumption in the civil aviation sector to the total turnover volume in the same year. It was regarded as a core indicator for measuring the level of technological innovation within the industry. This indicator is widely used in aviation efficiency research, such as in studies by Scotti and Volta [8] and Liu et al. [11], indicating that fuel efficiency is an important indicator for measuring the level of technological innovation in the aviation industry. Improvements in fuel efficiency served as a quantitative reflection of the effectiveness of technological innovation investments, indicating greater turnover volume generated per unit of fuel input. A reduction in this ratio signified enhanced transport efficiency and reflected the cumulative outcomes of technological advancement. In the context of TFP, this variable captured the long-term effects of innovation accumulation and functioned as a key metric for evaluating the sustainability and international competitiveness of the civil aviation sector.
- 2.
- Growth Rate of Fleet Size (FLEET).
The growth rate of fleet size was defined as the year-on-year percentage change in the number of civil aircraft owned. This indicator was considered an important measure of capital input in the civil aviation industry, with capital investment serving as a primary determinant of operational capacity and service quality. The impact of capital investment on aviation industry productivity has been confirmed by numerous studies, such as those by Vasigh and Fleming [22] and Assaf [23], which all demonstrate the significant impact of capital investment on aviation industry productivity. It reflected both the speed and scale of fleet expansion, as well as the influence of capital growth on production efficiency.
- 3.
- Educational Attainment of Employees (EDU).
The educational attainment of employees was measured as the proportion of civil aviation personnel holding a bachelor’s degree or higher in a given year. This indicator served as a key measure of labor quality, representing the overall level of human capital in the industry. The role of labor force quality as a determinant of TFP has been supported by relevant studies in Zhang et al. [20], Huang et al. [25], and other literature (Zhang et al., 2016; Huang et al., 2018). Within the TFP framework, this variable reflected the sector’s capacity to absorb knowledge, foster innovation, and adapt to technological progress.
- 4.
- Growth Rate of Total Turnover Volume (TURN).
This variable referred to the year-on-year growth in total transport turnover within the civil aviation sector. It was employed as a primary indicator of market demand and competition intensity. Market demand has been thoroughly validated as a key productivity driver in aviation studies by Duke and Torres [1], Russell [2], and others. It directly captured the expansion in both passenger and cargo transport, thereby reflecting the sector’s market growth and competitive dynamics.
- 5.
- Proportion of International Routes (INT).
The proportion of international routes was defined as the ratio of international routes to the total number of routes. It served as a key indicator of the industry’s openness and level of internationalization. The relationship between openness and efficiency has been explored in previous studies by Arjomandi and Seufert [7], Liu et al. [26], and others. This measure also reflected the efficiency of resource allocation and the realization of economies of scale, indirectly indicating the global competitiveness of the civil aviation sector.
3.2. Data Sources and Calculation of Influencing Variables
Regarding data sources, the variables, including fuel consumption per unit of turnover, growth rate of fleet size, growth rate of total turnover volume, and proportion of international routes, were obtained from the Civil Aviation Statistics Yearbook and the Statistical Bulletin on the Development of the Civil Aviation Industry, covering the period from 2000 to 2021. These indicators were calculated directly based on the reported data. However, direct data on the educational attainment of the entire civil aviation workforce were not available. As a result, the educational attainment indicator was indirectly estimated using other relevant data sources.
To estimate the proportion of employees with a bachelor’s degree or above in the civil aviation industry, a weighted average method was applied. Data from Air China, China Eastern Airlines, and China Southern Airlines—the three largest carriers—were used to approximate the industry-wide share of highly educated personnel. The estimation was conducted using each airline’s total number of employees and the percentage of employees holding a bachelor’s degree or higher. This approach was adopted due to the dominant market position of these three major airlines, whose combined workforce accounted for a significant share of the total civil aviation labor pool, thereby ensuring strong industry representativeness.
Statistical analysis showed that the trends in educational structure across the three airlines were generally consistent, with similar average annual growth rates. The weighted average results demonstrated greater robustness and lower volatility compared to alternative methods. These findings validated the methodological soundness of using the educational structure of the three major airlines to estimate the proportion of bachelor’s degree holders across the broader civil aviation industry. This variable served as a reliable metric for human capital evaluation in the analysis of changes in total factor productivity (TFP) within the sector.
The formula used to calculate the annual proportion of employees with a bachelor’s degree or higher in the civil aviation industry—based on the weighted average method applied to the three major airlines—was as follows:
where denotes the estimated proportion of employees holding bachelor’s degrees or higher in the civil aviation industry in year t; denotes airlines , representing Air China, China Eastern Airlines, and China Southern Airlines, respectively.
Due to the lack of data on the educational structure of industry personnel, this study uses data from Air China, China Eastern Airlines, and China Southern Airlines (which together account for over 70% of the market share) to estimate the industry’s overall level based on the human resource structure of these three major airlines. This assumption is based on the leading role of these three airlines in industry standard setting and management models, as their educational characteristics are consistent with those of the industry as a whole.
4. Civil Aviation TFP Measurement and Analysis
4.1. Global Malmquist–Luenberger Index Model
Total Factor Productivity (TFP) represents the ratio of total output to total inputs, capturing efficiency gains not attributable to increases in factor inputs. Within the seminal growth accounting framework, TFP embodies technological progress, organizational improvements, and economies of scale—collectively termed the “Solow residual.” In the civil aviation sector, TFP quantifies the industry’s capacity to generate transport output (measured by passenger and freight ton-kilometers) relative to inputs of labor, capital, and energy.
Incorporating environmental constraints into TFP measurement reflects a significant shift in productivity assessment compared to traditional calculations. Conventional TFP calculations implicitly treat environmental degradation as cost-free by disregarding pollution as undesirable output, potentially overestimating genuine economic progress. Under China’s dual carbon goals, the civil aviation sector faces urgent demands to decouple economic growth from carbon emissions. Environmentally adjusted TFP, calculated using the Global Malmquist-Luenberger index that treats carbon emissions as undesirable outputs, provides a more accurate sustainable productivity measure that integrates economic efficiency with environmental performance.
Total factor productivity (TFP) serves as a core indicator for measuring technological progress and efficiency changes. Under environmental constraints, it is necessary to consider the impact of unwanted outputs. Based on the directional distance function theory proposed by Färe et al., unwanted outputs can be incorporated into the production theory framework through the weak disposability assumption. The GML index effectively solves the potential infeasibility issues of traditional ML indices through the construction of global reference technologies.
To incorporate carbon emission constraints into the TFP analytical framework, the entire civil aviation industry was modeled as an integrated production system. The production possibility set encompasses all feasible output combinations. These are subject to constraints from input factors, desirable outputs, and carbon emissions as an undesirable output.
The specific production possibility set was expressed as follows:
Let the input set of the civil aviation industry be denoted as , which includes labor input, capital input, and energy input. Let the set of desirable outputs be denoted as , which includes route mileage, total turnover volume, and business revenue of civil aviation enterprises. Let the set of undesirable outputs be denoted as , representing carbon emissions in the civil aviation sector. Then, the production possibility set could be represented as:
The production possibility set could be specifically defined as the existence of a weight vector , such that:
where represents the weight for each cross-sectional observation, and indicates that the production technology operates under the condition of constant returns to scale.
The core concept of the Global Modeled Technology (GML) approach is to integrate production observations from all periods (2000–2021) into a unified technological reference set. Unlike traditional methods that construct production frontiers for each period individually, the GML index employs a unified approach , ensuring that efficiency measurements for any given period are based on the same technological benchmark. This implies that the carbon emission efficiency assessment for the civil aviation sector in 2021 within this study does not reference the technological level of 2021 itself, but rather the highest achievable level across the entire 2000–2021 period.
The global directional distance function serves as the foundation for constructing the GML index model. The GML model, built upon the production possibility set and the directional distance function, can effectively avoid infeasibility problems in linear programming. The global directional distance function can be expressed as:
where and are directional vectors; is the value of the distance function in period , which maximizes desirable outputs and minimizes undesirable outputs; represents the matrix of desirable outputs, including route mileage, total turnover volume, and business revenue of civil aviation enterprises; denotes the matrix of undesirable outputs, i.e., carbon emissions in the civil aviation industry; and represents the input matrix, including the number of employees, fixed asset investment, and energy consumption in the civil aviation industry. The GML index, constructed based on the global directional distance function, is defined as:
When calculating Total Factor Productivity (TFP) for China’s civil aviation industry, the construction of the global reference technology (as referenced in the question) follows these steps:
- Data integration.
Consolidate input indicators (labor, capital, energy) and output indicators (expected outputs: cargo ton-kilometers, operating revenue; unexpected outputs: carbon emissions) from 22 annual observations spanning 2000–2021 into a 22 × 6 data matrix.
- 2.
- Direction vector definition.
Based on the principle of “increasing desired outputs and reducing undesired outputs”, the direction vector is defined as , using the current output level as the baseline direction.
- 3.
- Calculate the distance function.
For each year t, compute the value of the directional distance function relative to the global frontier by solving a linear programming problem.
- 4.
- Calculate the GML index.
Based on the distance function values between adjacent periods, compute the GML index using Formula (7) to derive TFP changes under carbon emission constraints.
This global reference technique ensures comparability of TFP across different years, making it particularly suitable for analyzing the long-term evolution of production efficiency in China’s civil aviation sector under dual carbon goals.
4.2. Analysis of TFP Measurement Results
In this study, total factor productivity (TFP) in the civil aviation industry was employed as a key indicator of technological efficiency and production performance. Variations in TFP values reflected the intrinsic relationship between resource allocation and output generation within the sector. Table 1 presents the interpretation framework for the numerical values of the TFP results.

Table 1.
Interpretation Framework for TFP Values.
Based on the previously described indicator data and research method, the TFP of China’s civil aviation industry, considering carbon emissions, was calculated using the GML index. The results are shown in Figure 3.
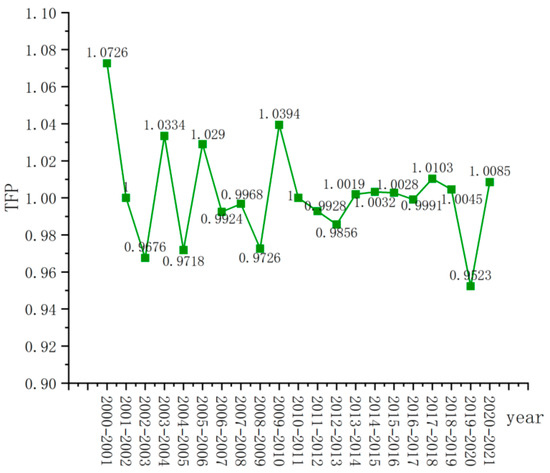
Figure 3.
TFP Measurement Results of the Civil Aviation Industry.
According to the TFP measurement results, the average TFP of the civil aviation industry was 1.00243, ranging from 0.9523 to 1.0726, with a standard deviation of 0.02614. These figures indicated that from 2000 to 2021, the overall TFP of the industry exhibited an upward trend, albeit with minor fluctuations. Moreover, TFP showed strong alignment with the technical efficiency change index, as both followed nearly identical trajectories. From a statistical perspective, the coefficient of variation for TFP is 0.026, indicating relatively moderate fluctuations. Decomposition analysis reveals that the correlation coefficient between changes in technical efficiency and TFP is as high as 0.94 (p < 0.001), indicating that technical efficiency is the dominant factor driving changes in TFP, rather than technological progress itself. This finding reveals that the Chinese civil aviation industry is currently achieving productivity growth mainly through improvements in operational efficiency.
From a more detailed perspective, TFP increased rapidly during 2000–2001, growing by 7.26% to reach a peak of 1.0726. Subsequently, periodic fluctuations were observed. During 2002–2003, TFP declined by 3.24%, falling to 0.9676, which was potentially attributable to market volatility and rising fuel prices that adversely affected operational efficiency. In 2009–2010, TFP experienced a temporary peak, increasing by 3.94% to 1.0394. This improvement likely reflected advancements in technological adoption and management innovation, possibly supported by post-financial crisis stimulus measures and the industry’s recovery capacity.
After 2010, TFP gradually rebounded and remained close to 1 in most subsequent years, indicating a relatively stable development phase characterized by steady changes in productivity. However, during 2019–2020, TFP declined sharply by 4.77% to 0.9523, primarily due to the impact of the COVID-19 pandemic, which significantly reduced air transport demand and disrupted industry operations. In 2020–2021, TFP recovered to 1.0085, demonstrating the industry’s resilience and its ability to return to positive productivity growth following the external shock.
The results revealed that TFP in China’s civil aviation industry exhibited clear cyclical fluctuations. From a long-term perspective, the average annual growth rate of TFP was approximately 0.3%, although significant short-term variations were observed. This pattern reflected the structural characteristics of the industry’s development and the influence of external environmental changes. Additionally, TFP demonstrated dynamic adjustment behavior, with evidence of mean reversion and a strong capacity for rapid correction when deviations occurred from long-run equilibrium. According to the results of the Granger causality test, the influencing factors showed weak short-term correlations but strong long-term correlations, indicating the existence of an intrinsic dynamic mechanism governing productivity evolution in China’s civil aviation industry.
5. Analysis of Influencing Factors of Civil Aviation TFP
5.1. Data Description and Statistical Analysis
Based on the preceding analysis and using annual data from 2001 to 2021 for China’s civil aviation industry, total factor productivity (TFP) was modeled as the dependent variable, while the influencing factors—including investment in technological innovation, capital input, labor quality, market demand and competition, and the degree of openness—were used as explanatory variables to examine their respective effects on TFP in the sector.
During the data preprocessing stage, outliers were detected within the dataset, necessitating a data cleansing procedure. A time-series visualization framework was initially applied, incorporating time series decomposition and the moving window standard deviation method to calculate local mean deviations and standard deviations within a five-year sliding window. These techniques facilitated the detection of potential outliers. Subsequently, a linear regression model was employed to estimate the trend components, and residual distributions were analyzed to identify anomalies.
Through this approach, two outliers were identified. First, the year 2004 in the turnover growth rate series was flagged as a clear outlier. This outlier was not related to any specific event. To reassess this data point, local polynomial regression smoothing was applied. To reduce the impact of extreme values on data robustness, the Winsorization technique based on quantile thresholds was adopted, constraining values within the 5–95% range. This method effectively balanced the trade-off between data integrity and analytical reliability, reducing distortion from 35.254% to 13.104%. A comparison of the data before and after cleansing is presented in Figure 4.
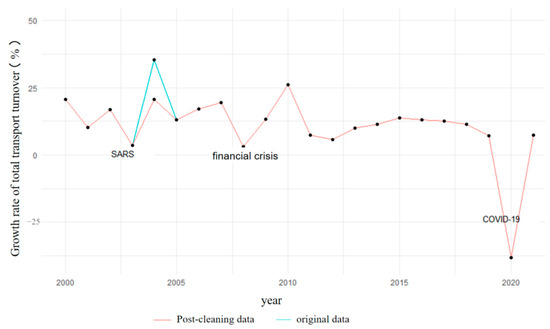
Figure 4.
Comparison of Turnover Growth Rate Before and After Data Cleaning.
In addition, the 2021 value for the proportion of international routes was identified as abnormally low. To enhance intertemporal comparability, this value was adjusted using a recent historical average method, whereby the original value of 5.736% was revised upward to 16.822%. This adjustment is based on the historical average over the three-year period from 2018 to 2020. The rationale for selecting this time window is as follows: 2018–2020 represents the normal operational state of China’s civil aviation industry before the COVID-19 pandemic. The proportions of international routes during these three years were 17.82%, 18.35%, and 14.30%, respectively, with an average of 16.82% and a standard deviation of only 2.11 percentage points, indicating good stability. The choice of a three-year window over longer or shorter periods balances the need for sufficient observations to smooth short-term fluctuations while maintaining data timeliness and relevance. The exceptionally low value in 2021 was clearly influenced by the exogenous shock of international travel restrictions and does not reflect the industry’s normal operating state. Retaining this extreme value would create a leverage effect in the regression analysis, distorting the estimated relationship between internationalization and TFP. Substituting with the recent pre-pandemic average is the standard method in time series analysis for handling outliers caused by policy shocks.
Based on the results of data cleaning, descriptive statistics were conducted. The results are presented in Table 2.
Table 2.
Descriptive Statistics of Variables.
The analysis of the influencing variables revealed that fuel consumption per unit of turnover exhibited a general downward trend, indicating that technological progress had been achieved within the civil aviation industry. The growth rate of fleet size displayed significant fluctuations, suggesting that capital investment followed a distinctly cyclical pattern. The educational attainment of employees demonstrated a clear upward trajectory, reflecting continuous improvements in the overall education level of civil aviation personnel. Among all variables, the growth rate of total turnover volume exhibited the highest degree of volatility, underscoring its sensitivity to external shocks such as the COVID-19 pandemic.
Figure 5 presents the scatterplot matrix of TFP and its influencing factors, offering a visual representation of the complex interrelationships among the variables. A significant positive correlation was observed between market demand and TFP (correlation coefficient = 0.4723, p < 0.05), indicating that increases in market demand contributed positively to TFP growth in the civil aviation industry.
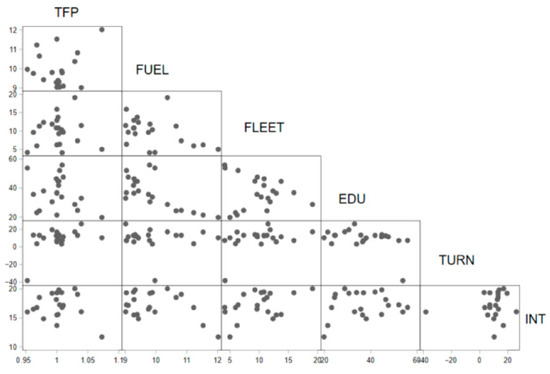
Figure 5.
Scatterplot Matrix of TFP and Influencing Factors.
Notably, a strong negative correlation was identified between fuel consumption per unit of turnover and the educational attainment of employees (correlation coefficient = −0.7287, p < 0.05), suggesting that as the education level of civil aviation personnel improved, fuel consumption per unit of turnover declined, reflecting gains in technological efficiency. In addition, a positive correlation was detected between capital input and the degree of openness (correlation coefficient = 0.4333, p < 0.05), implying that during periods characterized by a higher proportion of international routes, fleet expansion occurred more rapidly.
These findings revealed intricate interactions among the explanatory variables. This complexity underscores the need for comprehensive analysis. Both static and dynamic models are necessary to fully understand their effects on TFP. Before model estimation, unit root tests were conducted on all variables. The results indicated that labor quality (p = 0.0256), market demand (p = 0.0018), and TFP (p = 0.0000) were stationary at the 5% significance level, while technological innovation (p = 0.8872), capital input (p = 0.6163), and the degree of openness (p = 0.0857) exhibited unit roots. These outcomes justified the use of both static regression models and dynamic time series models to investigate the short-term and long-term effects of the selected influencing factors.
It should be specifically noted that the unit of analysis in this study is the Chinese civil aviation industry as a whole, rather than individual airlines. Consequently, the data structure is a time series rather than the traditional panel data. This research design aligns with the study’s objective of analyzing the evolution of total factor productivity (TFP) across the entire industry. However, it also necessitates the use of time series analysis techniques rather than panel data methods in the selection of analytical approaches.
5.2. Analysis of the Results of Influencing Factors
This study focused on the civil aviation industry as a unified research entity, using aggregate industry-level time series data for econometric analysis. Both static and dynamic time series regression models were employed to investigate the short-term dynamics and long-term relationships among the explanatory variables.
5.2.1. Short-Term Analysis Based on the Static Regression Model
The static panel model was employed to analyze the short-term effects of various influencing factors on total factor productivity (TFP), enabling the identification of key short-term drivers of productivity within the civil aviation sector. The estimation results derived from the static model directly reflected the marginal contributions of each explanatory variable to TFP, thereby supporting the identification of impactful factors and informing short-term policy decisions.
The static regression model served as the baseline analytical framework, with estimation conducted using the ordinary least squares (OLS) method to assess the direct effects of the selected variables on civil aviation TFP. The basic specification of the static regression model was formulated as follows:
where : constant term; : coefficients of the explanatory variables; : random error term.
In addition, to test the robustness of the results, this study also constructed a log-transformed regression model and a first-difference model as supplementary approaches.
The short-term regression results of the static panel regression based on the OLS method are presented in Table 3. The overall of the model was 0.3086, the adjusted was 0.0781, and the F-statistic was 1.34 (p = 0.3012), indicating that the model had a certain degree of explanatory power, though not strong. This also suggests that relying solely on the static regression model has its limitations.
Table 3.
Regression Results of the Static Regression Model for TFP Influencing Factors.
According to the results of the static panel model, in the short term, among the five explanatory variables, only market demand and competition intensity exhibited a statistically significant positive effect on total factor productivity (TFP), with a β coefficient of 0.0013 and a p-value of 0.047. This finding suggested that competitive market mechanisms contributed positively to efficiency improvements in the civil aviation industry. Specifically, for every 1 percentage point increase in total turnover growth rate, TFP increases by approximately 0.0013 units. Considering that the standard deviation of the total turnover growth rate is 12.1 percentage points, this means that a standard deviation in demand growth will lead to an approximately 1.57% increase in TFP, which is a moderate level of effect in the transportation industry. This result aligned with economic theory, which posits that in a fully competitive market environment, enterprises tend to enhance their market position by optimizing resource allocation, improving service quality, and increasing operational efficiency—ultimately resulting in productivity gains. This finding is highly consistent with competitive advantage theory, which states that market demand growth drives efficiency improvements by creating economies of scale and competitive pressure. Our coefficient estimate (0.0013) is comparable to previous European studies, indicating that similar demand-productivity relationships exist across different markets. However, China’s civil aviation industry exhibits slightly higher sensitivity, reflecting the characteristics of its rapid development phase.
The results indicate that fuel efficiency (FUEL) does not significantly affect TFP (β = 0.014, p = 0.387), a finding warranting further examination. This seemingly anomalous phenomenon may stem from several factors: First, endogeneity exists between fuel efficiency (FUEL) and TFP, as fuel efficiency itself constitutes a component of TFP. This simultaneous determination relationship may introduce estimation bias. Second, the effects of technological progress exhibit time lags; improvements like enhanced fuel efficiency require time to translate into productivity gains. More critically, the developmental stage of China’s civil aviation sector during the sample period (2000–2021) played a role. The industry’s rapid expansion phase may have masked the contribution of technological efficiency gains by amplifying market size growth. Finally, the strong negative correlation between FUEL and EDU (r = −0.7287) indicates multicollinearity, potentially affecting the identification of FUEL’s independent effect. Nevertheless, Granger causality tests reveal a significant long-term causal relationship between technological innovation and TFP (p = 0.005), suggesting that fuel efficiency’s impact may operate through more complex dynamic mechanisms.
5.2.2. Long-Term Analysis Based on the Dynamic Time Series Model
The civil aviation industry was characterized as a capital-intensive sector in which a clear lag effect existed between capital input and output efficiency. Changes in production efficiency typically exhibit strong temporal correlation and historical dependency. The dynamic panel model was capable of capturing the long-term cumulative effects of factors such as technology diffusion, human capital accumulation, and the optimization of management practices. Therefore, it was deemed necessary to apply a dynamic model to analyze the long-term impacts of these influencing variables on total factor productivity (TFP).
The constructed dynamic time series regression model is as follows:
where : constant term; : elasticity coefficients.
This study analyzes the entire civil aviation industry as a single decision-making unit, treating it as pure time-series data rather than typical panel data. System GMM and difference GMM estimators are primarily suited for panel data structures with “large N and small T.” However, this study features “N = 1, T = 21,” failing to meet the fundamental requirements for GMM estimation. Therefore, considering the single-industry time-series characteristics of the data, ordinary least squares (OLS) is employed to estimate the dynamic model.
The long-term regression results of the dynamic panel model with the lagged dependent variable are presented in Table 4.
Table 4.
Regression Results of the Dynamic Time Series Model for TFP Influencing Factors.
The regression results of the dynamic time series model showed that the coefficient of the lagged TFP term was −0.3269 (p = 0.069), approaching the 10% significance threshold. This result indicated mean-reverting behavior in total factor productivity (TFP)—specifically, when TFP in the current period exceeded its long-run equilibrium level, it tended to decline in the subsequent period; conversely, when it fell below the equilibrium level, it tended to rise in the following period. In addition, the coefficient of market demand remained statistically significant in the dynamic model (β = 0.0010, p = 0.046), further confirming its robust and positive impact on TFP in the civil aviation industry.
At the same time, the lag effect of technological innovation reflects the typical “learning curve” characteristic of capital-intensive industries, namely that technological absorption requires time for training, process adaptation, and experience accumulation. This finding supports the endogenous growth theory’s theoretical view that knowledge spillovers and human capital development are drivers of long-term productivity growth. However, it is worth noting that the negative relationship between internationalization and TFP should be interpreted with caution. This finding may reflect the “infant industry” challenges faced by China’s civil aviation industry during its international expansion. The results suggest that China may experience temporary efficiency losses in its international development due to increased operational complexity, rising regulatory compliance costs, and the reallocation of resources from efficient domestic routes to relatively immature international operations. This finding contrasts with research results from mature aviation markets but aligns with the theoretical characteristics of incremental learning in international markets.
5.2.3. Robustness Test of the Model
To ensure the reliability of the research conclusions, robustness checks were conducted on the empirical findings. By analyzing the estimation results from both static and dynamic time series models, it was found that the combined use of static regression and dynamic time series analysis for analyzing short-term and long-term effects, offered clear advantages in identifying the determinants of total factor productivity (TFP) in the civil aviation industry. Both model types consistently indicated that market demand was a key determinant of TFP. Moreover, the dynamic model further revealed the long-term cumulative effects of technological innovation and capital input, as well as the dynamic adjustment characteristics of TFP itself.
To verify the temporal stability of the results, a sample-splitting method was employed. A structural break test identified a significant breakpoint in 2010. Accordingly, the dataset was divided into two sub-samples—before and after 2010—for separate regression analyses. In the post-2010 period, the coefficient of market demand was 0.0009 with a p-value of 0.022, which was statistically significant and highly consistent with the full-sample results. This indicated that, as China’s civil aviation industry continued to develop, the positive impact of market demand on TFP remained relatively stable. The robustness of this relationship across different periods further supported the credibility of the findings. Despite the reduced sample size, the persistent significance of market demand reinforced the robustness of the core conclusions.
To further explore the dynamic relationship between TFP and its influencing factors, a Vector Autoregression (VAR) model was employed, and Granger causality tests were conducted. These methods facilitated the identification of interdependencies and enabled a deeper analysis of the dynamic interactions among the variables. The test results showed that investment in technological innovation (p = 0.005) and capital input (p = 0.000) had significant Granger causal effects on TFP. Labor quality also demonstrated explanatory power at the 10% significance level (p = 0.065).
Taken together, the results from the VAR model and Granger causality tests indicated that improvements in TFP within the civil aviation industry constituted a dynamic and cumulative process. The influencing factors exhibited complex lag effects and interaction mechanisms. This dynamic nature further underscored the necessity of employing both static regression analysis and dynamic time series analysis, thereby enhancing the reliability of the study’s conclusions and supporting the scientific validity of its policy implications.
Based on the robustness test results, it could be reasonably inferred that, under carbon emission constraints, technological innovation investment, capital input, and improvements in labor quality served as key drivers of TFP growth in China’s civil aviation industry.
6. Conclusions and Policy Recommendations
6.1. Research Focus and Conclusions
This study centers on the core theme of the dynamic evolution and influencing mechanisms of total factor productivity (TFP) in China’s civil aviation industry under carbon constraints, addressing three key issues: (1) Methodological issues. By introducing a carbon emissions adjustment coefficient to establish a more precise carbon emissions estimation model for the civil aviation industry, thereby enhancing the scientific rigor of TFP measurement under environmental constraints. (2) Theoretical mechanism issues. The study revealed the mean-reversion characteristics and cyclical fluctuation patterns of the aviation industry’s TFP, identifying the consistent positive role of market demand in both short-term and long-term influences. (3) Policy application issues. The study constructed differentiated pathways for the roles of factors such as technological innovation, capital investment, and labor quality, providing an empirical foundation for formulating precise related policies.
From the perspective of theoretical contributions, this study verifies the lag effect mechanism of technological innovation under environmental constraints, enriches the theoretical understanding of the factors influencing TFP in the civil aviation industry of developing countries, and provides empirical support for the application of Porter’s hypothesis (the theory that environmental regulations promote innovation) in the transportation sector.
This study found that from 2000 to 2021, the total factor productivity (TFP) of China’s civil aviation industry exhibited relative stability, with an average annual growth rate of approximately 0.3%. However, notable cyclical fluctuations were observed, reflecting the structural characteristics of the industry’s development and the influence of external environmental factors. TFP was also characterized by mean-reverting behavior, demonstrating a strong tendency to correct deviations from long-run equilibrium. According to the results of the Granger causality test, the explanatory variables exhibited weak short-term correlations but strong long-term relationships, indicating the existence of an inherent dynamic mechanism driving changes in production efficiency within the civil aviation sector.
Market demand and competition intensity were identified as the most significant determinants of TFP, exhibiting statistically significant positive effects in both static and dynamic panel models. Although technological innovation and capital input were not significant in the static model, the dynamic model revealed their significant lagged contributions to productivity. Notably, after 2010, the positive impact of technological innovation increased substantially, suggesting that the effects of innovation and capital accumulation required time to manifest. These findings indicated that the industry had entered a new phase of technology-driven development since 2010.
The relationship between labor quality and TFP appeared to be more complex. While long-term cointegration analysis demonstrated a significant positive effect, the Vector Autoregression (VAR) model suggested that the short-term impact was not statistically significant. This result was consistent with the practical delay between human capital investment and observable productivity gains. A negative relationship was observed between the degree of openness and TFP, implying that productivity constraints may arise during the process of internationalization. This highlights the necessity of structural adjustments in policy design, particularly regarding institutional alignment and the optimization of resource allocation. Furthermore, the error correction model indicated a relatively rapid adjustment speed toward equilibrium, suggesting that the civil aviation industry possessed strong adaptive capacity in response to market fluctuations.
6.2. Policy Recommendations
Based on the above research findings, the following policy recommendations are proposed:
- (1)
- Enhance Technology-Driven Innovation
Greater emphasis should be placed on investment in core technologies within the civil aviation sector. Particular focus should be given to independent innovation in aviation safety systems and intelligent operational platforms. The adoption of advanced technologies in operational management, service delivery, and cost control should be actively encouraged. These efforts will help translate innovation into tangible productivity gains. Although such effects may not be immediately observable, long-term investment in innovation remains essential for sustaining competitiveness and improving TFP. Additionally, implementing measures such as optimized route planning, continuous descent operations (CDO), and airport collaborative decision-making (A-CDM) to reduce ground taxiing can enhance operational efficiency while achieving significant emission reductions.
- (2)
- Optimize the Structure of Capital Investment
Capital investment strategies should prioritize quality and efficiency rather than scale, avoiding indiscriminate expansion that could lead to resource misallocation and excess capacity. A scientific and data-driven evaluation framework for capital allocation decisions should be established to ensure high returns on investment and effective conversion of capital input into productivity improvements.
- (3)
- Improve Labor Quality
The aviation talent development system should be further strengthened by aligning educational programs with the evolving demands of the industry. The goal is to cultivate a highly skilled workforce capable of supporting advanced development goals. Concurrently, efforts should be directed toward minimizing the lag between human capital investment and its measurable impact on productivity, thereby enhancing the sector’s overall innovation absorption capacity.
- (4)
- Stabilize Market Demand Growth
The domestic aviation market should be further developed through strategic improvements to regional hubs and route networks. Enhancing service quality, reliability, and consumer experience will contribute to stable demand growth. This, in turn, will facilitate economies of scale, improve resource utilization efficiency, and support sustained growth in TFP.
- (5)
- Promote Internationalization with Caution
Given the observed negative association between openness and TFP, a cautious and evidence-based approach should be taken in promoting international aviation liberalization. Greater attention should be paid to the economic viability and strategic value of international routes. In particular, deeper cooperation with countries participating in the Belt and Road Initiative should be fostered to enhance operational efficiency and convert external openness into productivity gains.
The implementation of these strategies should account for both static and dynamic effects. This ensures a balanced approach to short-term responsiveness. It also maintains focus on long-term development goals. Enhancing TFP in China’s civil aviation industry will require the integration of market-based resource allocation mechanisms with strategic policy guidance. A comprehensive framework—encompassing technological innovation, structural reform, human capital development, and managerial improvement—should be adopted to advance green, high-quality growth. This integrated approach will strengthen the sector’s ability to simultaneously improve economic performance and achieve environmental sustainability, thereby supporting the long-term development of civil aviation under the dual carbon strategy.
6.3. Future Research Prospects
Based on the findings of this study, future research could be further deepened in the following directions: (1) Micro-level analysis. From the perspective of enterprises, explore the differences in TFP among different types of airlines and their underlying mechanisms, guiding green transformation strategies at the airline enterprise level; (2) International comparative studies. Develop a comparative analysis framework for TFP across different countries’ civil aviation sectors to analyze China’s position within the global value chain and identify pathways for improvement; (3) Develop predictive models. Combining machine learning and other new methods to construct dynamic predictive models for TFP in the civil aviation sector, providing forward-looking support for policy-making. These research directions will contribute to further refining the theoretical framework and practical pathways for sustainable development in the civil aviation sector.
Regarding the international applicability of this research methodology, the carbon emission correction factor method holds universal methodological value but requires adjustments based on regional specifics. The correction factor α must be recalculated using actual energy consumption data from local airlines. Second, the GML index method demonstrates strong versatility, though input-output indicators should be selected considering local data availability and industry characteristics. Finally, factor analysis must incorporate region-specific variables—developed nations may prioritize technological innovation, while developing countries may emphasize market expansion. The analytical framework presented herein serves as a foundational template adaptable for cross-regional application through tailored modifications.
Author Contributions
Conceptualization, M.G.; methodology, M.G.; software, M.G.; validation, M.G.; resources, M.G.; data curation, M.G.; writing—original draft preparation, M.G.; writing—review and editing, L.Z.; visualization, M.G.; supervision, L.Z.; funding acquisition, L.Z. All authors have read and agreed to the published version of the manuscript.
Funding
This work was funded by the Ministry of Education Humanities and Social Sciences Research Planning Fund Project, grant number 24YJAZH168.
Institutional Review Board Statement
Not applicable.
Informed Consent Statement
Not applicable.
Data Availability Statement
All the raw data are available upon request to the corresponding author.
Conflicts of Interest
The authors declare no conflicts of interest.
References
- Duke, J.; Torres, V. Multifactor productivity change in the air transportation industry. Mon. Labor Rev. 2005, 128, 32. [Google Scholar]
- Russell, M. Economic productivity in the air transportation industry: Multifactor and labor productivity trends, 1990–2014. Mon. Labor Rev. 2017, 140, 1. [Google Scholar] [CrossRef][Green Version]
- Brits, A. A liberalised South African airline industry: Measuring airline total-factor productivity. J. Transp. Supply Chain Manag. 2010, 4, 22–38. [Google Scholar] [CrossRef][Green Version]
- Kumar, S. Environmentally sensitive productivity growth: A global analysis using Malmquist–Luenberger index. Ecol. Econ. 2006, 56, 280–293. [Google Scholar] [CrossRef]
- Oh, D. A global Malmquist-Luenberger productivity index. J. Prod. Anal. 2010, 34, 183–197. [Google Scholar] [CrossRef]
- Jeon, B.M.; Sickles, R.C. The role of environmental factors in growth accounting. J. Appl. Econom. 2004, 19, 567–591. [Google Scholar] [CrossRef]
- Arjomandi, A.; Seufert, J.H. An evaluation of the world’s major airlines’ technical and environmental performance. Econ. Model. 2014, 41, 133–144. [Google Scholar] [CrossRef]
- Scotti, D.; Volta, N. An empirical assessment of the CO2-sensitive productivity of European airlines from 2000 to 2010. Transp. Res. D Transp. Environ. 2015, 37, 137–149. [Google Scholar] [CrossRef] [PubMed]
- Xu, Y.; Hu, W.; Li, Z.; Chang, Y. Evaluating the environmental efficiency of the US airline industry using a directional distance function DEA approach. J. Manag. Anal. 2021, 8, 1–18. [Google Scholar]
- Ali, N.S.Y.; See, K.F. Revisiting an environmental efficiency analysis of global airlines: A parametric enhanced hyperbolic distance function. J. Clean. Prod. 2023, 394, 135982. [Google Scholar] [CrossRef]
- Liu, X.; Hang, Y.; Wang, Q.; Zhou, D. Drivers of civil aviation carbon emission change: A two-stage efficiency-oriented decomposition approach. Transp. Res. D Transp. Environ. 2020, 89, 102612. [Google Scholar] [CrossRef]
- Kito, M.; Yagita, H.; Matsumoto, M.; Umeda, Y. Drivers of CO2 emissions in international aviation: The case of Japan. Environ. Res. Lett. 2020, 15, 104036. [Google Scholar] [CrossRef]
- Wang, Y.; Zhang, H.; Wang, C. Influencing factors and decoupling elasticity of China’s transportation carbon emissions. Energies 2018, 11, 1157. [Google Scholar] [CrossRef]
- Timilsina, G.R.; Shrestha, A. Factors affecting transport sector CO2 emissions growth in Latin American and Caribbean countries: An LMDI decomposition analysis. Int. J. Energy Res. 2009, 33, 396–414. [Google Scholar] [CrossRef]
- Lin, B.; Xie, C. Reduction potential of CO2 emissions in China’s transport industry. Renew. Sustain. Energy Rev. 2014, 33, 689–700. [Google Scholar] [CrossRef]
- Hu, Y.J.; Wang, Y.; Wang, S.; Zhu, L. Strategies to mitigate carbon emissions for sustainable aviation: A critical review from a life-cycle perspective. Sustain. Prod. Consum. 2022, 33, 788–808. [Google Scholar] [CrossRef]
- Sharma, A.; Jakhar, S.K.; Choi, T.M. Would CORSIA implementation bring carbon neutral growth in aviation? A case of US full service carriers. Transp. Res. D Transp. Environ. 2021, 97, 102839. [Google Scholar] [CrossRef]
- Kaya, G.; Kayalıca, Ö. Aviation-caused CO2 emissions reduction efficiency in EU-28 under CORSIA compliance. J. Intell. Transp. Syst. Appl. 2022, 5, 33–52. [Google Scholar] [CrossRef]
- Moreira, M.; Gurgel, A.C.; Seabra, J.E.A. Life cycle greenhouse gas emissions of sugar cane renewable jet fuel. Environ. Sci. Technol. 2014, 48, 14756–14763. [Google Scholar] [CrossRef]
- Zhang, P.; Jing, C.; Sun, H. Research on the operational efficiency of air transport enterprises based on a three-stage DEA model. J. Transp. Syst. Eng. Inf. Technol. 2016, 16, 210–215. (In Chinese) [Google Scholar]
- Sang, M.; Gao, H. Methods for measuring total factor productivity in China’s transportation industry. Transp. Res. 2019, 5, 8. (In Chinese) [Google Scholar]
- Vasigh, B.; Fleming, K. A total factor productivity-based structure for tactical cluster assessment: Empirical investigation in the airline industry. J. Air Transp. 2005, 10. Available online: https://ntrs.nasa.gov/citations/20050185575 (accessed on 25 August 2025).
- Assaf, A. A fresh look at the productivity and efficiency changes of UK airlines. Appl. Econ. 2011, 43, 2165–2175. [Google Scholar] [CrossRef]
- Zou, B.; Elke, M.; Hansen, M. Evaluating Air Carrier Fuel Efficiency and CO2 Emissions in the US Airline Industry; The National Center of Excellence for Aviation Operations Research, UC Berkeley: Berkeley, CA, USA, 2012. [Google Scholar]
- Huang, G.; Jing, C.; Wang, H. Research on total factor productivity of Chinese airlines under carbon emission constraints. J. Transp. Syst. Eng. Inf. Technol. 2018, 18, 7. (In Chinese) [Google Scholar]
- Liu, W.; Zhou, D.; Wang, C.; Wang, B. Factor market distortion, technology change, and green growth in the Chinese civil airline industry. J. Asian Econ. 2021, 77, 101392. [Google Scholar] [CrossRef]
- Öztürk, O.; Serin, Z.V. From carbon footprints to competitive edges: Analyzing environmental efficiency in aviation. Veriml. Derg. 2025, 59, 369–382. [Google Scholar] [CrossRef]
- Queiroz Júnior, H.S.; Costa, A.P.S.; Lima, R.L. CO2 emissions in air transport: A comparative study using data envelopment analysis. Transp. Res. Rec. 2024, 2678, 872–883. [Google Scholar] [CrossRef]
- Chen, X.; Li, Y.; Zhang, J. Assessing eco-performance of the transport sector: Approach framework, static efficiency, and dynamic evolution. Transp. Res. D Transp. Environ. 2020, 85, 102414. [Google Scholar] [CrossRef]
- Ju, H.; Chen, Z. Research on influencing factors of low-carbon total factor productivity of aviation logistics enterprises. Front. Soc. Sci. Technol. 2020, 2, 12–17. [Google Scholar]
- Yu, Z. A Study on Total Factor Productivity of China’s Transportation Industry Considering Carbon Emissions. Master’s Thesis, East China Jiao Tong University, Nanchang, China, 2023. [Google Scholar] [CrossRef]
- Chang, K.; Liu, L.; Luo, D.; Xing, K. The impact of green technology innovation on carbon dioxide emissions: The role of local environmental regulations. J. Environ. Manag. 2023, 340, 117990. [Google Scholar] [CrossRef]
- Fu, B.; Salman, A.; Álvarez-Otero, S.; Sui, J.; Razzaq, M.G.A. The Dynamic Connectedness Between Environmental Attention and Green Cryptocurrency: Evidence from the COVID-19 Pandemic. J. Organ. End User Comput. 2024, 36, 1–18. [Google Scholar] [CrossRef]
- Xia, M.; Phillips, F.; Zhang, W.; Cai, H.H.; Dai, J.; Zhang, L.; Wu, Y. From Carbon Capture to Cash: Strategic Environmental Leadership, AI, and the Performance of US Firms. J. Organ. End User Comput. 2024, 36, 1–24. [Google Scholar] [CrossRef]
- Wang, Y.; Wang, T.; Wang, W.; Hou, Y. Collaborative Application of Deep Learning Models for Enhanced Accuracy and Prediction in Carbon Neutrality Anomaly Detection. J. Organ. End User Comput. 2024, 36, 1–25. [Google Scholar] [CrossRef]
- Wang, Y.; Zhao, Z.; Shi, M.; Liu, J.; Tan, Z. Public environmental concern, government environmental regulation and urban carbon emission reduction—Analyzing the regulating role of green finance and industrial agglomeration. Sci. Total Environ. 2024, 924, 171549. [Google Scholar] [CrossRef]
Disclaimer/Publisher’s Note: The statements, opinions and data contained in all publications are solely those of the individual author(s) and contributor(s) and not of MDPI and/or the editor(s). MDPI and/or the editor(s) disclaim responsibility for any injury to people or property resulting from any ideas, methods, instructions or products referred to in the content. |
© 2025 by the authors. Licensee MDPI, Basel, Switzerland. This article is an open access article distributed under the terms and conditions of the Creative Commons Attribution (CC BY) license (https://creativecommons.org/licenses/by/4.0/).