Article

Sustainability and Algorithmic Comparison of Segmented PVRP for Healthcare Waste Collection: A Brazilian Case Study

by
Micaela Ines Castillo Ulloa
1,
Diego Alexis Ramos Huarachi
1,
Vinicius Moretti
2,
Cleiton Hluszko
1,
Fabio Neves Puglieri
1,
Thalita Monteiro Obal
1,3 and
Antonio Carlos de Francisco
1,*
1
Sustainable Production Systems Laboratory (LESP), Postgraduate Program of Production Engineering (PPGEP), Universidade Tecnológica Federal do Paraná (UTFPR), R. Doutor Washington Subtil Chueire 330-Jardim Carvalho, Ponta Grossa 84017-220, Paraná, Brazil
2
Optimization and Decision-Making Research Group (GPOTD), Postgraduate Program of Production Engineering (PPGEP), Universidade Tecnológica Federal do Paraná (UTFPR), R. Doutor Washington Subtil Chueire 330-Jardim Carvalho, Ponta Grossa 84017-220, Paraná, Brazil
3
Postgraduate Program in Technological Innovations (PPGIT), Universidade Tecnológica Federal do Paraná (UTFPR), Avenida Guarapuava 800—Industrial, Guarapuava 85051-010, Paraná, Brazil
*
Author to whom correspondence should be addressed.
Sustainability 2025, 17(19), 8536; https://doi.org/10.3390/su17198536
Submission received: 3 August 2025 / Revised: 16 September 2025 / Accepted: 20 September 2025 / Published: 23 September 2025
(This article belongs to the Section Air, Climate Change and Sustainability)

Abstract

The safe and sustainable management of healthcare waste (HCW) is essential for minimizing environmental impacts and protecting public health, particularly in developing countries with limited logistical infrastructure. Despite the growing adoption of routing optimization in HCW logistics, few studies integrate waste generator segmentation with algorithmic planning. This study proposes an optimization approach based on the Periodic Vehicle Routing Problem (PVRP), incorporating a segmentation of waste generators by volume. Two solution methods, the Clarke and Wright (CW) heuristic and Particle Swarm Optimization (PSO), are applied and compared through a real-world case study in Paraná, Brazil. Results show that PSO significantly outperforms CW in reducing travel distance and CO2 emissions. For small generators, PSO achieves reductions of up to 41% in distance and 41.37% in emissions, compared to CW’s 35.42%. For large generators, PSO was reduced by 22% and 21.81%, respectively. The proposed method demonstrates the potential for scalable, data-efficient waste management strategies. This research contributes to sustainable urban logistics by bridging segmentation and routing optimization in resource-constrained settings, offering actionable insights for policymakers and planners.

1. Introduction

The expansion of healthcare services, driven by the increasing prevalence of chronic diseases and aging populations, has led to a significant rise in healthcare waste (HCW) generation. This presents complex challenges for its safe, efficient, and sustainable management [1]. While approximately 85% of HCW is non-hazardous, the remaining 15% poses serious risks due to its infectious, radioactive, or toxic content, creating high-risk scenarios for both human and environmental health [2,3].
HCW is primarily generated in hospitals, laboratories, research institutions, blood banks, veterinary clinics, and nursing homes [4,5]. Improper handling of such waste increases exposure to hazardous microorganisms, endangering healthcare professionals and the general population [6,7]. Therefore, timely and effective HCW management is essential for infection control, pollution mitigation, and environmental protection [8,9].
HCW logistics includes segregation, collection, treatment, and final disposal [10]. Among these stages, transportation is particularly critical. It is the second-largest contributor to greenhouse gas (GHG) emissions in the HCW chain due to fuel consumption, vehicle types, and payload constraints [11]. Globally, the transportation sector was responsible for 25% of GHG emissions in 2019 and remains a major contributor to climate change [12]. In developing countries, where daily HCW volumes are substantial, transportation and collection operations can account for 80–95% of total management costs [3,13].
The use of specialized vehicles for safely transporting HCW to treatment or disposal facilities is essential to ensure the continuity of healthcare operations and to prevent secondary contamination [14]. This operational and sanitary importance has gained increasing attention from governments and the public in several countries [15,16].
The environmental and logistical implications of HCW collection align directly with the Sustainable Development Goals (SDGs). Efficient waste routing supports SDG 3 (Health and Well-being), SDG 11 (Sustainable Cities and Communities), and SDG 13 (Climate Action) through reduced carbon emissions [17,18].
In this context, optimizing HCW collection routes has emerged as a practical and impactful strategy for reduce operational costs and environmental burdens [1,7]. Classical Vehicle Routing Problems (VRPs) are commonly employed to enhance fleet efficiency and minimize travel distances [19,20]. For time-dependent operations, the VRP has evolved into a Periodic Vehicle Routing Problem (PVRP), which allows scheduling over multiple days, a feature particularly useful in healthcare logistics [21,22].
However, most existing models assume homogeneous demand, failing to capture the diversity in waste generation profiles. This simplification can lead to inefficient routing and suboptimal resource allocation. Moreover, while intelligent algorithms such as Particle Swarm Optimization (PSO) have shown strong potential in routing problems [8,11], comparative studies involving traditional heuristics like Clarke and Wright (CW), particularly using real-world HCW data, remain limited.
This study proposes an optimized routing model for HCW that integrates a generator segmentation with a PVRP framework to address these gaps. The model is validated through a comprehensive computational comparison of the CW and PSO algorithms using real data from Paraná, Brazil, focusing on reducing travel distances and GHG emissions while accommodating heterogeneous waste profiles.
The main contributions of this work are:
  • A segmentation-based PVRP formulation that reflects realistic HCW generator behavior.
  • A computational comparison of CW and PSO, highlighting convergence performance and robustness.
  • An environmental impact assessment, quantifying CO2 reductions via optimized routing.
  • A real-world case study showing applicability in developing urban contexts.
The remainder of this paper is structured as follows: Section 2 presents related work. Section 3 details the proposed methodology and optimization algorithms. Section 4 introduces the case study. Section 5 discusses the experimental results. Section 6 concludes the paper and outlines directions for future research.

2. Related Work

The optimization of HCW collection has received increasing attention due to the high risks associated with its handling and transportation. Previous studies have primarily aimed to reduce transportation-related risks, operational costs, and environmental impacts, often through adaptations of the Vehicle Routing Problem (VRP). These adaptations include classical VRPs as well as integrated formulations that consider facility location, time windows, or service scheduling constraints [16].
Improper disposal of HCW poses serious threats to public health, occupational safety, and environmental integrity. Nearly half of all healthcare professionals are exposed to bloodborne pathogens through needlestick injuries [23], and inadequate HCW management practices put a substantial portion of the global population at risk [24]. Optimizing HCW transportation strategies is, therefore, crucial for mitigating contamination risks, especially in densely populated or resource-limited urban areas [16,25].
The literature on HCW collection optimization has evolved significantly, transitioning from cost-focused models to multi-objective formulations that incorporate environmental and social dimensions. Early research applied integer linear programming to the PVRP, focusing initially on minimizing operational costs [26,27]. Subsequent studies expanded the scope to include transportation and storage risk reduction [4], time window constraints [28], and healthcare safety, notably in contexts such as the COVID-19 pandemic [29].
Alternative VRP variants have also been explored, such as the Capacity-Constrained Vehicle Routing Problem (CVRP), combining with goal programming, and multi-compartment routing models powered by evolutionary algorithms [30]. These approaches aim to address real-world complexities, including varying waste types and service demands [13].
More recent research has emphasized multi-objective, multi-trip, and multi-depot models that account for uncertainty in customer demand, vehicle speeds, and disposal capacities. For example, Ref. [31] proposed a model integrating cost, risk, and workload factors, and Ref. [32] explored hybrid algorithms applied to green vehicle routing with a focus on emission reduction. Ref. [1] employed adaptive evolutionary algorithms to minimize transportation costs, fuel consumption, and operational risk.
In addition, various strategies have been explored to address challenges in HCW logistics. These include solutions applied to electric vehicle fleets [10], strategies aimed at minimizing infectious risk and total transportation cost [22], and approaches incorporating time constraints and capacity limitations [25,33,34] which apply the NSGA-II algorithm in scenarios involving multiple sources of risk during storage and transportation. More complex models have integrated exact algorithms for high-level facility location and route planning with Improved Adaptive Large Neighborhood Search (IALNS) methods for low-level vehicle routing [35].
Similarly, multi-objective, multi-trip, and multi-intermediate-depot models have been developed for medical waste collection, accounting for vehicle speed uncertainty, dynamic changes in customer demand, and variations in disposal capacity [36]. Additionally, VRP models for HCW have been proposed that incorporate multiple risk types and transit points, aiming to minimize both total cost and maximum risk simultaneously [14].
Despite this progress, two key gaps persist in the current literature, affecting the practical applicability and effectiveness of optimized solutions for HCW management:
(1)
Homogeneous customer modeling: Many studies assume uniform HCW generation behavior across clients, disregarding variations in waste type and volume. This limits the realism and applicability of routing solutions.
(2)
Limited algorithmic comparisons: Although intelligent algorithms such as PSO have demonstrated promising results in logistics applications [8,11], comparative analyses with classical heuristics like CW particularly using real operational data are rare.
To address these gaps, this study proposes a segmented PVRP model that distinguishes between large and small HCW generators over a structured planning horizon. Optimized scheduling enhances epidemiological control and reduces operational costs. Furthermore, a comparative analysis of CW and PSO is conducted, evaluating operational performance, algorithmic robustness, and environmental impact using real-world data from Brazil.
This integrated approach offers an innovative contribution to sustainable HCW logistics and reinforces the practical relevance of advanced routing models in complex urban environments.

3. Methods

This section presents the proposed PVRP model adapted for the collection and transportation of HCW. The model aims to optimize collection operations by addressing inefficiencies in manual route planning and accommodating heterogeneous waste generation profiles.

3.1. PVRP Model for HCW

HCW collection presents significant challenges, especially when routing decisions are made without mathematical optimization. To overcome this, a PVRP model is formulated to optimize collection and transportation operations over a predefined planning horizon.
The proposed model represents the collection network as a set of vertices, including de central depot, healthcare facilities (customers), and the disposal center (autoclave). Each customer generates a known volume of HCW that must be collected and transported efficiently during the planning period.
To capture real-world variability, customers are segmented based on the volume of waste they generate. This segmentation enables differentiated service frequencies and improves routing efficiency. Facilities generating large volumes receive more frequent collection services, enhancing operational performance and minimizing environmental impact. This approach aligns with the PVRP’s core characteristics of accommodating customer-specific service schedules [21]. Additionally, segmentation reduces the solution space, improving algorithmic efficiency.
Customers are classified into two categories:
  • Large Generators: Hospitals and clinics generating between 176 kg and 550 kg of HCW per day.
  • Small Generators: Medical offices, laboratories, dental practices, optical centers, and pharmacies, generating up to 175 kg/day.
The 176 kg/day threshold was not defined arbitrarily, but derived from operational evidence observed in the case study region. In particular, local collection contracts and service capacity guidelines establish 175 kg/day as the upper limit for classifying small generators. This value represents the maximum quantity that can be safely collected on shared routes without exceeding the temporary storage capacity of healthcare facilities or the payload limits of the vehicles employed. Moreover, the threshold reflects contractual practices and regulatory requirements already consolidated by the company responsible for regional waste collection. By aligning the model with these real-world operational conditions, the segmentation ensures consistency between the proposed optimization approach and the actual constraints of the HCW collection system.
Figure 1 illustrates the HCW collection network, where vehicles depart from and return to the central depot and deliver waste to the autoclave for treatment.
The depot operates a fleet of collection vehicles, while the disposal center has limited processing capacity. The following constraints are considered in the model:
  • Single visit per customer per day
  • Full coverage: All customers must be served on their scheduled days.
  • Depot start and end: Each route must begin and end at the depot.
  • Vehicle capacity: Waste collected must not exceed the vehicle’s capacity.
  • Exclusive service: Each customer is served only once per day by one vehicle.

Mathematical Formulation

Proper parameter selection is essential to the performance of model, influencing both computational efficiency and solution quality. The model incorporates key real-world constraints identified in collaboration with the case study company, including mandatory visits to the disposal site, the use of a heterogeneous fleet, and visit frequencies mandated by regulations, thereby ensuring that the solutions remain operationally feasible. The parameters used in this model are based on prior studies [8,21,37,38] and includes the following components:
Index and sets
N L :   s e t   o f   l a r g e   c u s t o m e r s   i n d e x e d   b y   i .
N S :   s e t   o f   s m a l l   c u s t o m e r s   i n d e x e d   b y   j .
N = 0 N L N S : s e t   o f   a l l   n o d e s ,   w i t h   0   t h e   d e p o t .
V :   s e t   o f   v e h i c l e s   ( i n d e x   v ) .
L :   s e t   o f   p l a n n i n g   d a y s   ( i n d e x   t ) .
R i :   s e t   o f   a d m i s s i b l e   v i s i t i n g d a y   s c h e d u l e s   f o r   c u s t o m e r   i   ( i n d e x   r ) .
a i , r , t     0,1 :   p a r a m e t e r   i n d i c a t i n g   i f   s c h e d u l e   r   f o r   c u s t o m e r   i   i n c l u d e s   d a y   t .
Parameters
d u . k :   d i s t a n c e   b e t w e e n   n o d e s   u   a n d   k   ( s y m m e t r i c   o r   n o t )
q i :   w a s t e   q u a n t i t y   c o l l e c t e d   w h e n   c u s t o m e r   i   e s   s e r v i c e d   ( p e r   v i s i t )
Q v :   c a p a c i t y   o f   v e h i c l e   v
M :   a   s u f f i c i e n t l y   l a r g e   c o n s t a n t
  • Decision variables
z i , r   { 0 , 1 } :   1   if   customer   i   adopts   schedule   r     R i ,   0   o t h e r w i s e .
Y j t 0,1 :   1   i f   c u s t o m e r   i   i s   s c h e d u l e d   t o   b e   v i s i t e d   o n   d a y   t ,   0   o t h e r w i s e
X u , k v , t 0,1 : 1   i f   v e h i c l e   v   t r a v e l s   d i r e c t l y   f r o m   n o d e   u   t o   n o d e   k   o n   d a y   t ,   0   o t h e r w i s e
  • Objective function
    Minimize total traveled distance over all days and vehicles:
    minimize   t L v V w N k N k u d u . k X u , k v , t
  • Constraints
    Schedule selection and day activation:
    r R i z i , r = 1                     i N L   N S
    Y i t = r R i a i , r , t z i , r                     i   N L N S ,   t L
    Visit exactly once on activated days (arrival/departure linking):
    v V k N k i X i , k v , t = Y i t                       i N 0 ,   t L
    v V u N u i X u , i v , t = Y i t                       i N 0 ,   t L
    Depot flow balance per vehicle and day:
    k N k 0 X 0 , k v , t = u N u 0 X u , 0 v , t               v V ,   t L
    Vehicle capacity per day:
    i N { 0 } q i u N u i X u , i v , t Q v                           v V ,   t L
    Variable domains:
    X u , k v , t , Y i t , z i , r { 0,1 }

3.2. Solution Approach

Solving the PVRP with real-world HCW constraints poses substantial computational challenges. The complexity of the problem, driven by high dimensionality, temporal scheduling, heterogeneous demand, and vehicle capacity constraints, renders exact methods computationally impractical for large scale applications. In this context, hybrid heuristics and metaheuristics have emerged as effective alternatives for high-quality solutions within reasonable computational time.
This study employs a two-stage solution framework that synergistically combines the CW savings algorithm and PSO. This selection is motivated by the complementary strengths of each method: CW is renowned for its computational efficiency in generating high-quality initial solutions, while PSO excels at iterative refinement through swarm intelligence, enhancing solution quality and promoting convergence toward a global optimum [39].
Previous studies have confirmed the effectiveness of CW in reducing travel distances and improving scheduling [37,40], while PSO has achieved reductions in collection time and distance in HCW routing [8,21]. Nonetheless, these works did not directly compare CW and PSO in HCW routing using real operational data, which is the main contribution of this study.
Therefore, dual-stage approach leverages the following:
  • CW, for its low computational cost and ability to produce feasible, structured initial routes.
  • PSO, for its swarm intelligence-inspired adaptability and capacity to refine complex, constraint-laden solutions.
CW is efficient in generating feasible routes quickly by calculating savings from merging routes. PSO iteratively improves solutions based on swarm behavior, leveraging historical best positions and social learning to explore the solution space more effectively.

3.2.1. Clarke and Wright (CW) Heuristic

The CW algorithm is a constructive algorithm widely used for vehicle routing problems. In this study, the CW algorithm was adapted to address the specific requirements of heterogeneous customer types (large vs. small generators) and periodic collection schedules. The pseudocode for the adapted CW implementation is presented in Algorithm 1.
Algorithm 1: Pseudo-code Clarke and Wright (CW) algorithm for a PVRP
Definition of the capacities of both small and large vehicles
Definition of parameters, customer demand, and geographical coordinates for collection
Calculate distance             d = i n ( a i b i ) 2
Input: Set of vertices V and set of edges W , maximum vehicle capacity Q v
Output: List of s a v i n g s , ordered in descending order of saving 1    route create_initial_routes ( V ) ;
2      saving_list = { };
3      For each customer pair i . j   V 0 ( i . e . ,   e x c l u d i n g   t h e   d e p o t   n o t e   0 )  do
4         S i j = W i , 0 + W 0 , j W ( i , j ) ;
5        saving list in descending order S i , j ;
6        end
7      sort_decreasing ( s a v i n g _ l i s t ) ;
8      return the optimized route structure ( s a v i n g _ l i s t )
The CW algorithm models each HCW generator as an individual route initially serviced by a dedicated vehicle, either for large or small customers on predefined collection days. Within this framework, potential savings are computed for all possible customer pairs by evaluating the cost reduction achieved by merging two individual routes into a single composite route. The savings value is calculated as the difference between the total cost of the separate routes and the combined route.
Once the savings matrix is established, the entries are sorted in descending order, prioritizing route combinations that yield the highest reductions. The algorithm then iteratively merges customer routes according to this sorted list, ensuring that each merged route respects vehicle capacity constraints and service schedules based on customer classification. Furthermore, in Algorithm 1, node 0 denotes the depot, while the set V 0 represents the customers to serve.
This merging process continues until all feasible savings have been explored or a stopping condition is met. Following the construction of composite routes, a post-processing step is applied to refine the solution further. This refinement includes reorganized customer sequences by collection day and customer type, using available temporal and spatial data to improve route feasibility and efficient [41].

3.2.2. Particle Swarm Optimization (PSO)

The second optimization strategy adopted in this study is the PSO algorithm. PSO offers an alternative to the CW construction algorithm, aiming to refine solution quality through iterative improvement. Inspired by the social behavior of swarm in nature, PSO is well-regarded for its simplicity, adaptability, and computational efficiency characteristics that make it suitable for complex, large-scale problems such as HCW collection planning.
In each iteration, a population of candidate solutions (particles) is evaluated and updated based on both individual experience and swarm-wide knowledge. Each particle moves through the solution space by adjusting its position and velocity according to its own best-known position (Pbest) and the global best-known position (Gbest) of the entire swarm. These adjustments are guided by inertial, cognitive, and social coefficients [38].
Previous studies [8,21] have successfully applied PSO in vehicle routing contexts, demonstrating its ability to minimize total travel distances and adapt to logistics problems under real-world constraints. In this work, PSO is used to optimize route configurations by minimizing transportation distances while satisfying capacity and periodic scheduling constraints. Algorithm 2 illustrates the flowchart representing the adopted solution method for the model.
Algorithm 2: Pseudo-code of the PSO algorithm
Input: W ,   w i ,   w j ,   N 1 ,   N ,   i m a x ,   X w i v ,   X w j v
Output: A swarm S of size N ( N position vetors)
Initialize S , randomly generate the position w of each particle within the bounds w i , w j
Initialize all velocities u to zero;
Initialize best positions w * (and respective values) for individual particles and find g *;
Choose randomly two values in [0,1] for r 1 and r 2 ;
Iteration i = 10 ;
Initialize θ m i n ,   θ m a x ;
While i < i m a x do
Calculate inertia θ   =   θ m a x     θ m a x     θ m i n i m a x i ;
For each particle in S , the values for iteration i are:
1 Update velocity big customer: u i = θ d i , i + 1 + N 1 r 1 w w i 1 + N 2 r 2 [ g w i 1 ] ;
2 Update velocity small customer: u i = θ d j , j + 1 + N 1 r 1 w w i 1 + N 2 r 2 [ g w i 1 ] ;
3 Update position: w i = w i 1 + u i ;
4 Compute the value of the new position according to f ;
5 Check / Update: w , g
(Optional) check for convergence;
Increment iteration counter: i = i + 1 ;
End
Return S
In this implementation, each particle represents a potential route configuration, with encoded assignments of customers to collection vehicles. The algorithm handles large and small HCW generators separately to reflect their distinct operational requirements.
During each iteration, particle performance is evaluated based on the total distance traveled while meeting collection constraints such as vehicle capacity and visit frequency. Position updates consider inertia (previous trajectory), individual learning (Pbest), and social learning (Gbest). This dynamic allows the swarm to explore the search space effectively and converge toward optimal or near-optimal solutions.
If a particle discovers a configuration that improves upon the current global best, the Gbest is updated accordingly. The algorithm continues until the maximum number of iterations is reached or convergence is observed.
This PSO-based approach effectively models the routing complexity of HCW collection systems. By minimizing travel distances while accounting for logistical constraints, it supports both operational efficiency and environmental sustainability. Its flexibility allows for adaptation to real-world HCW collection systems, especially in heterogeneous urban environments.

3.2.3. Parameter Settings and Calibration

The selection and calibration of parameters are critical to ensure the performance, stability, and reproducibility of algorithms applied to complex problems, such as periodic vehicle routing for HCW collection. This section outlines the parameter configurations adopted for the CW and PSO algorithms, providing justifications grounded in the specialized literature and adapted to the operational characteristics observed in the case study in Paraná, Brazil.
Although CW is a simple and deterministic algorithm widely used in logistics, its performance depends on practical configurations related to the structure of the logistics network and the criteria for route merging. The main settings adopted in this study were as follows:
  • Vehicle capacity: Based on operational data provided by the company responsible for HCW collection, vehicle capacities of 1500 kg were adopted for routes serving large generators and 1000 kg for those serving small generators. This differentiation is essential to accurately reflect the heterogeneity in waste generation volumes.
  • Route savings criteria: Two strategies were evaluated: one based on the distance between customers and another on the volume of waste collected. The distance-based savings criterion was selected based on its direct alignment with the primary objective of minimizing travel distance. This choice was subsequently validated through statistical comparison using the Mann–Whitney U test, confirming its superior performance over volume-based alternatives for small and large customer segments (see Section 5).
  • Distance matrix: The distances between waste generators, the central depot, and the treatment facility (autoclave) were calculated using real geographic coordinates and the Euclidean distance formula. This step was critical to ensure accuracy in estimating logistical costs and to support effective route optimization.
PSO is highly sensitive to parameter settings, which govern the swarm’s exploratory behavior and convergence dynamics. The parameter values adopted in this study are summarized in Table 1 and were defined based on recommendations from the literature, then fine-tuned through preliminary experiments using real-world data.
This configuration was validated through preliminary exploratory experiments aimed at avoiding premature convergence and maintaining adequate diversity within the search space. Instead of a formal sensitivity analysis, we tested different numbers of iterations and swarm sizes to assess the trade-off between solution quality and computational effort. These tests confirmed that the chosen configuration ensured convergence and stable performance within acceptable runtime limits.
To ensure a fair evaluation of the algorithms and proper calibration under realistic conditions, the following performance metrics were employed:
  • Total distance traveled (km): The primary optimization metric is directly associated with operational costs and environmental impact.
  • Feasibility rate (% of feasible solutions): Reflects the robustness of the solution concerning vehicle capacity and service frequency constraints.
  • CO2 emissions (kg CO2): The DEFRA emission factor (2.68 kg CO2 per liter of diesel) is estimated based on the average fuel consumption of the vehicles used in the waste collection service.

4. Case Study

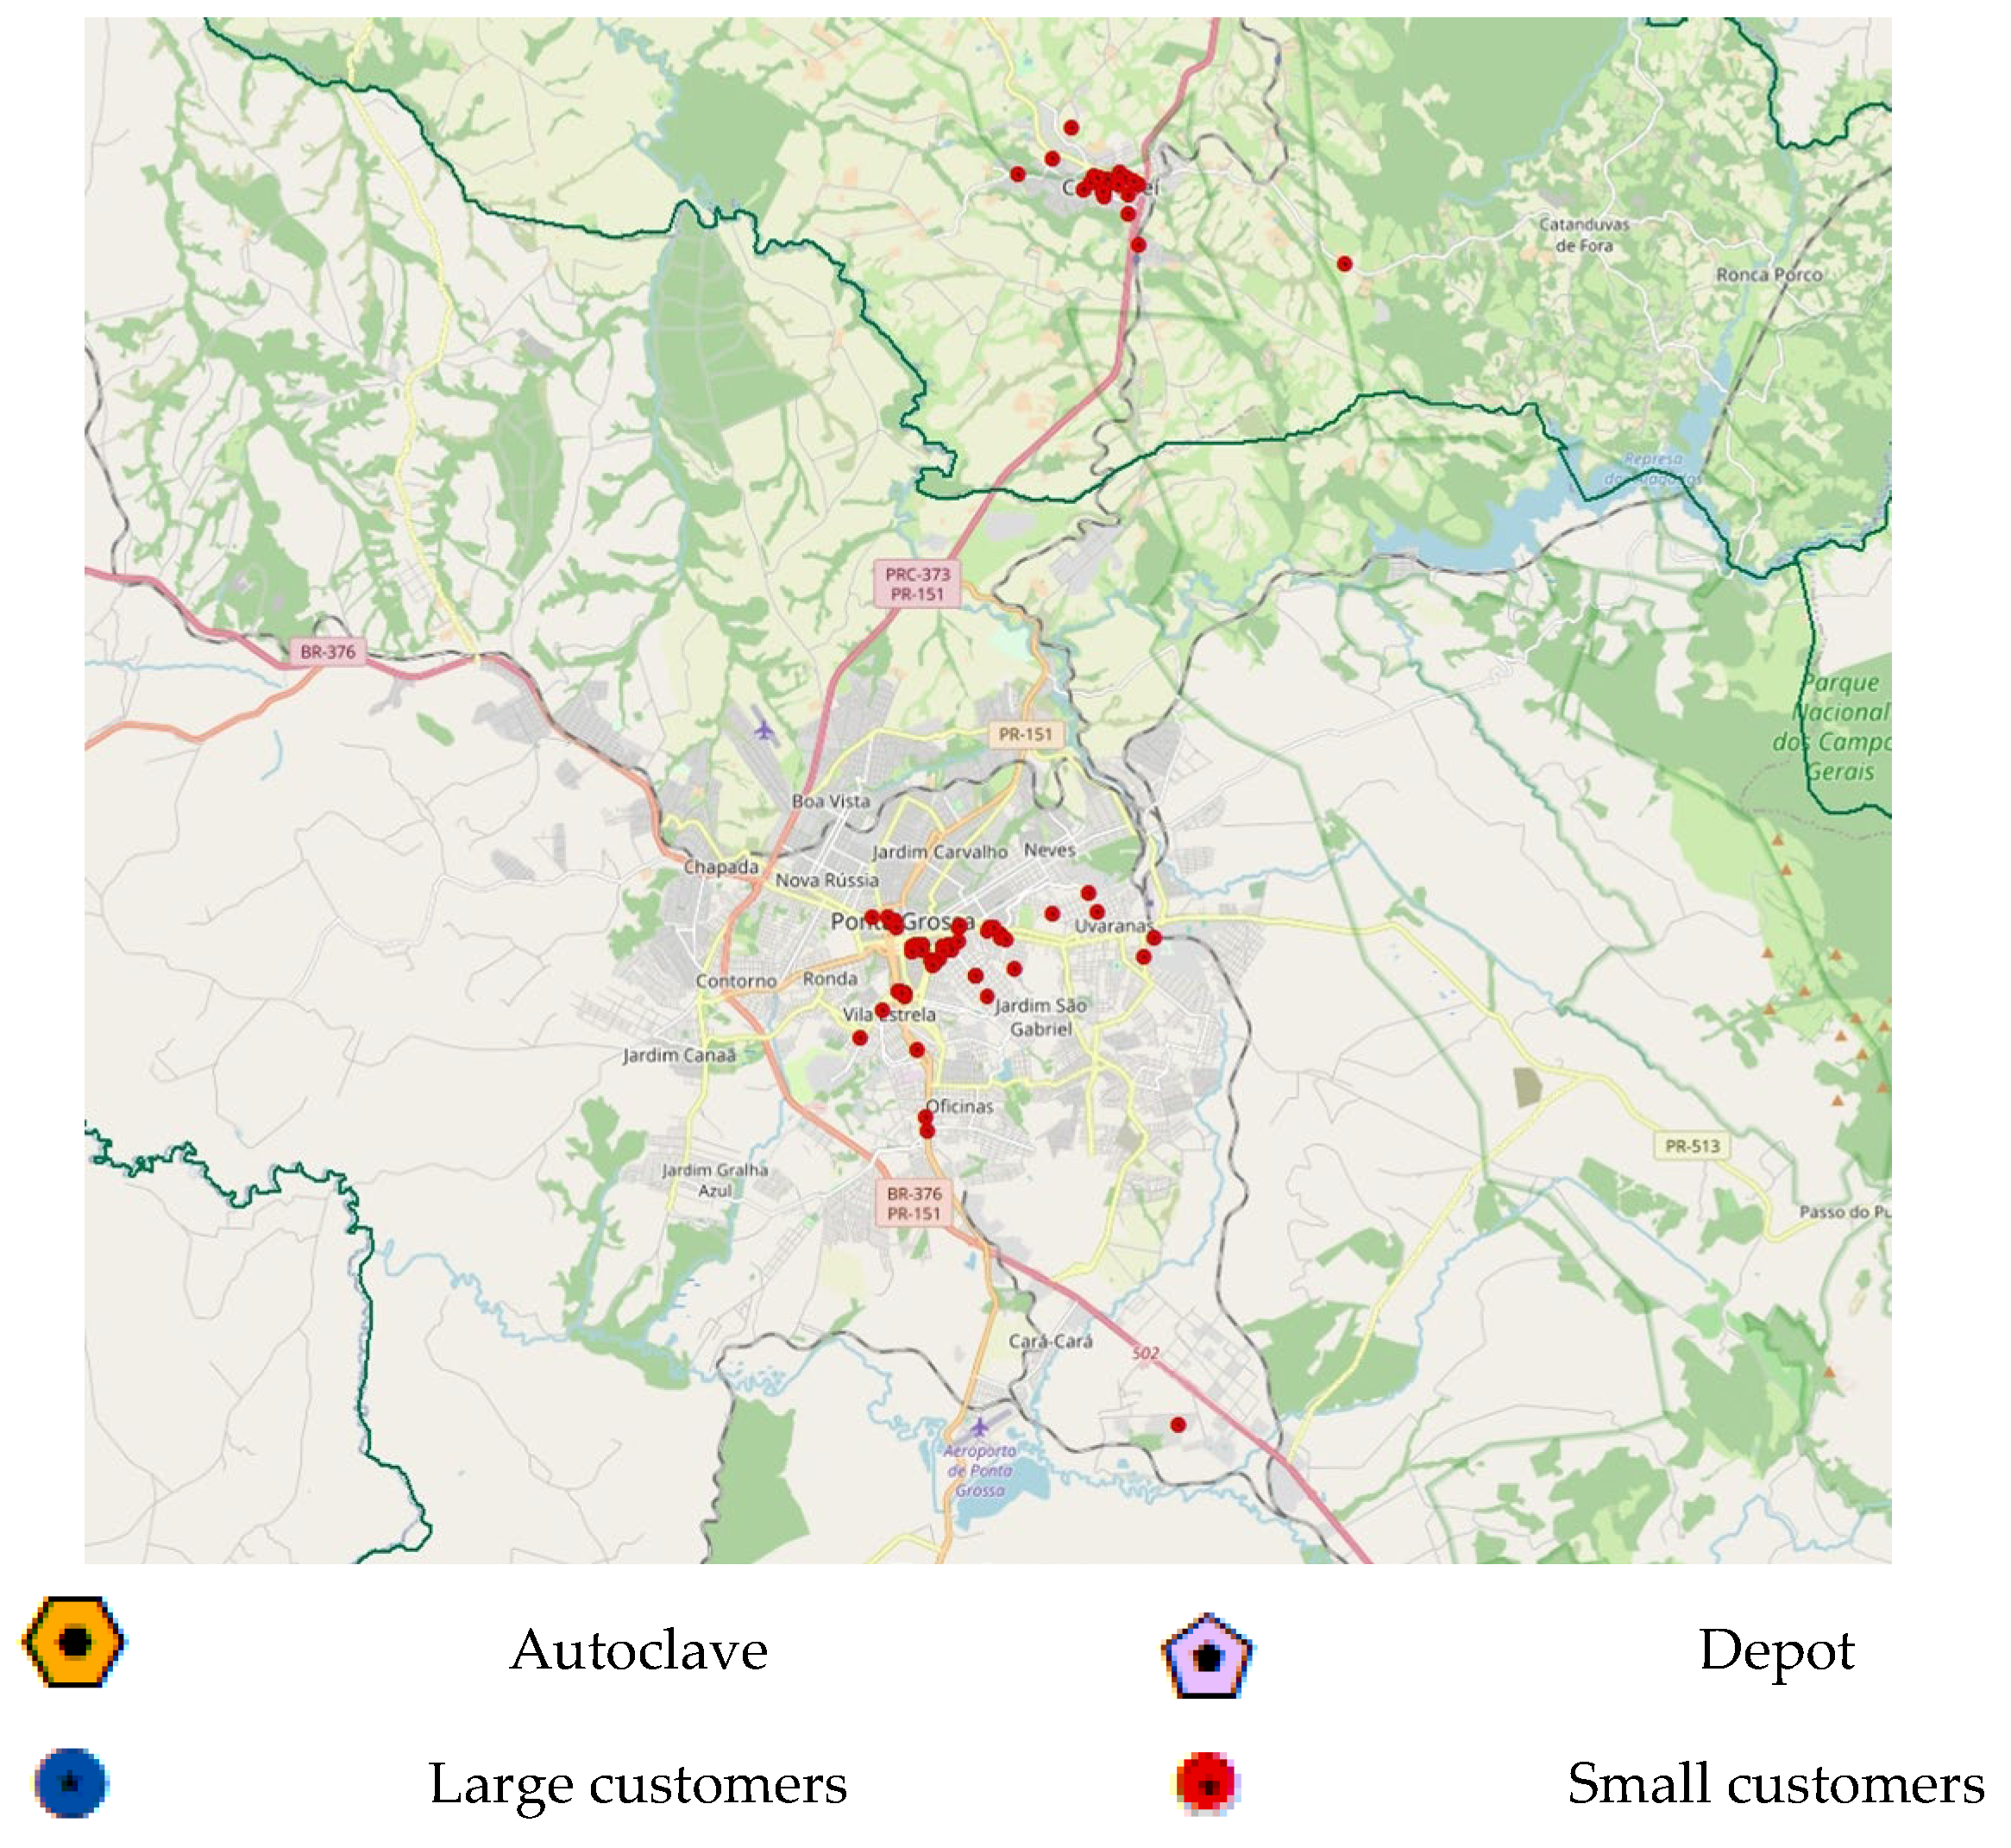
A real-world case study was conducted in a medium-sized city in the state of Paraná, Brazil. The company responsible for HCW collection currently employs manual routing practices based solely on proximity, leading to operational costs and collection delays, as shown in Figure 2. To overcome these limitations, a PVRP-based optimization model was implemented, as the collection must take place within a predefined time horizon. An initial analysis, complemented by interviews with the technical team, revealed the need for an efficient routing system to meet operational demands.
A five-day planning horizon was adopted, corresponding to the workweek (Monday through Friday). This period aligns with operational cycles and enhances scheduling flexibility for regular collections. The frequency of collection visits varies based on the customer’s waste generation volume, ranging from one to five times per week, as detailed in Table 2.
Table 2 presents the visit frequencies for customer categories based on the amount of HCW generated. The model selects a visit schedule for each customer, considering a five-day planning horizon. Consequently, the model assigns each collection task to a specific route and schedules it for one of the predetermined collection days.
It is worth noting that small generators, with a production of 136 to 175 kg/day, and large generators, with a production of 176 to 325 kg/day, receive three visits per week. This overlap is operationally justified: small generators are serviced by a 1000 kg-capacity vehicle, while large generators are serviced by a 1500 kg-capacity vehicle. This distinction ensures compliance with on-site storage limits, vehicle specialization, and current contractual guidelines, which define 175 kg/day as the maximum for small generators due to payload and storage time constraints.
Two vehicles defined by the company manage the HWC collection activity. These vehicles depart from a central depot and follow pre-established routes (using Google Maps Platform—Google LLC, Mountain View, CA, USA) to service designated customers within the established planning horizon. After collection, the vehicles proceed to an autoclave site for proper waste disposal. Subsequently, they return empty to the central depot for a comprehensive cleaning and disinfection process, ensuring adherence to necessary hygiene standards before resuming collection tasks the following day.
The proposed model’s implementation leverages the notations for sets and indices, parameters, response variables, and decision variables. A detailed breakdown of the specific parameter values used in the model can be found in Table 3.
As shown in Table 3, the case study considered a set of 73 customers categorized into two types: small and large. The categorization was based on the amount of waste generated and the frequent visits required over five days. Of these, 63 customers are considered small and 10 large.
To simulate daily waste collection needs over a four-week period, random values were generated for each customer. Although the study is grounded in a real-world case, detailed historical data on daily waste generation were not available for all customer categories. Therefore, a stochastic approach was adopted to approximate realistic variability in waste volumes, using average expected values as a reference.
Small generators were assumed to produce approximately 1000 kg per day on average, whereas large generators produced around 1500 kg per day. Vehicle capacities were defined to accommodate the minimum required collection volume over a one-week period. Vehicle capacities were sized to accommodate a minimum acceptable collection amount for a single week.
The quantities of waste to be collected weekly for each customer type are detailed in Appendix A (Table A1 and Table A2). Table A1 presents data for big customers, while Table A2 presents data for small customers. Customers are numbered from 1 to 73 based on their geographical coordinates. Notably, during the study period, small customers generated approximately 16,719 kg of waste, whereas large customers generated 24,631 kg. Additionally, two vehicles with different capacities were considered: one with a maximum load of 1500 kg and another with a 1000 kg capacity, each designated for a specific customer type. Both vehicles collected HCW throughout the planning period, strictly adhering to their maximum load capacities.
The efficiency of the case study algorithms hinges on considering two critical fixed points for each day within the planning period. Point 0 represents the depot, the starting point for daily vehicle journeys. Point 74 corresponds to the autoclave, where waste is unloaded before the vehicles return to the depot at day’s end.

5. Results

The computational experiments were conducted using the Spyder Integrated Development Environment (v5.4.3, Anaconda Inc., Austin, TX, USA) with Python 3.10.10. Algorithms were executed on a computer with an AMD Ryzen processor (Advanced Micro Devices, Inc., Santa Clara, CA, USA), 12 GB of RAM, and a 64-bit Windows 11 Pro operating system.
HCW generators were segmented into “small” and “large” categories based primarily on average monthly waste volume. While this classification supports initial planning and operational feasibility, it is acknowledged that additional factors such as waste type (e.g., infectious, chemical, sharps), spatial dispersion, and accessibility may enhance future model refinements. However, volume remains the primary criterion currently used by Brazilian HCW collection operators.
Each scenario was executed 20 times for both generator segments to ensure statistical reliability and account for the stochastic nature of the CW and PSO algorithms. Performance metrics were averaged to evaluate consistency and overall solution quality.
Both CW and PSO produced feasible, optimized routes. However, performance differences were observed regarding travel distance, environmental impact, and computational efficiency. The results are presented below by customer segment, followed by environmental and algorithmic analyses.

5.1. Small HCW Generators

For the 63 small HCW generators, each producing an average of 16,719 kg of waste monthly, a vehicle with a daily capacity of 1000 kg was used. Collection frequencies were determined according to individual client waste volumes, ranging from one to three visits per week. This approach reflects actual operational practices, balancing logistical efficiency with the strict regulatory requirements typically enforced by companies in the healthcare sector.
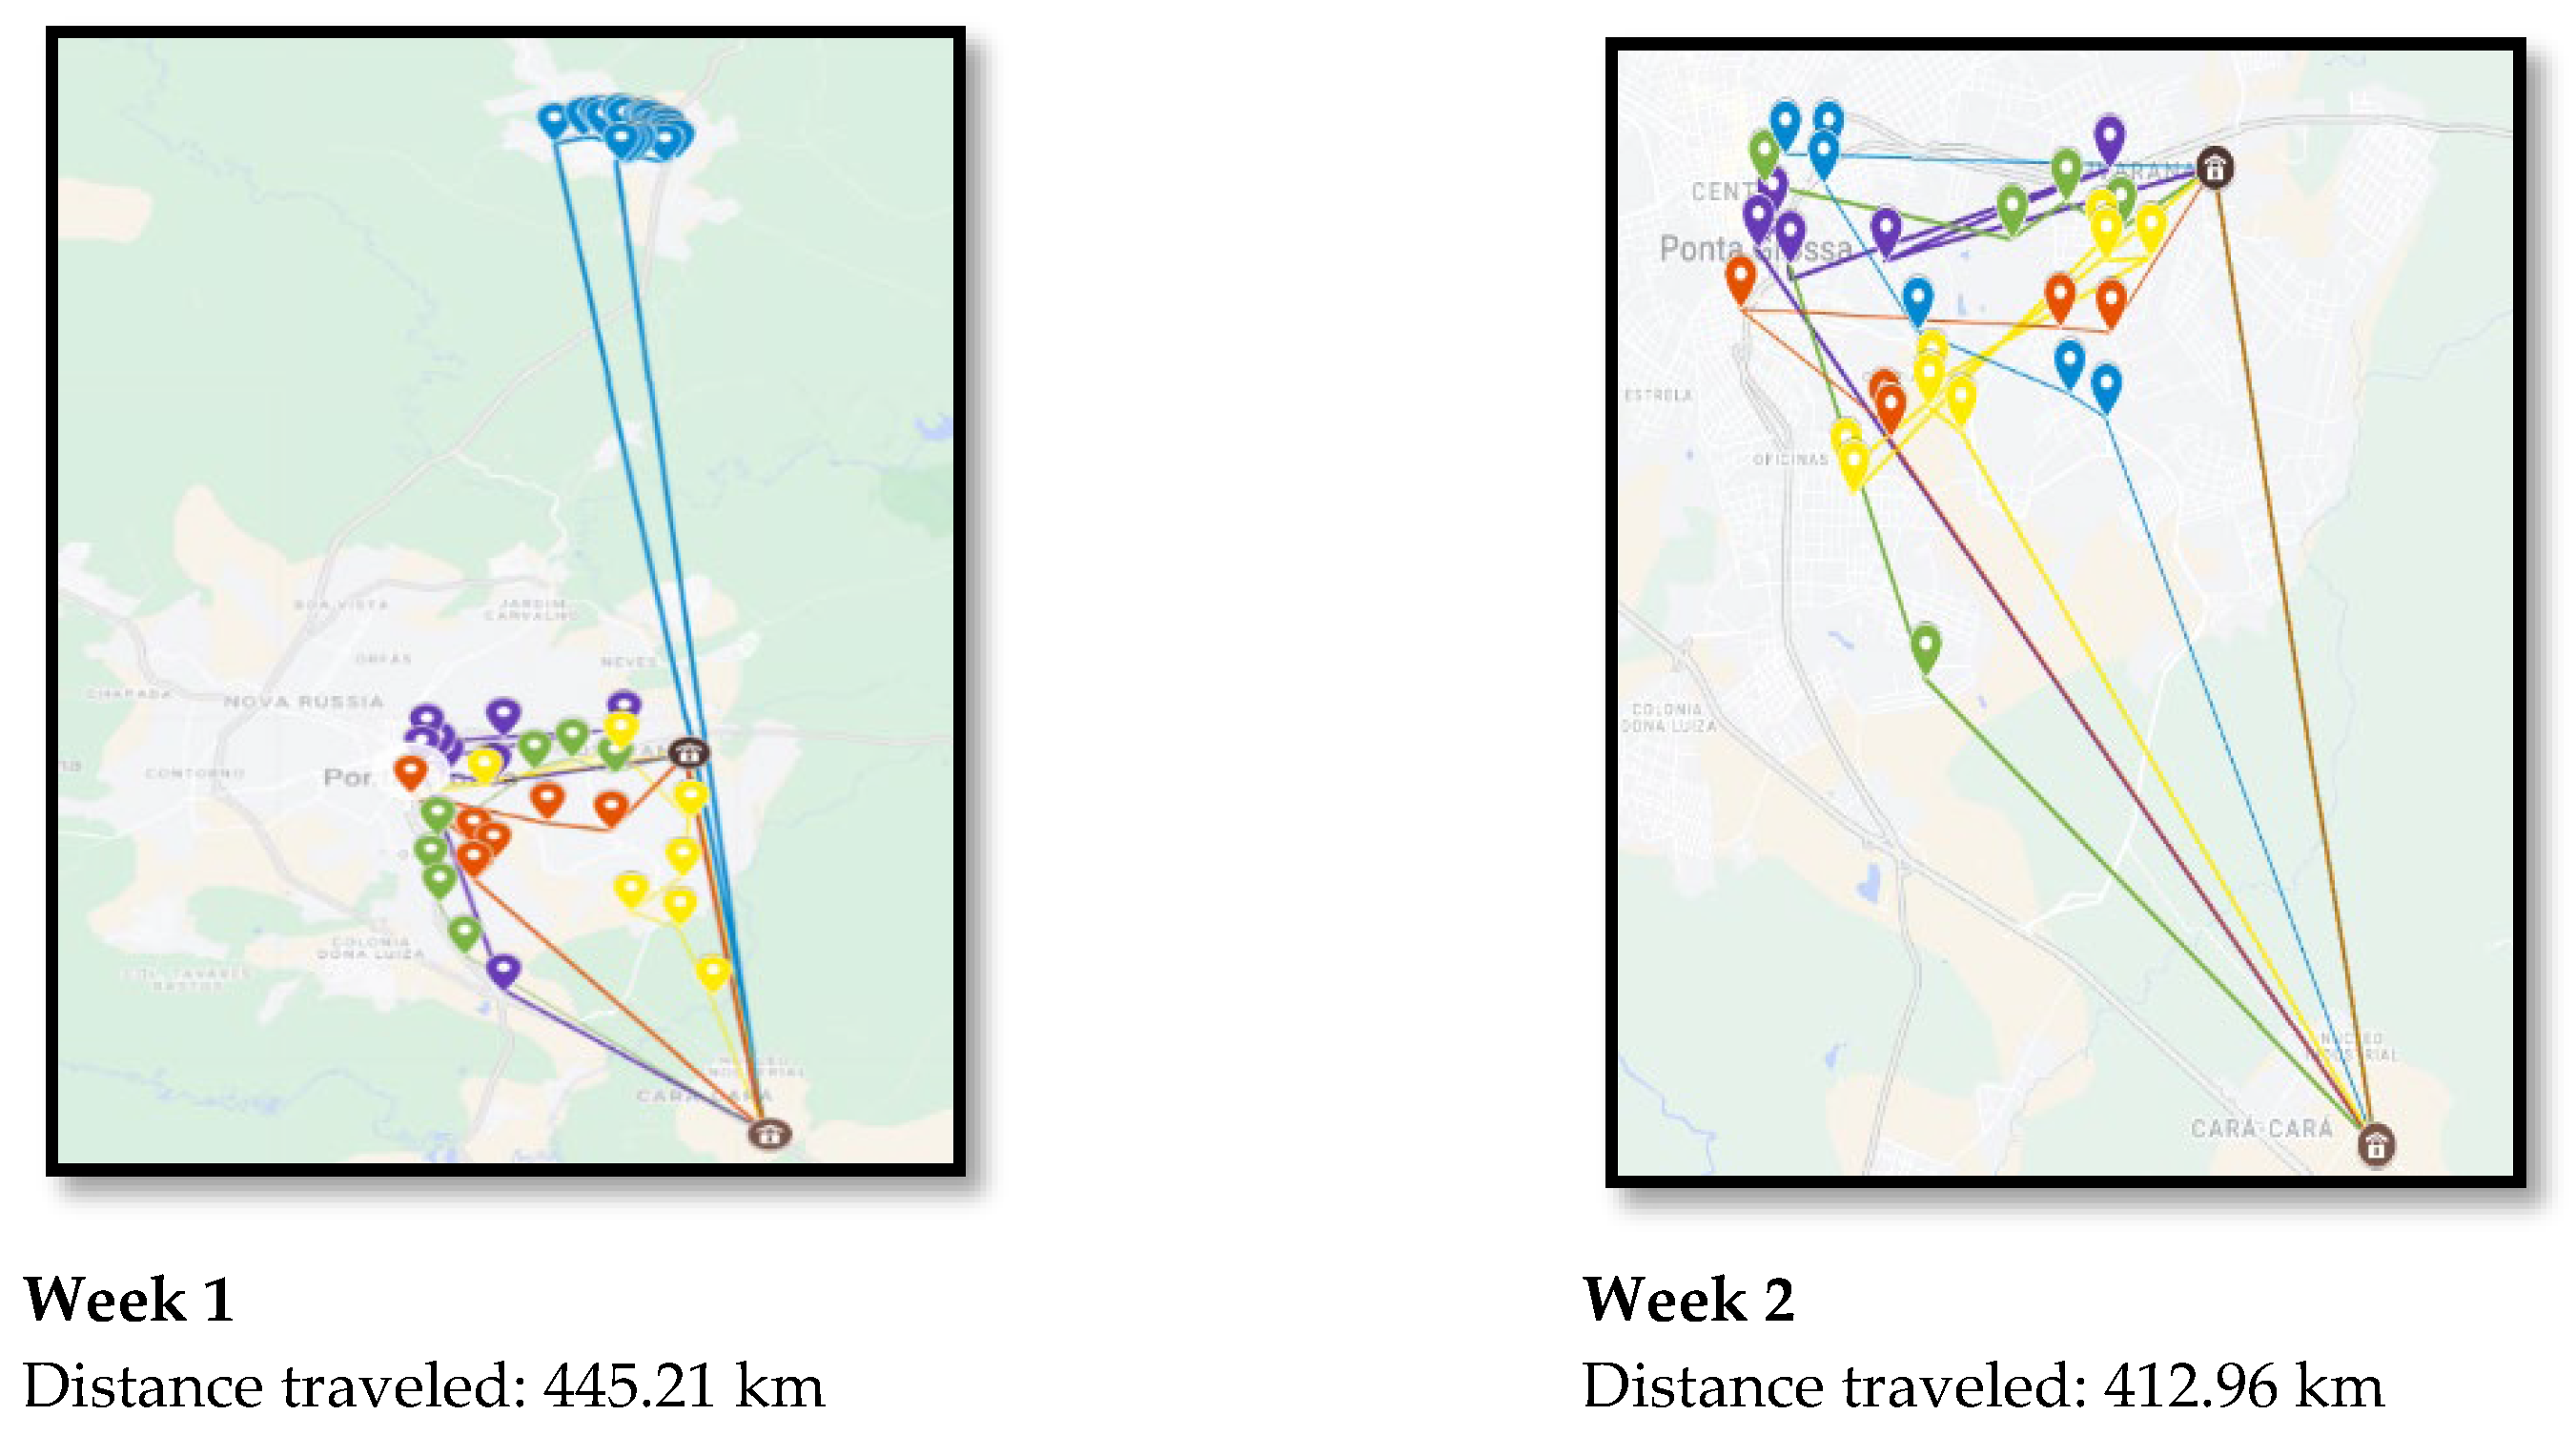
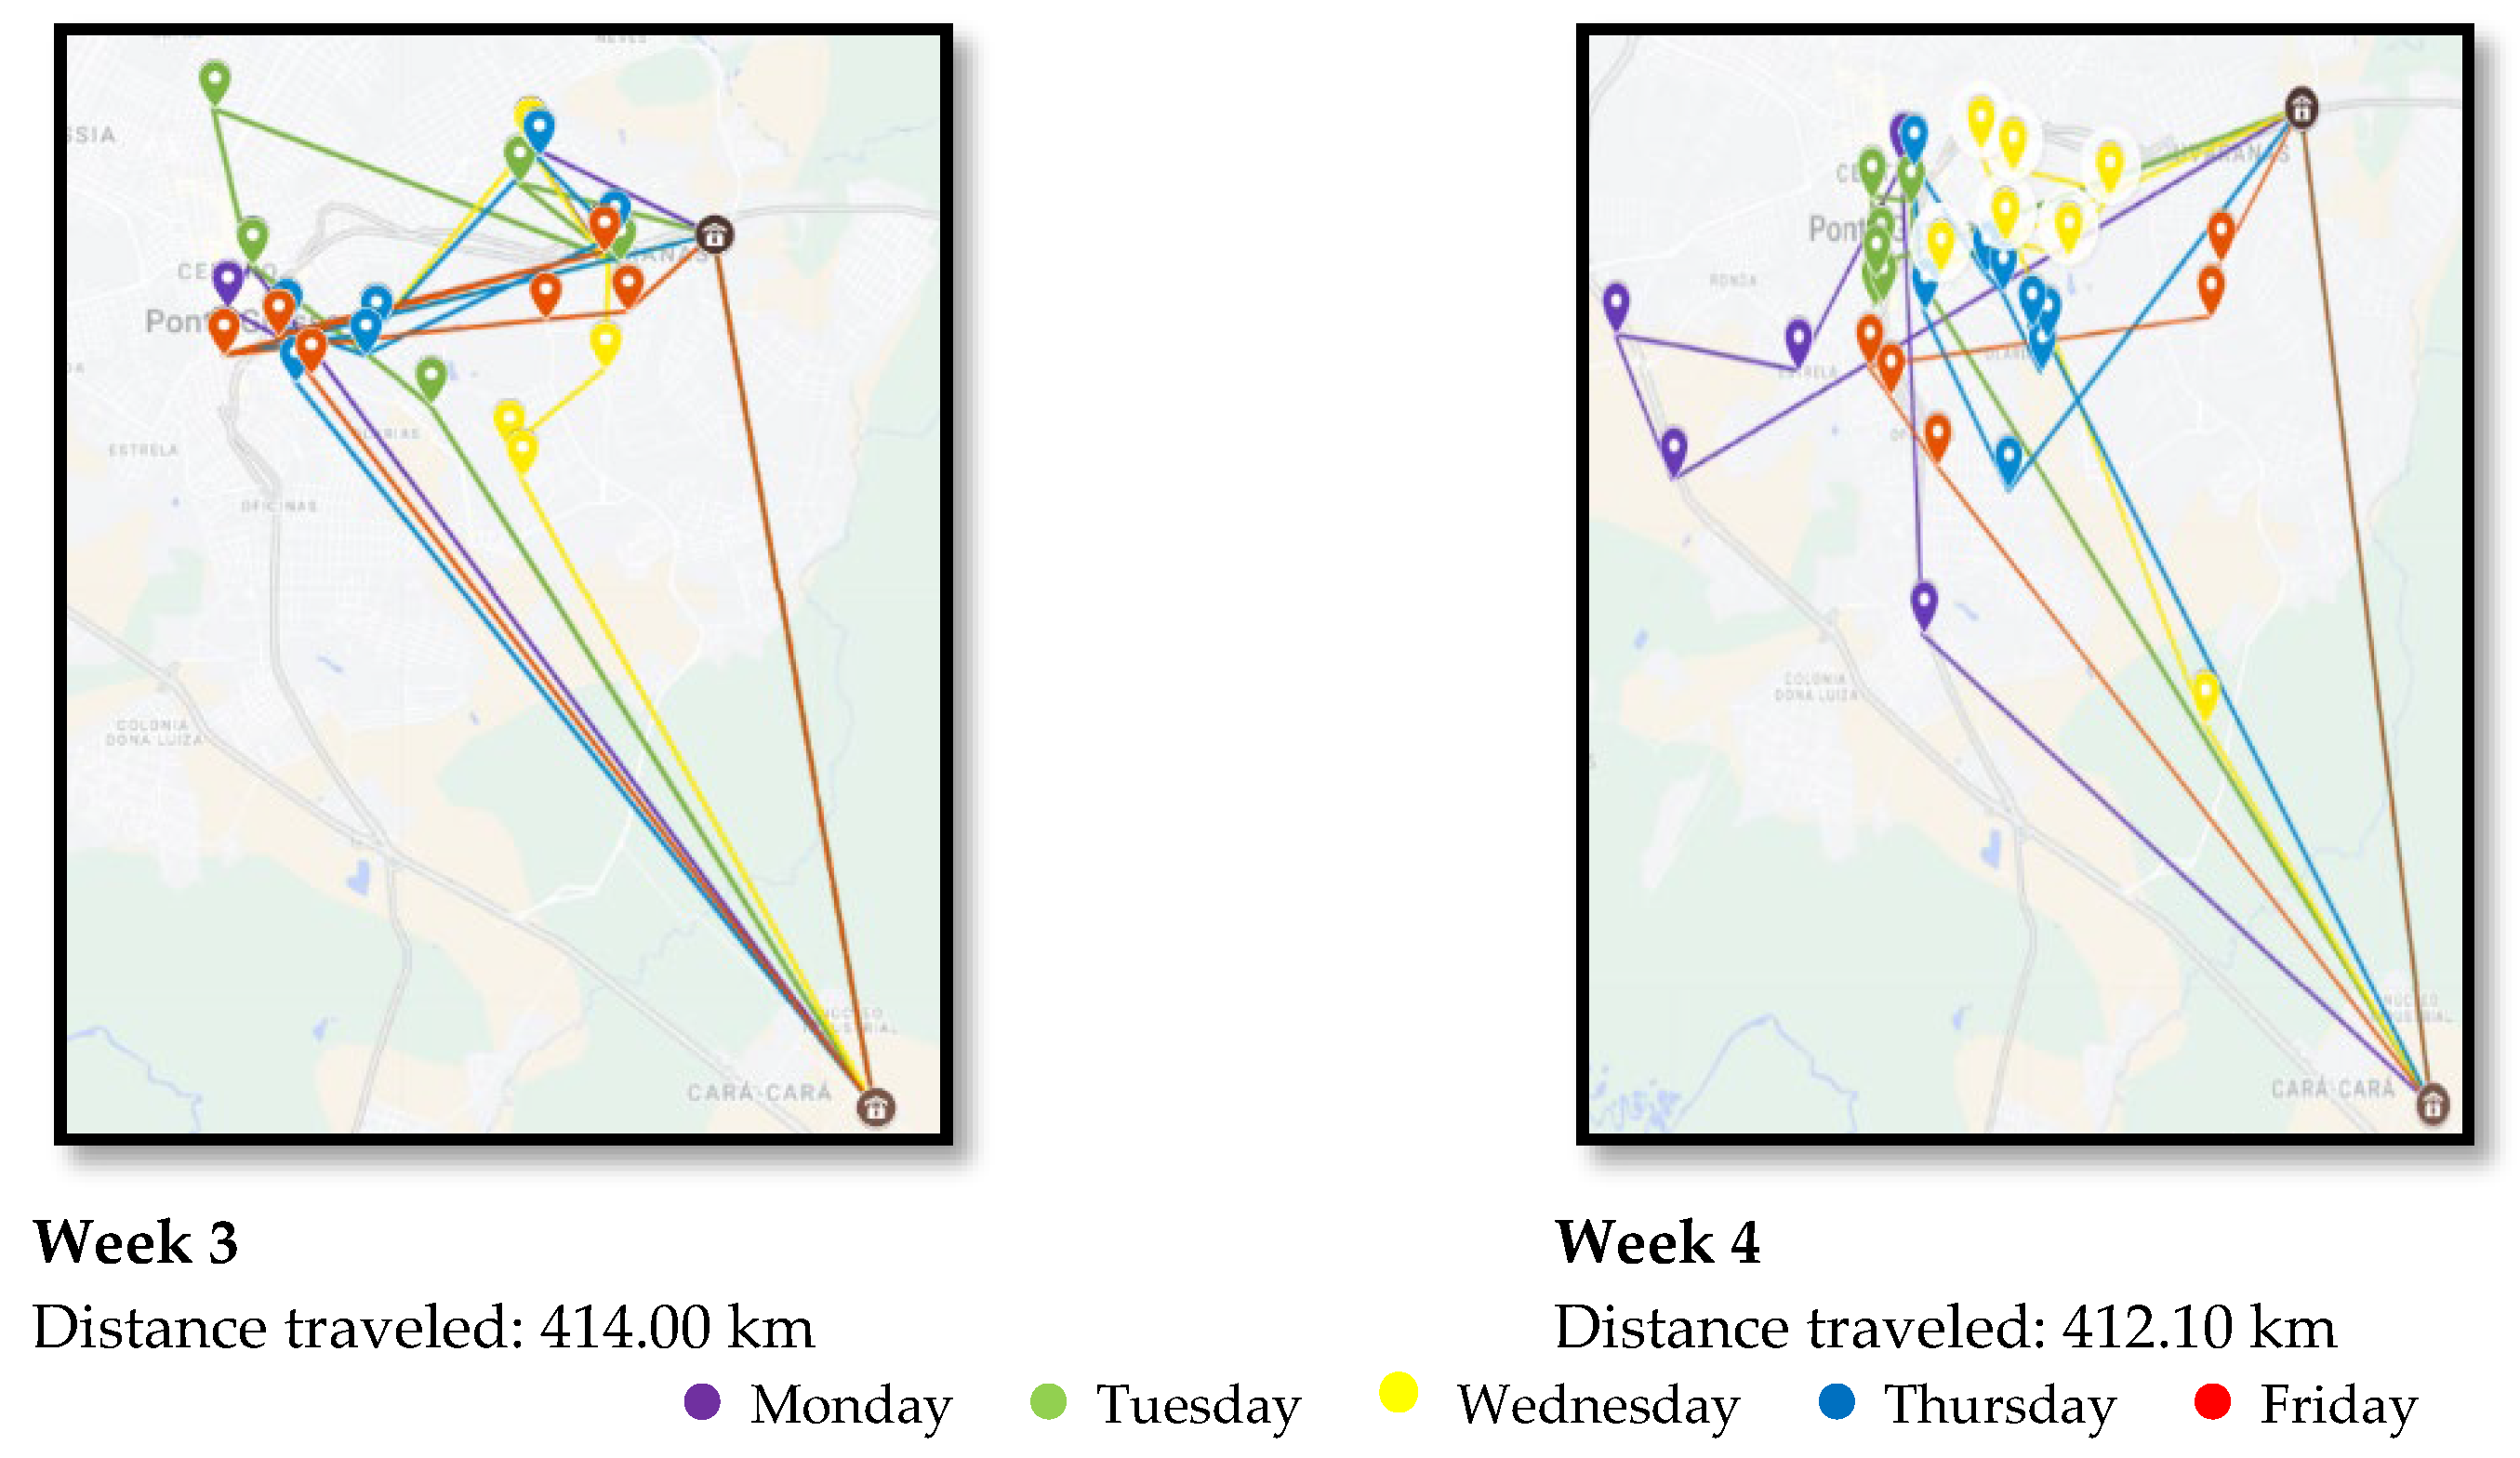
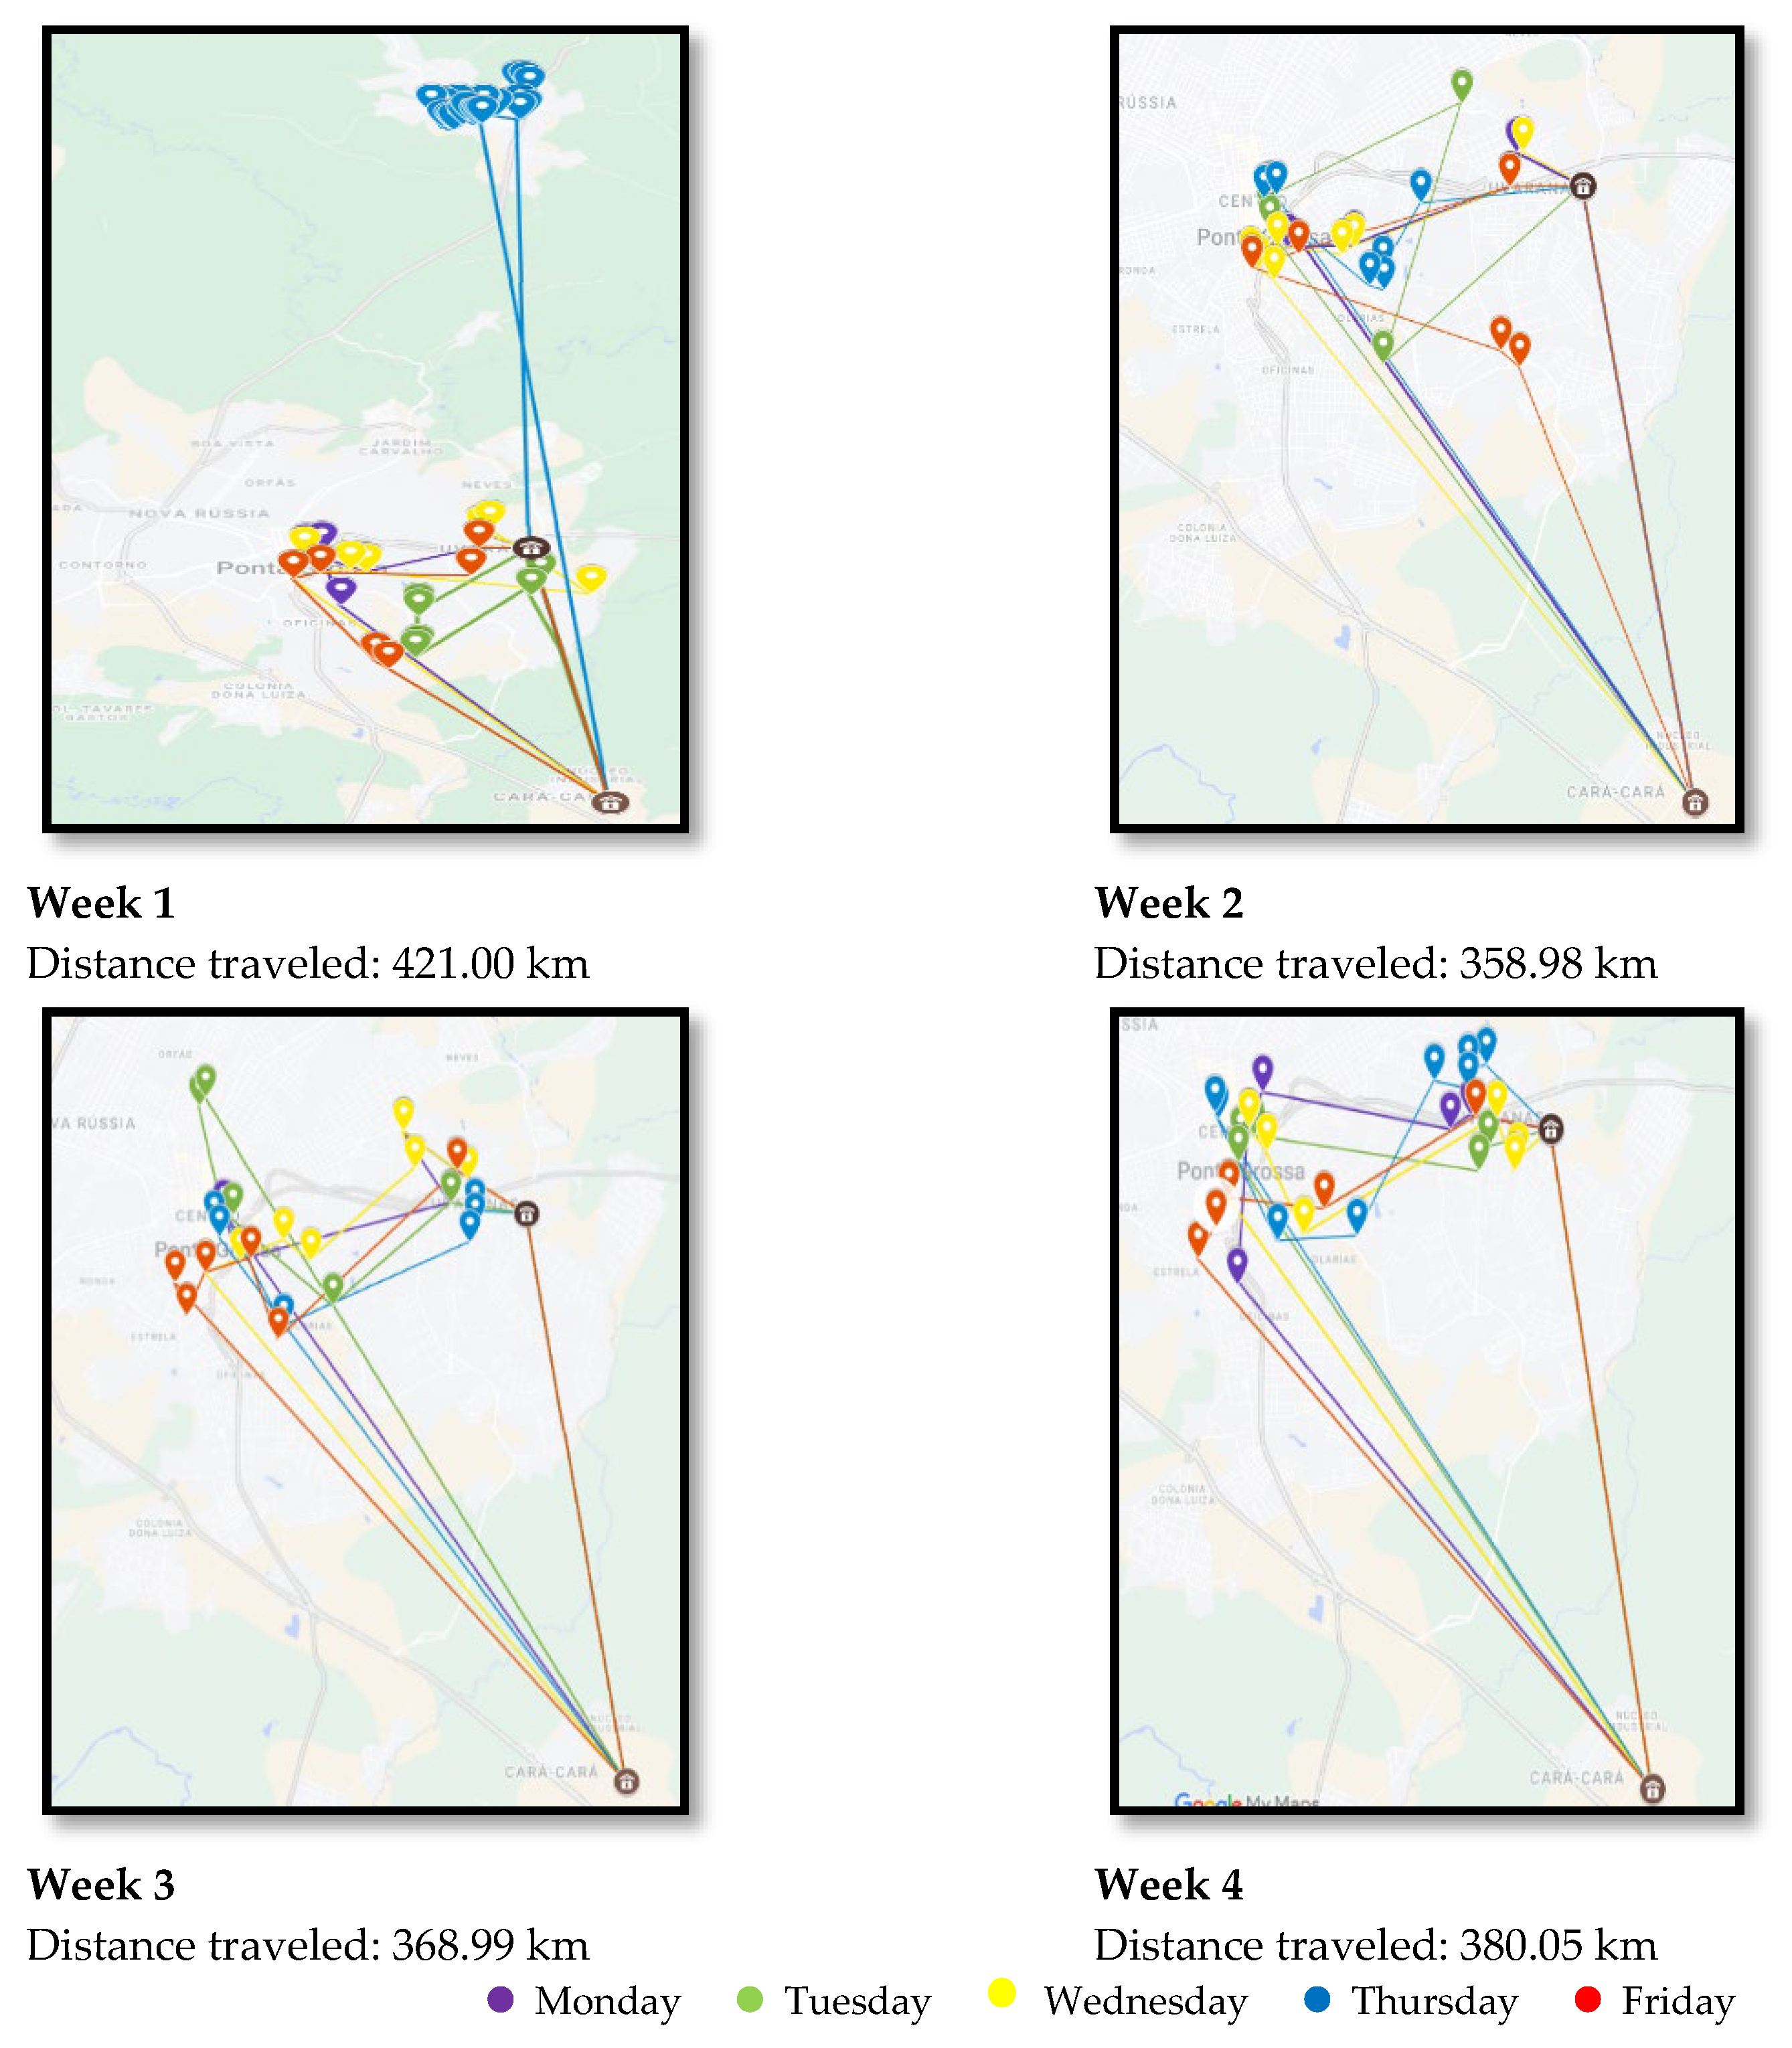
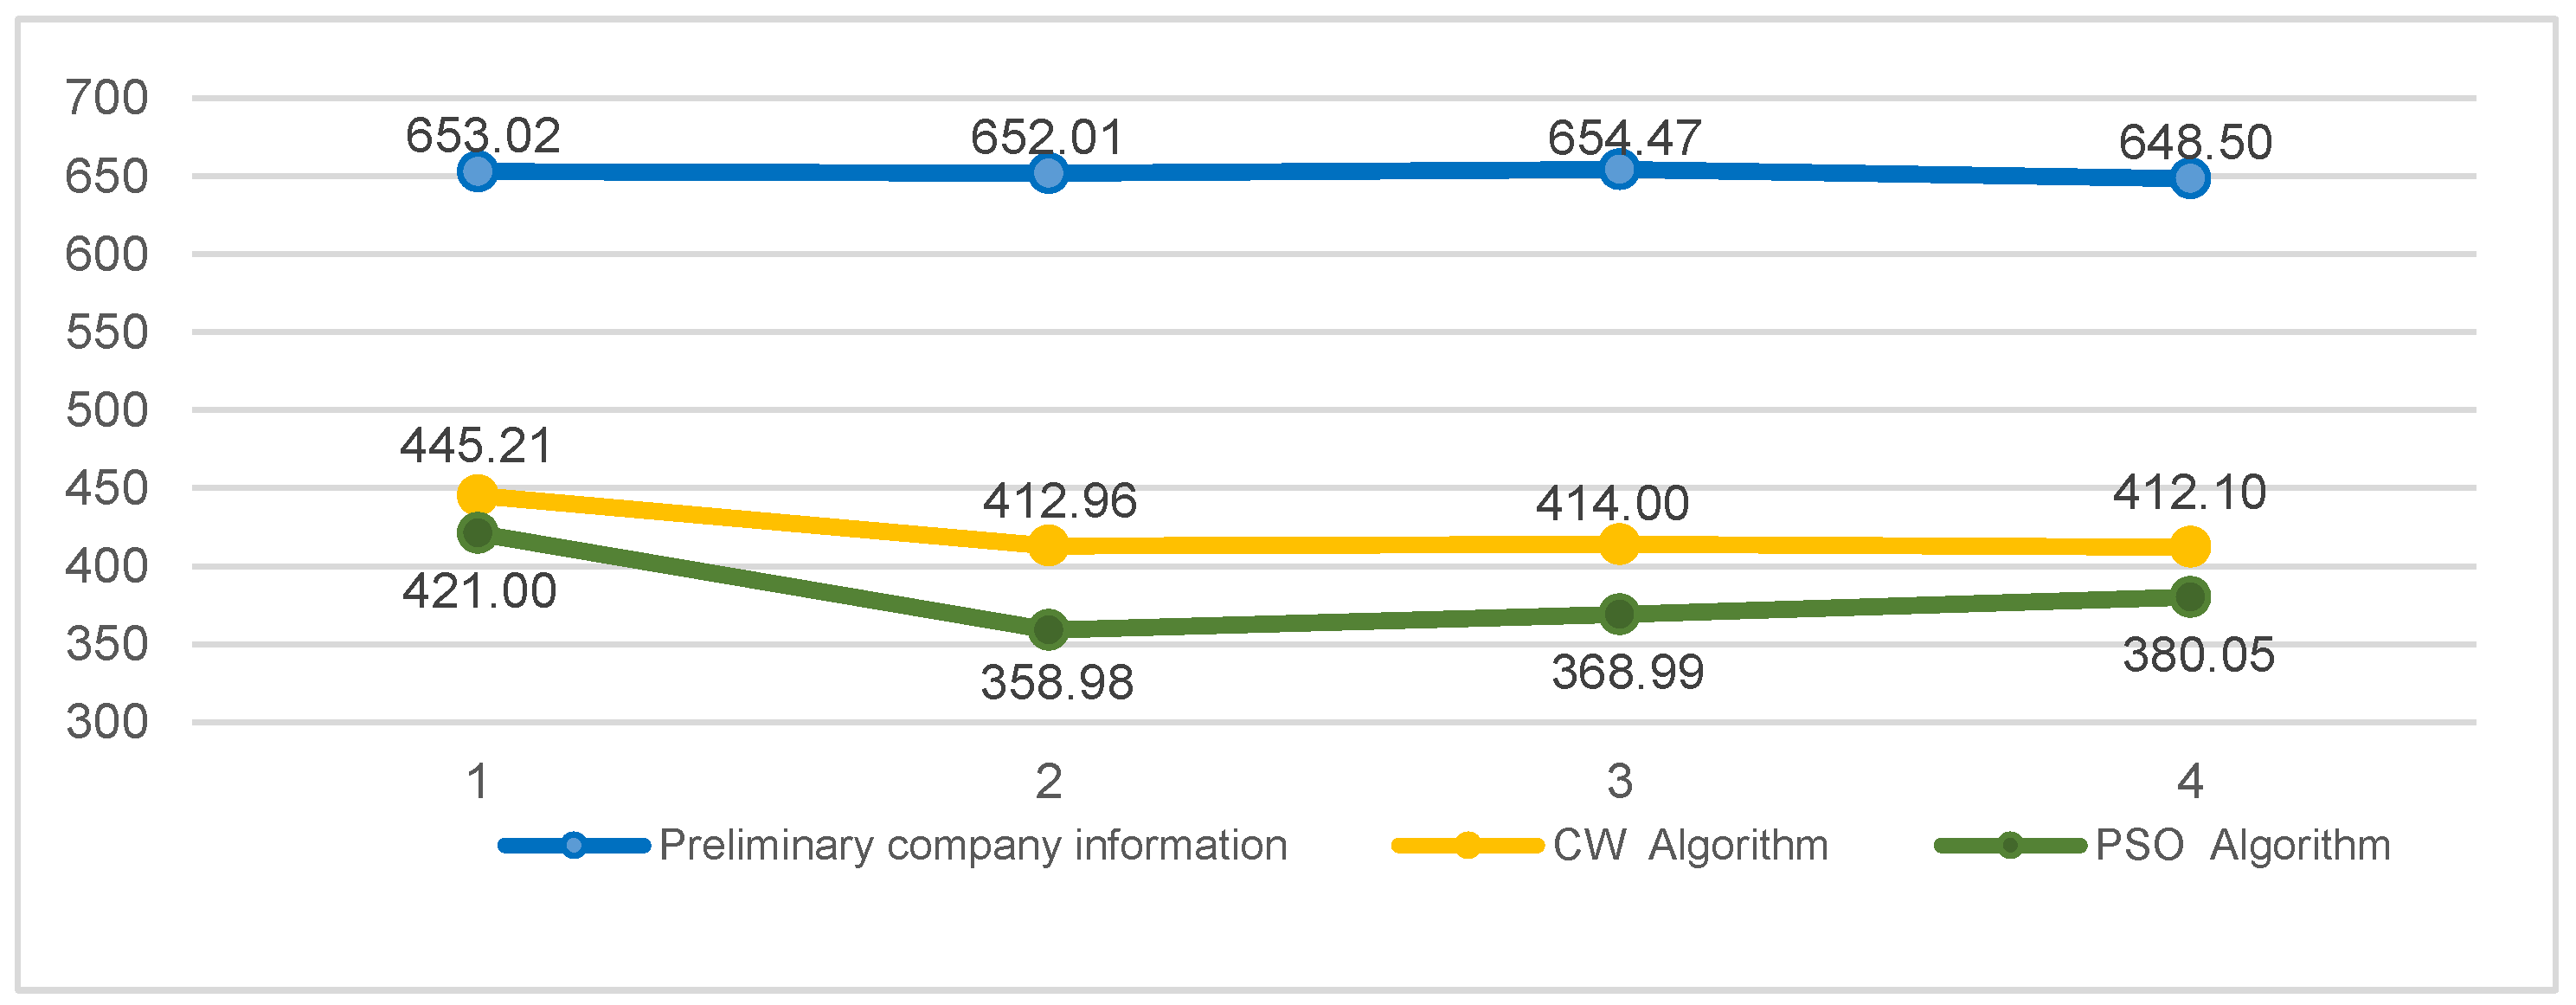
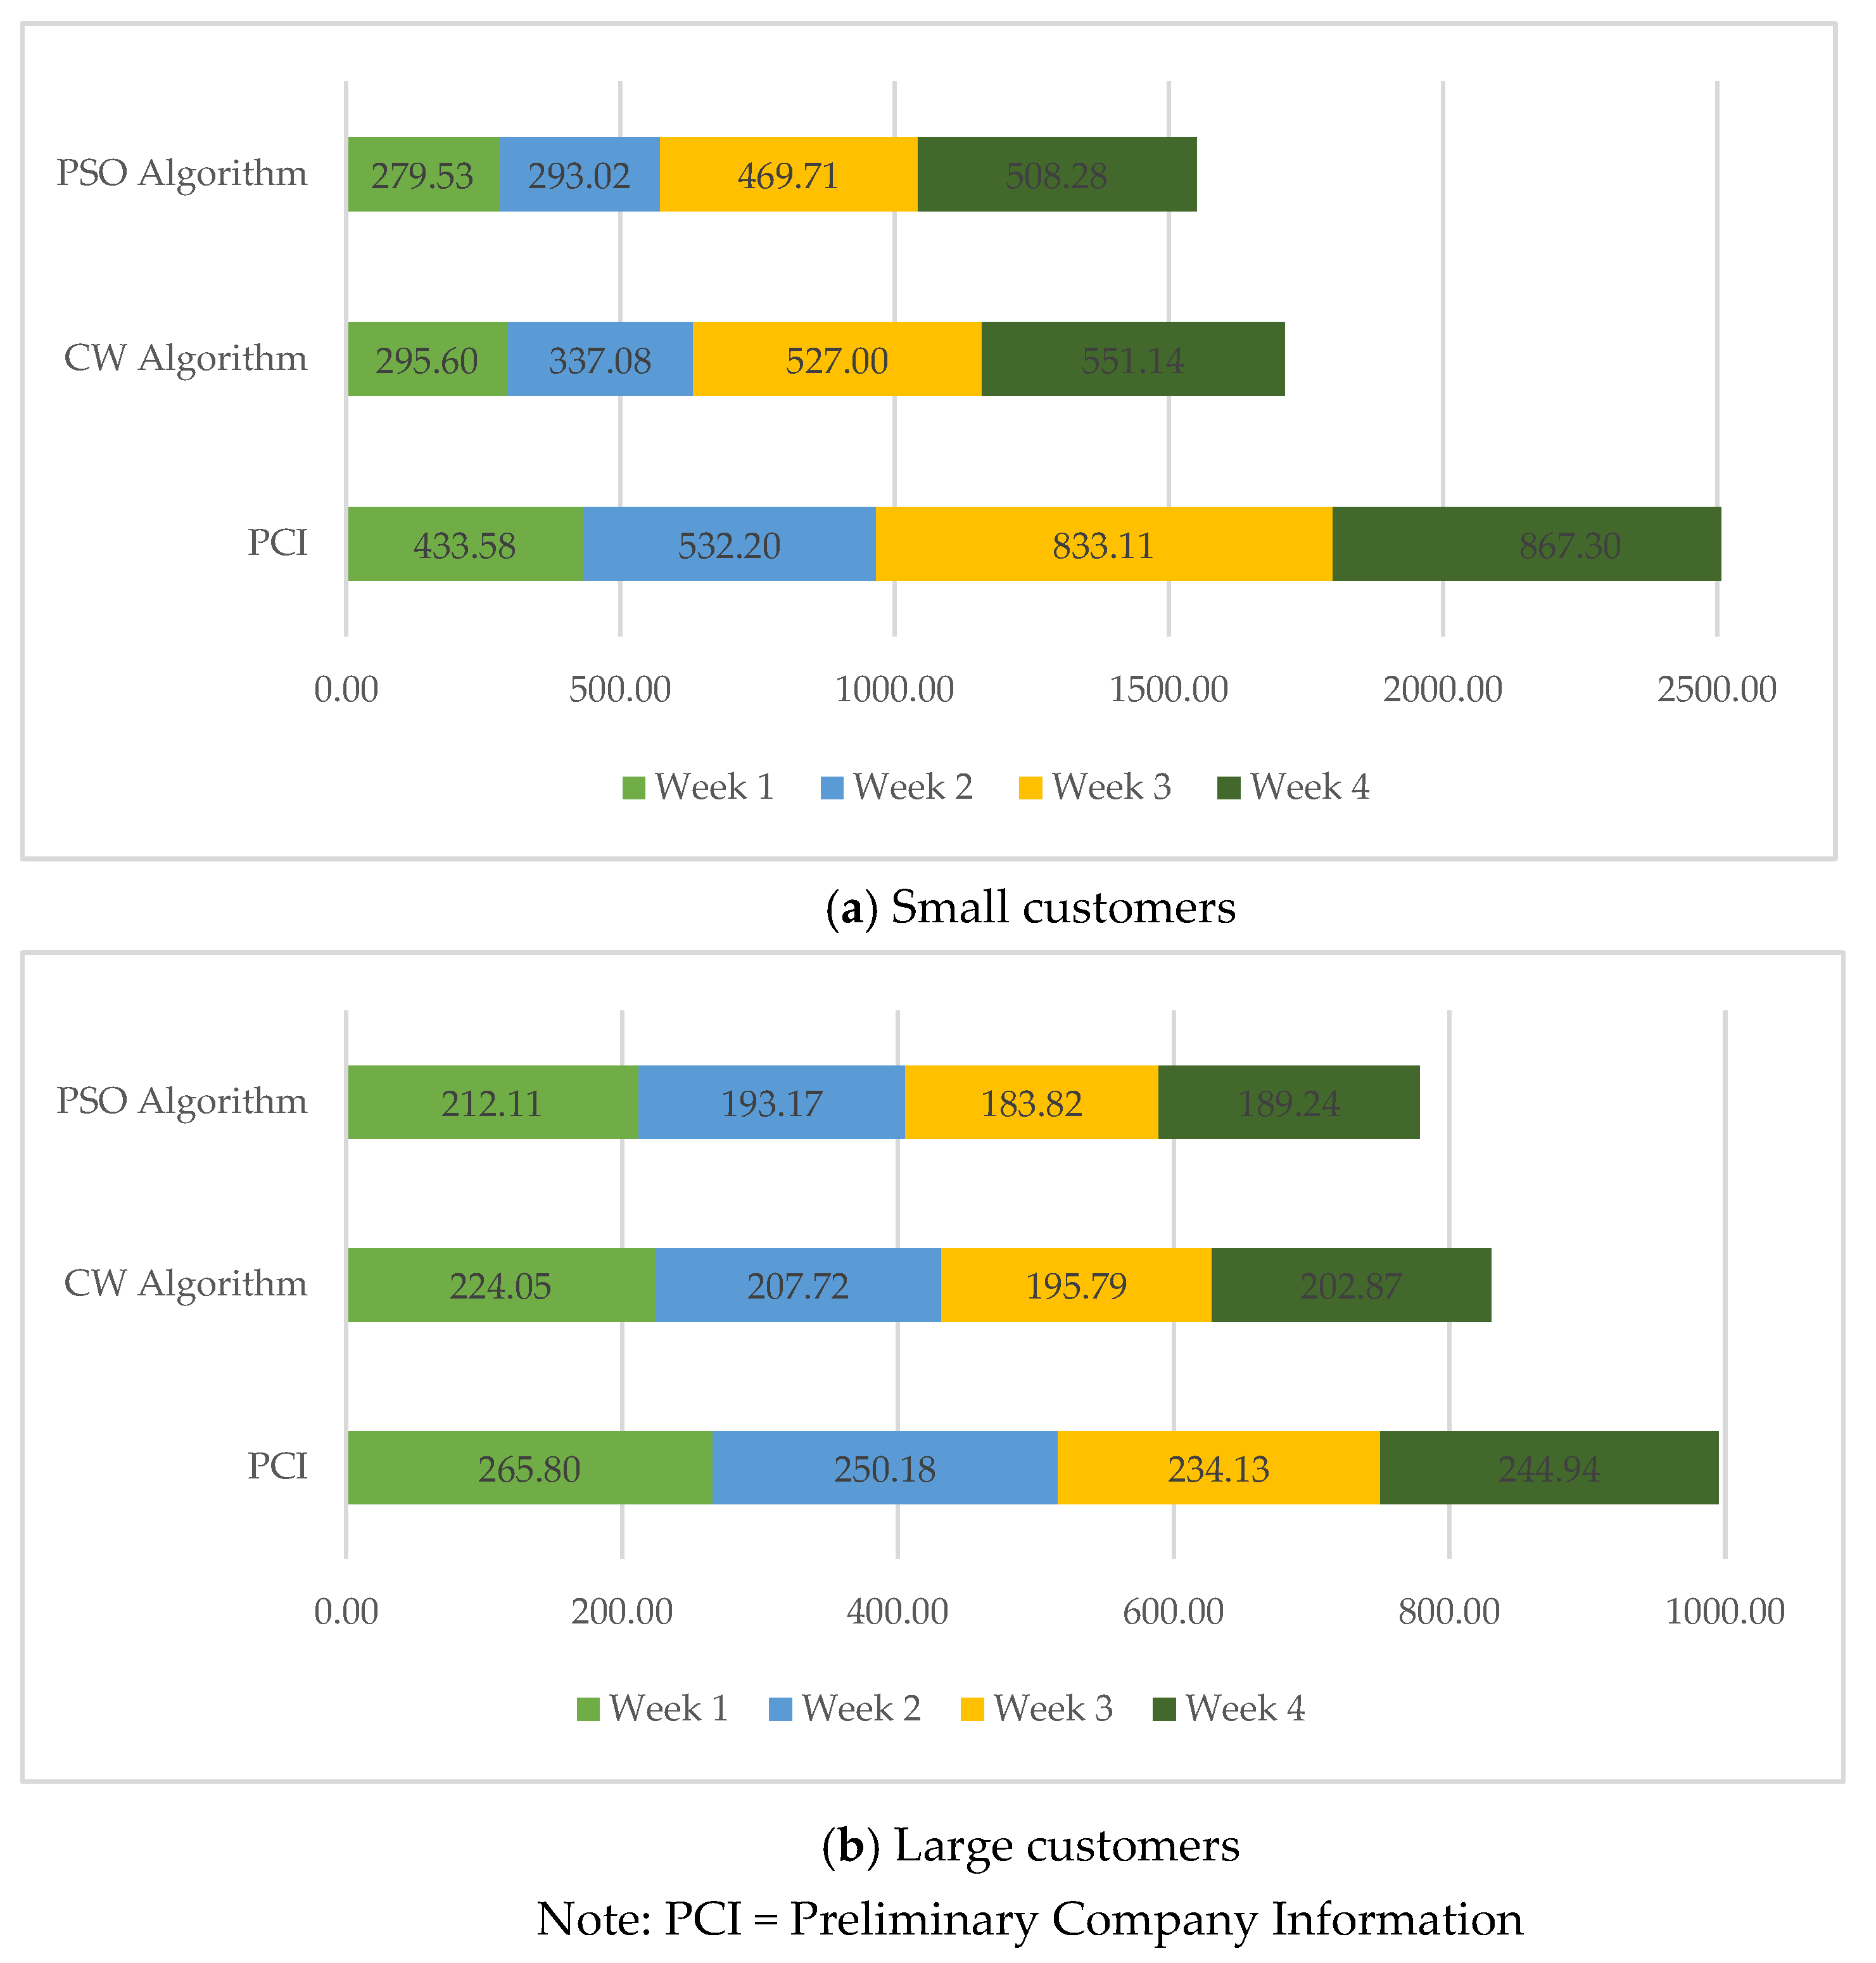
The CW algorithm yielded an average weekly distance of 421.07 km, with weekly variations ranging from 445.21 km (Week 1) to 412.10 km (Week 4). In contrast, PSO achieved a lower average of 382.26 km, ranging from 358.98 km (Week 2) to 421.00 km (Week 1).
Table 4 presents a weekly comparison between the two algorithms, showing that PSO achieved percentage reductions in total distance ranging from 13% in the second week to 5% in the first week. This variability in performance suggests that PSO is particularly effective in scenarios characterized by greater spatial dispersion and heterogeneous demand patterns typical features of small HCW generators.
These results highlight PSO’s superior adaptability to scenarios with high spatial dispersion and heterogeneous demand typical characteristics of small HCW generators. While CW uses a deterministic, locally optimized route structure, PSO performs a global search, enabling more balanced and efficient routes.
Figure 3 and Figure 4 illustrate the routes generated by CW and PSO over four weeks, georeferenced using Google Maps. Both algorithms respected operational constraints, such as fixed depot and autoclave locations, vehicle capacity, and scheduled visit frequencies.
The comparison was conducted using the company’s original route estimates. It should be noted that the case study company did not maintain documented records of the actual distances traveled, so the initial data were not available. The available weekly information was extrapolated to a four-week period to create a monthly estimate to enable a comparison with the algorithmic solutions. Based on this approach, the optimized solutions achieved substantial improvements: the CW algorithm reduced the total distance by 35% (923.73 km), while the PSO algorithm achieved a 41% reduction (1078.98 km). Figure 5 illustrates the weekly distance trends.
Additionally, the Mann–Whitney test was applied to compare the performance of the CW and PSO methods over four weeks. The results revealed statistically significant differences in all analyzed periods (p < 0.001). The CW method consistently exhibited higher mean values than PSO each week, corresponding to longer routes. These findings reinforce the robustness of PSO, which systematically achieved more efficient solutions than CW. Table 5 presents the comparative summary, including the means, standard deviations, and p-values obtained for each week for small customers.
These results confirm the effectiveness of optimization algorithms for HCW planning. However, segmentation based solely on volume may be a limiting factor. Variables such as waste type (e.g., infectious, sharps, chemical), geographical context (urban versus remote), and access condition also impact route performance.

5.2. Large HCW Generators

For the ten large HCW generators, which produced an average of 24,631 kg per month, a 1500 kg capacity vehicle was used. Collection frequencies ranged from three to five days, based on each customer’s waste generation volume. This strategy ensures rapid waste removal and reduces storage time and health risks.
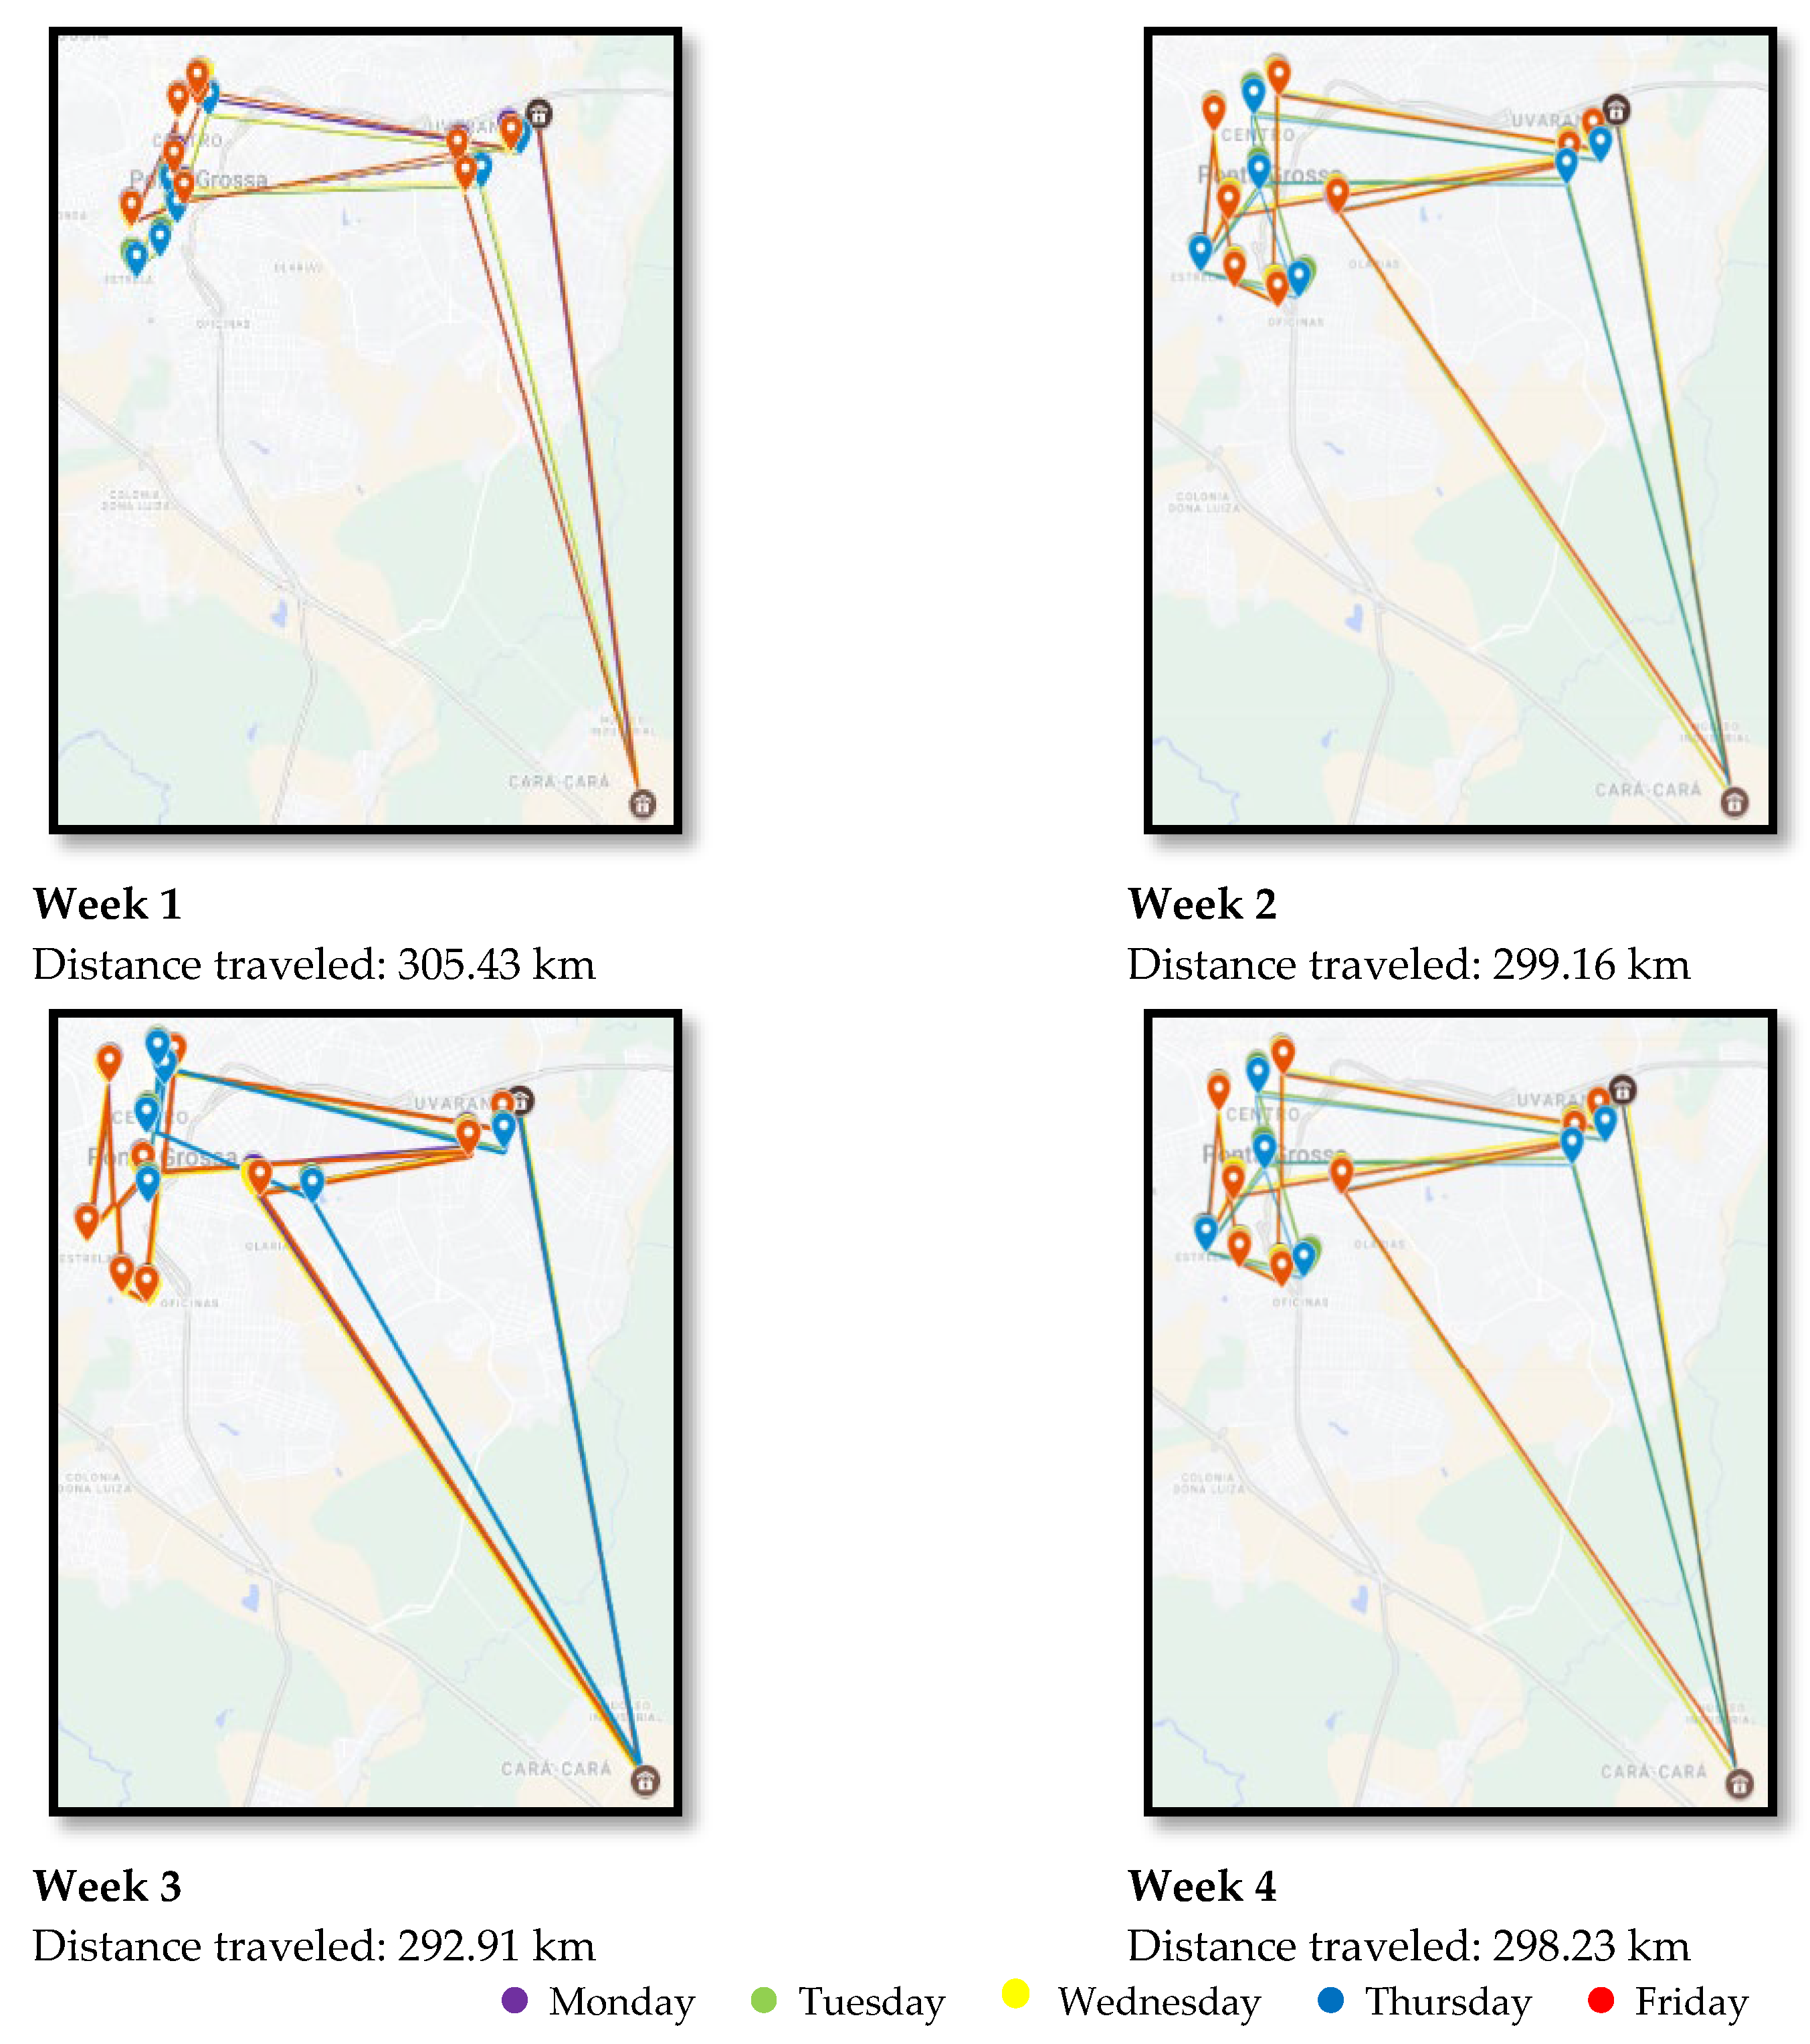
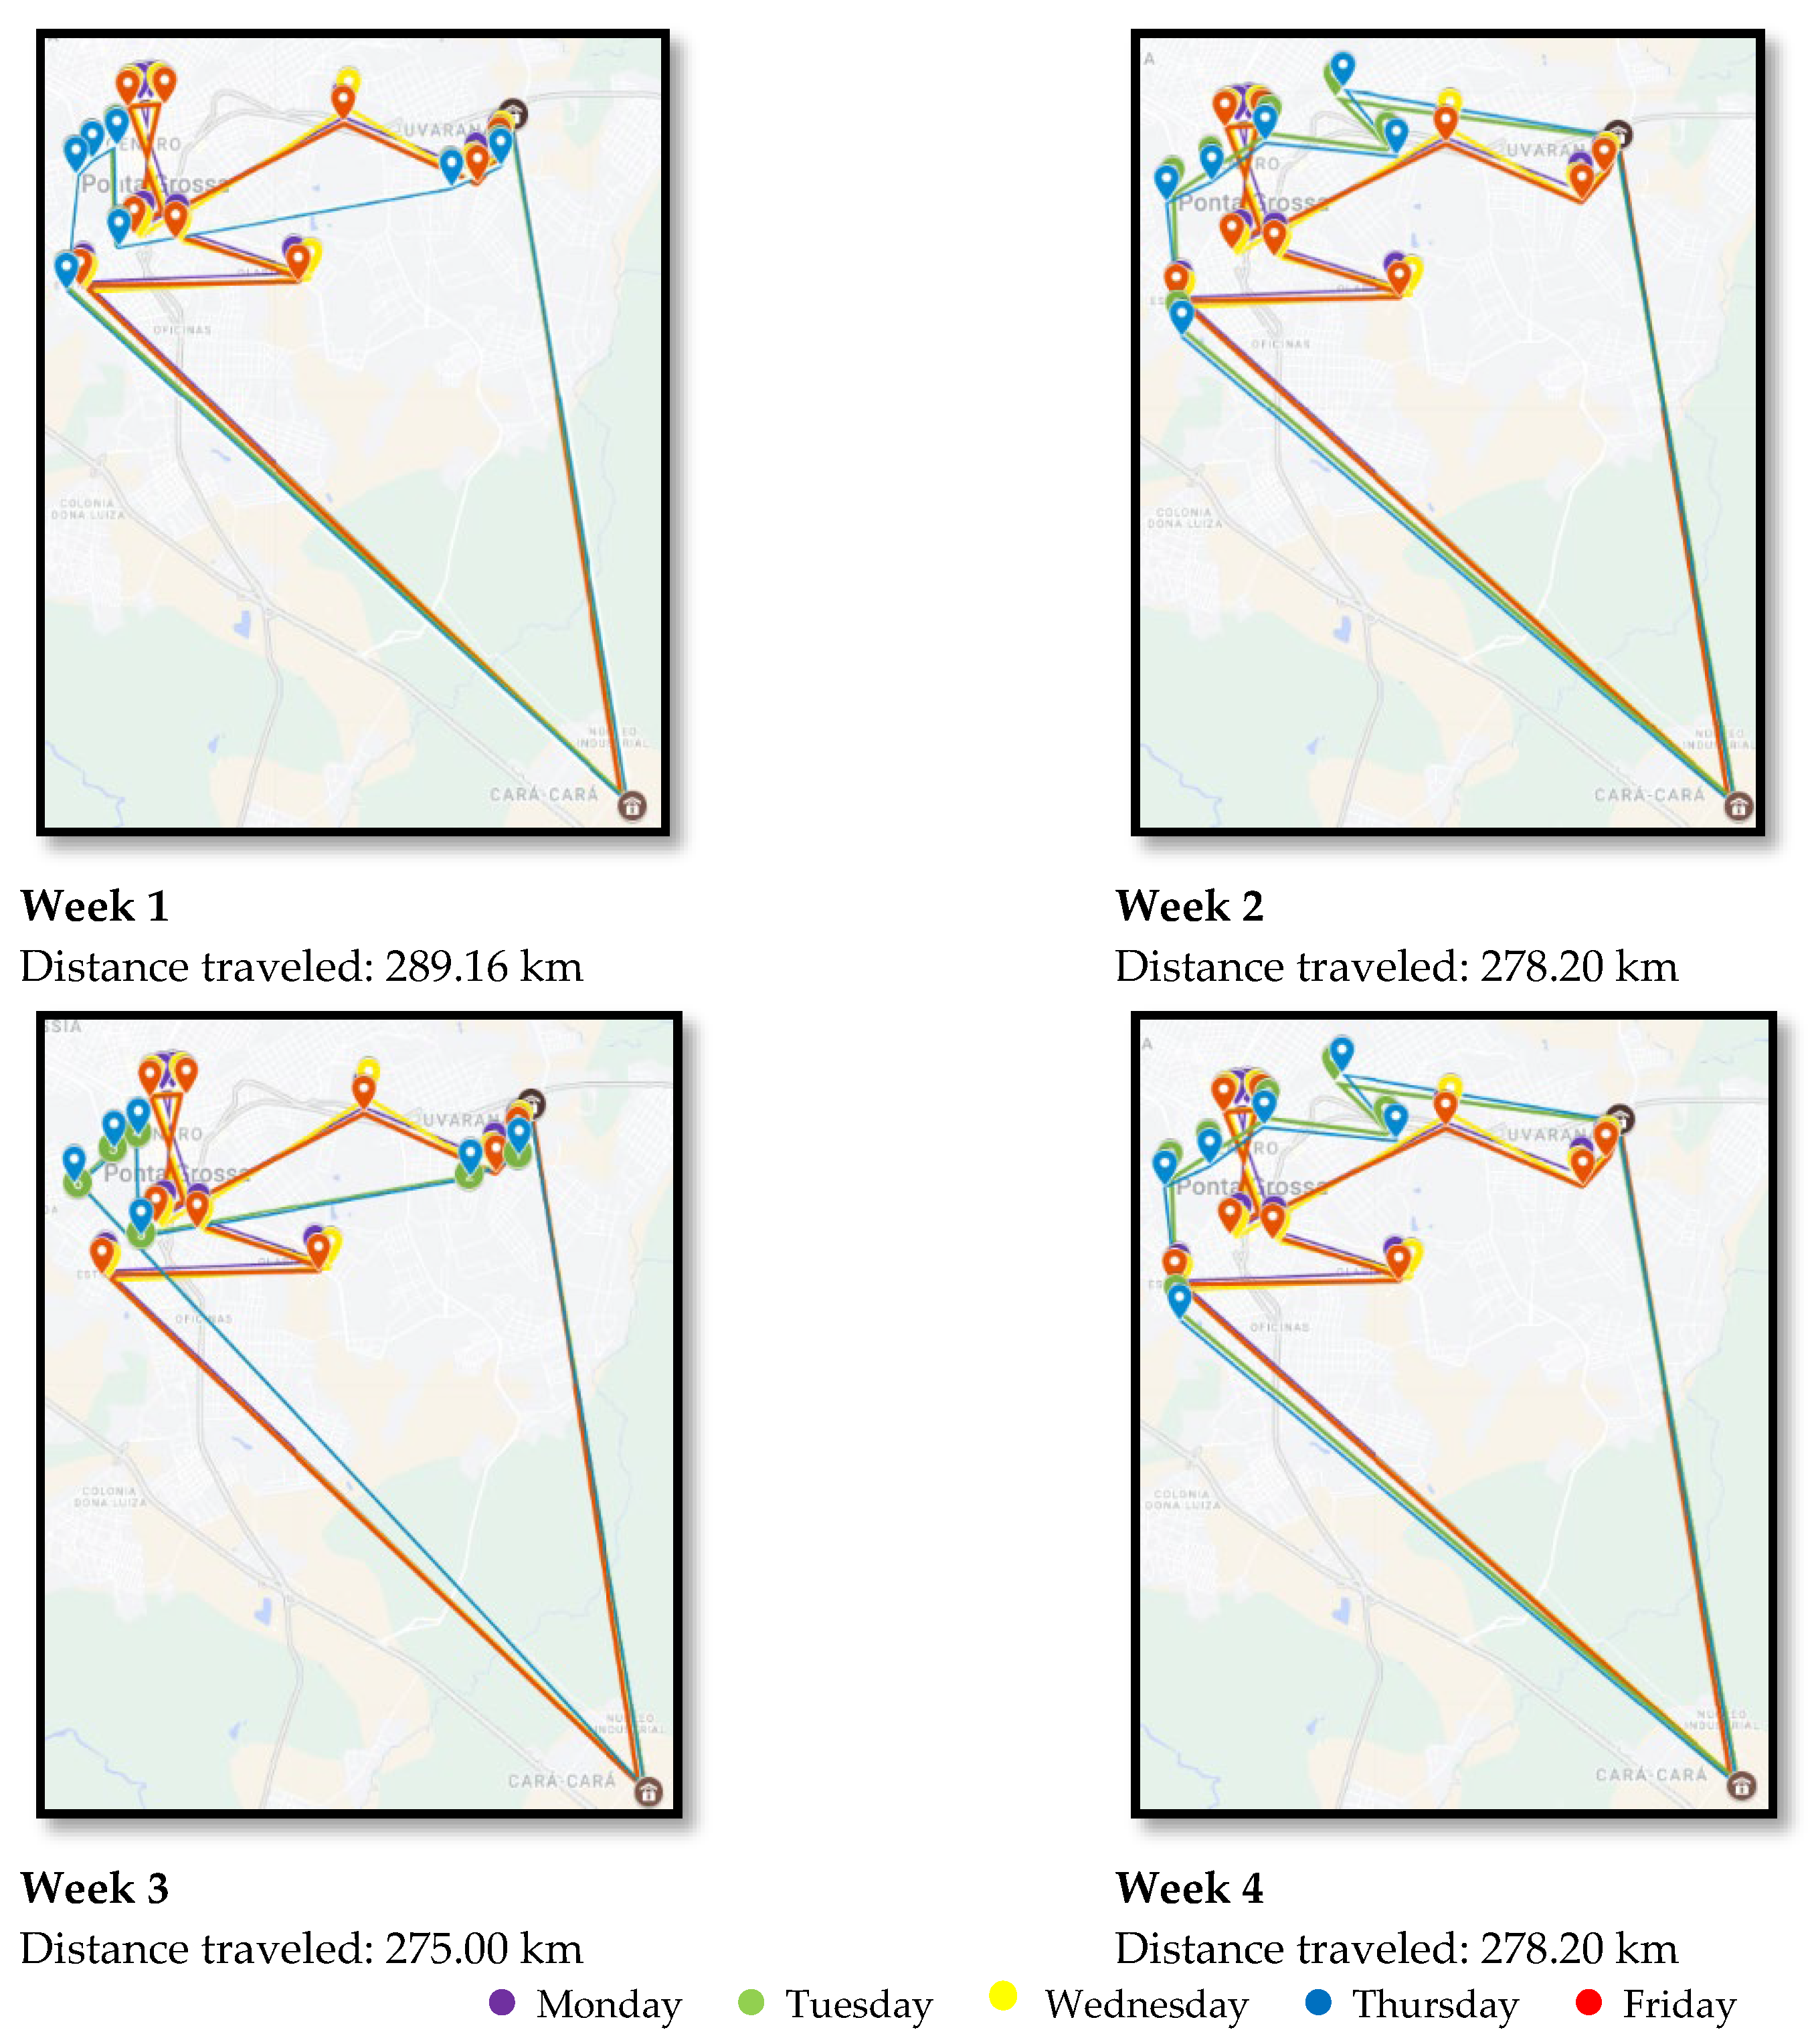
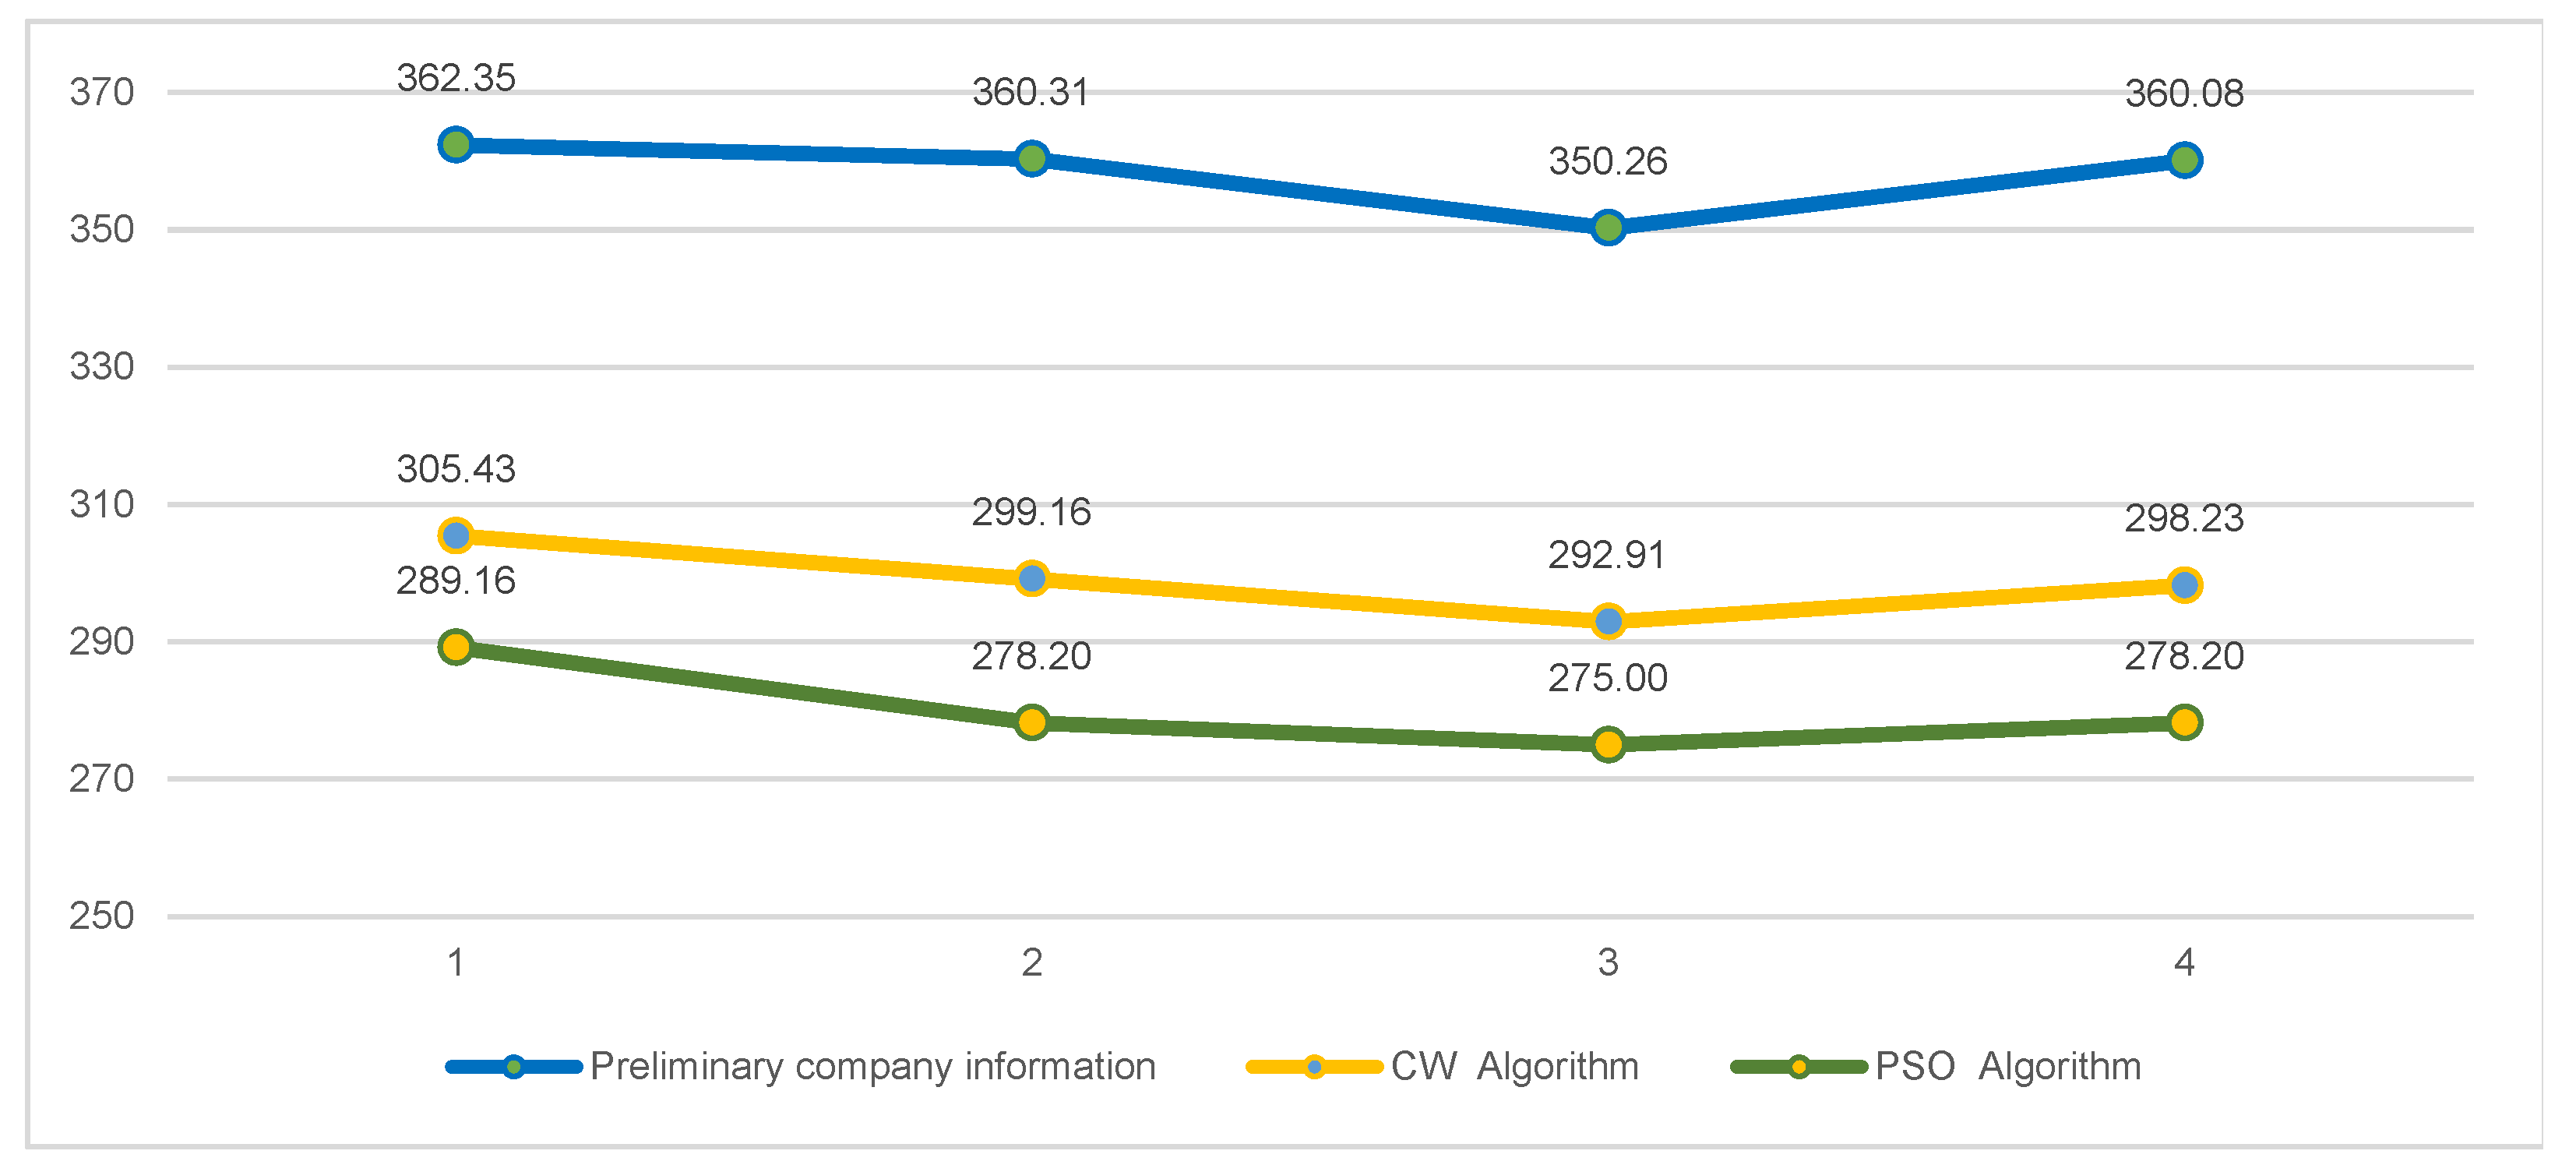
CW generated a total distances 1195.76 km over the four weeks, averaging 298.70 km weekly. In contrast, PSO demonstrated superior and more consistent performance in minimizing total distance, reduces this to of 1120.56 km in total, averaging 280.14 km week. Distance variations are detailed in Table 6.
The PSO algorithm consistently outperformed CW, especially in Weeks 2 and 4, with reductions of 7% (equivalent to 20.96 km and 20.03 km, respectively). Week 1 showed the smallest improvement (5%) reduction (16.27 km). PSO’s population-based nature allows for an effective global search, providing better solutions in the complex PVRP space under high-volume and high-frequency conditions. In contrast, the CW constructive heuristic, due to its deterministic and sequential structure, is more susceptible to local optima in such complex scenarios.
In contrast to small generators, large generators are more concentrated in urban areas, where logistical access is less complex and waste volumes are more predictable. This lower variability limits the potential for drastic optimization, which may explain the more modest percentage differences observed between the algorithms. Still, PSO generated less redundant and more compact routes.
Figure 6 and Figure 7 show the georeferenced CW and PSO routes, respectively. The lines depicted on the maps represent the routes defined by each algorithm, allowing for visual confirmation of compliance with operational constraints and the spatial efficiency of the proposed solutions.
Compared to the company’s baseline, which estimated 1433 km per month for this segment, CW reduces total distance by 17% (237.27 km), and PSO by 22% (312.44 km). It should be noted that the company did not maintain documented records of actual distances traveled for this segment; therefore, the baseline was estimated based on extrapolated weekly information to generate a monthly reference. Figure 8 summarizes these differences to reduce operational costs, collection time, and greenhouse gas emissions, illustrating these comparative outcomes.
In addition to the quantitative analyses, it is important to emphasize qualitative factors that support the use of PSO in this context: its ability to escape local optima, adaptability to multiple simultaneous constraints (such as time windows and capacity limits), and potential for generalization to other geographic regions or operational scenarios.
As in the analysis of large customers, the Mann–Whitney test confirmed that PSO significantly outperformed CW in route optimization for small customers over the four-week study period (p < 0.001). The superiority of PSO was consistently observed across all weeks, with shorter average routes and lower standard deviations. These findings demonstrate the robustness of PSO in achieving more efficient routing solutions, a result that proved consistent for both customer groups. Complete statistical details are provided in Table 7.

5.3. Environmental Impact Assessment

Optimizing reduces vehicle travel distances, resulting in lower GHG emissions, especially carbon dioxide (CO2), thereby contributing to improved air quality in urban areas and to global climate change mitigation efforts. This directly supports SDGs, particularly SDG 11 (Sustainable Cities and Communities) and SDG 13 (Climate Action).
The GHG Emissions Calculation Tool [42] was used with a well-established methodology that combines operational data with standardized emission factors. First, the total fuel consumption for each vehicle type was derived from the company’s monthly operational records (Table 8). The fuel consumption per kilometer was then calculated, based on the total distance traveled, by the algorithms.
To convert fuel usage into CO2 emissions, we applied the standard emission factor of 2.68 kg of CO2 per liter of diesel, as published by the UK’s Department for Environment, Food & Rural Affairs (DEFRA) [43]. While this generic factor does not account for specific vehicle models, load conditions, or urban driving patterns, it was consistently applied to both the baseline and optimized (CW and PSO) scenarios. This ensured that the relative comparison between the algorithms’ environmental performance remained robust and valid, as any absolute inaccuracy would affect all scenarios equally. The primary conclusion of this analysis is the significant relative reduction achieved by optimization, rather than the absolute emission value itself.
This information highlights the relevance of assessing environmental sustainability in waste collection systems. Furthermore, it provides a quantitative basis for comparing the CO2 emissions associated with the results of the CW and PSO algorithms. Figure 9 illustrates this comparison, showing emissions before and after applying both methods.
For small generators, average emissions were 666.55 tons before optimization. CW reduced this by 35.42% (equivalent to 427.71 tons), while PSO demonstrated superior performance, achieving a 41.37% reduction (equivalent to 387.63 tons).
This data quantifies the positive impact of optimization and clearly demonstrates that the PSO algorithm is significantly more efficient in reducing emissions for this customer group. This efficiency stems from its capability to explore globally optimal solutions, minimizing route overlaps and consolidating services with reduced idle load. Given that the small generators are geographically dispersed, the flexibility of PSO enables it to better adapt to spatial diversity, representing a strategic advantage over the more rigid CW algorithm, whose structure restricts route quality in less flexible contexts.
For large generators, initial emissions were 248.76 tons. CW reduced this by 16.56% (equivalent to 207.61 tons), and PSO proved more effective, achieving an average reduction of 21.80% (equivalent to 194.59 tons).
The smaller percentage difference between the algorithms in this segment is attributed to the fact that large generators are typically located in central urban areas, characterized by greater predictability and less spatial dispersion. This constrains the PSO algorithm’s ability to find significantly shorter routes.
The analysis of carbon emission data, validated using the GHG Protocol methodology, confirms that the implementation of the CW algorithm, and particularly the PSO algorithm, represents a substantially more sustainable alternative for the transportation of HCW. The positive environmental impact is especially pronounced in the small generators segment, where route optimization yielded a higher percentage reduction in emissions. These findings underscore the critical importance of route optimization in waste management, not only for operational efficiency but also as a key strategy for reducing the healthcare industry’s carbon footprint.
In addition to the environmental benefits, reducing the distances traveled has significant economic impacts, such as lower fuel consumption and decreased maintenance costs (including oil, tires, and idle engine time). From a social perspective, optimization helps minimize the population’s exposure to potentially hazardous materials by reducing the transit time of vehicles transporting infectious cargo in urban areas.
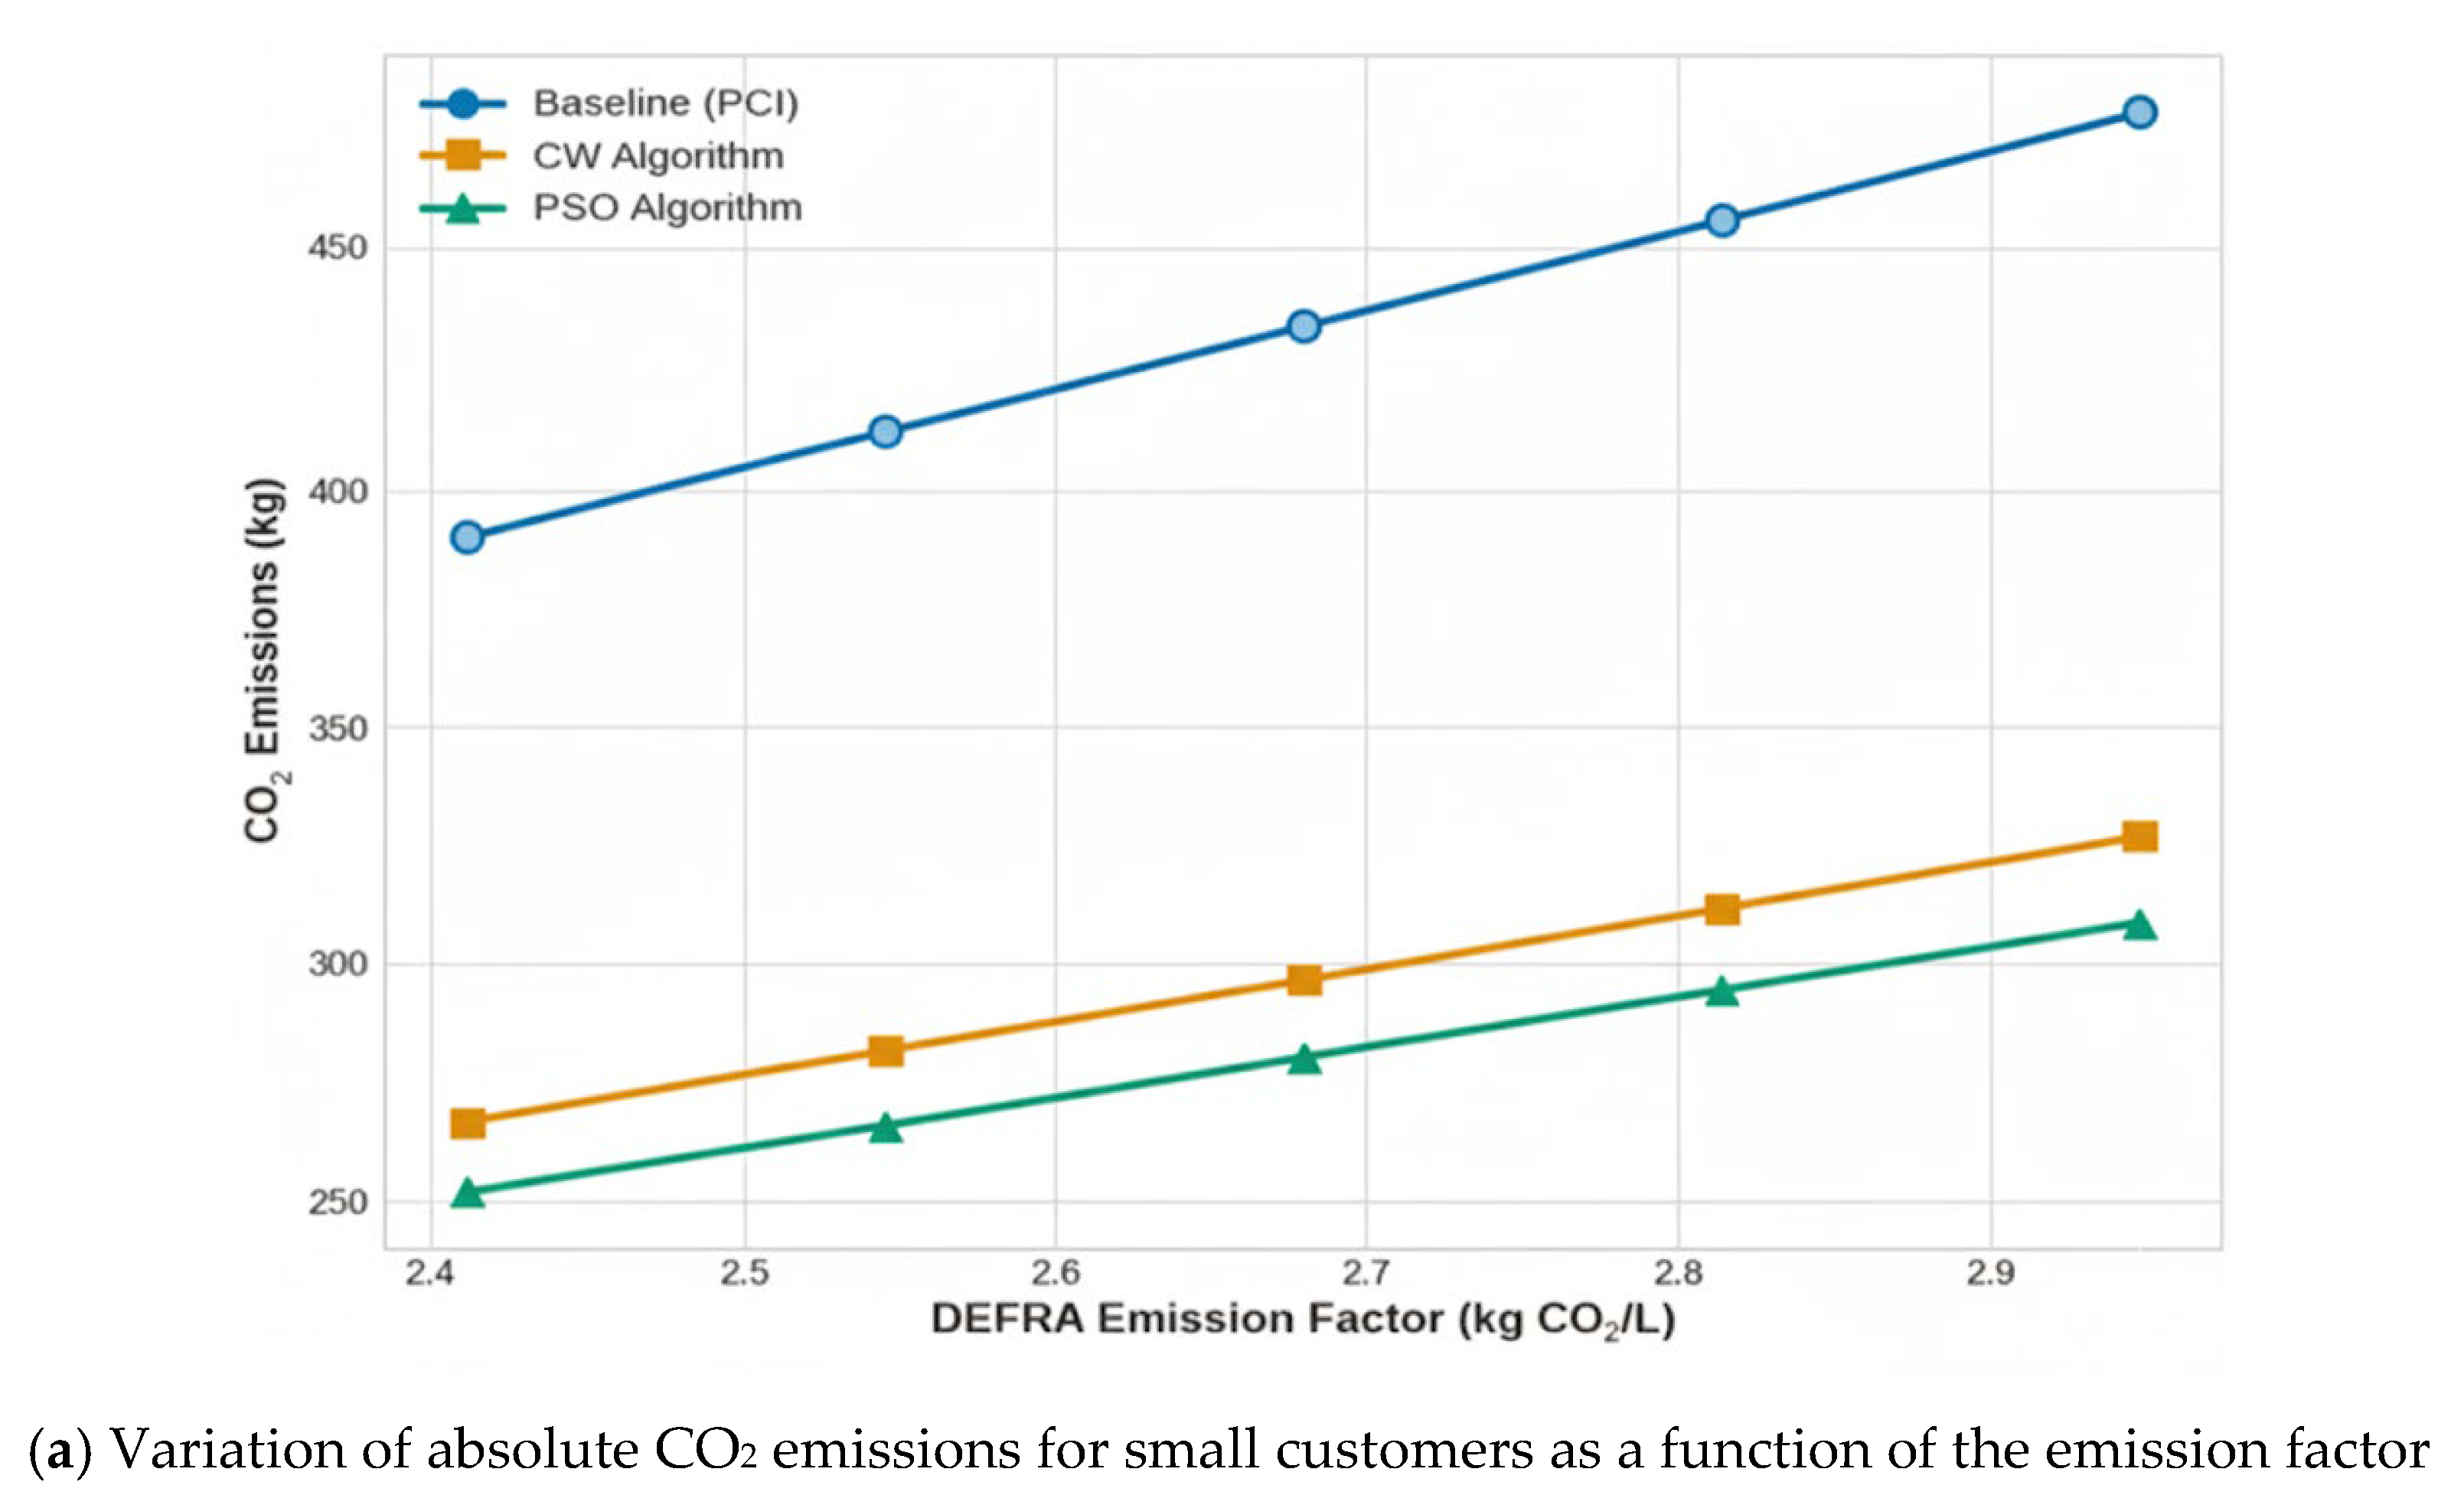
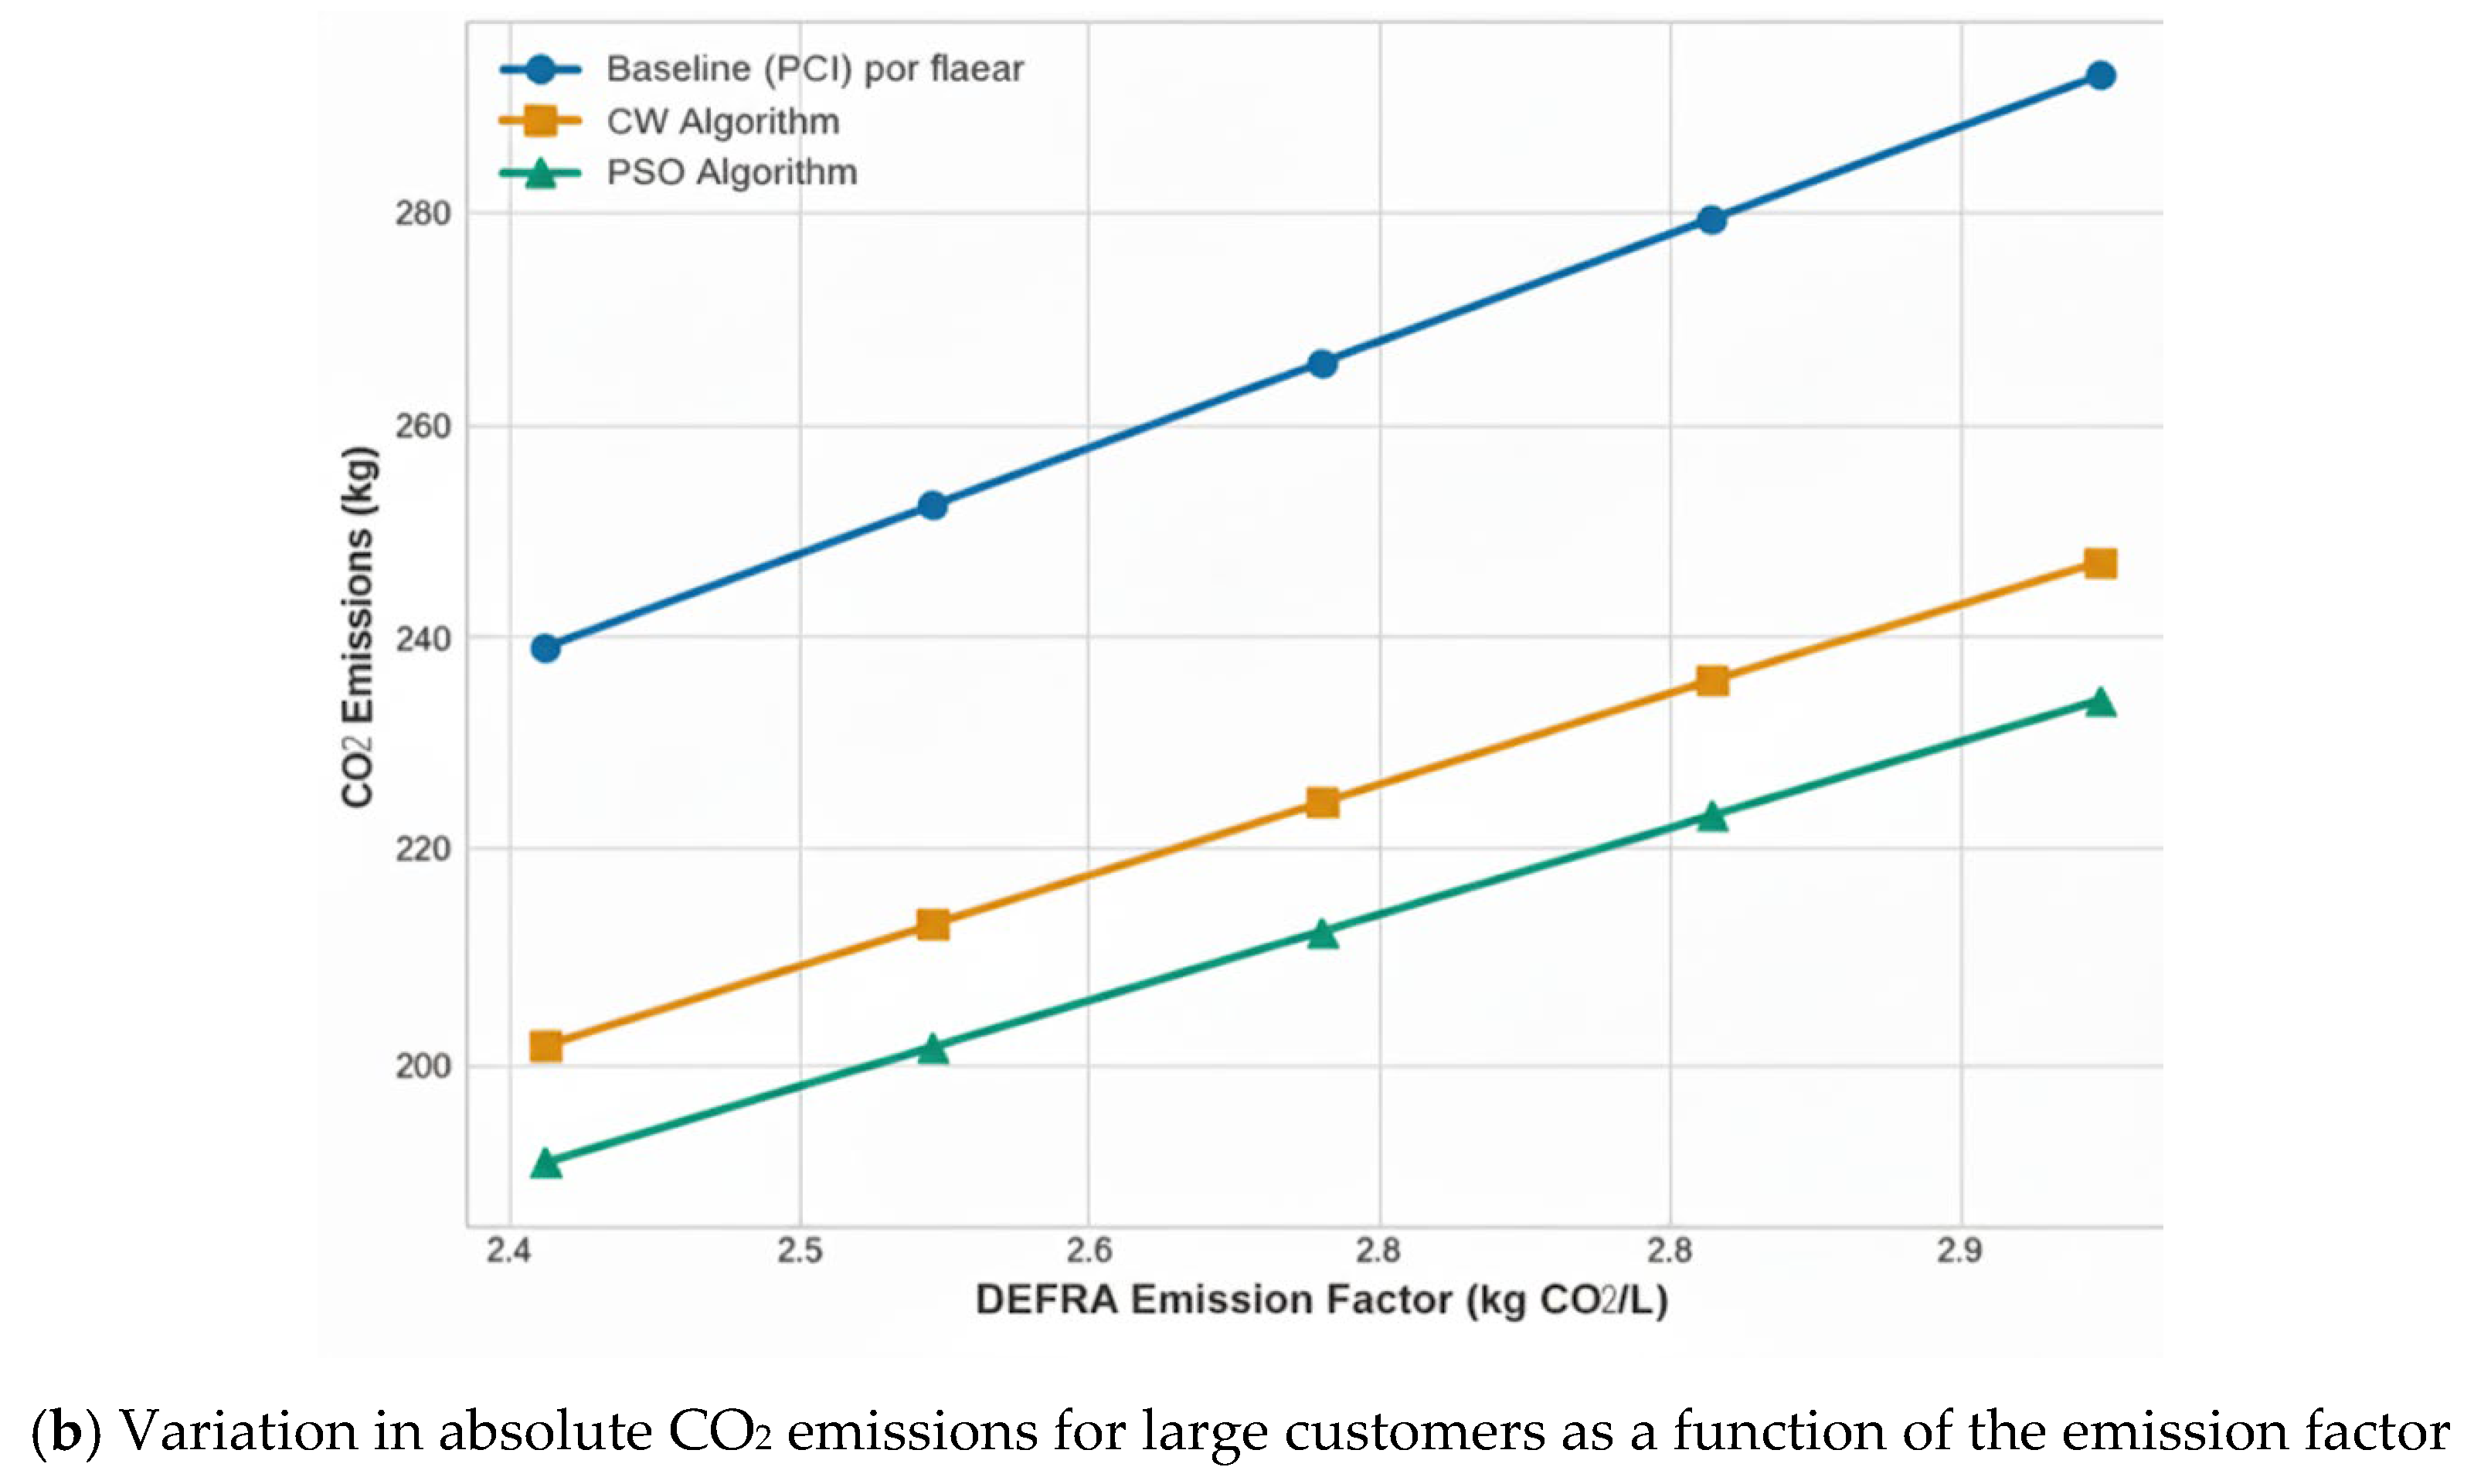
To validate the robustness of the CO2 reduction claims against parameter uncertainties, a sensitivity analysis was performed by varying the DEFRA emission factor within a ±10% range (2.412–2.948 kg CO2/L). The results, summarized in Table 9, show that absolute emission values scale linearly with the factor, as expected (Figure 10a,b). However, the percentage reductions achieved by both algorithms remain constant across the tested range.
As shown in Table 9, for small generators, the average reductions consistently remained at 35.4% for CW and 41.4% for PSO. Large generators’ reductions were stable at 16.6% for CW and 21.8% for PSO.
These results reinforce two key points: (i) the reported environmental benefits are intrinsic to the efficiency of the optimized routes rather than an artifact of the chosen emission factor, and (ii) the conclusions are robust to plausible uncertainties in this parameter. Therefore, the CO2 reduction claims remain valid and are potentially transferable to other operational contexts where different local emission factors may apply.
Finally, it is important to highlight that by integrating economic, environmental, and health objectives, the approach adopted in this study aligns with the principles of green logistics and smart cities, thereby enhancing the strategic value of route optimization in the HCW sector.

5.4. Algorithmic Performance Comparison

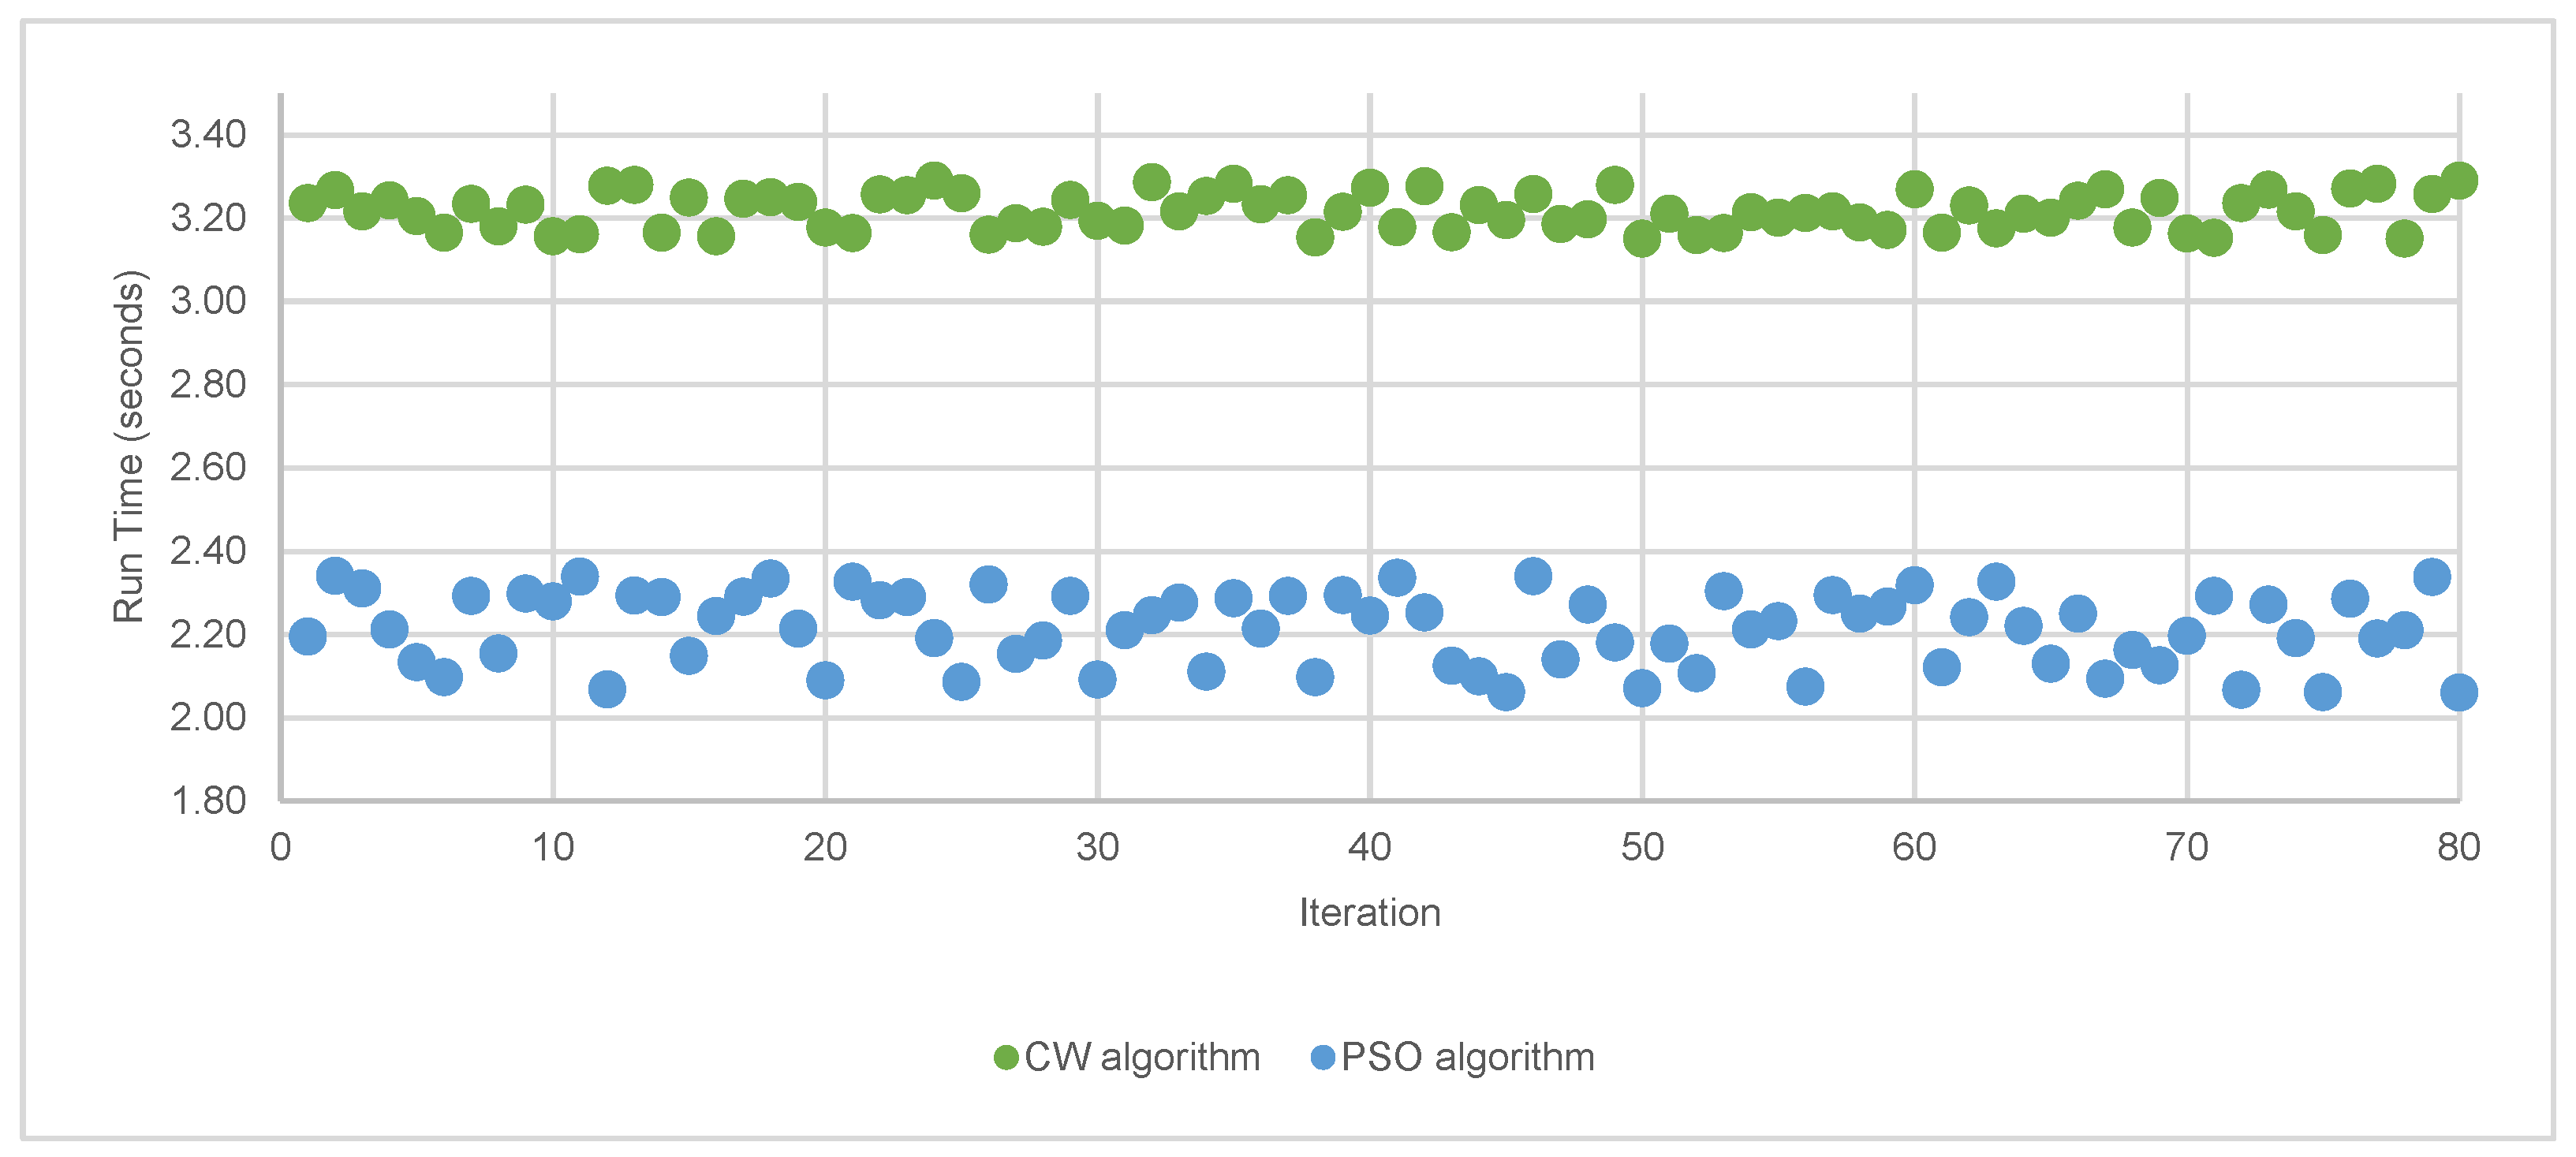
In addition to the quality of the solutions generated, computational performance, particularly processing time, is a critical factor for the adoption of algorithms in real operational contexts, especially in dynamic routing systems that require near-real-time reconfiguration in HCW management. The tests conducted, comprising 20 iterations per week for each customer segment, revealed a significant difference in processing time between PSO and CW.
Figure 10 compares algorithm runtimes. PSO consistently performed faster than CW, with times from 2.21 to 2.35 s. In contrast, CW required 3.15 to 3.29 s. This performance difference, averaging nearly 30%, highlights the computational speed advantage of PSO, which can be attributed to its inherently more efficient search strategy.
This superiority can be attributed to PSO’s ability to explore the solution space more efficiently, avoiding the redundant calculations typical of constructive heuristics such as CW, which require multiple iterations of route fusion and validation. Additionally, PSO exhibits superior scalability, with its performance tending to remain more stable as the number of customers increases, making it particularly suitable for scenarios characterized by high variability or growth in the number of collection points.
PSO’s lower computational latency reinforces its potential for integration into responsive routing systems, such as IoT-based applications, where real-time route adjustments are necessary due to operational events, accidents, or urban congestion.
Beyond computational performance, the application of optimization algorithms directly contributes to the standardization and predictability of collection processes, resulting in increased reliability of logistics operations and a reduced incidence of failures. In sensitive services such as HCW management, these characteristics are essential for maintaining sanitary conditions and ensuring compliance with legal regulations.
In summary, PSO outperformed CW across all metrics: total distance, emissions, and runtime. Its robust global search process makes it well-suited for diverse HCW scenarios, especially when scalability and adaptability are key requirements.
The results of this study demonstrate the consistent superiority of PSO over CW, particularly for small HCW generators. This finding aligns with previous research that has emphasized the effectiveness of metaheuristics in medical waste routing problems. For instance, Ref. [21] reported that solutions obtained with NDPSO deviated by only 1.52% on average from the best-known solutions when combined with a savings-based heuristic and a local search mechanism. Similarly, Ref. [22] showed that metaheuristic-based models can generate more efficient and scientifically sound medical waste collection routes. The algorithm’s performance is optimized when the maximum number of iterations (M) is set to 1800, the maximum number of unchanged consecutive iterations (B) is fixed at 300, and the perturbation frequency (Y) is defined as 10. Other approaches, such as those incorporating distance- or safety-based prioritization [30], have further demonstrated the adaptability of metaheuristics to practical applications across different scales, highlighting the extent to which objective functions grow relative to one another. Notably, the impact of population growth differs between the total and pollution costs.
Furthermore, the proposed model was presented to the local company responsible for hospital waste collection in the case study. The results demonstrated clear improvements over their current fixed-route practices, and the company expressed interest in adopting the model in its planning process, underscoring the practical applicability of the proposed approach.
These studies highlight the effectiveness of metaheuristics such as PSO in managing routing scenarios characterized by high spatial dispersion and heterogeneous demand, which are key features of HCW collection problems. Our application to a real-world HCW PVRP further confirms PSO’s ability to explore the solution space more effectively, minimizing route overlaps and optimizing service consolidation, leading to substantial reductions in travel distance and, consequently, CO2 emissions.
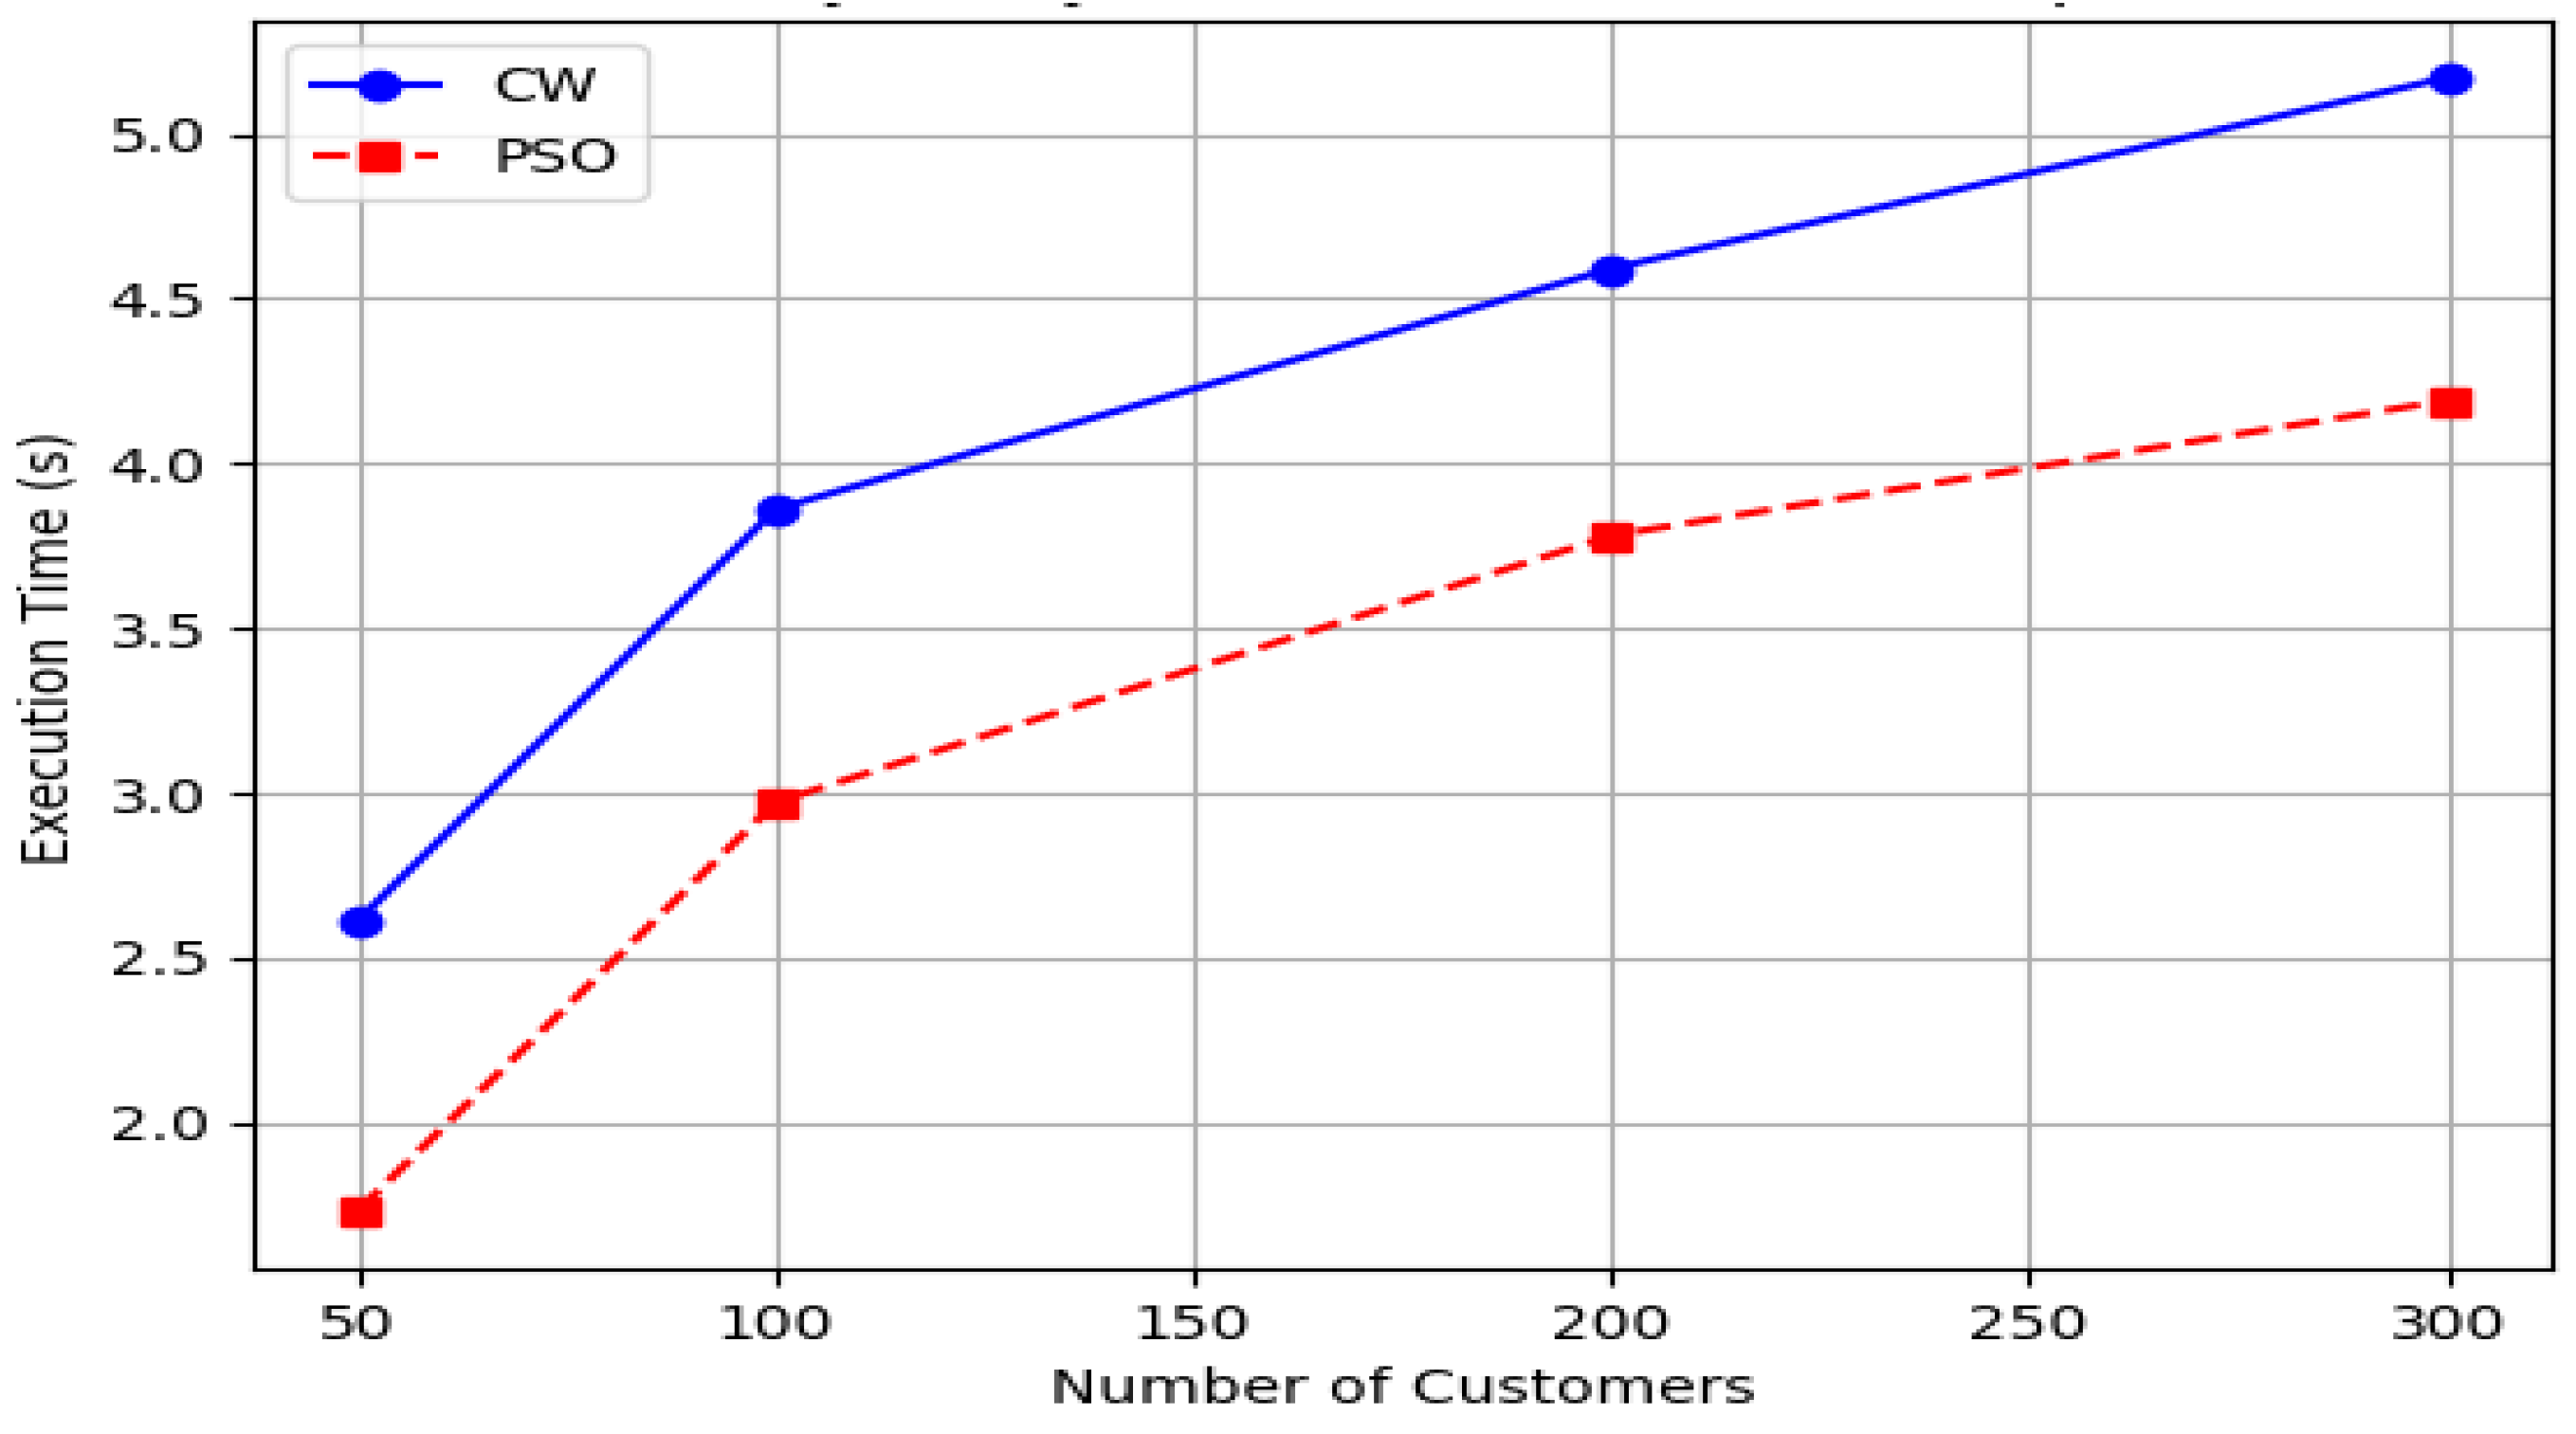
However, additional experiments with randomly generated test instances were conducted to further validate the computational efficiency and scalability of the proposed algorithms, particularly regarding PSO’s performance with larger instances. These instances were designed to simulate the geographical dispersion and demand patterns typical of HCW collection problems, with varying numbers of customers. The algorithms (CW and PSO) were executed on instances ranging from 50 to 300 customers, with all other parameters kept consistent with the base case. The average execution times (in seconds) over 20 runs for each scenario are summarized in Table 10 and visually compared in Figure 11.
As observed, PSO consistently outperforms CW regarding execution time across all problem sizes. The difference is particularly notable in minor instances (e.g., 50 customers), where PSO is approximately 33.72% faster than CW. As the number of customers increases, both algorithms show a gradual rise in execution time, as expected. Nevertheless, PSO maintains a significant advantage, demonstrating better scalability and efficiency, which is especially relevant for dynamic or real-time routing applications where computational speed is critical.
These results reinforce the suitability of PSO for larger-scale HCW collection problems, supporting its integration into responsive logistics systems, such as those enabled by real-time fleet management tools. Figure 12 clearly illustrates the growth trend.
The percentage advantage of PSO is more pronounced in minor instances, possibly due to its initialization overhead being relatively more significant in such problems. In larger instances, both algorithms exhibit similar time complexity; however, PSO maintains a consistent absolute advantage, demonstrating its superior efficiency.

6. Conclusions and Future Work

This study introduced an integrated approach to optimizing HCW collection and transportation by explicitly incorporating generator segmentation based on volume profiles and linking it to differentiated service frequencies. The key methodological contribution demonstrates how established tools can be adapted and combined in practice, resulting in a model validated under real-world operational conditions. By integrating segmentation, a critical yet underexplored dimension in the HCW routing literature, with a systematic comparison of a classical heuristic and a metaheuristic, the study underscores both the applicability and relevance of the proposed framework. Validation using real operational data from a company in Paraná, Brazil, provides a robust proof of concept and offers actionable insights for practitioners and policymakers.
The results confirm that both algorithms apply to the problem, but PSO consistently outperformed CW in all criteria evaluated. For small generators, PSO reduced the distance traveled by up to 41% and CO2 emissions by 41.37%, while CW achieved reductions of 35.42%. For large generators, PSO achieved average reductions of 22% in distance and 21.80% in emissions, compared to 16.56% achieved by CW. In addition, PSO had shorter processing times (2.21–2.35 s), compared to 3.15–3.29 s recorded by CW. The most significant improvements occurred among small generators, whose greater geographical dispersion favored the exploration of more efficient routes by PSO. In summary, PSO demonstrated consistently superior performance, especially in complex and highly dispersed scenarios.
Although the proposed model demonstrates strong potential to reduce travel distances and emissions, its practical implementation faces important challenges. These include high initial costs for software infrastructure, hardware (e.g., GPS tracking, onboard computers), and integration with existing management systems; the need for comprehensive training of drivers and dispatchers to adapt to dynamic algorithm-generated routes and interpret system outputs; and organizational change management to overcome resistance to new technologies and processes. Addressing these barriers related to cost, training, and cultural adoption is essential to realize the benefits of the optimization approach in practice fully.
In addition to its practical contribution, this study provides a methodological advancement by comparing the performance of algorithms in a realistic scenario that incorporates customer segmentation, a dimension largely unexplored in the existing HCW routing literature. Customizing collection frequencies by customer type improved service quality, logistical efficiency, and compliance with health standards. Furthermore, the proposed model is flexible and adaptable to various urban and rural operational environments, as long as accurate data are available (e.g., customer coordinates, waste generation rates, and service capacities) to feed the algorithm. Regarding computational scalability, while the current analysis was performed with a real-world case of 73 customers, the observed algorithmic robustness, evidenced by consistent convergence, low computational times, and firm performance across heterogeneous demand patterns, provides preliminary indications of the model’s adaptability to larger instances. This suggestion is further supported by the established literature on PSO’s application to large-scale vehicle routing problems [21,39]. However, rigorous empirical validation on significantly larger datasets remains an essential direction for future research to determine scalability limits and performance conclusively.
Key limitations of this study involve the generator segmentation based exclusively on daily waste volume, omitting other critical factors like waste type, accessibility, and regulations. The baseline scenario also utilized extrapolated weekly data instead of historical records, a limitation mitigated by validation from company experts. The distance-based savings parameter, however, was statistically confirmed as optimal for the studied segments.
In the environmental analysis, the application of a generic emission factor means that the absolute CO2 values are estimates, as fleet specifics and local traffic patterns are not captured. Nevertheless, the significant percentage reductions are robust for comparison, as the same factor was applied consistently. Lastly, as a single case study in Brazil, the findings cannot be immediately generalized but do offer a relevant foundation for similar urban settings in developing countries.
For future research, we recommend the following:
  • Extending the analysis to different problem sizes, operational configurations (e.g., fleet capacity, regulations), and geographical contexts (other cities/countries) to rigorously validate scalability and improve generalizability.
  • Incorporating additional critical variables into the model and segmentation, such as waste type (infectious, sharps), time windows, health-related priorities, and real-time data from IoT sensors.
  • Conducting broader comparative studies with other advanced metaheuristics (e.g., Genetic Algorithms, Variable Neighborhood Search) and focusing on systematic parameter calibration tailored to the HCW routing problem.
  • Although the 176 kg/day limit was set based on established operational practices, we may investigate alternative limits derived from optimization models, considering different scenarios of fleet capacity, collection frequencies, and waste generation patterns.
  • Although the PSO parameters were initially set based on widely accepted literature recommendations, future research could focus on systematic parameter calibration and sensitivity analysis specifically for the HCW routing problem.
  • Integrating socio-economic indicators and multi-criteria decision-making frameworks to evaluate the holistic sustainability and social impact of routing strategies.
By advancing both algorithmic and operational understanding of HCW logistics, this research contributes to safer, more efficient, and environmentally sustainable urban waste management.

Author Contributions

M.I.C.U.: Conceptualization, Methodology, Investigation, Writing—Original Draft. D.A.R.H.: Data Curation, Investigation, Writing—Review and Editing. V.M.: Validation, Resources, Writing—Review and Editing. C.H.: Resources, Writing—Review and Editing. F.N.P.: Writing—Review and Editing. T.M.O.: Methodology, Writing—Review and Editing. A.C.d.F.: Conceptualization, Writing—Review and Editing. All authors have read and agreed to the published version of the manuscript.

Funding

This work was supported by the Coordenação de Aperfeiçoamento de Pessoal de Nível Superior—Brasil (CAPES)—Finance Code 001, the Conselho Nacional de Desenvolvimento Científico e Tecnológico (CNPq) (Sponsored by CNPq 309491/2023-1), and Fundação Araucária e Secretaria de Estado da Ciência, Tecnologia e Ensino do Paraná/00E1.

Institutional Review Board Statement

Not applicable.

Informed Consent Statement

Not applicable.

Data Availability Statement

The data presented in this study are available on request from the corresponding author.

Conflicts of Interest

The authors declare no conflicts of interest.

Appendix A

Table A1. Quantity of waste collected from big customers (kg).
CustomerWeek 1Week 2Week 3Week 4Total
15004504624891901
25184544704491891
33204973154821614
74373204543201531
85193194453181601
94565253194481748
134874404764911894
273193203183121269
375435394474701999
383183173193171271
Table A2. Quantity of waste collected from small customers (kg).
CustomerWeek 1Week 2Week 3Week 4Total
49399166183541
592122199160573
6112126179211628
10120114232298764
119410012899421
12120113269254756
14999790147433
15117119195274705
16101149214271735
17949917892463
18537310982317
19809815880416
2071100249172592
217996181157513
226597156161479
238299132124437
24132145161251689
255694139160449
26150185348301984
28107131162334734
2988128160145521
30108123176128535
31104125196173598
3275130152128485
336895204128495
347698184154512
357184168178501
36101121181273676
399990111165465
408794139107427
41139185296332952
42107125198282712
4376125162181544
447175161188495
4585147178259669
46102151216299768
47151712953
48205101550
4912159642
5091081340
511177833
521412151051
53106101238
541910141154
551512131151
56109111242
57911121446
58181281149
598105528
6011910333
611110161855
62188111148
631310102053
641216101452
65149101144
66986932
6710159640
681068832
695871131
7084149168220621
7193169307297866
72103128200185616
736182232172547
TOTAL399849157665805324,631

References

  1. Ghannadpour, S.F.; Zandieh, F.; Esmaeili, F. Optimizing triple bottom-line objectives for sustainable health-care waste collection and routing by a self-adaptive evolutionary algorithm: A case study from tehran province in Iran. J. Clean. Prod. 2021, 287, 125010. [Google Scholar] [CrossRef]
  2. Chauhan, A.; Jakhar, S.K.; Chauhan, C. The interplay of circular economy with industry 4.0 enabled smart city drivers of healthcare waste disposal. J. Clean. Prod. 2021, 279, 123854. [Google Scholar] [CrossRef] [PubMed]
  3. Janik-Karpinska, E.; Brancaleoni, R.; Niemcewicz, M.; Wojtas, W.; Foco, M.; Podogrocki, M.; Bijak, M. Healthcare waste—A serious problem for global health. Healthcare 2023, 11, 242. [Google Scholar] [CrossRef] [PubMed]
  4. Taslimi, M.; Batta, R.; Kwon, C. Medical waste collection considering transportation and storage risk. Comput. Oper. Res. 2020, 120, 104966. [Google Scholar] [CrossRef]
  5. Neves, A.C.; Maia, C.C.; de Castro e Silva, M.E.; Vimieiro, G.V.; Gomes Mol, M.P. Analysis of healthcare waste management in hospitals of Belo Horizonte, Brazil. Environ. Sci. Pollut. Res. 2022, 29, 90601–90614. [Google Scholar] [CrossRef]
  6. Zamparas, M.; Kapsalis, V.C.; Kyriakopoulos, G.L.; Aravossis, K.G.; Kanteraki, A.E.; Vantarakis, A.; Kalavrouziotis, I.K. Medical waste management and environmental assessment in the Rio University Hospital, Western Greece. Sustain. Chem. Pharm. 2019, 13, 100163. [Google Scholar] [CrossRef]
  7. Erdem, M. Designing a sustainable logistics network for hazardous medical waste collection a case study in COVID-19 pandemic. J. Clean. Prod. 2022, 376, 134192. [Google Scholar] [CrossRef]
  8. Gao, J.; Li, H.; Wu, J.; Lyu, J.; Tan, Z.; Jin, Z. Routing Optimisation of Urban Medical Waste Recycling Network considering Differentiated Collection Strategy and Time Windows. Sci. Program. 2021, 2021, 5523910. [Google Scholar] [CrossRef]
  9. Rahmanifar, G.; Mohammadi, M.; Sherafat, A.; Hajiaghaei-Keshteli, M.; Fusco, G.; Colombaroni, C. Heuristic approaches to address vehicle routing problem in the Iot-based waste management system. Expert Syst. Appl. 2023, 220, 119708. [Google Scholar] [CrossRef]
  10. Erdem, M. Optimisation of sustainable urban recycling waste collection and routing with heterogeneous electric vehicles. Sustain. Cities Soc. 2022, 80, 103785. [Google Scholar] [CrossRef]
  11. Chen, W.; Zhang, D.; Van Woensel, T.; Xu, G.; Guo, J. Green vehicle routing using mixed fleets for cold chain distribution. Expert Syst. Appl. 2023, 233, 120979. [Google Scholar] [CrossRef]
  12. International Energy Agency, CO2 Emiss. Available online: https://www.iea.org/reports/co2-emissions-in-2023 (accessed on 3 May 2024).
  13. Ben-Romdhane, H.; Ouertani, N.; Krichen, S.; Nouaouri, I. On optimizing healthcare waste routing systems using waste separation policies: A case study. Appl. Soft Comput. 2023, 146, 110615. [Google Scholar] [CrossRef]
  14. Zhang, M.; Cui, W.; Jiang, Q.; Wang, N.; Shang, Y. Vehicle Routing for Infectious Healthcare Waste Collection with Transit Points: A Problem Incorporating Multiple Types of Risks and Two Solution Methods from Different Perspectives. IEEE Access 2025, 13, 83542–83560. [Google Scholar] [CrossRef]
  15. Nikzamir, M.; Baradaran, V. A healthcare logistic network considering stochastic emission of contamination: Bi-objective model and solution algorithm. Transp. Res. Part E Logist. Transp. Rev. 2020, 142, 102060. [Google Scholar] [CrossRef]
  16. Zhang, M.; Cui, W.; Jiang, Q.; Wang, N. Routing Optimization for Healthcare Waste Collection with Temporary Storing Risks and Sequential Uncertain Service Requests. IEEE Access 2024, 12, 2868–2881. [Google Scholar] [CrossRef]
  17. Cárdenas-León, I.; Koeva, M.; Nourian, P.; Davey, C. Urban digital twin-based solution using geospatial information for solid waste management. Sustain. Cities Soc. 2024, 115, 105798. [Google Scholar] [CrossRef]
  18. SDG. United Nations. Department of Economic and Social Affairs Sustainable Development. 2021. Available online: https://sdgs.un.org/goals (accessed on 8 October 2024).
  19. Liu, L.; Liao, W. Optimization and profit distribution in a two-echelon collaborative waste collection routing problem from economic and environmental perspective. Waste Manag. 2021, 120, 400–414. [Google Scholar] [CrossRef]
  20. Akbarpour, N.; Salehi-Amiri, A.; Hajiaghaei-Keshteli, M.; Oliva, D. An innovative waste management system in a smart city under stochastic optimization using vehicle routing problem. Soft Comput. 2021, 25, 6707–6727. [Google Scholar] [CrossRef]
  21. Chen, R.-M.; Shen, Y.-M.; Hong, W.-Z. Neural-like encoding particle swarm optimization for periodic vehicle routing problems. Expert Syst. Appl. 2019, 138, 112833. [Google Scholar] [CrossRef]
  22. Zhang, W.; Zeng, M.; Guo, P.; Wen, K. Variable Neighborhood Search for Multi-Cycle Medical Waste Recycling Vehicle Routing Problem with Time Windows. Int. J. Environ. Res. Public Health 2022, 19, 12887. [Google Scholar] [CrossRef]
  23. Bouya, S.; Balouchi, A.; Rafiemanesh, H.; Amirshahi, M.; Dastres, M.; Moghadam, M.P.; Behnamfar, N.; Shyeback, M.; Badakhsh, M.; Allahyari, J. Global prevalence and device related causes of needle stick injuries among health care workers: A systematic review and meta-analysis. Ann. Glob. Health 2020, 86, 35. [Google Scholar] [CrossRef] [PubMed]
  24. Islam, M.T.; Rafi, M.A.; Hasan, M.J. Knowledge, attitude and practice of health care workers on solid medical waste management in two urban hospitals of Bangladesh: A mixed-method study. J. Health Popul. Nutr. 2025, 44, 34. [Google Scholar] [CrossRef] [PubMed]
  25. Wang, N.; Cui, W.; Zhang, M.; Jiang, Q. Routing optimization for medical waste collection considering infectious risk and multiple disposal centers. Expert Syst. Appl. 2023, 234, 121035. [Google Scholar] [CrossRef]
  26. Shih, L.-H.; Lin, Y.-T. Optimal routing for infectious waste collection. J. Environ. Eng. 1999, 125, 479–484. [Google Scholar] [CrossRef]
  27. Shih, L.-H.; Chang, H.-C. A routing and scheduling system for infectious waste collection. Environ. Model. Assess. 2001, 6, 261–269. [Google Scholar] [CrossRef]
  28. Huang, D.; Gu, Y.; Wang, S.; Liu, Z.; Zhang, W. A two-phase optimization model for the demand-responsive customized bus network design. Transp. Res. Part C Emerg. Technol. 2020, 111, 1–21. [Google Scholar] [CrossRef]
  29. Eren, E.; Rıfat Tuzkaya, U. Safe distance-based vehicle routing problem: Medical waste collection case study in COVID-19 pandemic. Comput. Ind. Eng. 2021, 157, 107328. [Google Scholar] [CrossRef]
  30. Babaee Tirkolaee, E.; Aydin, N.S. A sustainable medical waste collection and transportation model for pandemics. Waste Manag. Res. 2021, 39, 34–44. [Google Scholar] [CrossRef]
  31. Shih, L.-H.; Lin, Y.-T. Multicriteria optimization for infectious medical waste collection system planning. Pract. Period. Hazard. Toxic Radioact. Waste Manag. 2003, 7, 78–85. [Google Scholar] [CrossRef]
  32. Wu, H.; Tao, F.; Qiao, Q.; Zhang, M. A chance-constrained vehicle routing problem for wet waste collection and transportation considering carbon emissions. Int. J. Environ. Res. Public Health 2020, 17, 458. [Google Scholar] [CrossRef]
  33. Xu, X.; Wu, T.; Wang, S.; Zhang, S.; Xu, Z.; Yang, B.; Ding, Z.; Shen, L. Optimization of reliable vehicle routing problem for medical waste collection with time windows in stochastic transportation networks. Eng. Optim. 2025, 57, 2109–2139. [Google Scholar] [CrossRef]
  34. Shen, L.; Xu, X.; Shao, F.; Shao, H.; Ge, Y. A multi-objective optimization model for medical waste recycling network design under uncertainties. Transp. Res. Part E Logist. Transp. Rev. 2024, 184, 103492. [Google Scholar] [CrossRef]
  35. Tang, C.; Wei, Q.; Zhang, D.; Sun, J.; Perboli, G.; Guo, Z.; Li, K. An improved adaptive large neighborhood search algorithm to solve a bi-level medical waste location-routing problem with infection control. Waste Manag. 2025, 197, 1–13. [Google Scholar] [CrossRef] [PubMed]
  36. Shen, X.; Lou, H.; Ge, Z. A two-stage scheduling algorithm for dynamic interval multi-objective vehicle routing problem in medical waste collection. Comput. Ind. Eng. 2025, 2025, 111136. [Google Scholar] [CrossRef]
  37. Sasikumar, P.; Kannan, G.; Haq, A.N. A heuristic based approach to vehicle routing model for Third Party Reverse Logistics provider. Int. J. Serv. Technol. Manag. 2009, 12, 106–125. [Google Scholar] [CrossRef]
  38. Hannan, M.A.; Akhtar, M.; Begum, R.A.; Basri, H.; Hussain, A.; Scavino, E. Capacitated vehicle-routing problem model for scheduled solid waste collection and route optimization using PSO algorithm. Waste Manag. 2018, 71, 31–41. [Google Scholar] [CrossRef]
  39. Pisinger, D.; Ropke, S. A general heuristic for vehicle routing problems. Comput. Oper. Res. 2007, 34, 2403–2435. [Google Scholar] [CrossRef]
  40. Seyyedhasani, H.; Dvorak, J.S. Using the Vehicle Routing Problem to reduce field completion times with multiple machines. Comput. Electron. Agric. 2017, 134, 142–150. [Google Scholar] [CrossRef]
  41. Cengiz Toklu, M. A fuzzy multi-criteria approach based on Clarke and Wright savings algorithm for vehicle routing problem in humanitarian aid distribution. J. Intell. Manuf. 2023, 34, 2241–2261. [Google Scholar] [CrossRef]
  42. GHG Emissions Calculation Tool. Available online: https://eaesp.fgv.br/centros/centro-estudos-sustentabilidade/projetos/programa-brasileiro-ghg-protocol (accessed on 12 September 2024).
  43. Defra. Department for Environment, Food & Rural Affairs. Nature Recovery Network; 2020. Available online: https://www.gov.uk/government/publications/nature-recovery-network/nature-recovery-network (accessed on 17 March 2024).
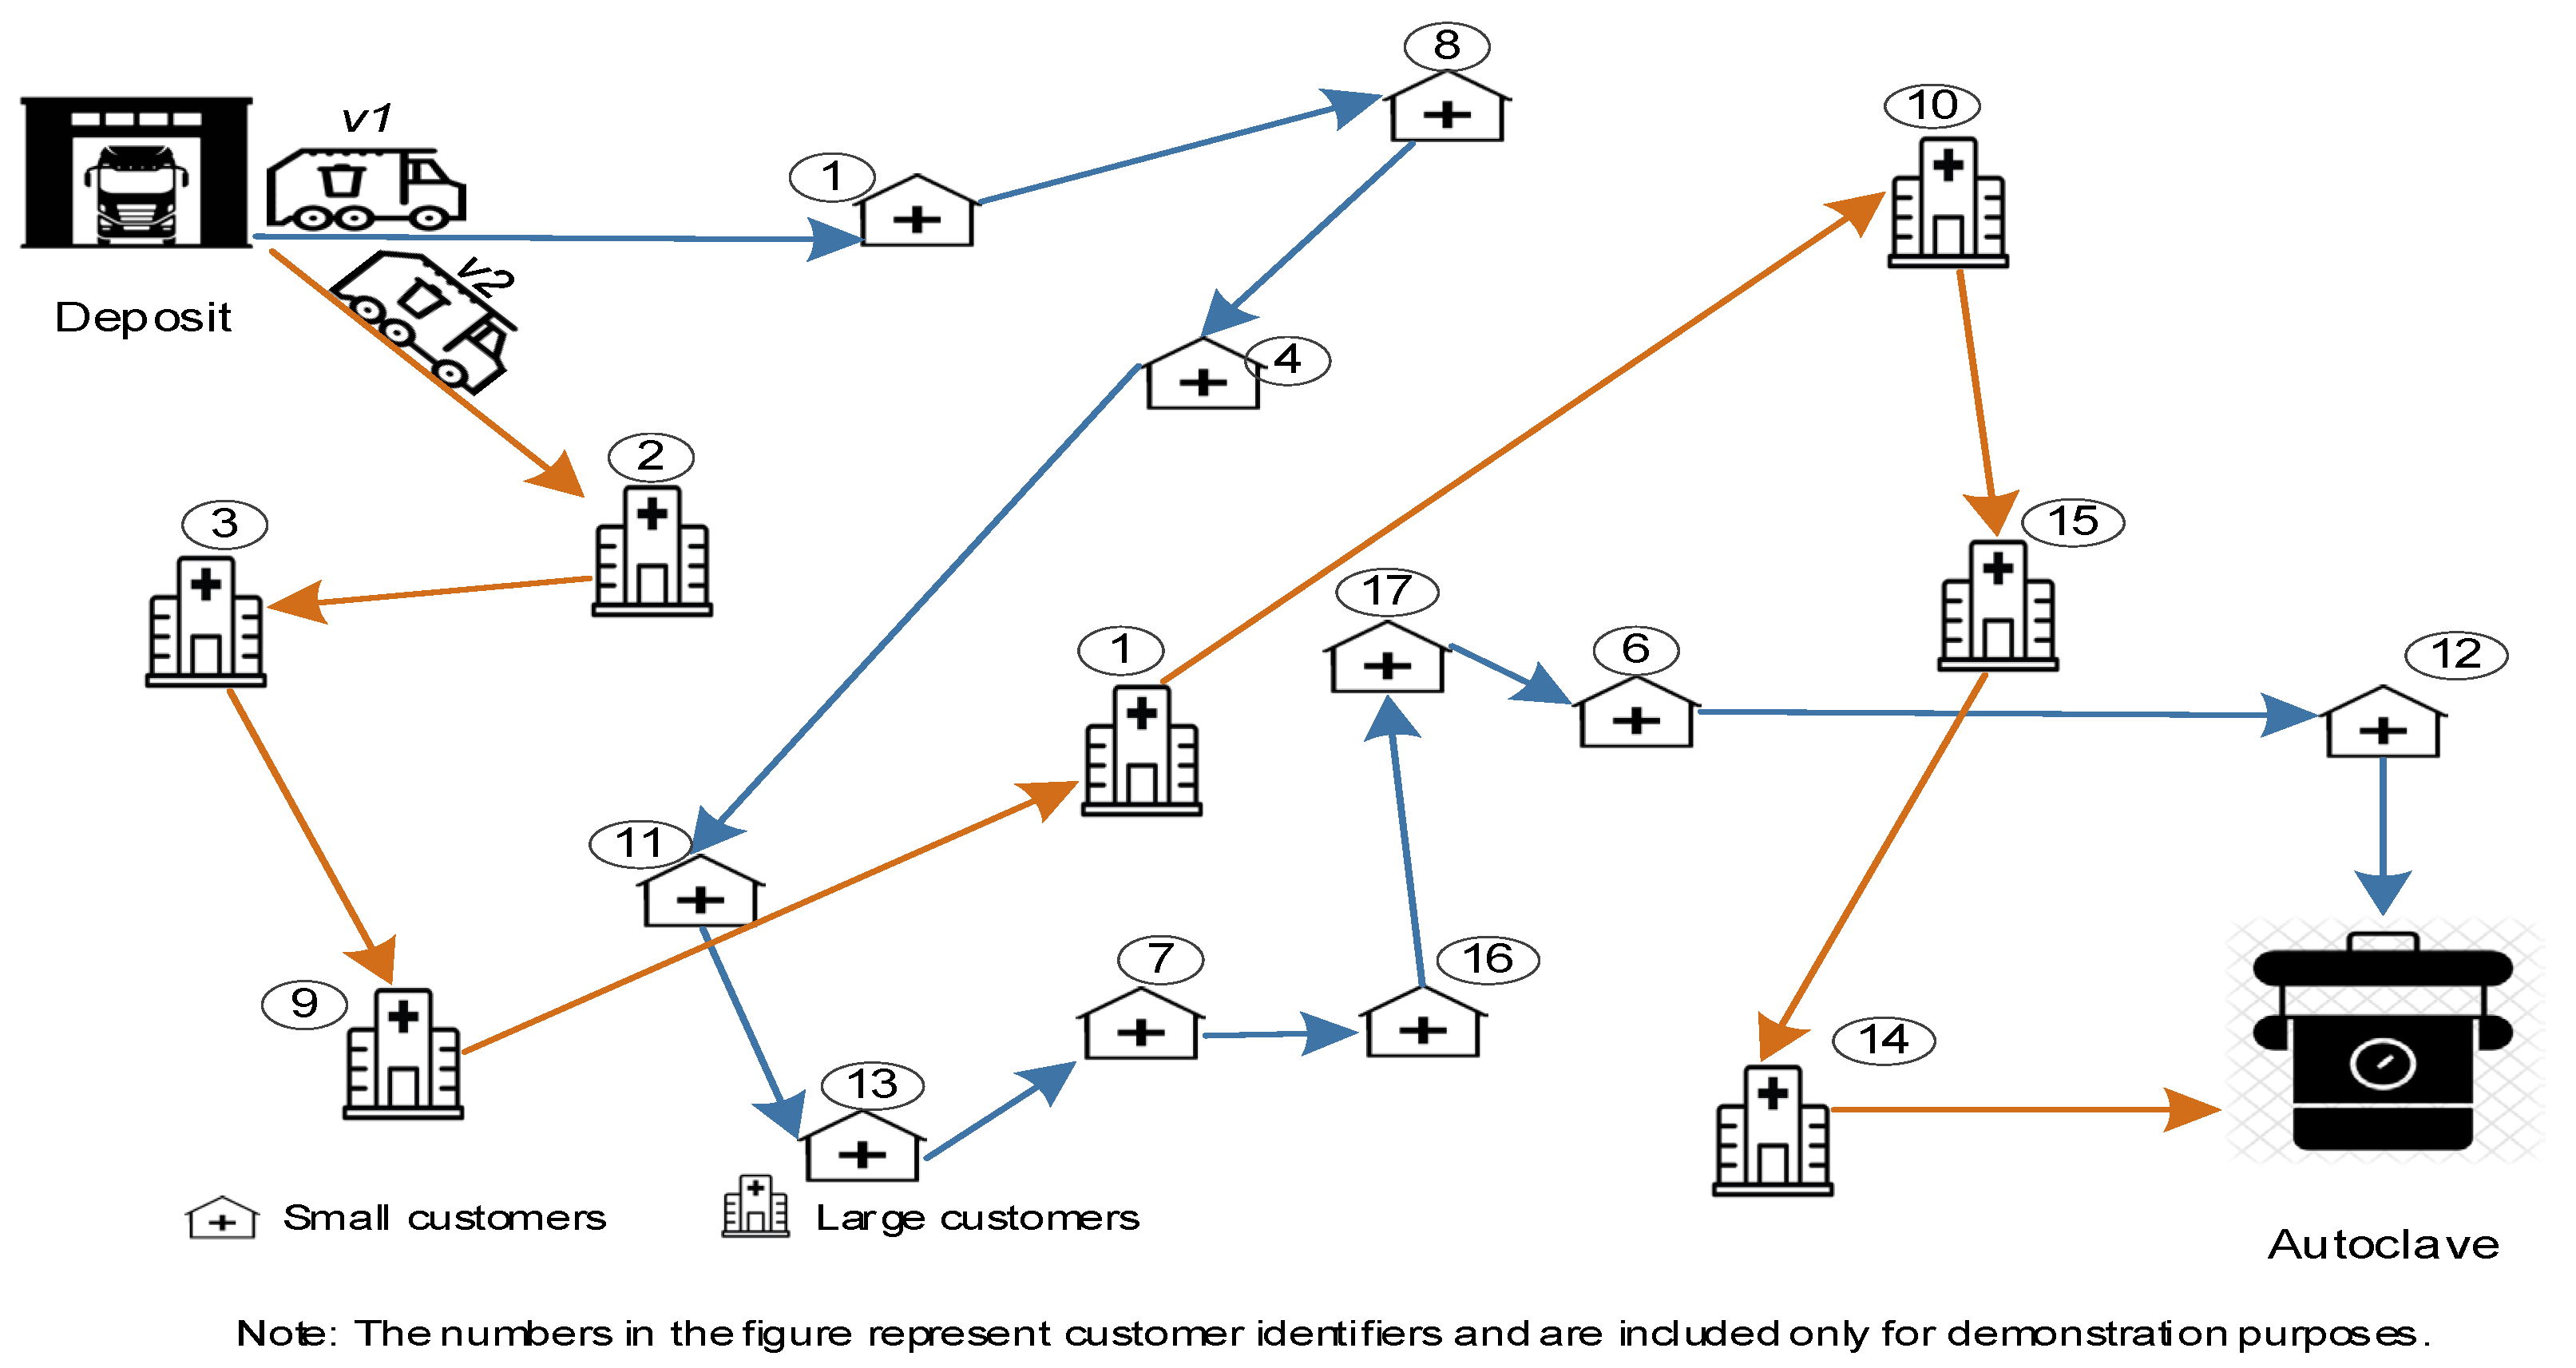
Figure 1. HCW process for different customer types.
Sustainability 17 08536 g001
Figure 2. Collection points in Paraná, Brazil.
Sustainability 17 08536 g002
Figure 3. CW routes per week—small customers.
Sustainability 17 08536 g003aSustainability 17 08536 g003b
Figure 4. PSO routes per week—small customers.
Sustainability 17 08536 g004
Figure 5. Weekly distance summary—small customers.
Sustainability 17 08536 g005
Figure 6. CW Routes per week—large customers.
Sustainability 17 08536 g006
Figure 7. PSO Routes per week—large customers.
Sustainability 17 08536 g007
Figure 8. Weekly distance summary—large customers.
Sustainability 17 08536 g008
Figure 9. CO2 emissions by segment.
Sustainability 17 08536 g009
Figure 10. Sensitivity analysis of the DEFRA emission factor: absolute CO2 emissions for (a) small and (b) large customers.
Sustainability 17 08536 g010aSustainability 17 08536 g010b
Figure 11. Algorithm execution time comparison.
Sustainability 17 08536 g011
Figure 12. Execution time growth of CW and PSO algorithms for an increasing number of customers.
Sustainability 17 08536 g012
Table 1. PSO parameter settings.
ParameterSymbolValueJustification
Population size (particles) η 20Standard size for medium-scale routing problem [21]
Inertia weight w 0.5Balances global and local search [8]
Cognitive coefficient c 1 0.5Encourages self-exploration
Social coefficient c 2 0.5Encourages convergence via swarm best
Max iterations T 10Empirically defined to ensure convergence without excessive runtime
Velocity bounds V m i n ,   V m a x [−1, 1]Prevents overshooting feasible space
Table 2. Customer types and collection frequencies.
Customer TypeNumber of CustomersPlanning Period
(Days)
Maximum Fleet (u/Day)Daily Demand
(kg)
Visit Frequency
Small6351≤1001
101 to 1352
136 to 1753
Large1051176 to 3253
326 to 5505
Table 3. Parameter configuration for experiments.
Item DescriptionInformation
Small customer (number)63
Large customer (number)10
Depot (number)1
Autoclave (number)1
Vehicles (number)2
Small vehicle capacity (kg)1000
Large vehicle capacity (kg)1500
Table 4. Weekly distance comparison—small customers.
WeekTotal Distances Traveled (km)Difference in Distances
CW AlgorithmPSO Algorithmkm%
1445.21421.0024.215%
2412.96358.9853.9813%
3414.00368.9945.0111%
4412.10380.0532.058%
Table 5. Mann–Whitney test results for weekly performance of CW and PSO—small customers.
WeekCW (Mean ± SD)PSO (Mean ± SD)p-Value (Mann–Whitney–Wilcoxon Test)
W1445.21 ± 2.54421.00 ± 2.371.45 × 10−11
W2412.96 ± 2.38358.98 ± 3.231.45 × 10−11
W3414.00 ± 3.34368.99 ± 3.261.45 × 10−11
W4412.10 ± 2.75380.05 ± 3.061.45 × 10−11
Table 6. Weekly distance comparison—large customers.
WeekTotal Distances Traveled (km)Difference in Distances
CW AlgorithmPSO Algorithmkm%
1305.43289.1616.275%
2299.16278.2020.967%
3292.91275.0017.916%
4298.23278.2020.037%
Table 7. Mann–Whitney test results for weekly performance of CW and PSO—large customers.
WeekCW (Mean ± SD)PSO (Mean ± SD)p-Value (Mann–Whitney–Wilcoxon Test)
W1305.43 ± 2.11289.16 ± 2.521.45 × 10−11
W2299.16 ± 3.35278.20 ± 3.051.45 × 10−11
W3292.91 ± 3.41275.00 ± 2.851.45 × 10−11
W4298.23 ± 3.23278.20 ± 2.551.45 × 10−11
Table 8. Operational parameters of vehicles considered in CO2 emissions calculations.
Vehicle TypeTrips/MonthQuantity (T/Day)Operational DaysFuel Cost (R$/month)
Volkswagen Delivery (Volkswagen AG, Wolfsburg, Germany)3001.551169.89
Hyundai HR (Hyundai Motor Company, Seoul, South Korea)6531.051315.47
Table 9. Percentage CO2 reduction for different DEFRA emission factor values.
DEFRA Factor (kg CO2/L)Baseline–SmallCW–SmallPSO–SmallBaseline–LargeCW–LargePSO–Large
2.412 (–10%)398.9271.2250.11025.6855.9801.4
2.680 (Base)442.9301.2277.81138.5949.9888.3
2.948 (+10%)486.9331.3305.51251.31043.9975.2
Table 10. Comparative average execution times (in seconds) of CW and PSO algorithms across different problem sizes.
Number of CustomersCW Time (s)PSO Time (s)Percentage Difference (%)
502.611.7333.72
1003.862.9723.06
2004.593.7817.65
3005.174.1918.96
Disclaimer/Publisher’s Note: The statements, opinions and data contained in all publications are solely those of the individual author(s) and contributor(s) and not of MDPI and/or the editor(s). MDPI and/or the editor(s) disclaim responsibility for any injury to people or property resulting from any ideas, methods, instructions or products referred to in the content.