Article

Spatial Assessment of Ecotourism Development Suitability Incorporating Carrying Capacity in the Yellow River Estuary National Park

1
College of Oceanic and Atmospheric Sciences, Ocean University of China, Qingdao 266100, China
2
Observation and Research Station of Bohai Strait Eco-Corridor, Ministry of Natural Resources, Qingdao 266061, China
3
Qingdao Municipal Landscape Gardens and Forestry Bureau, Qingdao 266075, China
4
First Institute of Oceanography, Ministry of Natural Resources, Qingdao 266061, China
5
Institute of Marine Development, Ocean University of China, Qingdao 266100, China
*
Authors to whom correspondence should be addressed.
Sustainability 2025, 17(18), 8449; https://doi.org/10.3390/su17188449
Submission received: 24 August 2025 / Revised: 15 September 2025 / Accepted: 18 September 2025 / Published: 20 September 2025

Abstract

Ecotourism is vital for harmonious human–nature coexistence in national parks, making the quantification of its spatial suitability an urgent scientific priority. This study took the Yellow River Estuary National Park (YRENP) as the study area and constructed a multi-criteria evaluation model by interpreting the relationship between Ecotourism Environmental Carrying Capacity (EECC) and Ecotourism Development Suitability (EDS), addressing the critical gap in the integrated land–sea ecotourism suitability assessment for coastal national parks, using the Analytic Hierarchy Process (AHP) to determine indicator weights and ArcGIS for spatial visualization. Multi-source geospatial data, including land use, NDVI, DEM, and socio-economic datasets, were integrated. The results revealed the following: (1) Overall moderate EECC levels with stronger terrestrial capacity contrast with weaker marine capacity—high-carrying zones being limited to nearshore areas; (2) The overall EDS level was favorable, where southern section significantly outperformed northern zones, forming concentrated high-suitability clusters encircling lower-suitability areas; (3) Marine EDS slightly exceeds terrestrial suitability, with optimal coastal zones transitioning landward toward progressively higher suitability. This research provided a replicable methodology for ecotourism suitability assessment in coastal protected areas and supported sustainable spatial planning in land–sea integrated national parks.

1. Introduction

National parks serve as vital platforms for biodiversity conservation, human well-being enhancement, and sustainable development promotion [1,2]. The International Union for Conservation of Nature (IUCN) defined national parks as large-scale natural reserves that protect ecological processes, species diversity, and ecosystem services while supporting environmental education, scientific research, and ecotourism [3,4]. The Yellow River Estuary National Park (YRENP) in China interprets this concept through its unique geomorphic feature, where terrestrial and marine ecosystems converge to form dynamic wetlands that sustain endangered bird species and deltaic landscapes, making it an ideal study area for accommodating conservation and ecotourism.
Ecotourism is fundamentally characterized by nature-based experiences that prioritize ecological integrity, minimal environmental footprint, and human–nature symbiosis [5,6,7,8]. However, it faces multiple challenges in protected areas, including polarized management (overdevelopment vs. complete closure), unregulated tourist densities, unclear zoning, and coastal ecosystem degradation, which limit park sustainability [9,10]. These challenges underscore the critical need for spatial methodologies to delineate ecotourism suitability zones and quantify permissible activity thresholds within sensitive landscapes like YRENP.
The Ecotourism Environmental Carrying Capacity (EECC) was introduced to address these challenges. The EECC played a significant role in ecotourism management [11,12,13,14]. Its concept has evolved from “utilization intensity/visitor numbers” to “management models” and then to “ecological environment,” reflecting consensus on its dependence on environmental use intensity, which defines the maximum development level preserving visitor experiences [15,16,17]. The evaluation indicators systematically integrated three key dimensions: ecological environment (environmental quality, water quality, and ecological resilience), socio-economic conditions (transportation infrastructure and GDP), and tourism resource characteristics (tourism infrastructure and service quality) [14,18,19,20]. While scholars have made significant progress in ensuring methodological rationality and accuracy [21,22,23,24], challenges still remain. The lack of clearly defined management objectives often introduces subjectivity into model construction. This may potentially result in an oversimplified focus on tourism’s environmental demand at the expense of comprehensive system evaluation [25]. To optimize the EECC model applications, three critical aspects should be considered: (1) thorough incorporation of regional geographical and cultural features; (2) precise assessment of ecological tourism resource supply capacity and its inherent variability; and (3) the inter-relationship between ecotourism activities and ecological environment. Future research should particularly emphasize investigating the spatial configuration and determining factors of carrying capacity within specific regional contexts to advance both theoretical understanding and practical implementation.
While EECC effectively measures tourism activity intensity, it fails to identify optimal areas for ecotourism development. This limitation strengthens the significance of Ecotourism Development Suitability (EDS) assessment in addressing this spatial-planning challenge. The EDS assessment was derived from land-use evaluation, which systematically analyzes social, economic, and natural environmental factors to determine appropriate development strategies [26]. As a specialized application, EDS provides theoretical foundations for customized tourism planning and sustainable resource utilization that ultimately promotes balanced regional tourism growth. The methodological evolution of EDS assessment has progressed from qualitative to quantitative approaches. Among them, nonlinear, fuzzy, and SWOT methods enable tourism suitability evaluation by quantifying factor relationships, transforming qualitative constraints, and simplifying decision-making despite inherent subjectivity [27,28,29]. Contemporary technological advancements have revolutionized EDS spatial assessment through GIS integration. The multi-factor spatial overlay analysis of GIS can merge various data to generate new data layers, making the results integrate the attributes of all layers. It not only generates new spatial relationships but also combines the attributes of multiple data layers to produce new attribute relationships [30,31,32]. Given ecotourism’s inherent geographical phenomenon [33], GIS proves particularly valuable for visualizing spatial patterns and characteristics in EDS research. Additionally, it provides technical support for spatially explicit suitability evaluations.
While substantial progress has been made in EECC and EDS research, the linkages between these two frameworks continue to stimulate vigorous debate in spatial planning. Within the context of national park ecotourism, fundamental uncertainties persist regarding the spatial relationship between carrying capacity and suitability assessments. Unresolved questions include the following: whether to implement a sequential assessment approach (first evaluating EECC park-wide, then assessing EDS in high-capacity zones) or a parallel assessment strategy (conducting both evaluations simultaneously before integration). There is no definite conclusion on the choice between these two approaches. In addition, the transmissibility and applicability of the EECC/EDS assessment at different spatial scales remain questionable. EECC fundamentally embodies a constraint-oriented paradigm for ecological conservation, while EDS adopts a development-focused approach for sustainable growth. However, the current literature lacks the theoretical support for the connection of the core essences of the two [34,35]. Moreover, existing research demonstrated notable gaps: most EECC/EDS case studies concentrated on historical districts, scenic spots, and mountain areas, while largely neglecting national park contexts. In addition, the geographical focus has also been mostly land-based, with minimal attention to coastal zones. As an advanced socioeconomic development and high tourism demand region, the coastal zone is an ideal place for developing eco-tourism activities. Meanwhile, the national parks, which represent the prioritized protection area of the country, are also suitable for such activities. Therefore, advancing integrated EECC–EDS assessment methodologies for land–sea integrated national parks carries substantial theoretical significance and practical value.
This research selected the YRENP as the study area and adopted a land–sea integrated approach to develop an EECC evaluation framework comprising three key dimensions: ecological environment, tourism resources, and socio-economic factors. Building upon this foundation, the study incorporated additional critical elements, including natural endowments, biodiversity conservation significance, and natural hazard risks, to construct a comprehensive EDS assessment system. Utilizing GIS methods, the study visualized the results of both the EECC and the EDS assessments and analyzed their spatial patterns. The aim was to facilitate sustainable development and promote harmonious human–nature coexistence within the national park.
Following this introduction, the paper proceeds by first detailing the study area and the diverse datasets employed. The Materials and Methods section explains the EECC-EDS integration framework and evaluation index system construction. The results of the spatial assessments for both EECC and EDS are then presented and analyzed. The discussion interprets these findings, explores their implications for land–sea integrated management, and places the study’s contributions within the broader literature. The paper concludes by summarizing the key findings and outlining pathways for future research.

2. Materials and Methods

2.1. Study Area

The YRENP is one of only two land–sea integrated national parks in China. It is located at the Yellow River Estuary in Dongying City, Shandong Province. The park borders the Bohai Bay to the north, is adjacent to the Laizhou Bay to the east, and faces the Liaodong Peninsula across the sea. The geographical coordinates range from 118°13′55.28″ E to 119°30′57.00″ E longitude and 37°25′02.67″ N to 38°17′53.47″ N latitude (Figure 1). The national park comprises two sectors (northern and southern) spanning a total area of 3611.21 km2, with terrestrial areas covering 934.91 km2 (25.89%) and marine areas occupying 2676.30 km2 (74.11%). The Yellow River exerts the greatest impact within the YRENP and serves as the dominant factor shaping its distinctive ecosystems. Characterized by a warm, temperate, and semi-humid continental monsoon climate, the region exhibits distinct seasons with clearly demarcated shifts in temperature and humidity.
The YRENP possesses exceptional ecotourism value. It sustains the world’s most intact, representative, and geologically youngest coastal wetland ecosystem within the warm temperate zone. This area acts as both a vital genetic reservoir and evolutionary nucleus for marine biodiversity in the Yellow-Bohai Sea region. Additionally, it is a key stopover for migratory birds along two major routes: the Circum-Pacific and East Asian-Australasian flyways.

2.2. Dataset

The spatial boundary and the coastline of the YRENP utilized in this study were derived from the Master Plan for Yellow River Estuary National Park (2021–2035). The official map published in the plan was exported and imported into ArcGIS 10.7 software, with the corresponding data generated through visual interpretation and georeferencing procedures. The datasets utilized in this study were collected between 2020 and 2022. The data sources and specifications utilized in this study are summarized in Table A1 in Appendix A.

2.3. Methodology

2.3.1. Theoretical Framework

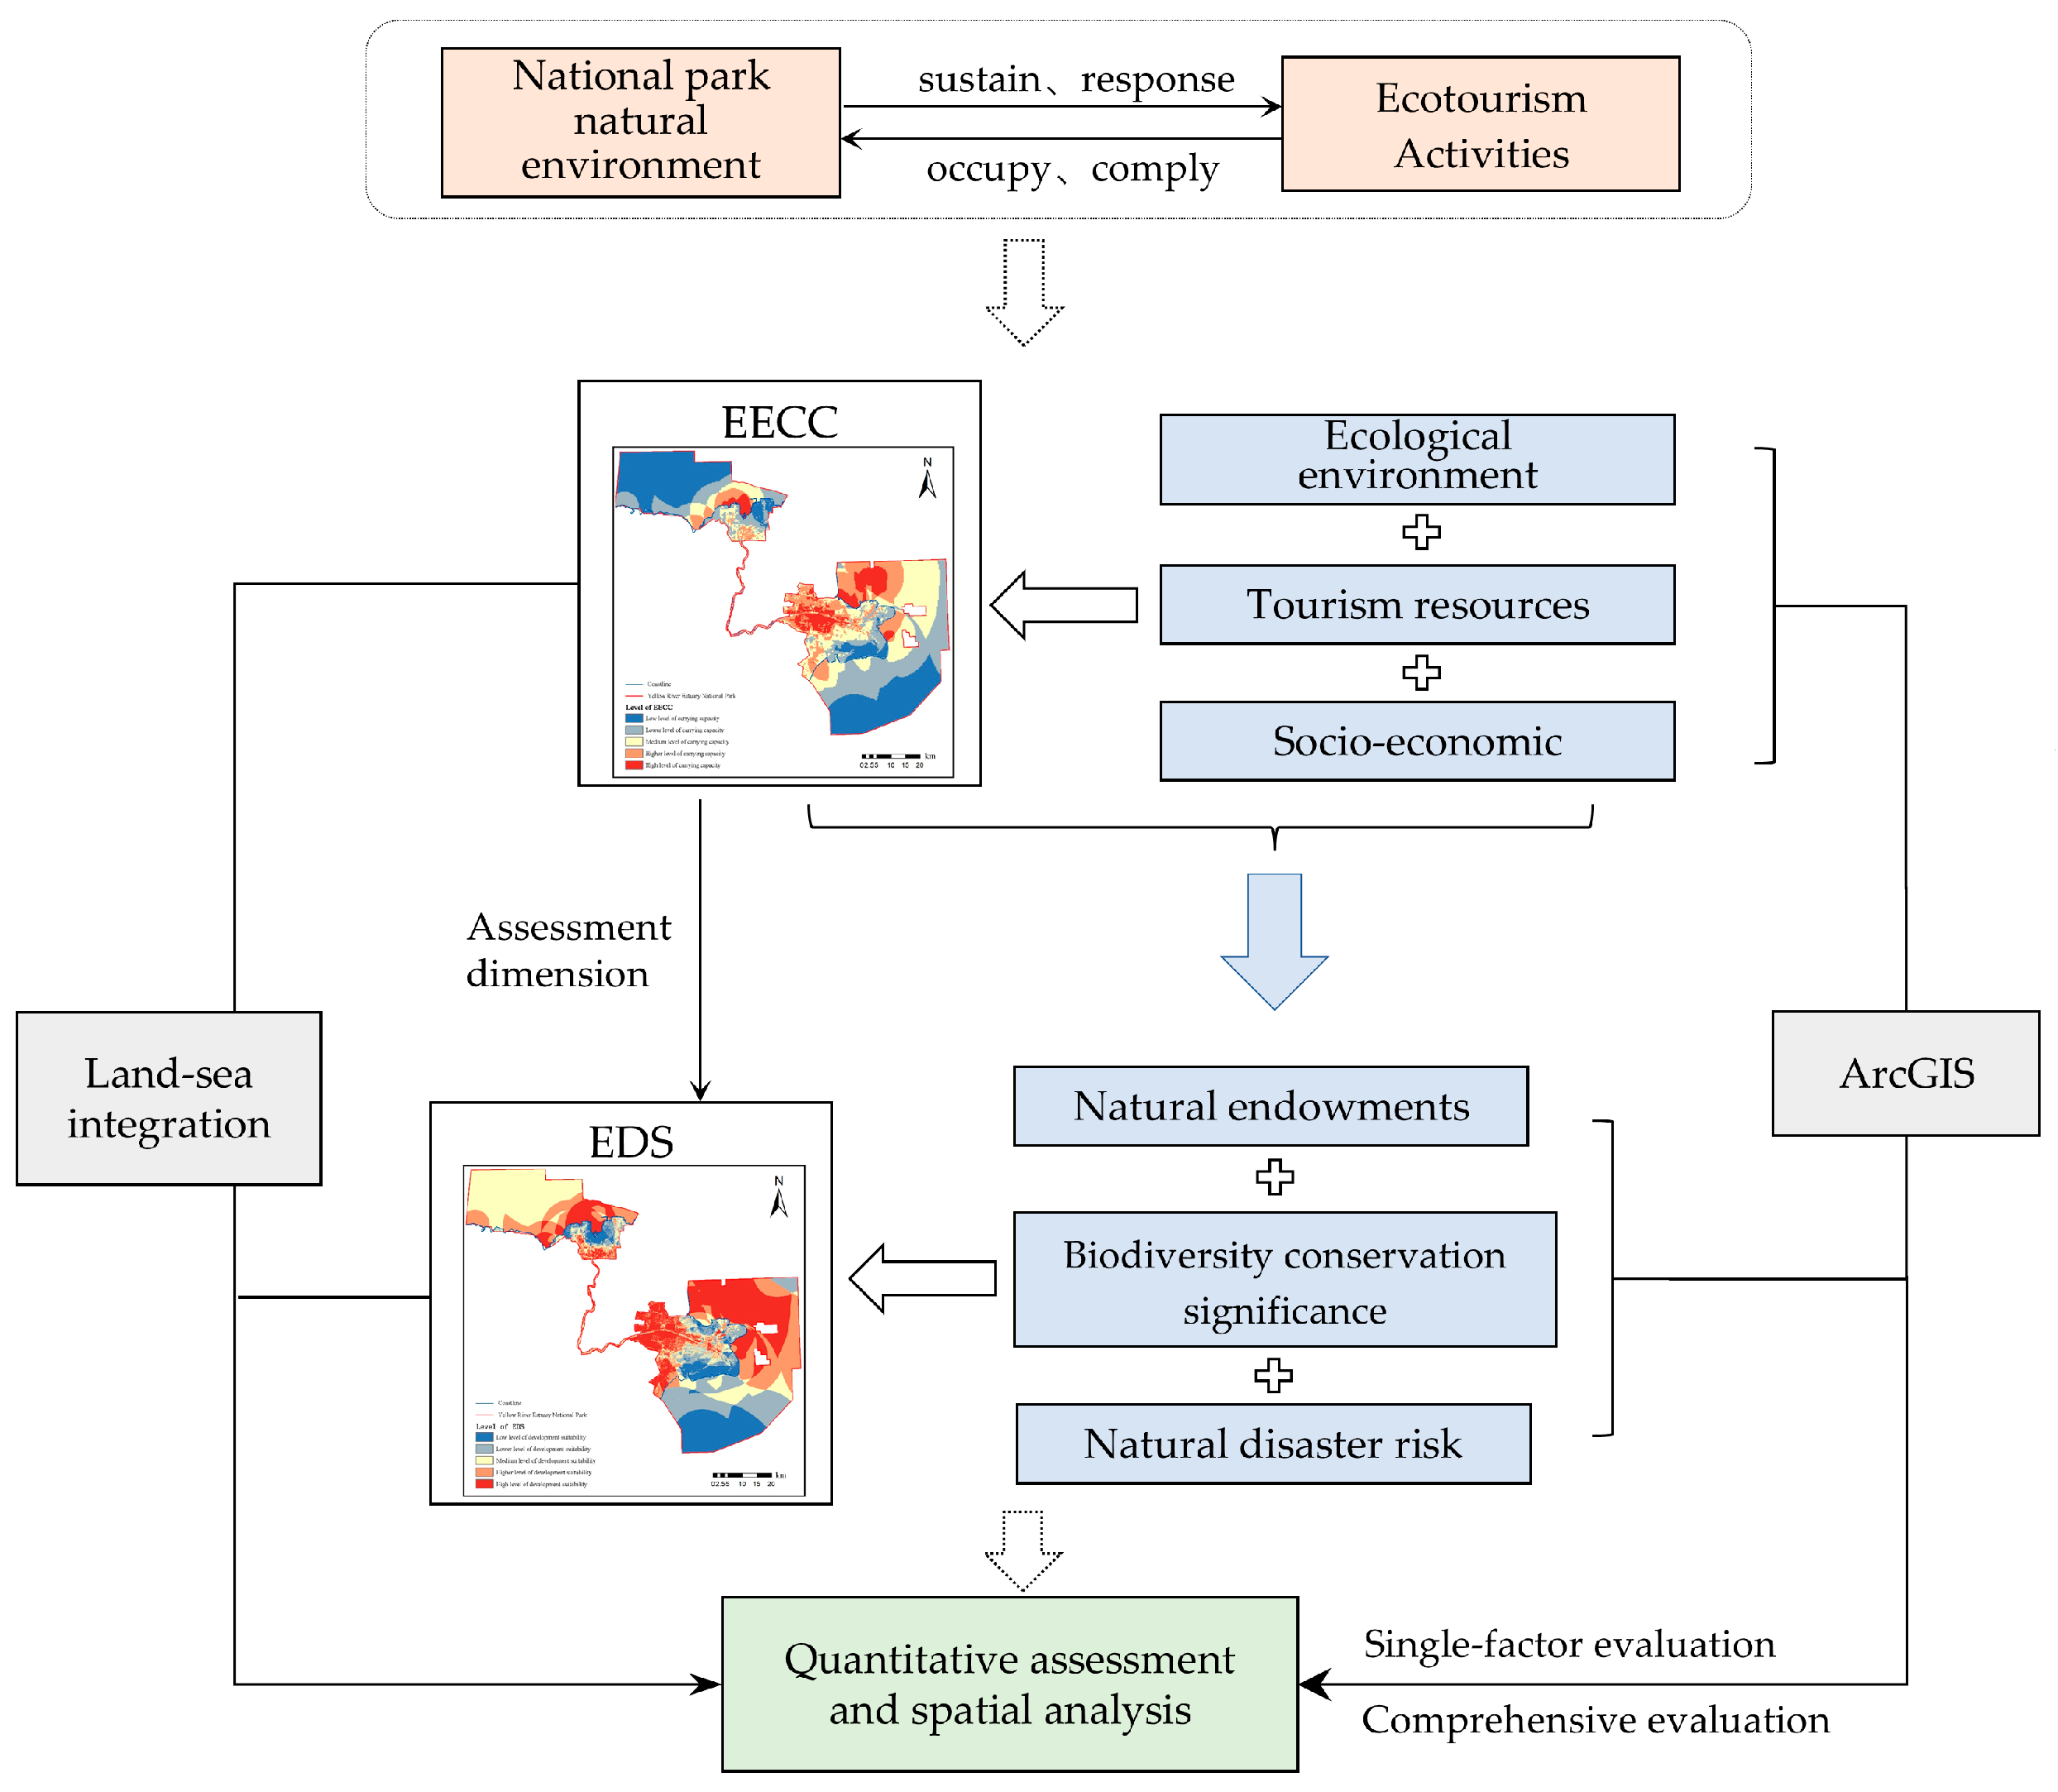
To scientifically determine the EECC and EDS of the YRENP, we have constructed an interdisciplinary methodology with standardized evaluation criteria (Figure 2). The intrinsic linkage between carrying capacity and suitability constitutes a core research focus. Any geographic unit has multifunctional attributes. For national parks, natural systems exhibit heterogeneous carrying capacities due to differential human activity intensities [36]. Consequently, only when ecotourism is designated as the primary functional objective do environmental components acquire defined development thresholds, rendering carrying capacity metrics operationalizable [37]. For ecotourism development, suitability assessment must contain both capacity thresholds and follow the spatial configuration principles suggested by tourism location theory. The location preferences vary greatly across human activities, and regions exhibit diverse suitability for different socioeconomic functions. Therefore, EDS evaluation extends beyond EECC to incorporate natural endowments, biodiversity conservation significance, natural hazard risks, and alignment with ecological protection goals of national parks.
Building upon this theoretical foundation, we incorporated the EECC evaluation as a hierarchical dimension within the EDS assessment. The EECC evaluation first estimates resource–environment capacity under functional ecotourism objectives. On the basis of this component, the suitability assessment integrates metrics of natural endowments, ecosystem criticality, and natural hazard risks. In this approach, we first derived the evaluative outcomes of carrying capacity levels and then the development suitability levels. The carrying capacity level acted as an evaluative dimension within the suitability assessment. This method emphasized suitability more strongly as the final results, achieving a defined scale for carrying capacity and spatial delineation for suitability.
Within the context of the YRENP, the conceptual framework for the EECC and EDS assessments should incorporate the concept of land–sea integration. Land–sea integration includes both functional and spatial integration [38,39]. Functional coordination manifests as land–sea coupling in regulating ecotourism development with ecological conservation objectives. Popular ecotourism zones often extend across coastal areas, while critical ecosystems (estuarine complexes and coastal wetlands) exhibit intrinsic land–sea connectivity. Spatial integration requires unified functional zoning that treats the coastal zone as a whole area, preserving the integrity of the ecotourism zone and ecological landscapes.

2.3.2. Construction of Evaluation Index System

The influencing factors of EECC and EDS involve multiple fields, exhibiting complexity, functional orientation, and regional connectivity. Therefore, constructing the evaluation index system requires consideration of both hierarchy and internal inter-relationships. Within the human–environment system, national parks provide natural components including landscapes and ecosystems. These components possess ecological and resource attributes while supporting ecotourism activities. Additionally, ecotourism development requires socioeconomic support systems [40,41]. Hence, the evaluation index system for the EECC comprises three subsystems: ecological environment, tourism resources, and socio-economic factors. Based on the theoretical framework, the suitability index system incorporates additional factors beyond those subsystems. These include natural endowments, biodiversity conservation significance, and natural hazard risks. Notably, as marine areas dominate the study region, our methodology integrated marine indexes to achieve coastal integration, representing a key methodological advancement.
Through systematic review of relevant research [34,37,42,43] and theoretical analysis, we established an EDS evaluation index system for the YRENP (Table 1). We were guided by four fundamental principles—scientific rigor, comprehensive coverage, operational feasibility, and location-specific adaptability. We used the Analytic Hierarchy Process (AHP) to determine the weights of the indexes. The method facilitates multi-criteria decision-making through pairwise comparisons, transforming expert judgments into quantitative results that integrate subjective logic with objective analysis [44]. It is suitable for multi-criteria evaluation and decision-making in complex systems. Crucially, EECC was incorporated as a primary subsystem within this hierarchical structure.

2.3.3. Integrated Approach of EECC and EDS

Firstly, spatial quantification of EECC and EDS was conducted using GIS analytical techniques with a specific spatial quantification method detailed in Table 2. All raster data were standardized to a spatial resolution of 30 m. The Coordinate Reference System (CRS) used was WGS_1984_UTM_Zone_50N. The evaluation was conducted using a square grid with a cell size of 300 m × 300 m over the study area.
Each index was reclassified into five tiers based on threshold values and assigned values of 5, 4, 3, 2, and 1 from high to low, thus completing the normalization process. To ensure scientific validity, threshold standardization followed hierarchical criteria: (1) national/industry/local standards; (2) analogous regional benchmarks; and (3) derived from Jenks Natural Breaks classification in ArcGIS. The grading criteria and threshold sources for each index are shown in Table A2 in Appendix A.
Secondly, the AHP was employed to determine the weights of the indexes. All ten participating experts specialized in integrated coastal management, protected area planning, and tourism management. The index weight-calculation procedure was as follows: First, weights were calculated for the three EECC dimensions, followed by their constituent indexes. If only one marine index existed within a dimension, it inherited the full dimension weight. Where all indexes applied equally to both land and sea, they share identical weights (indexes in Tourism Resources). Subsequently, weights for the four subsystems within the EDS were computed, with marine and terrestrial indexes weighted separately due to the presence of marine-exclusive or terrestrial-exclusive cases (indexes in Natural Endowments). Crucially, all EECC index weights were multiplied by the EECC’s weight as an EDS subsystem (0.451, see Table 1), yielding the final integrated weights in the evaluation model (Table 1). The Consistency Ratio (CR) test results and the pairwise comparison matrices are shown in the Supplementary Materials.
A weight-sensitivity analysis was conducted by adjusting (±10%) the weights of the two most influential indicators: Density of Protected Species (highest weight) and River Network Density (lowest weight). The model proved highly robust, with the total area of each EDS class changing by less than 0.13% in all scenarios. This confirmed the stability of our results. Detailed data are provided in the Supplementary Materials.
Finally, the Weighted Linear Combination (WLC) [47] method was computed using the normalized metric scores integrated with AHP-derived weights via multi-factor spatial overlay analysis in ArcGIS. This process generated comprehensive evaluations of EECC and EDS through weighted averaging. The formula is expressed as follows:
TS = i = 1 n Wi × Xi
where TS represents the comprehensive evaluation value for the EECC or EDS. Wi is the weight of the i-th indicator, Xi is the evaluation value of the i-th indicator, and n is the total number of evaluation indicators.

3. Results

3.1. Evaluation of EECC

3.1.1. Ecological Environment

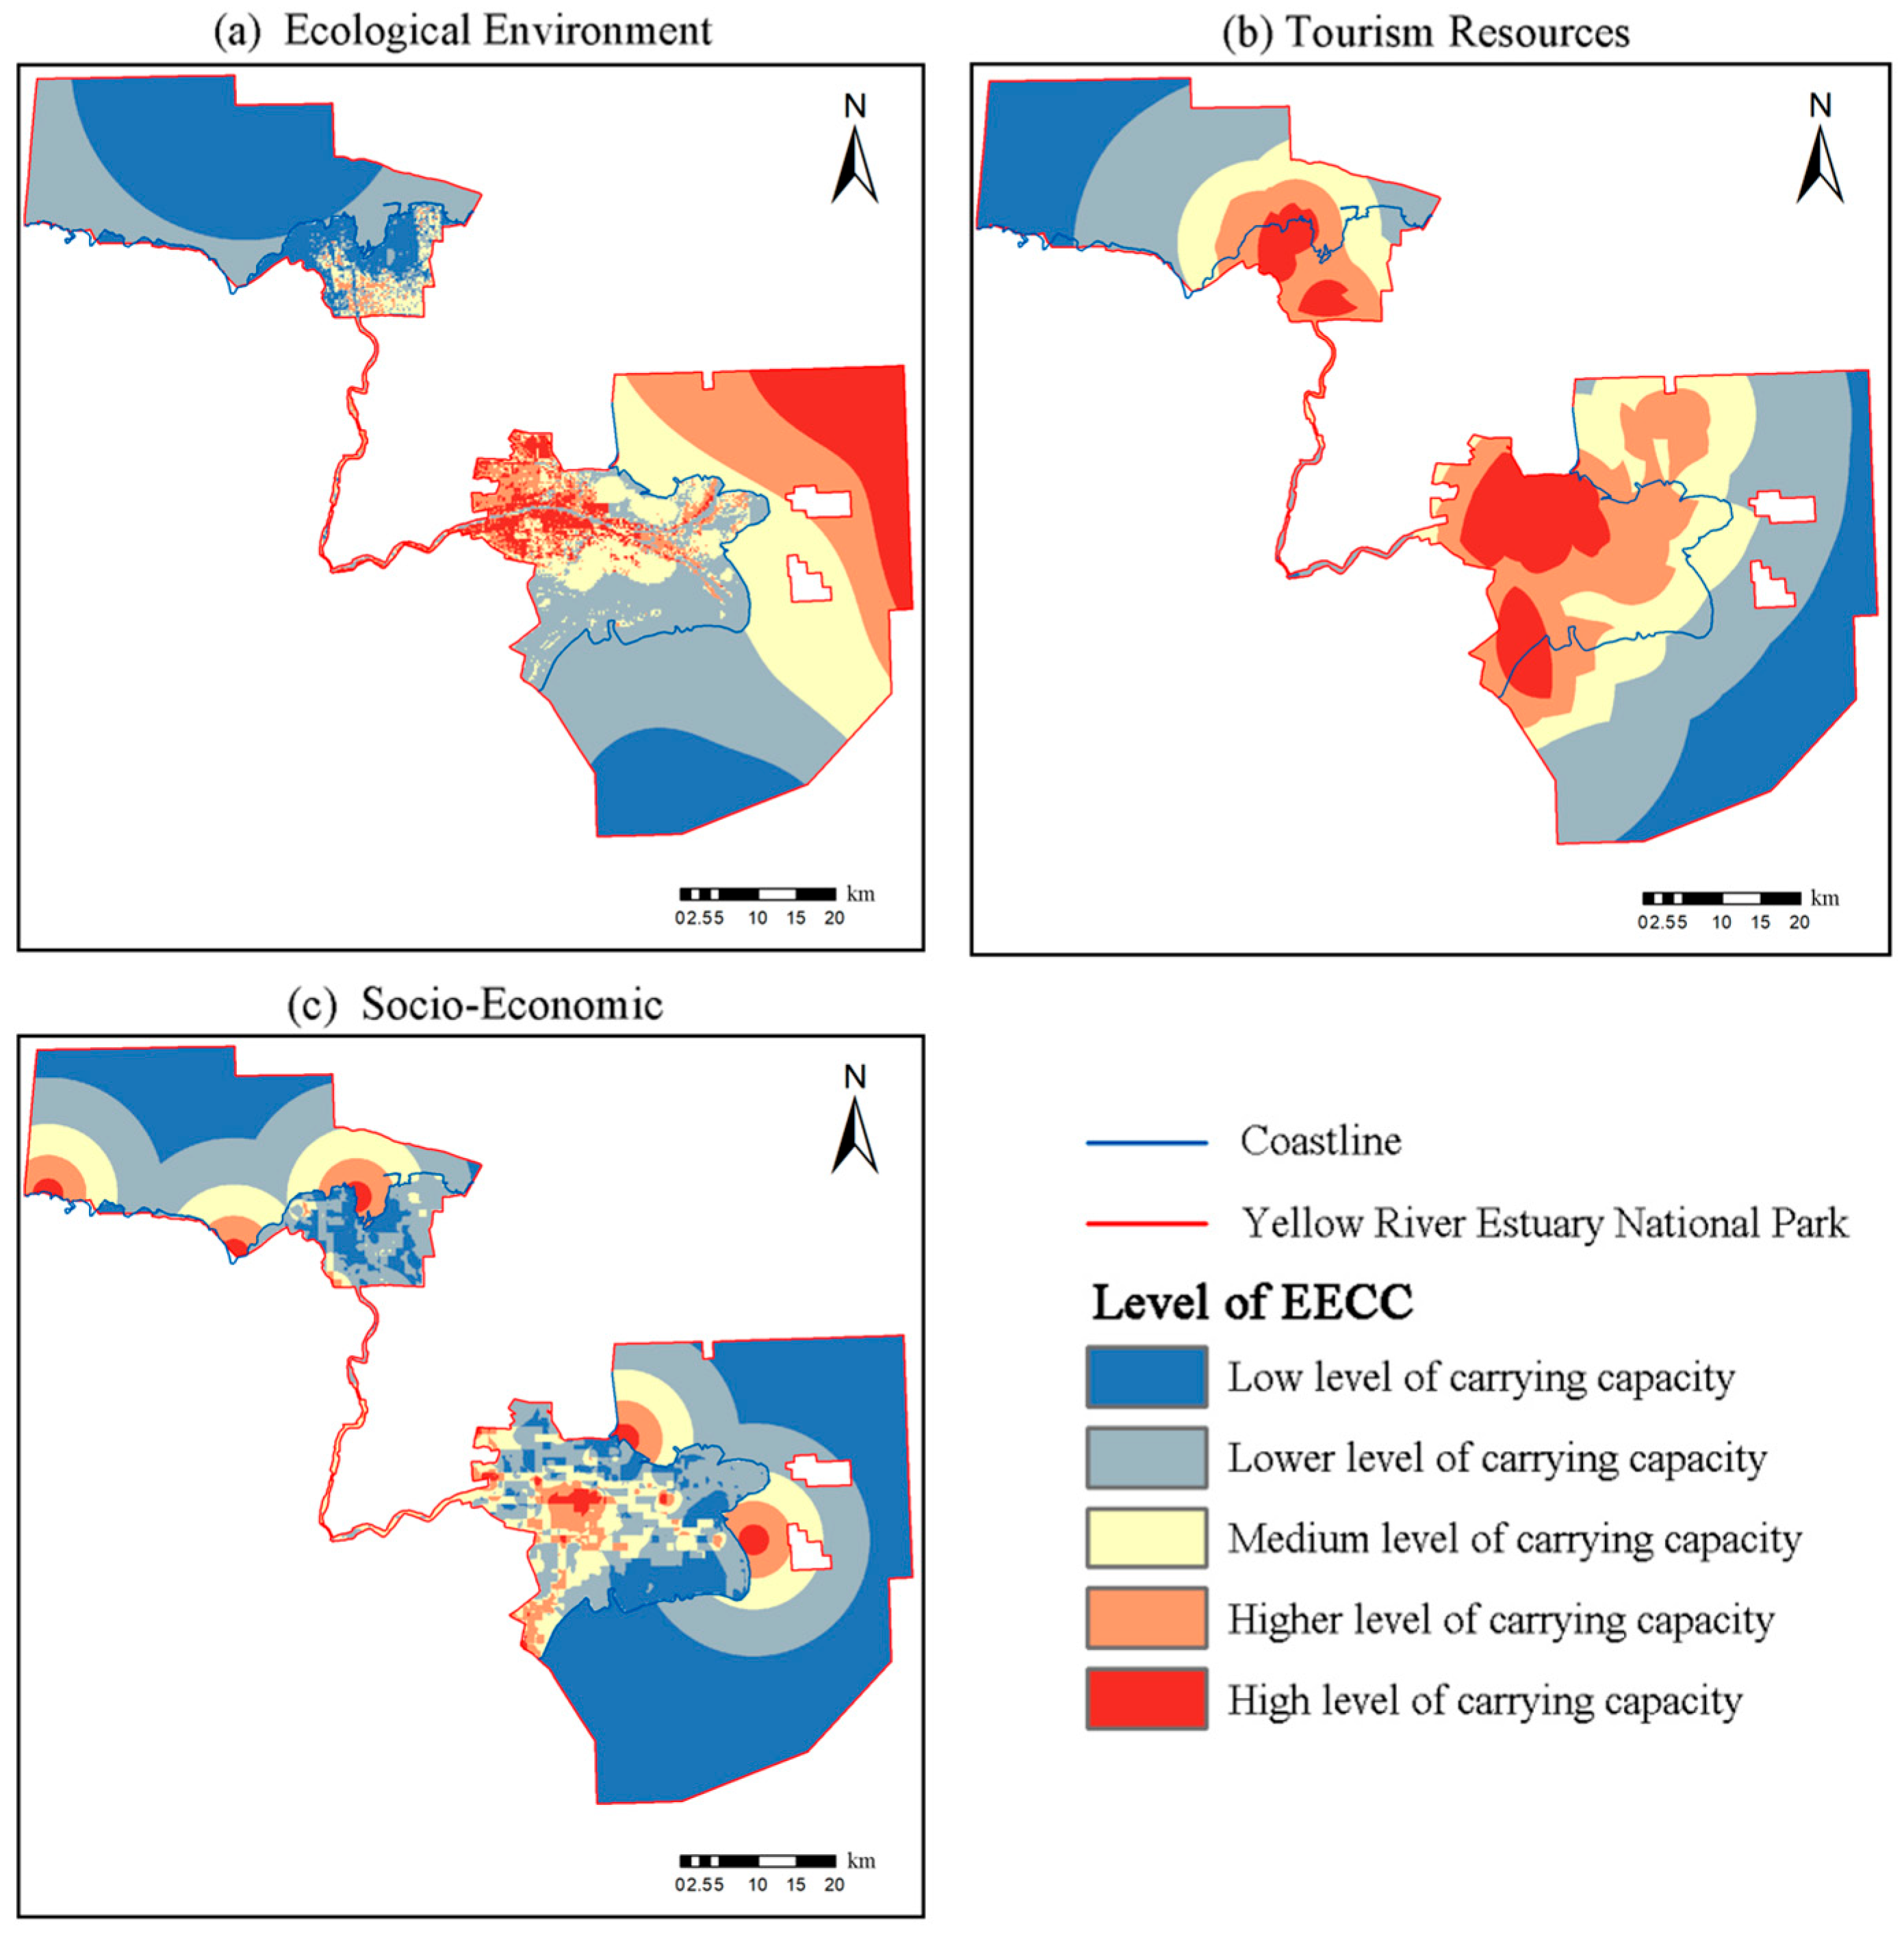
Areas with high marine biodiversity were located close to the Yellow River’s estuary (Figure 3a). The main reason is substantial sediment transport. Annual fluvial discharges of the Yellow River introduce freshwater, organic phosphorus, inorganic nitrogen, and other nutrients into the Bohai Sea, creating optimal habitats for marine biota through land–sea interactions [48]. Vegetation coverage showed spatial heterogeneity: higher values occurred inland and along the river channel, whereas coastal zones exhibited reduced coverage due to extensive mudflats, saline marshes, and tidal wetlands. Inland salt marshes occurred along the historic course of the Yellow River. These areas exhibited lower vegetation coverage compared to inland habitats, such as in reed-dominated areas.
Terrestrial ecological capacity in the southern sector greatly exceeded the northern sector, with inland areas outperforming coastal zones. High-capacity areas are concentrated along the Yellow River, diminishing with increasing distance from the river. This reflected ideal environmental quality and ecosystem complexity in streamside zones, which can support ecotourism activities. In the ecological environment subsystem, the areas of the EECC from high to low were 373.83 km2, 458.29 km2, 690.39 km2, 1140.93 km2, and 947.52 km2, accounting for 10.35%, 12.69%, 19.12%, 31.60%, and 26.24% of the total area of the national park.

3.1.2. Tourism Resources

The EECC within the tourism resources dimension was determined by the ecotourism attractions and related facilities within the national park. The attractions were predominantly located in terrestrial areas (Figure 3b). Tourism facilities (visitor centers, recreation wharfs, and observation decks) were mainly located on land areas, while limited coastal infrastructure was constructed near shorelines. These infrastructures directly impacted the capacity for ecotourism development, involving the number of visitor receptions, transportation capabilities, environmental education, and service quality.
The areas with high and higher capacity were concentrated in regions where tourism resources and related facilities were densely distributed. Their distribution was relatively balanced between the northern and southern sections. The EECC of terrestrial areas was much higher than that of marine areas. The further the sea areas were from the coastline, the lower the capacity. The areas of capacity from high to low were 349.39 km2, 650.32 km2, 653.48 km2, 1118.83 km2, and 838.98 km2, accounting for 9.68%, 18.01%, 18.10%, 30.98%, and 23.23% of the total area.

3.1.3. Socio-Economic

The socio-economic subsystem incorporates three indexes: road network density, transportation accessibility, and economic development level. Road infrastructure directly influenced transportation capability, where higher road density and accessibility could enhance EECC [49]. A robustness check was conducted by recalculating land-transportation accessibility with an assumed speed of 40 km/h (compared to the baseline 30 km/h). It showed a high degree of spatial consistency with the original results, indicating that the model output was robust to reasonable variations in this parameter. Marine transportation accessibility depends on the distance to wharfs. Economic activities were restricted to regulated industries (petroleum and aquaculture) due to the national park’s protection requirements. As a low-impact activity, ecotourism aligned with protection goals while affecting regional development as well. From the spatialized results of night-time light intensity, the overall level of economic development within the YRENP was relatively low, and only the eastern coastal area of the northern section showed relatively better development and generated a certain radiating effect. Spatially, the EECC, in the socio-economic dimension, was predominantly low (low level: 2223.19 km2, lower level: 799.33 km2), covering 83.71% of the YRENP. Terrestrial capacity was marginally higher in southern sectors, which was concentrated in the central position of the land area (Figure 3c).

3.1.4. Comprehensive Evaluation of the EECC

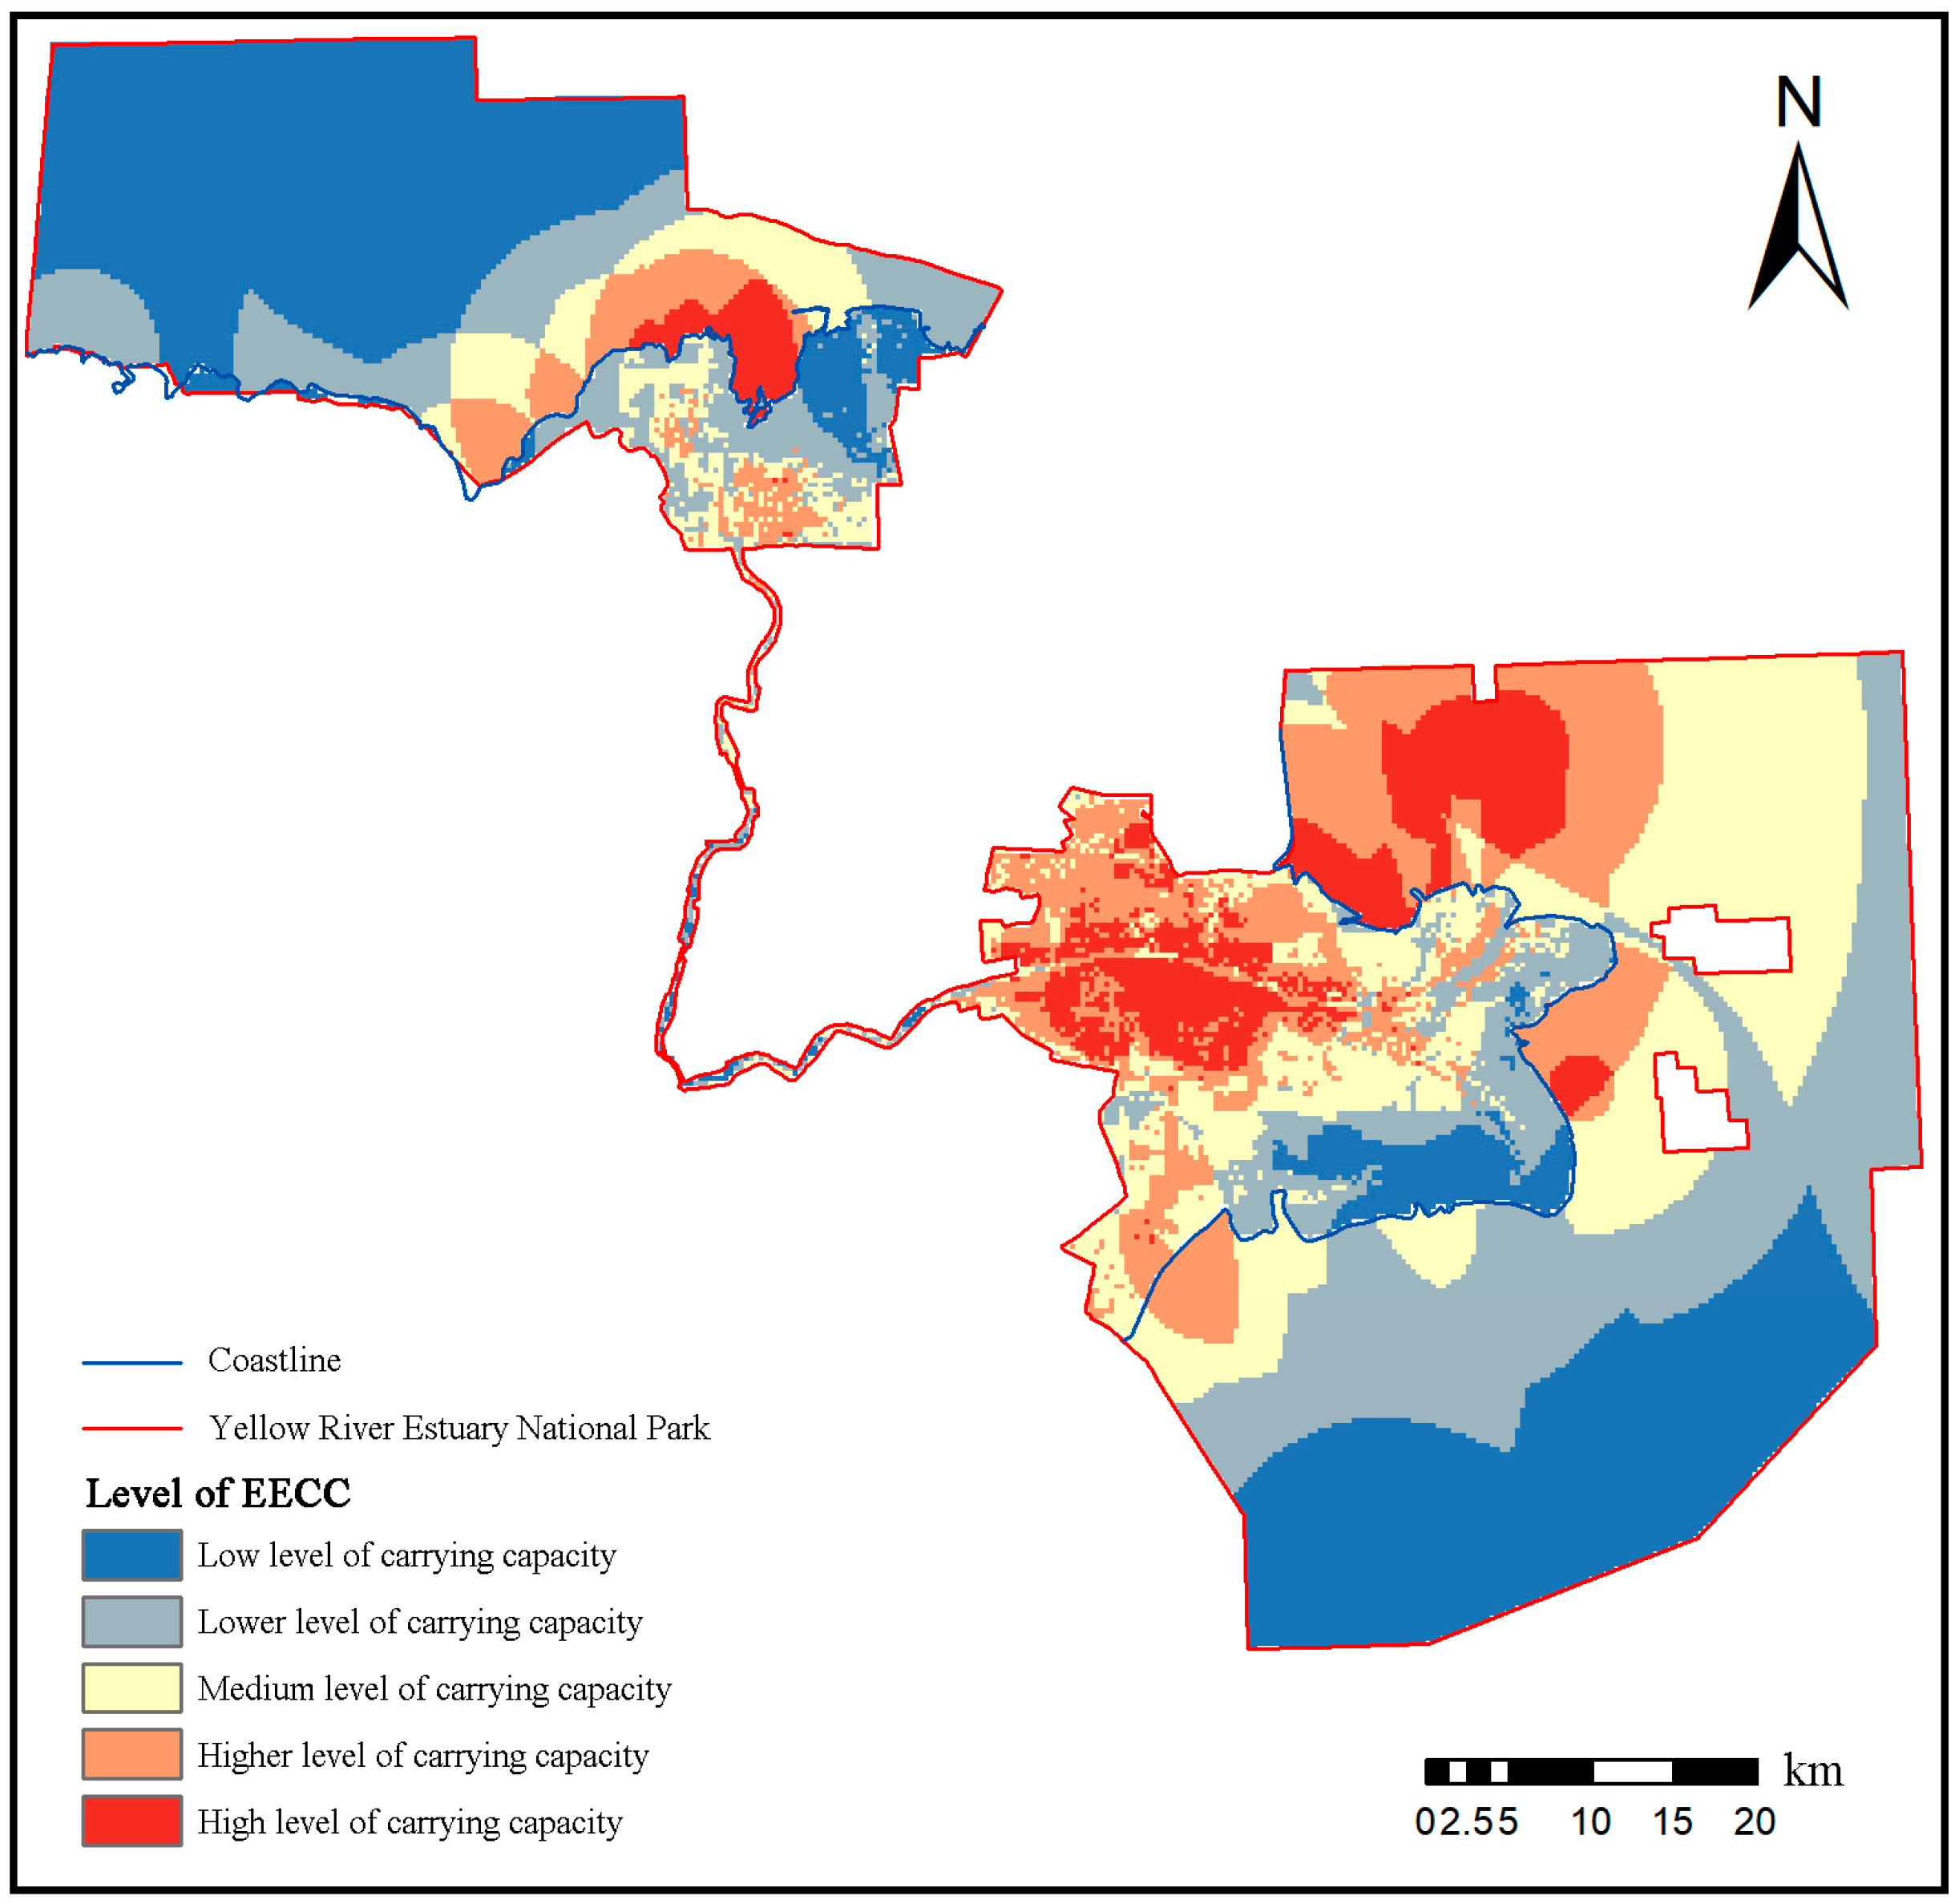
Figure 4 illustrates the spatial distribution of the comprehensive EECC within the YRENP. Terrestrially, the southern sector showed higher capacity than the north, with high-capacity zones concentrated in the south with balanced distribution. Low-capacity regions occurred in northeastern coastal areas (northern sector) and southeastern coasts (southern sector). For the marine area, capacity peaked nearshore and decreased seaward. The southern sea exhibited slightly higher capacity than the north. High-capacity marine zones were located in the north of the southern section and the east of the northern section. Among the three subsystems, tourism resources and ecological environment outperformed socio-economic level. However, high-capacity zones consistently occupied the smallest area across all layers, while low-capacity zones covered the largest. Specifically, areas by descending EECC level were: 270.71 km2 (7.50%), 526.28 km2 (14.57%), 761.24 km2 (21.08%), 890.39 km2 (24.66%), and 1162.38 km2 (32.19%).
Figure 5 presents the spatial evaluation results for each indicator of EECC in terms of area proportion. Terrestrial EECC exhibited obvious spatial variation. The BAI performed optimally; its high-capacity zones exceeded 70% coverage of the YRENP. Other indicators were generally weaker: high-capacity zones for economic development level and transportation accessibility only accounted for about 1%, while low-capacity zones for tourism resource abundance and road network density both exceeded 60%. This indicated effective ecological conservation on land, yet highlighted deficiencies in infrastructure and resource development. Prioritizing ecotourism and service facilities in non-core protected areas was recommended to enhance localized capacity.
Marine EECC was overall inferior to land. High-capacity zones covered 21% for the Biodiversity Index and 15% for tourism resource attractiveness, higher than tourism facility support (3%) and transportation accessibility (1%). Tourism resources were concentrated nearshore. Due to limited port coverage, over 60% of the sea area had low transportation accessibility and resource abundance. Optimizing nearshore resource allocation and moderately expanding the port network were necessary to balance conservation and development needs.

3.2. Evaluation of EDS

3.2.1. Natural Endowments

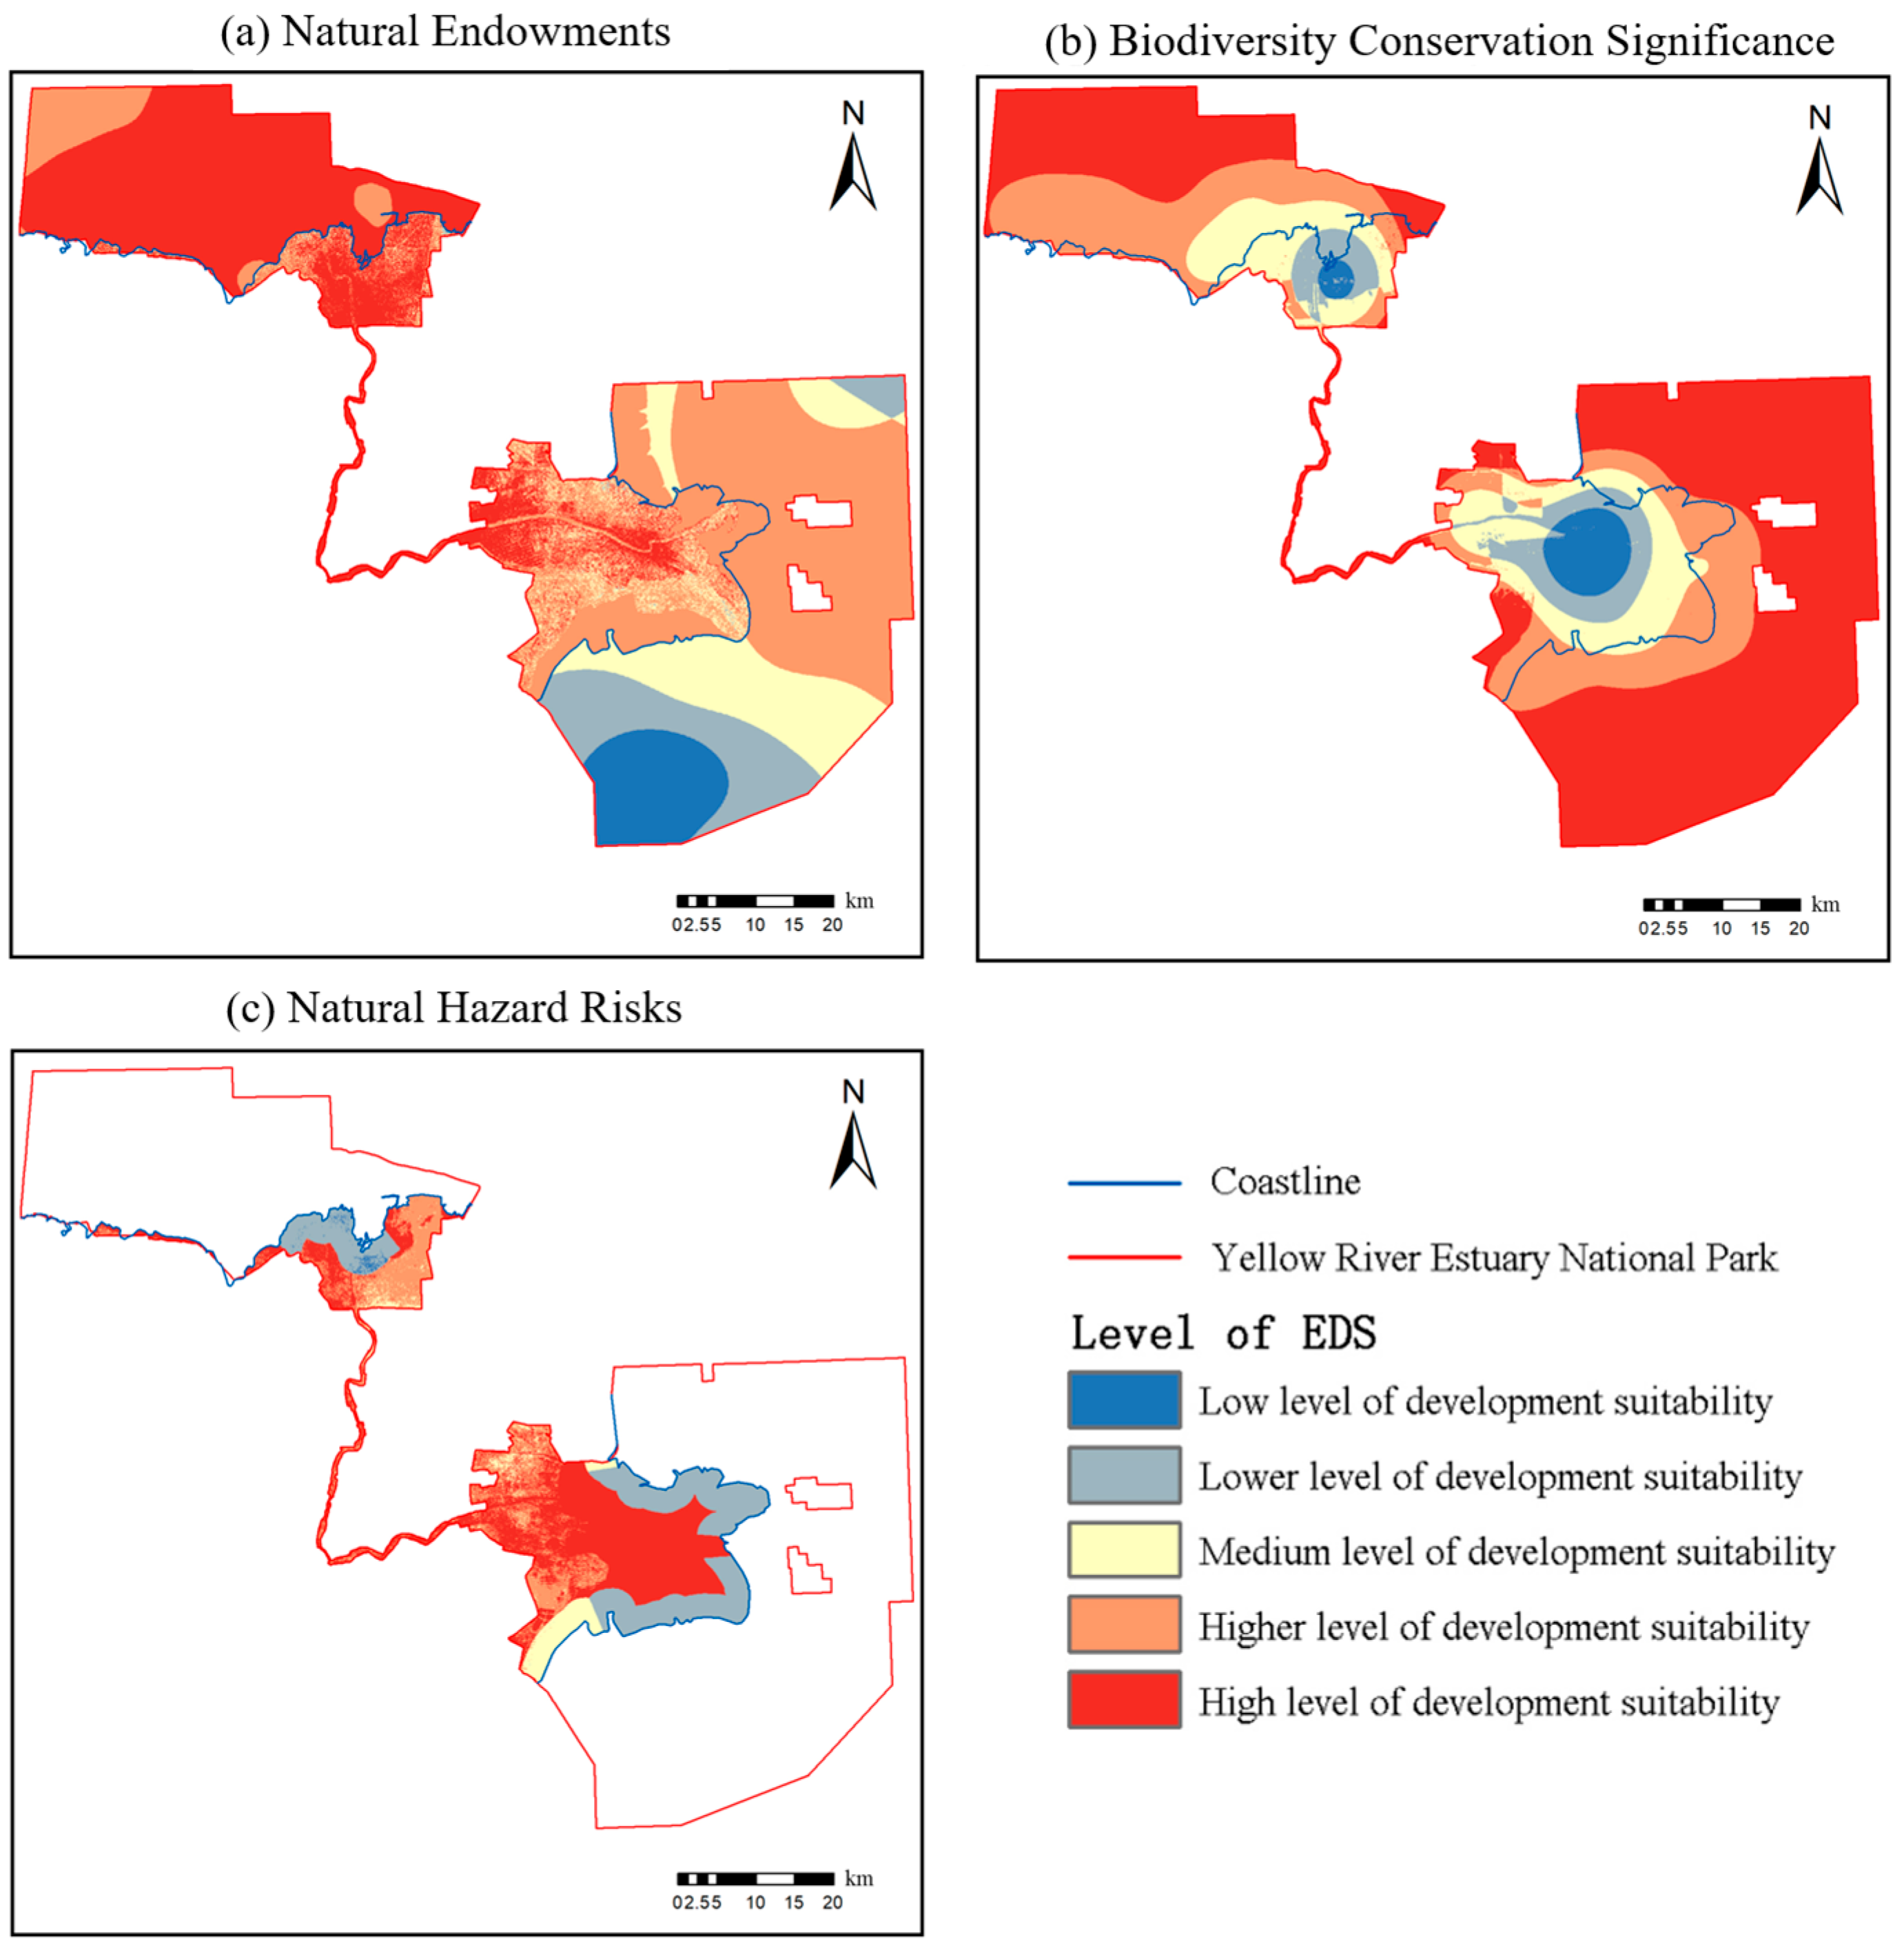
The natural endowments encompass five indexes: elevation, slope, water depth, seawater quality, and THI. On land, the YRENP exhibited good natural conditions due to gentle terrain and a suitable climate. The majority of terrestrial areas showed above-average EDS, with northern sections outperforming southern zones (Figure 6a). Marine areas similarly showed generally good natural conditions, with only limited sea zones having low EDS. Marine EDS in northern sections exceeded that in southern sections, with most areas rated highly suitable. Southern marine areas displayed a gradual decrease southward in suitability. The areas of EDS from high to low were 1140.21 km2, 1405.80 km2, 537.46 km2, 306.93 km2, and 220.61 km2, accounting for 31.58%, 38.93%, 14.88%, 8.50%, and 6.11% of the total area.

3.2.2. Biodiversity Conservation Significance

The YRENP is a region where rare and endangered species are densely distributed along China’s southeastern coast, including key protected animals such as the Siberian Crane (Grus leucogeranus), Red-crowned Crane (Grus japonensis), Oriental Stork (Ciconia boyciana), Dalmatian Pelican (Pelecanus crispus), and Great Bustard (Otis tarda). The results revealed that the majority of the protected species inhabited intertidal saline marshes and inland salt marshes within terrestrial zones (Figure 6b). This distribution pattern formed due to the area’s critical role as a breeding and stopover site for migratory birds, requiring the strictest protection and, consequently, the lowest EDS. Similarly, regions with high ecosystem significance, including coastal wetlands, tidal flats, common reed, and seepweed, also need strict protection; this also reduced the EDS. Overall, marine zones demonstrated higher suitability than terrestrial areas. The least suitable zones occurred in the central area due to the concentration of protected wildlife, which was predominantly found in intertidal saline marshes and inland salt flats. The areas of EDS from high to low were 1997.73 km2, 821.77 km2, 465.00 km2, 209.94 km2, and 116.58 km2, accounting for 55.32%, 22.76%, 12.88%, 5.81%, and 3.23% of the total area.

3.2.3. Natural Hazard Risk

Natural hazard risk was determined by geological hazard risk and coastal erosion sensitivity. Geological hazard risk was quantified by land subsidence rates. Overall, subsidence was minimal and primarily attributed to salt production, aquaculture, and petroleum extraction. Beyond anthropogenic factors, natural sedimentation also contributed to subsidence in the Yellow River Delta. The sediment transport of the river caused deltaic progradation. The newly deposited formations exhibit loose structure and high water content, and anticipate sinking [50]. Coastal erosion sensitivity was evaluated based on geomorphology and the current utilization status of the coastal zone. Three shoreline types were identified: Artificial shorelines (reclamation/landfill) demonstrated low sensitivity and correspondingly high EDS; Silt-mud shorelines showed the highest sensitivity, requiring maximal protection and thus the lowest EDS; and ecologically restored shorelines with natural features exhibited moderate sensitivity and medium EDS [46].
Spatially, the northern section featured mostly artificial shorelines and reclamation coastline, while abandoned river channels comprised sensitive silt-mud shorelines (Figure 6c). Southern coastal zones were dominated by silt-mud shorelines as well, with limited occurrences of artificial and restored shorelines. EDS distribution across land areas from high to low was quantified as follows: 424.55 km2, 184.61 km2, 71.34 km2, 249.14 km2, and 5.36 km2, accounting for 45.41%, 19.74%, 7.63%, 26.65%, and 0.58%.

3.2.4. Comprehensive Evaluation of the EDS

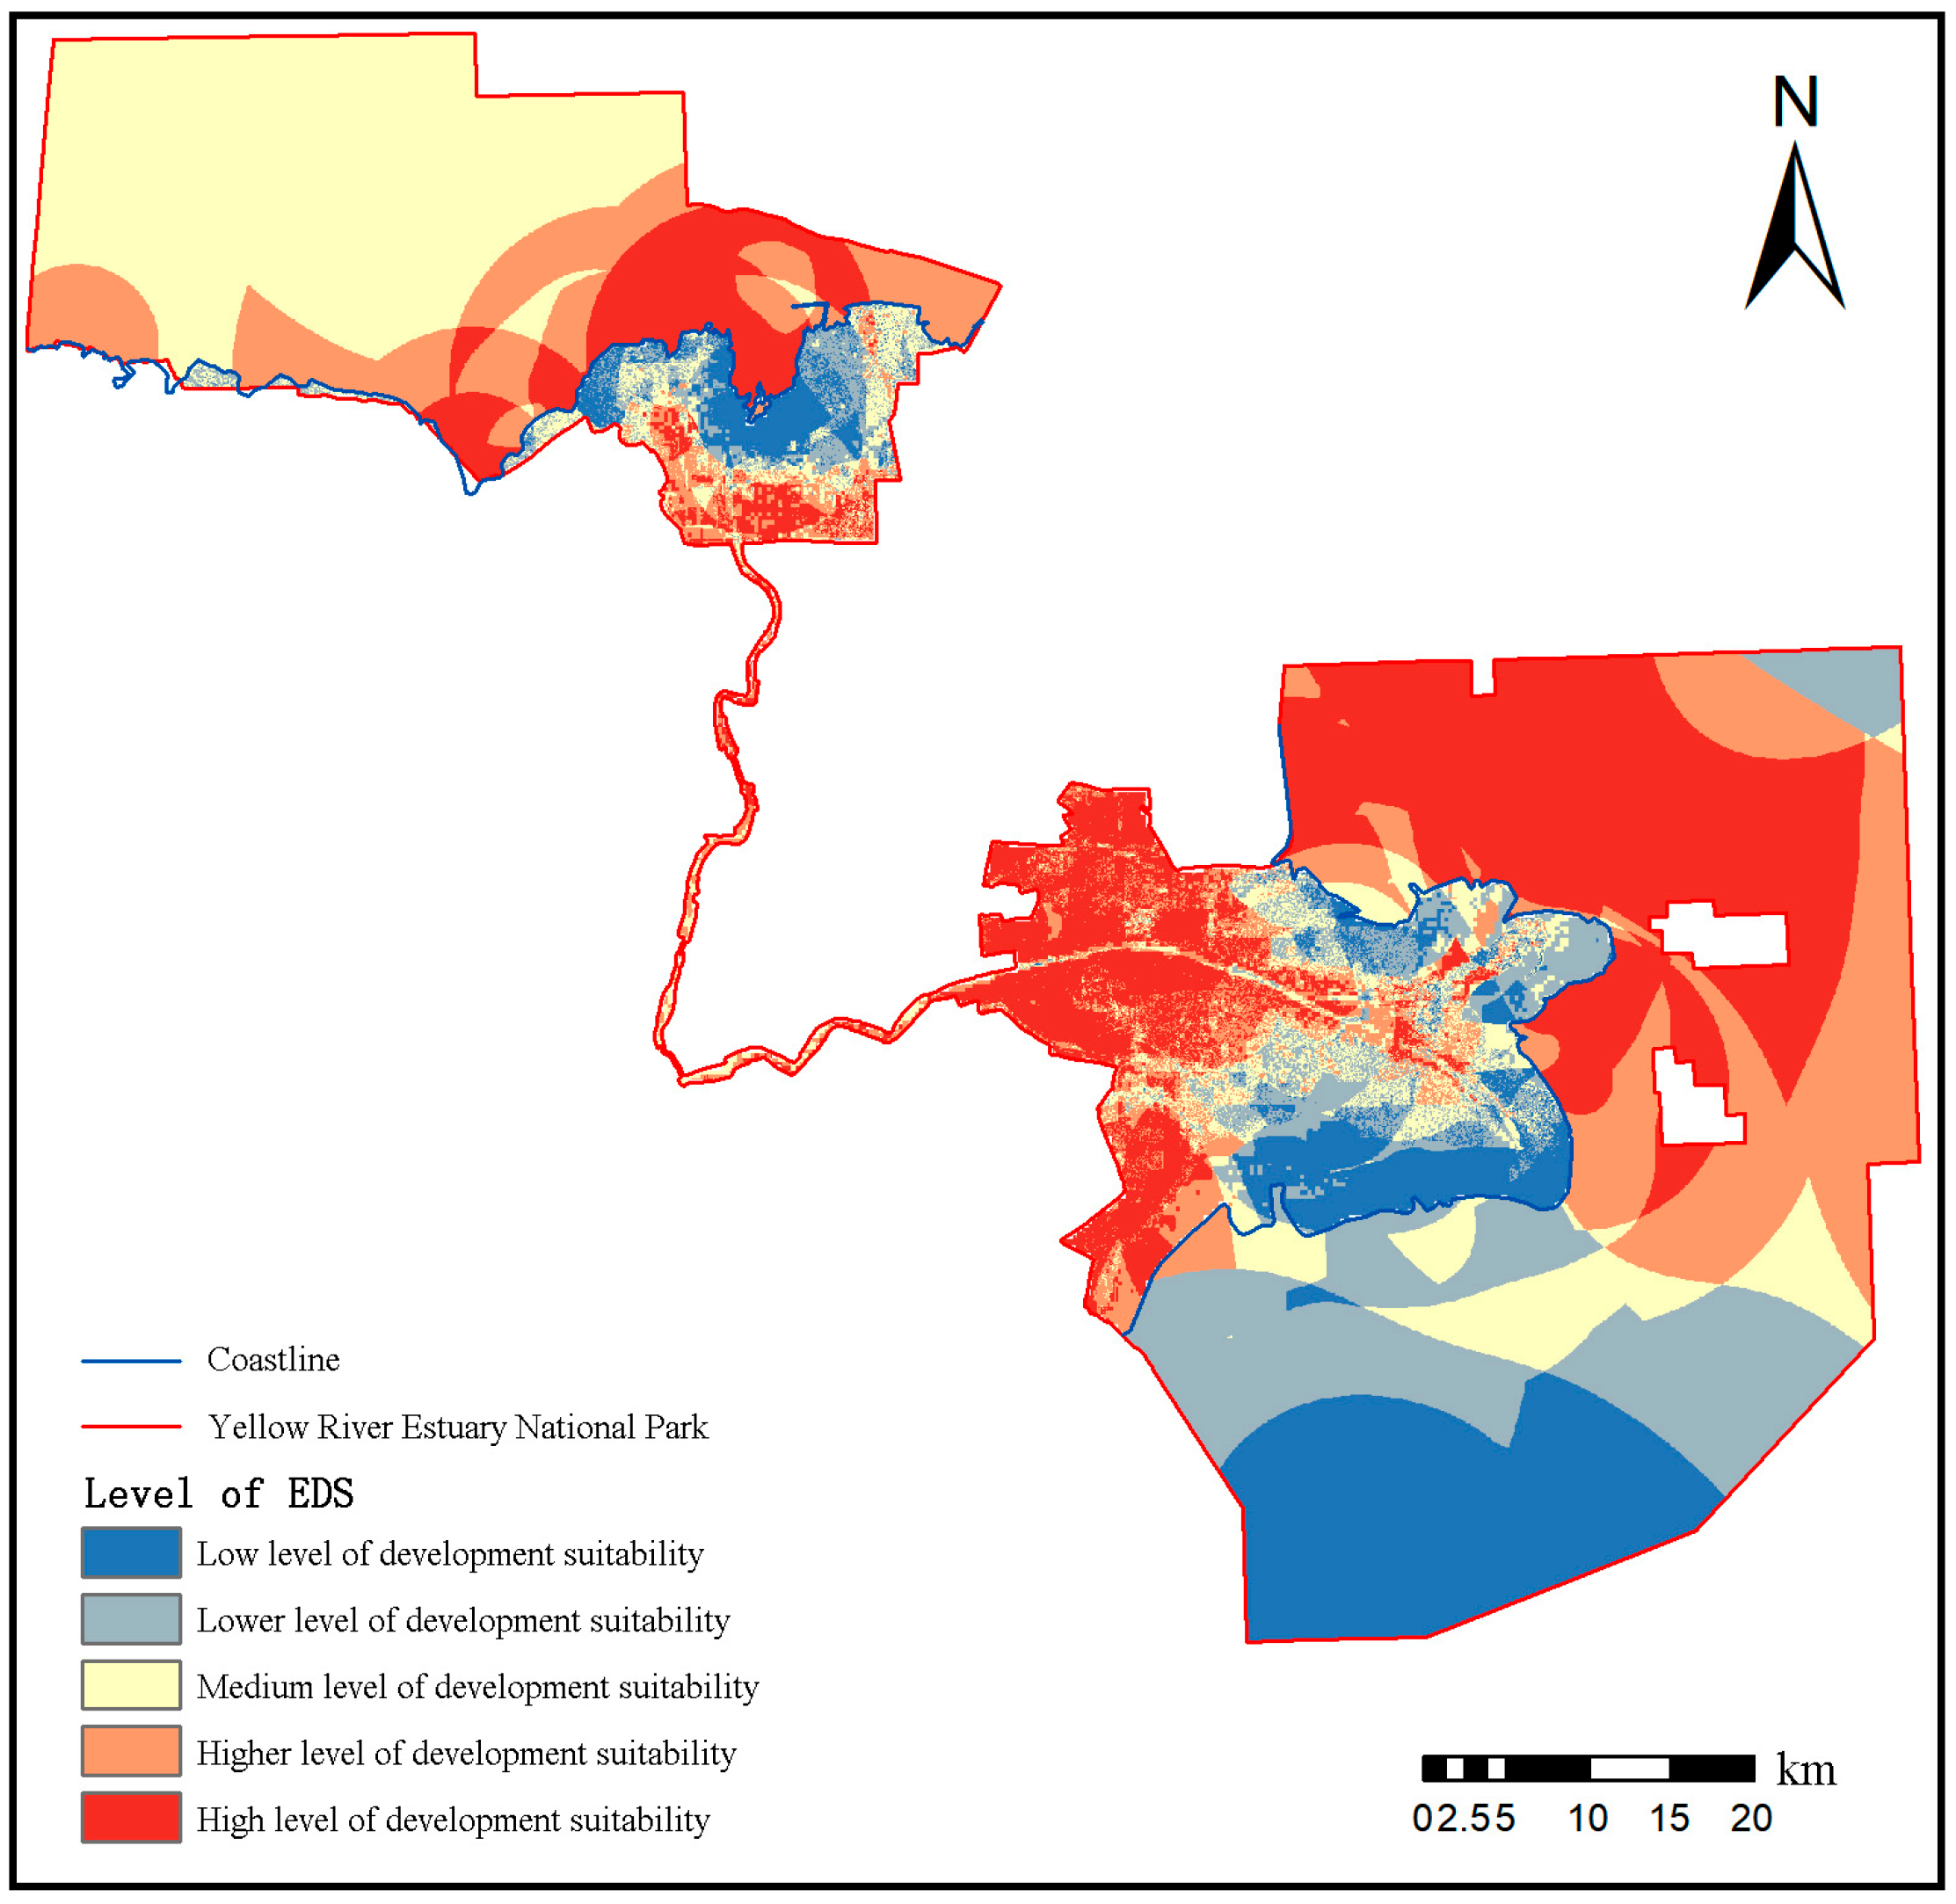
The comprehensive EDS evaluation integrates weighted results from all subsystems (Figure 7). Marine zones had slightly higher EDS than terrestrial areas. High-suitability coastal areas were concentrated along shorelines, which is consistent with the actual situation, in that most ecotourism activities occur along shorelines. Terrestrial analysis revealed a distinct spatial distribution: inland areas exhibited a higher EDS than coastal zones, while the southern sector contained much larger high-suitability areas. This pattern aligned with EECC assessments. Important ecosystems (wetlands/intertidal saline marshes) were concentrated along the coast, which decreased shoreline suitability. The southern sector’s EDS was relatively high, though with greater internal variability compared to the northern sector’s homogeneity (where only narrow coastal strips show low suitability). Among evaluation subsystems, biodiversity conservation importance contained the largest high-suitability coverage, followed sequentially by natural hazard risk, natural endowments, and EECC. The areas of EDS from high to low were 923.35 km2, 745.98 km2, 875.50 km2, 558.25 km2, and 507.90 km2, accounting for 25.57%, 20.66%, 24.25%, 15.46%, and 14.07% of the total area.
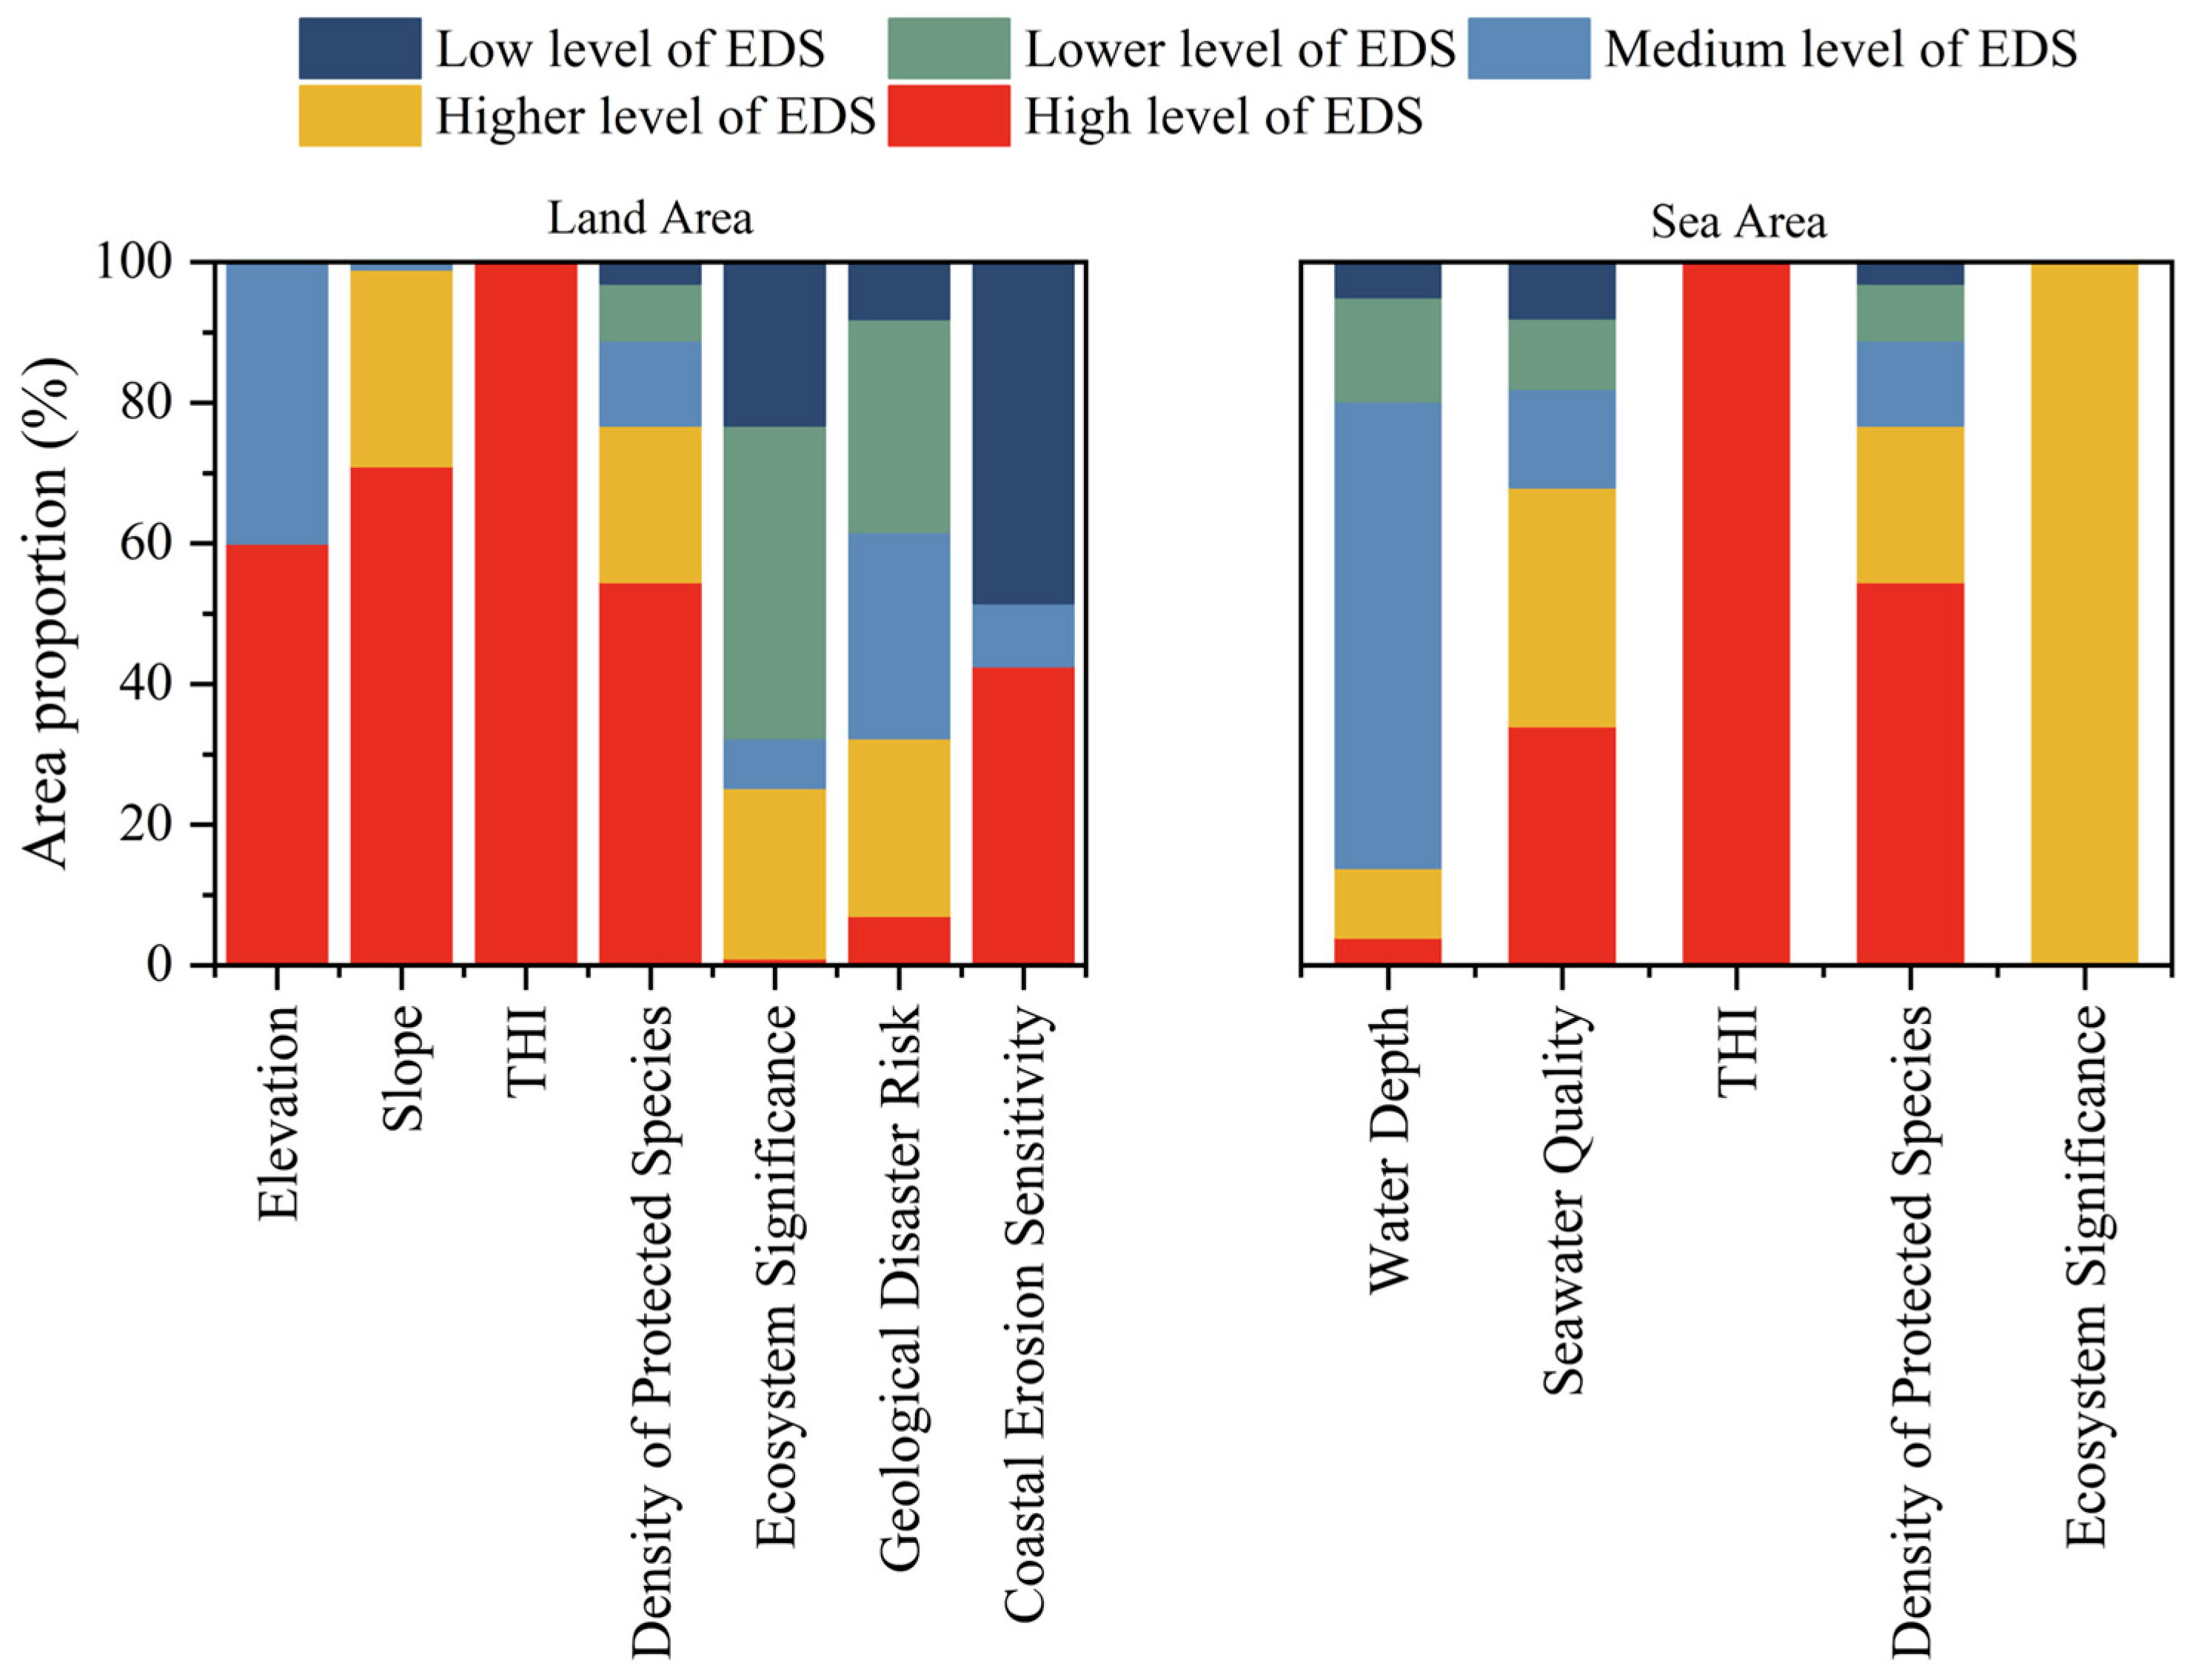
As illustrated in Figure 8, territorial indicators exhibited great spatial differentiation. Elevation and slope demonstrated high suitability due to the Yellow River Delta’s flat terrain (mean elevation < 5 m, slope ≤ 2°). The THI was 57.52, benefitting from the maritime climate. Protected species distributions also influenced the EDS in the YRENP. In addition, ecosystem importance and coastal erosion sensitivity showed lower EDS, requiring prioritized protective strategies. For marine zones, 67% of areas displayed moderate suitability in water depth, seawater quality, THI, and protected species density.

4. Discussion

4.1. Core Findings and Significance of the Assessment

China is advancing its nature reserve system centered on national parks, positioning YRENP as a pioneering land–sea integrated national park as critically significant. Although national parks implement the “strictest protection” policies, this does not impose complete prohibitions on human activities. Instead, they adhere most strictly to scientific principles in conservation. As an important function of national parks, ecotourism holds significant meaning for enhancing the value of ecosystem services and achieving human well-being. The EECC and EDS are among the crucial elements of tourism management planning. An effective theoretical framework and precise quantitative assessment play a guiding role in the development of ecotourism within national parks. This helps managers of national parks in implementing integrated land–sea tourism management. The research revealed three key spatial patterns in the YRENP. Firstly, the overall EECC was moderate, with terrestrial areas exhibiting a stronger capacity than marine zones. The high-capacity areas were largely confined to the nearshore environment. Secondly, the EDS was generally favorable, showing a distinct spatial heterogeneity where the southern sector significantly outperformed the northern. Finally, a pronounced land–sea disparity was observed, as marine EDS slightly surpassed its terrestrial counterpart, with the most suitable coastal zones forming a clear gradient of decreasing suitability away from the shoreline.
A validation against observed data confirmed the practical relevance of the assessment. A comparison revealed that areas we identified as high/higher EDS coincided with existing clusters of tourism facilities and popular visitor sites as POI data. The matching spatial patterns validated our model’s ability to pinpoint critical factors sustaining current ecotourism hotspots. Moreover, our model demonstrated high efficacy in identifying conservation-critical zones. The spatial distribution of low/lower EDS areas showed a strong correspondence with the habitats of protected species, which was documented in the Master Plan for Yellow River Estuary National Park (2021–2035). The majority of these biologically sensitive areas fell within the low-suitability zones, indicating that the model effectively integrated biodiversity constraints as intended.
This approach has substantial practical significance for the YRENP in alleviating the conflict between protection and development, and in achieving a harmonious coexistence between humans and nature. From a theoretical perspective, current research neglects the spatial differentiation that integrates EECC-EDS linkages and pays little attention to the coastal zone. This makes it difficult to provide technical support for ecotourism development. This study applied the theory of human–environment relationship and the theory of regional function, integrated with the concept of land–sea integration, and clarified the intrinsic connection between the EECC and EDS within the context of national parks. By employing ArcGIS for quantitative assessment and spatial analysis of both, this research provided methodological reference for the ecotourism development of the YRENP and other land–sea national parks.

4.2. The Land–Sea Coordination Mechanism in Ecotourism Development

The land–sea coordination mechanism of the YRENP constituted a core focus of this study. The spatial evaluation of EECC and EDS should be based on the concept of integrated land–sea management to address the functional conflicts caused by the traditional separated development models. The principle of land–sea coordination should not only cover the systematic integration of functional dimensions, but also require achieving a balance between ecological processes and anthropogenic activities in terms of spatial dimensions. It is reflected in two aspects.
Functionally, the coordination between ecotourism development and conservation needs to break through land–sea fragmentation. Within estuarine–nearshore ecosystems, key processes including sediment transport, nutrient cycling, and species migration exhibit distinct land–sea connectivity. For instance, the landscape stability of the Yellow River Delta’s newborn wetlands relies on a dynamic equilibrium between terrestrial sediment discharge and tidal redistribution. However, if tourism activities only focus on the construction of land-based facilities while neglecting their anthropogenic interference with the sediment flux of tidal creeks (boardwalks obstructing flow and reducing sedimentation rates), this could lead to risks such as wetland shrinkage and tourism safety. Consequently, ecotourism zoning in land–sea transition zones requires a systematic identification of suitable areas through holistic land–sea coordination frameworks.
Spatially, the scientific demarcation of functional zones in the coastal areas should take into account the spatial match between ecological integrity and development requirements. The Yellow River estuary can be divided into three interdependent functional units: the land-based input zones, like river channel buffers, requiring restricted tourism intensity to maintain sediment and nutrient supplies; the land–sea interaction zones including tidal salt marshes and mudflats, which are suitable for infrastructures, such as seasonal floating bridges, that should be deployed to accommodate tidal dynamics; and the area with dense distribution of wild animals and plants, where the focus is on maintaining the connectivity of biological habitats. Implementing integrated management of these three types of units enhances conservation efficiency from a land–sea coordination perspective while regulating the development of ecotourism activities. This land–sea integrated mechanism overcomes ecological fragmentation caused by rigid coastal boundaries in conventional planning, instead enabling the synergistic optimization of natural process preservation and human activity regulation through differentiated zone management. Ultimately, it forms a gradient spatial pattern of “ecological core zones—transitional buffers—moderate utilization areas.” By translating ecological constraints into spatial-planning parameters through recognition of landscape heterogeneity, the land–sea coordination strategy provides a scientific pathway for implementing sustainable ecotourism development.

4.3. Comparison with Previous Studies and Innovations

This study advanced existing ecotourism suitability assessments by systematically integrating EECC in a land–sea integrated evaluation framework for coastal national parks. Earlier studies mainly focused on land-based systems for ecotourism resilience. They used methods like weighted map overlays with AHP-GIS [51] or machine learning [52] to analyze these land systems. However, these approaches did not consider how land and marine environments interact, even though coastal zones are critically important for ecotourism. In addition, models like ANP-Fuzzy TOPSIS [53] demonstrated methodological sophistication but remained isolated in terrestrial or marine contexts. In contrast, our framework uniquely incorporated marine indicators alongside terrestrial ones, addressing the bidirectional ecological interactions between land and sea. Furthermore, the study results revealed both the asymmetric patterns and spatially clustered features of EECC and EDS. This land–sea disparity underscored the necessity of dual-system evaluation. Even though the resource endowments in marine and land areas are equally abundant, marine constraints such as coastal erosion have a disproportionately large impact on limiting the potential of ecotourism. Methodologically, earlier studies, such as [54,55], employed single-dimensional models. These included techniques like Ordered Weighted Averaging (OWA) for risk-level zoning or AHP for wildlife habitat suitability. In contrast, our approach integrated carrying capacity as a subsystem within development-suitability assessment using a multi-criteria spatial overlay framework, simultaneously capturing resource limitations and ecotourism development capabilities. Moreover, this research model specifically incorporated ecological conservation imperatives of national parks, integrating metrics such as ecosystem significance and density of protected species. Yet some studies found peak development suitability zones in protected cores [55]. This holistic framework bridged the gap between conservation and sustainable ecotourism, which offered a replicable model for coastal-protected areas globally.
The innovation of this paper is reflected in the following aspects. Firstly, we integrated the EECC into the evaluation mechanism of EDS. The above text systematically expounds the carrying function and feedback mechanism of the natural environment system of national parks for ecotourism activities, as well as the occupation and reliance of ecotourism activities on the national park’s natural environment system. We also clarified that the EECC was one of the subsystems of the EDS evaluation. Secondly, the study integrated the concept of land–sea coordination into the spatial evaluation of EDS. Based on the coastal wetland characteristics of the YRENP, targeted marine and terrestrial indicators were selected and simultaneously incorporated into the evaluation index system. This achieved an integrated assessment of land and sea. In the study, the coastline only served as the demarcation line between marine and terrestrial areas, rather than as a boundary for the spatial distribution of EECC and EDS. This approach achieved a coordinated integration of land and sea from a spatial and functional perspective. This research paradigm resolved the land–sea dichotomy in ecotourism planning, broke the boundaries between land and sea, and enhanced the mutual coordination in marine and terrestrial spatial planning.

4.4. Management Implications and Study Limitations

The findings of this study could offer broad applicability in ecotourism development and management for protected areas. The spatially explicit assessment of the EECC/EDS could provide a scientific basis for zoning guidance. Rather than presenting a rigid zoning plan, our results could empower managers to derive flexible strategies by referencing the EECC and EDS levels of any given area. For instance, zones with both high EDS and high EECC present opportunities for moderate ecotourism development, where low-impact infrastructure like seasonal boardwalks and observation decks could be accommodated. Conversely, areas with low EDS and low EECC (often overlapping with critical habitats) should be designated for core protection, with access restricted to scientific monitoring and minimal human intrusion. The interface between these zones, characterized by moderate EDS but variable EECC, would be ideal for buffer and educational functions, facilitating controlled visitor experiences through guided tours that emphasize environmental education without compromising ecological integrity. This evidence-based approach defines adaptive use thresholds matched to sub-area capacity, enabling ecologically sustainable and operationally viable management. Furthermore, the long-term monitoring of ecotourism factors could also be facilitated, including tourist behavior, habitat ranges of protected species, and tourism services. It is worth mentioning that current research on EECC often relies on specific numerical values of tourist numbers as research outcomes [19,56,57]. Crucially, we transcended conventional static tourist-quota-based evaluations by establishing a five-tiered capacity gradient. This dynamic benchmark integrated ecological parameters with socioeconomic factors. It enabled adaptive management protocols to quantitatively track environmental changes through remote sensing and monitoring.
It should be noted that, while this paper has achieved some results, there were still some limitations. First, the assessment of EDS possesses strong seasonal features [58], yet most of the evaluation indicators in this paper were calculated based on annual data, such as vegetation cover and THI. This approach may overlook seasonal variations, which could lead to an inaccurate estimation of when the area is most suitable for tourism. The suitability tiers may shift spatially between the peak bird-migration season and tourist season. Second, there were several calculation uncertainties during the spatial evaluation procedures. A degree of subjectivity was inherent in the selection of evaluation indicators and the calculation of their weights using the AHP, despite consistency ratios passing the test. In addition, the use of VIIRS night-time light data as a proxy for economic development level introduced uncertainty, particularly in low-intensity areas like protected zones. Also, the spatial interpolation of N:P ratios via Kriging was an estimation that may not fully capture the heterogeneity of seawater quality, potentially introducing local inaccuracies. Addressing these limitations in future work will further refine the proposed framework and increase the reliability of its applications.

5. Conclusions

This paper took the YRENP as the study area and systematically reviewed the intrinsic linkage between the EECC and EDS. A novel integrated assessment framework was constructed by incorporating EECC into the evaluation of EDS for land–sea integrated national parks, incorporating indicators that reflected the characteristics of both marine and terrestrial environments of YRENP. Based on the spatial quantification methods of each indicator, the evaluation results were spatially visualized and analyzed by using ArcGIS. The main conclusions are as follows:
  • The EECC and EDS evaluation framework was constructed. The EECC was evaluated across three subsystems: ecological environment, tourism resources, and socio-economic factors. The evaluation system for the EDS in the YRENP was constructed by overlaying indicators of natural endowments, biodiversity conservation significance, and natural hazard risks. Spatial quantification assessments and evaluation criteria have been conducted for each indicator. The weights of each system layer and each indicator were determined through the AHP method.
  • The EECC tiers demonstrated progressive decline: from high to low, accounting for 8%, 15%, 21%, 25%, and 32% of the total area, respectively. Terrestrial areas exhibited superior performance due to effective ecological conservation and tourism infrastructure. Marine zones showed constrained capacity—high-capacity areas confined mainly to the coastal regions.
  • The EDS grades were distributed across 26%, 21%, 24%, 15%, and 14% within the YRENP. The southern section showed a clear advantage over the northern section, with high-suitability zones demonstrating concentrated spatial clustering. The EDS in the sea area was slightly higher than that of the land areas. High-suitability zones were concentrated in coastal regions, while terrestrial suitability showed a seaward-increasing gradient.
The main theoretical innovation of this work was reflected in establishing an EECC-EDS relationship within a land–sea coordination paradigm. This resolved a critical gap in spatial planning by theoretically linking the concept of carrying capacity with the development-oriented suitability. Methodologically, the construction of a harmonized indicator system integrating marine and terrestrial factors provided a replicable model for coastal protected areas worldwide. In practical terms, the spatial results of EECC and EDS could offer a scientific foundation for functional zoning and differentiated management strategies within the YRENP. They directly informed where to restrict intensive use, where to promote ecotourism development, and how to balance conservation with recreation across the land–sea interface.
Future research should, therefore, focus on integrating national park zoning frameworks with EECC and EDS assessments. This could enable sustainable ecotourism development within ecological conservation. Furthermore, future studies should incorporate temporal dynamics, particularly seasonal variations in key ecological and tourism factors (NDVI, THI, and migratory bird populations), to evaluate how EDS tiers shift across different seasons. Also, the complex interactions and potential conflicts between key evaluation criteria should be investigated, such as the tension between tourism development pressure and ecological vulnerability. Employing analytical approaches, like spatial conflict modeling, or introducing interaction terms (between erosion sensitivity and tourism facility density) would enable more nuanced quantification of the inherent trade-offs in managing land–sea integrated protected areas. This would move beyond our current model towards a more dynamic and interactive assessment framework, ultimately enabling more adaptive and pre-emptive spatial-planning decisions under various scenarios.

Supplementary Materials

The following supporting information can be downloaded at: https://www.mdpi.com/article/10.3390/su17188449/s1, Table S1: Stability of EDS areal classification following ±10% perturbation of key indicator weights.

Author Contributions

Conceptualization, H.W. and J.Y.; methodology, H.W. and J.Y.; software, H.W. and C.Y.; validation, J.Y. and Y.Z.; formal analysis, Y.Z. and Q.W.; investigation, C.Y.; resources, Y.Z. and C.Y.; data curation, Y.Z.; writing—original draft preparation, H.W.; writing—review and editing, J.Y. and Q.W.; visualization, H.W.; supervision, J.Y. and Q.W.; project administration, J.Y.; funding acquisition, J.Y. All authors have read and agreed to the published version of the manuscript.

Funding

This research was funded by the Qingdao Natural Science Foundation (Grant No. 25-1-1-179-zyyd-jch), the Zhejiang Provincial Academy of Oceanography (Grant No. HKY2025KF06WT06(Y)), the China Land Surveying and Planning Institute (Grant No. 2025B1121385), and the Observation and Research Station of Bohai Strait Eco-Corridor, Ministry of Natural Resources, China (Grant No. BH202504).

Institutional Review Board Statement

Not applicable.

Informed Consent Statement

Not applicable.

Data Availability Statement

Applicable data are contained within Appendix A.

Conflicts of Interest

The authors declare no conflicts of interest.

Appendix A

Table A1. Research datasets and sources.
Data TypeYearSource
Land Use2020Resources and Environment Science and Data Center, Chinese Academy of Sciences
NDVI2020Geospatial Data Cloud
DEM2020Geospatial Data Cloud
Sentinel-1 SAR Imagery2021European Space Agency
Coastal Geomorphology2021China’s Third National Land Survey
Temperature Data2021Dongying Statistical Yearbook (2021)
Protected Species Distribution2021Master Plan for Yellow River Estuary National Park (2021–2035)
Bathymetric Model2022National Oceanic and Atmospheric Administration (NOAA)
Tourism Facilities/resources; Road Network and Ports2021Master Plan for Yellow River Estuary National Park (2021–2035)
Night-time Light2022National Oceanic and Atmospheric Administration (NOAA)
Table A2. Grading criteria and threshold sources for each index.
IndexBreak ValuesThreshold Sources
IIIIIIIVV
BAI≤2020–3535–5050–70>70National Standards
Biodiversity Index≤1.821.82–1.981.98–2.172.17–2.36>2.36Natural Breaks
Vegetation Coverage0–0.250.26–0.500.51–0.700.71–0.850.86–1National Standards
River Network Density≤0.190.19–0.430.43–0.660.66–0.97>0.97Natural Breaks
Tourism Facility Capacity≤0.0020.002–0.0070.007–0.0110.011–0.015>0.015Natural Breaks
Tourism Resources Attractiveness>2010–205–102–5≤2Analogous Regional Benchmarks
Tourism Resources Abundance≤0.0010.001–0.0030.003–0.0050.005–0.007>0.007Natural Breaks
Road Network Density≤1.581.58–8.718.71–21.4521.45–37.35>37.35Natural Breaks
Transportation Accessibility (land)≤0.0110.011–0.0190.019–0.0280.028–0.039>0.039Analogous Regional Benchmarks
Transportation Accessibility (sea)≤22–55–99–15>15Analogous Regional Benchmarks
Economic Development Level≤0.260.26–0.720.72–1.641.64–5.47>5.47Natural Breaks
Slope>25°15–25°6–15°2–6°≤2°National Standards
Elevation//<0/≥0Distribution Diagnostics
Water Depth16.86–27.5111.60–16.868.49–11.604.06–8.490–4.06Natural Breaks
Seawater Quality34.22–40.2440.24–46.7546.75–49.8649.86–53.7553.75–59.00Natural Breaks
THI<35, ≥8535–40, 80–8540–45, 75–8045–50, 70–7550–70National Standards
Density of Protect-ed Species≥0.1420.085–0.1420.045–0.0850.016–0.045<0.016Natural Breaks
Ecosystem Significanceswamp wetlands, reeds, alkali reedsriver basins or shallow seas, tidal flatsreservoirs and pondsarable land, aquaculture ponds, salt fieldsurban land, bare landNational Standards
Coastal Erosion SensitivitySilt-mud shorelines/Ecologically restored shorelines/Artificial shorelinesAnalogous Regional Benchmarks
Geological Disaster Risk<−0.057−0.057~−0.033−0.033~−0.013−0.013~0.0090.009~0.117Natural Breaks
"/" indicates that the data is not available or not applicable.

References

  1. Dudley, N. Guidelines for Applying Protected Area Management Categories; IUCN: Gland, Switzerland, 2008; 86p. [Google Scholar]
  2. Ma, B.; Zeng, W.; Xie, Y.; Wang, Z.; Hu, G.; Li, Q.; Cao, R.; Zhuo, Y.; Zhang, T. Boundary delineation and grading functional zoning of Sanjiangyuan National Park based on biodiversity importance evaluations. Sci. Total Environ. 2022, 825, 154068. [Google Scholar] [CrossRef]
  3. Jiang, M.; Wang, Z.; Zhu, G.; Tao, S.; Zhou, H. Chinese nature reserve classification standard based on IUCN protected area categories. Rural Ecol. Environ. 2004, 20, 1–6, (In Chinese with English Abstract). [Google Scholar]
  4. Xie, Y. Comparison and reference of nature reserves in China and IUCN protected area management categories. World Environ. 2016, S1, 53–56, (In Chinese with English Abstract). [Google Scholar]
  5. Ceballos-Lascurain, H. The future of ecotourism. Mex. J. 1987, 2, 13–14. [Google Scholar]
  6. Buckley, R. A framework for ecotourism. Ann. Tour. Res. 1994, 21, 661–669. [Google Scholar] [CrossRef]
  7. Ross, S.; Wall, G. Ecotourism: Towards congruence between theory and practice. Tour. Manag. 1999, 20, 123–132. [Google Scholar] [CrossRef]
  8. Donohoe, H.M.; Needham, R.D. Ecotourism: The evolving contemporary definition. J. Ecotour. 2006, 5, 192–210. [Google Scholar] [CrossRef]
  9. Sobhani, P.; Esmaeilzadeh, H.; Wolf, I.D.; Marcu, M.V.; Lück, M.; Sadeghi, S.M.M. Strategies to manage ecotourism sustainably: Insights from a SWOT-ANP analysis and IUCN guidelines. Sustainability 2023, 15, 11013. [Google Scholar] [CrossRef]
  10. Abuhay, T.; Teshome, E.; Mulu, G. A tale of duality: Community perceptions towards the ecotourism impacts on Simien Mountains National Park, Ethiopia. Reg. Sustain. 2023, 4, 453–464. [Google Scholar] [CrossRef]
  11. Arrow, K.; Bolin, B.; Costanza, R.; Dasgupta, P.; Folke, C.; Holling, C.S.; Jansson, B.-O.; Levin, S.; Mäler, K.-G.; Perrings, C.; et al. Economic growth, carrying capacity, and the environment. Ecol. Econ. 1995, 15, 91–95. [Google Scholar] [CrossRef]
  12. Cupul-Magaña, A.L.; Rodríguez-Troncoso, A.P. Tourist carrying capacity at Islas Marietas National Park: An essential tool to protect the coral community. Appl. Geogr. 2017, 88, 15–23. [Google Scholar] [CrossRef]
  13. Ma, P.; Ye, G.; Peng, X.; Liu, J.; Qi, J.; Jia, S. Development of an index system for evaluation of ecological carrying capacity of marine ecosystems. Ocean Coast. Manag. 2017, 144, 23–30. [Google Scholar] [CrossRef]
  14. de Sousa, R.C.; Pereira, L.C.C.; da Costa, R.M.; Jiménez, J.A. Management of estuarine beaches on the Amazon coast through the application of recreational carrying capacity indices. Tour. Manag. 2017, 59, 216–225. [Google Scholar] [CrossRef]
  15. Canestrelli, E.; Costa, P. Tourist carrying capacity: A fuzzy approach. Ann. Tour. Res. 1991, 18, 295–311. [Google Scholar] [CrossRef]
  16. Schwartz, Z.; Stewart, W.; Backman, E. Visitation at capacity-constrained tourist destinations: Exploring revenue management at a national park. Tour. Manag. 2012, 33, 500–508. [Google Scholar] [CrossRef]
  17. Manning, R. Parks and Carrying Capacity: Commons Without Tragedy; Island Press: Washington, DC, USA, 2007; pp. 23–28. [Google Scholar]
  18. Wang, J.; Huang, X.; Gong, Z.; Cao, K. Dynamic assessment of tourism carrying capacity and its impacts on tourism economic growth in urban tourism destinations in China. J. Destin. Mark. Manag. 2020, 15, 100383. [Google Scholar] [CrossRef]
  19. Corbau, C.; Benedetto, G.; Congiatu, P.P.; Simeoni, U.; Carboni, D. Tourism analysis at Asinara Island (Italy): Carrying capacity and web evaluations in two pocket beaches. Ocean Coast. Manag. 2019, 169, 27–36. [Google Scholar] [CrossRef]
  20. Chen, C.L.; Bau, Y.P. Establishing a multi-criteria evaluation structure for tourist beaches in Taiwan: A foundation for sustainable beach tourism. Ocean Coast. Manag. 2016, 121, 88–96. [Google Scholar] [CrossRef]
  21. Li, L.; Ye, X.J.; Wang, X.L. Evaluation of Rural Tourism Carrying Capacity Based on Ecological Footprint Model. Wirel. Commun. Mob. Comput. 2022, 2022, 4796908. [Google Scholar] [CrossRef]
  22. Lobo, H.A.S.; Trajano, E.; Marinho, M.d.A.; Bichuette, M.E.; Scaleante, J.A.B.; Scaleante, O.A.F.; Rocha, B.N.; Laterza, F.V. Projection of tourist scenarios onto fragility maps: Framework for determination of provisional tourist carrying capacity in a Brazilian show cave. Tour. Manag. 2013, 35, 234–243. [Google Scholar] [CrossRef]
  23. Yang, X.P.; Weng, G.M. A study on the mechanism of coupling coordination development of tourism carrying capacity and application research. Inf. Technol. J. 2013, 12, 6229–6234. [Google Scholar] [CrossRef]
  24. Cisneros, M.A.H.; Sarmiento, N.V.R.; Delrieux, C.A.; Piccolo, M.C.; Perillo, G.M.E. Beach carrying capacity assessment through image processing tools for coastal management. Ocean Coast. Manag. 2016, 130, 138–147. [Google Scholar] [CrossRef]
  25. Yang, X.P.; Weng, G.M. A review of studies on tourism environment carrying capacity. Tour. Trib. 2019, 34, 96–105, (In Chinese with English Abstract). [Google Scholar]
  26. Collins, M.G.; Steiner, F.R.; Rushman, M.J. Land-use suitability analysis in the United States: Historical development and promising technological achievements. Environ. Manag. 2001, 28, 611–621. [Google Scholar] [CrossRef]
  27. Marull, J.; Pino, J. A land suitability index for strategic environmental assessment in metropolitan areas. Landsc. Urban Plan. 2001, 81, 200–212. [Google Scholar] [CrossRef]
  28. Stoms, D.M.; McDonald, J.M.; Davis, F.W. Fuzzy assessment of land suitability for scientific research reserves. Environ. Manag. 2002, 29, 545–558. [Google Scholar] [CrossRef] [PubMed]
  29. Huang, W. Research on the Suitability of Tourism Development for Uninhabited Islands in Qinzhou. Master’s Thesis, Guangxi University, Nanning, China, 2017. (In Chinese with English Abstract). [Google Scholar]
  30. Liu, Y.; Lv, X.; Qin, X.; Guo, H.; Yu, Y.; Wang, J.; Mao, G. An integrated GIS-based analysis system for land-use management of lake areas in urban fringe. Landsc. Urban Plan. 2007, 82, 233–246. [Google Scholar] [CrossRef]
  31. Huang, P.; Chen, Y.; Zhang, Z.W. Evaluation research on island spatial suitable zoning based on GIS: A Case Study on Lingshan Island. China Popul. Resour. Environ. 2016, 26, 145–148, (In Chinese with English Abstract). [Google Scholar]
  32. Withanage, N.C.; Wijesinghe, D.C.; Mishra, P.K.; Abdelrahman, K.; Mishra, V.; Fnais, M.S. An ecotourism suitability index for a world heritage city using GIS-multi criteria decision analysis techniques. Heliyon 2024, 10, e31585. [Google Scholar] [CrossRef]
  33. Boavida, I.; Rocha, J.; Ferreira, C.C. Exploring the impacts of future tourism development on land use/cover changes. Appl. Geogr. 2016, 77, 82–91. [Google Scholar] [CrossRef]
  34. Fan, J. Territorial System of Human-environment Interaction: A theoretical cornerstone for comprehensive research on formation and evolution of geographical pattern. Acta Geogr. Sin. 2018, 73, 597–607, (In Chinese with English Abstract). [Google Scholar]
  35. Yue, W.Z.; Wang, T.Y. Logical problems on the evaluation of resources and environment carrying capacity for territorial spatial planning. Chin. Land Sci. 2019, 33, 1–8, (In Chinese with English Abstract). [Google Scholar]
  36. Sheng, K.R.; Fan, J. The formation mechanism of regional function: An analysis based on the theory of Man-Earth Areal System. Econ. Geogr. 2018, 38, 11–19, (In Chinese with English Abstract). [Google Scholar]
  37. Wang, Y.F.; Fan, J.; Zhou, K. Territorial function optimization regionalization based on the integration of Double Evaluation. Geogr. Res. 2019, 38, 2415–2429, (In Chinese with English Abstract). [Google Scholar]
  38. Gao, J.Z.; An, T.T.; Shen, J.W.; Zhang, K.C.; Yin, Y.; Zhao, R.; He, G.S.; Hynes, S.; Jattak, Z.U. Development of a land-sea coordination degree index for coastal regions of China. Ocean Coast. Manag. 2022, 230, 106370. [Google Scholar] [CrossRef]
  39. Yue, W.Z.; Hou, B.; Ye, G.Q.; Wang, Z.W. China’s land-sea coordination practice in territorial spatial planning. Ocean Coast. Manag. 2023, 237, 106545. [Google Scholar] [CrossRef]
  40. Li, J.P.; Weng, G.M.; Pan, Y.; Li, C.H.; Wang, N. A scientometric review of tourism carrying capacity research: Cooperation, hotspots, and prospect. J. Clean. Prod. 2021, 325, 129278. [Google Scholar] [CrossRef]
  41. Dong, X.L.; Gao, S.; Xu, A.R.; Luo, Z.K.; Hu, B.B. Research on tourism carrying capacity and the coupling coordination relationships between its influencing factors: A case study of China. Sustainability 2022, 14, 15124. [Google Scholar] [CrossRef]
  42. Chen, Y.; Liu, S.; Ma, W.; Zhou, Q. Assessment of the carrying capacity and suitability of spatial resources and the environment and diagnosis of obstacle factors in the Yellow River Basin. Int. J. Environ. Res. Public Health 2023, 20, 3496. [Google Scholar] [CrossRef]
  43. Chen, G.Q.; Wang, S.F. Evaluation of urban resource environmental carrying capacity and land spatial development suitability in a semiarid area of the Yellow River Basin. Sustainability 2023, 15, 12411. [Google Scholar] [CrossRef]
  44. Zhou, Y.; Maumbe, B.K.; Deng, J.; Selin, S.W. Resource-based destination competitiveness evaluation using a hybrid analytic hierarchy process (AHP): The case study of West Virginia. Tour. Manag. Perspect. 2015, 15, 72–80. [Google Scholar] [CrossRef]
  45. Zhang, X.; Li, S. Monitoring and Analysis on Ecological Environment in Near-shore Waters of Yellow River Estuary During 2015–2020. Bull. Soil Water Conserv. 2022, 42, 139–147, (In Chinese with English Abstract). [Google Scholar]
  46. Niu, X.; Ni, H.; Chen, G.; Zhang, D.; Zhang, J.; Zhang, J.; Wu, J. Evaluation of ecological conservation importance of Fujian Province. Acta Ecol. Sin. 2022, 42, 1130–1141, (In Chinese with English Abstract). [Google Scholar] [CrossRef]
  47. Ghosh, P.; Lepcha, K. Weighted linear combination method versus grid based overlay operation method—A study for potential soil erosion susceptibility analysis of Malda district (West Bengal) in India. Egypt. J. Remote Sens. Space Sci. 2019, 22, 95–115. [Google Scholar] [CrossRef]
  48. Wu, A.; Zhong, Z.; Yu, S.; Sui, X.; Yao, X.; Zou, L.; Wang, T.; Bian, C.; Jiang, W. The Current Status and 20 Years of Evolution of Nutrient Structure in the Yellow River Estuary. Prog. Fish. Sci. 2024, 45, 1–13, (In Chinese with English Abstract). [Google Scholar]
  49. Hsiao, C.Y.; Kuo, C.M.; Tuan, C.L. Island ecological tourism: Constructing indicators of the tourist service system in the penghu national scenic area. Front. Ecol. Evol. 2021, 9, 708344. [Google Scholar] [CrossRef]
  50. Ning, R.R.; Wang, D.; Tian, X.P.; Zhang, Y.W.; Zhou, Z.X.; Luo, F.B. Analysis of Ground Settlement in the Yellow River Delta and Projection of Seawater Inundation. Adv. Earth Sci. 2023, 38, 296–308, (In Chinese with English Abstract). [Google Scholar]
  51. Harishnaika, N.; Arpitha, M.; SA, A.; Ashwini, K.S. Geospatial investigation of site suitability for ecotourism development using AHP and GIS techniques in Uttara Kannada district, Karnataka state, India. World Dev. Sustain. 2023, 3, 100114. [Google Scholar] [CrossRef]
  52. Huang, Q.; Zhou, C.; Li, M.C.; Ma, Y.; Hua, S. An Approach for Mapping Ecotourism Suitability Using Machine Learning: A Case Study of Zhangjiajie, China. Land 2024, 13, 1188. [Google Scholar] [CrossRef]
  53. Morteza, Z.; Reza, F.M.; Seddiq, M.M.; Sharareh, P.; Jamal, G. Selection of the optimal tourism site using the ANP and fuzzy TOPSIS in the framework of Integrated Coastal Zone Management: A case of Qeshm Island. Ocean Coast. Manag. 2016, 130, 179–187. [Google Scholar] [CrossRef]
  54. Ronizi, S.R.A.; Mokarram, M.; Negahban, S. Utilizing multi-criteria decision to determine the best location for the ecotourism in the east and central of Fars province, Iran. Land Use Policy 2020, 99, 105095. [Google Scholar] [CrossRef]
  55. Nino, K.; Mamo, Y.; Mengesha, G.; Kibret, K.S. GIS based ecotourism potential assessment in Munessa Shashemene Concession Forest and its surrounding area, Ethiopia. Appl. Geogr. 2017, 82, 48–58. [Google Scholar] [CrossRef]
  56. Shokri, M.R.; Mohammadi, M. Effects of recreational SCUBA diving on coral reefs with an emphasis on tourism suitability index and carrying capacity of reefs in Kish Island, the northern Persian Gulf. Reg. Stud. Mar. Sci. 2021, 45, 101813. [Google Scholar] [CrossRef]
  57. Adrianto, L.; Kurniawan, F.; Romadhon, A.; Bengen, D.G.; Sjafrie, N.D.M.; Damar, A.; Kleinertz, S. Assessing social-ecological system carrying capacity for urban small island tourism: The case of Tidung Islands, Jakarta Capital Province, Indonesia. Ocean Coast. Manag. 2021, 212, 105844. [Google Scholar] [CrossRef]
  58. Zeng, Y.; Filimonau, V.; Wang, L.E.; Zhong, L. The role of seasonality in assessments of conflict tendency between tourism development and ecological preservation in protected areas: The case of protected areas in China. J. Environ. Manag. 2022, 304, 114275. [Google Scholar] [CrossRef]
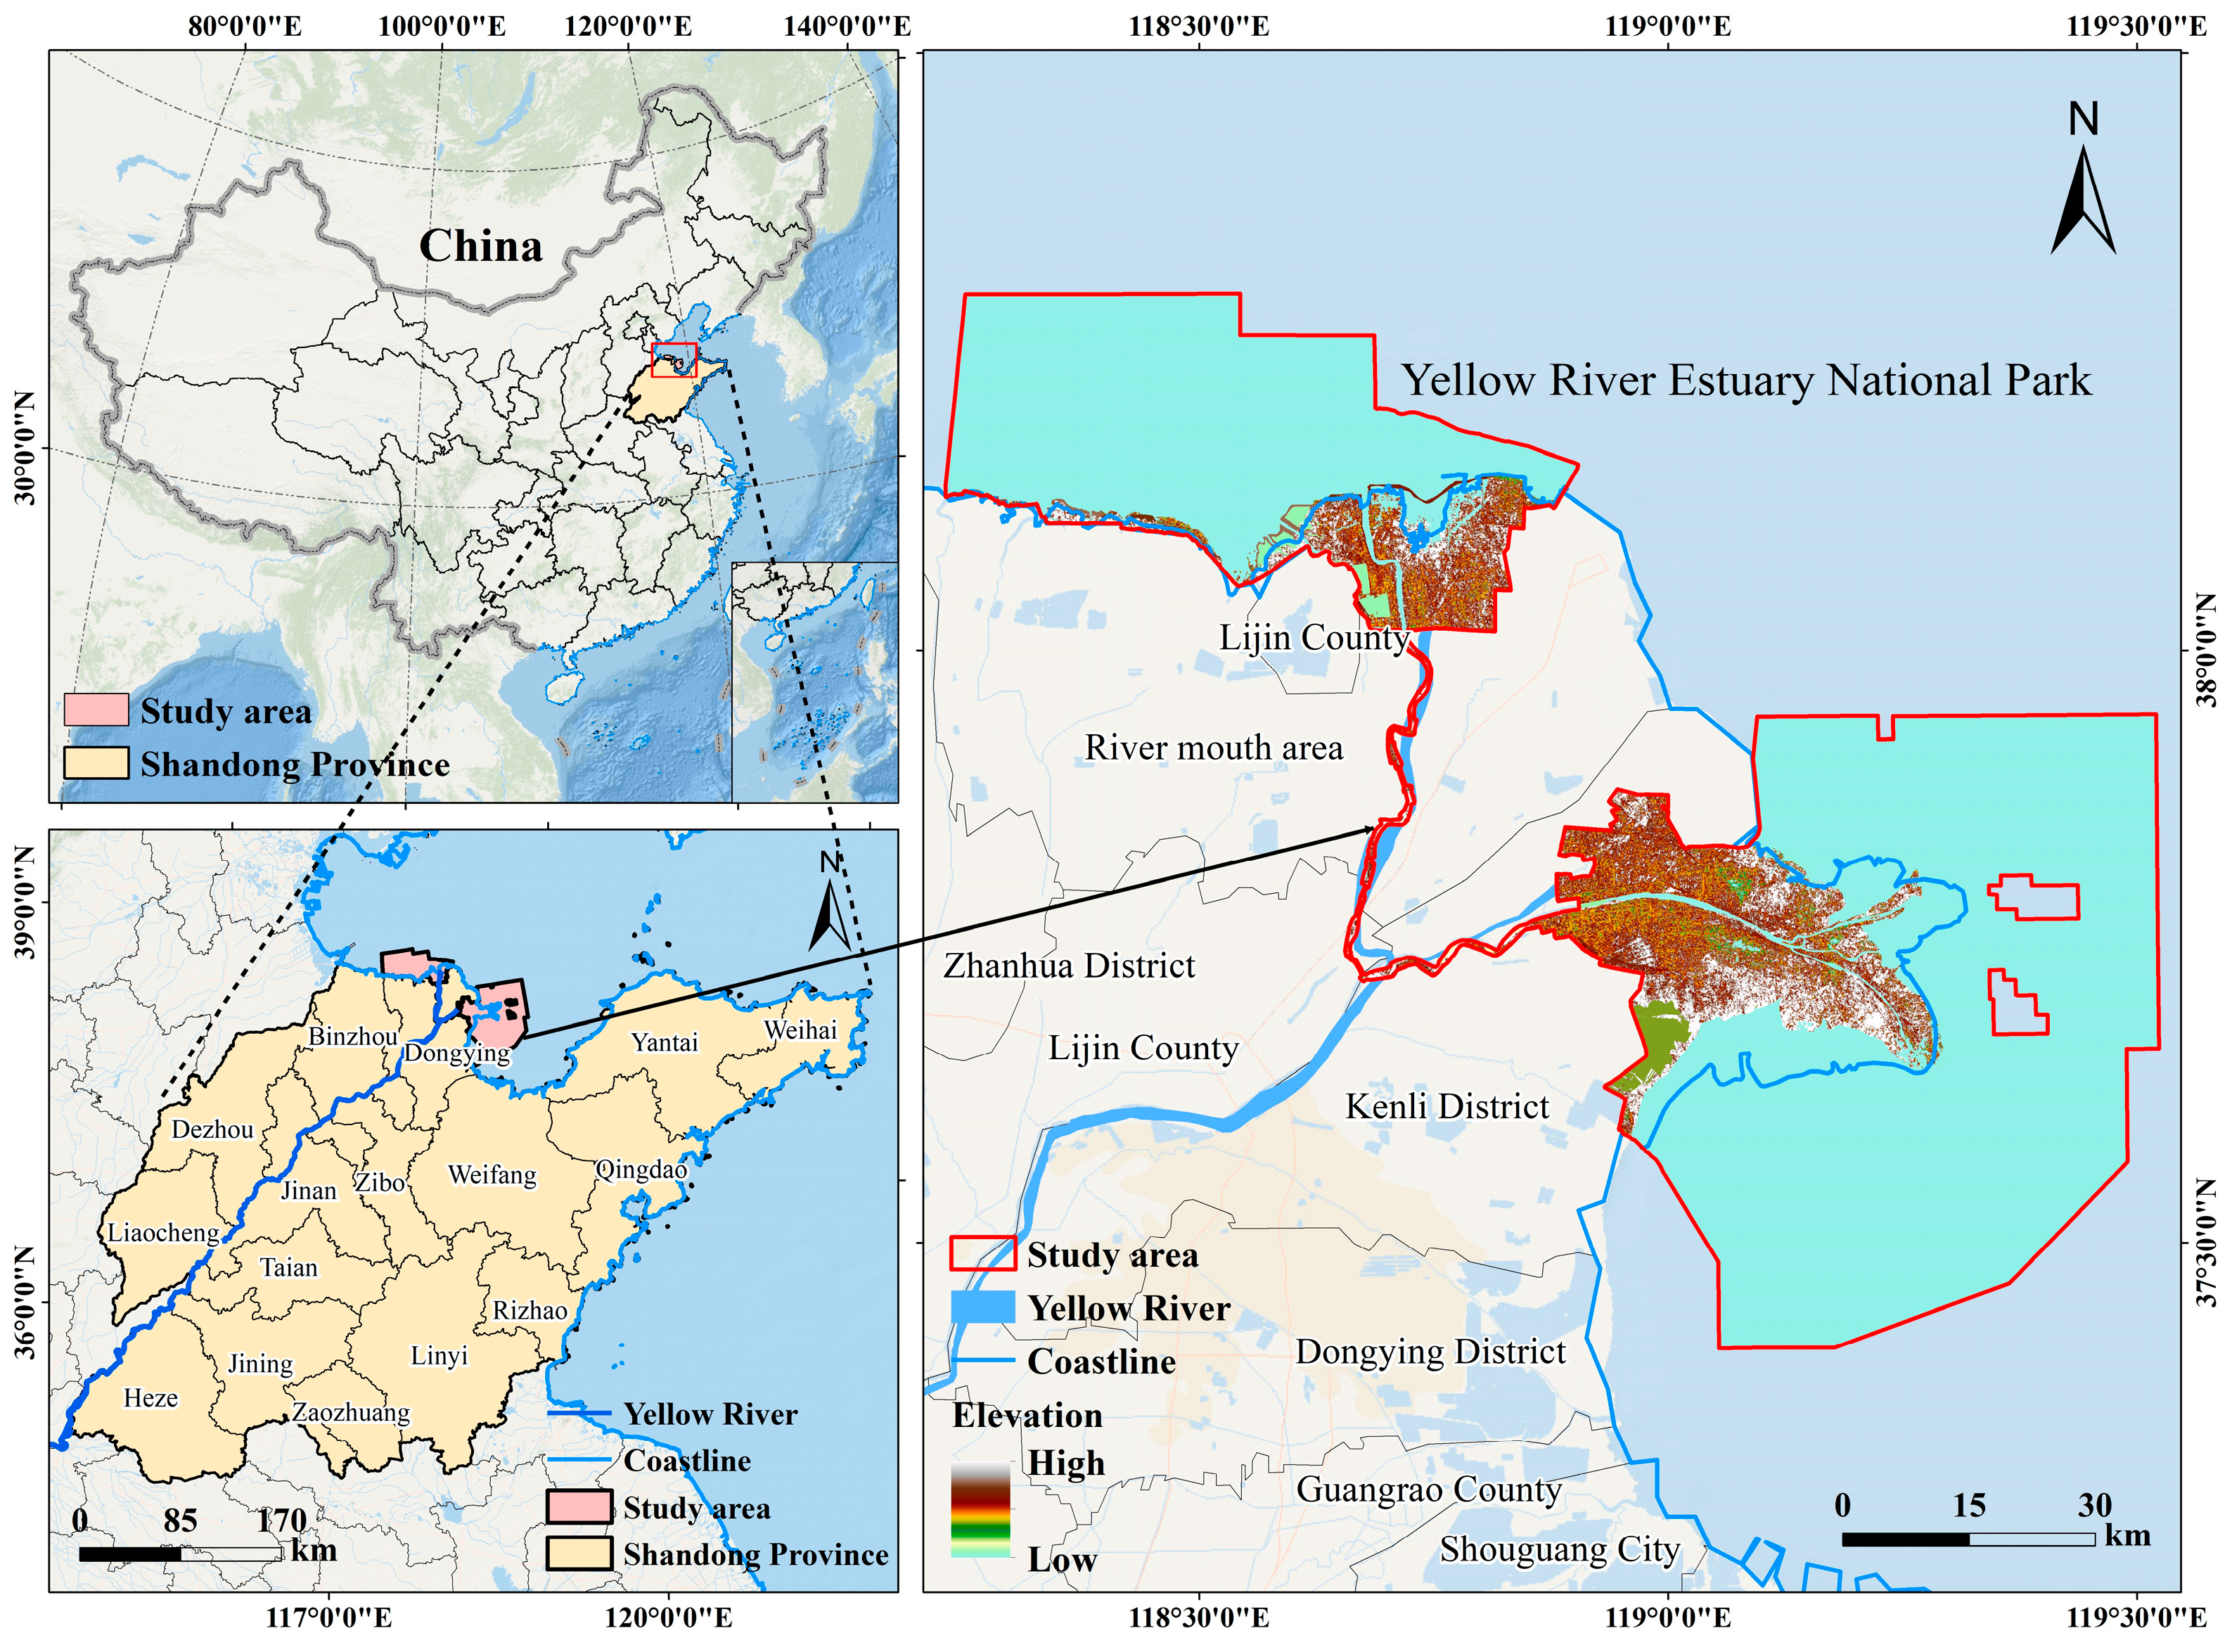
Figure 1. Location of the Yellow River Estuary National Park.
Sustainability 17 08449 g001
Figure 2. Flowchart of Theoretical Framework.
Sustainability 17 08449 g002
Figure 3. The spatial distribution of each subsystem of EECC.
Sustainability 17 08449 g003
Figure 4. The spatial distribution of the comprehensive evaluation of EECC.
Sustainability 17 08449 g004
Figure 5. Area proportion of evaluation results for each EECC index.
Sustainability 17 08449 g005
Figure 6. The spatial distribution of each subsystem of EDS.
Sustainability 17 08449 g006
Figure 7. The spatial distribution of the comprehensive evaluation of EDS.
Sustainability 17 08449 g007
Figure 8. Area proportion of evaluation results for each EDS index.
Sustainability 17 08449 g008
Table 1. EDS Evaluation Index System.
TargetSubsystemsIndexIndex Interpretation and DirectionWeights (Terrestrial)Weights (Marine)
EDSEECC
(0.451)
Ecological Environment
(0.140)
Biological Abundance Index (BAI)The differences in the number of biological species among various ecosystem types within a unit area. Positive index.0.071
Biodiversity IndexThe diversity and richness of species within an ecosystem. Positive index. 0.140
Vegetation CoverageThe percentage of the vertical projected area of vegetation per unit area. Positive index.0.058
River Network DensityThe ratio of the total length of main and tributary streams to the basin area. Positive index.0.012
Tourism Resources
(0.223)
Tourism Facility CapacityThe scale of ecotourism activities that can be supported by the tourism facilities. Positive index.0.0670.067
Tourism Resources AttractivenessThe quality of tourism resources and visitor appeal within the national park. Positive index.0.0870.087
Tourism Resources AbundanceThe density of tourism resources. Positive index.0.0690.069
Socio-Economic
(0.087)
Road Network DensityThe density of transportation infrastructure. Positive index.0.026
Transportation AccessibilityThe accessibility of tourists to transportation infrastructure. Positive index.0.0390.087
Economic Development LevelRegional socio-economic development status. Positive index.0.022
Natural Endowments
(0.197)
ElevationVertical height above sea level. Positive index based on regional diagnostics.0.018
SlopeMaximum rate of elevation changes across a surface. Negative index.0.034
Water DepthDepth of sea water within the national park. Negative index. 0.039
Seawater QualityNutrient levels in seawater, expressed by N:P ratios. Positive index. 0.127
Temperature-Humidity Index (THI)A bioclimatic metric quantifying heat stress by integrating air temperature and relative humidity. Positive index.0.1450.163
Biodiversity Conservation Significance
(0.220)
Density of Protected SpeciesDensity of nationally protected species in China. Negative index.0.1760.176
Ecosystem SignificanceEcosystem importance based on wetland attributes and ecosystem service functions. Negative index.0.0440.044
Natural Hazard Risks
(0.133)
Geological Disaster RiskRates of surface deformation in terrestrial areas of the national park. Negative index.0.053
Coastal Erosion SensitivitySensitivity of coastal geomorphological type to human activities. Negative index.0.080
Table 2. Spatial quantification methods for each Index.
IndexSpatial Quantification Methods
BAIBAI = Abio × (0.35 × Forest + 0.21 × Grassland + 0.28 × Wetland + 0.11 × Cropland + 0.04 × Construction Land + 0.01 × Unused Land)/Area(1)
where Abio is the normalized coefficient of the BAI, with a reference value of 511.26.
Biodiversity IndexUtilize the Shannon–Wiener index (H′) for biodiversity characterization:
H = i = 1 S P i log 2 P i (2)
where H′ is the Shannon–Wiener index; S is the total number of species in the sample; Pi is the proportion of the i-th species relative to the total number of individuals.
Vegetation Coverage C i = N D V I N D V I s o i l N D V I v e g N D V I s o i l (3)
where Ci is the vegetation coverage of the i-th evaluation grid cell; NDVI is the Normalized Difference Vegetation Index of the evaluation grid cell; N D V I s o i l is the NDVI value for areas that are completely bare soil or devoid of vegetation cover; N D V I v e g is the NDVI value for pixels that are fully covered by vegetation. This study used the upper and lower bounds of the NDVI at a 0.5% confidence level.
River Network DensityUtilizing DEM data to calculate river network density, a minimum catchment area threshold of 300 km2 was set through trial-and-error comparisons. Apply the Strahler stream order classification, and the river network was determined to be divided into four levels. The calculation formula is as follows:
D = L A (4)
where D is the river network density, ∑L is the total length of rivers in the area, and ∑A is the total terrestrial area of the region.
Tourism Facility CapacityConducting kernel density analysis on tourism facility point data derived from Point of Interest (POI) data.
Tourism Resources AttractivenessEstablishing buffer zones centered on tourism resources within the YRENP, with intervals of 1 km and a maximum buffer radius of 4 km, to perform buffer zone analysis.
Tourism Resources AbundancePerforming kernel density analysis on tourism resources within the YRENP, with a radius setting of 2 km.
Road Network DensityUtilizing the “Create Fishnet” tool in ArcGIS to calculate the length of roads within each grid cell to determine road network density. The formula expression is identical in form to Equation (4), but represents a different physical context.
where D is road network density; ∑L is the total length of roads at all levels; ∑A is the total terrestrial area of the national park.
Transportation AccessibilityFor the land area, GIS-based road accessibility analysis was applied, calculating the accessibility of transportation arteries at a speed of 30 km/h. For the marine area, distance analysis tools within ArcGIS were utilized to calculate the Euclidean distance from the sea area to the wharfs.
Economic Development LevelEmploying night-time light data to simulate the level of economic development within the YRENP, the VIIRS night-time light data’s projection coordinate system was transformed into a Lambert projection, using bilinear resampling to eliminate interfering light factors, thereby deriving the night-time light results.
ElevationUtilizing ArcGIS to extract DEM data through masking, and subsequently processed the projected raster to obtain the elevation.
SlopeUtilizing ArcGIS, processed the elevation raster data to generate a slope raster map.
Water DepthUsing ArcGIS’s 3D Analyst tools to create a TIN (Triangulated Irregular Network), converted the TIN layer into raster data to obtain a depth layer, and after masking, derived the spatial distribution of water depth.
Seawater QualitySpatial distribution of nutrient N:P ratios in the YRENP marine area was generated using Kriging interpolation, with input data sourced from [45].
THI T H I = 1.8 t + 32 0.55 1 f 1.8 t 26 (5)
where THI is the Temperature-Humidity Index, t is air temperature in degrees Celsius, and f is relative humidity.
Density of Protected SpeciesProtected species distribution was processed in ArcGIS using kernel density estimation to generate a density raster of protected species.
Ecosystem SignificanceUsing NDVI and integrating Maximum Likelihood Classification with visual interpretation, classify land-use types from remote sensing imagery. Validated the classifications in ENVI 5.6 and categorized the area into various types including urban land, river basins or shallow seas, arable land, aquaculture ponds, tidal flats, swamp wetlands, reservoirs and ponds, bare land, salt fields, reeds, and alkali reeds, then assigned values based on their ecological significance. The grading criteria are shown in Table A2 in Appendix A.
Geological Disaster RiskLeveraging InSAR (Interferometric Synthetic Aperture Radar) with Sentinel-1A ascending track remote sensing data for interferometric processing, the derived interferograms were subjected to correlation processing to determine the annual average rate of ground deformation in the YRENP.
Coastal Erosion SensitivityThe area for erosion sensitivity assessment was designated as a 3-km-wide strip landward of the coastline [46]. Various coastal geomorphological types within the study area were assigned values. The grading criteria are shown in Table A2 in Appendix A.
Disclaimer/Publisher’s Note: The statements, opinions and data contained in all publications are solely those of the individual author(s) and contributor(s) and not of MDPI and/or the editor(s). MDPI and/or the editor(s) disclaim responsibility for any injury to people or property resulting from any ideas, methods, instructions or products referred to in the content.