Article

Quantification of Biodiversity Loss in Building Life Cycle Assessment: Insights Towards Regenerative Design

by
Emma Sofie Terkildsen
1,
August Sørensen
2 and
Aliakbar Kamari
1,*
1
Department of Civil and Architectural Engineering, Aarhus University, 8000 Aarhus C, Denmark
2
EKOLAB, Vestergade 48H, 2.tv., 8000 Aarhus C, Denmark
*
Author to whom correspondence should be addressed.
Sustainability 2025, 17(18), 8369; https://doi.org/10.3390/su17188369
Submission received: 24 June 2025 / Revised: 12 September 2025 / Accepted: 15 September 2025 / Published: 18 September 2025

Abstract

This study examines the incorporation of biodiversity loss into the Life Cycle Assessment (LCA) of buildings, with a specific focus on the Danish construction sector. Motivated by the ecological crisis reflected in the Planetary Boundaries and the Kunming-Montreal Global Biodiversity Framework, it addresses regulatory gaps that prioritise climate indicators, such as Global Warming Potential (GWP), while largely ignoring biodiversity. The study analyses 73 Danish building cases for GWP and a custom method linking material quantities to ReCiPe 2016 endpoint data for biodiversity loss. The findings indicate key methodological issues include the quality of Environmental Product Declarations (EPDs), the regional relevance of assessment methods, and differences in European standards. While average GWP levels mostly meet upcoming Danish limits, variability, especially in Office and Other building categories, supports the need for differentiated regulations. Results show embodied impacts mainly drive GWP, while biodiversity loss is split between embodied and operational impacts. Detached and Terraced houses, which use more bio-based materials, have low embodied GWP but higher biodiversity loss, highlighting trade-offs in regenerative design. The shift in GWP impacts to end-of-life phases stresses the need to consider forest dynamics. Operational impacts rank similarly, despite differences in the data. The study concludes that progress toward regenerative design requires addressing climate and biodiversity together to avoid shifting environmental burdens.

1. Introduction

Due to the continued exploitation of the Earth and its natural resources, the planet has been pushed into a state of emergency. This is clearly illustrated through the Planetary Boundaries framework. First developed in 2009, the model is based on nine crucial biophysical processes that maintain the Earth in its Holocene-like state [1]. The framework indicates that six out of the nine boundaries had been transgressed due to habitat destruction, pollution and disruption of the natural cycle. As a result, the robustness of the Earth’s natural systems, which provide well-being for mankind and animals alike, has been reduced significantly. Climate Change has been a focus for many years, and its attention increased with the release of the Paris Agreement in 2016 [2,3], which set specific climate goals. The agreement states that the pursued increase in global temperature is 1.5 °C; however, a report from the UN International Panel on Climate Change from 2018 (IPCC 2018 report) presents a clear picture of the consequences of an increase in global temperature by 2 °C. An increase in this scale will likely result in the destruction of ecosystems. Ecosystem services refer to the benefits that people derive from nature. These include provisioning services such as food and water; regulating services, including flood, drought, and disease control; supporting services such as soil formation and nutrient cycling; and cultural services, which offer recreational, spiritual, scientific, and other non-material benefits [4,5]. One of the most significant impacts of recognising ecosystem services is the way it shifts our perspective, highlighting the interdependence between humans and nature. This understanding positions natural ecosystems as vital assets that contribute to inclusive wealth, well-being and sustainability. The continuous disruption and transformation of the Earth’s natural cycles continually challenge its functions, such as carbon sequestration, moisture recycling, and biodiversity, all of which are crucial for the health of the Earth’s ecosystem [6]. Achieving long-term well-being depends on maintaining a balance among all forms of capital, whether that be human, social, built or natural. This shift in thinking is crucial for shaping a sustainable and desirable future for humanity [7].
Studies have shown that the still-increasing criticality of biodiversity loss has brought the world into its sixth mass extinction due to the global acceleration of the pace of species extinction [8,9]. This has increased governmental awareness of the issue, and biodiversity conservation has become an environmental issue equally as urgent as climate change [10]. According to IPBES (Intergovernmental Science-Policy Platform on Biodiversity and Ecosystem Services) biodiversity loss is defined as “the reduction of any kind of biological diversity (i.e., diversity at the genetic, species and ecosystem levels) lost in a particular area through death (including extinction), destruction or manual removal; it can refer to many scales, from global extinction to population extinctions, resulting in decreased total diversity at the same scale”. In 2022, the UN Biodiversity Conference in Montreal resulted in an agreement aiming to address global biodiversity loss, similar to the Paris Agreement on climate change, and it was adopted by 196 countries [11]. This agreement is known as the Kunming-Montreal Global Biodiversity Framework, which sets ambitious targets for 2030 and goals for 2050.
The construction and operation of buildings are responsible for 39% of global carbon emissions [12] and 60% of raw material consumption. To mitigate the environmental impacts of construction materials and energy consumption, environmental considerations must be incorporated into all products and services. Many planetary boundaries have already been crossed and are in critical states. Being sustainable and aiming towards net-zero impacts may not be enough if the natural balance is not restored. Instead, a regenerative design approach must be adopted. The term “regenerative development” was first defined in 1995 as an approach to co-evolution between humans and all other species that allows the earth to thrive [13,14]. However, regenerative design not only seeks to restore the balance between nature and humanity. According to Reed [15], sustainability strives towards doing ‘less bad’ with a goal of reaching net-zero emissions, while regenerative design seeks to do ‘more good’ than harm, resulting in net-positive emissions. This also encompasses a whole system perspective, which is why studies have suggested applying a regenerative mindset alongside a circular material economy [16]. Many practitioners of the regenerative paradigm also believe that an understanding of ecosystems is essential, as a single building should be viewed as an organism within a larger ecosystem; hence, it fulfils its own function to help sustain the area surrounding it, also known as biomimicry [15,17,18]. According to ISO 18458:2015 [19], ‘biomimicry’ is defined as “philosophy and interdisciplinary design approach taking nature as a model to meet challenges of sustainable development”. In contrast, ‘biomimetics’ is defined as “interdisciplinary cooperation of biology and technology or other fields of innovation to solve practical problems through the function analysis of biological systems, their abstraction into models, and the transfer into and application of these models”.
Emissions from material and energy consumption can be tracked through Life Cycle Assessment (LCA). LCA tracks the potential environmental impacts from material extraction to production and use, encompassing the end-of-life scenario, through its approach to waste management, reuse, and recycling. This comprehensive assessment covers a broad range of environmental impacts, rendering the method particularly effective in avoiding problem shifting. LCA meets all the essential criteria for an appropriate biodiversity evaluation, as it is both interdisciplinary, inclusive, comprehensive and reproducible [20,21]. During the life cycle of a building, different types of biodiversity are in play, which can generally be distinguished as off-site biodiversity and on-site biodiversity [22]. Off-site biodiversity refers to all the ecosystems affected outside the actual building site. These effects can have numerous sources, such as land changes resulting from forestry or the release of toxins and pollution from material production, as well as poor waste management. Conversely, on-site biodiversity refers to the impact on ecosystems and various species within the construction site. Clearing areas for construction robs many species of their home and food sources.
Despite increasing global awareness and international commitments to halt biodiversity loss, current practices in the construction industry fail to adequately address the environmental impacts associated with biodiversity loss during construction and operation activities. While methods like LCA are widely used to measure carbon emissions, a critical gap remains in their application to biodiversity evaluation. As a result, businesses lack the guidance and tools necessary to measure, report, and mitigate their effects on both on-site and off-site biodiversity. This gap represents a major obstacle to achieving the transparency and accountability demanded to meet international biodiversity targets. To enable the construction industry to take responsibility for its role in biodiversity preservation, stakeholders, including companies and practitioners, must develop a deeper understanding of how design decisions and construction practices contribute to biodiversity loss. A comprehensive data foundation can support this understanding, enabling practitioners to benchmark their projects against others of similar scope and nature.
In Denmark, requirements for calculating the climate change impact of buildings are addressed through regulations; thus, a national framework has been established for making LCAs of building projects. This provides a concrete foundation and possibility to broaden the national LCA scope to encompass other environmental factors such as biodiversity.
In light of the urgent need to safeguard ecosystems, this study aims to establish a data foundation for evaluating biodiversity loss in Danish buildings by developing and using an LCA methodology. This dataset encompasses LCA calculations for 73 Danish building cases, spanning various typologies and material compositions. Each case is evaluated in terms of both climate change and biodiversity loss. Accordingly, the following research question (RQ) is proposed:
  • RQ: How do buildings with different typologies and material compositions perform in relation to their impact on climate change and biodiversity loss?
By addressing the RQ, the study’s interrelated research contributions (C) are as follows:
C1: An overview of key LCA standards is provided, along with a review of commonly used databases and tools, highlighting their respective strengths and limitations (Section 2.1). Additionally, current and forthcoming Danish LCA regulations are examined. The GWP results of the 73 case buildings are compared against these regulations, offering insights into how well current practices align with national sustainability goals (Section Comparison with the New Danish Regulations).
C2: As ecological concerns continue to gain prominence in urban development and construction, this study explores the potential of LCA to quantify biodiversity loss. It reviews current methodological developments and discusses their limitations in the construction context (Section 2.1). Furthermore, it investigates regulatory initiatives and practices related to biodiversity accounting and connects them to broader LCA processes (Section 2.1.1 and Section 2.2).
C3: Regenerative design often emphasises an increased use of bio-based materials. This study examines current regulations and standards for this material category and assesses the methods used to evaluate their environmental impacts (Section 2.3). Since bio-based materials are featured in many case buildings, their influence on GWP and biodiversity loss is analysed and discussed in detail (Section 5.2).
C4: This study employs both a midpoint and an endpoint impact, as the LCA results for both GWP and biodiversity loss from the 73 case buildings are analysed and interpreted (Section 4.2 and Section 4.3). The findings are compared to identify variations in environmental impacts based on material choices, operational data, and building typologies (Section 5.2), providing valuable insights for improving sustainable development in construction.
Figure 1 presents the research workflow and structure, featuring a coherent development across all relevant topics, which is essential to ensuring that the research aims and contributions are comprehensively addressed.

2. Background

2.1. Building Life Cycle Assessment (LCA)

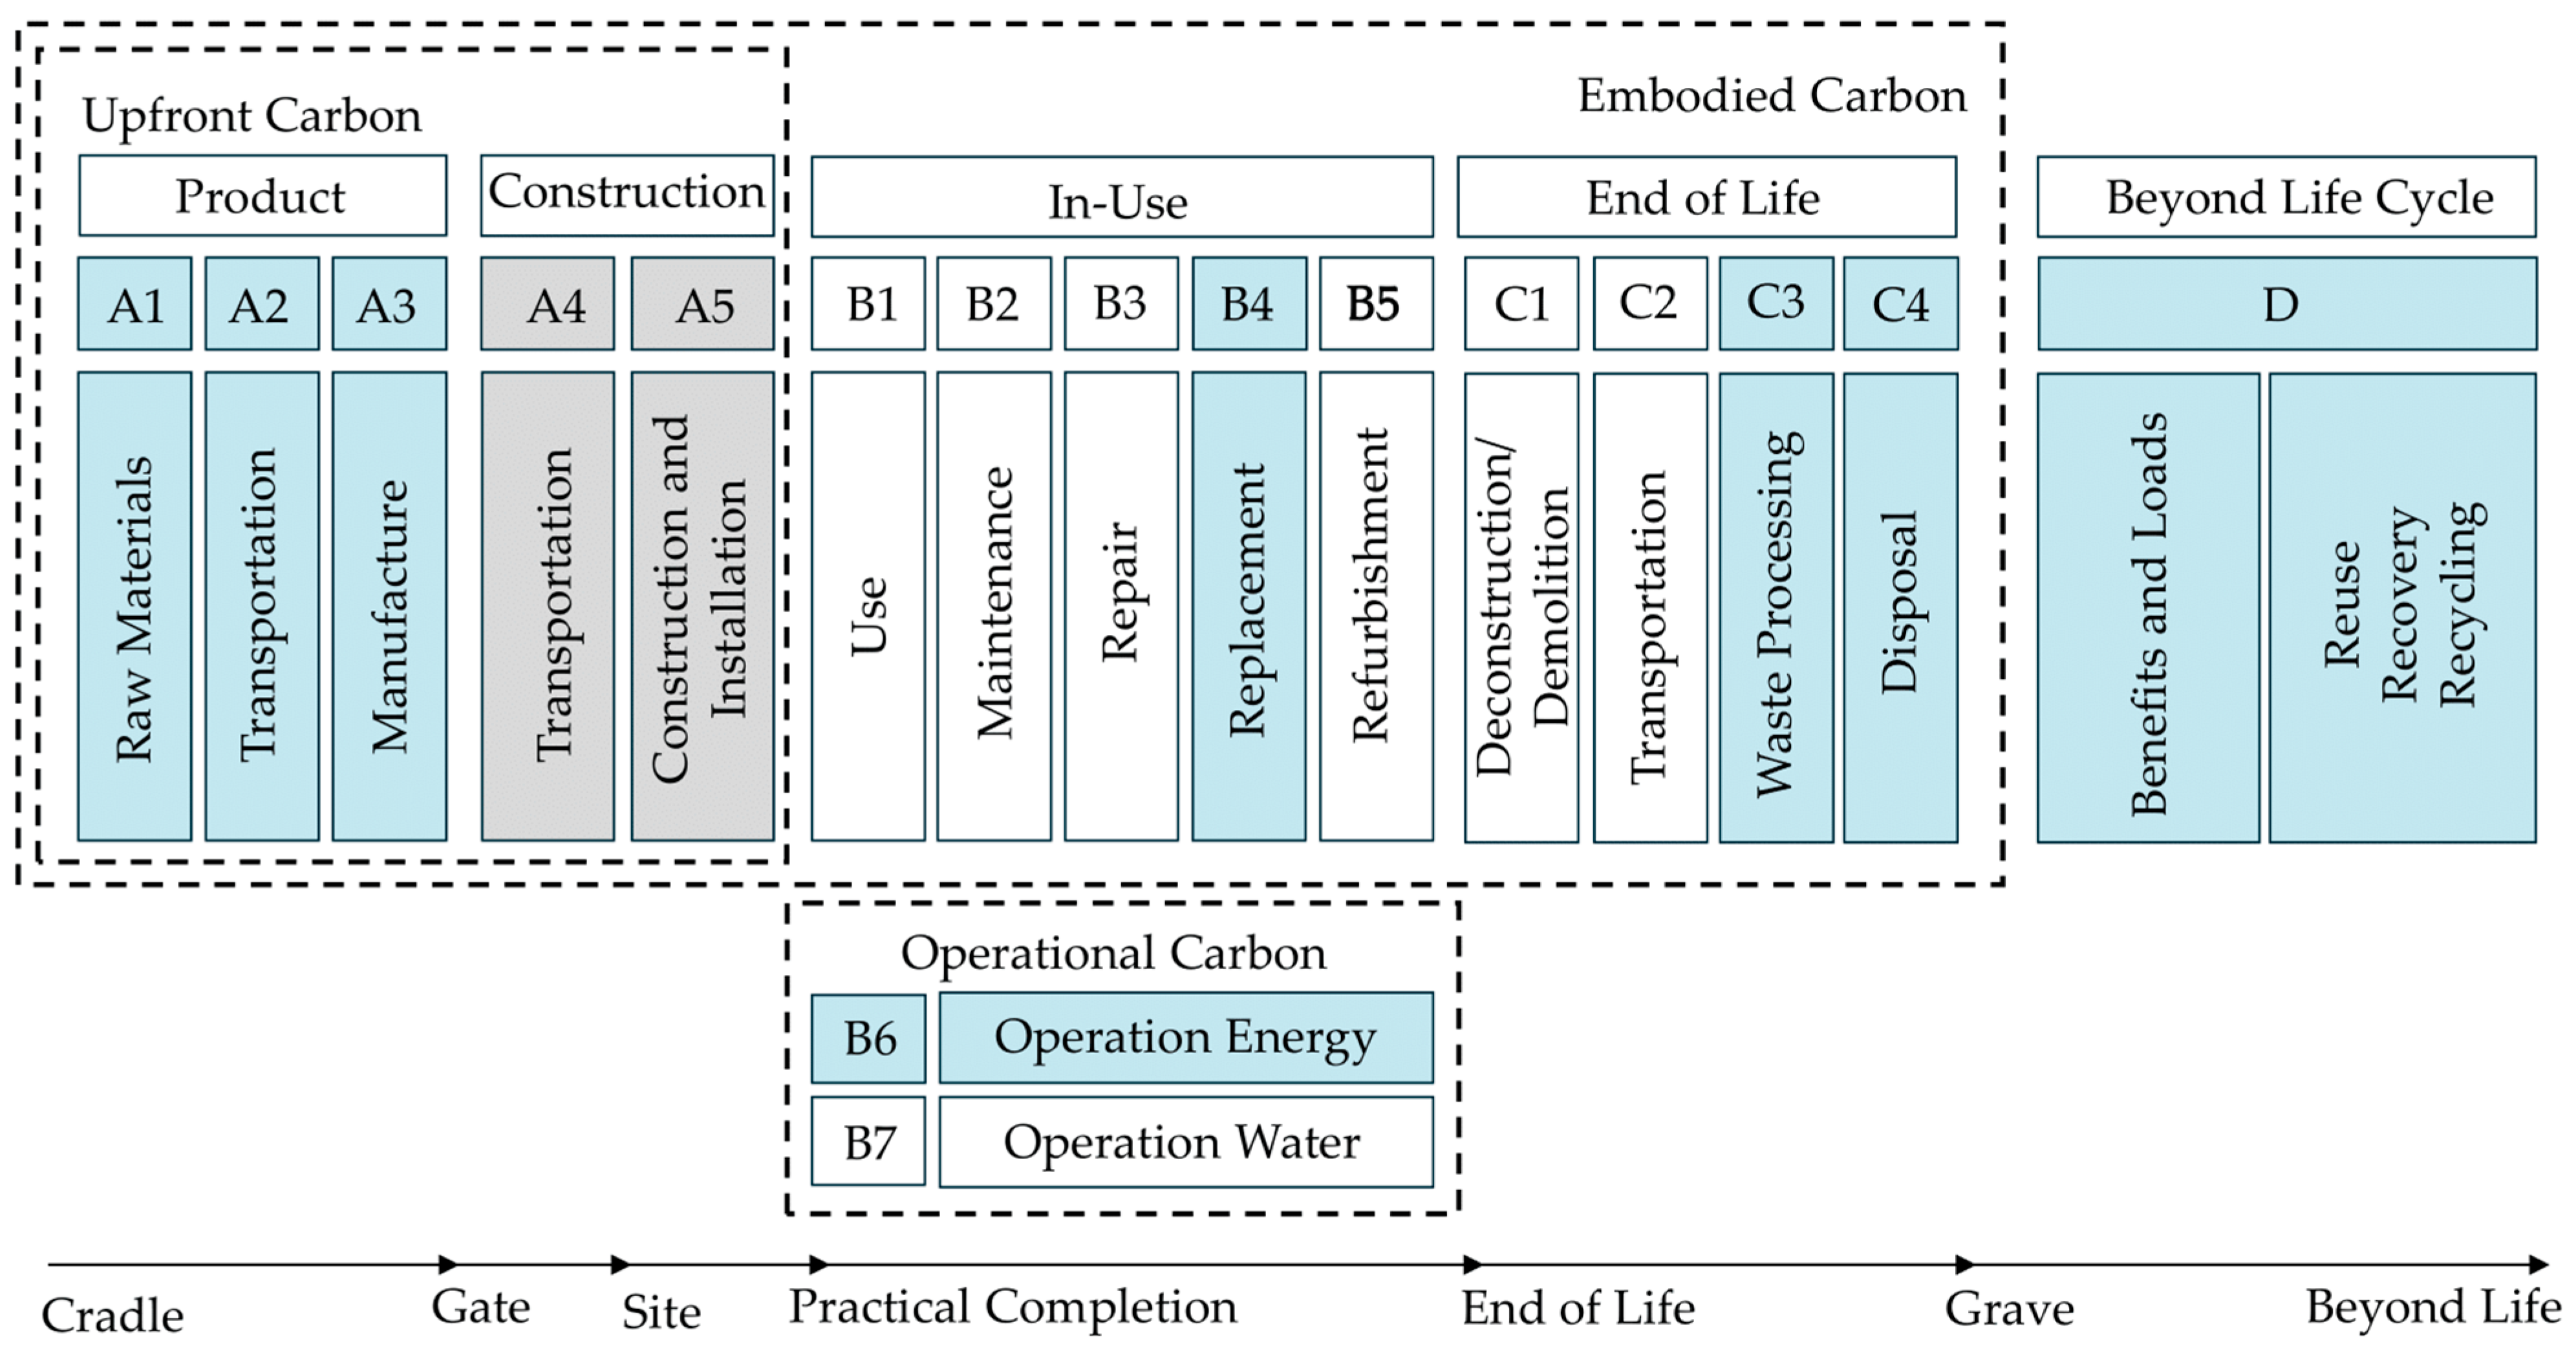
LCA is a standardised practice of measuring the flow of resources and materials in a product’s life cycle to determine its environmental impacts. This has resulted in a comprehensive framework, presented in the international standards ISO 14040/14044 [23,24], and coverage of a wide range of environmental impacts. With the LCA methodology, practitioners can quantify the effects of design decisions and compare alternatives, allowing them to make more informed decisions. This can be within a wide range of areas, such as minimising material usage, incorporating reusability and recyclability, and avoiding burden-shifting [25,26]. European standards have been created to ensure standardised practice that makes results comparable across projects. The standard EN 15978 [27] outlines the procedure for performing an LCA for construction, dividing the life cycle into stages and modules, as illustrated in Figure 2, which also highlights the modules included according to Danish regulations.
The Danish requirements for LCA documentation of new buildings were introduced on 1 January 2023. For buildings with a reference area of less than 1000 m2, an LCA must be documented. For buildings exceeding 1000 m2, emissions must remain within 12 kg CO2-eq./m2/year, covering climate change as measured in GWP. On 1 January 2024, the requirements for reused materials changed. Until 31 December 2023, reused materials were accounted for as new materials in production. This was changed to 0 kg CO2-eq./m2/year for reused materials.
A larger update will be made in the Danish building regulations on 1 July 2025. This update provides additions and tightening for documentation as follows:
  • The requirements now cover all new buildings, no matter the reference area. The new upper limits are presented in Table 1.
  • Two modules are added to the required calculation: transportation to the site (A4) and construction activities (A5), calculated separately with a limit value of 1.5 kg CO2-eq./m2/year [28].
As shown in Figure 2, most of the modules required by the Danish regulations, both from 2023 and the 2025 update, are related to the off-site biodiversity activities in the value chain, such as material production. Initial studies have shown that the activities in the value chain are often responsible for a far larger share of biodiversity impacts, which highlights the importance of including the activities outside of the actual building site [29].
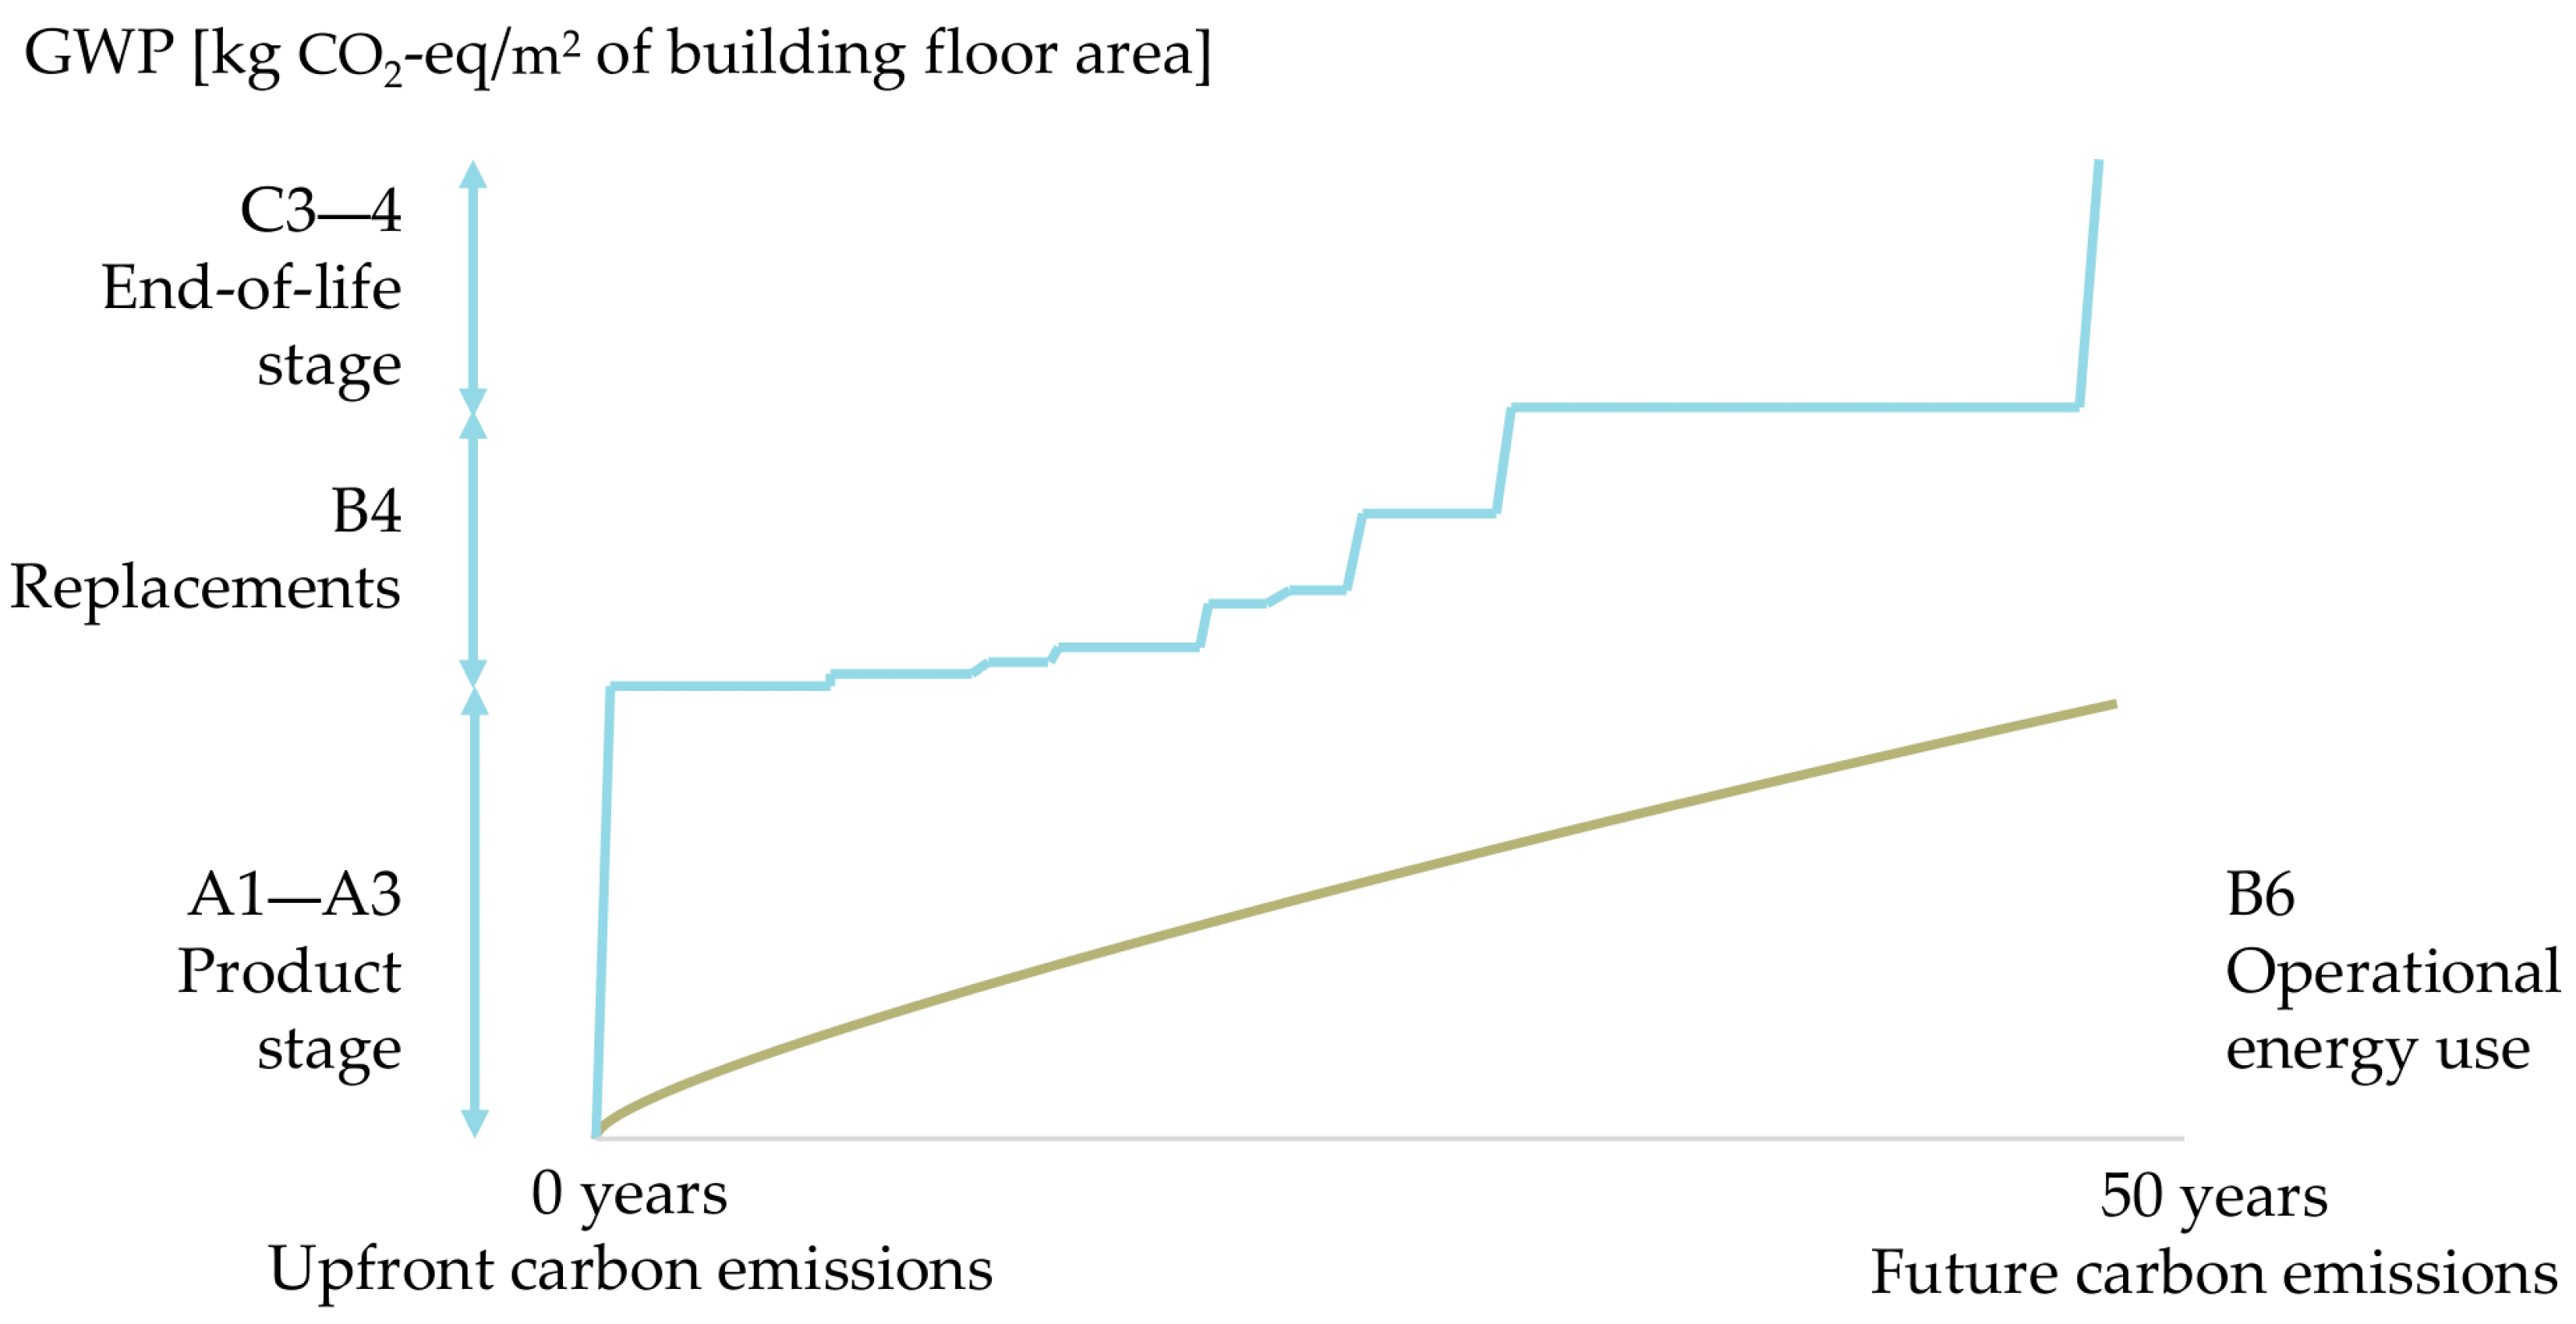
LCA tracks environmental impacts for each life cycle stage, but as many modules are time-dependent, such as B4 and B6, it is necessary to establish a reference study period. The length of this period determines aspects like the number of replacements expected. In Denmark, calculations use a reference study period of 50 years, starting from the time the building is completed. As the construction period is not included, emissions from stage A are considered upfront carbon emissions and occur in year 0. All other emissions are based on future scenarios. This is illustrated in Figure 3, which shows the timing of the emissions emitted in each life cycle module during the chosen reference study period (50 years in this case). This visualises that while operational impacts are time-dependent throughout the reference study period, the embodied impacts are related to specific timestamps.

2.1.1. LCI and LCIA Methods

The European standards EN 15978 and EN 15804 [31] are built upon the principles and structure of LCA, as well as the requirements for calculation, presented in the international standards ISO 14040/14044. The structure of LCA is described in ISO 14040 and consists of (1) Goal and Scope Definition, (2) Inventory Analysis, (3) Impact Assessment, and (4) Interpretation. At the beginning of every LCA project, the goal and scope should be defined, and part of this should be the determination of methods to be used for impact assessment. These methods are commonly referred to as Life Cycle Impact Assessment (LCIA) methods, and they use characterisation models to transform emissions from the inputs and outputs of the Life Cycle Inventory (LCI) into environmental impacts. Choosing the correct method is crucial to ensure that the goal and scope of the analysis will be fulfilled, as it decides what emissions are included and how they are accounted for. Many characterisation models exist; some focus on a single impact, and others cover several impact categories. Generally, they can be distinguished between methods that use midpoint indicators and methods that use endpoint impacts. In Figure 4, the difference between the two types is illustrated. The midpoint impact categories are calculated directly from the inventory data, while the endpoint impacts are calculated from the midpoint impacts. As the inputs and outputs all have different units and weighting, characterisation factors are used to convert the data into the equivalent unit of the related impacts. The characterisation factors and data used to calculate the impacts are determined by the choice of LCIA method.
Some of the most used methodologies to calculate mid-point impacts are CML-IA 2012, TRACI 2.1, and PEF. The CML methodology is made in compliance with ISO 14040/14044, EN 15978, and EN 15804 standards. The methodology’s characterisation factors are developed to analyse emissions as environmental impacts before they are translated to endpoint damage levels. It is the most widely used LCA methodology for assessing mid-point impact categories, with broad application everywhere except North America. The U.S. Environmental Protection Agency developed its own impact assessment method, TRACI, which focuses on environmental issues relevant to the United States. This method also focuses on midpoint indicators and, in comparison to CML, incorporates more detailed assessments related to human health in the form of respiratory effects (Particulate Matter); however, it does not separate fossil and mineral elements like the CML methodology does [33]. Lastly, the PEF methodology was developed by the European Commission to standardise environmental impact assessment across products and industries and to align with EU sustainability regulations, e.g., the Product Environmental Footprint Category Rules (PEFCR) [34]. Similar to CML and TRACI, the PEF methodology uses midpoint indicators, but it is more comprehensive [33]. Table 2 provides an overview of the different environmental impact categories included in the three methodologies.
Regarding LCIA methods that analyse impacts on an endpoint level, three methods will be highlighted: ReCiPe 2016, Impact World+, and LC-Impact. ReCiPe 2016 is an update to ReCiPe 2008, improving consistency in regionalisation and uncertainty analysis. It is one of the most widely used LCIA methodologies, and its implementation in several LCA tools and databases proves its increasing use within the AEC sector. A broad range of midpoint indicators is included, which are connected to the three endpoint AoPs: Damage to Human Health, Damage to Ecosystems and Damage to Resource Availability. The method offers three different perspectives for characterisation factors: individualistic (short-term interests), hierarchic (scientific consensus), and egalitarian (long-term precautionary) [35].
Impact World+ was released as an extension of Impact 2002+ to improve regionalisation and account for geographically specific environmental impacts. This method provides results at both midpoint and endpoint levels, offering comprehensive environmental coverage, but it does not include resource depletion as a separate impact category. Instead, it assesses resource availability based on competition and adaptation, focusing on economic and societal consequences, covered within an AoP named Resources & Ecosystem Services. The depletion of resources can also be connected to human health if the resource provides an essential function, such as drinking water. Impact World+ differentiates impacts based on geographic regions, which can give more precise scopes for both global and country-specific LCAs. This comprehensive approach leads to a higher level of complexity, as the method requires geographically explicit input data, which might not always be available [36]. While it is not yet broadly implemented, it is gaining interest within the construction industry.
The last method is LC-impact, an advanced LCIA method designed to improve regionalisation. This method also uses both midpoint and endpoint impacts with the inclusion of all three AoPs (Human Health, Ecosystem Damage, and Resource Depletion). Still, unlike ReCiPe 2016, it strongly focuses on spatial differentiation using geographic-specific impact factors. This allows for a more detailed and aggregated impact assessment and gives areas such as toxicity and water impacts improved modelling [37]. Similar to Impact World+, the comprehensive approach requires spatial and regional data, which may not always be available.
Table 3 and Table 4 provide an overview of the qualities and drawbacks of each of the three methods.
The reasoning for choosing these methods is based on the findings in [38], which analysed 23 frameworks for their quality of measuring biodiversity impacts and their application potentials in LCA. The three methods mentioned were among the best performing in terms of pressures included and their coverage of ecosystems, taxonomy groups, essential biodiversity variables, and fundamental biodiversity aspects. None of the LCA-based methods included pressures from invasive species or overexploitation. The more species included, the more accurately biodiversity loss is measured. However, methods with more detailed frameworks require equally detailed data. In current developments of tracking the environmental impacts of construction products, this level of data can be challenging to acquire, especially if regionalisation is included.

2.1.2. LCA Databases

No matter the method used to perform the impact assessment, the analysis cannot be performed without data. LCA databases are crucial in evaluating the environmental impacts of buildings, materials, and infrastructure. They provide the essential data for assessing the environmental impacts of construction products through the entire life cycle, from material extraction to disposal or reuse/recycling. Generally, these databases can provide two different kinds of data: LCI and EPD data. LCI data provides raw, generic environmental data on material and energy flows throughout the life cycle of a product. This includes the inputs (raw materials, energy use, etc.) and the outputs (emissions, waste, etc.) of the system boundary [26]. An EPD is a third-party verified document containing a specific product’s environmental impacts from a particular manufacturer, calculated based on a standardised LCA method and following ISO 14025 [40] and EN 15804. Therefore, the data found in an EPD is actually LCIA data that has been characterised. While EPDs are based on LCI data, this is usually not accessible in the EPD itself. EPDs provide transparency of a product’s environmental footprint through a standardised calculation basis, which makes them objective and credible. Moreover, it allows the product to be used in certification systems. EPDs are preferable when conducting LCAs of entire buildings and selecting construction products/materials, as they enable the practitioner to make active choices of products with lower environmental impacts or reused products. Furthermore, they ensure compliance with national and European regulations, as well as in the application for green building certifications [41]. Meanwhile, LCI data can be useful when the assessment is on a larger scale, like modelling an entire sector or a supply chain to further policy-making or benchmarking.
Some of the largest and most used databases for LCI and LCIA data are Ecoinvent and Sphera Managed LCA Content. Both databases offer data for various types of industries and can be used to create LCAs across multiple sectors. They support a wide range of LCIA methods, both midpoint and endpoint, which makes them broad in their inclusion of impact categories [42,43]. While Ecoinvent and Sphera MLC do not provide EPDs, they can be used to generate EPDs. Both databases provide data to the PEF database, a European database required when performing an LCA with the PEF LCIA method [32].
In terms of databases that exclusively offer EPDs and generic data, many options exist. Some of the most used ones in Denmark’s construction industry are Ökobaudat, Inies, IBU EPD Database, EPD Denmark, and EPD Norge. These five databases provide EPDs (and generic data for Ökobaudat and Inies) for construction materials made according to EN 15804 and ISO 14025. Each product is accounted for with the impact categories required in EN 15804 using an LCIA method that supports the standards. While the range of impact categories is narrower than in Ecoinvent and Sphera MLC, the data can be integrated directly into projects that must comply with European Standards. Moreover, these EPD databases are often freely available, as is the case with the five databases mentioned above [44,45,46,47]. An overview of some of the mentioned databases and their properties is presented in Table 5.

2.1.3. LCA Tools

In practice, when conducting LCAs, the above-mentioned methods and databases are most often used through LCA software tools [48,49]. These tools can be used to figure out a product’s environmental impact hotspots, create a Digital Product Password, or document environmental impacts for publishing of EPDs. Many options exist, and the best choice depends on the goal and scope of the LCA. Some of the most used LCA software tools globally are Ecochain, SimaPro, LCA for Experts (Sphera), OneClick LCA and OpenLCA. An overview of the establishment and format for the five tools can be found in Table 6, and an overview of their inclusion of previously mentioned LCIA methods and databases can be found in Table 7.
Within the Ecochain environment, two different tools are offered: Ecochain Mobius and Ecochain Helix. Mobius is known to have a very user-friendly interface and many advanced features, which make the process of collecting and analysing data throughout a product’s life cycle easier. Helix is used to conduct LCAs on a scale for production facilities. It is also through the Helix tool that the European standard EN15804 can be applied; hence, it is the tool relevant to the construction industry [57].
Research institutes and consultants often choose Simapro because it offers features that LCA experts expect in a professional LCA software package. The tool allows customisation of the modelling process in LCA, as parameters can be adjusted and inputs can be chosen to reflect specific industry and regional factors. The customised reports generated in the software provide the LCA results in a clear and concise manner [57].
The most advanced software of those mentioned is LCA for Experts from Sphera. This tool combines modelling and reporting software with a database of reliable and consistent environmental data. The tool has more than 20 sector-specific databases, enabling organisations to understand the impacts through a product’s full life cycle. It is part of Sphera’s own network, which also contains a vast database that covers a wide range of industries and geographies, allowing tailoring in the modelling process. Moreover, it can be integrated with other sustainability tools, such as carbon accounting software [57].
OneClickLCA is by far the most automated of the bunch. This cloud-based software has been developed specifically for LCAs and the creation of EPDs within the construction industry. It integrates leading standards, databases, and design software tools globally, and it can be used for buildings, infrastructure, renovation projects, construction products, and materials. The intended user of OneClickLCA is a range of professionals, such as architects, engineers and consultants, but it can also give building owners insights into the environmental impact of their project [57]. It integrates leading standards, databases and design software tools globally and can be used for buildings, infrastructure, renovation projects, construction products and materials. The intended user of OneClickLCA is a range of professionals, such as architects, engineers and consultants [50].
The last-mentioned globally used tool is OpenLCA, which is the only free open-source LCA software worldwide that professionals in ecological, social and economic LCAs can use. The tool has a wide range of applications, among which are LCAs, carbon and water footprints, eco-design, EPD creation, LCC and social LCA. The design was to make the tool flexible and customisable [57]. Through their connected website OpenLCA Nexus, it is possible to obtain both free and paid databases. The website also contains an LCIA method package, which can be downloaded for free and used in OpenLCA [58].
A tool that is not used globally but deserves a mention in a Danish context is LCAbyg [56]. This tool is freely available, and its sole focus is to calculate the environmental impacts of buildings. The newer versions have been specifically tailored for the Danish building regulations on sustainability, which were made mandatory in 2023. The only database directly integrated is its own Generisk Dansk (GenDK) Database. However, it is possible to insert EPDs into the calculations automatically for some EPD files and otherwise manually.
Table 7. The inclusion of LCIA methods and LCA databases in the mentioned global tools [42,53,58,59,60,61,62,63,64].
Methods and DatabasesEcochain HelixSimaProLCA for ExpertsOneClick LCAOpenLCA
CML-IA
TRACI
PEF
ReCiPe 2016
Impact World+
LC-impact
Ecoinvent
GaBi (Sphera)
Ökobaudat
EPD Danmark

2.2. Biodiversity Loss

The Biodiversity Net Gain (BNG) Tool was developed as a solution for the BNG UK national policy, which came into effect on the 12th of February 2024 [65]. The primary goal of this policy is to leave the natural habitats affected by development in a measurably better state than they were before development. This regulation makes it mandatory for developers to measure a BNG of 10%. The documentation of this net gain is necessary to obtain permissions from planning authorities, and once approved, ecologists will track the work over 30 years to ensure compliance. The net gain can be obtained on-site, which is preferable, or off-site, which involves the improvement of nearby habitats. As a last resort, biodiversity credits can be bought from the government, though this comes at a high cost. It is recommended that an ecologist be consulted to measure the biodiversity value and advise on habitat creation. Calculation of biodiversity units must be performed in the Statutory Biodiversity Metric Tool, available on the UK Government’s website [66]. Based on these requirements, OneClickLCA has created the Biodiversity Net Gain Tool using the UK Habitat Classification System, which is also found in the Statutory Biodiversity Metric Tool [67]. These tools require experience with the classification system and expertise in actionable steps to improve biodiversity.
While European Standards on construction do not recommend any methods to assess biodiversity, studies have shown that LCA meets the essential criteria for an appropriate biodiversity evaluation [20,21]. As biodiversity loss gains attention due to its critical state (see Section 1), practitioners have started developing their own tools to evaluate biodiversity loss through the LCAs of construction projects. The Off-site Biodiversity Tool (Doughnut Biotool in newer publications [68]) is the result of such an initiative. The tool was developed as part of the Doughnut for Urban Development framework to calculate biodiversity loss more straightforwardly, enabling LCA practitioners to include biodiversity considerations. The tool works in spreadsheet programmes such as Excel and is an alternative to more complex and costly endpoint LCIA tools and databases. Two options of the tool are provided, and it is recommended to use ReCiPe 2016 (see Section 2.1.1) for both:
(A)
The practitioner can buy a licence to a database using endpoint LCIA methods and match these materials with their LCA results. Based on this material match, the tool will calculate biodiversity loss.
(B)
A set of correction factors to account for missing impact categories can be multiplied by material amounts in the LCA. The results from selected impact categories are inserted into the Off-Site Biodiversity Tool, which calculates the corresponding biodiversity impact. This second method has higher uncertainty, as no biodiversity impacts are calculated for each individual material but only for the material group.

2.3. LCA of Bio-Based Materials

The European standard EN 15804 was first implemented in 2012 and has been broadly adopted since. The original purpose came from a mandate at the European Commission to make a harmonised approach to the declaration and calculation of the environmental performance of construction products in a European context. Since its first publication, the standard has been amended twice. In the first amendment, EN 15804+A1, it was made mandatory to use a standard set of characterisation factors, which created a foundation for comparability across most of the environmental impact categories in EPDs. The European Commission has since developed the Product Environmental Footprint (PEF), which considers both the supply chain and downstream activities. To ensure alignment, a new amendment was issued, EN 15804:2012+A2:2019. This amendment was introduced in July 2019, when a transition period started. This gave users three years, until July 2022, when EN 15804+A1 was withdrawn. One major change is the reporting of biogenic carbon. In EN 15804 [69], the method for handling biogenic carbon flows was not clearly specified, and the sequestration process and release were not consistently addressed, resulting in uncertainty. Hence, in EN 15804+A2, more consistent rules have been introduced, including sequestration and carbon release at end-of-life. The category of GWP has been split into GWP-fossil, GWP-biogenic and GWP-LULUC. The division into subcategories can be found for other impact categories from EN 15804+A1 [70].
Biogenic carbon can belong to two categories. The first is CO2 captured during photosynthesis, also known as carbon sequestration. The second is emissions of CO2, CO, and CH4 from the oxidation and reduction in biomass, which comes from the transformation or degradation of biomass. These processes are currently accounted for with static modelling approaches, in which no time considerations are made [71]. The two approaches used are the 0/0 method and the −1/+1 method. The 0/0 method assumes a balance between uptake and release of CO2; hence, no emissions are tracked in either stage A or C. In the −1/+1 approach, uptake, release and transfer of biogenic carbon is measured for each stage. During forest growth, an uptake is noted as negative in stage A, while carbon is either released (incineration) or transferred (recycling) in stage C. A positive emission is tracked at the end-of-life. The −1/+1 method is recommended by European standards. However, carbon neutrality can only be assumed if the material originates from sustainable forestry, where yearly harvested biomass is less than yearly forest growth.
The two static methods are often criticised for neglecting time considerations for emissions and biomass regrowth [72]. Bio-based materials, such as timber, have a longer rotation period. According to the IPCC, biogenic carbon can be considered neutral over long timescales of more than 100 years, but only if sustainably sourced and regrown [73]. Thus, biogenic carbon cannot be considered neutral over 50–80 years, which is often used as the basis for RSPs in LCAs [74].
Many researchers are developing dynamic LCA approaches to account for biogenic carbon. Approaches have been developed using dynamic inventory and dynamic characterisation factors, determining emissions based on time steps [75], or using characterisation factors that take biomass regrowth rotation into account [76]. However, these dynamic approaches are not commonly used, even though the timing of release and uptake affects impact results, depending on the type of analysis [77]. The topic has been increasingly discussed, yet no agreed-upon method for evaluation exists [71].

3. Materials and Methods

3.1. LCA Methodology for Climate Change

Life cycle stages: The standard EN 15978 divides the life cycle into a number of stages and modules (see Figure 2). These take the whole life cycle of the building into account, including aspects from both building materials and operation. As explained in Section 2.1, the current Danish building regulations require a calculation including material production and transportation to the manufacturer (A1–A3), replacements (B4), energy usage (B6), waste processing and disposal (C3–C4), and potentials outside the system boundary (D), though the last is accounted for separately. These modules are included in this study, except for module D. The reason for excluding this module is that it has separate documentation; therefore, it is not part of the upper limit value for GWP. Only the modules affected by limit values due to Danish building regulations are studied.
With the new requirements taking effect in July 2025, emissions from transportation to the site (A4) and construction activities (A5) will be required. The latest version of LCAbyg (version 5 [78], covers all modules according to Danish regulations. Due to the timeframe and scope of this study, modules A4 and A5 are not included. Modules A4 and A5 should be calculated separately and will not feature in the new limit values in Table 1. The included modules and descriptions can be found in Table 8.
Building parts included: Inclusion of all building components and products is crucial. The Danish building regulations have requirements for the inclusion of building parts, which are followed here. The categories can be found in Table 9.
Reference study period: In the Danish regulations, the reference study period (RSP) is fixed to 50 years, following the Level(s). As all LCAs for the case buildings are made according to Danish requirements, this has determined the RSP. The RSP is theoretical and not equivalent to the expected service life.
Assumptions for replacements: Replacements must be accounted for with service life values from BUILD RAPPORT 2021:32—BUILD levetidstabel—Version 2021. If the number of replacements is not whole, LCAbyg rounds up. For example, 1.6 replacements result in 2 replacements.
Biogenic carbon: In LCAbyg, biogenic carbon is accounted for using the −1/+1 method as in EN 15804:2012 (described in Section 2.3). The GWP of bio-based materials is negative in production (A1–A3) when carbon is sequestered, and positive in end-of-life (C3–C4) when released. This gives a total balance of 0. Buildings with high bio-based material shares will have a low impact during A1–A3 and a higher impact in C3–C4.
Operational energy usage: Impacts from building operation are calculated based on energy consumption for electricity and heating. The emission factors are the 2025 factors from the draft for public consultation by the Danish Social and Housing Authority (https://hoeringsportalen.dk/Hearing/Details/69066, accessed on 3 April 2025), based on the newest scenarios for Denmark’s electricity and district heating mix. These factors have a lower overall impact on B6 compared to the previous data for B6. These are made mandatory from the 1st of July 2025. As the factors are projected, they are reduced each year, making them different from static data used, for example, by Ecoinvent.
Tool and database for LCAs: The tool used for all 73 case buildings is LCAbyg, which follows the Danish regulations (BR18). The data in LCAbyg follows BR18 appendix 2, Table 7, known as the generic Danish database (GenDK). EPD data has also been imported manually from the following locations:
  • EPD Danmark;
  • EPD Norge;
  • IBU (Germany);
  • EPD International (Sweden).
The EPDs used are primarily for the Danish market. GenDK is based on EN 15804+A1; as many EPDs following this standard as possible have been used. However, some EPDs using EN 15804+A2 were also used.
Environmental impact categories for LCAs: In LCAbyg, results can be obtained for nine indicators in EN 15978. As current legislation only requires climate change reporting, the results focus on this indicator. Nevertheless, LCAs should evaluate several indicators to avoid burden-shifting.
Reference unit for LCAs: To make results comparable with regulations, the LCAs are presented in Global Warming Potential (GWP), presented for the area and reference study period. GWP is measured in CO2-eq., so the reference unit is kg CO2-eq./m2/year.

3.2. LCA Methodology for Biodiversity Loss

LCA basis for biodiversity calculations: Currently, there are no requirements in Denmark for the evaluation of biodiversity loss through LCA, and the scope of the analysis is dependent on the practitioner. For the cases in this study, biodiversity loss will be assessed on equal terms as the LCAs for climate change in LCAbyg. This includes the following:
  • The choices made in methodology in Section 3.1 related to life cycle stages (Table 8), building parts (Table 9), and the reference study period.
  • The number of replacements will follow the model presented in Section 3.1.
The new emission factors for module B6 have not been used in the evaluation of biodiversity loss, as this calculation is based on a different database and tool. The dataset for heating demand with district heating is an EU average, recommended in the Reduction Roadmap [22,29]. Within this dataset, 65% of biodiversity loss impacts occur from hard coal combustion, making up about 60% of energy production. The combustion of fossil fuels and wood in energy production is associated with high emissions. This is not very representative of Danish energy production, and if a Danish average for district heating was used, emissions would likely decrease. The dataset for electricity is a Danish average.
Tool and database for biodiversity calculations: As presented in Section 2.1, different LCA methodologies that evaluate Ecosystem Damage (biodiversity loss) exist. Biodiversity loss is not implemented in the current version of LCAbyg, thus, it is calculated separately. For the case buildings, the calculation has been carried out in a spreadsheet programme, which takes all materials and quantities from LCAbyg and matches them to generic material data from the Ecoinvent database (Section 2.1.2) with impact categories calculated based on the ReCiPe 2016 methodology (Section 2.1.1). The characterisation factors from ReCiPe 2016 are based on a hierarchical perspective and do not include long-term emissions.
Impact category for biodiversity loss: The ReCiPe 2016 framework connects midpoint indicators to three endpoint AoPs: Damage to Human Health, Damage to Ecosystems, and Damage to Resource Availability [33]. This study uses the category Damage to Ecosystems, including biodiversity loss for freshwater, terrestrial, and marine species.
Reference unit for biodiversity loss: Mapping and quantifying biodiversity impacts across entire value chains can be challenging. A single indicator is used to represent local species losses in all affected areas: “species·year”, representing local species loss integrated over time. This is not “species per year” but “species lost locally multiplied by years”. This indicator is chosen because of data availability and its relation to the local dimension of biodiversity loss. Throughout this study, biodiversity results will be presented in species·year converted to area (per m2) and reference study period (per year), with the unit species·year/m2/year.

4. Case Studies

This section presents the 73 case buildings based on their typology, reference area, year of commissioning, and load-bearing structure. It also covers the material composition of the main building parts for all the case buildings. This is followed by the results of LCA calculations for all case buildings, divided into results in GWP and results in biodiversity loss.

4.1. Presentation of the 73 Case Buildings

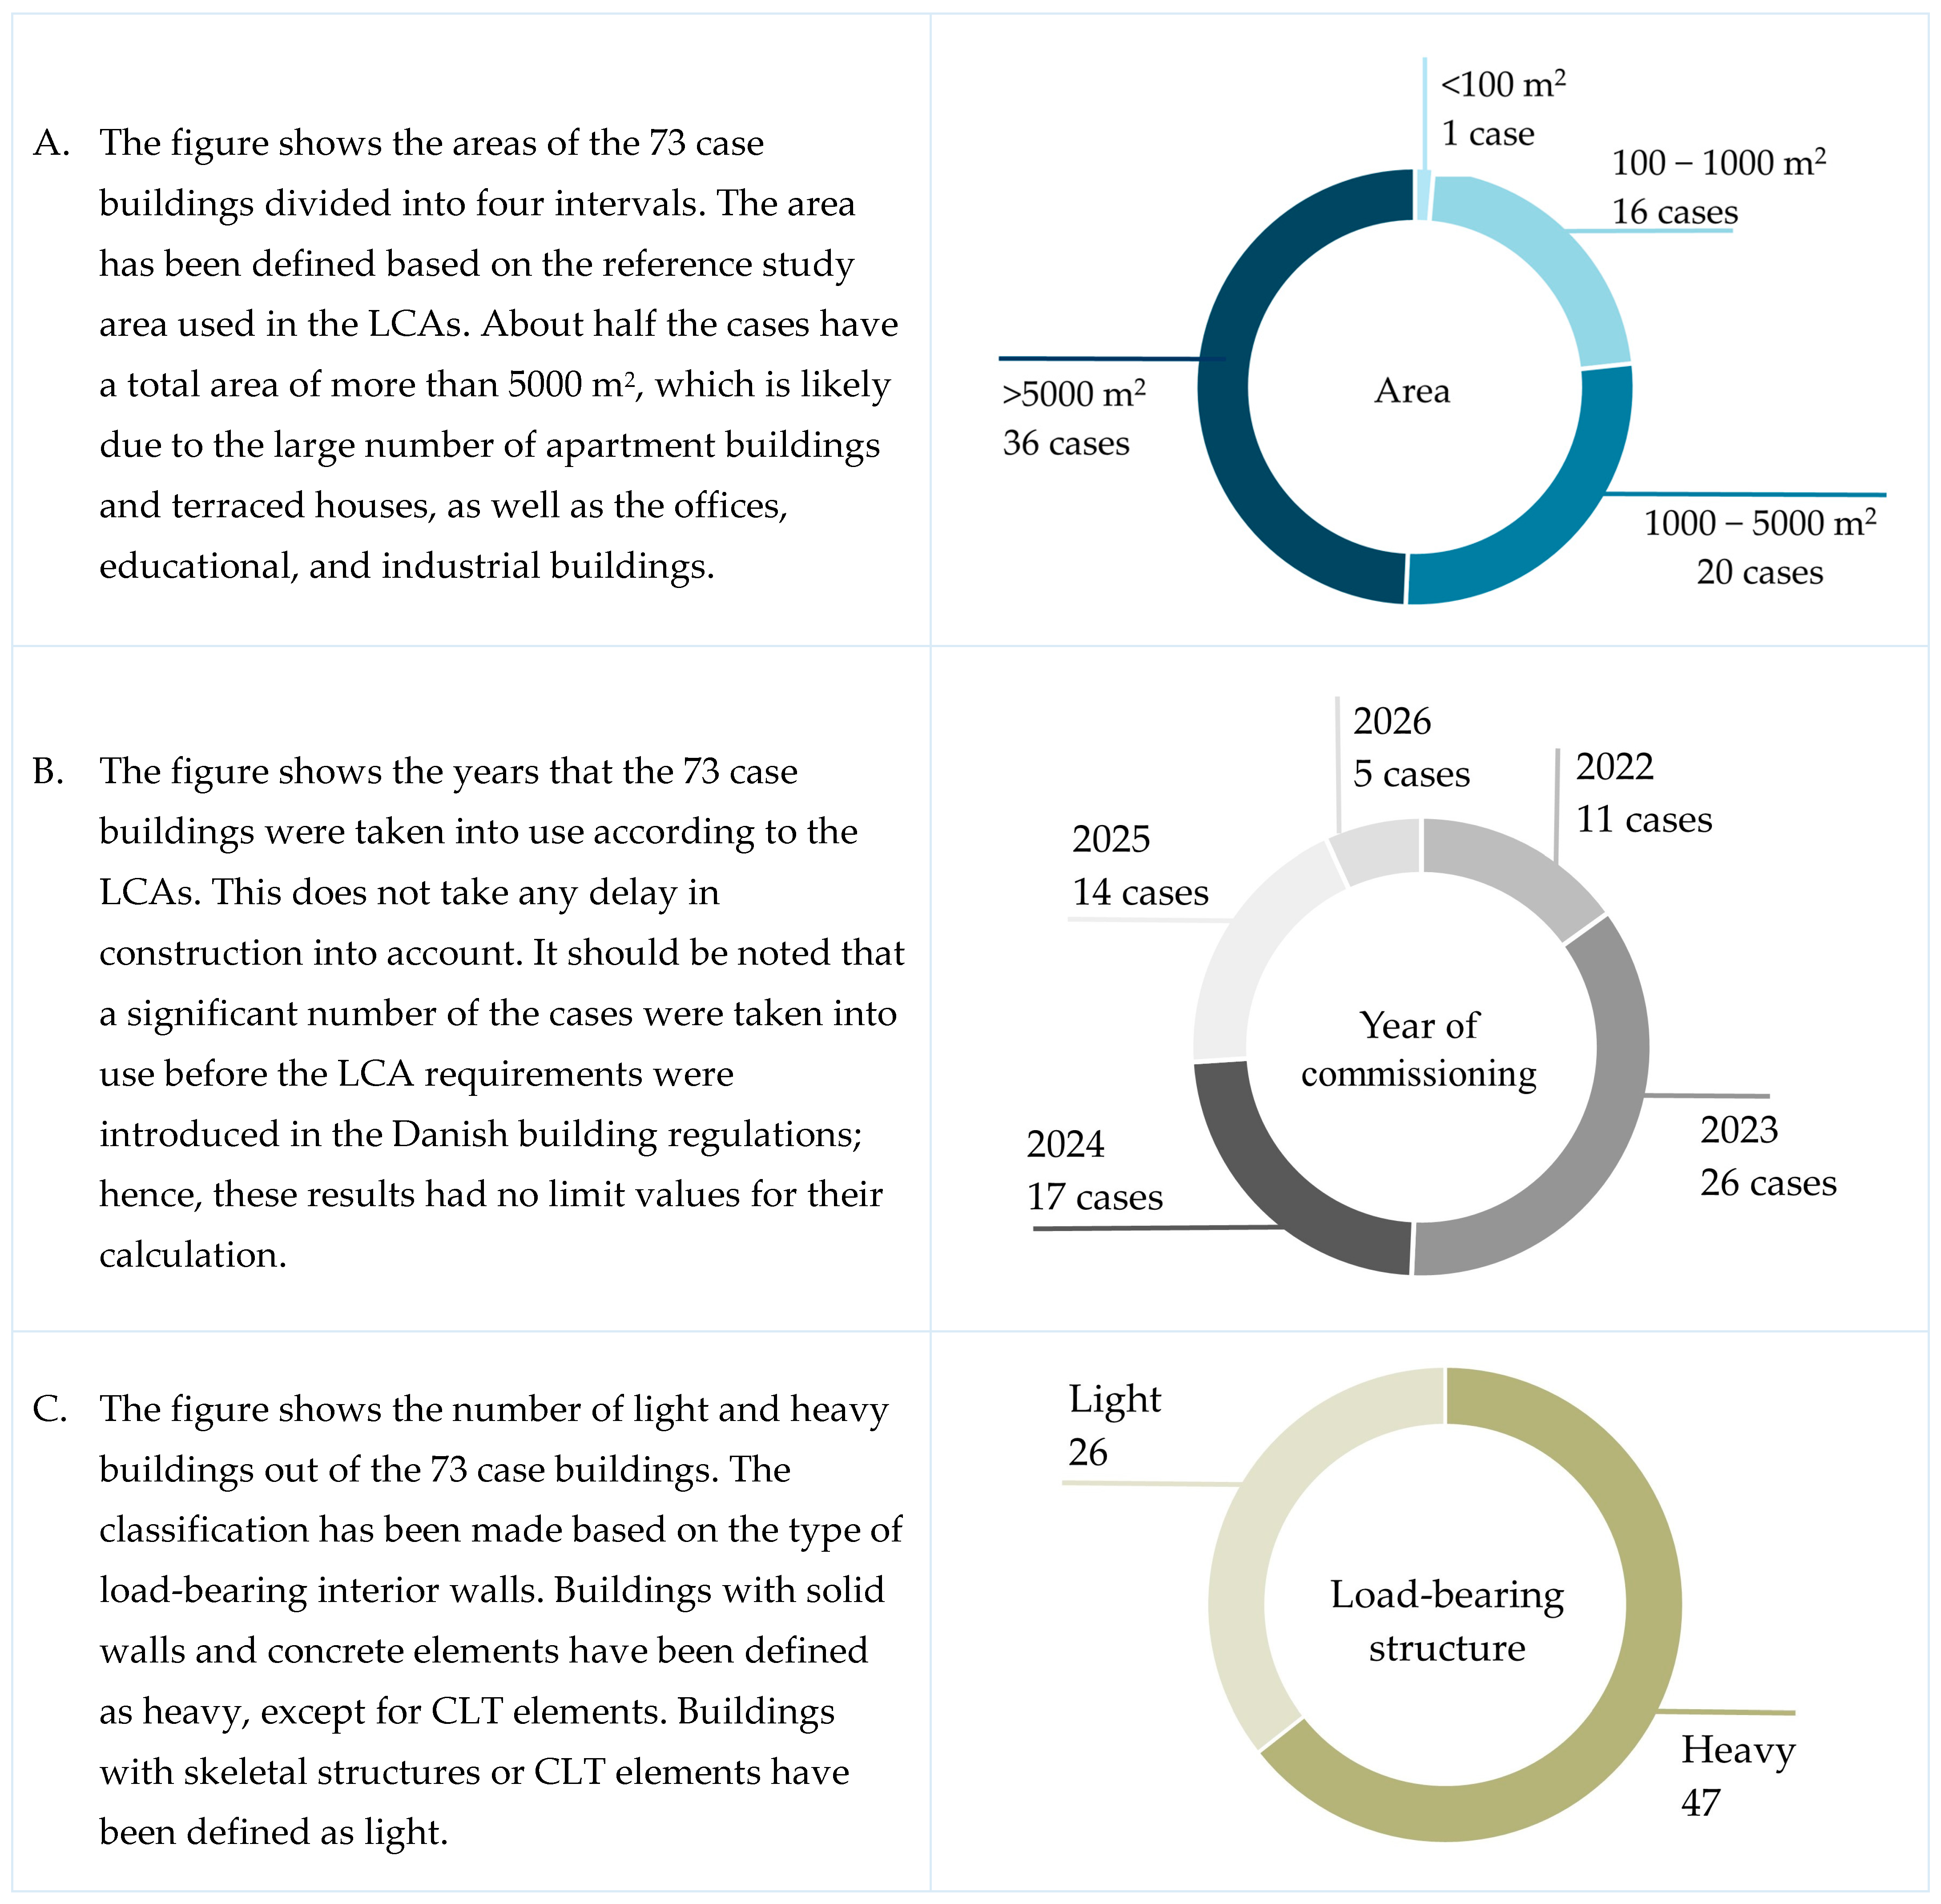
A total of 73 case buildings have been used in this study, with results from LCAs and biodiversity calculations. The distribution of the cases in the typologies used for classification is presented in Figure 5, which also includes the index used to create the IDs for each case. These will be used in Section 4.2 and Section 4. The case buildings will be taken into use between 2022 and 2026 (see Figure 6). Therefore, the current requirements for LCA and the upper limit value of GWP in the Danish building regulations were not taken into effect when some of these projects were environmentally accounted for through LCA. The case buildings consist of a variety of different functional typologies.
As seen in Figure 6, there is a wide distribution of building typologies. However, no assessments have been made on how representative these buildings are of the Danish building stock or within their typology group. Some buildings have been certified according to a sustainable certification scheme, while others have been documented according to the BR18.
The LCA calculations have all been performed in LCAbyg, as mentioned in Chapter 3. This ensures uniformity in calculations and fulfilment of requirements in EN 15978 and BR18. LCAbyg has been the primary data source, with some data inserted manually from other sources, thereby fulfilling EN 15978 and BR18.
Due to functional differences, the buildings have varying sizes and structures. In Figure 6, an overview of the area, year of commissioning, and load-bearing structure can be found. The load-bearing structure has been classified as either light or heavy, based on interior load-bearing walls. Buildings with solid walls and concrete elements are classified as heavy, except CLT walls, while skeletal structures and CLT walls are classified as light. The classification does not consider façade cladding, which impacts total building weight.
The category of interior walls covers both load-bearing and non-bearing walls, as differentiation has not been possible. The material categories consist of one or two primary material groups. The categories and their colour-codes are found in Figure 7. The category “Not relevant” indicates building parts that do not exist in the given case (e.g., one-floor buildings with no floor slabs). These categories differ from those in Table 9, which include additional elements within each building part.

4.2. Results from the LCAs of Case Buildings

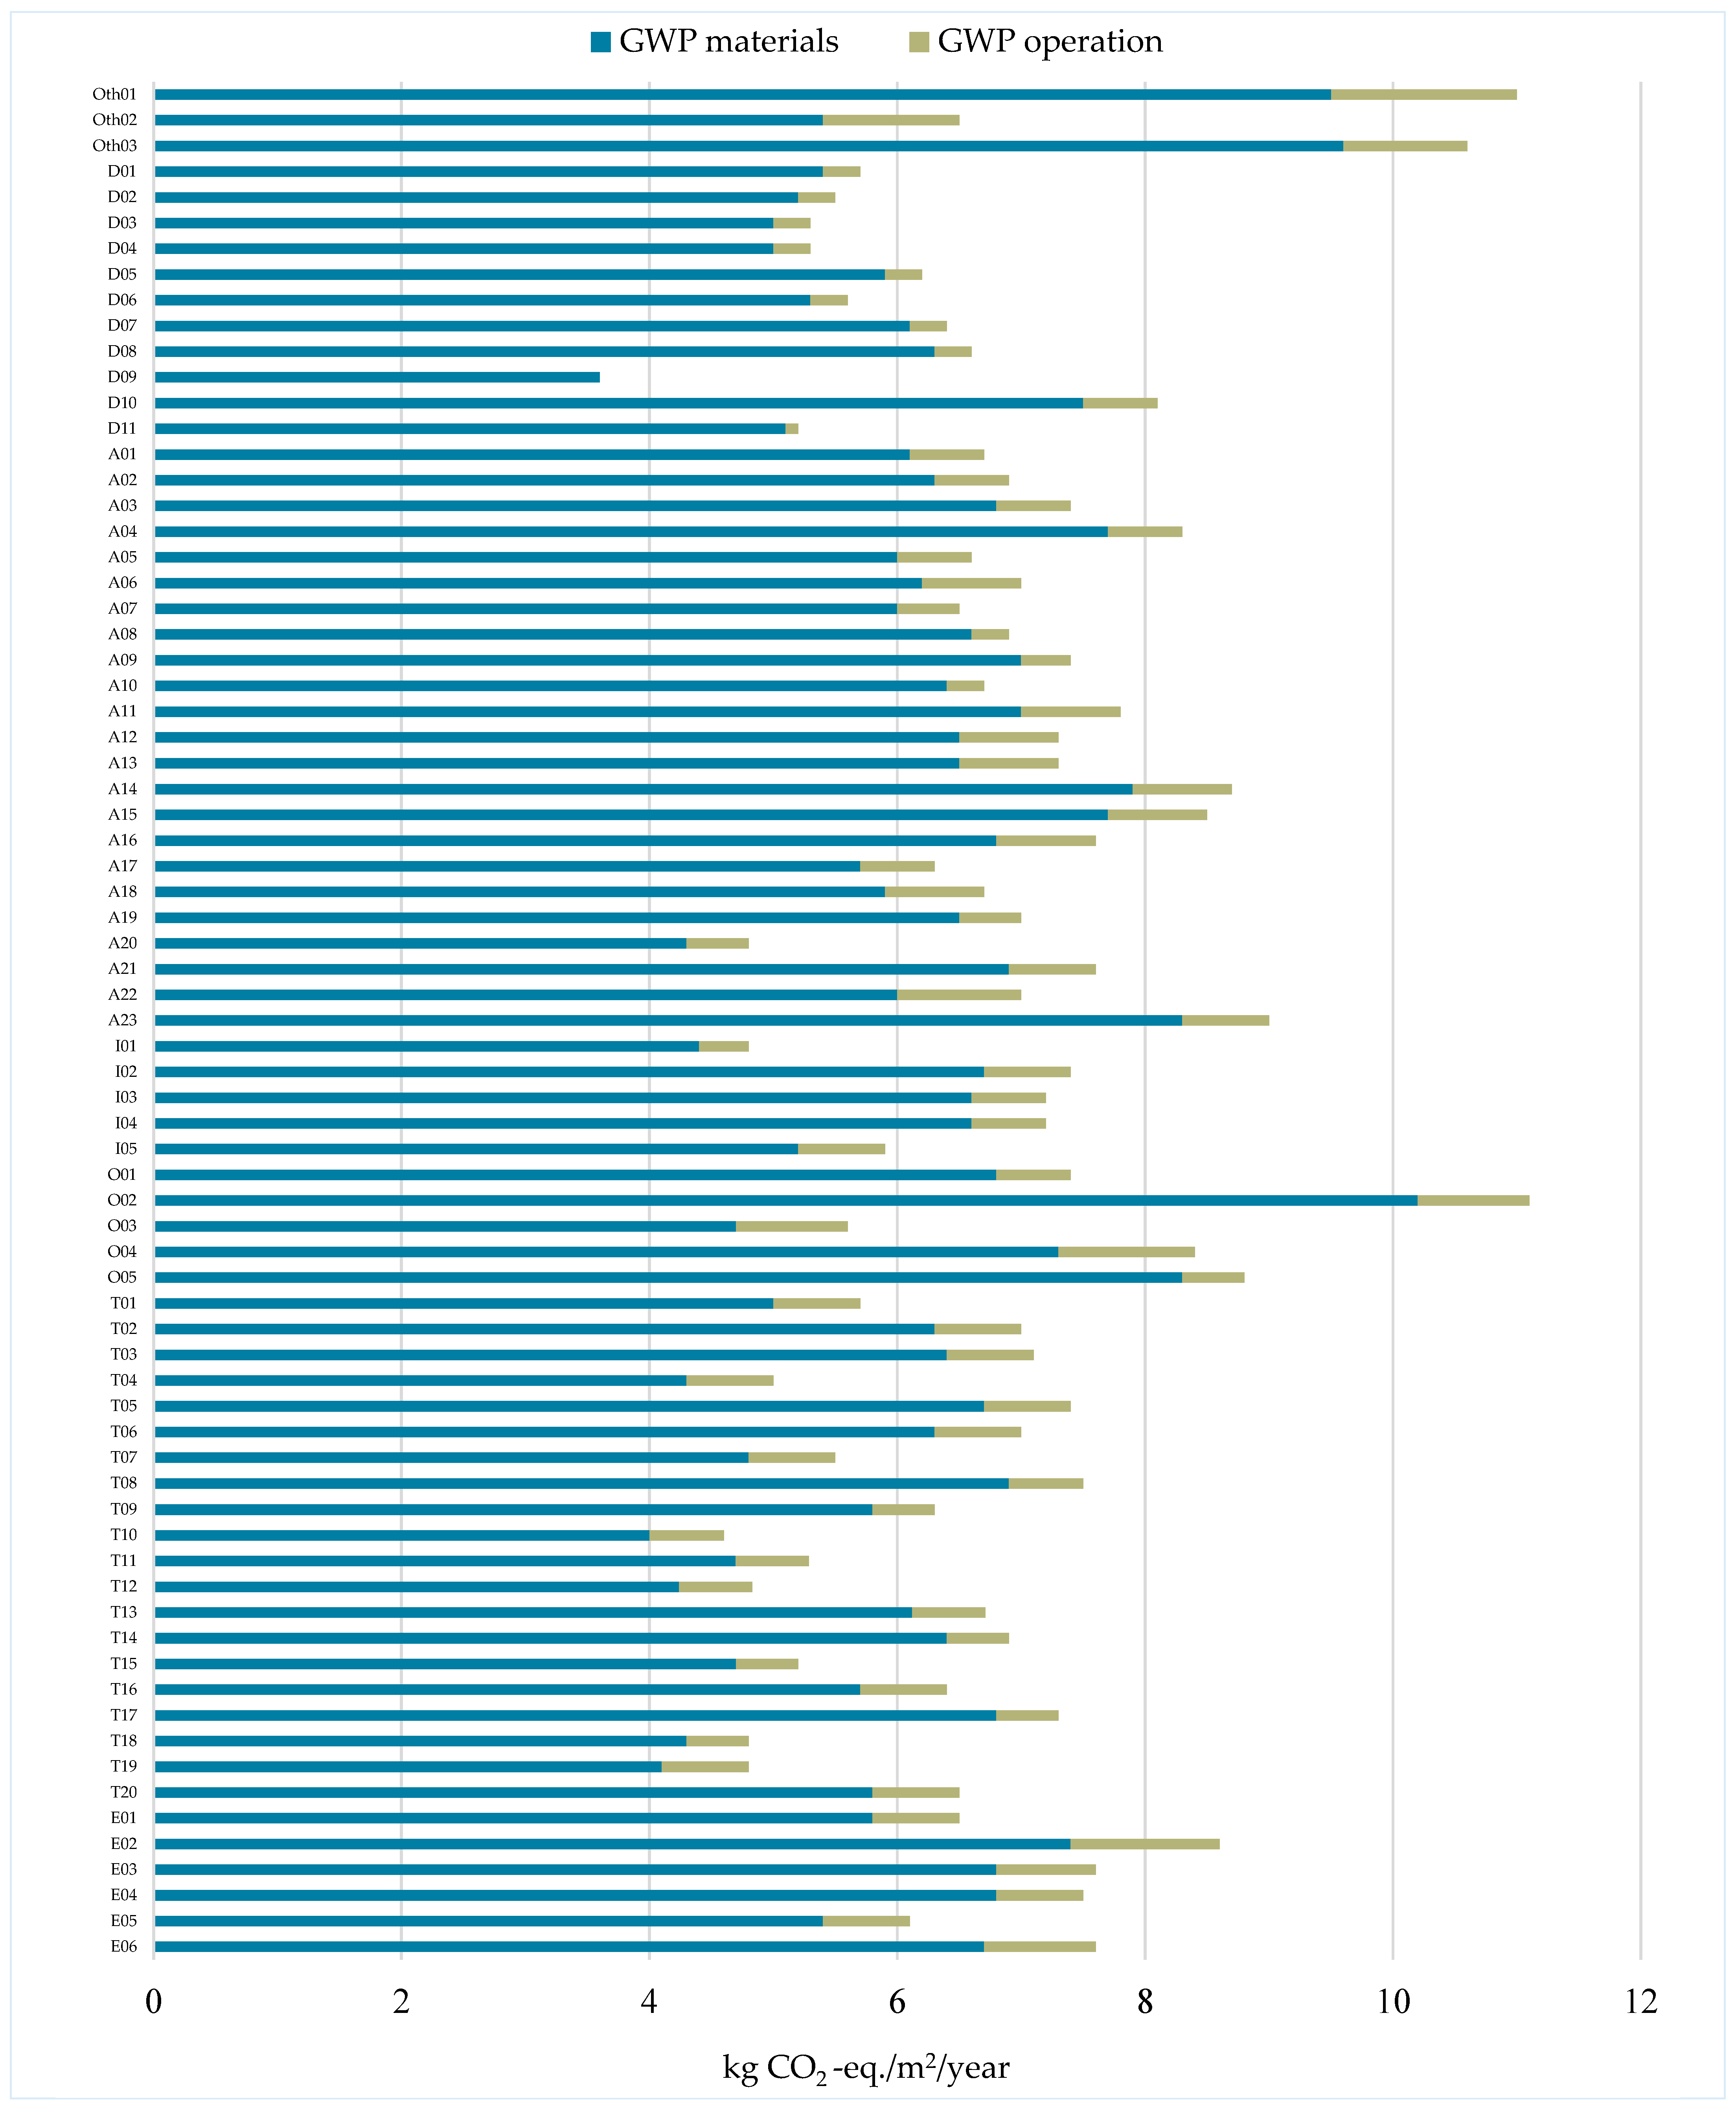
This section presents the results of all 73 case buildings for their GWP expressed in kg CO2-eq./m2/year. In Figure 8, the impacts have been split into those from materials and those from operation. The overall GWP varies greatly, with the lowest score being 4.1 and the highest being 12.7 kg CO2-eq./m2/year, more than 3 times the lowest. Impacts from materials are, on average, 10.5 times higher than those from operation, with the lowest ratio being 5.2 and the highest being 51. Building materials’ impacts vary from 3.6 to 10.2 kg CO2-eq./m2/year, while operation impacts range from 0.1 to 1.5 kg CO2-eq./m2/year. This confirms the tendency that results from the previously sole focus on reducing emissions from operations. As buildings become more energy efficient and operational impacts decrease, embodied impacts from materials take a larger share of total GWP. Increasing energy efficiency may require more materials, such as insulation, which adds to embodied impacts.
It should be noted that actual impacts from both operation and materials will likely be higher than calculated. Operational impacts are based on energy performance calculations that do not cover all energy use and rely on standard assumptions that may not reflect real scenarios. Embodied carbon includes only certain life cycle modules, as stated in Chapter 3; the entire building life cycle is not covered. Impacts from transportation to/from the site, construction waste, and repair/maintenance during use will add to embodied impacts.
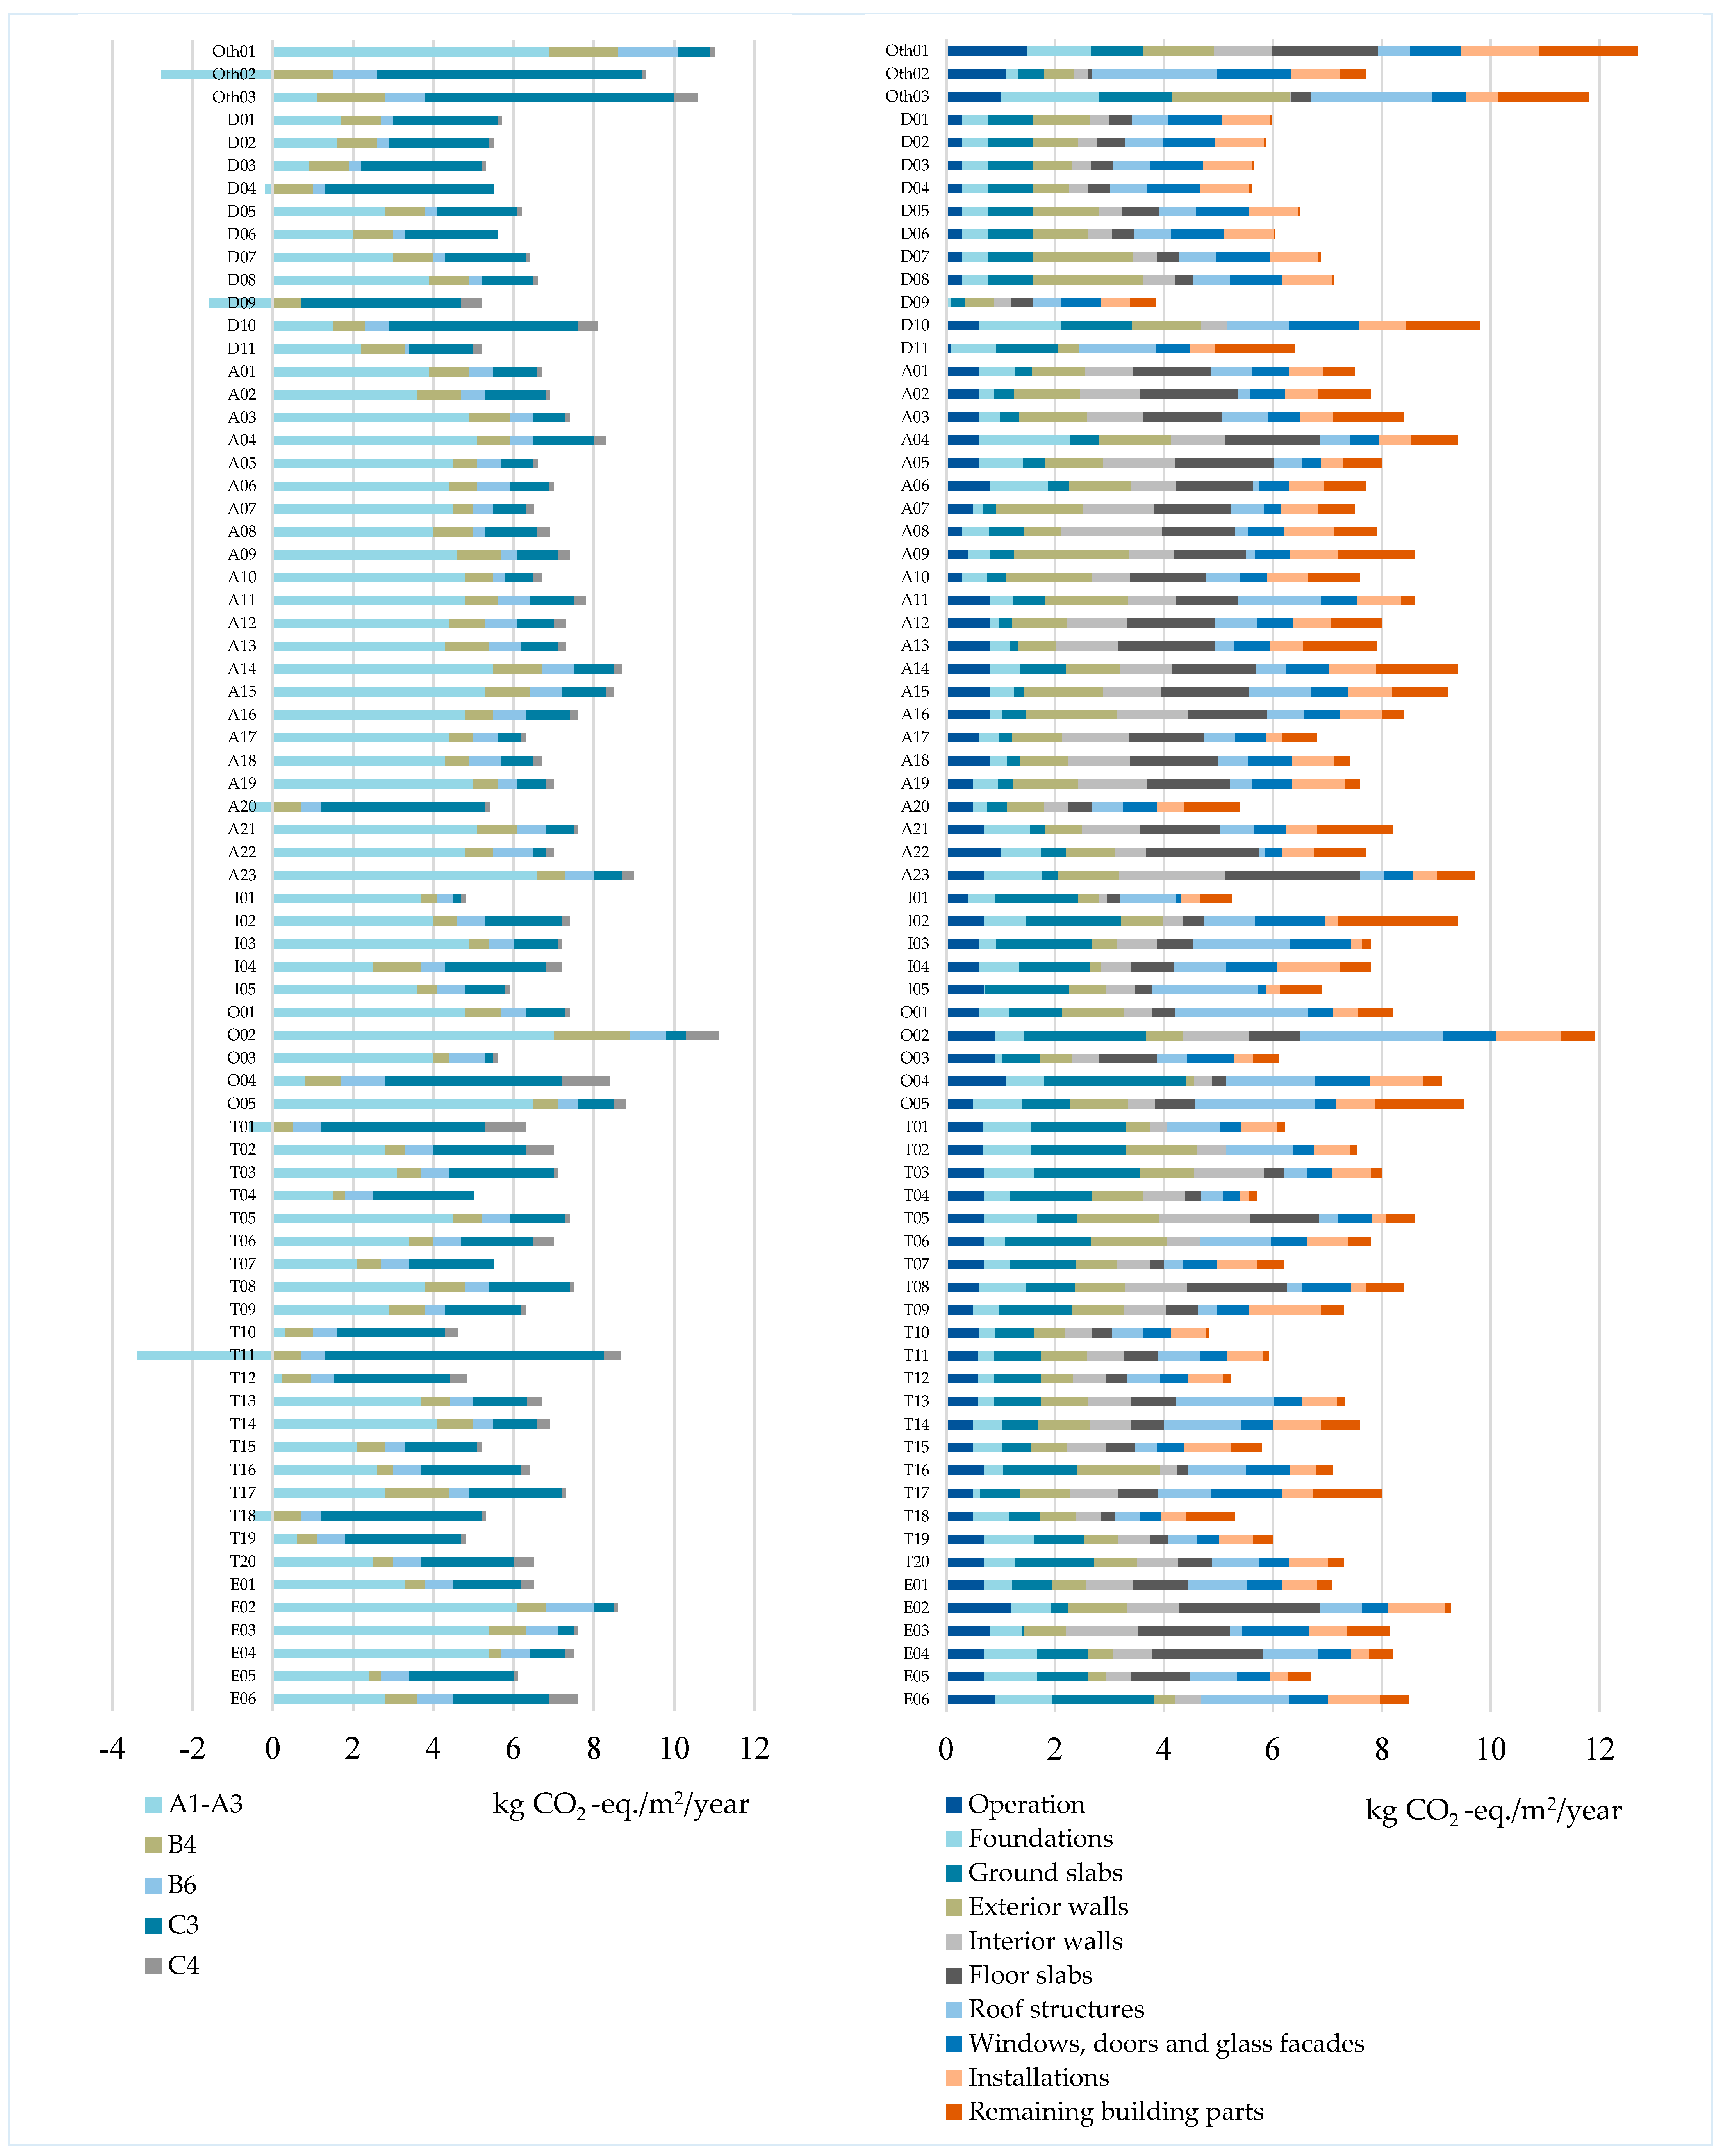
In Figure 9, emissions are divided into life cycle modules (left) and building parts (right) as described in Section 3.1. On the left, emissions in modules A1–A3 and C3 vary significantly. Buildings with lower emissions in material production tend to have higher impacts in waste processing at end-of-life and vice versa. This is due to biogenic carbon accounting: carbon sequestered in bio-based materials has a negative impact in A1–A3 but is assumed to be released at end-of-life in C3, causing high impact at that stage. The right side shows that building parts contributing most to GWP, with the highest averages, are ground slabs, exterior walls, floor slabs, and roofs. Figure 7 shows that ground slabs, exterior walls, and floor slabs are mostly mineral-based materials like concrete. Roof structures are primarily bio-based. The high impact of roofs is likely due to roof finishing being included in this category (see Table 9) and roof insulation having a high compressive strength. Most buildings use roofing felt as a finish, which ranks higher than regular concrete on the material pyramid [79], increasing roof impact. The most contributing parts are also among the largest in material amounts and weight.
In Figure 10, the GWP for embodied carbon and operation is visualised by building typology. The impact of building materials varies significantly between typologies, while the operational impact is more consistent. The Other buildings category has the highest mean and average, but consists of only three very different buildings, making it not very representative. Detached houses and Terraced houses have the lowest embodied carbon values, likely due to lighter structures with a higher share of bio-based materials. As shown in Figure 7, most detached and terraced houses either lack floor slabs or have bio-based floor slabs. Since floor slabs constitute a significant emission contributor, reducing them lowers the overall impact. The variance in embodied carbon supports making different regulatory requirements by building typology. However, more cases are needed for Other buildings, Industry, Offices, and Education to make representative suggestions (see Figure 5).
Operation impact shows low variance across typologies, with Other buildings slightly higher. The lowest operational impacts are in Detached houses and Industry. Detached houses are smaller and mostly use electric heat pumps, which explains their lower impacts. Industrial buildings often need less heating, ventilation, and lighting, resulting in low energy use. The highest operational impacts are in Education and Offices, due to high electricity demand for equipment, lighting, and ventilation systems, which detached houses lack. Terraced houses and Apartment buildings fall in the middle; they have lower energy needs than education and offices, but mostly use district heating, which has a higher impact than electric heating.

4.3. Results from the Biodiversity Calculations of Case Buildings

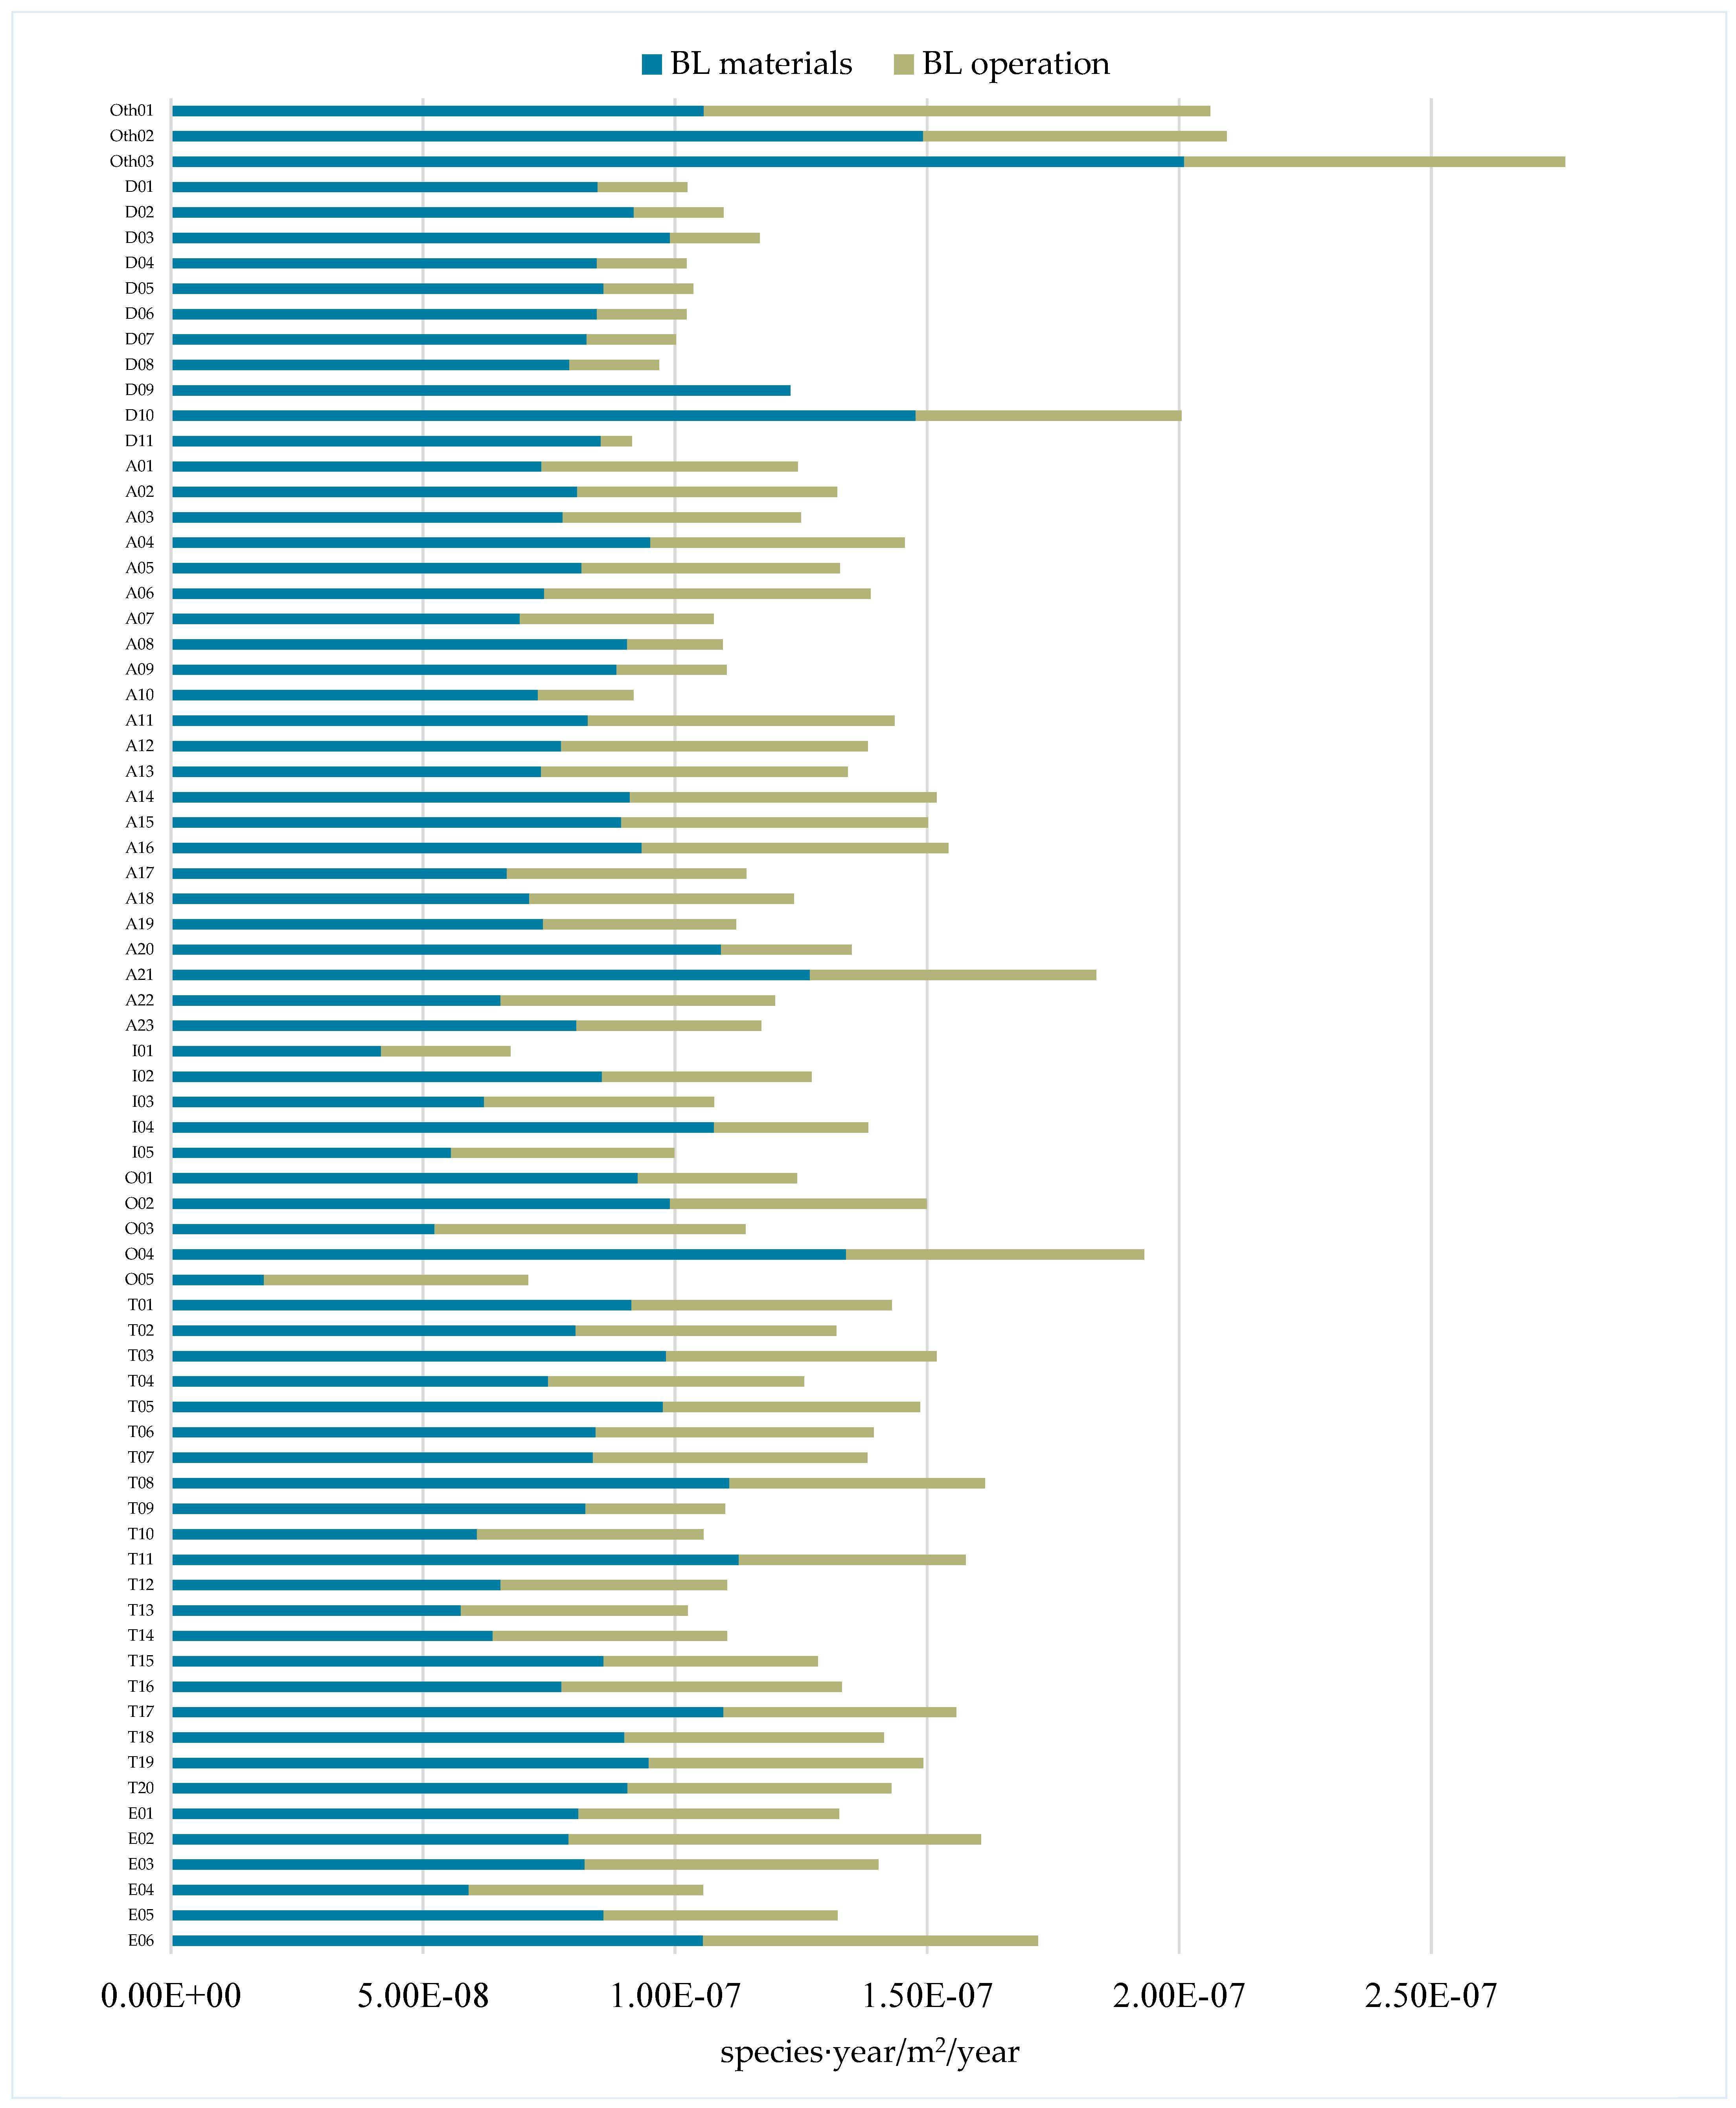
In this section, the results of the biodiversity calculations for all 73 case buildings are presented in species·year/m2/year. In Figure 11, impacts are divided into embodied impacts from materials and operational impacts. The total biodiversity impact varies significantly, with the lowest at 7.81 × 10⁻⁸ species·year/m2/year and the highest at 3.34 × 10⁻⁷, more than 4 times greater. The embodied impact is, on average, more than twice the operational impact, with ratios ranging from 0.4 to 13.8. Material emissions range from 1.9 × 10⁻⁸ to 2.0 × 10⁻⁷, while operational emissions range between 6.2 × 10⁻⁹ and 1.0 × 10⁻⁷ species·year/m2/year. However, as described in Section 4.2, actual impacts may be higher due to assumptions in energy performance calculations and excluded life cycle modules.
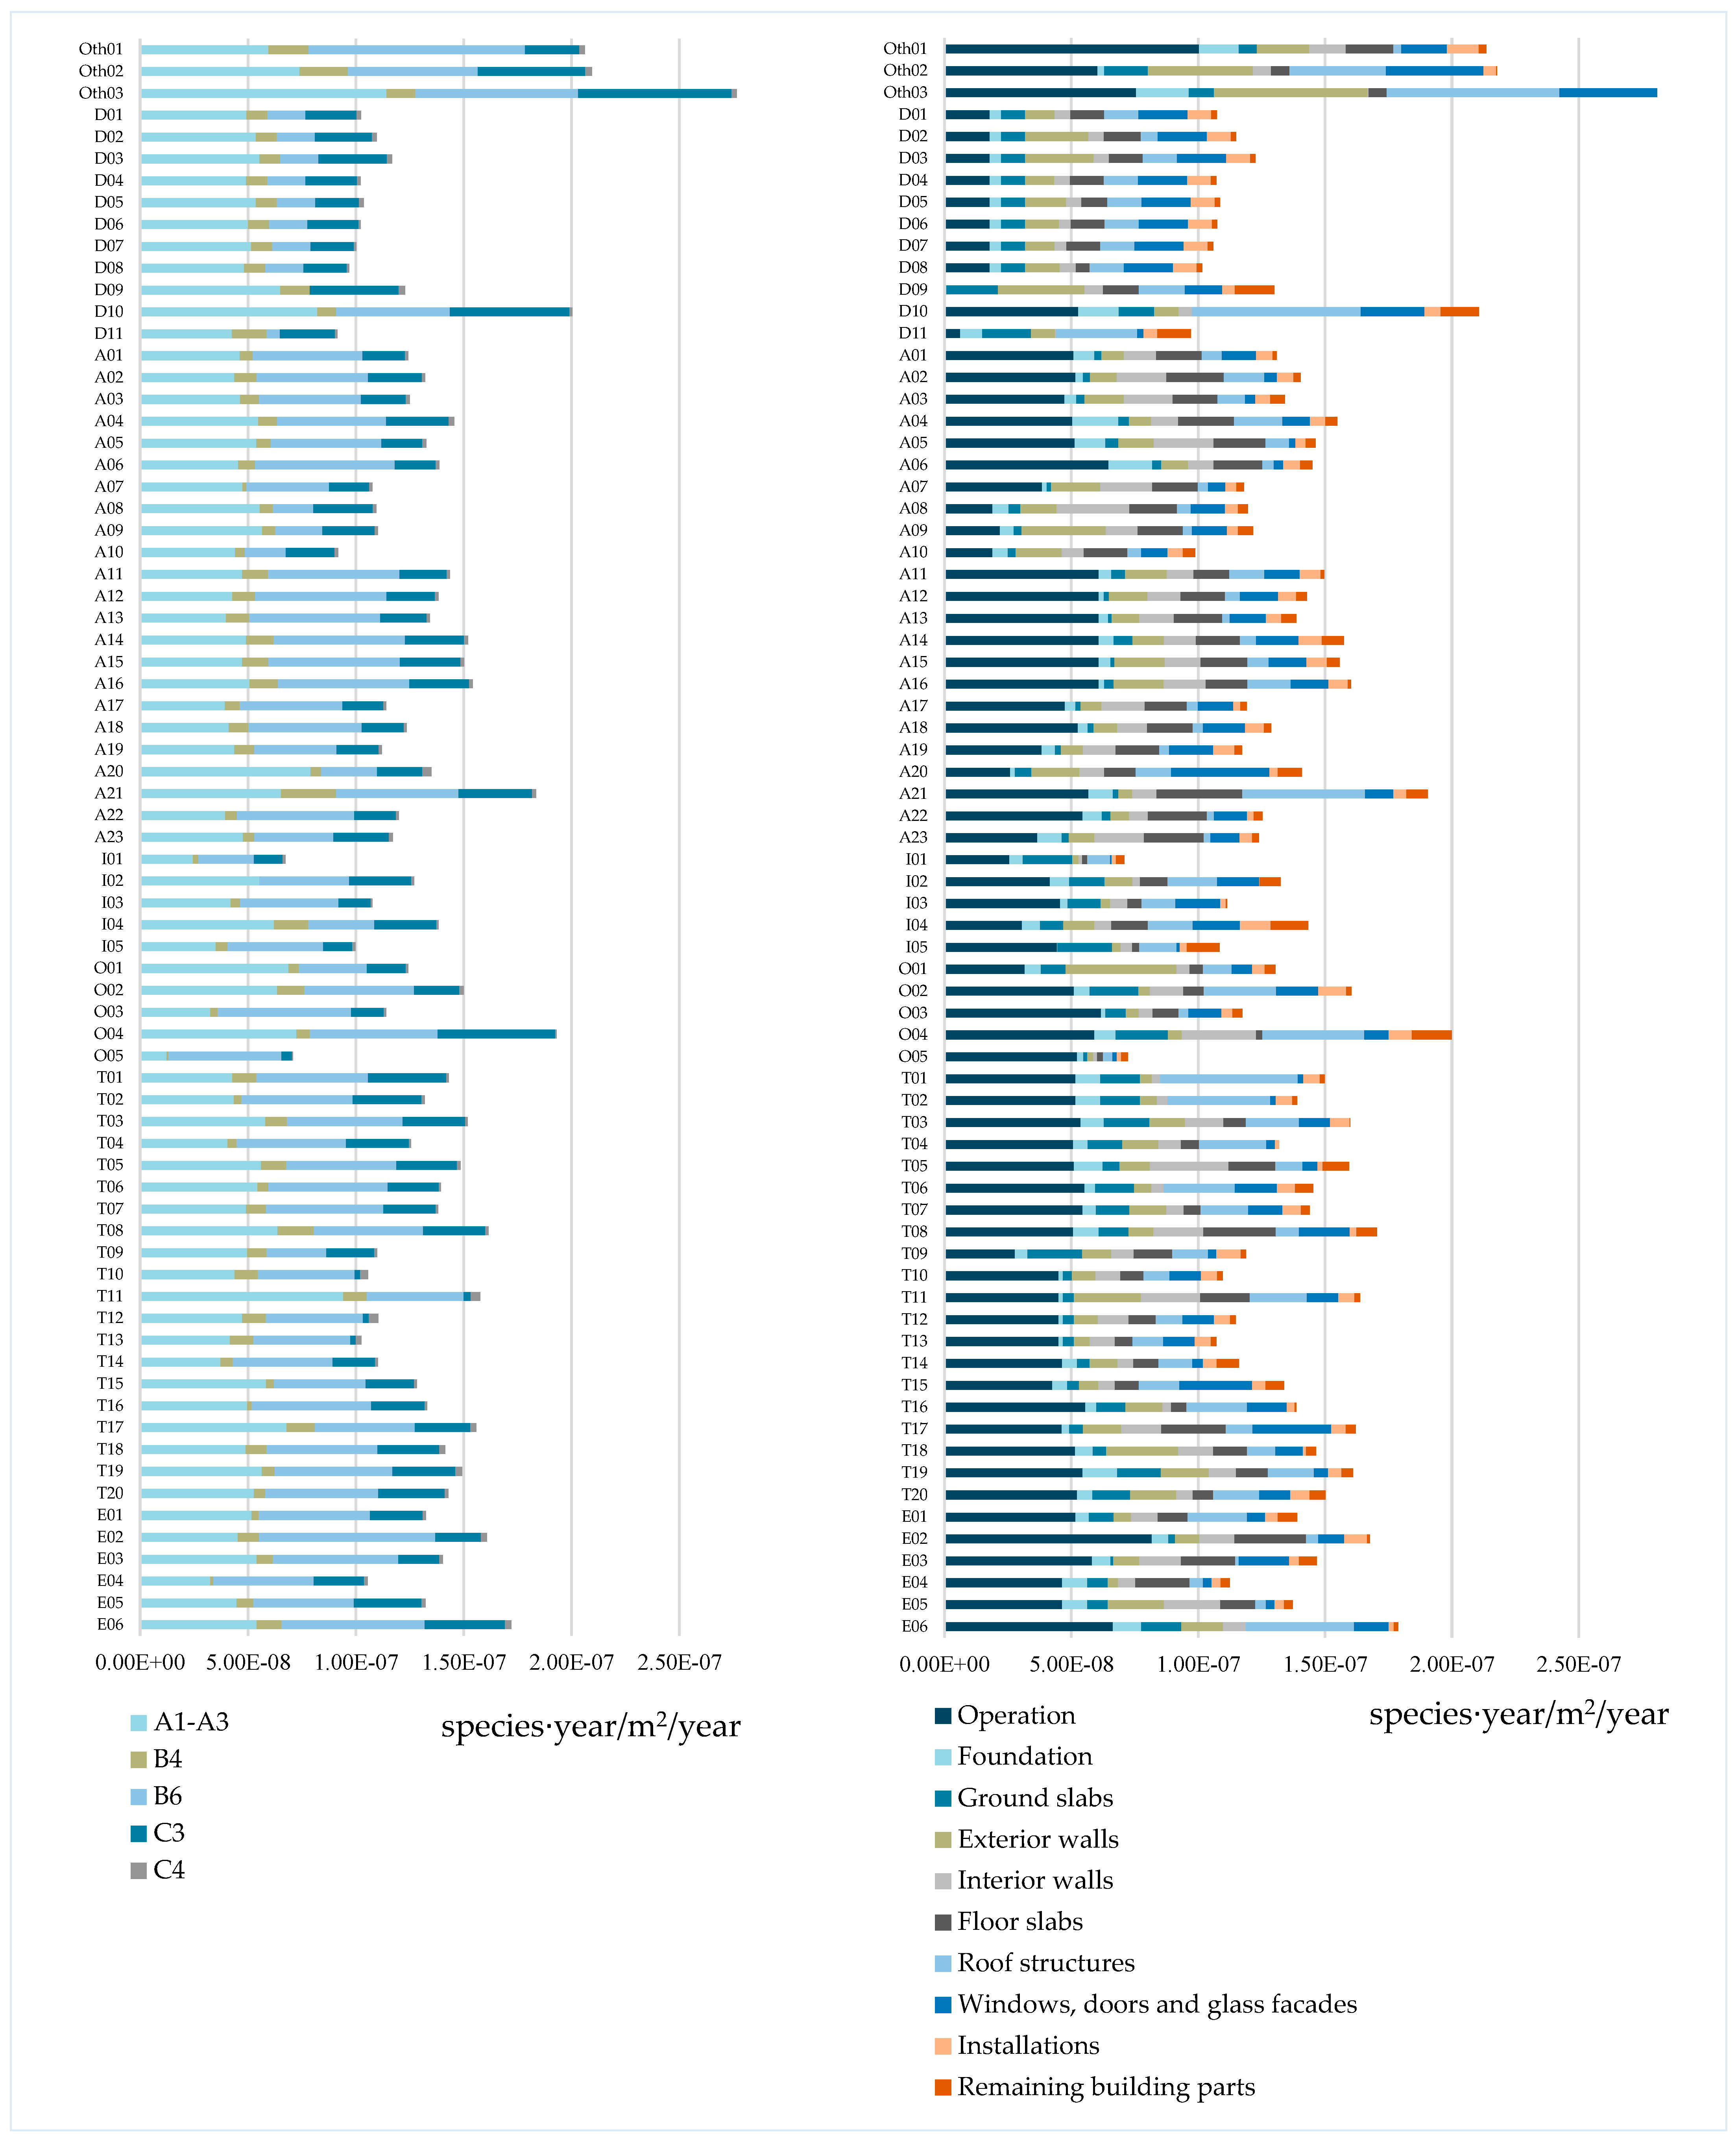
Figure 12 divides biodiversity loss into life-cycle modules (left) and building parts (right), as described in Chapter 3. Modules A1–A3 and B6 contribute the most in most cases. Some buildings with negative GWP in A1–A3 (see Section 4.2) show high biodiversity loss in the same modules, indicating that while bio-based materials capture CO2, which is beneficial for climate change, they negatively affect biodiversity mainly due to land use and land use changes during harvesting. The high impact of module B6 relates to the demand for heating and electricity. As mentioned in Section 3.2, the district heating dataset used is an EU average, not representative of Denmark. Using a Danish average would likely reduce emissions. District heating generally dominates energy use in buildings, with 50 of 73 cases using district heating, so most B6 impact likely stems from it.
The right side of Figure 12 shows that the main contributors to biodiversity loss are building operations, exterior walls, floor slabs, and roof structures. Exterior walls and floor slabs are mostly mineral-based (see Figure 7), while roofs are primarily bio-based. Due to their size and weight, these large building parts contribute most to biodiversity loss.
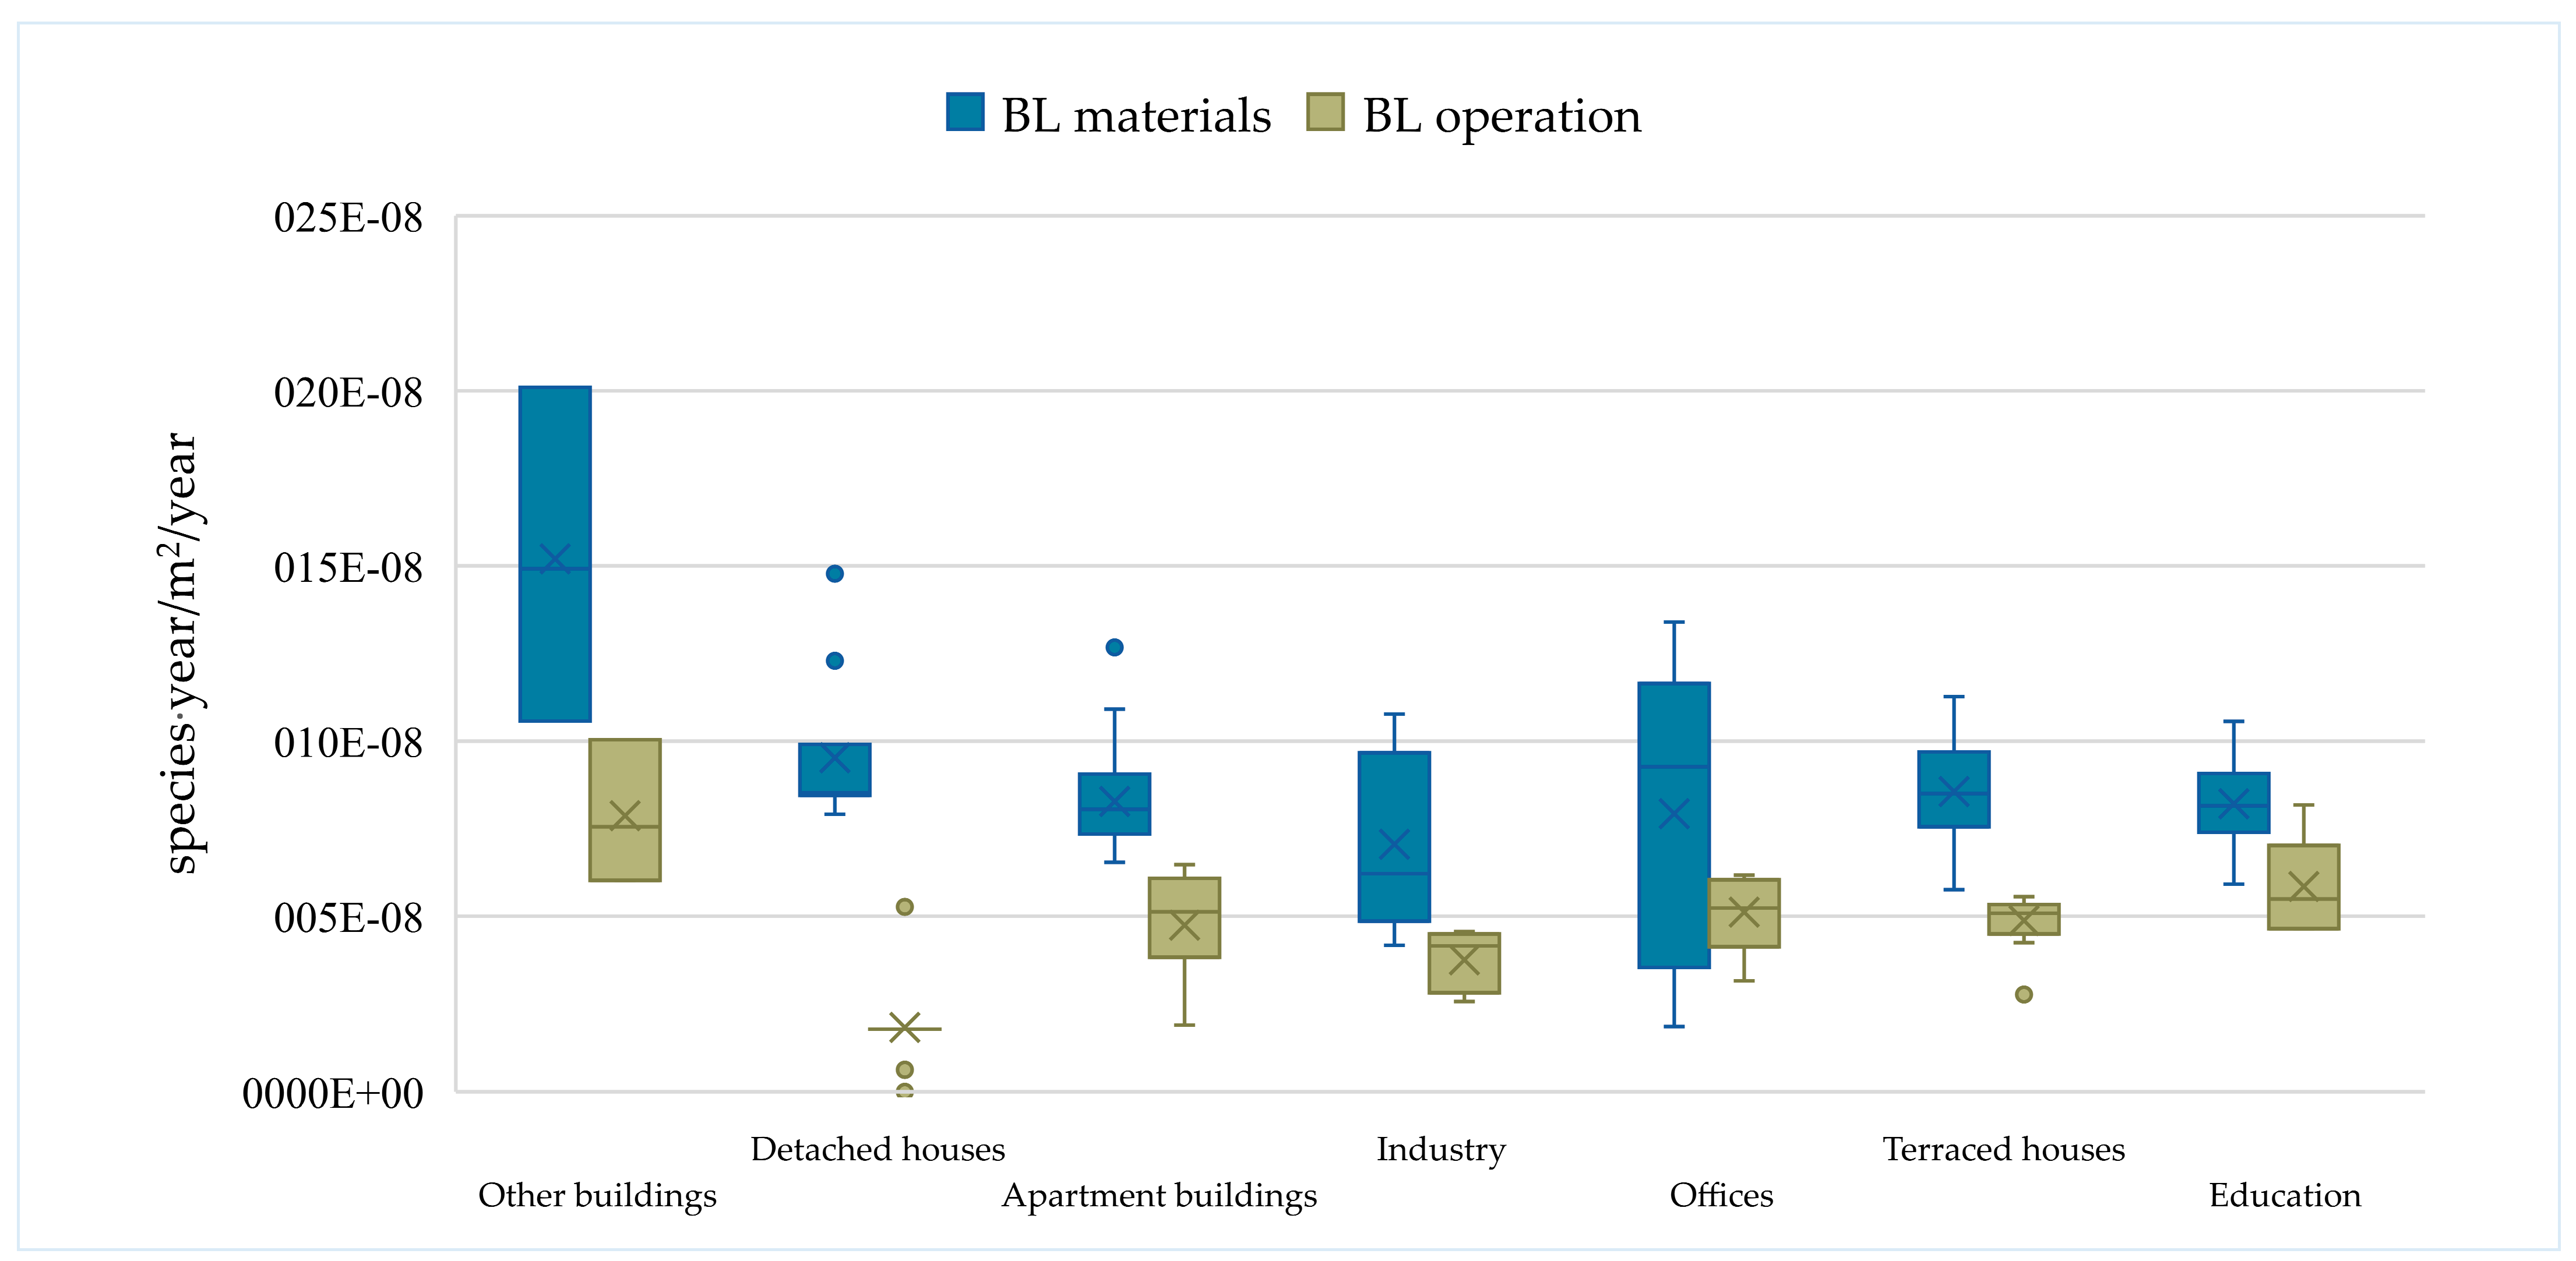
In Figure 13, the biodiversity loss associated with embodied impact and operation is illustrated by building typology, revealing considerable variation across the different typologies. The category Other buildings has the highest mean and average values for both embodied and operational impacts; however, it represents a very small number of cases, making it non-representative. For embodied impacts, the highest average values are in Detached houses and Terraced houses, while the highest mean values are in Offices and Terraced houses. The categories are relatively close. Many Detached and Terraced houses have a higher share of bio-based materials in floor slabs, exterior walls, and interior walls (see Figure 7). This higher ranking could indicate that building types with more bio-based materials have a higher biodiversity impact.
The impact of building operations varies notably between categories, with the ranking of mean and average values aligning with the results for GWP in Section 4.2, where explanations were given. Operational impacts comprise a notable share of total impacts, as addressed in Section 3.2 and summarised earlier.
Given the variance in embodied and operational biodiversity impacts, separate requirements based on building typologies would be reasonable if biodiversity loss calculations were regulated. However, Other buildings, Industry, Offices, and Education each have too few cases to provide proper representation (see Figure 5).

5. Discussion

This section discusses the results presented in the preceding section. The first part covers the methodological assumptions and limitations, which are discussed and related to relevant aspects in earlier chapters. The results are then compared to the upcoming Danish regulations. The second part compares the results for GWP and biodiversity loss, focusing on both embodied and operational impacts.

5.1. Considerations of LCA Methodology

One factor influencing LCA results is the type of data used. In Section 2.1.2, different databases containing LCA data were mentioned, including generic data and EPD data. Generic data is environmental impact data for an industry average product, whereas an EPD is LCA documentation for a specific product. Databases can publish generic data, EPDs, or both. In LCAbyg, used for all case building LCAs, the GenDK database is integrated, including all generic data from the Danish building regulations appendix. This database was the source for generic data, but EPDs from several databases were also used (see Section 3.1). Although Denmark was the intended market for each EPD, quality can vary, and mistakes occur in many published EPDs. Many EPDs lack calculation details, limiting insight and increasing uncertainty.
When calculating environmental impacts, an end-of-life scenario must be chosen, which can significantly influence the impact. There is uncertainty because planned end-of-life scenarios may not be followed exactly.
Another data aspect is the versions of European standards. As noted in Section 2.3, EN 15804:2012 has been amended twice. The GenDK database follows the first amendment, EN 15804:2012+A1:2013. Therefore, EPDs following this version were preferred. However, as this version is being phased out, EPDs following the second amendment, EN 15084:2012+A2:2019, were used when no alternatives existed. Differences in characterisation factors and GWP results between versions add uncertainty to impacts; however, the problem of this uncertainty lies in the Danish building regulations, which allow EPDs from different amended versions of the standard in the same LCA. For biodiversity loss, LCIA methods in EPDs and GenDK are insufficient, as they use midpoint indicators, whereas biodiversity loss is an endpoint impact (see Section 2.1.1). The Ecoinvent database provided endpoint data via ReCiPe 2016 for all case buildings. This method is increasingly integrated but has higher uncertainty due to lower regionalisation. Regionalised LCIA methods, such as Impact World+, provide a more realistic assessment of biodiversity impacts for materials, particularly bio-based ones, due to regional differences in land use. However, such methods require more regional data, which is often unavailable in current LCA practice. Moreover, collaboration between LCA practitioners, ecologists, and bioscientists is necessary, as building industry LCA experts often lack knowledge of local biodiversity and its impact on actions. This collaboration exists in the Biodiversity Net Gain UK regulations (see Section 2.3) and should be more widely adopted.
Regarding data, the Danish regulations currently specify which data is allowed in the performance of LCAs. Since this data does not account for biodiversity loss, we have used Ecoinvent data directly to calculate biodiversity loss, which is contrary to Danish regulations. This suggests a need for better and more inclusive data in the Danish regulations.

Comparison with the New Danish Regulations

Requirements for GWP accounting of new buildings were introduced in Danish legislation in 2023, and as discussed in Section 2.1, the requirements are being tightened from July 2025. The case buildings in this study were taken into use between 2022 and 2026, reflecting current Danish building practices. The median, lower quartile, and upper quartile for the GWP of each building typology are compared to upcoming requirements in Table 10. Of the included typologies, Other buildings and Offices are the only categories whose median value surpasses the upcoming requirements. Regarding the lower quantile, only Other buildings surpass the requirements, while Apartment buildings and Terraced houses join the list when considering the upper quartile. The Other buildings category includes only three cases, two of which have a high environmental impact compared to the 2023 requirement, thereby raising the average. It should be noted that there is a high probability that many Other buildings will fall under critical infrastructure (such as airport buildings, prisons, and hospitals), which is exempt from the CO2 cap requirement (the calculation must still be met). Offices consist of 5 cases, and, as seen in Figure 5, the impact from materials gives the quartiles a larger variance, likely due to different material compositions (see Figure 10). While this shows that the new requirements can be, and, to some extent, already are fulfilled, many cases within typologies do not meet the upcoming requirements, indicating changes are needed in current practices. Some values in Table 10 are close to the new requirements, while others fall far below or slightly above, suggesting varying ambitions within the new limits for different typologies. The significant variation in results indicates that new requirements, which take into account the building typology, are reasonable, rather than a single upper limit for all. It should be noted that these requirements do not include modules A4 and A5, nor stage D, which should be documented separately.

5.2. Comparison of Results for GWP and Biodiversity Loss

When examining the results for the different building typologies in Figure 10 and Figure 13, it is evident that the category ‘Other buildings’ has the highest embodied and operational impacts for both GWP and biodiversity loss. Three building cases are included in this category, all with different design requirements and demands. One of the buildings in this category fulfils the requirements to allow an increased climate impact according to Danish regulations. Another building has a heavy structure, but it is the lowest area of all buildings in this study. This category is difficult to evaluate due to the diversity of the buildings. With this category covered, the focus will be on the remaining building typologies in the following sections.

5.2.1. Embodied Impact of Case Buildings

The method used in this study to account for biogenic carbon is the −1/+1 method, as described in Section 3.1. Using this method, cases with high amounts of bio-based material have low or negative impacts in modules A1–A3 (see Figure 9). While these cases show lower emissions in production, their impact at end-of-life is increased, and the sequestered carbon in bio-based materials is accounted for as being released independently of the end-of-life scenario. Bio-based materials may reduce emissions early in the life cycle, helping with short-term CO2-eq. goals. However, environmental impacts are shifted to future generations, which is both an environmental and ethical problem. As discussed in Section 2.3, static methods do not reflect forest dynamics, potentially neglecting actual impacts. For bio-based materials to be a good long-term choice, reuse strategies must be considered, as prolonging material life allows more time for forest regrowth, as assumed in the IPCC method of carbon neutrality after 100 years (see Section 2.3). Comparing impacts from modules A1–A3 for GWP (Figure 9) and biodiversity loss (Figure 12), cases with negative GWP impacts due to bio-based materials show positive impacts in biodiversity loss, indicating no biodiversity benefits from bio-based materials.
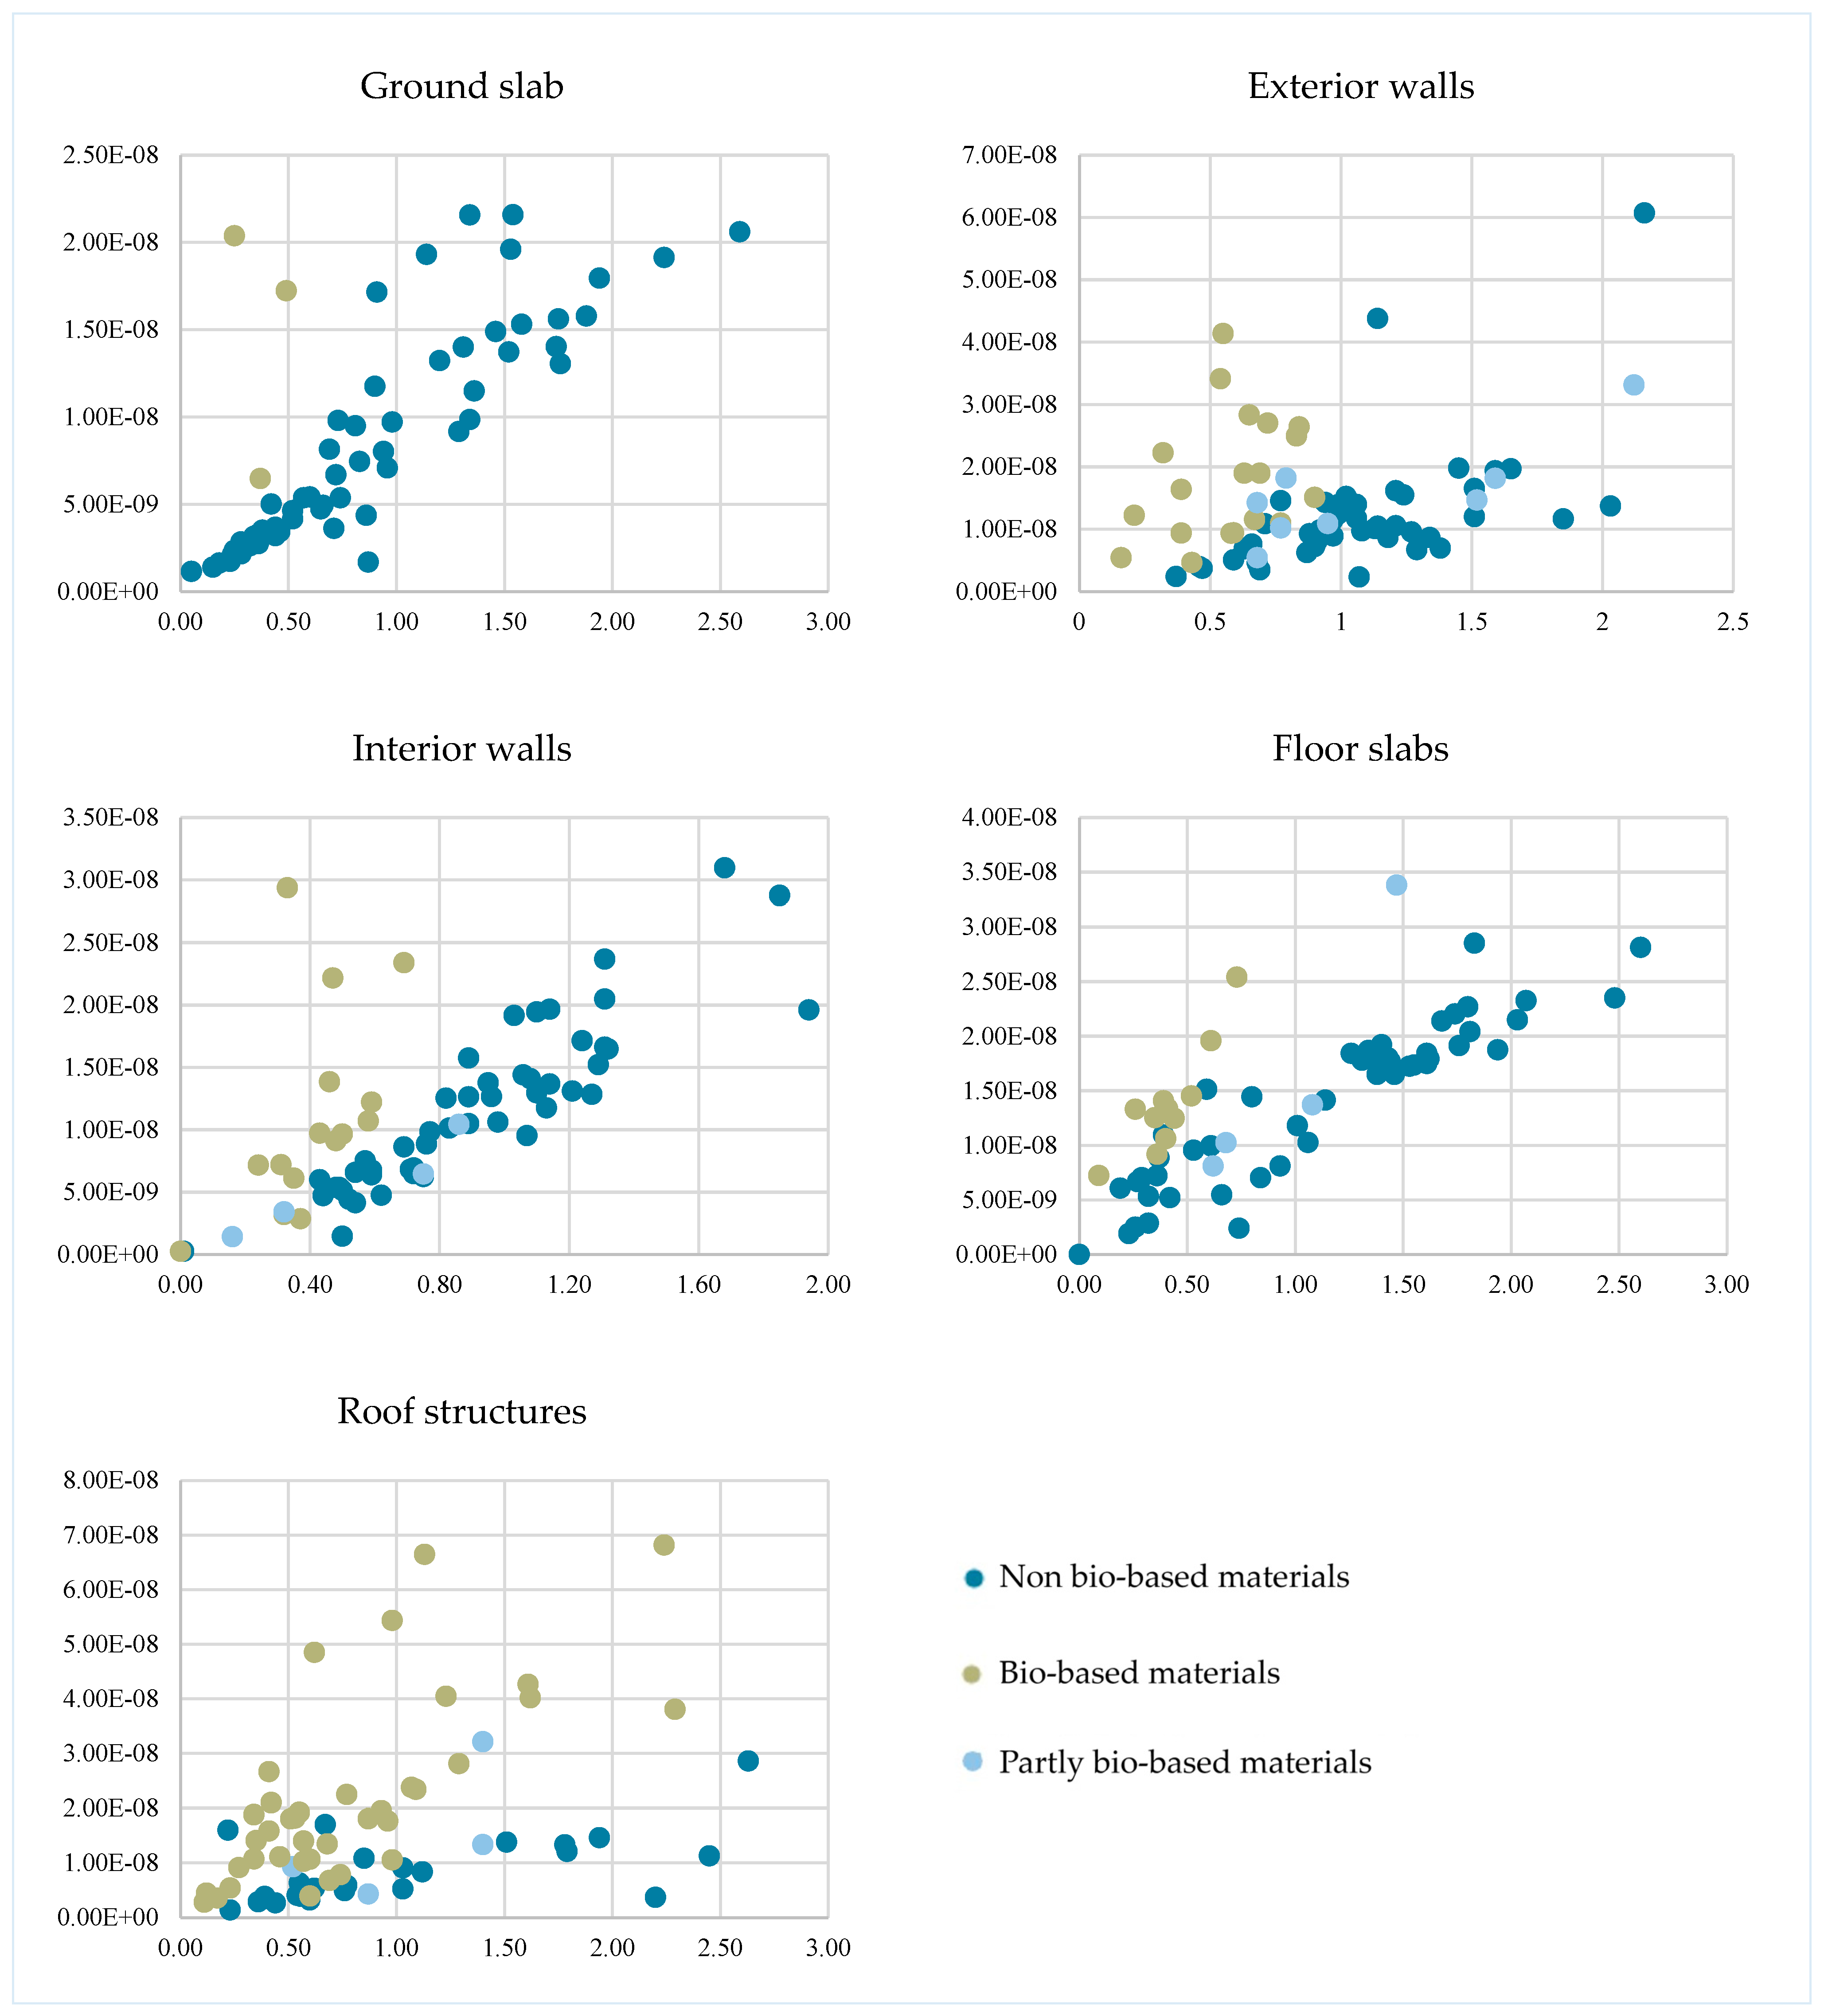
The mean and average values for GWP and biodiversity loss by building typology were covered in Section 4.2 and Section 4.3. Typologies differ in ranking between GWP and biodiversity loss. The most noticeable difference is Detached and Terraced houses, which rank low in GWP but higher in biodiversity loss. These typologies are characterised by a lighter structure and higher shares of bio-based materials in exterior walls, interior walls, floor slabs, and roof structures (Figure 7). Scatter plots in Figure 14 compare GWP and biodiversity loss for some building parts. For ground slabs, interior walls, and floor slabs made of non-bio-based materials, some correlation exists between GWP and biodiversity loss. However, bio-based building parts fall outside this relation and often have a higher biodiversity loss than a GWP impact. Exterior walls made of bio-based materials rank low in GWP but vary in biodiversity loss. Roof structures have the highest representation of bio-based material. Bio-based roof structures have a greater impact on biodiversity loss than non-bio-based ones. The scatter plot results include roof finishes as described in Section 3.1, but roof structures are marked bio-based if the structure itself is bio-based per Figure 7. This likely explains why some bio-based roof structures have noticeable GWP effects, as roofing felt and insulation are also included. There is a need to increase the scope of building LCA requirements, as focusing solely on GWP risks shifting the burden to other aspects like biodiversity.

5.2.2. Operational Impact of Case Buildings

In terms of operational impact, the results for GWP and biodiversity loss are very similar in ranking, as the categories Offices and Education have the highest mean and average values. In contrast, Industry and Detached Houses have the lowest values, as seen in Section 4.2 and Section 4.3. While the ranking of the typologies is similar, the relative size of the impact compared to the embodied impact differs. As mentioned in Section 3.1, the emission factors used in calculating climate change impact are the new 2025 emission factors. These values are intended to better represent the future Danish energy mix, resulting in a lower contribution from module B6 compared to calculations with the previous emission factors. As these emission factors have only been used in the calculation for GWP, it could explain why the operational impacts from biodiversity make up a bigger share of the total impact in these cases. Furthermore, the datasets used to calculate biodiversity loss only partly represent the Danish energy mix (see Section 3.2). The dataset used to calculate the impact from electricity is a Danish average, while the dataset used to calculate the impact for district heating is an EU average, assuming 60% of the energy production comes from hard coal combustion. Moreover, the European data is static, while the Danish dataset uses projected values. This last-mentioned dataset is recommended in the Reduction Roadmap [22,29]. However, it causes the impacts from district heating to be significantly higher than those from electricity per MJ. As district heating is used in many of the case buildings, the largest share of biodiversity loss is likely attributed to district heating. Nevertheless, the actual impact of energy consumption on biodiversity loss in module B6 is uncertain due to the unrepresentative data. To better understand the actual impact of biodiversity loss from building operations in Denmark, calculations using a representative scenario of a Danish energy mix should be performed and compared to these results.
Due to the significant impact of operational energy on module B6, a separate analysis is conducted in the following. While the study utilises the dataset recommended by the reduction roadmap, a static dataset for the average Danish district heating system in 2024 [80] is modelled. The Danish district heating sources are modelled using Ecoinvent, with 10% loss through distribution. The specific distribution is presented in Table 11.
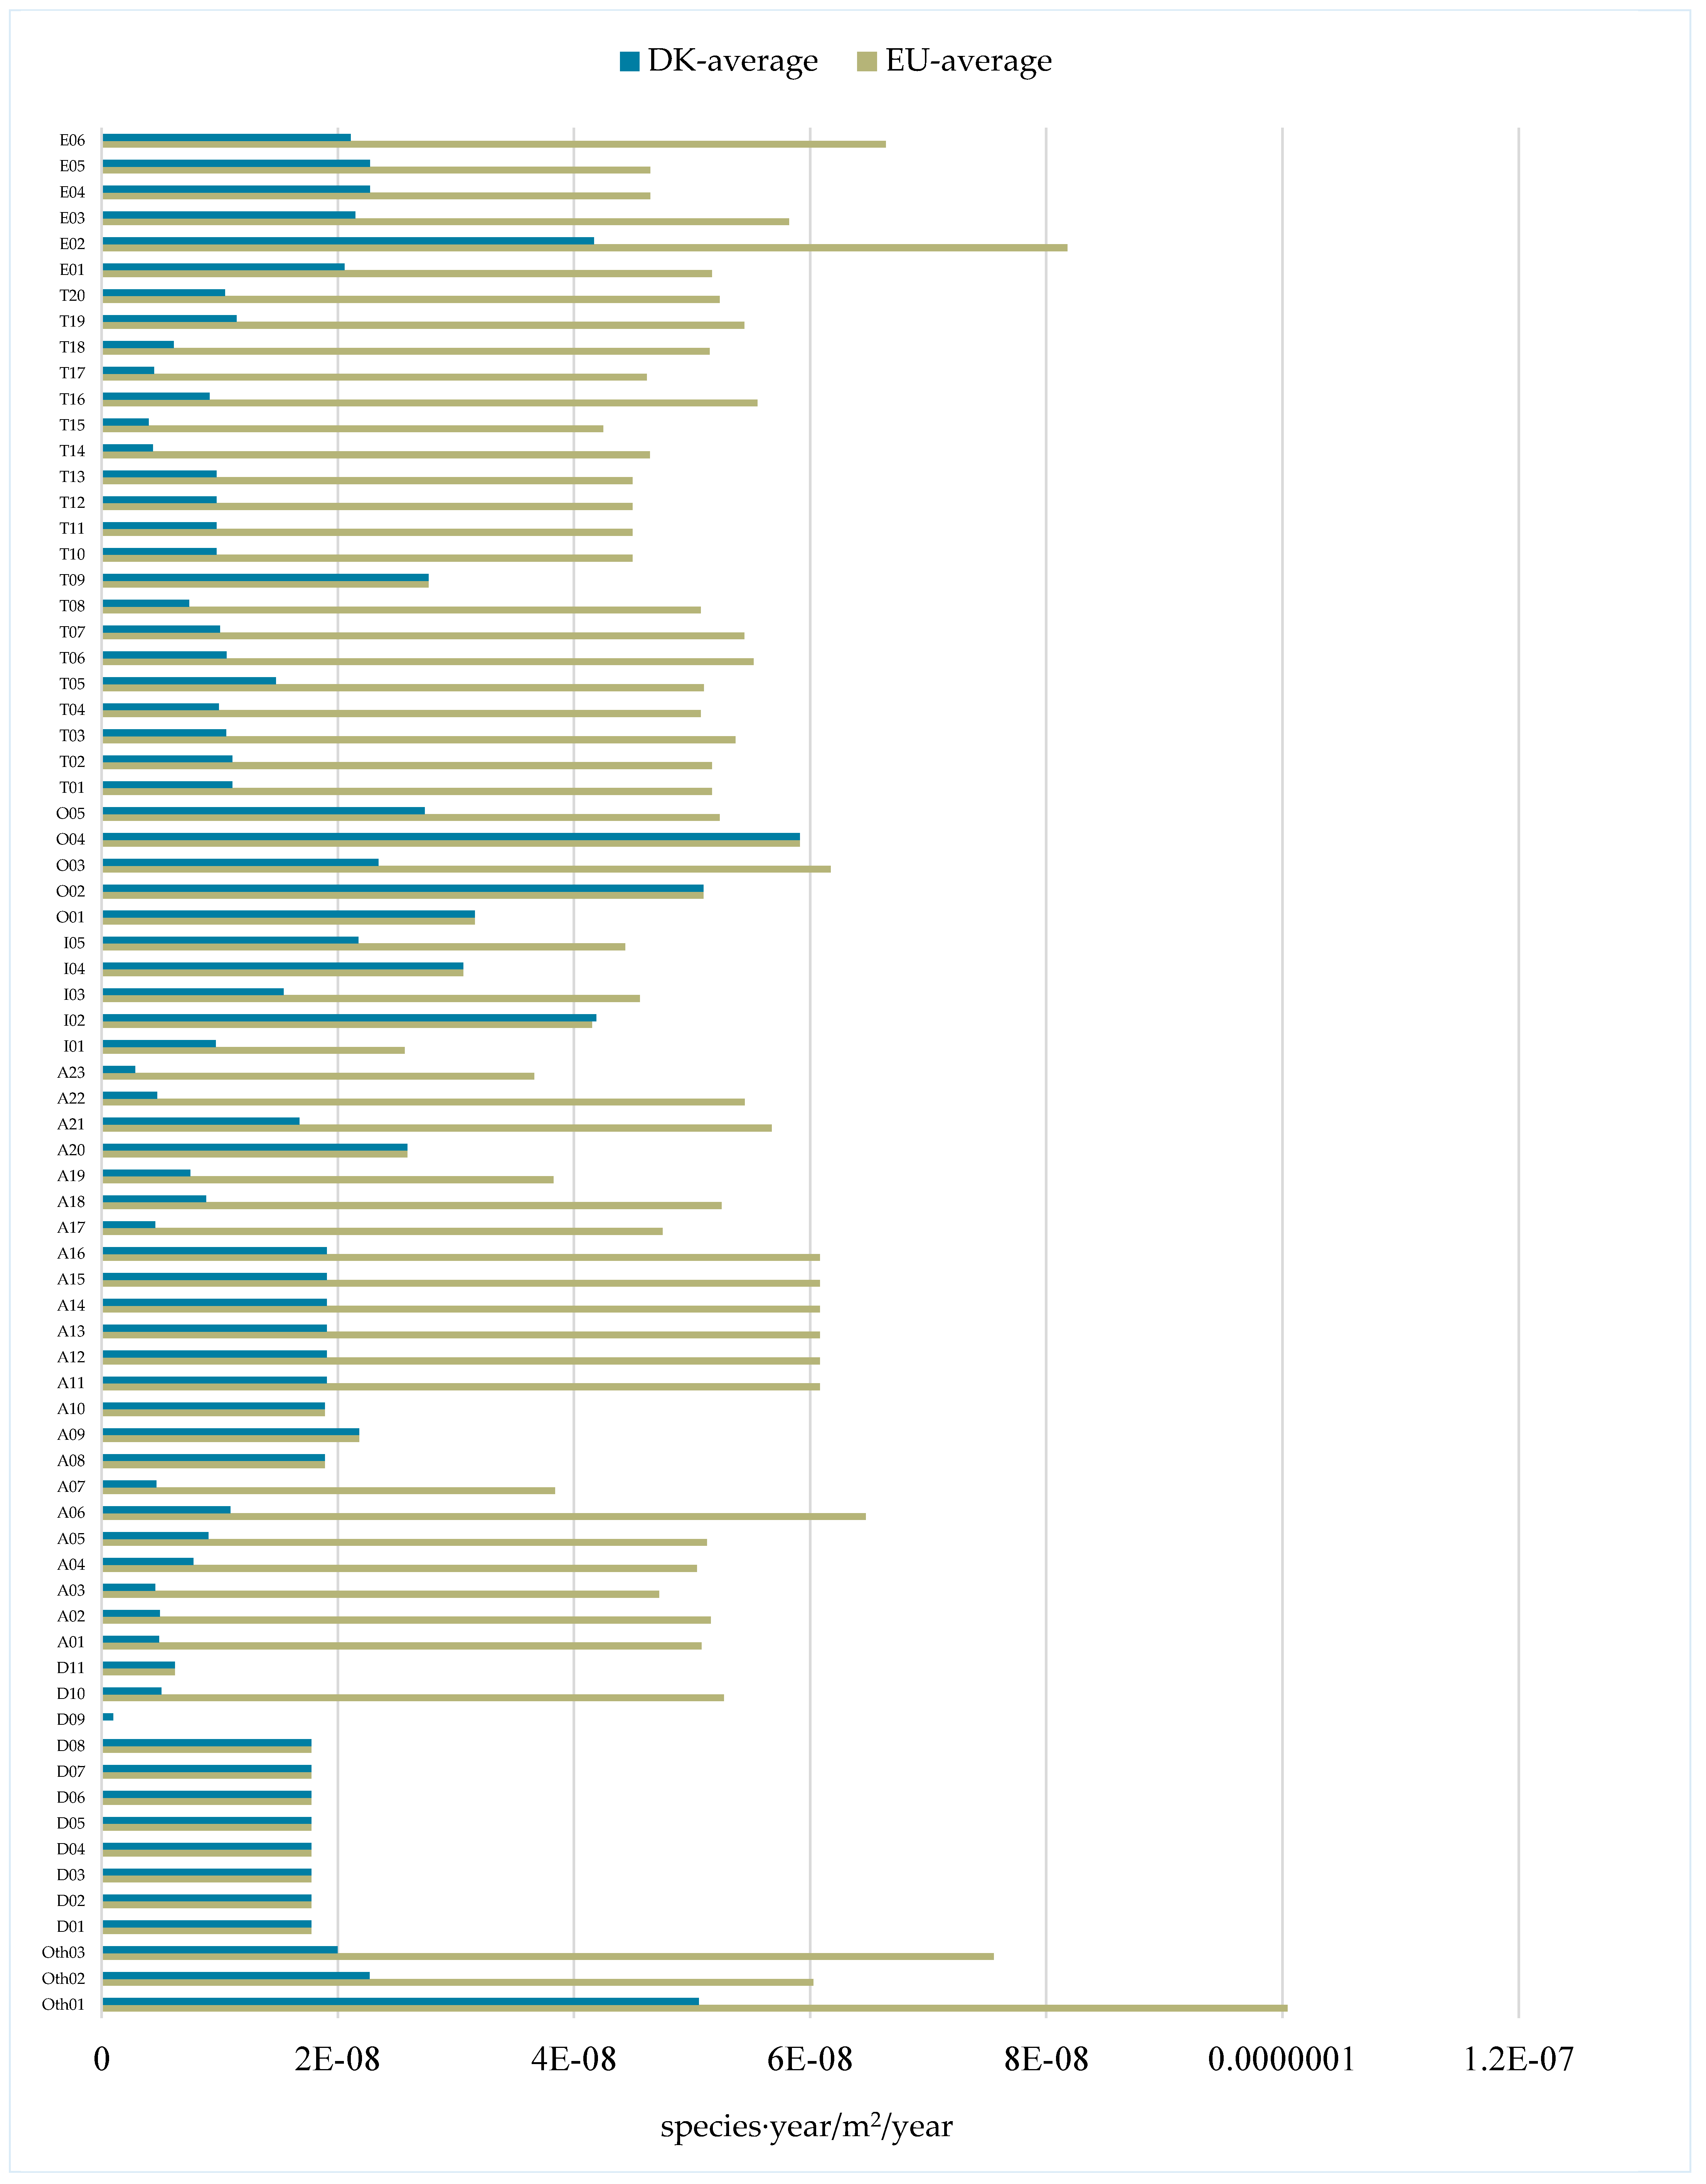
Figure 15 presents the biodiversity loss from operational energy use (i.e., module B6) compared across the two datasets. The results show a reduction in biodiversity loss by using the dataset for the Danish average between 0 and 92%. Projects that rely solely on heat pumps show no reduction.

6. Conclusions

This study conducted an analysis of 73 concrete cases of Danish buildings to assess their contributions to GWP and biodiversity loss. The findings underscore the critical need for regenerative design that concurrently addresses climate change and biodiversity loss in order to avoid shifting environmental burdens. In terms of operational impact, the results for GWP and biodiversity loss are very similar in ranking, with Offices and Education having the highest mean and average values, and Industry and Detached Houses the lowest, as seen in Section 4.2 and Section 4.3. While the ranking is similar, the relative size of the impact compared to embodied impact differs. As mentioned in Section 3.1, the emission factors used for climate change are the new 2025 factors, which better represent the future Danish energy mix and generally lower the contribution from module B6 compared to previous factors. Since these factors are only used for GWP, this may explain why operational impacts from biodiversity make up a bigger share of the total impact. Furthermore, datasets for biodiversity loss are only partly representative of the Danish energy mix (see Section 3.2). The electricity impact uses a Danish average, while the district heating impact uses an EU average, assuming 60% energy from hard combustion. This results in higher impacts from district heating compared to electricity per MJ. As district heating is often used in buildings, most biodiversity loss is likely attributed to it. Nevertheless, the actual impact of energy consumption in module B6 is uncertain due to unrepresentative data. The findings highlight key methodological issues, including the quality of EPDs, the regional relevance of assessment methods, and differences in European standards.

Research Limitations and Future Work

The life cycle modules included in the case studies enabled comparison with the Danish building regulations effective as of July 2025. These regulations introduce upper limits for GWP based on typology. However, the module settings that impose these limits do not include all that is required for documentation. Transportation to the construction site (module A4) and the construction process (module A5) must be reported separately. Future research should incorporate these modules into LCAs to explore their influence on GWP and biodiversity loss. Similarly, module D, which accounts for benefits and loads beyond the system boundary, warrants investigation for both GWP and biodiversity impacts.
Two distinct types of data were used for different impact categories: datasets mandated by Danish regulation, including EPDs, for GWP, and Ecoinvent for biodiversity loss. This approach reflects current regulatory requirements in Denmark, where Danish regulation explicitly prescribes the use of either national data sources or EPDs for GWP, limiting the use of other datasets, such as Ecoinvent. Thus, to enable the assessment of biodiversity loss, Ecoinvent was used in conjunction with the Danish mandated datasets, by systematically mapping corresponding Ecoinvent datasets to maintain methodological alignment. Nonetheless, this introduces a limitation regarding consistency in data sources, modelling assumptions, and geographical representativeness. While the mapping of datasets reduces discrepancies, perfect alignment cannot be guaranteed, affecting cross-indicator comparability. Future work should focus on improving interoperability between national regulatory datasets and international LCA databases.
The data used in module B6 varies for GWP and biodiversity loss calculations. While GWP data represents a Danish context, biodiversity loss data uses an EU average for district heating. Moreover, the different types of data present a difference, as the European data is static, while the Danish dataset uses projected values. Future studies should use consistent data and emission factors for both impact categories. Similarly, as seen in Section 5.2.2, the operational impact of case buildings, using a dataset for Danish district heating, has a significant effect. Therefore, future studies should also focus on aligning data for operational energy; in the case of Denmark, a dataset aligned with the one mandated in Danish building regulations has been proposed.
Due to the nature of biogenic materials, dynamic modelling is particularly relevant, especially for carbon storage or delayed emissions. As Danish regulation has been used as the baseline for the study, only modules B4 and B6 of the use phase are included, which may skew the results, as many nuances are lost. Furthermore, dynamic modelling can offer more nuanced insights into both GWP and biodiversity loss over time. However, Danish regulation mandates the use of static time-aggregated datasets, and specifically the use of the −1/+1 method, effectively precluding dynamic approaches. Introducing dynamic modelling solely for biodiversity loss would introduce asymmetry and potentially greater uncertainty in cross-indicator comparisons. Future works should explore harmonised dynamic approaches that allow more nuanced cross-indicator comparisons and a more holistic assessment of long-term environmental performance.
The endpoint LCIA method used here is ReCiPe 2016. Alternative methods better capture regional variations and broader species coverage, but require complex data and are less common in building LCA practice. Future research should compare biodiversity loss outcomes between ReCiPe 2016 and more regionally sensitive approaches.
Several building typologies in this study are represented by a limited number of case studies, which constrains the generalizability of the findings. To establish more robust conclusions, future research should aim to incorporate a greater number of cases for each typology. Additionally, it is imperative to conduct a comprehensive sensitivity and uncertainty analysis to further strengthen the validity and credibility of the results obtained.
Finally, regenerative design includes environmental, economic, and social aspects. Future assessments should adopt a whole-systems approach, expanding criteria to assess different building impacts holistically.

Author Contributions

Conceptualization, E.S.T. and A.K.; methodology, E.S.T. and A.K.; software, E.S.T. and A.S.; validation, E.S.T. and A.S.; formal analysis, E.S.T. and A.S.; investigation, E.S.T., A.S. and A.K.; resources, E.S.T. and A.S.; data curation, E.S.T. and A.S.; writing—original draft preparation, E.S.T. and A.K.; writing—review and editing, E.S.T., A.S. and A.K.; visualisation, E.S.T.; supervision, A.K.; project administration, A.K. All authors have read and agreed to the published version of the manuscript.

Funding

This research received no external funding.

Institutional Review Board Statement

Not applicable.

Informed Consent Statement

Not applicable.

Data Availability Statement

All the data collected are already presented in Appendix A; further inquiries can be directed to the corresponding author.

Acknowledgments

The authors are grateful to EKOLAB for providing the case study information used in this study.

Conflicts of Interest

Author August Sørensen was employed by the company EKOLAB. The remaining authors declare that the research was conducted in the absence of any commercial or financial relationships that could be construed as a potential conflict of interest.

Abbreviations

The following abbreviations are used in this manuscript:
BR25Danish Building Regulations
EPDEnvironmental Product Declaration
GWPGlobal Warming Potential
LCALife Cycle Assessment
LCIALife Cycle Impact Assessment
LCILife Cycle Inventory

Appendix A

The following table presents an overview of the data for the 73 case buildings used in Section 4.
Table A1. Data overview for the 73 case buildings.
Methods and DatabasesCodeReference Area
[m2]
Year of
Commissioning
Type of Load-Bearing StructureWeight
[kg/m2]
Other buildingsOth01>50002022Heavy1545
Oth021000–50002023Light497
Oth03<1002023Light1692
Detached housesD01100–10002023Light394
D02100–10002023Light391
D03100–10002023Light419
D04100–10002023Light427
D05100–10002023Light430
D06100–10002023Light419
D07100–10002023Light594
D08100–10002023Light849
D09100–10002023Light285
D10100–10002022Heavy1126
D11100–10002024Light655
Apartments buildingsA01>50002022Heavy1158
A02>50002023Heavy1135
A03>50002023Heavy1326
A04>50002024Heavy1465
A05>50002023Heavy1350
A061000–50002023Heavy1175
A07>50002025Heavy1049
A081000–50002026Heavy1094
A091000–50002026Heavy1169
A10>50002026Heavy1292
A11100–10002024Heavy1168
A121000–50002024Heavy1208
A131000–50002024Heavy1155
A14>50002024Heavy1574
A151000–50002024Heavy1521
A16100–10002024Heavy1397
A17>50002023Heavy1222
A18>50002024Heavy935
A19>50002022Heavy1179
A201000–50002024Light359
A21>50002025Heavy1313
A22>50002025Heavy1244
A23>50002024Heavy1621
IndustryI01>50002023Heavy1239
I021000–50002025Light940
I03>50002023Heavy826
I041000–50002025Heavy776
I05>50002025Heavy905
OfficesO01>50002023Heavy1214
O021000–50002023Light1302
O03>50002024Heavy994
O041000–50002026Light659
O051000–50002025Heavy970
Terraced housesT01100–10002023Light742
T02100–10002023Light811
T03>50002022Heavy957
T04>50002022Heavy770
T051000–50002022Heavy1386
T06>50002025Heavy674
T07>50002022Light697
T08>50002022Heavy1270
T09>50002024Heavy724
T10>50002023Light370
T11>50002023Light548
T12>50002023Light419
T13>50002023Heavy734
T141000–50002025Heavy977
T151000–50002025Heavy835
T16>50002024Heavy734
T171000–50002024Light547
T181000–50002026Light501
T191000–50002025Light545
T20>50002025Heavy727
EducationE011000–50002025Heavy1210
E02>50002024Heavy1426
E03>50002024Heavy1237
E04>50002022Heavy1381
E05>50002022Heavy783
E06100–10002025Light772

References

  1. Steffen, W.; Richardson, K.; Rockström, J.; Cornell, S.E.; Fetzer, I.; Bennett, E.M.; Biggs, R.; Carpenter, S.R.; de Vries, W.; de Wit, C.A.; et al. Planetary boundaries: Guiding human development on a changing planet. Science 2015, 347, 1259855. [Google Scholar] [CrossRef] [PubMed]
  2. Adams, M.; Burrows, V.; Richardson, S.; Drinkwater, J.; Gamboa, C.; Collin, C.; Den, X.; Riemann, L.; Porteron, S.; Secher, A. Bringing Embodied Carbon Upfront: Coordinated Action for the Building and Construction Sector to Tackle Embodied Carbon; World Green Building Council: Toronto, ON, Canada, 2019. [Google Scholar]
  3. Paris Agreement to the United Nations Framework Convention on Climate Change. 2015. Available online: https://unfccc.int/process-and-meetings/the-paris-agreement (accessed on 3 February 2025).
  4. Costanza, R.; d’Arge, R.; de Groot, R.; Farber, S.; Grasso, M.; Hannon, B.; Limburg, K.; Naeem, S.; O’Neill, R.V.; Paruelo, J.; et al. The value of the world’s ecosystem services and natural capital. Nature 1997, 387, 253–260. [Google Scholar] [CrossRef]
  5. de Groot, R.S.; Wilson, M.A.; Boumans, R.M.J. A typology for the classification, description and valuation of ecosystem functions, goods and services. Ecol. Econ. 2002, 41, 393–408. [Google Scholar] [CrossRef]
  6. Richardson, K.; Steffen, W.; Lucht, W.; Bendtsen, J.; Cornell, S.E.; Donges, J.F.; Drüke, M.; Fetzer, I.; Bala, G.; von Bloh, W.; et al. Earth beyond six of nine planetary boundaries. Sci. Adv. 2023, 9, eadh2458. [Google Scholar] [CrossRef]
  7. Costanza, R.; de Groot, R.; Sutton, P.; van der Ploeg, S.; Anderson, S.J.; Kubiszewski, I.; Farber, S.; Turner, R.K. Changes in the global value of ecosystem services. Glob. Environ. Change 2014, 26, 152–158. [Google Scholar] [CrossRef]
  8. Ceballos, G.; Ehrlich, P.R.; Dirzo, R. Biological annihilation via the ongoing sixth mass extinction signaled by vertebrate population losses and declines. Proc. Natl. Acad. Sci. USA 2017, 114, E6089–E6096. [Google Scholar] [CrossRef]
  9. Barnosky, A.D.; Matzke, N.; Tomiya, S.; Wogan, G.O.U.; Swartz, B.; Quental, T.B.; Marshall, C.; McGuire, J.L.; Lindsey, E.L.; Maguire, K.C.; et al. Has the Earth’s sixth mass extinction already arrived? Nature 2011, 471, 51–57. [Google Scholar] [CrossRef]
  10. CBD. Quick Guides to the Aichi Biodiversity Targets; Convention on Biological Diversity: Montreal, QC, Canada, 2013; 42p. [Google Scholar]
  11. Convention on Biological Diversity. Decision Adopted by the Conference of the Parties to the Convention on Biological Diversity at Its Fifteenth Meeting (COP/15/DEC/4); 2022. Available online: https://www.cbd.int/gbf/targets (accessed on 3 February 2025).
  12. Andersen, C.E.; Rasmussen, F.N.; Habert, G.; Birgisdóttir, H. Embodied GHG Emissions of Wooden Buildings—Challenges of Biogenic Carbon Accounting in Current LCA Methods. Front. Built Environ. 2021, 7, 729096. [Google Scholar] [CrossRef]
  13. Mang, P.; Haggard, B.; Regenesis Group. Front Matter. In Regenerative Development; John Wiley & Sons: Hoboken, NJ, USA, 2016; pp. i–xxxvi. [Google Scholar]
  14. Mang, P.; Haggard, B.; Regenesis Group. Creating Regenerative Projects. In Regenerative Development; John Wiley & Sons: Hoboken, NJ, USA, 2016; pp. 1–8. [Google Scholar]
  15. Reed, B. Shifting from ‘sustainability’ to regeneration. Build. Res. Inf. 2007, 35, 674–680. [Google Scholar] [CrossRef]
  16. Sala Benites, H.; Osmond, P.; Prasad, D. A neighbourhood-scale conceptual model towards regenerative circularity for the built environment. Sustain. Dev. 2023, 31, 1748–1767. [Google Scholar] [CrossRef]
  17. Zari, M.P. Regenerative Urban Design and Ecosystem Biomimicry, 1st ed.; Routledge: London, UK, 2018; p. 260. [Google Scholar]
  18. du Plessis, C. Towards a regenerative paradigm for the built environment. Build. Res. Inf. 2012, 40, 7–22. [Google Scholar] [CrossRef]
  19. ISO 18458:2015; Biomimetics—Terminology, Concepts and Methodology. ISO: Geneva, Switzerland, 2015.
  20. Souza, D.M.; Teixeira, R.F.M.; Ostermann, O.P. Assessing biodiversity loss due to land use with Life Cycle Assessment: Are we there yet? Glob. Change Biol. 2015, 21, 32–47. [Google Scholar] [CrossRef]
  21. Brachet, A.; Schiopu, N.; Clergeau, P. Biodiversity impact assessment of building’s roofs based on Life Cycle Assessment methods. Build. Environ. 2019, 158, 133–144. [Google Scholar] [CrossRef]
  22. Bjørn, A.; Fanning, A.; Branny, A.; Clausen, C.; Pham, D.; Engelbrecht, E.; Lassen, E.B.; Sahen, E.; Moberg, F.; Birgisdóttir, H.; et al. Doughnut for Urban Development—A Manual, 2nd ed.; Hill-Hansen, D., Jensen, K.G., Eds.; Danish Architectural Press: Copenhagen, Denmark, 2023; p. 176. [Google Scholar]
  23. ISO 14040:2006; Environmental Management—Life Cycle Assessment—Principles and Framework. ISO: Geneva, Switzerland, 2006.
  24. ISO 14044:2006; Environmental Management—Life Cycle Assessment—Requirements and Guidelines. ISO: Geneva, Switzerland, 2006.
  25. Finnveden, G.; Potting, J. Life Cycle Assessment. In Encyclopedia of Toxicology, 3rd ed.; Wexler, P., Ed.; Academic Press: Oxford, UK, 2014; pp. 74–77. [Google Scholar]
  26. Simonen, K. Life Cycle Assessment, 1st ed.; Routledge by Taylor and Francis: Milton, UK, 2014; p. 182. [Google Scholar]
  27. EN 15978:2012; Sustainability of Construction Works—Assessment of Environmental Performance of Buildings—Calculation Method. Dansk Standard: Nordhavn, Denmark, 2012.
  28. Social-og Boligstyrelsen (Denmark). Ny Aftale Stiller Ambitiøse Klimakrav Til Nyt Byggeri. Available online: https://www.sm.dk/nyheder/nyhedsarkiv/2024/maj/ny-aftale-stiller-ambitioese-klimakrav-til-nyt-byggeri (accessed on 29 April 2025).
  29. Reduction Roadmap. Beyond the Roadmap: A Transition Plan for the Danish Building Industry, Version 2.14. 2024. Available online: https://www.shareyourgreendesign.com/research/beyond-the-roadmap-a-transition-plan-for-the-danish-building-industry/ (accessed on 20 February 2025).
  30. Zimmermann, R.K.; Andersen, C.M.E.; Kanafani, K.; Birgisdottir, H. Whole Life Carbon Assessment of 60 Buildings: Possibilities to Develop Benchmark Values for LCA of Buildings; BUILD Report No. 2021:12; Polyteknisk Boghandel og Forlag: Lyngby, Denmark, 2021. [Google Scholar]
  31. EN 15804:2012; Sustainability of Construction Works—Environmental Product Declarations—Core Rules for the Product Category of Construction Products. Dansk Standard: Nordhavn, Denmark, 2012.
  32. Ecoinvent. Impact Assessment. Available online: https://support.ecoinvent.org/impact-assessment (accessed on 27 February 2025).
  33. Institude of Environmental Sciences (CML); Leiden University. CML-IA Characterisation Factors. Available online: https://www.universiteitleiden.nl/en/research/research-output/science/cml-ia-characterisation-factors (accessed on 27 February 2025).
  34. One Click LCA. Impact Assessment Categories: CML, TRACI, and PEF. Available online: https://oneclicklca.zendesk.com/hc/en-us/articles/360015036980-Impact-Assessment-Categories-CML-TRACI-and-PEF (accessed on 27 February 2025).
  35. Mattia, D.; Nicola, F.; Ardente, F. Understanding Product Environmental Footprint and Organisation Environmental Footprint Methods; Publications Office of the European Union: Luxembourg, 2022. [Google Scholar]
  36. Huijbregts, M.A.J.; Steinmann, Z.J.N.; Elshout, P.M.F.; Stam, G.; Verones, F.; Vieira, M.; Zijp, M.; Hollander, A.; van Zelm, R. ReCiPe2016: A harmonised life cycle impact assessment method at midpoint and endpoint level. Int. J. Life Cycle Assess. 2017, 22, 138–147. [Google Scholar] [CrossRef]
  37. Bulle, C.; Margni, M.; Patouillard, L.; Boulay, A.-M.; Bourgault, G.; De Bruille, V.; Cao, V.; Hauschild, M.; Henderson, A.; Humbert, S.; et al. IMPACT World+: A globally regionalized life cycle impact assessment method. Int. J. Life Cycle Assess. 2019, 24, 1653–1674. [Google Scholar] [CrossRef]
  38. Verones, F.; Hellweg, S.; Antón, A.; Azevedo, L.B.; Chaudhary, A.; Cosme, N.; Cucurachi, S.; de Baan, L.; Dong, Y.; Fantke, P.; et al. LC-IMPACT: A regionalized life cycle damage assessment method. J. Ind. Ecol. 2020, 24, 1201–1219. [Google Scholar] [CrossRef]
  39. Damiani, M.; Sinkko, T.; Caldeira, C.; Tosches, D.; Robuchon, M.; Sala, S. Critical review of methods and models for biodiversity impact assessment and their applicability in the LCA context. Environ. Impact Assess. Rev. 2023, 101, 107134. [Google Scholar] [CrossRef]
  40. ISO 14025:2006; Environmental Labels and Declarations—Type III Environmental Declarations—Principles and Procedures. ISO: Geneva, Switzerland, 2006.
  41. Pre-Sustainability. Recipe. Available online: https://pre-sustainability.com/articles/recipe/ (accessed on 13 March 2025).
  42. Zacharia, M. A Simple Guide to EPDs. Available online: https://oneclicklca.com/en/resources/articles/guide-to-epds (accessed on 11 March 2025).
  43. Su, D.; Ren, Z.; Wu, Y. Guidelines for Selection of Life Cycle Impact Assessment Software Tools. In Sustainable Product Development: Tools, Methods and Examples; Su, D., Ed.; Springer International Publishing: Cham, Switzerland, 2020; pp. 57–70. [Google Scholar]
  44. European Commission. Nodes Containing EF Data. Available online: https://eplca.jrc.ec.europa.eu/LCDN/contactListEF.html (accessed on 12 March 2025).
  45. INIES Database. Frequently Asked Questions—INIES. Available online: https://www.inies.fr/en/ressources-documentaires/frequently-asked-questions/ (accessed on 12 March 2025).
  46. EPD Norge. General Programme Instructions—The Norwegian EPD Program, Version 4.0; EPD Norge: Oslo, Norway, 2024. [Google Scholar]
  47. Institut Bauen und Unwelt (IBU). Life Cycle Assessment—IBU. Available online: https://ibu-epd.com/en/life-cycle-assessment/ (accessed on 12 March 2025).
  48. German Federal Ministry for Housing, U.D.a.B.B. Ökobaudat—The German LCA Database for Construction. Available online: https://www.oekobaudat.de/no_cache/en/database/search.html (accessed on 12 March 2025).
  49. Kamari, A.; Kotula, B.M.; Schultz, C.P.L. A BIM-based LCA tool for sustainable building design during the early design stage. Smart Sustain. Built Environ. 2022, 11, 217–244. [Google Scholar] [CrossRef]
  50. Kamari, A.; Schultz, C. Streamlining BIM-integrated LCA for rapid-iterative-informed-early stage upfront carbon assessment by architects and engineers. Archit. Struct. Constr. 2024, 5, 5. [Google Scholar] [CrossRef]
  51. OneClick LCA. About OneClick LCA. Available online: https://oneclicklca.com/company/about-us (accessed on 18 March 2025).
  52. OpenLCA. About OpenLCA. Available online: https://www.openlca.org/about/ (accessed on 18 March 2025).
  53. SimaPro. Meet the Developer. Available online: https://simapro.com/meet-the-developer/ (accessed on 18 March 2025).
  54. Sphera. A Quick Guide to Sphera’s 2023.1 LCA Databases Update. Available online: https://sphera.com/resources/blog/a-quick-guide-to-spheras-2023-1-lca-databases-update/ (accessed on 18 March 2025).
  55. Ecochain. We Are Ecochain. Available online: https://ecochain.com/about-us/ (accessed on 19 March 2025).
  56. Sphera. Who We Are. Available online: https://sphera.com/company/who-we-are/ (accessed on 19 March 2025).
  57. Birgisdottir, H.; Sørensen, C.G.; Rasmussen, F.N. Udvikling af LCAbyg—Livscyklusvurderingsværktøj for den Danske Byggebranche. Available online: https://vbn.aau.dk/en/projects/udvikling-af-lcabyg-livscyklusvurderingsv%C3%A6rkt%C3%B8j-for-den-danske-by (accessed on 24 March 2025).
  58. LCA Software Directory. LCA Software Overview 2025. Available online: https://lca-software.org/ (accessed on 24 March 2025).
  59. OpenLCA. OpenLCA Data. Available online: https://www.openlca.org/data/ (accessed on 18 March 2025).
  60. OpenLCA Nexus. About. Available online: https://nexus.openlca.org/about (accessed on 18 March 2025).
  61. Ecochain Helpcenter. Explained: LCIA Methods. Available online: https://helpcenter.ecochain.com/en/articles/9055669-explained-lcia-methods?_gl=1*1jwj4eb*_gcl_au*Njg4NDM2MTk3LjE3MzkzNTQ0MDk (accessed on 19 March 2025).
  62. OneClick LCA. Global LCA Data. Available online: https://oneclicklca.com/why-us/capabilities/global-lca-data (accessed on 19 March 2025).
  63. SimaPro. Marketplace. Available online: https://simapro.com/marketplace/?_product_categories=databases (accessed on 11 March 2025).
  64. SimaPro. SimaPro Craft. Available online: https://simapro.com/craft/ (accessed on 19 March 2025).
  65. Ecochain. What is Ecoinvent? Meet the LCI Database. Available online: https://ecochain.com/blog/what-is-ecoinvent/ (accessed on 18 March 2025).
  66. Gaia. Examples of How Biodiversity Net Gain Can Be Achieved. Available online: https://gaiacompany.io/biodiversity-net-gain-examples/ (accessed on 10 March 2025).
  67. UK Government. Understanding Biodiversity Net Gain. Available online: https://www.gov.uk/guidance/understanding-biodiversity-net-gain (accessed on 10 March 2025).
  68. One Click LCA. Hit Your 10% Biodiversity Net Gain Goal. Available online: https://oneclicklca.com/software/design-construction/biodiversity-net-gain (accessed on 10 March 2025).
  69. Francart, N.; Nøddegaard Hansen, R.; Ernst Andersen, C.; Ryberg, M.; Kristenssen Stranddorf, L.; Birgisdóttir, H. The Doughnut Biotool: A tool to assess life-cycle biodiversity impacts from building projects. IOP Conf. Ser. Earth Environ. Sci. 2024, 1402, 012049. [Google Scholar] [CrossRef]
  70. One Click LCA. EN 15804+A2: What the Changes Mean for EPDs. Available online: https://oneclicklca.com/en/resources/articles/en-15804-changes-epds (accessed on 20 March 2025).
  71. Breton, C.; Blanchet, P.; Amor, B.; Beauregard, R.; Chang, W.-S. Assessing the Climate Change Impacts of Biogenic Carbon in Buildings: A Critical Review of Two Main Dynamic Approaches. Sustainability 2018, 10, 2020. [Google Scholar] [CrossRef]
  72. Hoxha, E.; Passer, A.; Saade, M.R.M.; Trigaux, D.; Shuttleworth, A.; Pittau, F.; Allacker, K.; Habert, G. Biogenic carbon in buildings: A critical overview of LCA methods. Build. Cities 2020, 1, 504–524. [Google Scholar] [CrossRef]
  73. Hansen, R.N.; Eliassen, J.L.; Schmidt, J.; Andersen, C.E.; Weidema, B.P.; Birgisdóttir, H.; Hoxha, E. Environmental consequences of shifting to timber construction: The case of Denmark. Sustain. Prod. Consum. 2024, 46, 54–67. [Google Scholar] [CrossRef]
  74. Pittau, F.; Krause, F.; Lumia, G.; Habert, G. Fast-growing bio-based materials as an opportunity for storing carbon in exterior walls. Build. Environ. 2018, 129, 117–129. [Google Scholar] [CrossRef]
  75. Levasseur, A.; Lesage, P.; Margni, M.; Deschênes, L.; Samson, R. Considering Time in LCA: Dynamic LCA and Its Application to Global Warming Impact Assessment. Environ. Sci. Technol. 2010, 44, 3169–3174. [Google Scholar] [CrossRef] [PubMed]
  76. CHERUBINI, F.; PETERS, G.P.; BERNTSEN, T.; STRØMMAN, A.H.; HERTWICH, E. CO2 emissions from biomass combustion for bioenergy: Atmospheric decay and contribution to global warming. GCB Bioenergy 2011, 3, 413–426. [Google Scholar] [CrossRef]
  77. Arehart, J.H.; Hart, J.; Pomponi, F.; D’Amico, B. Carbon sequestration and storage in the built environment. Sustain. Prod. Consum. 2021, 27, 1047–1063. [Google Scholar] [CrossRef]
  78. LCAbyg. Brugervejledning til LCAbyg. 2023. Available online: https://guide.lcabyg.dk/introduction/lifecycle/lifecycle.html (accessed on 28 March 2025).
  79. Det Kongelige Akademi—Arkitektur, Design, Konservering. Byggeriets Materialepyramide. Available online: https://materialepyramiden.dk/ (accessed on 8 April 2025).
  80. Energistyrelsen. Analyseforudsætninger til Energinet. Available online: https://ens.dk/analyser-og-statistik/analyseforudsaetninger-til-energinet (accessed on 24 April 2025).
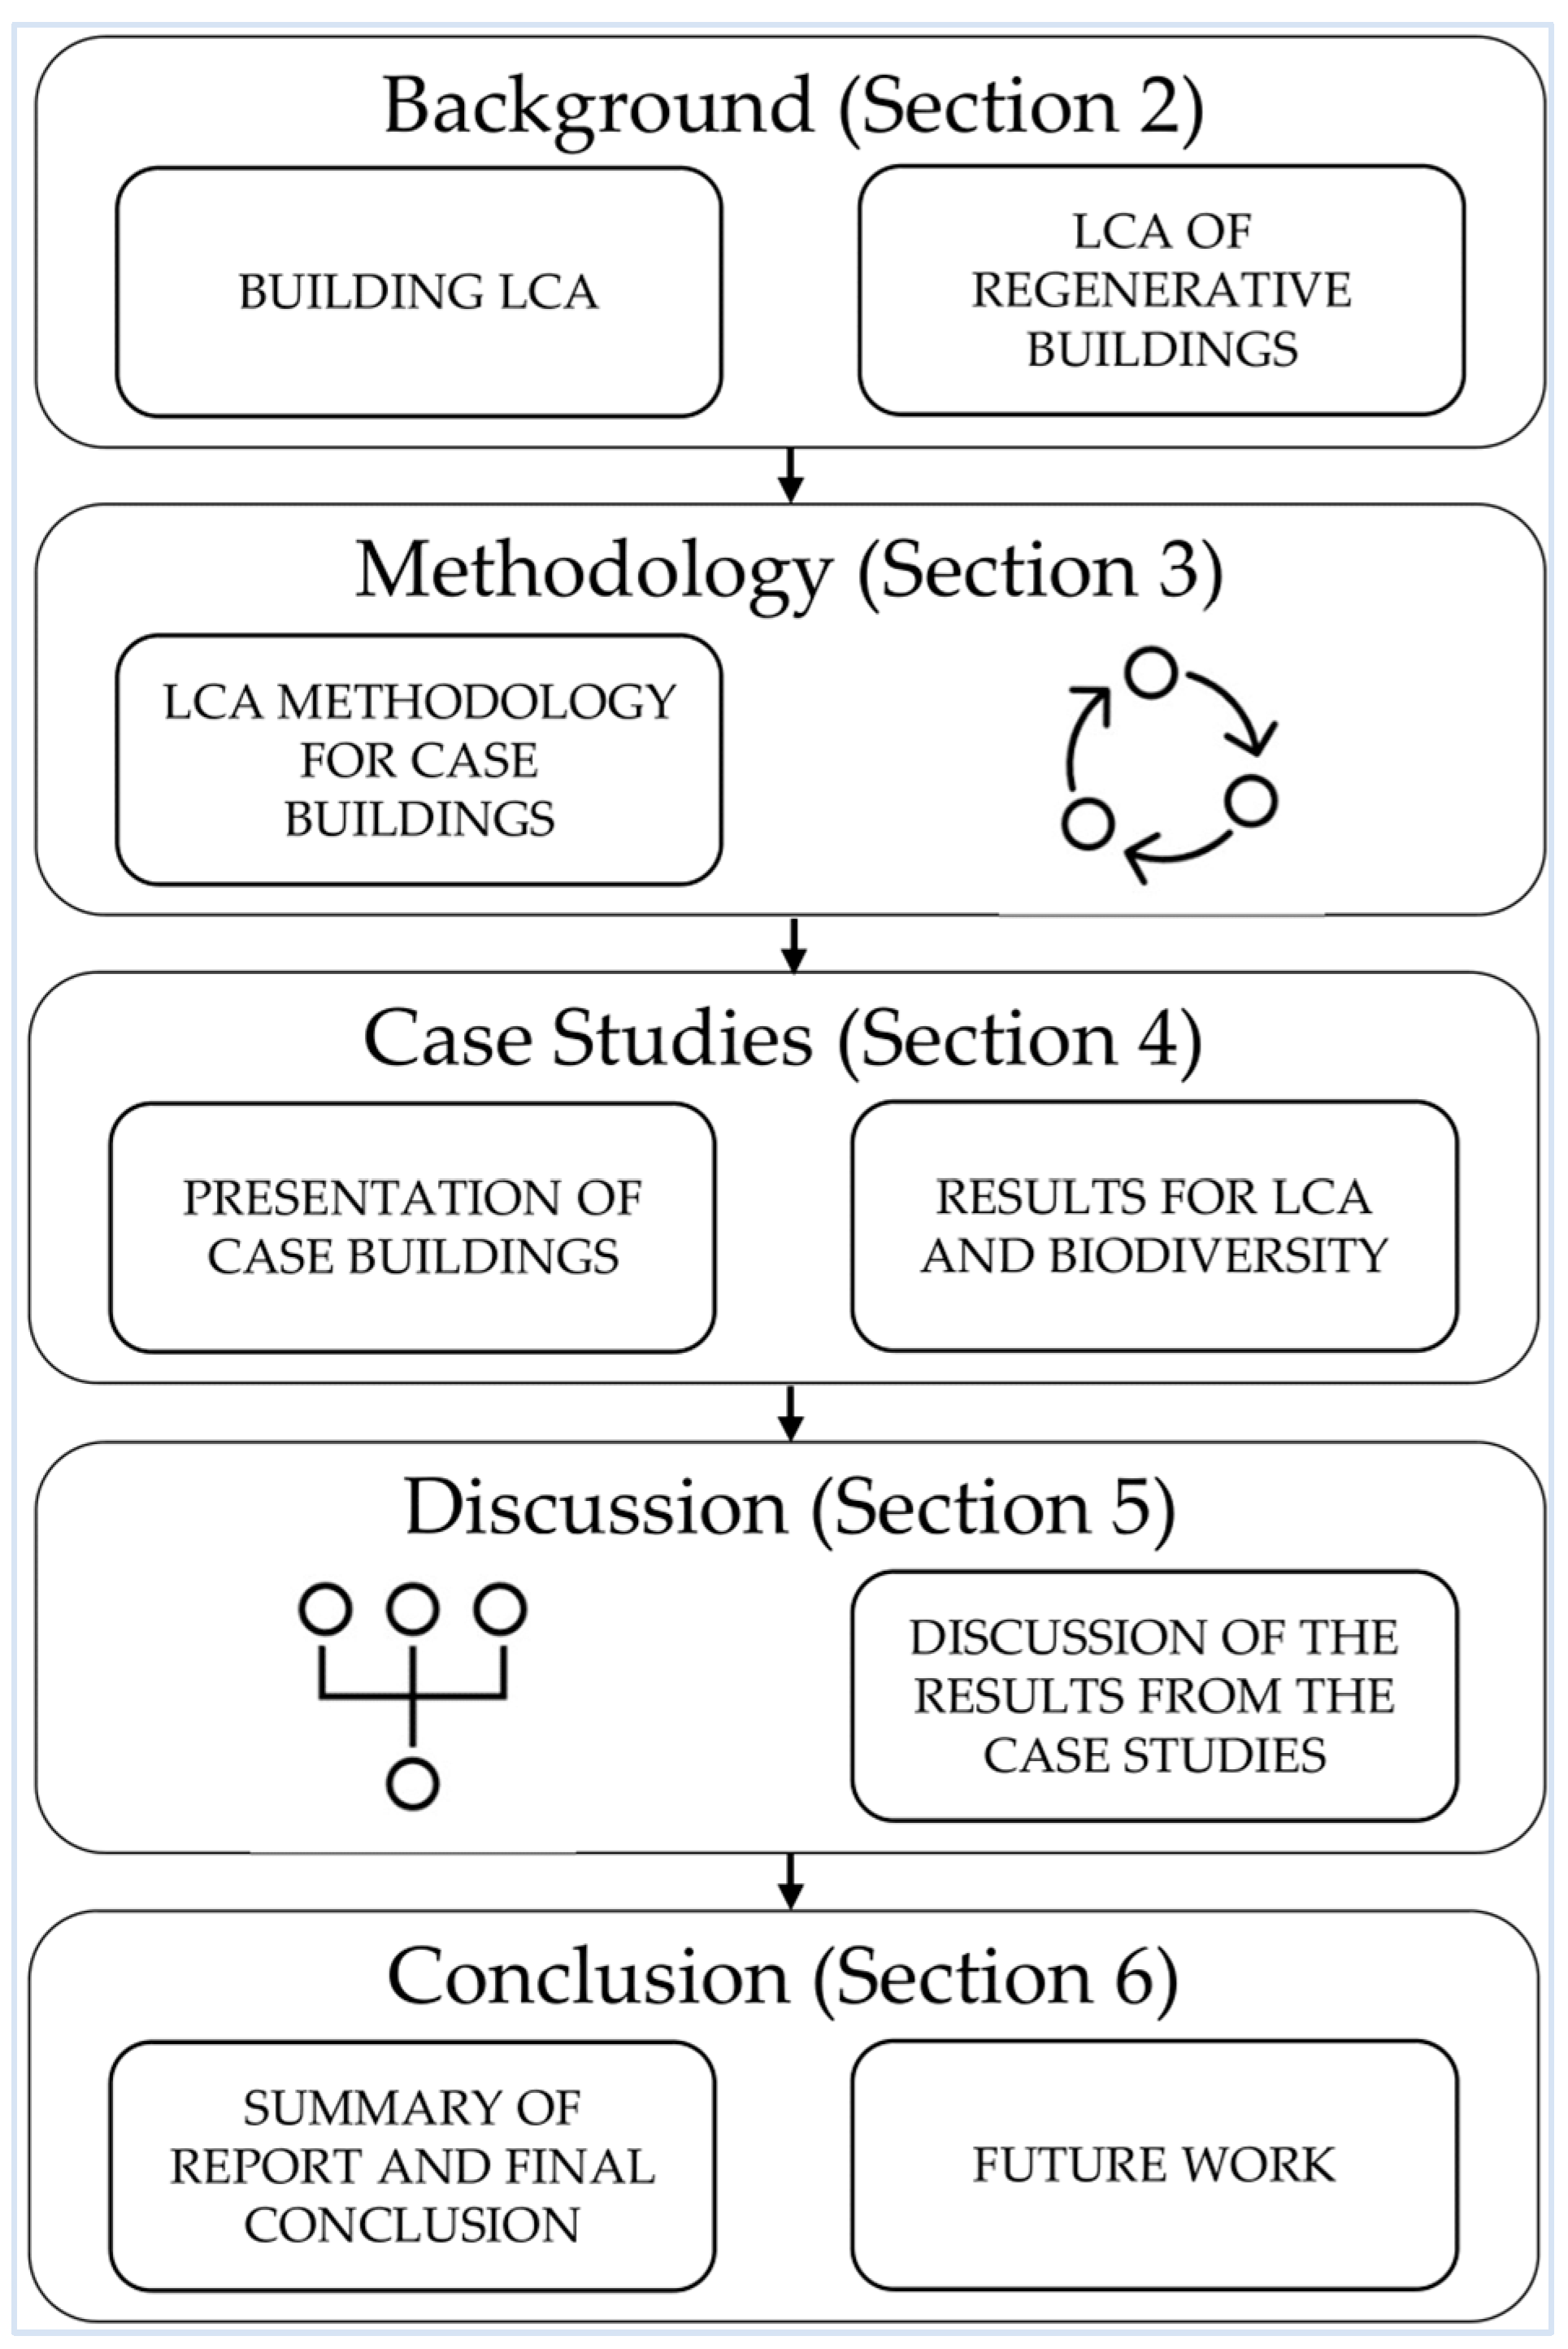
Figure 1. Research workflow and structure: The circular framework in the methodology demonstrates its capacity for replication.
Sustainability 17 08369 g001
Figure 2. Life cycle modules and stages in accordance with EN 15978. Danish regulations require the modules highlighted in blue, as per the 2023 regulations, and modules highlighted in grey were added in the middle of 2025. The included life cycle modules both cover off-site and on-site biodiversity considerations.
Sustainability 17 08369 g002
Figure 3. Depiction of the environmental impact of buildings over the entire reference study period. The upper curve shows the impacts caused by materials, which start in year 0 with a significant impact from the production of construction products (A1–A3). Smaller increases during the use phase from replacements (B4), and lastly, it increases notably at the end-of-life with demolition and waste processing (C3–C4). The lower curve shows the impacts of operational energy during the use phase (B6) (Reproduced from [30]).
Sustainability 17 08369 g003
Figure 4. The relation between the inventory data and impact assessments. All the inputs and outputs from the elementary flows in the life cycle inventory can be connected to one or more impacts by using a characterisation factor. These factors come from the LCIA methods that analyse the impact on the midpoint level. Once the environmental impacts have been determined, they can be converted into areas of protection using LCIA methods that analyse impacts at the endpoint level. Similarly, the midpoint scores are transformed into endpoint scores using characterisation factors (Reproduced from [32]).
Sustainability 17 08369 g004
Figure 5. Distribution of cases from building typology. Out of the 73 cases, 54 cases are of homes, and 19 are of other buildings, including offices, schools and more.
Sustainability 17 08369 g005
Figure 6. Summary of the data for all seven building typologies. For a complete data overview of each case building, see Appendix A.
Sustainability 17 08369 g006
Figure 7. Material categorisation for each building part in the 73 cases.
Sustainability 17 08369 g007
Figure 8. The GWP from all 73 case buildings, delineated into embodied emissions from materials and operational emissions. D09 has no data for operation; hence, only the materials are noted.
Sustainability 17 08369 g008
Figure 9. The GWP for all 73 case buildings, delineated into life cycle modules (left) and building parts (right).
Sustainability 17 08369 g009
Figure 10. GWP associated with embodied carbon and operational carbon emissions for various building typologies. The horizontal lines in the box represent the first, second, and third quartiles, while the X shows the average value. The whiskers at each end of the box indicate the variance, and the dots represent observed values outside the variance. It is noted that results from Other buildings, Industry, Offices, and Education are based on fewer cases and are not as representative.
Sustainability 17 08369 g010
Figure 11. The biodiversity loss from all 73 case buildings, delineated into the embodied emissions from materials and the operational emissions.
Sustainability 17 08369 g011
Figure 12. The biodiversity loss for all 73 case buildings, delineated into life cycle modules (left) and building parts (right).
Sustainability 17 08369 g012
Figure 13. Biodiversity loss associated with materials and operations for various building typologies. The horizontal lines in the box represent the first, second, and third quartiles, while the X shows the average value. The whiskers at each end of the box indicate the variance, and the dots represent observed values outside the variance. It is noted that results from Other buildings, Industry, Offices, and Education are based on fewer cases and are not as representative.
Sustainability 17 08369 g013
Figure 14. The scatter plots show the impacts of selected building parts in both GWP (x-axis) in kg CO2-eq./m2/year and biodiversity loss (y-axis) in species·year/m2/year. The green datapoints represent bio-based building parts, the light-blue datapoints represent partly bio-based building parts, and the blue datapoints represent building parts made from other materials.
Sustainability 17 08369 g014
Figure 15. Biodiversity loss from operational energy, module B6, using either the Danish average or the EU average district heating.
Sustainability 17 08369 g015
Table 1. New climate requirements from Danish building regulations will take effect from July 2025. The limit values are divided into building typologies and measured in GWP with the unit kg CO2-eq./m2/year.
Climate Requirements202520272029
Holiday homes below 150 m24.03.63.2
Detached houses, terraced houses, tiny houses and holiday homes above 150 m26.76.05.4
Apartment buildings7.56.86.1
Office buildings7.56.86.1
Institutions8.07.26.4
Other new buildings, for example, stores, warehouses, and parking garages8.07.26.4
Table 2. Mid-point indicators included in the CML, TRACI and PEF methodologies [33].
Impact CategoryCMLTRACIPEF
1. Global Warming Potential (GWP)
 GWP—Fossil
 GWP—Biogenic
 GWP—LULUC
 GWP—Total
2. Ozone Depletion Potential (ODP)
3. Photochemical Ozone Creation Potential (POCP)
4. Acidification Potential (AP)
5. Eutrophication Potential (EP)
 EP—Terrestrial
 EP—Freshwater
 EP—Marine
6. Ecotoxicity
 Ecotoxicity—Freshwater
7. Human Toxicity (HT)
 HT—Cancer Effects
 HT—Non-Cancer Effects
8. Particular Matter
9. Ionising Radiation
10. Land Use
11. Resource Use—Fossil Fuels
12. Resource Use—Minerals and Metals
13. Water Use and Water Scarcity
14. Freshwater Ecotoxicity—Long-term
15. Ozone Formation—Human Health Effects
16. Land Use Change
17. End-of-Life Emissions
18. Waste Generation
19. End-of-Life Energy Recovery
Table 3. The table presents the midpoint impact categories, whose modelling differs between the LCIA methods ReCiPe 2016, Impact World+ and LC-impact, as well as the methods’ coverage of Areas of Protection [35,36,37,38,39].
FeatureReCiPe 2016Impact World+LC-Impact
Year published201620192020
Replaced (Year)Eco-indicator 99 (1999)
CML 2000 (2000)
ReCiPe 2008 (2008)
EDIP (2004)
LUCAS (2007)
Impact 2002+ (2002)
-
1. Midpoint Impacts
 Climate Change
 Land UseBasicAdvancedAdvanced
 Water UseBasicAdvancedAdvanced
 ToxicityBasicAdvancedAdvanced
2. Endpoint impacts
 Human Health
 Ecosystem Damage
 Resource DepletionNot directly
3. RegionalisationLimitedAdvancedAdvanced
Table 4. The table highlights strengths and limitations of the three LCIA methods, ReCiPe 2016, Impact World+ and LC-impact [35,36,37,38].
MethodStrengthsWeaknesses
ReCiPe 2016
-
Most widely used LCIA method, balancing midpoint and endpoint
-
Less detailed regionalisation.
-
More general assumptions
Impact Word+
-
High regionalisation
-
Improvements in toxicity and water modelling
-
Complex
-
Data-intensive
LC-impact
-
High regionalisation
-
Advanced climate and toxicity modelling
-
Complex
-
Requires detailed spatial data
Table 5. Overview of some of the mentioned LCI/LCIA and EPD databases. Not all of the EPD databases discussed above have been included in the table, as they generally have many of the same properties, except for their country of origin [42,43,44,45,46,47].
FeatureEcoinventGaBi (Sphera)ÖkobaudatEPD Danmark
OriginSwitzerlandGermanyGermanyDenmark
Publication Year20031990 *20092014
ScopeGlobal, multisectorGlobal, multisectorConstruction-focusedConstruction-focused (Denmark)
Data typeBackground LCI and LCIABackground LCI and LCIAEPDs and generic dataEPDs
Industry focusVariousVariousConstructionConstruction
AssessPaidPaidFreeFree
EPD complianceSome datasets are aligned with EPDsSupports EPD generationEN 15804, ISO 14025EN 15804, ISO 14025
Used forLCA studies across multiple sectorsLCA studies across multiple sectorsSustainable construction and building materialsDanish building sector LCAs
LCIA methodsCML, ReCiPe, IPCC, EF and moreCML, ReCiPe, IPCC, EF and moreEN 15804 impact categoriesEN 15804 impact categories
* The exact year varies across sources.
Table 6. Overview of establishment and format for the mentioned global LCA tools [50,51,52,53,54,55,56].
FeatureEcochain HelixSimaProLCA for ExpertsOneClick LCAOpenLCA
Developer
(Location)
Ecochain
(Amsterdam, The Netherlands)
PRé Sustainability
(Amersfoort, The Netherlands)
Sphera
(Chicago, IL, USA)
OneClick LCA Ltd.
(Helsinki, Finland)
GreenDelta
(Berlin, Germany)
Founding year201119901990 *20012006
Cloud/desktopCloudDesktopDesktopCloudDesktop
AccessPaidPaidPaidPaidFree
* The exact year varies across sources.
Table 8. Overview of the calculated LCA modules.
ModulesDescription
A1–A3Emissions related to raw material extraction, transportation to the factory and production of materials.
B4Emissions related to the replacement of materials.
B6Emissions related to energy consumption for operation.
C3–C4Emissions related to waste treatment and disposal of materials.
Table 9. Overview of all the building parts included (in accordance with the Danish regulations).
Building PartDescription
OperationEmissions from operational energy.
FoundationFoundation, including plinth.
Ground slabGround slab, including flooring.
Exterior wallsExterior walls
Interior wallsInterior walls.
Floor slabsFloor slabs, including flooring and ceilings.
Windows, doors, and glass facadesAll windows and glass facades, as well as both interior and exterior doors.
InstallationsAll drainage, water, heating, and ventilation installations, but not electrical installations.
Remaining building partsEverything not otherwise covered above, such as solar panels, columns, and stairs.
Table 10. The table presents the median, lower quartile, and upper quartile for the GWP categorised based on building typology. All values given are in the unit kg CO2-eq./m2/year.
TypologyMedianLower QuartileUpper QuartileRequirement *
Other buildings10.68.610.88.0
Detached houses5.65.36.36.7
Apartments buildings76.77.67.5
Industry7.25.97.28.0
Offices8.47.48.87.5
Terraced houses6.45.276.7
Education7.66.87.68.0
* These values are compared to the requirements, which will be introduced into BR25 and take effect in Denmark from July 2025.
Table 11. Distribution of different production sources in the average Danish district heating 2024.
ProductionShare
Waste incineration19.6%
Biogas1.3%
Biomass55.2%
Industrial heat3.1%
Coal2.7%
Natural gas4.3%
Oil1.8%
Solar panels1.8%
Heat pumps8.1%
Heat pumps, excess heat2.1%
Disclaimer/Publisher’s Note: The statements, opinions and data contained in all publications are solely those of the individual author(s) and contributor(s) and not of MDPI and/or the editor(s). MDPI and/or the editor(s) disclaim responsibility for any injury to people or property resulting from any ideas, methods, instructions or products referred to in the content.