Article

Smart Sustainable Disassembly Systems for Circular Economy

by
Marina Crnjac Žižić
*,
Amanda Aljinović Meštrović
,
Marko Mladineo
and
Nikola Gjeldum
Faculty of Electrical Engineering, Mechanical Engineering and Naval Architecture, University of Split, R. Boskovica 32, 21000 Split, Croatia
*
Author to whom correspondence should be addressed.
Sustainability 2025, 17(18), 8289; https://doi.org/10.3390/su17188289
Submission received: 15 July 2025 / Revised: 10 September 2025 / Accepted: 11 September 2025 / Published: 15 September 2025
(This article belongs to the Section Sustainable Products and Services)

Abstract

Today’s economic systems are characterized by overproduction, rapid changes in consumer preferences and the intensive exploitation of natural resources. For this reason, the idea of the circular economy has emerged in recent years as a key strategy for tackling environmental, social and resource problems. At the same time, manufacturers are increasingly trying to fulfill customer requirements, so that products are becoming ever more personalized. This increasing focus on individuality is leading to greater variability in design, while at the same time the complexity of product structures and components is increasing, which poses major challenges for production and assembly processes. Understanding this complexity helps in finding the most effective ways for the disassembly process to enable reuse, repair and high-quality recycling, which are among the key principles of the circular economy. This not only supports environmental and resource sustainability, but also contributes to long-term competitiveness and climate neutrality in manufacturing. This paper outlines how complexity is defined and how this parameter can be used to obtain an optimal solution for minimizing product complexity and maximizing the number of disassembled parts. This problem was modeled using linear programming, where the optimal disassembly sequence was defined taking into account variables and constraints such as the time available within a working day and the complexity of the sub-assemblies. The results showed that the process can be significantly optimized if clear variables and targets are defined.

1. Introduction

1.1. Background and Motivation

The transition to a circular economy (CE) is a response to the challenges of overproduction, rapidly changing consumer preferences and the overexploitation of natural resources. Circularity is an essential part of industrial transformation change, where the use of digital technologies for the tracking, tracing and mapping of resources is promoted. The aim is to achieve long-term competitiveness, while at the same time trying to preserve climate neutrality. The circular economy should provide high-quality, functional and safe products, which are efficient and designed for reuse, repair and high-quality recycling [1]. Focusing on the reuse, repair and high-quality recycling of products, the important process to discuss is the disassembly of those products [2]. Within this framework, disassembly is a crucial factor as it enables the systematic disassembly of products into components and materials that can be directly reused or integrated into new value chains. Without efficient disassembly, most CE strategies remain unachievable. Moreover, the conceptualization and design phase of products are key elements for enabling the use of circular economy paradigms [3]. However, the increasing personalization of products and the complexity of structures make disassembly a major challenge. Complex connections, different materials and complicated product architectures increase the time, costs and environmental impact during disposal. Managing this complexity is therefore crucial to harmonize industrial practice with CE objectives. A long time ago, authors started to evaluate disassembly complexity and material recyclability in order to consider the disassembly and recycling issues during the product design phase [4]. One of the most effective approaches for managing and considering the various influencing factors (X) is the implementation of Design for X (DfX). DFX provides a proactive, systematic methodology for coordinating and communicating requirements from internal and external stakeholders throughout the new product development process [5]. The first family of DfX methods aimed at optimizing the manufacturing and assembly aspects (Design for Manufacturing and Assembly, DfM and DfA). However, as environmental consciousness increased, Design for Disassembly (DfD) methods were developed [6]. Strategies of complexity management represent a crucial competitive factor for successful engineering in a complex environment [7]. Insights into product disassembly are important for the repairability of products, and moreover disassembly depth only partially describes the complexity of the repairability process; what actually differentiates the different types of steps is the nature of the operations carried out, which directly relates to the amount of time they require [2].

1.2. Research Gap and Objectives

In this research, disassembly is understood not only as a technical process, but as a strategic enabler for the circular economy [8]. The novelty of this study lies in the integration of product complexity metrics into the balancing of disassembly lines using linear programming. By combining these two dimensions, this study makes a methodological contribution that not only improves operational efficiency but also increases the total number of products that can be disassembled within a specified time frame. While previous research has focused on product disassembly, very little attention has been paid to directly linking product complexity to disassembly line balancing. While classical methods have been successfully applied to balancing problems, recent studies highlight the importance of integrating advanced algorithms and new technologies for improving line balancing in manufacturing environments [9]. This dual objective of increasing productivity while supporting circular economy and sustainability goals represents a new approach in the field. Particular attention is paid in this paper to the balance of disassembly lines, as it plays a crucial role in improving operational efficiency and supporting the sustainability goals of the circular economy, especially in the context of complex products, where the number of components, the type of connections and the structural intricacies significantly influence the disassembly process. Furthermore, the integration of product complexity metrics into the balancing of disassembly lines through linear programming supports the dual objective of improving operational efficiency and increasing the total number of products that can be disassembled within a fixed timeframe, which is one of the key performance indicators in sustainable and circular systems.

2. Related Work and Background

2.1. Importance of Disassembly Within the Circular Economy Framework

Today’s economic systems are characterized by overproduction, rapid shifts in consumer preferences, and the intensive exploitation of natural resources (such as biomass, minerals, metals, fuels, etc.). Overuse of the natural resources that are available, substantial waste production, environmental deterioration, and harm to human health are all inevitable outcomes of this. The European Union’s Circular Economy Action Plan [1] predicts that this trend will continue. Such a “take–make–use–dispose” paradigm, however, is not viable long-term. Because of this, in recent years, the idea of the circular economy has emerged as a key strategy for addressing issues pertaining to the environment, society, and resources. A closed-loop system is the foundation of the circular economy. This means that the circular economy assumes that products, components and/or materials are constantly reused or recycled and can therefore be fed back into further value creation cycles [10,11]. This not only helps to reduce the amount of waste and the need for ever-new raw materials, but also plays an important role in achieving climate goals, promoting sustainable economic growth and encouraging innovation in all areas of human activity. CE is not a simple term, but an interdisciplinary concept that integrates technical, economic and behavioral aspects to promote a more sustainable way of life (Figure 1). This means that the implementation of the circular economy would not be feasible without technical solutions. Without economic models, it would not be profitable. And without behavioral change and education, the circular economy would not be recognized and accepted as an important tool for achieving a sustainable society and environment.
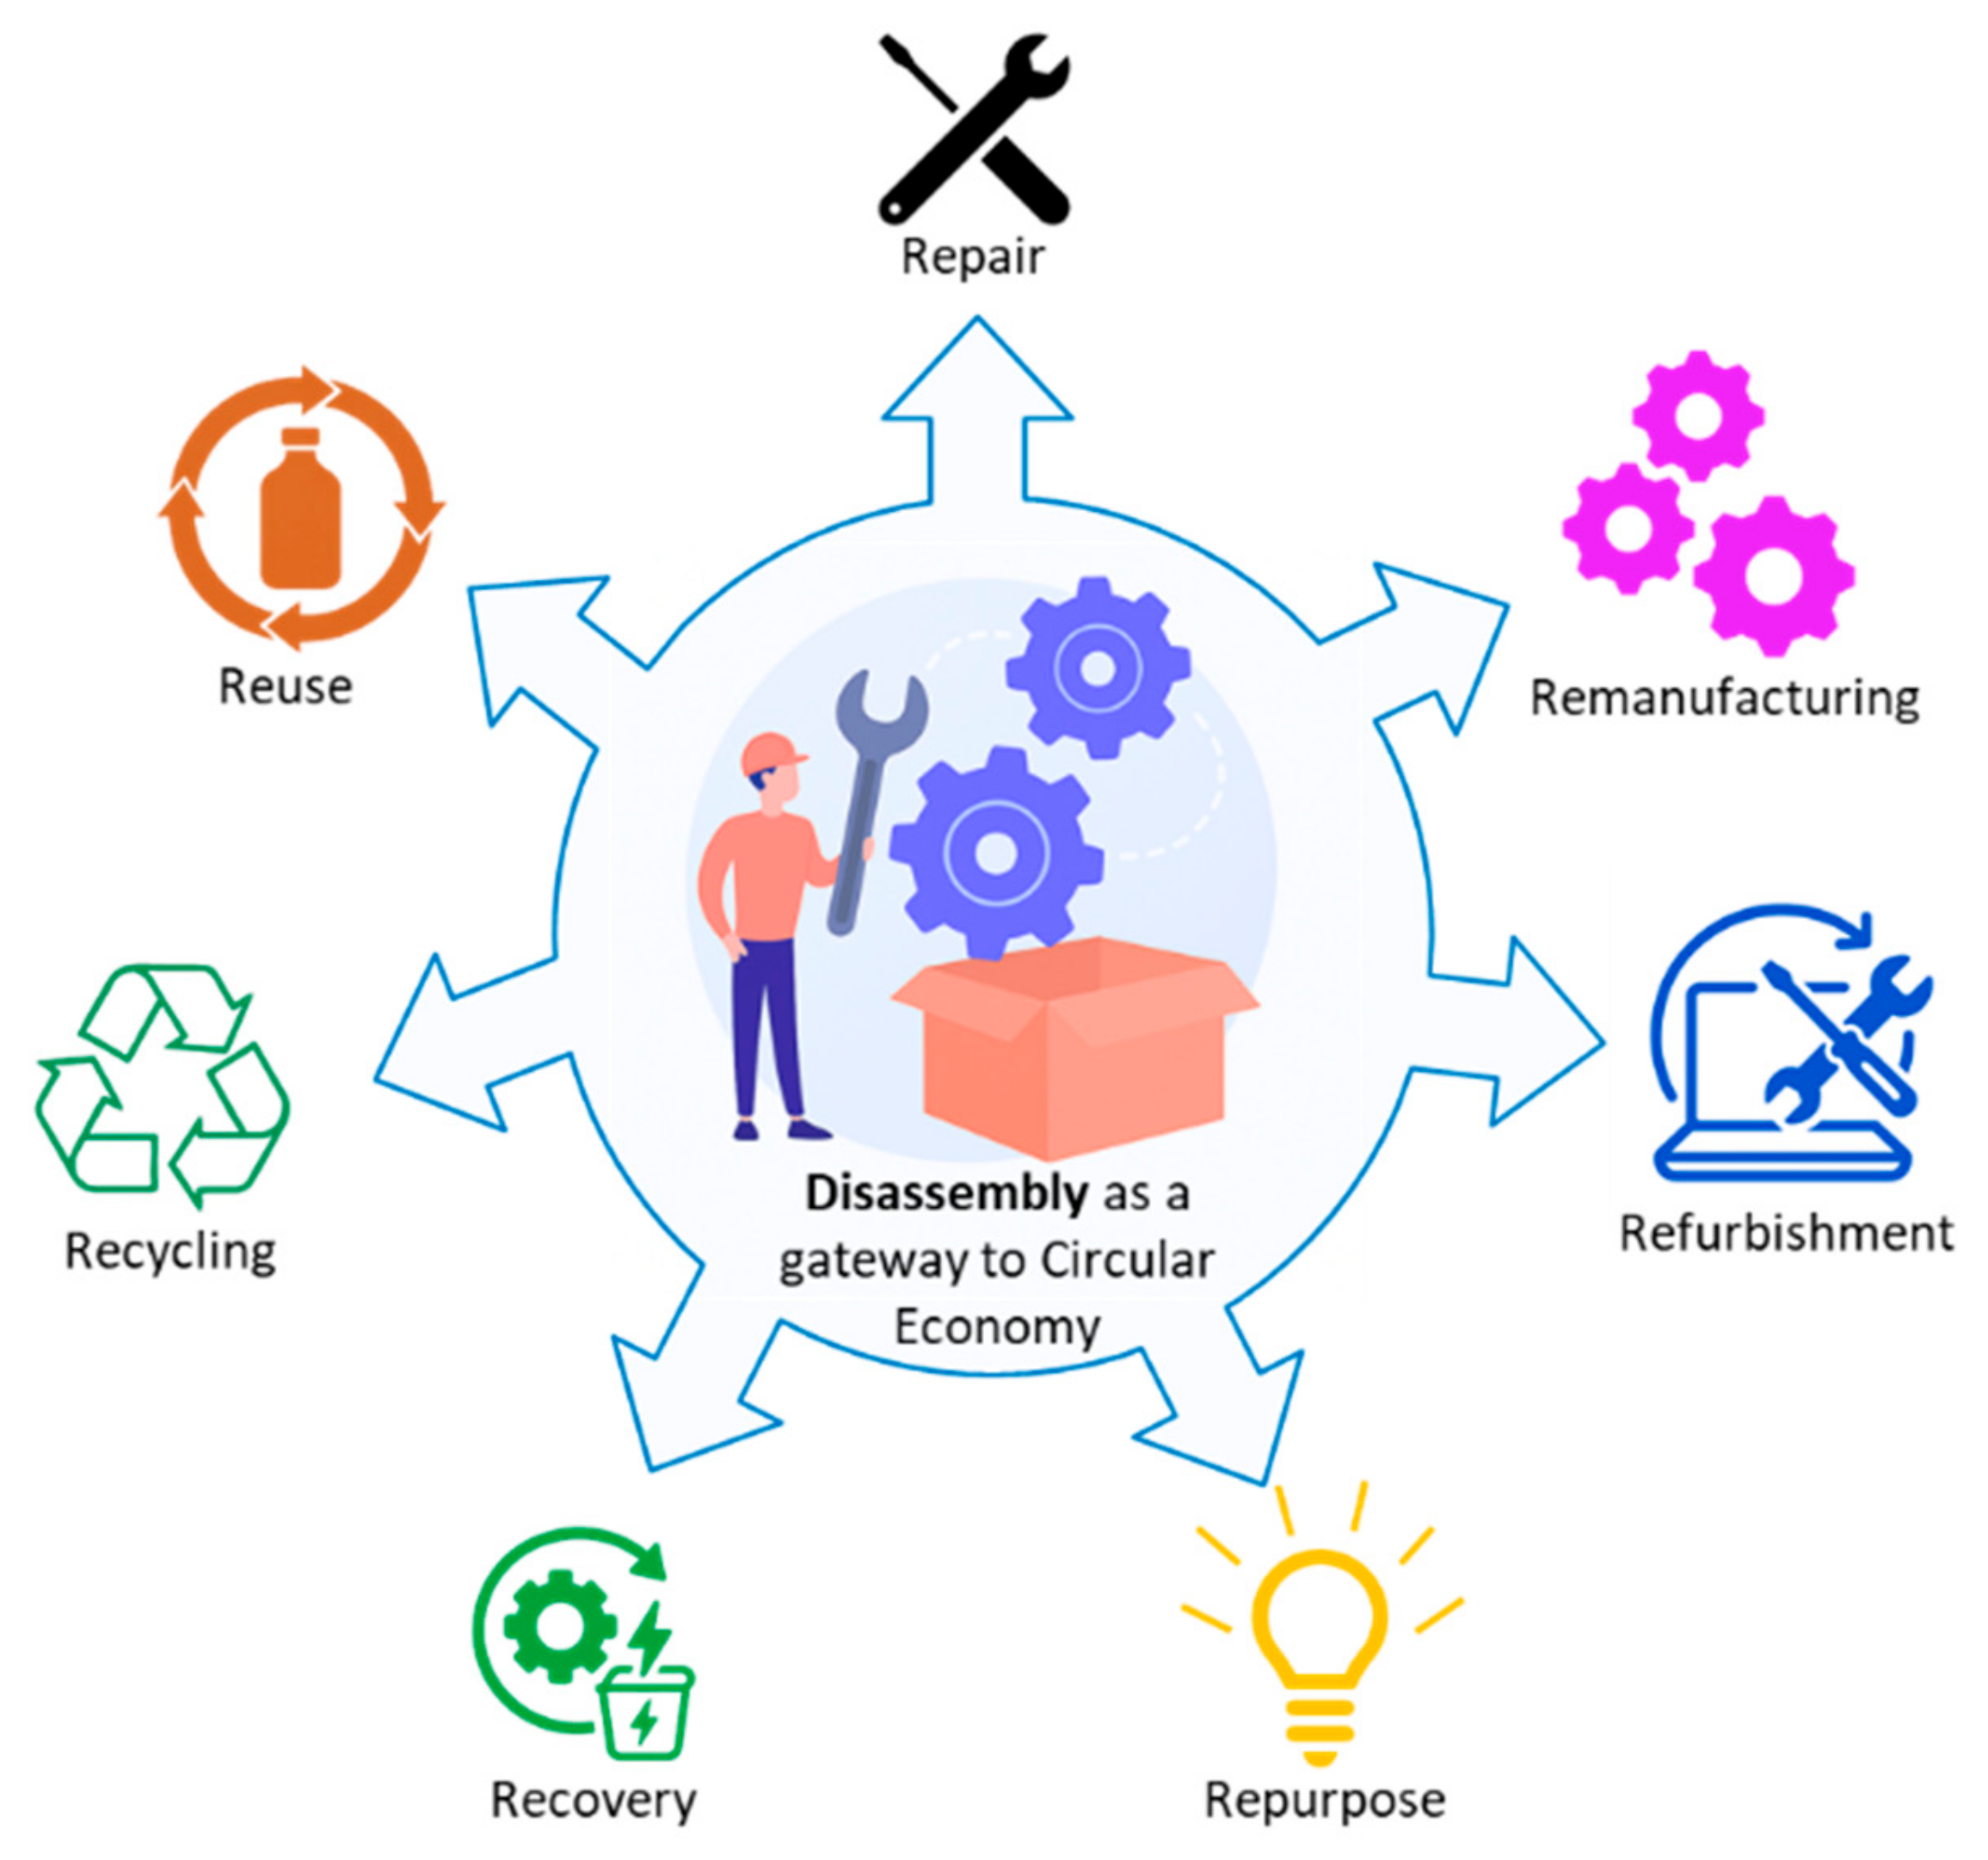
A central point of many circular economy strategies is the disassembly process. Designs for Disassembly and Design for Adaptability (DfD/As) are widely recognized as key design strategies that promote the circular economy [12]. The disassembly of a product is a process in which the product is broken down into its individual components, sub-assemblies or raw materials, which is a prerequisite for the further processing, recycling and reuse of these parts. Disassembly is therefore a starting point for the effective implementation of several R-strategies that are important for achieving the goals of the circular economy [13]. In particular, disassembly is a first step towards extending the life cycle of products through reuse, repair, remanufacturing, refurbishment and repurposing, as well as ensuring the recovery and use of materials through recycling and recovery processes (Figure 2).
Depending on the circular economy strategy, the degree of product disassembly required varies, as each strategy requires a certain level of removal, replacement or processing of product parts. This means that some strategies require a minimal disassembly of the product, while other strategies require a complete disassembly of the product into its components and/or basic materials. According to Reike et al. [14], strategies that maintain the functional value of the product require a lower level of disassembly since they assume that the product is in a good or at least partially usable condition. This refers to strategies like reuse and repair. In contrast, strategies that relate to products that are technically defective or damaged and can no longer fulfill their original purpose require the highest level of disassembly, for example, strategies such as recycling and reuse. However, the choice of R-strategy, and consequently the extent of product disassembly level required, depends greatly on the physical condition of the product at the end of its life. This claim is supported by the work of Formentini et al. [15], in which the authors propose the “Design for Circular Disassembly” indicator. The proposed indicator quantifies the effort required to disassemble a product as a function of its physical state. Using this indicator, they showed that disassembling a product in a worse condition is significantly more time-consuming, which reduces the possibility of applying strategies such as repair or remanufacturing and increases the likelihood of products being directed towards strategies such as recycling or reuse. It can be concluded that the degree of disassembly is largely determined by the circular economy strategy, but also by the actual condition of the product.

2.2. Design for Disassembly

Although at first glance a disassembly line appears to be the opposite of an assembly line, it is actually much more complex. Recent research emphasizes that disassembly itself remains one of the critical bottlenecks for enabling reuse, since the feasibility of end-of-life strategies is often limited by cost, complexity and technological barriers [16]. A key difference lies in the divergent nature of the disassembly processes, where products have to be broken down into their individual components, as opposed to the converging structure typical for assembly processes. This complexity is compounded by the variability and uncertainty associated with personalized products, such as inconsistent product conditions, unknown failure modes, missing or damaged parts, and differences in previous use or repair history. In contrast to standardized parts in assembly lines, disassembly often requires pre-inspection, sorting and classification, resulting in increased time and decision-making requirements. Designs for disassembly could help in creating a product in a way that enables a high percentage of reuse and recycling. In recent decades, one of the key challenges attracting the attention of researchers has been the development of products that can be easily disassembled. However, the requirements for ease of assembly and disassembly are often in conflict with each other. To improve this, several important factors need to be considered at the design stage, including the ease of separation of components, the use of non-permanent and improved fastening methods, the application of modular design principles to improve handling, and the minimization of material variations to support efficient sorting and recycling [17]. Another important aspect for this research is the design and balance of the disassembly line. Due to the challenges mentioned, the balancing of the disassembly line needs special attention and efficient tools to optimize performance and effectiveness [18]. To solve this problem, linear programming has proven to be a suitable approach to incorporate the complexity of the disassembly tasks and the associated times into the process of belt tuning and to effectively support the objective of maximizing throughput within a fixed time frame. Several reasons and advantages of using linear programming when adjusting disassembly to maximize throughput are discussed below in the subsections.

2.2.1. Strategic Benefits

A key strategic advantage of using linear programming (LP) in disassembly line balancing lies in its ability to support data-driven decision-making. Unlike heuristic methods, LP provides a structured and mathematical approach to task assignment that ensures consistency, transparency and reproducibility in planning decisions. This is particularly valuable in complex environments where manual allocation can lead to sub-optimal or distorted results. This capability supports robust and proactive planning and helps organizations respond effectively to uncertainties and system fluctuations. In addition, LP models enable comprehensive scenario and sensitivity analyses, allowing decision makers to evaluate various “what-if” situations, such as changes in task times due to product design updates, job reconfiguration or fluctuations in labor availability. This is important because most disassembly processes are carried out manually due to the high automation costs [17]. Another strategic advantage is the model’s flexibility in adapting to product diversity. LP can be tailored to different product types, configurations and disassembly sequences, enabling decision makers to efficiently manage highly dynamic product portfolios without having to redesign the planning framework for each case. Furthermore, LP serves as a basis for integration into intelligent manufacturing systems. By embedding optimization logic into digital twins, companies can enable real-time decision support and adaptive control, improve responsiveness and align operational execution with strategic sustainability and productivity goals.

2.2.2. Operational Benefits

A primary operational advantage of applying LP to the balancing of disassembly lines is its ability to maximize throughput within fixed time constraints. By structuring the problem around this objective, LP ensures that the maximum number of products can be disassembled in a given period of time, without the need for additional resources or line expansion. To achieve this, LP distributes the tasks optimally to the individual workstations, taking into account the varying duration of the tasks due to product complexity. This results in optimized resource utilization, minimizing idle time at workstations and distributing work evenly, ensuring that each station contributes efficiently to the overall performance of the line. By incorporating data on task complexity such as metrics from the Lucas method or Design for Assembly (DfA), LP also helps to avoid bottlenecks. Complex operations are strategically distributed to avoid overloading individual stations, which would otherwise slow down the entire process and reduce throughput. The results of LP-based optimization are quantifiable and enable performance tracking based on key indicators such as cycle time reduction, work station efficiency and increased number of disassembled products per shift. This data-driven approach not only increases operational effectiveness, but also supports continuous improvement efforts that are aligned with the goals of lean and sustainable systems.

2.2.3. Sustainability Benefits

The application LP directly supports the core principles of the circular economy, where maximizing the reuse of materials is essential. Increasing disassembly throughput supports the recovery of a greater quantity of valuable components and materials. This contributes to resource efficiency and supports the transition from linear to circular production models. Moreover, a well-balanced disassembly line contributes to energy and cost efficiency by eliminating unnecessary steps, reducing labor time and minimizing energy consumption.

2.3. The Role of Disassembly Systems Today and Product Complexity

Thanks to the further development of augmented reality (AR), in connection with disassembly activities, it is being used in disassembly systems. With the help of special applications, AR enables the visualization of product parts on a screen, enhancing the user’s physical environment [19]. The main purpose is to show the location of each part to be removed and to guide the user through the steps required to disassemble the product. Augmented reality is used in a variety of challenges related to disassembly, such as planning, design, ergonomics and providing step-by-step instructions for disassembly on production lines. By using AR, users receive real-time feedback to analyze product behavior and characteristics as well as the performance of the entire disassembly process [20]. The organization of a disassembly system is influenced by the type and complexity of the product, the input information about the number of parts, their connections to each other, the materials they are made from, information about the geometry, and the accessibility of parts that need to be disassembled, restored or replaced. Many researchers use different methods to visualize the parts intended for disassembly and their hierarchy. In the scientific literature, the variety of parts that make up the sub-assemblies of a product are often represented as nodes in different types of graphs, with their connections to each other represented as edges [21]. In industry, however, a more general representation of the parts which is commonly used is called the bill of materials (BOM) [22]. In a disassembly context, the BOM is a hierarchical, tree-like representation of the disassembled parts, where each level is assigned a numerical designation to facilitate navigation within the hierarchy from the final product to subassemblies and components. In opposition to BOM for assembly, BOM for disassembly includes data regarding material type, reusability and the condition of parts. It is reverse-oriented to support product breakdown. When such representations of disassembled parts are enhanced with new tracking technologies or augmented reality, it becomes possible to monitor each disassembly step and part movement in real time. This also opens up opportunities for easier disassembly planning and the introduction of management of changes. From a process management aspect, there are differences as the task sequence is optimized for ease of separation, component recovery, recycling or reuse. However, it is crucial to achieve some similar goals to the assembly process, such as evenly distributed workload, minimization of cycle time, maximization throughput of disassembled products, reduction in bottlenecks and consistent flow. However, the complexity of modern products leads to a high disassembly effort, which in turn leads to increased environmental impact. This research focuses on analyzing product complexity, i.e., the complexity of the product components and the way in which connections are made within the product itself. Some examples of the development of measures of product complexity are listed and explained below. A lot of measures of product, workstation, and overall process complexity represented in the literature are based on the information theory Shannon’s entropy. Shannon entropy is defined as the amount of information in a system that is required to describe the uncertainty of its behavior [23]. If certain states of the system are known, less information is required to describe them, i.e., the uncertainty of the system’s behavior is lower. Park and Okudan [24] present their complexity measure for product families as the complexity of a single part within a product in relation to its similarity to other parts within the product family. Using this complexity measure, they examine the impact on production performance, such as production cycle time and total production cost, while also considering the impact of make-to-order and make-to-stock production strategies. Alkan et al. [21] break down the activities of the individual assembly tasks into elements and assign them codes and the time required to perform them. The aim is to use this analysis to determine optimal working conditions and to integrate the model into an existing tool for the virtual visualization of worker movements during task execution. In their subsequent work, Alkan et al. [25] present a complexity index for an automated system using Petri nets that includes system states and the set of conditions leading to these states. Zeltzer et al. [26] showed in their study the minimization of workload at workstations and the distribution of complexity in engine assembly in the automotive industry. There are examples where authors [24] introduce entropy-based complexity measurement mechanism, based on a diagnostic questionnaire and a global analysis of production and operations management covering four areas, planning, organization, management and control, ensuring objective decision-making [27]. Some authors base their approaches on interactions within the product, process or layout [28], while in other research they use the information theory focused on the product family and the probability of repetition of a particular part within the family [29]. All methods are very important for applications in the assembly process, especially in the early stages of product design, where it is possible to significantly influence the entire assembly process by making conclusions about possible changes in components, their number and their mutual relationships, which will ultimately affect the assembly time and the required effort. A suitable way to describe complexity for disassembly purposes can be through the number of components and their mutual relationships. The way to keep complexity under the control is to define and measure it [30].
As already mentioned, numerous studies have dealt with the measurement of product complexity in order to optimize manufacturing and assembly processes [30,31]. Following these approaches, this study also used product complexity as a key parameter for analyzing and optimizing the process, but in the context of disassembly. Specifically, product complexity was used to determine the most efficient disassembly sequence, i.e., the one that maximizes the throughput of the system. This confirms that understanding and quantifying complexity is not limited to improving assembly, but also plays an important role in circular production models where efficient disassembly is essential for the reuse, recycling or refurbishment of components. The results of the study show that properly analyzed complexity can serve as a guide for optimizing workflows, reducing disassembly time and increasing overall process efficiency.

3. Linear Programming-Based Model for Optimizing Disassembly

3.1. Managing Product Complexity

In this section, one of the previously mentioned models for assessing product complexity will be used. This model was proposed by Sinha [32] and further adapted by Alkan [21]. Applied in many different contexts in the literature, it has proven to be especially suitable for structural characteristics of products. According to Alkan [21], structural complexity consists of three components:
C = C 1 + C 2 · C 3
where C 1 , C 2 and C 3 represent part, interface and topological complexity, respectively. In this research, this expression serves as a tool to assess complexity in order to integrate it within the disassembly model. However, all components of expression will not be used in this case; as it is a disassembly process, it differs from assembly in several points. Due to the design logic, assembly requires a strict sequence and certain elements cannot be installed before others are in place. Disassembly, on the other hand, often allows more flexibility. Components can be removed independently of each other as long as they are not mechanically blocked. In the context of disassembly, operational efficiency usually takes precedence over attention to detail. Components such as manual handling analysis ( C 1 ) and topological complexity ( C 3 ) contribute relatively little to the determination of overall disassembly performance, as their influence on cycle time and task sequencing is minor compared to other factors. Including them in the evaluation would increase the analytical effort and complexity without providing adequate insights. Therefore, their exclusion represents a pragmatic decision that speeds up the analysis while capturing the most important factors contributing to the complexity of disassembly and ensuring a balance between accuracy and efficiency. The complexity of connections in assembly, C 2 component, will be determined with Lucas DFA method [33] and manual fitting analysis. When determined with the Lucas DFA method, the expression below will be used to calculate the total complexity index. The term C 2 represents the sum of complexities of each pair-wise interaction, which is defined as β i j :
C 2 =   i = 1 N j = 1 N β i j A i j
where A i j defines the binary adjacency matrix representing the connectivity structure of the system:
A i j 1   i f   t h e r e   i s   a   c o n n e c t i o n   b e t w e e n   i   a n d   j 0   o t h e r w i s e
In this paper, the normalized fitting index is adapted from the Lucas method, Table 1, to assess individual β i j values. The complexity of connections is calculated as follows:
β i j =   f A + f B + f C + f D + f E + f F β m a x
where
  • f A is the fitting index for category A in the Lucas DfA method—Part Placing and Fastening.
  • β m a x is the theoretical maximum value for the fitting index (12.4).
The fitting index calculation for Table 1 is represented as
Fitting   index = f A + f B + f C + f D + f E + f F
Even though this table is prepared for assembly, in this research, all of these categories were tested in disassembly, and what increases complexity in assembly also increases complexity in disassembly cases, meaning that the indexes are suitable for disassembly purposes.

3.2. Products and Disassembly Process Design

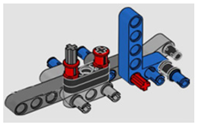
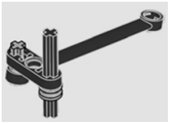
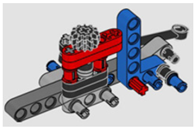
In this research, two products were used to conduct the disassembly process. The first product is called Snowmobile 1 (S1), and second is Snowmobile 2 (S2) (Figure 3). The use of these models provides a controlled and reproducible environment that allows systematic testing of the complexity of disassembly while avoiding the variability and safety risks often found in industrial products. Although simplified, the assemblies presented capture essential features of real disassembly tasks, such as override conditions, manual handling requirements and varying component accessibility. Another advantage is that these products are predefined with a complete bill of materials, unique IDs for each part and documentation comparable to industrial assembly standards. This ensures the consistency, transparency and traceability of the parts used in the experiments while reducing ambiguity in the analysis. By comparing two structurally different products of similar sizes, it becomes possible to show how the proposed methodology adapts to different product architectures, and the same approach can be extended to more complex industrial cases.
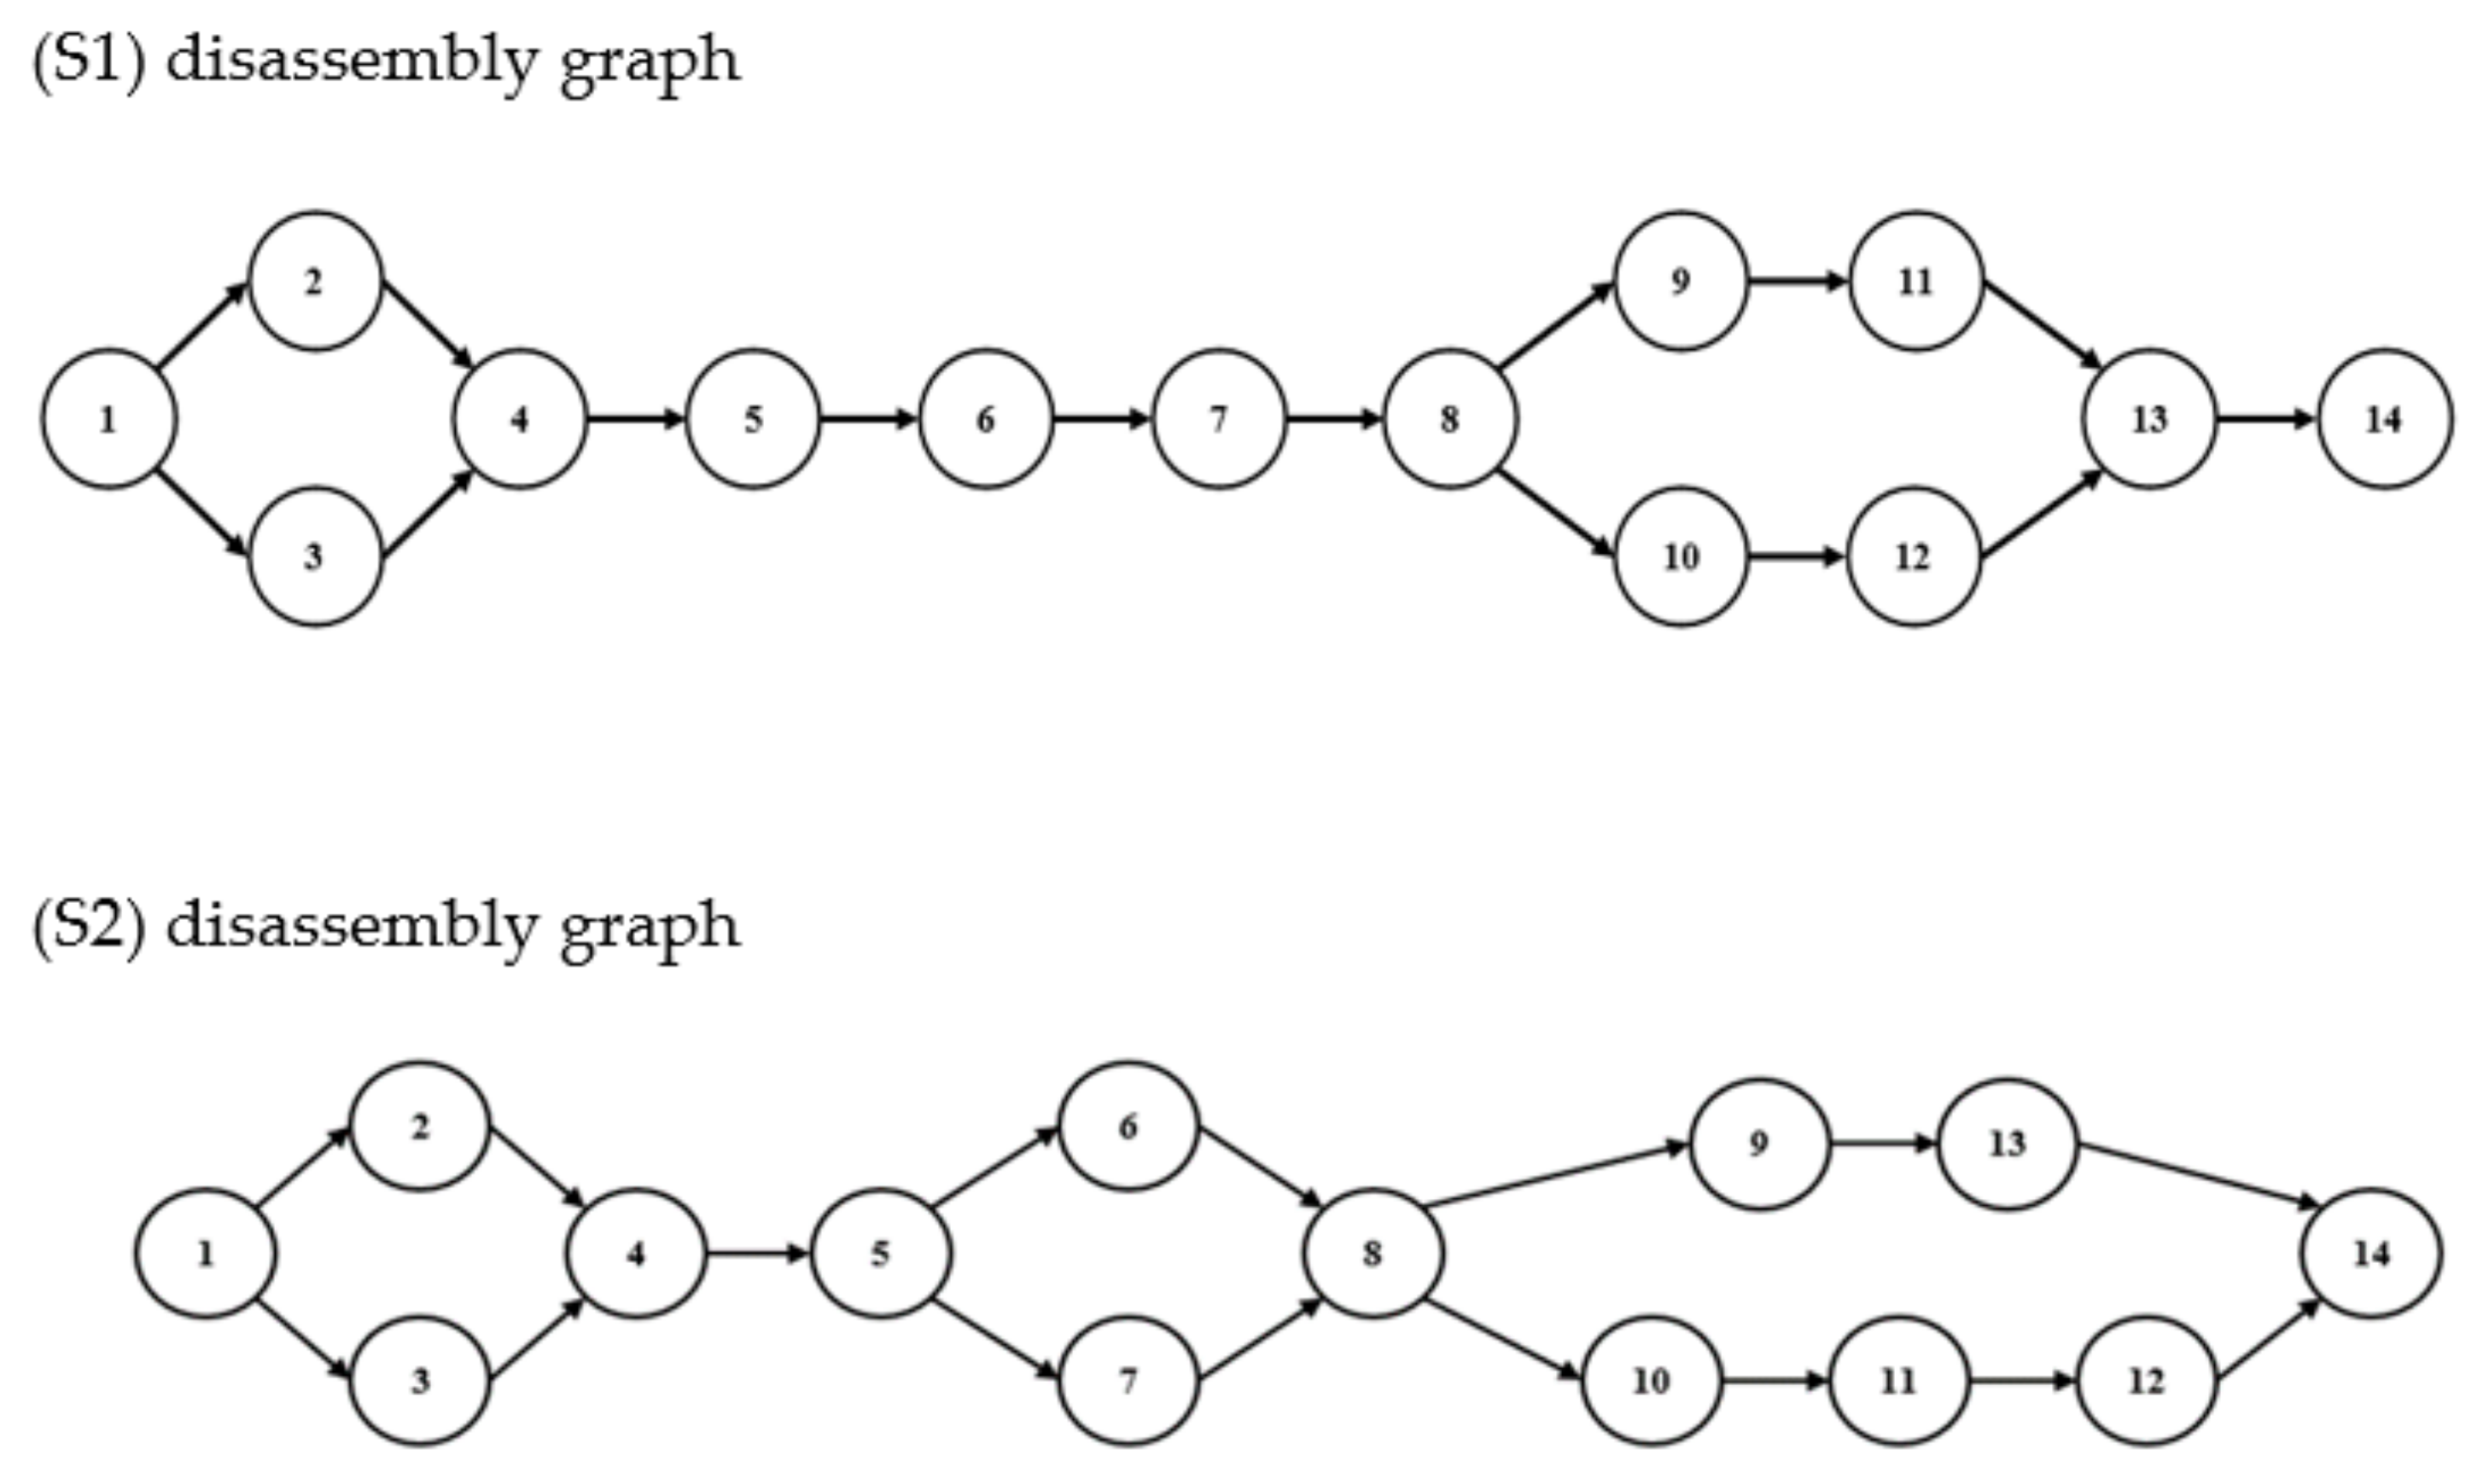
Disassembly process graphs representing sequential and parallel disassembly steps are shown in Figure 4 for S1 and S2 products. The disassembly process will be explained for the first product (S1). The first node with the number 1 in Figure 4 represents the fully assembled product, which is divided into several other nodes with corresponding assembly numbers to illustrate the optimal disassembly process. The first node splits into two parallel disassembly steps, which can be performed independently of each other and then merged at node 4. The process then continues in a sequential flow to node 8, where it again splits into two parallel paths that converge at the end point, node 14. In the example from the study, both sequential independence and sequential dependency were used for disassembly. Assemblies can also be visualized using clusters. Clusters represent grouped components that can be disassembled together, which simplifies the actual disassembly process. The following diagram shows the assignment of the assemblies and the disassembly process of the entire product. The explanation for the second product (S2) is different. As Snowmobile 2 is constructed differently to Snowmobile 1, the illustration of the disassembly process looks visually different. The first node with the number 1 represents the fully assembled product, from which the disassembly process begins. This is followed by the parallel disassembly of assemblies represented by nodes 2 and 3, which are sequentially independent. Only when these have been disassembled can nodes 4 and 5 be accessed. Nodes 6 and 7 can be disassembled after the assembly represented by node 5 has been removed. After the disassembly of assembly 8, two sequentially independent streams are created, which then converge at node 14 and mark the end of the disassembly process. When nodes are parallel, the question of which task will start first depends on time. In the end, it is important that they finish at the same time to be ready for the next node.

3.3. Development of Disassembly Model and Maximization of Disassembly Throughput

A linear programming model applied to the disassembly process can provide optimal results for certain aspects of disassembly. In this work, the focus is on the complexity of the product that needs to be disassembled at a workstation within the available time frame of a single working day. In order to formulate a linear programming problem, it is necessary to define an objective function with the associated variables and constraints. The variables are the key components that are optimized and influence the target result, while the constraints are the conditions that must be met for a solution to be considered acceptable. The simplex algorithm consists of four steps. The first step is to construct an initial feasible solution. This initial solution represents the initial values of the variables that fulfill all the defined constraints. Once the initial solution has been determined, it is necessary to check whether it fulfills the objective function and whether it leads to an optimal solution. If the solution is not optimal, the method improves the solution iteratively and finally delivers the optimal result after a finite number of steps. By analyzing and manipulating the model, you gain an insight into the behavior of the real system, which is why it is crucial to define the objective function, the variables and the constraints correctly. In the example analyzed in this research, the objective function was defined with the aim of minimizing product complexity. In addition to minimizing product complexity, it is also necessary to determine the maximum number of parts that can be disassembled at the workstation. To achieve this with the linear programming model, it was necessary to adapt the model with the penalty function. An approximation is achieved by adding a penalty term to the objective function that falls within the unrealizable region. Usually, in methods with penalty functions, the given objective function is modified by introducing penalty functions on the basis of given constraints. In the part of the range that does not fulfill the constraints (the infeasible region), a penalty is added to the function value, which worsens the value of the modified objective function. In this way, the final value of the objective function is degraded and the points within the infeasible region become uncompetitive, pushing the function out of the infeasible region. In the part of the range that does not fulfill the conditions, the objective function should assume high values, which can be achieved by adding the penalty term. With the help of the penalty term, only the feasible part of the range becomes competitive in relation to the value of the objective function. The objective function was formulated as a minimization problem. The reason for this choice is that the study focuses on minimizing the overall complexity of disassembly, which directly reflects the time, effort, and resources required for product disassembly. By minimizing complexity, the model identifies the most efficient disassembly sequence. At the same time, the methodology takes into account the maximum possible number of parts that can be disassembled within the given constraints. In other words, minimizing the objective function does not reduce the amount of disassembly, but ensures that the process is carried out in the least complex and most resource-efficient way.
Objective function is defined as
F = x 1 · C 2 S 1 + x 2 · C 2 S 2 + + x n · C 2 S n k x 1 + x 2 + + x n ,     i = 1 n ,   k > 0
where
  • x n is the number of disassembled products n ;
  • C 2 S n is interface complexity for disassembly of product n ;
  • k is the penalty parameter.
This expression is generalized for more products that can be included; however, in this specific example with two products, the penalty parameter was tested and should be higher than 10 to lead the search sequence out of the infeasible region during optimization. In the experiments, the parameter k was chosen to be greater than 10. This choice was based on exploratory experiments in the solution space, which showed that feasible solutions consistently occurred in this range. The main objective was therefore to restrict the analysis to the range in which valid disassembly sequences could be obtained. As far as sensitivity is concerned, the results are not strongly dependent on the exact value of k; the quality of the solutions remains stable as long as k is chosen within the feasible range. Therefore, the choice of k > 10 should be understood as a practical guideline to ensure feasibility and not as a strict parameter that significantly alters the results. This is one of constraints. This is where other constraints should also be defined. The constraint x n 0 is a non-negativity constraint, and the set of values of variables x 1 , x 2 x n that satisfy all constraints are called the feasible solution. In addition, it is necessary to define more constraints for each disassembly workstation, as they only have a limited amount of time to complete the task. The constraints are the product of the time required for disassembly and the variables x 1 , x 2 x n , written in the following form:
c m = j = 1 m t j · x n T m
where
  • c m is the constraint for disassembly workstation j , for   j = 1 m ;
  • t j is disassembly time for specific product n ;
  • T m is amount of time to complete disassembly tasks at specific workstation j .

4. Results and Discussion

4.1. Product Complexity Calculation

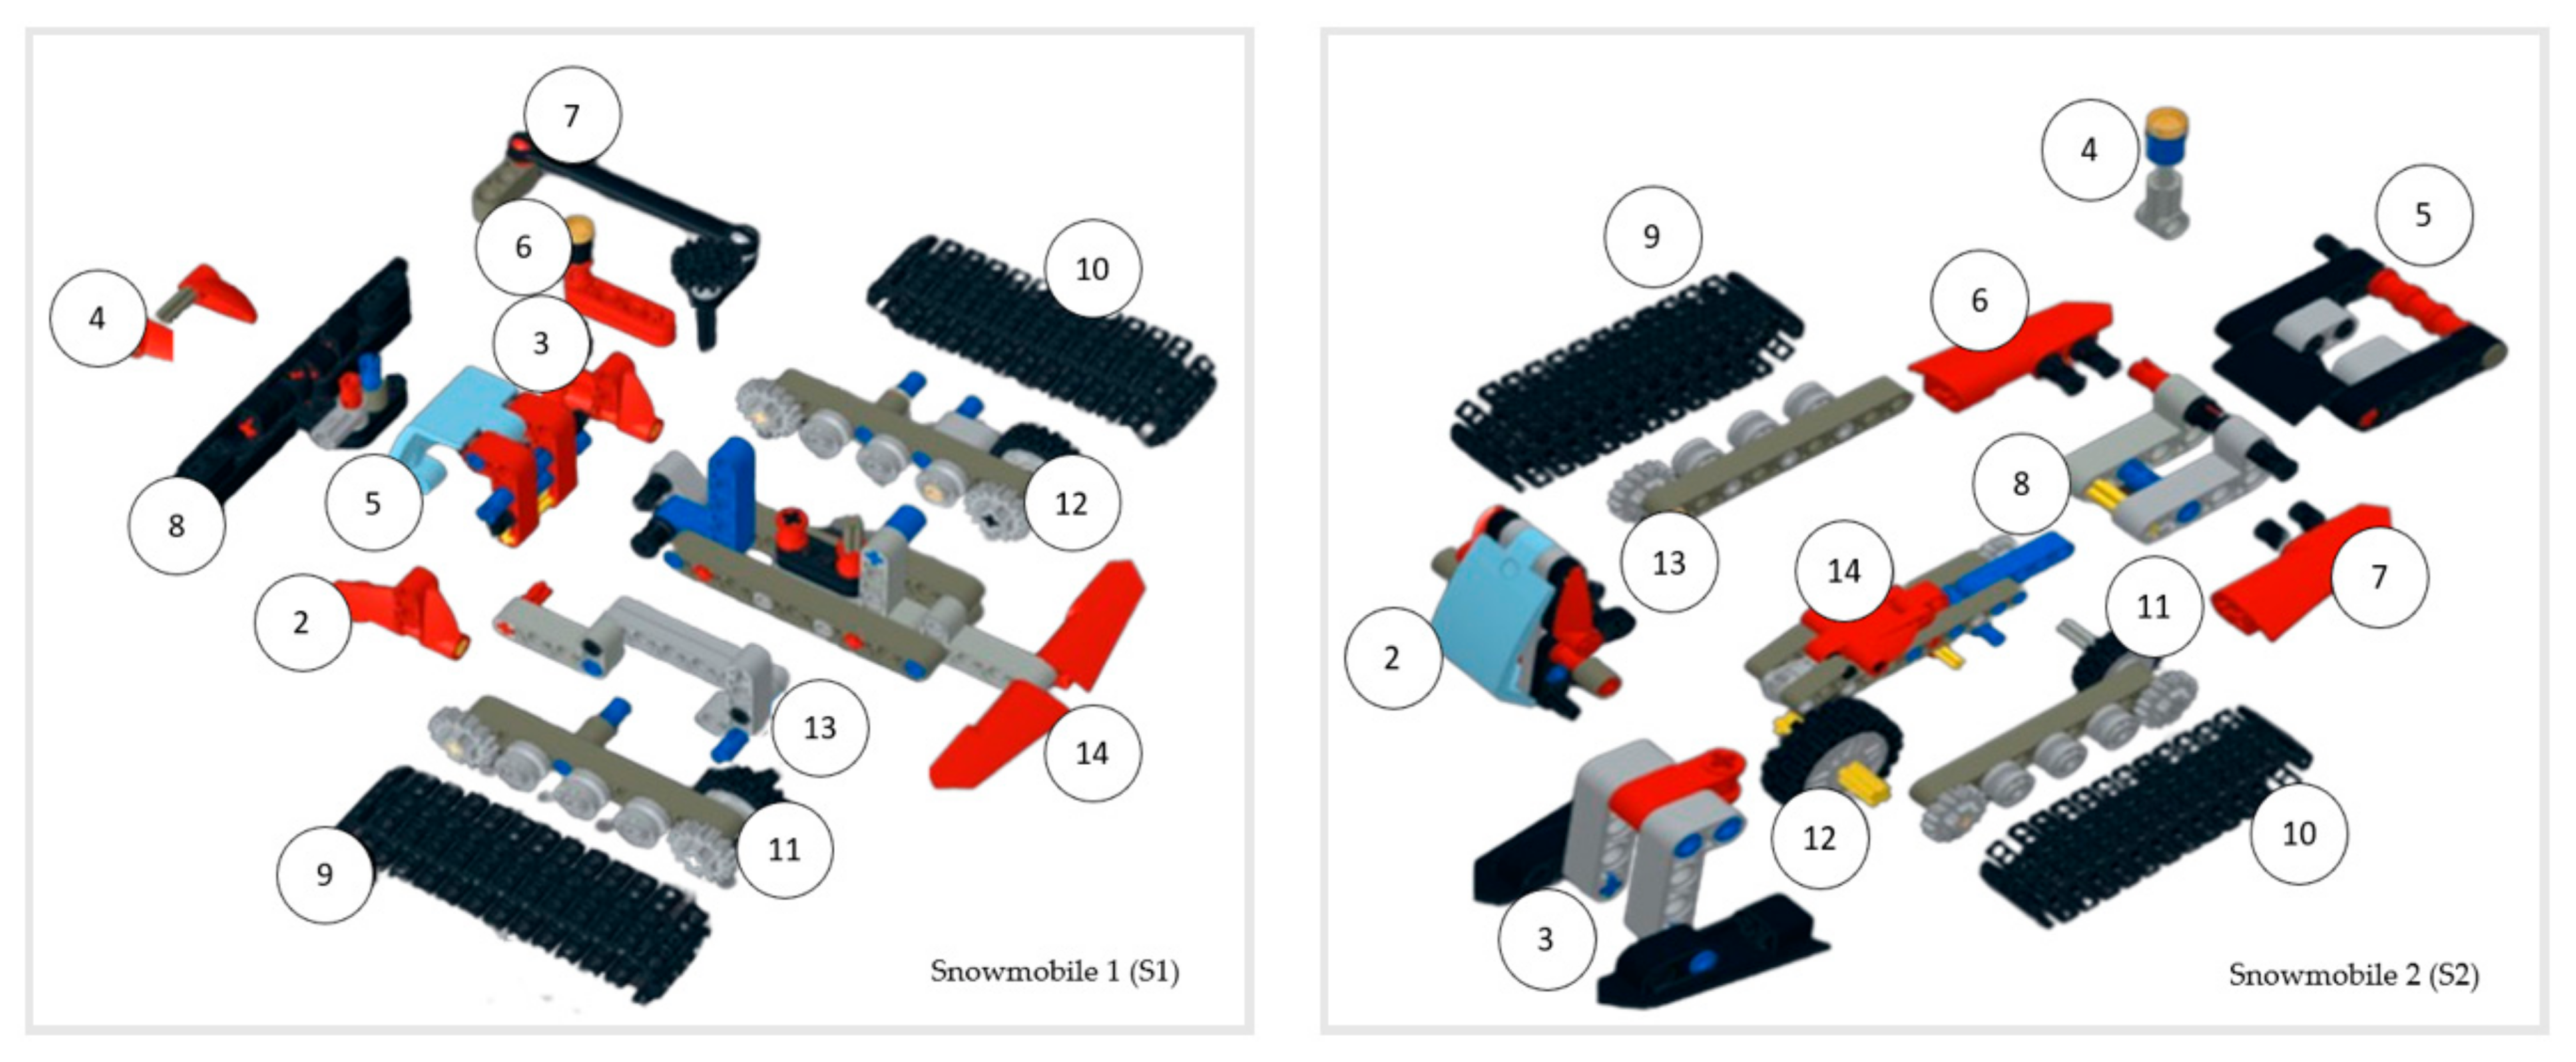
Product complexity is represented by the concept of structural complexity of technical systems, which is defined by the number of different elements and their mutual structural connections. Using this approach, the complexity of the technical system is quantified, providing a more precise insight into the factors that influence product complexity. Figure 5 shows an exploded view in which the assemblies are labeled with numbers for both products.
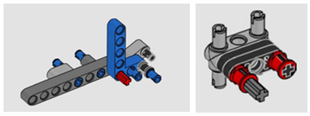
Table 2 shows examples of the way in which connections are defined in subassemblies for product S1. Also, there is a complexity index calculated from the table below.
The C 2 component or complexity fitting index is determined with the Lucas DFA method and manual fitting analysis, according to Table 1, and calculated using expressions 2, 3, 4 and 5. Table 3 is related to Table 2 and contains the defined index based on the connections for each subassembly and the calculated total complexity index for each connection. This is the way in which all other connections used in this research were calculated and then integrated within the linear programming model.

4.2. Linear Programming Results

In this section, linear programming results will be shown. Before, it was necessary to conduct the disassembly process for products and repeat this several times to measure the time necessary for each connection defined for each product. Table 4 shows the sum of complexity and time for each disassembly workstation.
To solve the linear programming model, it was necessary to use the Excel solver. All the necessary data were there, together with the objective function defined as
F = x 1 · 4.86   + x 2 · 4.11 10   x 1 + x 2
with constraints defined as
s 1 = 60 · x 1 + 20 · x 2 20,171
s 2 = 10 · x 1 + 20 · x 2 15,171
s 3 = 30 · x 1 + 35 · x 2 28,300
s 4 = 35 · x 1 + 35 · x 2 28,300
s 5 = 40 · x 1 + 35 · x 2 28,300
x 1 100
x 2 600
The constraints of the model are not arbitrary assumptions, but result from the logical and physical requirements of the disassembly process. The constraints were defined to reflect both the logical structure of the disassembly process and the practical conditions under which it is carried out. Precedence constraints ensure that the components are removed in the correct order, taking into account the physical and topological dependencies between the parts. Capacity constraints limit the number of tasks that can be assigned to a workstation or disassembly step within the given cycle time, thus ensuring the feasibility of execution. The constraints x 1 and x 2 are directly determined by the disassembly requirements, i.e., which components have to be removed and in what quantity. These values are not universally defined, but depend on the specific objectives of the disassembly process, and x 1 and x 2 thus serve as flexible parameters that adapt the model to different practical contexts and ensure that the optimization remains aligned with the actual needs of the process.
The obtained results of the model have shown that our disassembly process is able to disassemble 100 S1 products and over 700 S2 products within the available working hours scheduled at each workstation. While this demonstrates technical efficiency, its greater significance lies in its impact on sustainability. By enabling a higher disassembly flow, the model ensures that more components are recovered for reuse and recycling, which directly leads to a reduction in waste and savings in raw materials. The proposed method, therefore, not only optimizes processes, but in particular promotes CE and sustainability goals by improving material recovery rates, reducing end-of-life environmental impacts and promoting product designs that balance user needs with end-of-life disassembly efficiency.

4.3. Discussion

From the solution shown in Excel Solver, the objective function has taken on a negative value due to the large penalty term; however, this is not important because the goal is to minimize complexity. In this case, the penalty term helps to avoid areas in the function domain that represent high product complexity. The objective function without penalty is positive. Using the linear programming method, the number of units that can be disassembled through the previously described disassembly process is 100 S1 products and over 700 S2 products, which exceeds the constraints added at the beginning. Since the complexity of S1 is greater than that of S2, it is expected that more units of the less complex product will be disassembled. Additional constraints, such as disassembling more than 100 S1 product units and 600 S2 product units, have also been satisfied, so this solution is validated.
The results of this research show that product complexity plays an important role in the efficiency of the disassembly process. The analysis of two snowmobiles provided valuable insights and showed that products with a larger number of components and more complex connections require significantly more time for disassembly, even though these products have the same parts but different connections. This clearly shows that more complex products are more challenging to disassemble, which is reflected in the longer duration of the process. By applying Lucas’ method of quantifying complexity, the analysis took into account the difficulty of handling certain components, especially those with small dimensions, different geometric shapes and the need for a firm grip to prevent them from falling. In contrast, simpler components that require fewer connections make the disassembly process much easier. Using a model to map the disassembly process, the optimal disassembly procedure for both products was determined, including the order in which the individual sub-assemblies should be disassembled. The disassembly process was optimized by formulating the target function to minimize product complexity while maximizing the number of disassembled products at the workstation. The aim was to disassemble as many components as possible in the shortest possible time, which can be achieved by minimizing product complexity. This was achieved by introducing a penalty term. Finally, linear programming was used to determine the number of units that can be disassembled by the specified process. These results show that the integration of penalty conditions not only ensures feasibility but also provides a systematic way to prevent inefficient solutions, which is crucial when scaling optimization models to more complex products and larger production systems.

5. Conclusions

The represented results directly support the goals of the circular economy by emphasizing the efficient recovery of resources through optimized disassembly. By reducing product complexity, more components can be disassembled, reused or recycled in less time, minimizing waste generation and promoting the circular economy. The use of complexity analyses such as the Lucas method improves the ability to identify and recover high-value components, which is in line with the principle of extending product life cycles and preserving resource value. Furthermore, by avoiding highly complex products through penalty functions in optimization, the model encourages the design and selection of products that are better suited to end-of-life recycling processes. This supports the principles of Design for Disassembly (DfD) and helps to close the loop in product systems. Ultimately, the overall approach contributes to the transition from a linear to a circular model by enabling scalable and systematic disassembly planning, which is essential for achieving long-term sustainability in industrial production.
A key value of this research lies in the successful modeling of a complex disassembly problem by establishing a link between two critical variables: complexity and time. This enabled a quantitative approach to analyzing how the structural complexity of a product affects the duration of the disassembly process, contributing significantly to understanding the real challenges of end-of-life product management. By integrating these factors into a single optimization model, informed decisions can be made to improve process efficiency, reduce time and resource consumption and support circular economy goals through better planning of the disassembly, reuse and recycling of components. However, some limitations of this study should be noted, including the focus on only two product types, which may not capture the full variability of disassembly processes across industries. Future research should examine a broader range of products, integrate dynamic disassembly conditions, and investigate the impact of automation and robotics on complexity reduction. In terms of scalability, the proposed approach could be extended to large industrial systems by including additional constraints such as labor availability, machine capacity and cost factors. Finally, the practical applicability lies in supporting decision-making for manufacturers, recyclers and policy makers by providing a structured framework linking product design, disassembly efficiency and circular economy goals.

Author Contributions

Conceptualization and methodology—M.C.Ž. and M.M.; Analysis and validation—A.A.M.; Investigation, data collection and case studies—M.C.Ž. and A.A.M.; Writing and draft preparation—M.C.Ž.; Writing, review and editing N.G. and M.M. All authors have read and agreed to the published version of the manuscript.

Funding

This research received no external funding.

Institutional Review Board Statement

Not applicable.

Informed Consent Statement

Not applicable.

Data Availability Statement

The original contributions presented in this study are included in the article. Further inquiries can be directed to the corresponding author.

Conflicts of Interest

The authors declare no conflicts of interest.

References

  1. European Commission. Directorate-General for Communication. Circular Economy Action Plan: For a Cleaner and More Competitive Europe; Publication Office of the European Union: Luxembourg, 2020. [Google Scholar] [CrossRef]
  2. De Fazio, F.; Bakker, C.; Flipsen, B.; Balkenende, R. The Disassembly Map: A new method to enhance design for product repairability. J. Clean. Prod. 2021, 320, 128552. [Google Scholar] [CrossRef]
  3. Bocken, N.; De Pauw, I.; Bakker, C.; Van der Grinten, B. Product and design business model strategies for a circular economy. J. Ind. Prod. Eng. 2016, 33, 308–320. [Google Scholar] [CrossRef]
  4. Mani, V.; Das, S.; Caudill, R. Disassembly complexity and recyclability analysis of new designs from CAD file data. In Proceedings of the 2001 IEEE International Symposium on Electronics and the Environment. 2001 IEEE ISEE (Cat. No. 01CH37190), Denver, CO, USA, 9 May 2001; pp. 10–15. [Google Scholar]
  5. Benabdellah, A.; Bouhaddou, I.; Benghabrit, A.; Benghabrit, O. A systematic review of design for X techniques from 1980 to 2018: Concepts, applications, and perspectives. Int. J. Adv. Manuf. Technol. 2019, 102, 3473–3502. [Google Scholar] [CrossRef]
  6. Formentini, G.; Prioli, J.; Ko, J.; Hapuwatte, B.; Ferrero, V.; Badurdeen, F.; Rickli, J.L.; Ramanujan, D. A review of disassembly systems for circular product design. J. Clean. Prod. 2025, 506, 145459. [Google Scholar] [CrossRef]
  7. Lindemann, U.; Maurer, M.; Braun, T. Complexity in the Conteyt of Product Design; Springer: Berlin/Heidelberg, Germany, 2009. [Google Scholar]
  8. Vanegas, P.; Peeters, J.R.; Cattrysse, D.; Tecchio, P.; Ardente, F.; Mathieux, F.; Dewulf, W.; Duflou, J.R. Ease of disassembly of products to support circular economy strategies. Resour. Conserv. Recycl. 2018, 135, 323–334. [Google Scholar] [CrossRef]
  9. Zhang, Q.; Xing, Y.; Yao, M.; Guo, X.; Qin, S.; Zhu, H.; Qi, L.; Hu, B. Optimizing Robotic Disassembly-Assembly Line Balancing with Directional Switching Time via an Improved Q(λ) Algorithm in IoT-Enabled Smart Manufacturing. Electronics 2025, 14, 3499. [Google Scholar] [CrossRef]
  10. Cong, L.; Zhao, F.; Sutherland, J. Integration of dimantling operations into a value recovery plan for circular economy. J. Clean. Prod. 2017, 149, 378–386. [Google Scholar] [CrossRef]
  11. Kirchherr, J.; Yang, N.; Schulze-Spuntrup, F.; Heerink, M.; Hartley, K. Conceptualizing the circular economy (revisited): An analysis of 221 definitions. Resour. Conserv. Recycl. 2023, 194, 107001. [Google Scholar] [CrossRef]
  12. Kret-Grzeskowiak, A.; Baborska-Narozny, M. Guidelines for disassembly and adaptation in architectural design compared to circular economy goals—A literature review. Sustain. Prod. Consum. 2023, 39, 1–12. [Google Scholar] [CrossRef]
  13. Al Assadi, A.; Goes, D.; Baazouzi, S.; Staudacher, M.; Malczyk, P.; Kraus, W.; Nägele, F.; Huber, M.F.; Fleischer, J.; Peuker, U.; et al. Challenges and prospects of automated disassembly of fuel cells for a circular economy. Resour. Conserv. Recycl. Adv. 2023, 19, 200172. [Google Scholar] [CrossRef]
  14. Reike, D.; Vermeulen, W.; Witjes, S. The circular economy: New or refurbished as CE 3.0?—Exploring controversies in the conceptualization of the circular economy through a focus on history and resource value retention options. Resour. Conserv. Recycl. 2018, 135, 246–264. [Google Scholar] [CrossRef]
  15. Formentini, G.; Ramanujan, D. Design for circular disassembly: Evaluating the impacts of product end-of-life status on circularity through the parent-action-child model. J. Clean. Prod. 2023, 405, 137009. [Google Scholar] [CrossRef]
  16. Ohnemuller, G.; Beller, M.; Rosemann, B.; Dopper, F. Disassembly and Its Obstacles: Challenges Facing Remanufacturers of Lithium-Ion Traction Batteries. Processes 2025, 13, 123. [Google Scholar] [CrossRef]
  17. Battaia, O.; Dolgui, A.; Heragu, S.; Meerkov, S.; Tiwari, M.K. Design for manufacturing and assembly/disassembly: Joint design of products and production systems. Int. J. Prod. Res. 2017, 56, 7181–7189. [Google Scholar] [CrossRef]
  18. Benatha, M.; Battaia, O.; Doulgui, A.; Hu, J. Dealing with Uncertainty in Disassembly Line Design. CIRP Ann.-Manuf. Technol. 2014, 63, 21–24. [Google Scholar] [CrossRef]
  19. Wang, X.; Ong, S.; Nee, A. A comprehensive survey of augmented reality assembly research. Adv. Manuf. 2016, 4, 1–22. [Google Scholar] [CrossRef]
  20. Nee, A.; Ong, S.; Chryssolouris, G.; Mourtzis, D. Augmented reality applications in design and manufacturing. CIRP Ann. 2012, 61, 657–679. [Google Scholar] [CrossRef]
  21. Alkan, B.; Vera, D.; Ahmad, B. A method to assess assembly complexity of industrial products in early design phase. IEEE Access 2017, 6, 989–999. [Google Scholar] [CrossRef]
  22. Chatras, C.; Giard, V.; Sali, M. Mass customisation impact on bill of materials structure and master production schedule development. Int. J. Prod. Res. 2015, 54, 5634–5650. [Google Scholar] [CrossRef]
  23. Shannon, C. A mathematical theory of communication. Bell Syst. Tech. J. 1948, 27, 379–423. [Google Scholar] [CrossRef]
  24. Park, K.; Kremer, G.O. Assessment of static complexity in design and manufacturing of a product family and its impact on manufacturing performance. Int. J. Prod. Econ. 2015, 169, 215–232. [Google Scholar] [CrossRef]
  25. Alkan, B.; Vera, D.; Ahmand, M.; Ahmad, B.; Harrison, R. Design evaluation of automated manufacturing processes based on complexity of control logic. Procedia CIRP 2016, 50, 141–146. [Google Scholar] [CrossRef]
  26. Zeltzer, L.; El-Houssaine, A.; Limere, V. Workload balancing and manufacturing complexity levelling in mixed-model assembly lines. Int. J. Prod. Res. 2016, 55, 2829–2844. [Google Scholar] [CrossRef]
  27. Herrera-Vidal, G.; Coronado-Hernández, J.R.; Paredes, B.P.M.; Ramos, B.O.S.; Sierra, D.M. Systematic configurator for complexity management in manufacturing systems. Entropy 2024, 26, 747. [Google Scholar] [CrossRef]
  28. Modrak, V.; Soltysova, Z. Development of operational complexity measure for selection of optimal layout design alternative. Int. J. Prod. Res. 2017, 56, 7280–7295. [Google Scholar] [CrossRef]
  29. Modrak, V.; Soltysova, Z. Novel Complexity Indicator of Manufacturing Process Chains and Its Relations to Indirect Complexity Indicators. Complexity 2017, 2017, 9102824. [Google Scholar] [CrossRef]
  30. Frizelle, G.; Suhov, Y. The measurement of complexity in production and other commercial systems. Proc. R. Soc. A: Math. Phys. Eng. Sci. 2008, 464, 2649–2668. [Google Scholar] [CrossRef]
  31. Liu, H.; Xu, K.; Pan, Z. Modeling and application of mixed model assembly system complexity introduced by auto-body personalization. Int. J. Adv. Manuf. Technol. 2015, 93, 43–54. [Google Scholar] [CrossRef]
  32. Sinha, K. Structural Complexity and Its Implications for Design of Cyber Phisical Systems. Ph.D. Thesis, Massachusetts Institute of Technology, Cambridge, MA, USA, 2014. [Google Scholar]
  33. Chan, V.; Salustri, F. DFA: The Lucas Method. 2005. Available online: https://ebrary.net/191720/business_finance/lucas_evaluation_method (accessed on 29 January 2019).
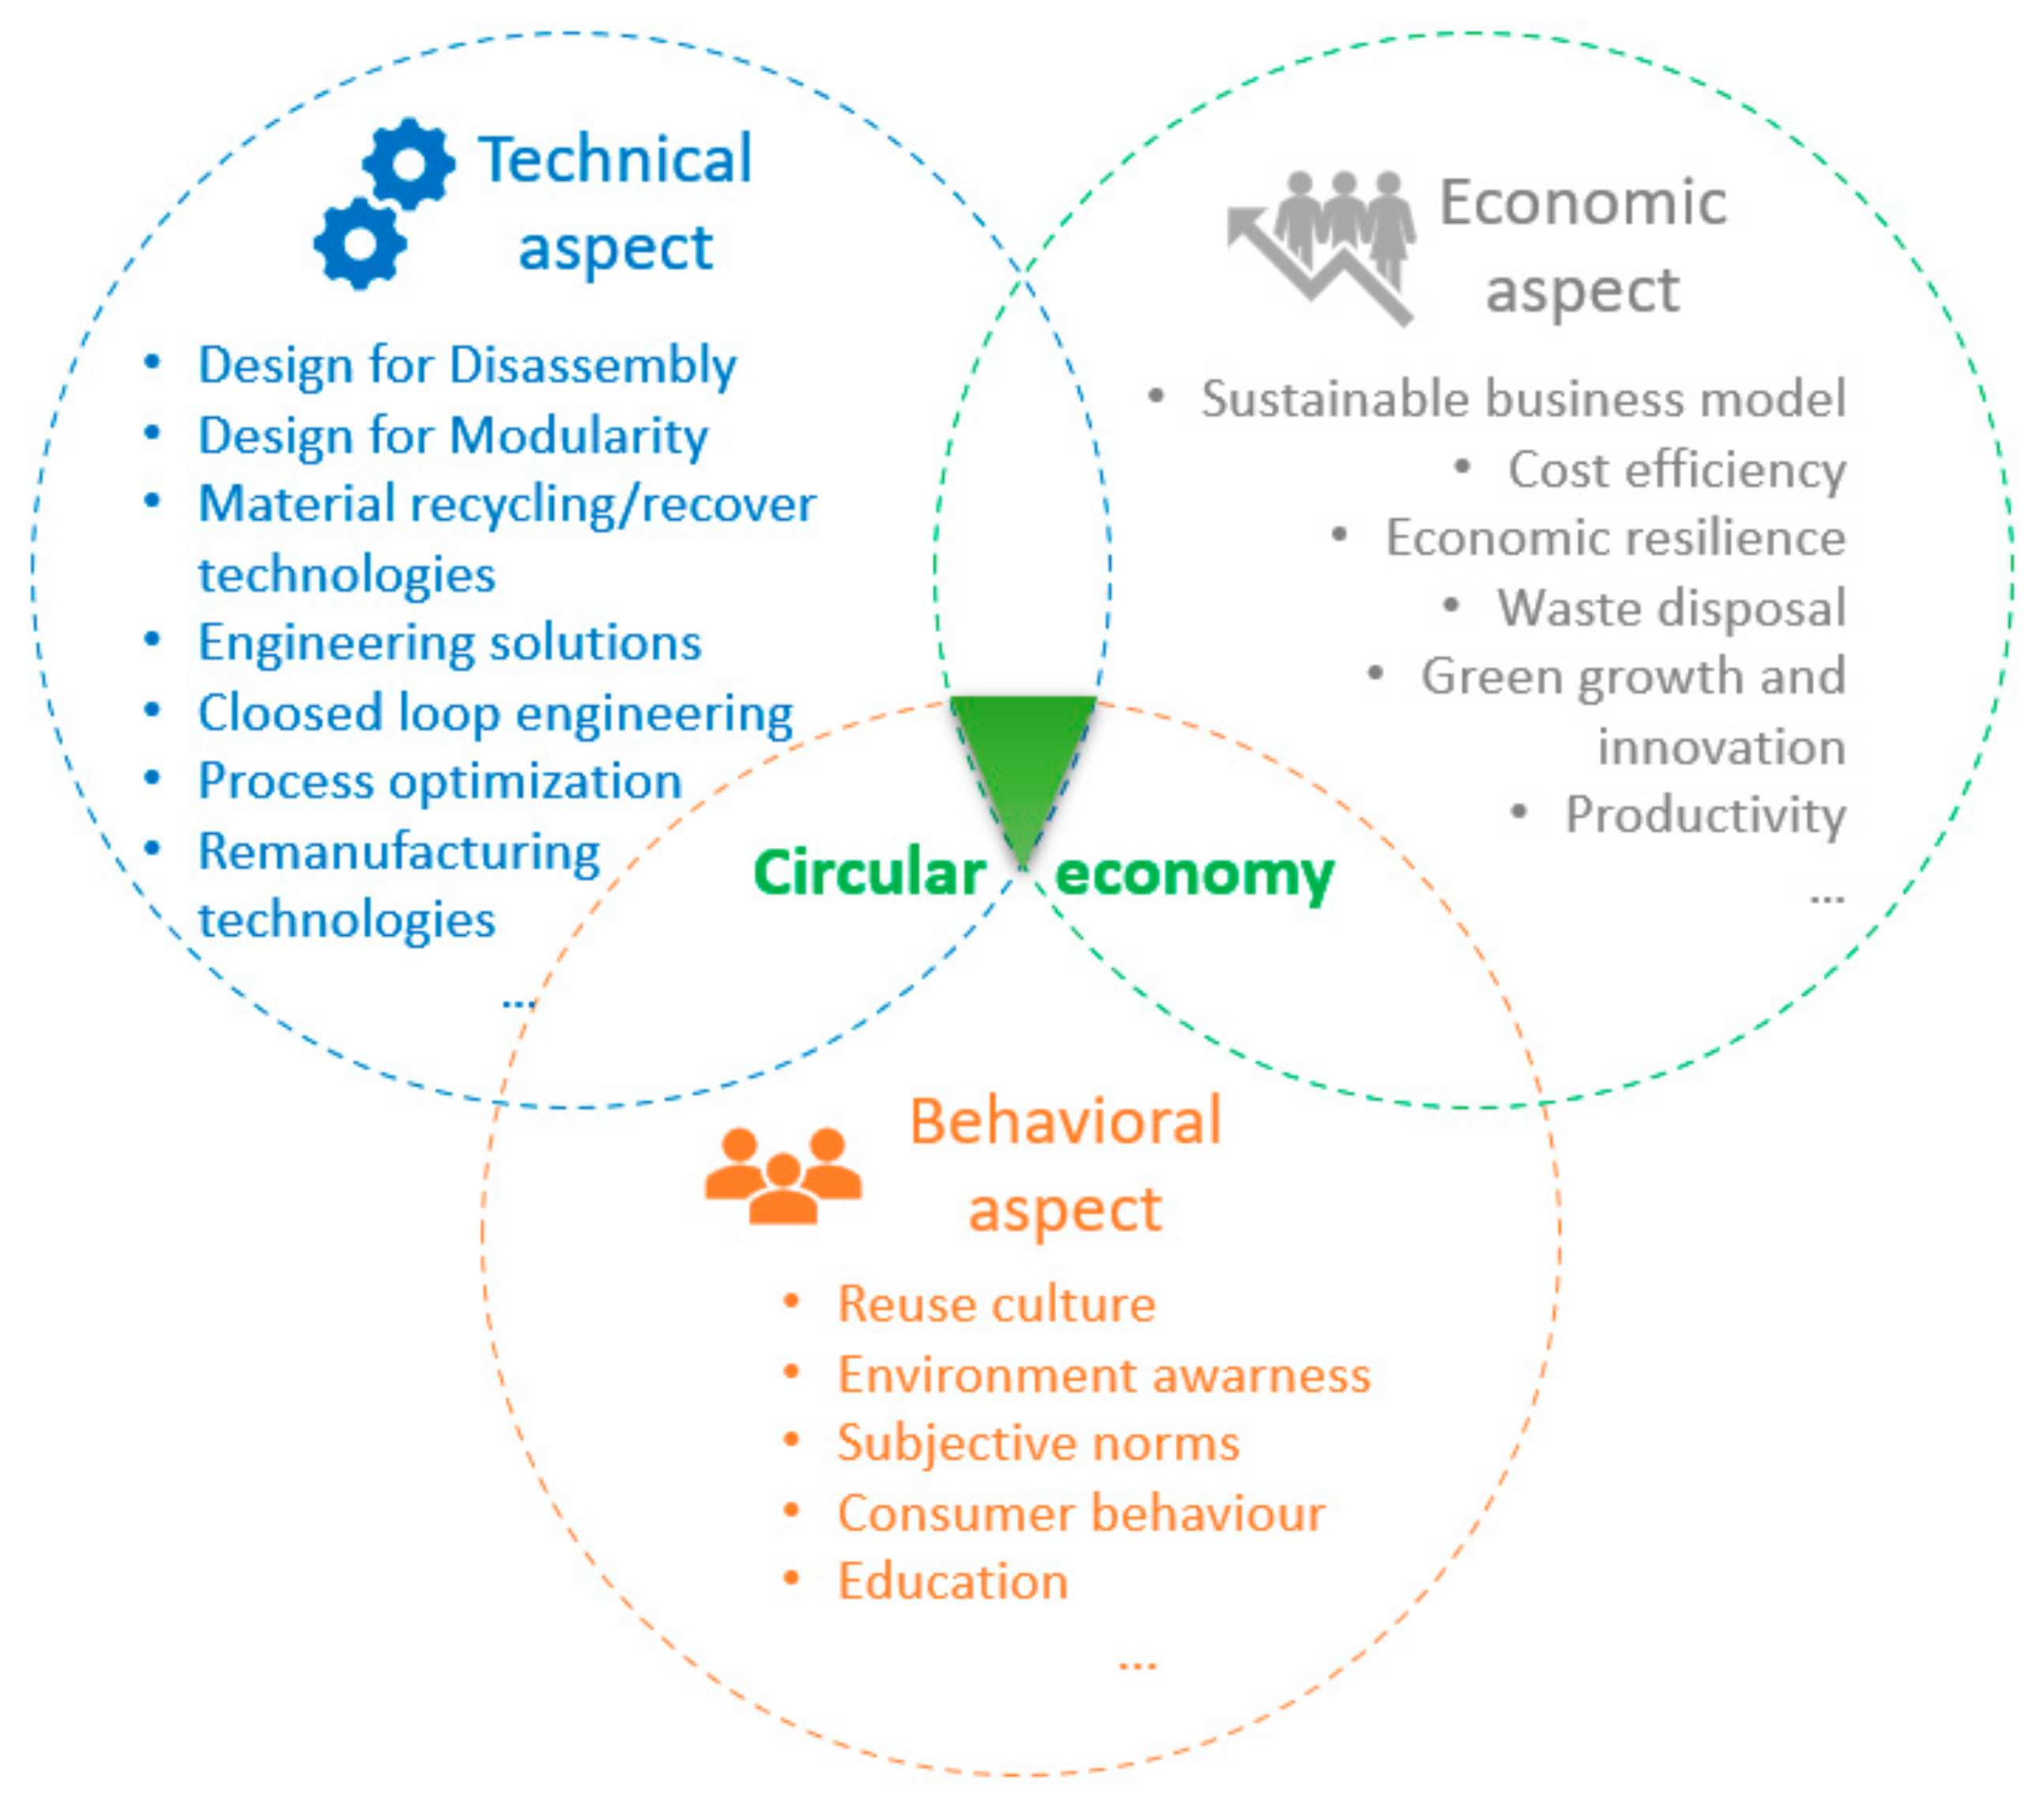
Figure 1. Circular economy integrates technical, economic and behavioral aspects.
Sustainability 17 08289 g001
Figure 2. The importance of disassembly in the circular economy.
Sustainability 17 08289 g002
Figure 3. Products for disassembly.
Sustainability 17 08289 g003
Figure 4. Disassembly process graphs for S1 and S2 products (where numbers represent task).
Sustainability 17 08289 g004
Figure 5. Exploded view for S1 and S2 (where each number represents one part with identification number).
Sustainability 17 08289 g005
Table 1. Manual fitting analysis—Lucas DfA method.
CategoryOptionValue
A. Part placing and fastening
(Select one of the following *)
Self-holding orientation
Requires holding
1.0
2.0
(* Plus one of the following lists)Self-securing (i.e., snaps)1.3
Screwing4.0
Riveting4.0
Bending4.0
B. Process direction
(Select one of the following *)
Straight line from above
Straight line not from above
0
0.1
Not a straight line1.6
C. Insertion
(Select one of the following *)
Single
Multiple insertions
0
0.7
Simultaneous multiple insertions1.2
D. Access and/or vision
(Select one of the following *)
Direct
Restricted
0
1.5
E. Alignment
(Select one of the following *)
Easy to align
Difficult to align
0
0.7
F. Insertion force
(Select one of the following *)
No resistance to insertion
Resistance to insertion
0
0.6
Table 2. Subassemblies and defined connections with associated complexity index.
ConnectionTotal Complexity IndexSubassembliesAssembly
1-20.33Sustainability 17 08289 i001Sustainability 17 08289 i002
2-30.26Sustainability 17 08289 i003Sustainability 17 08289 i004
3-40.32Sustainability 17 08289 i005Sustainability 17 08289 i006
Table 3. Determination of indexes for connections.
ConnectionLucas DfA Method and AnalysisIndexTotal Complexity Index
1-2A. Part Placing and Fastening2
1.3
0.33
B. Process Direction0.1
C. Insertion0.7
D. Access and/or Vision0
E. Alignment0
F. Force0
2-3A. Part Placing and Fastening2
1.3
0.26
B. Process Direction0
C. Insertion0
D. Access and/or Vision0
E. Alignment0
F. Force0
3-4A. Part Placing and Fastening2
1.3
0.32
B. Process Direction0
C. Insertion0.7
D. Access and/or Vision0
E. Alignment0
F. Force0
Table 4. Workstations, complexities, disassembly time, and amount of time to complete disassembly tasks.
Disassembly Workstation Complexity   Sum   for   Workstation   ( C 2 S 1 ) Disassembly Time (S1)
Time [s]
Complexity   Sum   for   Workstation   ( C 2 S 2 ) Disassembly Time (S1)
Time [s]
Constraints
Time [s]
10.99600.772020,171
20.65100.772015,171
30.80300.773528,300
41.32350.773528,300
51.10401.033528,300
sum4.86 4.11
Disclaimer/Publisher’s Note: The statements, opinions and data contained in all publications are solely those of the individual author(s) and contributor(s) and not of MDPI and/or the editor(s). MDPI and/or the editor(s) disclaim responsibility for any injury to people or property resulting from any ideas, methods, instructions or products referred to in the content.