Article

Towards Sustainable Waste Management: Predictive Modelling of Illegal Dumping Risk Zones Using Circular Data Loops and Remote Sensing

1
Javno Podjetje Nigrad, Komunalno Podjetje d.o.o., 2000 Maribor, Slovenia
2
Faculty of Electrical Engineering and Computer Science, University of Maribor, Koroška Cesta 46, 2000 Maribor, Slovenia
3
Department of Operational Construction, Faculty of Civil Engineering, Transportation Engineering and Architecture, University of Maribor, Smetanova 17, 2000 Maribor, Slovenia
*
Author to whom correspondence should be addressed.
Sustainability 2025, 17(18), 8280; https://doi.org/10.3390/su17188280
Submission received: 28 June 2025 / Revised: 8 September 2025 / Accepted: 12 September 2025 / Published: 15 September 2025
(This article belongs to the Section Waste and Recycling)

Abstract

Illegal waste dumping poses a severe challenge to sustainable urban and regional development, undermining environmental integrity, public health, and the efficient use of resources. This study contributes to sustainability science by proposing a circular data feedback loop that enables dynamic, scalable, and cost-efficient monitoring and prevention of illegal dumping, aligned with the goals of sustainable waste governance. Historical data from the Slovenian illegal dumping register, UAV-based surveys and a newly developed application were used to update, monitor, and validate waste site locations. A comprehensive risk model, developed using machine learning methods, was created for the Municipality of Maribor (Slovenia). The modelling approach combined unsupervised and semi-supervised learning techniques, suitable for a positive-unlabeled (PU) dataset structure, where only confirmed illegal waste dumping sites were labeled. The approach demonstrates the feasibility of a circular data feedback loop integrating updated field data and predictive analytics to support waste management authorities and illegal waste dumping prevention. The fundamental characteristic of the stated approach is that each iteration of the loop improves the prediction of risk areas, providing a high-quality database for conducting targeted UAV overflights and consequently detecting locations of illegally dumped waste (LNOP) risk areas. At the same time, information on risk areas serves as the primary basis for each field detection of new LNOPs. The proposed model outperforms earlier approaches by addressing smaller and less conspicuous dumping events and by enabling systematic, technology-supported detection and prevention planning.

1. Introduction

Illegal dumping of waste, defined as the unauthorized disposal of waste in natural or unregulated areas, poses a serious environmental, health, and economic threat. This includes the deliberate abandonment of waste in forests, riverbanks, roadside ditches, and vacant land. Despite comprehensive regulatory frameworks such as the EU Waste Framework Directive (2008/98/EC) [1] and national strategies like the Waste Management and Prevention Programme of the Republic of Slovenia (2022) [2], illegal dumping persists.
The consequences of illegal dumping are multifaceted. Environmentally, dumped waste contaminates soil and water resources, harms biodiversity, and pollutes landscapes. Hazardous materials like asbestos, chemicals, or electronics pose long-term risks to both ecosystems and human health. Economically, municipalities bear high costs for clean-up operations, often exceeding those of regular waste collection. Property values near affected sites can decrease significantly, further burdening local communities.
Slovenia is no exception. Despite 100% coverage of municipal waste services, over 15,000 illegal dumpsites remained active as of 2018, with an estimated 230,000 m3 of waste still in the environment. The problem is particularly acute in urban fringe zones, areas with limited oversight, and where specific types of waste—notably construction waste—are not covered by public services.
To address these challenges, this study aims to identify high-risk areas for illegal dumping within the Municipality of Maribor by leveraging a circular data feedback loop. This loop integrates field inventories, geospatial analytics, UAV-based remote sensing, and machine learning models based on positive-unlabeled (PU) learning. A key component of the approach is the deployment of the EkoVaruh application, which supports field data collection and enables continuous updates to the illegal dumping register.

2. Related Work

Numerous studies have explored the causes, detection methods, and predictive modelling of illegal dumping. Motivations include waste disposal costs [3,4], transportation avoidance [5,6,7], insufficient surveillance [8], and lack of awareness [7,9,10]. Ecological and economic impacts have been widely documented, including threats to water quality, biodiversity loss, and reduced property values near dumpsites [11,12,13,14,15,16,17,18].
Detection technologies have evolved significantly in recent years. Satellite imagery, drones (UAVs), surveillance systems, and big data analytics have all been tested for waste monitoring. In Hong Kong, researchers developed machine learning algorithms to detect suspicious waste hauler behavior [19], while the Italian Aerospace Research Centre proposed an integrated airborne-ground system for waste surveillance [20].
GIS and statistical models have been applied globally to predict high-risk areas. In Australia, a binary logistic regression model using spatial predictors such as land use, road proximity, and population density classified areas into five risk levels [21]. Similar models have been applied in Europe using Social Life Cycle Assessment (SLCA) frameworks to inform strategic decisions [22].
Limitations of remote sensing methods remain. The use of drones between 2010–2021 was analyzed by Sliusar et al. and concluded that aerial photo imagery is effective for assessing diffuse waste contamination in adjacent areas because of the spread of light fractions by wind and surface water [23]. Studies note difficulty detecting small, scattered dumps due to vegetation cover, chaotic object orientation, or complex backgrounds [24]. Advanced object detection methods like CNN, YOLO, and SSD have improved performance, but are constrained by data requirements and false detections [24,25,26,27,28].
Positive-Unlabeled (PU) learning, used in this study, has gained traction in domains where negative samples are unknown or unreliable—a common situation in environmental data. Unlike traditional supervised learning, PU models can work with only known positives and a background of unlabeled data [29,30,31,32].
Slovenian context is uniquely informed by the work of Ecologists Without Borders (EBM) [33], who developed a nationwide illegal dumping register during the “Let’s Clean Slovenia” campaigns. Although extensive, the database has seen limited updates since 2018. Furthermore, the doctoral research by Matos [34] has provided a comprehensive spatial analysis of dumping behavior across Slovenia.
This study builds on that foundation by incorporating PU-learning, UAV-assisted discovery, and a mobile data collection platform (EkoVaruh) to establish a dynamic and scalable system for managing illegal dumping sites. In addressing the highlighted topic, the basic data structure of the LNOP register has been based on the needs of all stakeholders directly or indirectly involved in addressing the overall topic or a specific LNOP. The identification of impacts and potential has been based on available datasets provided by national and local authorities, which represent a stable and reliable data source, which is crucial in any risk modelling exercise. In terms of upgrading the classical field approach to LNOP registration, remote sensing procedures were applied in terms of the use of drones and the production of high-resolution orthophoto images. A mobile application and a back-end system, EkoVaruh, which is still under development, was used as an operational digital tool for the recording and subsequent data management of individual LNOPs. All the above is linked in a circular data loop, which from a data management perspective provides a holistic and continuous overview of the topic under consideration. The approach was tested in the Municipality of Maribor (MOM), the second largest municipality in Slovenia (Figure 1).

3. Materials and Methods

3.1. Circular Data Loop Concept

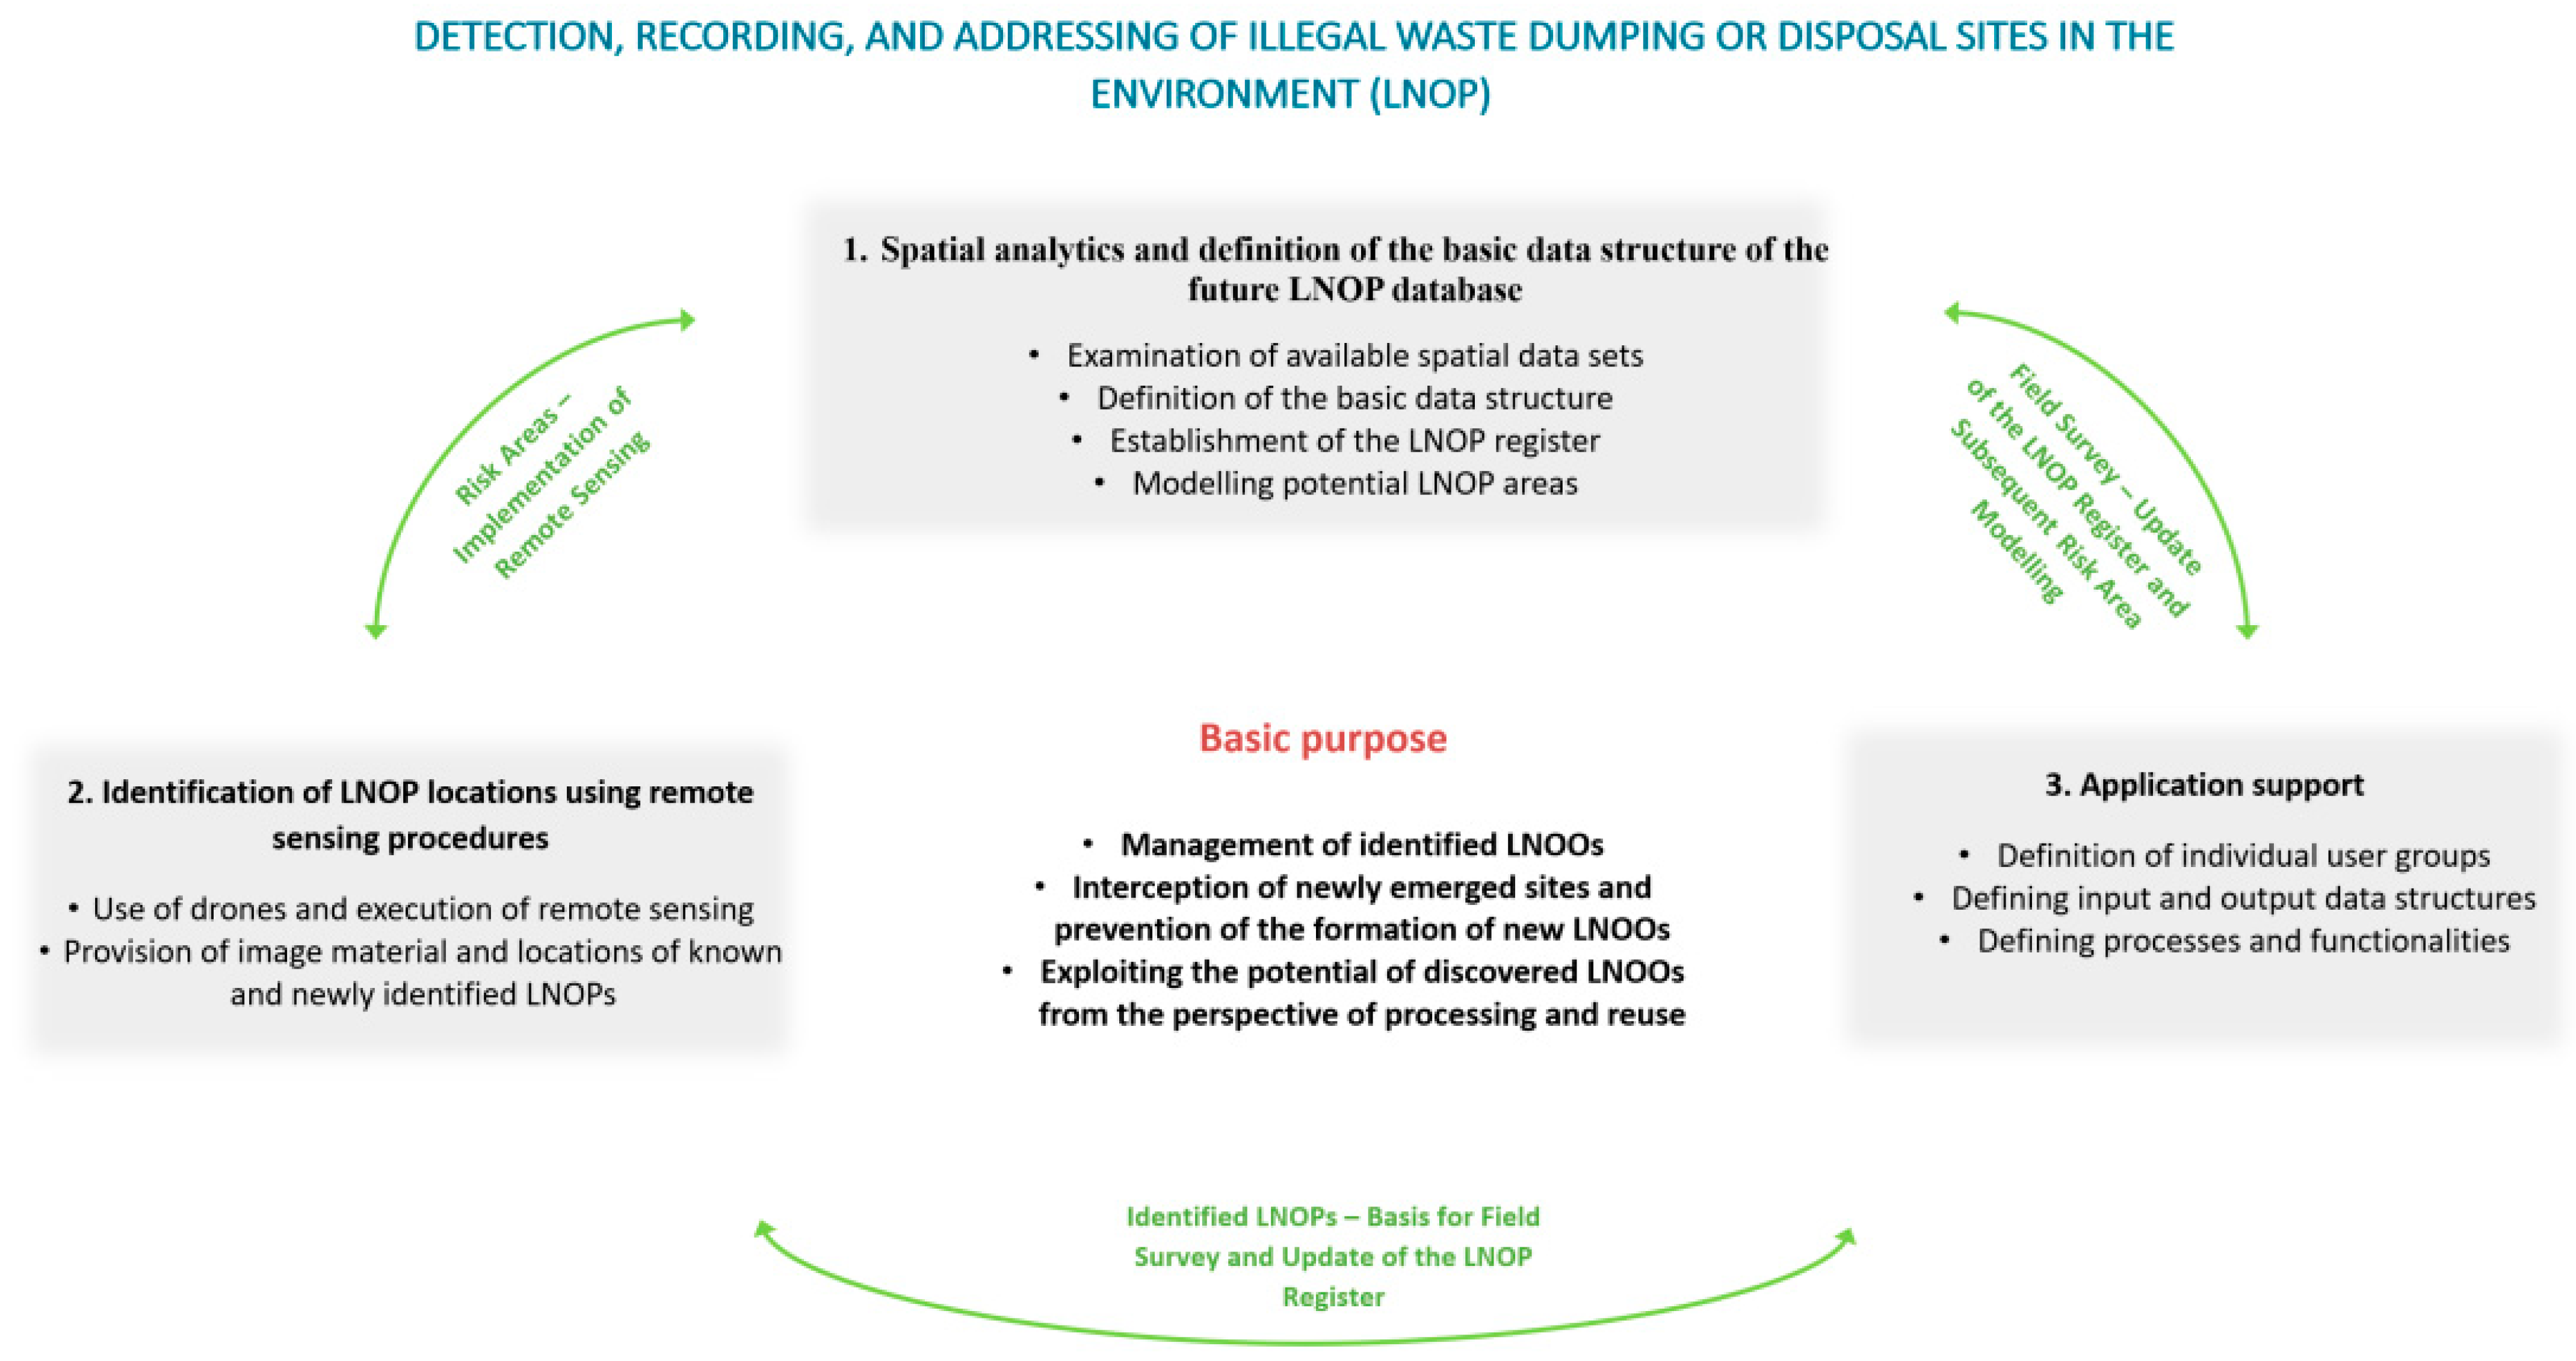
Based on an in-depth review of scientific and expert contributions, operational practices, the specificities of the area under consideration and previous approaches in Slovenia (Ecologists without Borders EBM—wild landfill register), a methodology was defined that is based on the concept of a circular data loop (Figure 2) and includes several basic interconnected and iterative activities. The starting point was the knowledge that whenever you want to adequately address a specific spatial content, in this case illegal dumping and leakage of waste in the environment, you need an adequate amount of appropriately captured spatial data related to the phenomenon under consideration. The following will help to achieve the goal, which is, of course, to remediate the identified sites and prevent the creation of new ones. To establish an integrated, operationally usable and scalable system, a methodology has been devised that treats each LNOP site not only as a static phenomenon, but as a dynamic element within a broader spatial and social context. Central to the solution presented is the design of a circular data loop that allows for continuous updating, verification, validation and re-analysis of the post-data. A key advantage of this approach is the ability to react in real time and to plan spatial actions more accurately. This is particularly important in environments with limited over-the-horizon resources and rapidly changing circumstances.
The individual stages of the data loop are presented in more detail below—from initial data capture and structuring, through predictive modelling of risk areas, to field validation and application support. Each of the phases contributes to increasing the reliability of the database, while allowing the results to be fed back into the initial structure, ensuring continuous system improvement and methodological robustness. This approach was chosen because it combines the best practices of scientific research, modern technologies (Geographical Information System GIS, Unmanned Aerial Vehicles UAVs, machine learning) and the field experience of stakeholders, which is essential for an effective and long-term solution to the problem of illegal waste disposal.

3.2. Definition of the Basic Data Structure of the LNOP and Discussion of Existing Thematically Linked Data

3.2.1. Definition of the Basic Data Structure of the LNOP Register

The basic data structure of the future LNOP registry was based on the information needed by key stakeholders in the treatment of each LNOP. Key stakeholders were identified as representatives of local authorities, inspection services, public companies whose activities are related to waste management and interested individuals or groups. For this reason, the following areas were identified: status, location, type and quantity of waste and legal status.
Each area was defined in terms of data structure and a set of content values for each data (Table S1). The aim was to enable each stakeholder to carry out further processes based on the data collected. From the point of view of the status of each location, data are maintained to provide an overview of the individual entry and the whole database. The location data provide spatial orientation and allow further spatial analysis. Data on the type and quantity of waste at each site allow for contextual analysis and remediation planning. The legal status provides a basic starting point for inspection and, consequently, criminal proceedings. The overall dataset allows for an in-depth consideration of a single LNOP or a set of LNOPs from a spatial, temporal or contextual point of view. The data structure of the established register with the corresponding description and values is given below.
Status
  • Unique identifier (ID)
Unique identifier linked to the specific LNOP under consideration (Automatic entry)
  • Identification Status (SIF_STAT_PREP)
Method of identification of the location of illegal dumping
-
Identified in the field by stakeholders
-
Identified by image analytics (e.g., orthophotos and aerial images)
-
Identified from other sources of information (e.g., word of mouth and Ecologists Without Borders (EBM, etc.))
  • User group (SIF_UPO_SKU)
User group identifying the location
-
Citizens, third parties
-
Representatives of local authorities (e.g., inter-municipal inspectors and municipalities)
-
Public service providers
-
System administrators
  • Status or validation (SIF_STAT_POT)
Data validation status
-
Not validated—values not validated
-
Validated—values validated by administrator
  • Priority of treatment (SIF_PRIORITY)
Urgency of action based on impacts and site context
-
First priority—immediate action required
-
Second priority
-
Third priority
-
Jurisdiction (SIF_PRIS)
Determination of competent authority according to ownership and type of waste
-
Intermunicipal inspection
-
State inspection
  • Date of entry (DAT_ENTRY)
Date of first LNOP entry
  • Date of treatment (DAT_OBR)
Date of individual LNOP treatment
  • Note (NOTE_STATUS)
Additional site-specific note (Census taker, custodian)
Location
  • Unique identifier (ID)
Unique identifier linked to the specific illegal dumping site under consideration (automatic entry)
  • X and Y coordinate (D96/TM)
Coordinates given in the national coordinate system D96/TM (automatic input)
  • Coordinate λ (Lon) and φ (Lat)
Geographical coordinates in WGS84 (automatic input).
  • Municipality (SIF_OB)
Information about the municipality according to the official records of the Geodetic Administration of the Republic of Slovenia (GURS) (automatic input)
  • Cadastral municipality (SIF_KO)
Cadastral municipality obtained from the GURS register (automatic entry)
  • Narrow part of the municipality (SIF_ODO)
Information on the narrow part of the municipality as defined by GURS (automatic input)
  • Note (NOTE_LOK)
Free description of the location or feature related to the LNOP under consideration
Type and quantity of waste
  • Unique identifier (ID)
Unique identifier linked to each LNOP handled (automatic entry)
  • Area (POV)
Estimated area in m2 covered by waste at the site
  • Comparative volume (SIF_PROS)
Estimate of the volume according to the comparative code list (e.g., “up to 1 m3—washing machine”, “10–25 m3—one lorry”, and “50–100 m2—three to four cars”).
  • Volume (PROS)
Exact estimated volume in m3, expressed as a numerical value
  • Waste type (SIF_ODP_1…10)
Up to 10 entries of waste content types per individual location, in accordance with the predefined classification system based on the Decree on Waste (Official Gazette of the Republic of Slovenia, No. 77/22, dated 31 May 2022) [37].
  • Waste fraction (DELEZ_ODP_1…10)
Fraction of each waste type at the site (expressed as a percentage or proportional value)
  • Note (NOTE_ODP)
Additional contextual explanations on the structure, status or specificity of the waste stream(s) considered
Legal status
  • Unique identifier (ID)
Unique identifier linked to the specific illegal dumping site under consideration
  • Waste Owner (LAST_ODP)
Indicates the identified owner of the illegally dumped waste
  • Generator (POVZ_ODP)
Entering the name or code of the LNOP generator
  • Landowner (LAST_PARC)
Entry of the owner of the land where the LNWP has been identified
  • Remediation obligation (SIF_OBV_SAN)
Identification of the remediation obligation holder; possible values:
-
Waste owner
-
Generator
-
Landowner
-
Public service operator
-
Clean-up action
  • Remediation status (SIF_STAT_SAN)
Information on the implementation of the site remediation
-
Existing
-
Remediated
  • Note (OPO)
Additional records or clarifications related to legal relationships, liability or remediation implementation

3.2.2. Review, Analysis and Adaptation of Existing Thematically Linked Data

The data from the register of wild landfills, which was established under the auspices of Ecologists Without Borders (EBM), were used as a baseline. EBM’s activities started with the organization of two nationwide “Let’s Clean Up Slovenia” campaigns, which are among the largest volunteer projects in the history of independent Slovenia. More than 280,000 individuals, companies, associations, the Slovenian Armed Forces, the police, co-municipal companies and municipalities were involved in these campaigns. During the implementation, the previously mentioned register of wild landfills was established, which comprises an inventory of more than 15,000 LNOPs in the whole territory of Slovenia [33]. In MOM, 158 inventoried sites at the level of detail (inventoried quantity and types of waste) and 41 LNOPs were detected. Most of the entries in the register were made in 2010 and 2011, with the most recent entries of individual remediation dating back to 2018.
Each previously identified site of LNOP, as recorded in the register of wild landfills, within the territory of MOM, was verified (in terms of data relevance) and defined in accordance with the established basic data structure. This process created the initial data baseline for triggering further activities, particularly in terms of subsequent field investigations. Additionally, it constituted the first input dataset for implementing a model aimed at generating a cartographic representation of risk areas (Loop 1).

3.2.3. On-Site Verification of Previously Known Locations and Identification of New Illegal Waste Disposal Sites

Fieldwork related to the spatial documentation of existing LNOP by EBM was further developed during Phases Two (for Loop 2) and Three (for Loop 3). Additional direct field inspections were carried out in both phases. During the second phase, all previously recorded LNOP identified during EBM’s earlier activities (from Loop 1) were revisited and verified. During this verification process, numerous new LNOP were simultaneously identified and documented in the field.
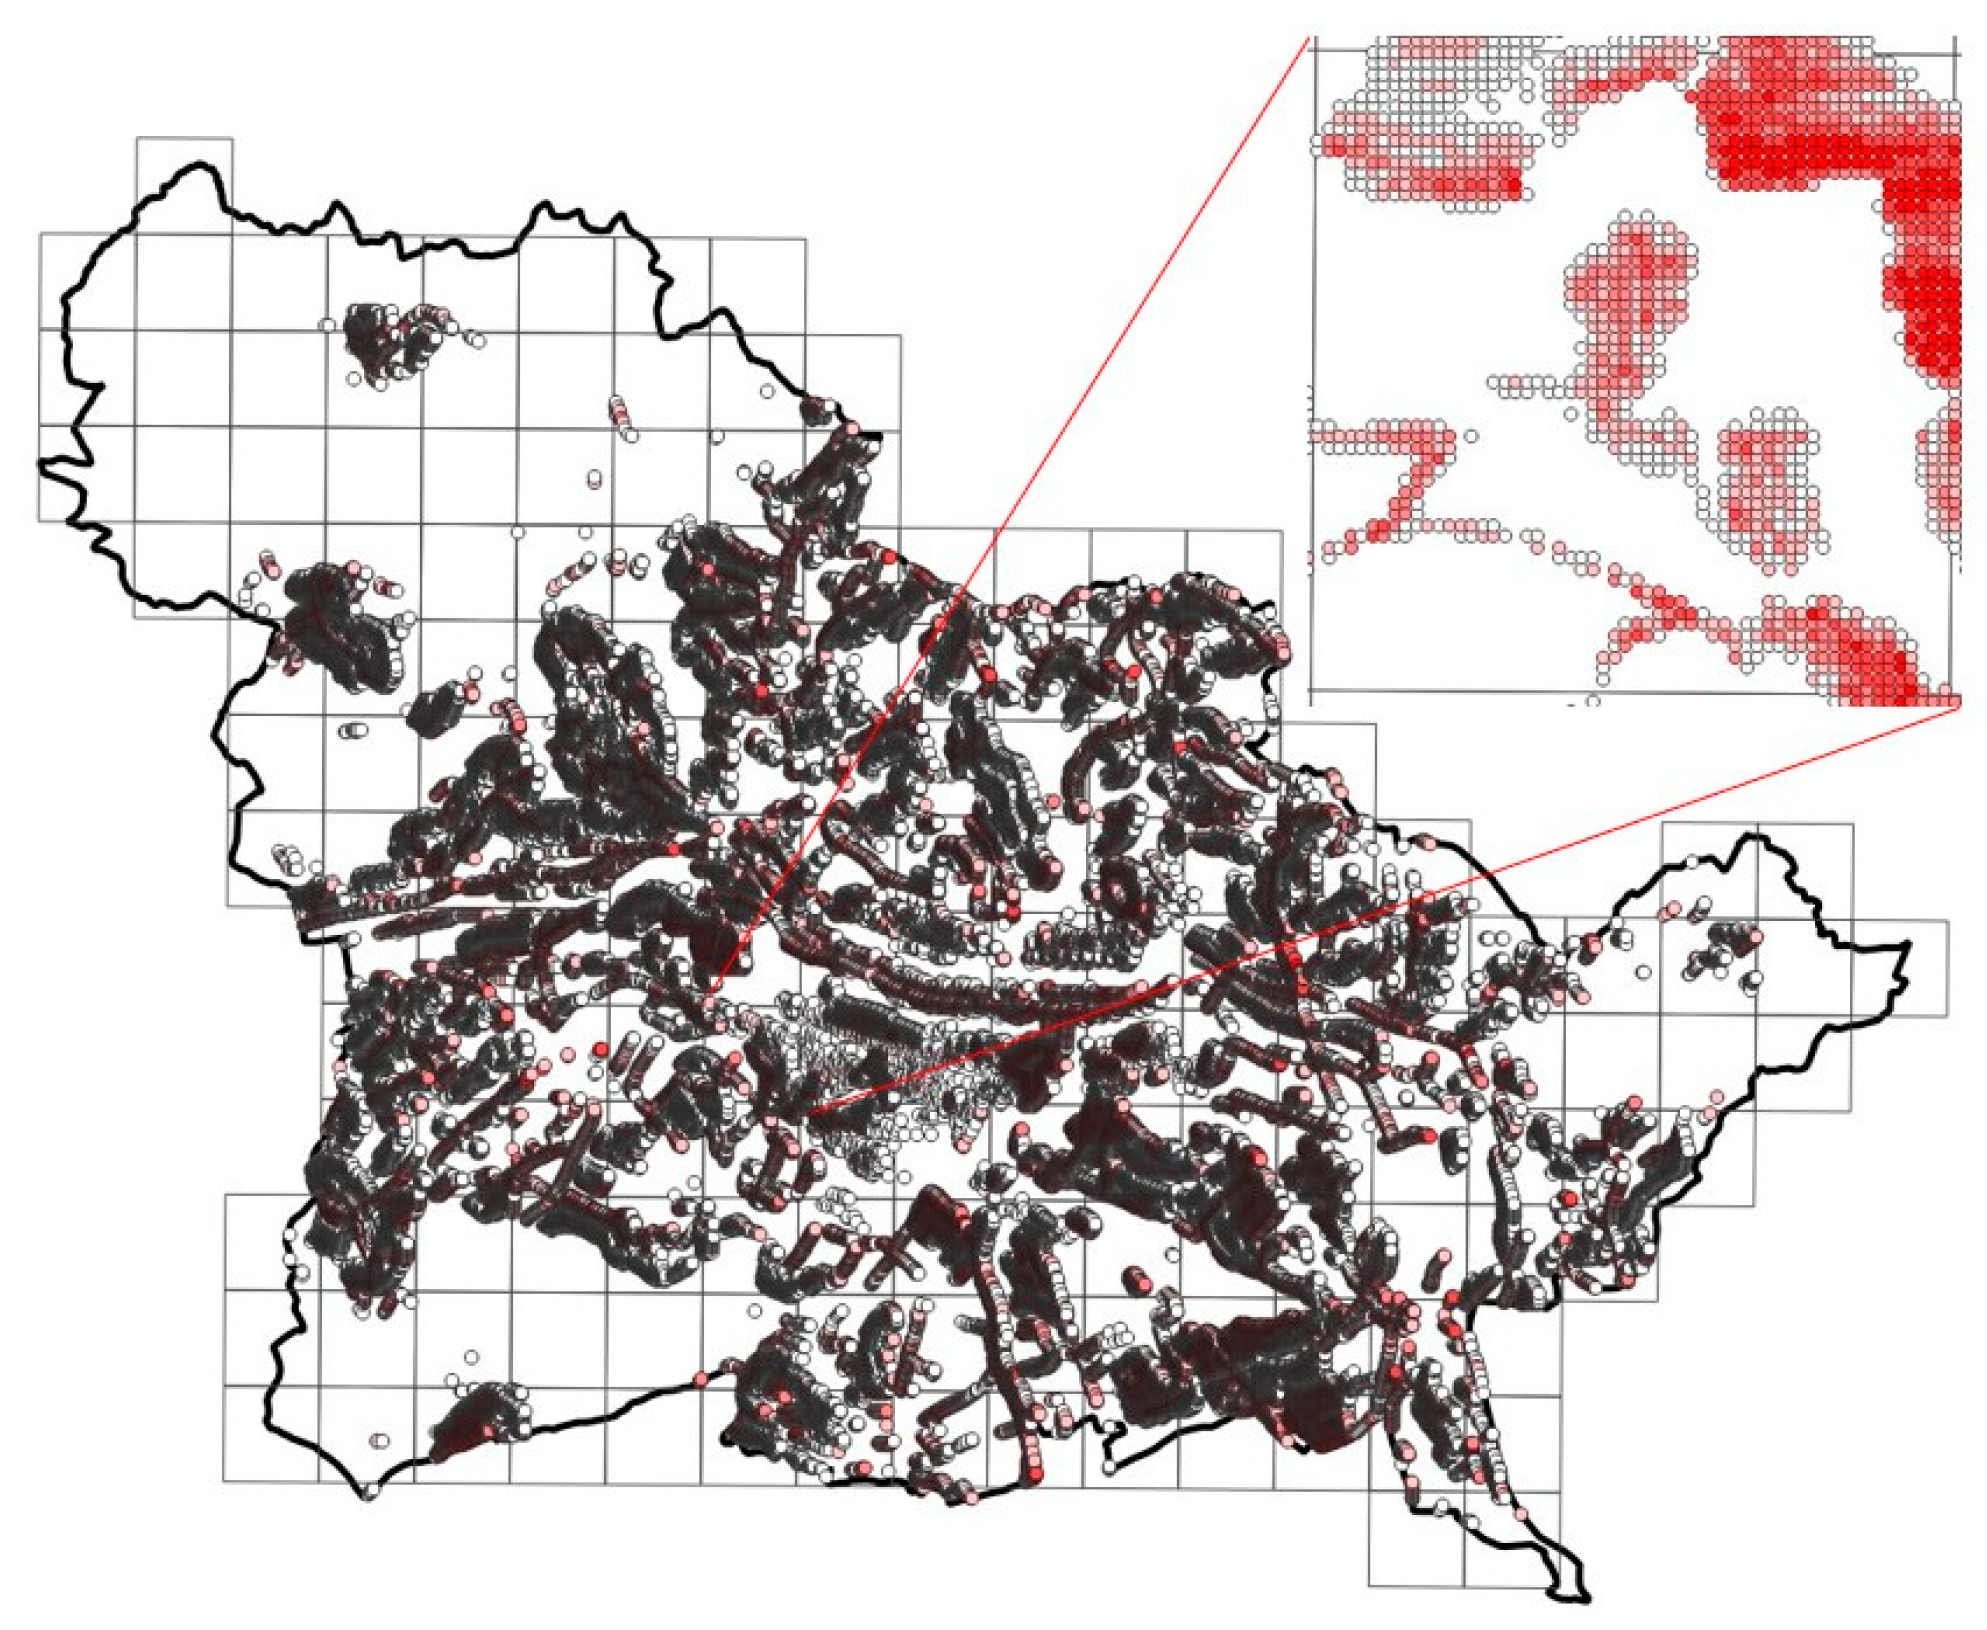
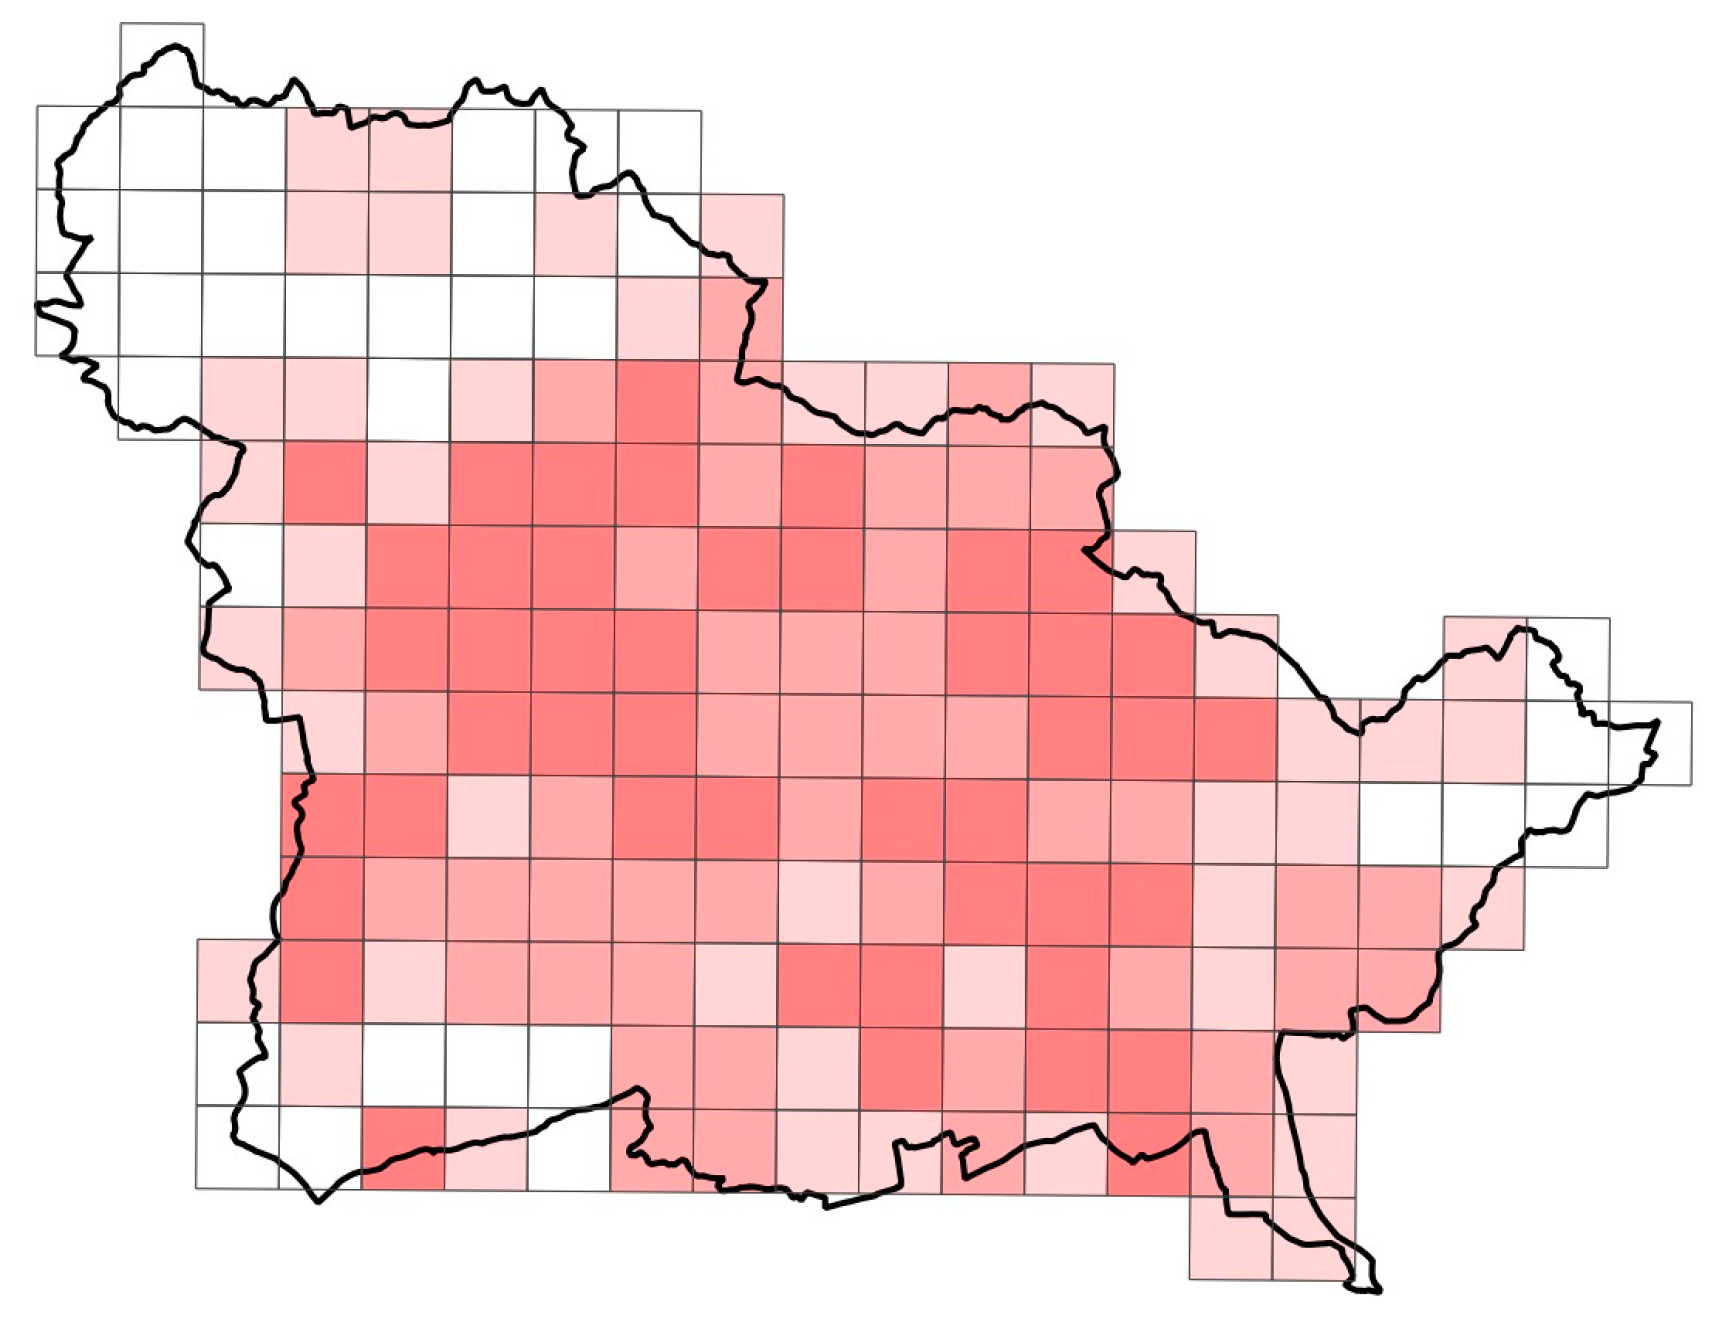
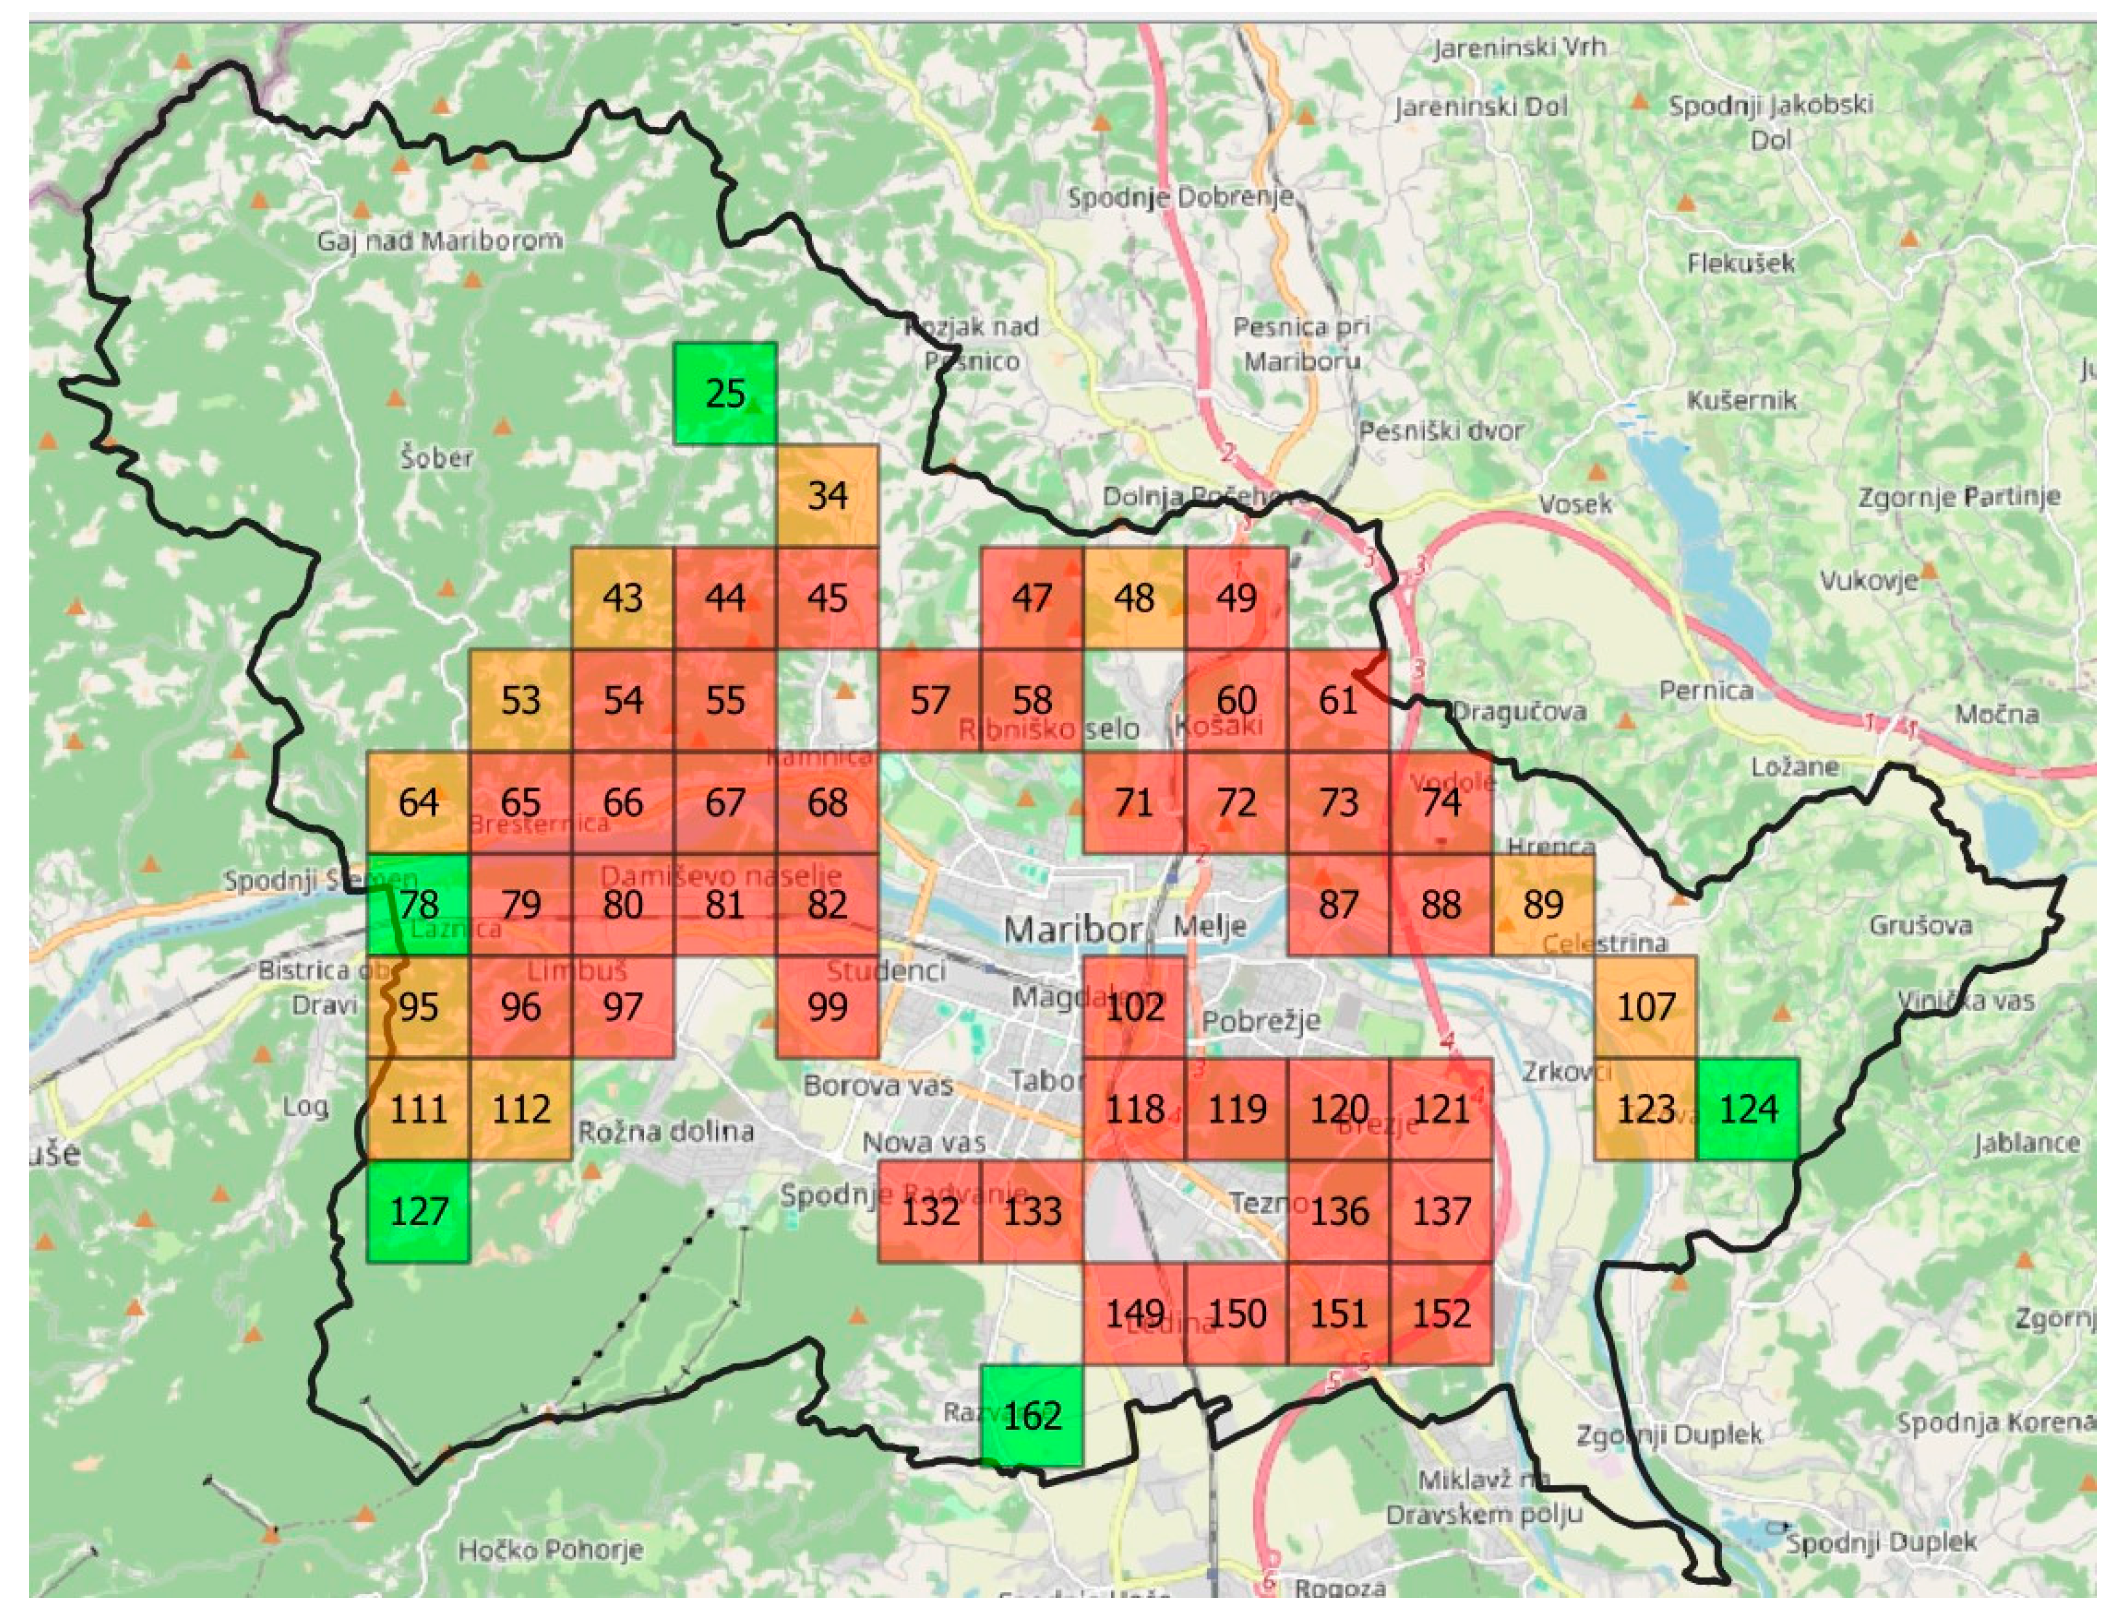
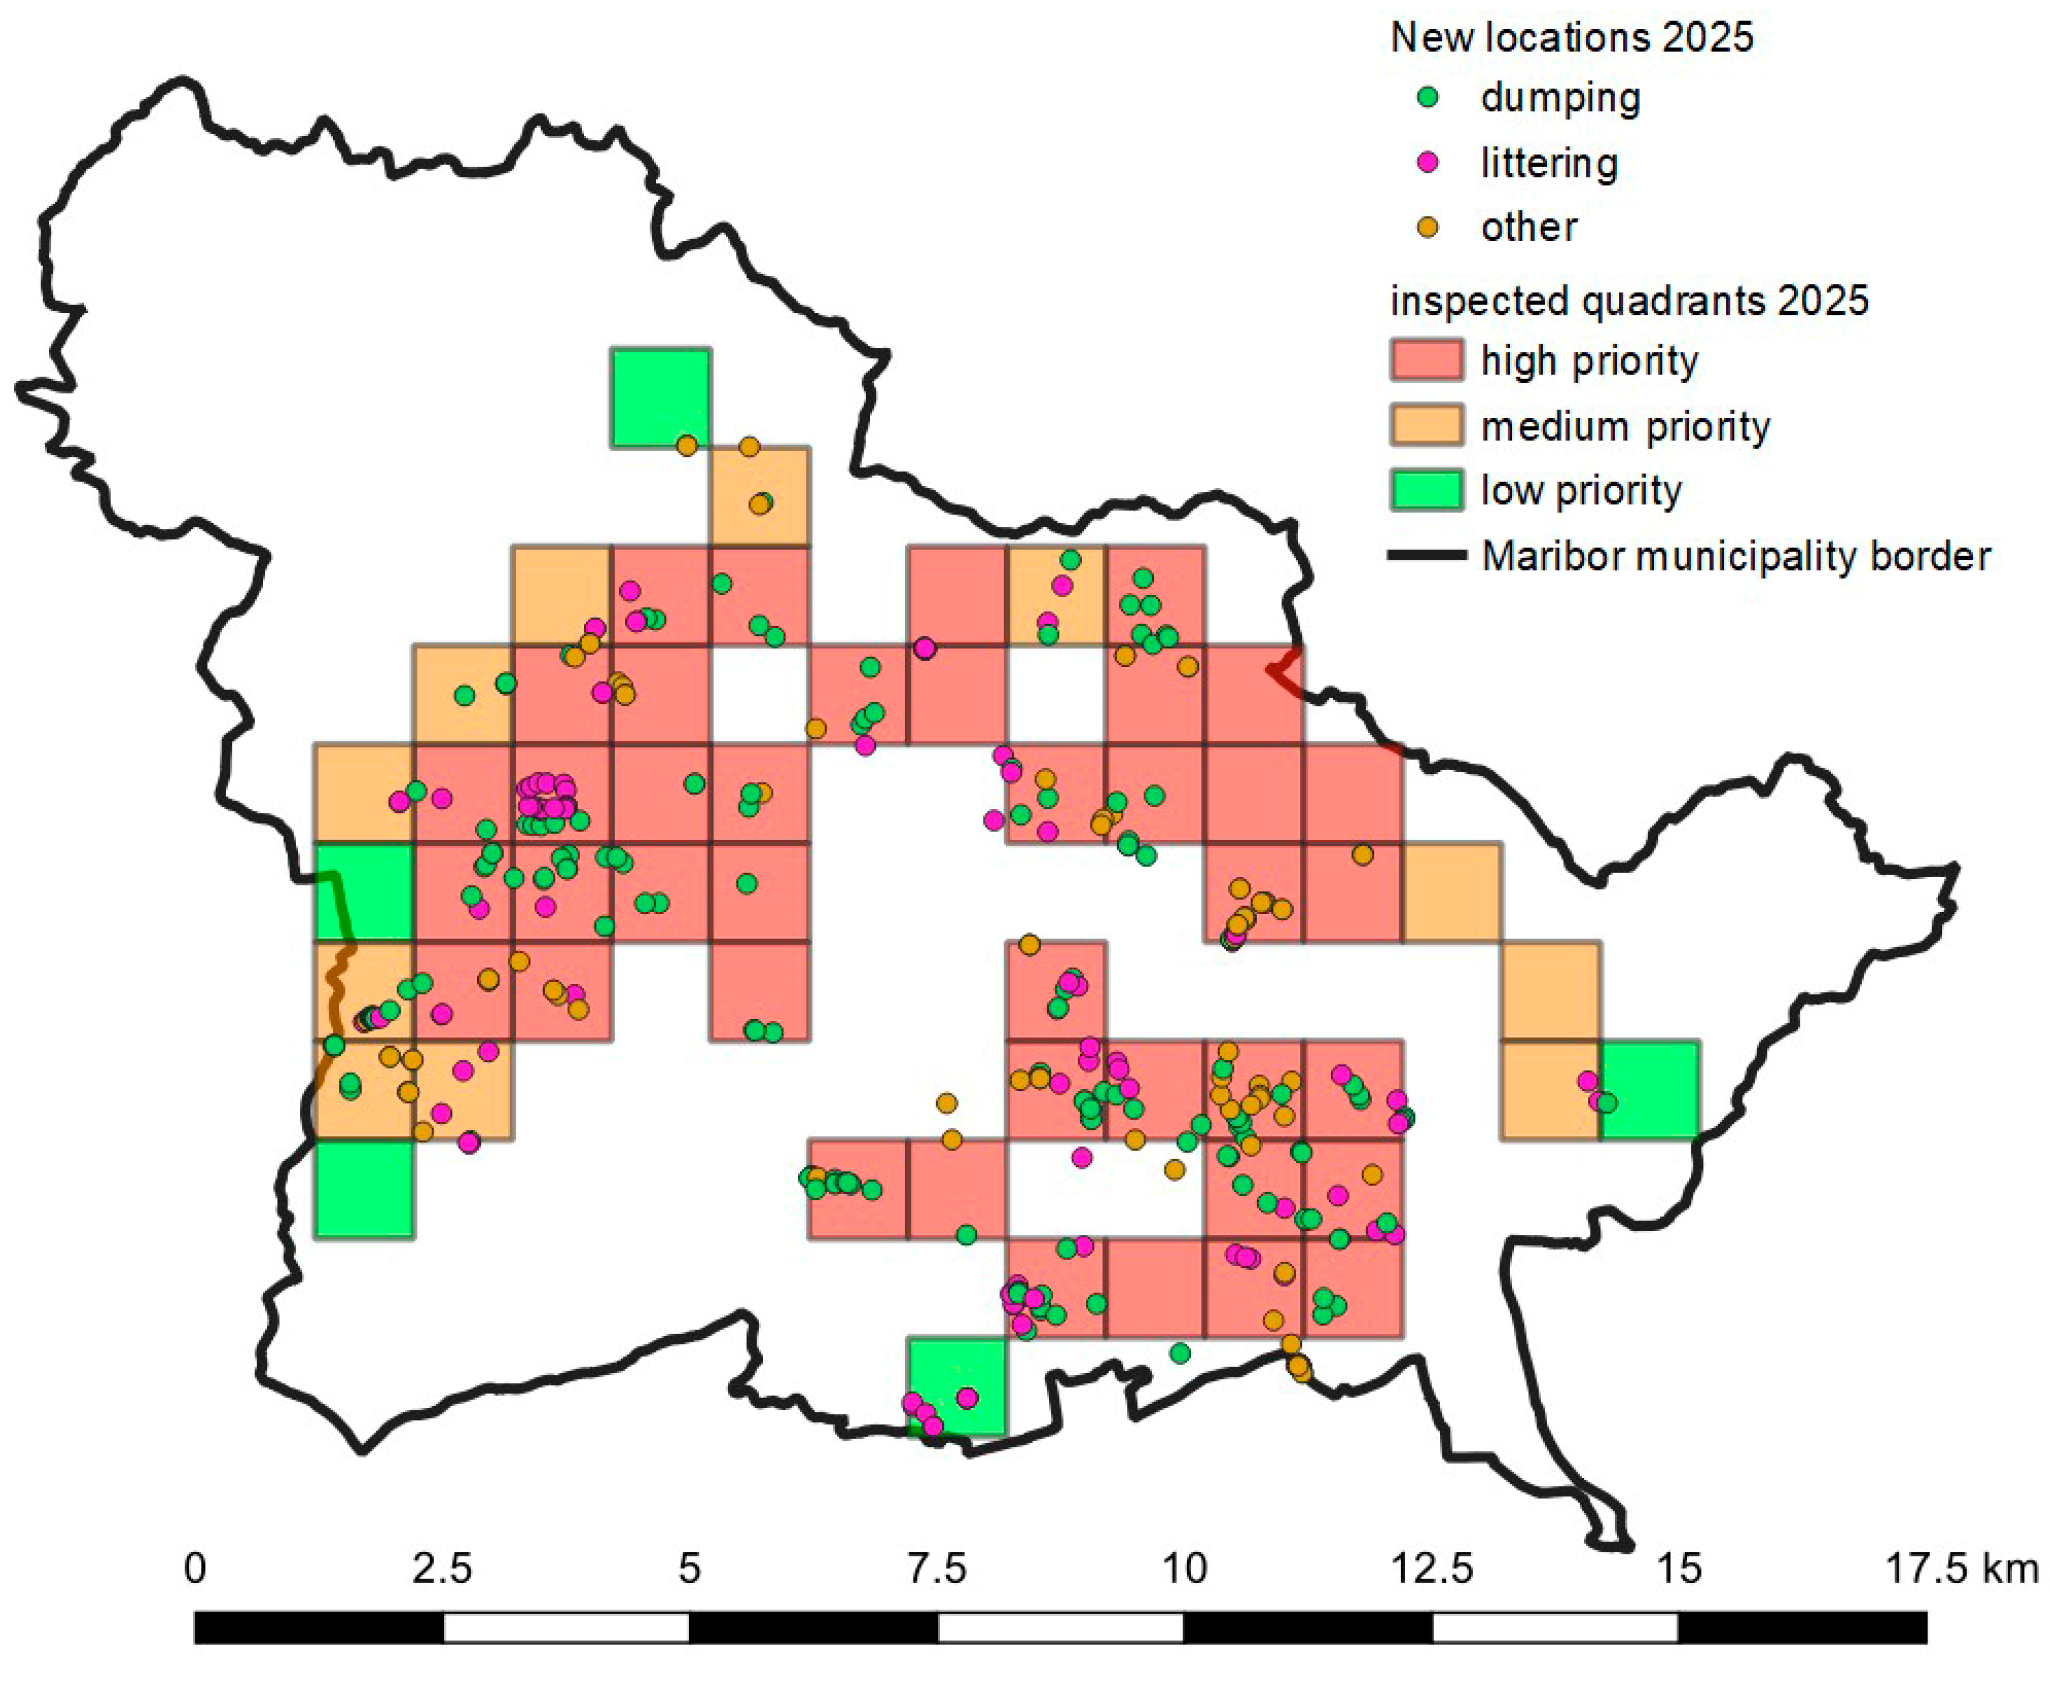
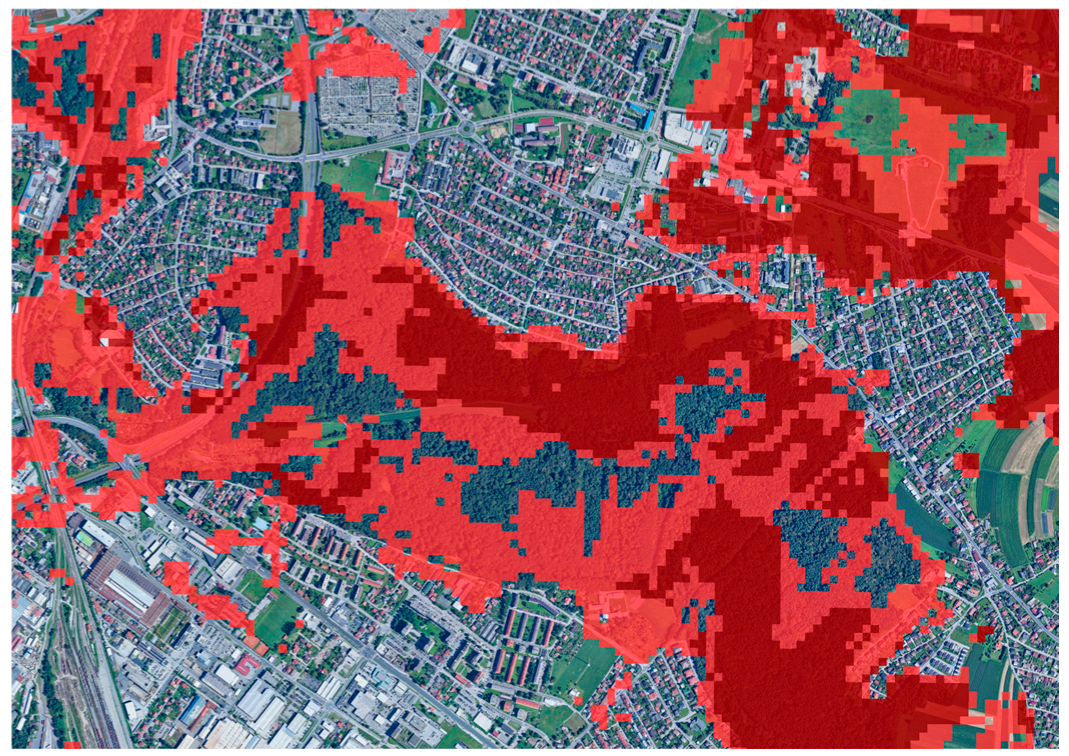
Additional data on LNOP were obtained in the third phase through the implementation of the “Cleanup Campaign 2025—My Waste, My Responsibility” campaign in MOM, as well as during field exercises conducted by students from the Faculty of Civil Engineering, Transportation Engineering and Architecture in spring 2025. The students systematically inspected a total area of 56 km2 (quadrants). The inspected areas were prioritized based on a preliminary assessment of LNOP occurrence likelihood (Figure 3), with higher probability areas highlighted (Figure 4). Three priority zones were delineated and subsequently examined: green (low inspection priority), orange (medium inspection priority), and red (high inspection priority) (Figure 5). The newly identified LNOP locations are presented in Figure 6, with the status of dumping, littering and other.
During field data collection, a test version of the EkoVaruh application, currently under development, was used. The application enables in situ recording of LNOP and subsequent back-end processing of the collected data.
An important contribution to the identification of new LNOP locations was also made by the municipal initiative “Cleanup Campaign Maribor 2025My Waste, My Responsibility”, organized by the Municipality of Maribor, which is based on the active engagement of citizens. As part of the campaign, the reporting of illegal dumping sites via the EkoVaruh application was enabled. The information obtained through this initiative supplemented the existing database and strengthened the community-based approach to addressing the issue of illegal waste dumping and abandonment in the environment [38].
In this way, three separate datasets related to LNOP were collected, each reflecting a different temporal context and scope of identified sites. During field surveys conducted in Phases Two and Three, the selection of areas was additionally guided by the results of the analytical model developed in Phase One and updated in Phase Two, which identified potentially high-risk areas.

3.3. Modeling of LNOP Potential Areas

The modelling of potential or high-risk areas for illegal waste disposal (LNOP) is based on contemporary spatial analytics approaches. These include the processing of both previously known and newly identified LNOP locations, as well as spatial data on infrastructure, accessibility, land use, and demographic characteristics. By applying advanced technological methods—such as semi-supervised learning—it is possible to identify areas with a higher probability of illegal dumping, thereby enabling targeted monitoring and preventive interventions.
These models are grounded in machine learning principles, where each new data entry contributes to improve the accuracy of predictions. The development of a methodology based on the concept of a circular data feedback loop enables continuous updating of the LNOP database and iterative adaptation of the risk area model. Spatial data from various influential layers, high-resolution orthophoto raster imagery, and LNOP data collected through a purpose-developed application environment serve as input datasets for cartographic modelling of risk zones. The entire workflow is highly scalable, as it allows for the flexible inclusion or exclusion of specific input datasets (variables), thereby enabling the development of alternative model scenarios with different input combinations for different land characteristics usable anywhere.
This multidisciplinary approach has proven essential for effective management and prevention of illegal waste dumping and abandonment in the environment.

3.3.1. Assessment of Influential Factors—Available Datasets

In determining the influential content or relevant spatial datasets, two key criteria were applied. In the initial phase, available professional and scientific contributions were reviewed, and consultations were conducted with stakeholders associated with the topic under investigation. This process provided guidance on spatially relevant influential factors.
In the subsequent phase, the criteria focused on the availability of datasets in terms of their consistent accessibility and regular maintenance. Datasets were considered appropriate if they were provided and maintained by national institutions or established through public funding, and if they were managed and distributed via official national-level public data portals. In our case, the datasets used originate from various competent ministries and agencies (e.g., the Surveying and Mapping Authority of the Republic of Slovenia—GURS, the Slovenian Environment Agency—ARSO, and the Statistical Office of the Republic of Slovenia—SURS) and form part of the national data scheme, following national or European standards (e.g., compliance with the INSPIRE Directive). For such datasets, it can be reasonably assumed that they will remain accessible whenever the circular data feedback loop is reactivated.
The following section presents a description of the individual spatial data layers included in the modelling of potential LNOP areas.
Accessibility—National and Municipal Roads
The spatial data layer Roads is part of the Consolidated Cadastre of Public Economic Infrastructure (ZKGJI), managed by the GURS. It represents a linear spatial layer that includes both national and municipal roads. This is the primary spatial dataset at the national level, providing a unified and standardized representation of Slovenia’s road network.
The layer contains geometric data on the alignment of road segments in the national coordinate system D96/TM, as well as associated attribute data, including road ID, road name, category (national or municipal), length, managing authority, traffic characteristics, and administrative affiliation. National roads in the dataset include motorways, regional roads, and expressways, with updates provided by the Slovenian Infrastructure Agency (DRSI), while municipal roads are recorded and updated by individual municipalities.
Data maintenance is carried out in accordance with the Rules on the Content and Management of the Actual Use of Space Database [39], whereby municipalities and the state jointly contribute updates on infrastructure to the central database. The primary purpose of the layer is to support effective spatial planning, infrastructure management, analytical processing, integration with other public infrastructure layers, and coordination among various managing entities.
The data are publicly accessible via the e-Prostor portal [40], which enables online viewing, integration through standardized WMS/WFS services, and downloading in GML, SHP, or GeoJSON formats. This spatial layer is essential for transparent and harmonized management of transport infrastructure across all levels of governance and provides fundamental insights into the accessibility of the studied locations [41].
OpenStreetMap (OSM)
OpenStreetMap (OSM) is an open-source, community-maintained global map based on voluntary contributions and continuous updates of spatial data. One of its core components is the road network, which includes everything from highways and primary roads to local streets, forest tracks, bicycle lanes, and pedestrian paths. Due to its openness and frequent updates, OSM is widely used in spatial analyses, navigation systems, urban planning, and in the development of mobile and web applications.
In the context of LNOP analysis, OSM was used as a Supplementary Data source to the primary Roads spatial dataset. Particular attention was given to lower-category roads and paths, which are typically not recorded in national or municipal road datasets [42].
Settlement Patterns
A spatial data layer was created to capture key information on the distribution and characteristics of settlements with respect to their influence on the occurrence of illegal waste dumping and abandonment. This dataset is based on spatial analysis of house number locations, providing precise point-based data on buildings associated with permanent or temporary residence, employment, or other forms of use.
The layer integrates the following data components: the density of house numbers per unit area, the number of permanent and temporary residents, and the number of employees registered at each address. Additionally, the distance from each house number to the edge of the built-up area was calculated, capturing the influence of transitional or edge zones between urban and non-urban environments.
To define individual settlement areas, a maximum allowed distance of 40 m between adjacent addresses was applied. This threshold corresponds to the average spacing between buildings in urban areas discussed in the literature and enables further analysis of urban edges and transitional zones, which are more frequently associated with illegal waste activities.
The primary data sources used include the official spatial layer Spatial Units—House Numbers, managed by the GURS [43]; data from the Central Population Register (CRP) [44,45] for determining the number of permanent and temporary residents; and the Business Register of Slovenia (PRS) [46] for data on the number of employees per address. The integration of these three data sources enabled the development of a robust basis for further modelling of settlement patterns and identification of areas where spatial conditions may be linked to an increased likelihood of LNOP occurrence.
Terrain-Relief, LIDAR
Elevation models derived from LIDAR data [47] were used to detect selected topographic features. The key features analyzed included slope (expressed in degrees) and the presence of slopes, embankments, and cliffs. The slope was calculated as a continuous value, determined individually for each location, while the remaining features were represented as binary masks, stored in georeferenced TIFF files.
Terrain-Land Cover/Vegetation
Similarly to the detection of terrain features, LIDAR data [47] were also used to derive areas of low, medium, and high vegetation. These were stored as separate binary masks for each vegetation type. In subsequent LNOP prediction phases, the vegetation masks were used to assess vegetation cover around the analyzed locations.
Actual Land Use
GURS manages and provides access to a consolidated spatial layer of actual land use, which offers a harmonized spatial representation of the current use of individual land parcels. This layer is based on the integration of multiple official records—including agricultural, forest, and water land; built-up areas; transport infrastructure; and barren land—and provides a unified graphical layer reflecting the current physical use of space.
The data are available through the e-Prostor portal as part of the Public Geodetic Data application, including the option to download the layer via WMS/WFS services for use in GIS tools. This enables analyses of land use, spatial planning, and the preparation of planning documents [48].
Functionally Degraded Areas
The functionally degraded areas (FRO) dataset represents a spatial inventory of degraded and inadequately utilized areas in Slovenia that possess limited functional value due to various environmental, spatial, or economic factors. These areas may result from former industrial use, abandoned activities, disordered spatial conditions, or environmental burdens. The primary purpose of this layer is to support sustainable spatial planning by enabling the identification of areas suitable for remediation, revitalization, or reintegration into spatial development.
The dataset was developed through research conducted by the Department of Geography at the Faculty of Arts, University of Ljubljana, in cooperation with the Ministry of Natural Resources and Spatial Planning (the dataset owner) and co-financed by the Ministry of Cohesion and Regional Development. The data are available under the CC BY 4.0 license, meaning they are open and free to use, including for commercial purposes, provided that the source and authorship are properly cited.
The dataset is available in SHP format, using the D96/TM coordinate reference system, with the most recent version dated November 2024 [49].
Areas of Past and Current Waste Collection Centers
The dataset concerning past and current waste collection centers and waste management facilities is part of the ZKGJI, managed by the Surveying and Mapping Authority of the Republic of Slovenia. This layer delineates the areas of facilities and installations related to waste management, such as collection centers, landfills, composting facilities, sorting plants, incineration plants, and waste processing facilities.
The primary purpose of this dataset is to provide a spatially harmonized and up-to-date overview of the infrastructure supporting the collection, treatment, and disposal of waste in Slovenia. The layer is valuable for spatial planning, environmental analysis, municipal planning alignment, and monitoring the implementation of national waste management strategies. The data are accessible via the e-Prostor portal [40], and allow integration with other layers of public infrastructure and the natural environment [41].
In the context of the LNOP issue, such data represent a valuable resource for identifying potentially high-risk areas. It is reasonable to assume that historical activities related to waste disposal or management at a given location may encourage illegal dumping in the same or nearby areas.
Other Public Economic Infrastructure
For a more comprehensive spatial analysis of the occurrence of illegal waste disposal sites (LNOP), it is reasonable to also include the following layers of public economic infrastructure, as they have significant spatial and functional impacts on accessibility, surveillance, and land use:
Electric Power Network
Part of the ZKGJI also includes data on high-voltage overhead power lines [41], which represent important infrastructural corridors. These installations often traverse sparsely populated and poorly monitored areas. Land use beneath power lines is typically restricted (e.g., construction is prohibited), creating underutilized areas. These corridors are often less accessible to supervisory authorities, yet accessible by vehicles (e.g., via maintenance roads), which increases the risk for LNOP. Due to technical requirements (e.g., clearance and maintenance access), these areas tend to have limited oversight and minimal human presence.
Public Lighting
This layer includes data on the presence and density of public lighting in settlements, along roads, and nearby infrastructure. The data originate from the ZKGJI [41]. Poorly lit or unlit areas increase the likelihood of undetected illegal waste dumping. Lighting density serves as a good indicator of urbanization and spatial surveillance—higher illumination typically indicates greater human presence and lower LNOP risk. Analysis of this layer enables the distinction between well-monitored areas and more remote or less controlled parts of settlements and rural environments.
Railway Infrastructure
This layer includes railway tracks, stations, service roads, and associated railway facilities. It can be obtained from publicly available sources (e.g., ZKGJI or OSM) [41,42]. Railway lines often traverse areas with low or no permanent human presence, which increases the risk of concealed illegal dumping. Railway service roads allow vehicle access even in remote locations. A higher occurrence of LNOP is frequently observed near railway depots or abandoned industrial rail connections, a pattern confirmed in comparable international studies.

3.3.2. Modelling Potential LNOP Risk Areas—Risk Assessment Map

As part of this research, an approach was developed for identifying LNOP risk areas using machine learning and multimodal data sources, with special emphasis on the integration of geospatial and socio-demographic data.
The main challenge was the nature of the dataset, which consisted of positive and unlabeled data—a learning setup known as positive-unlabeled (PU) learning [29]. This type of dataset is common in real-world environmental problems, as typically only positive instances—i.e., cases where the phenomenon of interest is confirmed—are available. In our case, the positive samples were known LNOP locations, while the unlabeled data were selected from the remaining spatial territory in such a way that known LNOP points were excluded, yet the actual status of these points remains unknown (they may be either negative or undetected positives). This uncertainty poses a significant barrier to the use of traditional supervised learning methods, which usually require both positive and negative examples to generalize effectively.
To construct the unlabeled dataset in a consistent and reproducible way, we first generated a grid covering the entire study area. All grid cells that overlapped with known positive LNOP sites were excluded, along with a 200 m buffer zone around each positive location. This spatial separation was introduced to reduce potential contamination of the unlabeled set by locations that are highly likely to be positive but not yet observed. The remaining grid cells formed the pool of unlabeled data points, which may contain true negatives as well as unobserved positives. This sampling strategy reflects a fundamental limitation of PU learning: while the positive class is clearly defined, the unlabeled set is inherently noisy and cannot be assumed to represent only negatives.
To predict areas with a higher likelihood of LNOP occurrence, three machine learning models were applied, encompassing both unsupervised and semi-supervised approaches. Among the unsupervised methods, the Isolation Forest algorithm [30] was implemented, known for its efficiency in detecting anomalies in high-dimensional data spaces, as well as the One-Class Support Vector Machine (One-Class SVM) [31], which constructs decision boundaries based on a single class (in this case, confirmed dumping sites) to identify outliers or anomalies. The third approach employed was the Elkan and Noto method [32], which belongs to the category of semi-supervised learning techniques and was specifically designed to address challenges associated with partially labeled datasets.
The modelling process utilized a broad set of input data layers described in the preceding sections. Preprocessing the data was crucial for ensuring high-quality model training. Each model was trained independently, with a focus on robustness and resistance to noise in the unlabeled data. In the final step, the output of the three models merged into a heatmap representing the aggregated risk assessment.
The aggregation of predictions was based on spatial integration of the individual model outputs. The final output was assigned a probability value (p) of 0, 1/3, 2/3, or 1, depending on the number of models that predicted a high-risk classification for a given location. A threshold was applied whereby a location was considered potentially at risk if at least two out of the three models agreed in their prediction (p ≥ 2/3).
This approach reduced the influence of potential outlier predictions from individual models and increased the overall reliability of the result. The outcome is a spatially continuous map illustrating the relative likelihood of LNOP occurrence, based on consensus among multiple independent models. An example of the final output produced by this method is shown in Figure 7.
Model evaluation in a PU setting must be adapted, since traditional precision and F1 measures can be misleading when true negatives are unknown. We therefore relied on recall and a quasi-AUC derived from the ROC framework. Recall was estimated using bootstrap resampling: in each of 50 replicates, we sampled with replacement from both the positive and unlabeled sets, retrained all three models, and evaluated recall against the original set of known positives. The quasi-AUC was obtained through K-fold cross-validation, where all unlabeled samples in the test folds were provisionally treated as negatives, even though some may in fact be positives. This approach provides a conservative, lower-bound estimate of the models’ discriminative ability. Together, recall and quasi-AUC offer a robust yet cautious assessment of how well the models prioritize high-risk areas without being biased by the abundance of unlabeled data.

3.4. Remote Sensing for LNOP Recognition

As part of the assessment of LNOP, the applicability of remote sensing methods was also tested—specifically, the generation of high-resolution orthophoto raster imagery using UAV. The aim of this approach was to evaluate the potential for visual identification of additional LNOP and to assess the effectiveness of the method as a supporting tool for monitoring and documentation. Importantly, UAV deployment was guided by the outputs of the predictive LNOP risk model, serving as a targeted discovery tool to investigate areas with an elevated probability of illegal dumping.
Test flights and the subsequent production of orthophoto imagery were conducted over three selected areas, which were chosen based on the outputs of the LNOP risk modelling that indicated a higher likelihood of illegal dumping. The UAV flights were scheduled for late autumn and early spring to take advantage of snow-free periods with reduced vegetation cover—conditions that proved to be critical for successful aerial detection of LNOP [50]. Vegetation coverage and snow presence were confirmed as the main limiting factors of the method. The drone flights were mainly conducted over unpopulated areas, so no special permits were required. Nevertheless, the pilots were trained and certified by the Slovenian Civil Aviation Agency to fly in a standard STS scenario. Flying over larger areas would only require more batteries or more drones and a larger team.
The resolution of the acquired orthophoto raster images depended on the characteristics of the camera used (12 MP) and the UAV flight altitude, which was approximately 60 m. The imagery provided a relatively detailed overview of the terrain, enabling operators to manually identify additional LNOP sites in the broader vicinity of known or previously predicted high-risk areas.
The use of UAV in populated areas represents an innovative approach; however, it requires strict compliance with applicable legislation. According to the Decree on the Implementation of the Commission Implementing Regulation (EU) on the Rules and Procedures for the Operation of Unmanned Aircraft [51], UAV operations in the “specific category” (e.g., overpopulated areas or in proximity to people) require prior authorization.
For this purpose, all legally required conditions were met: operational authorization was successfully obtained for the company, and UAV operators were certified, having completed both theoretical and practical training, passed the specific category theoretical examination, and undergone preparation for inspection and actual supervision by the Civil Aviation Agency (CAA) of Slovenia. This ensured the legal and safety foundation for systematic aerial data acquisition. This approach will also need to be adopted in the future and in other parts of the world.
The detection of additional LNOP confirmed the effectiveness of UAV deployment as a complementary monitoring mechanism within the circular data feedback loop.

3.5. Software-Based Support

As part of the activities related to the inventory and analysis of LNOP, a dedicated digital tool—the EkoVaruh application—was developed and tested during the pilot phase. The application consists of two interconnected components: a mobile app and a web-based (back-end) system. Its purpose is to enable a comprehensive approach to recording, monitoring, and managing LNOP at both local and national levels, while also providing a high-quality spatial database to support planning of remediation and prevention measures.
The mobile application allows easy recording of new LNOP using geolocation data, along with the addition of basic descriptive information (e.g., type and quantity of waste, photo, and comment) and a cartographic display of already recorded locations. This functionality facilitates orientation in the field and reduces the risk of duplicate entries.
The web application (back-end system) is intended for system administrators and managers. For now, it enables review, editing, and analysis of collected data, including filtering by various criteria and access to the history of changes. The application will be integrated with other spatial datasets, allowing for a more comprehensive approach to LNOP management from the perspective of environmental risk, remediation strategies, prevention of repeated violations, and the planning of more effective preventive and remedial actions.
The development of EkoVaruh establishes an efficient digital system that supports both operational fieldwork and systemic management of LNOP. At the same time, it encourages the active involvement of users and stakeholders in maintaining a clean environment. Compared to other application-based solutions—such as TrashOut [52], which also target illegal waste disposal—EkoVaruh is tailored specifically to the needs of local and national stakeholders and administrative systems. The EkoVaruh application is still under development and, as such, can be adapted to the needs of this type of mass data collection. In terms of its purpose, the application is being developed to be as simple and intuitive to use as possible, while still allowing administrators in the background to perform numerous analyses and queries. The potential for further development and enhancement is therefore undisputed.

4. Results

4.1. First Data Loop—Iteration

The establishment of the initial LNOP registry represents the first phase within the circular data feedback loop, in which existing records of illegal waste dumping and abandonment are used as input data. For this purpose, a dataset compiled by the non-governmental organization EBM was used. Between 2010 and 2018, the organization led a nationwide field campaign to map so-called illegal dumping sites across Slovenia.
The analysis included all locations from this dataset that were spatially identified within the territory of MOM during the stated period. Some of these sites included detailed information on waste types and quantities, while others contained only geolocation data. Despite the methodological heterogeneity in data collection, the entire dataset was used as the initial input for the spatial LNOP database and as a foundation for further enhancement through additional data sources and methods (e.g., UAV data acquisition and risk area modelling).
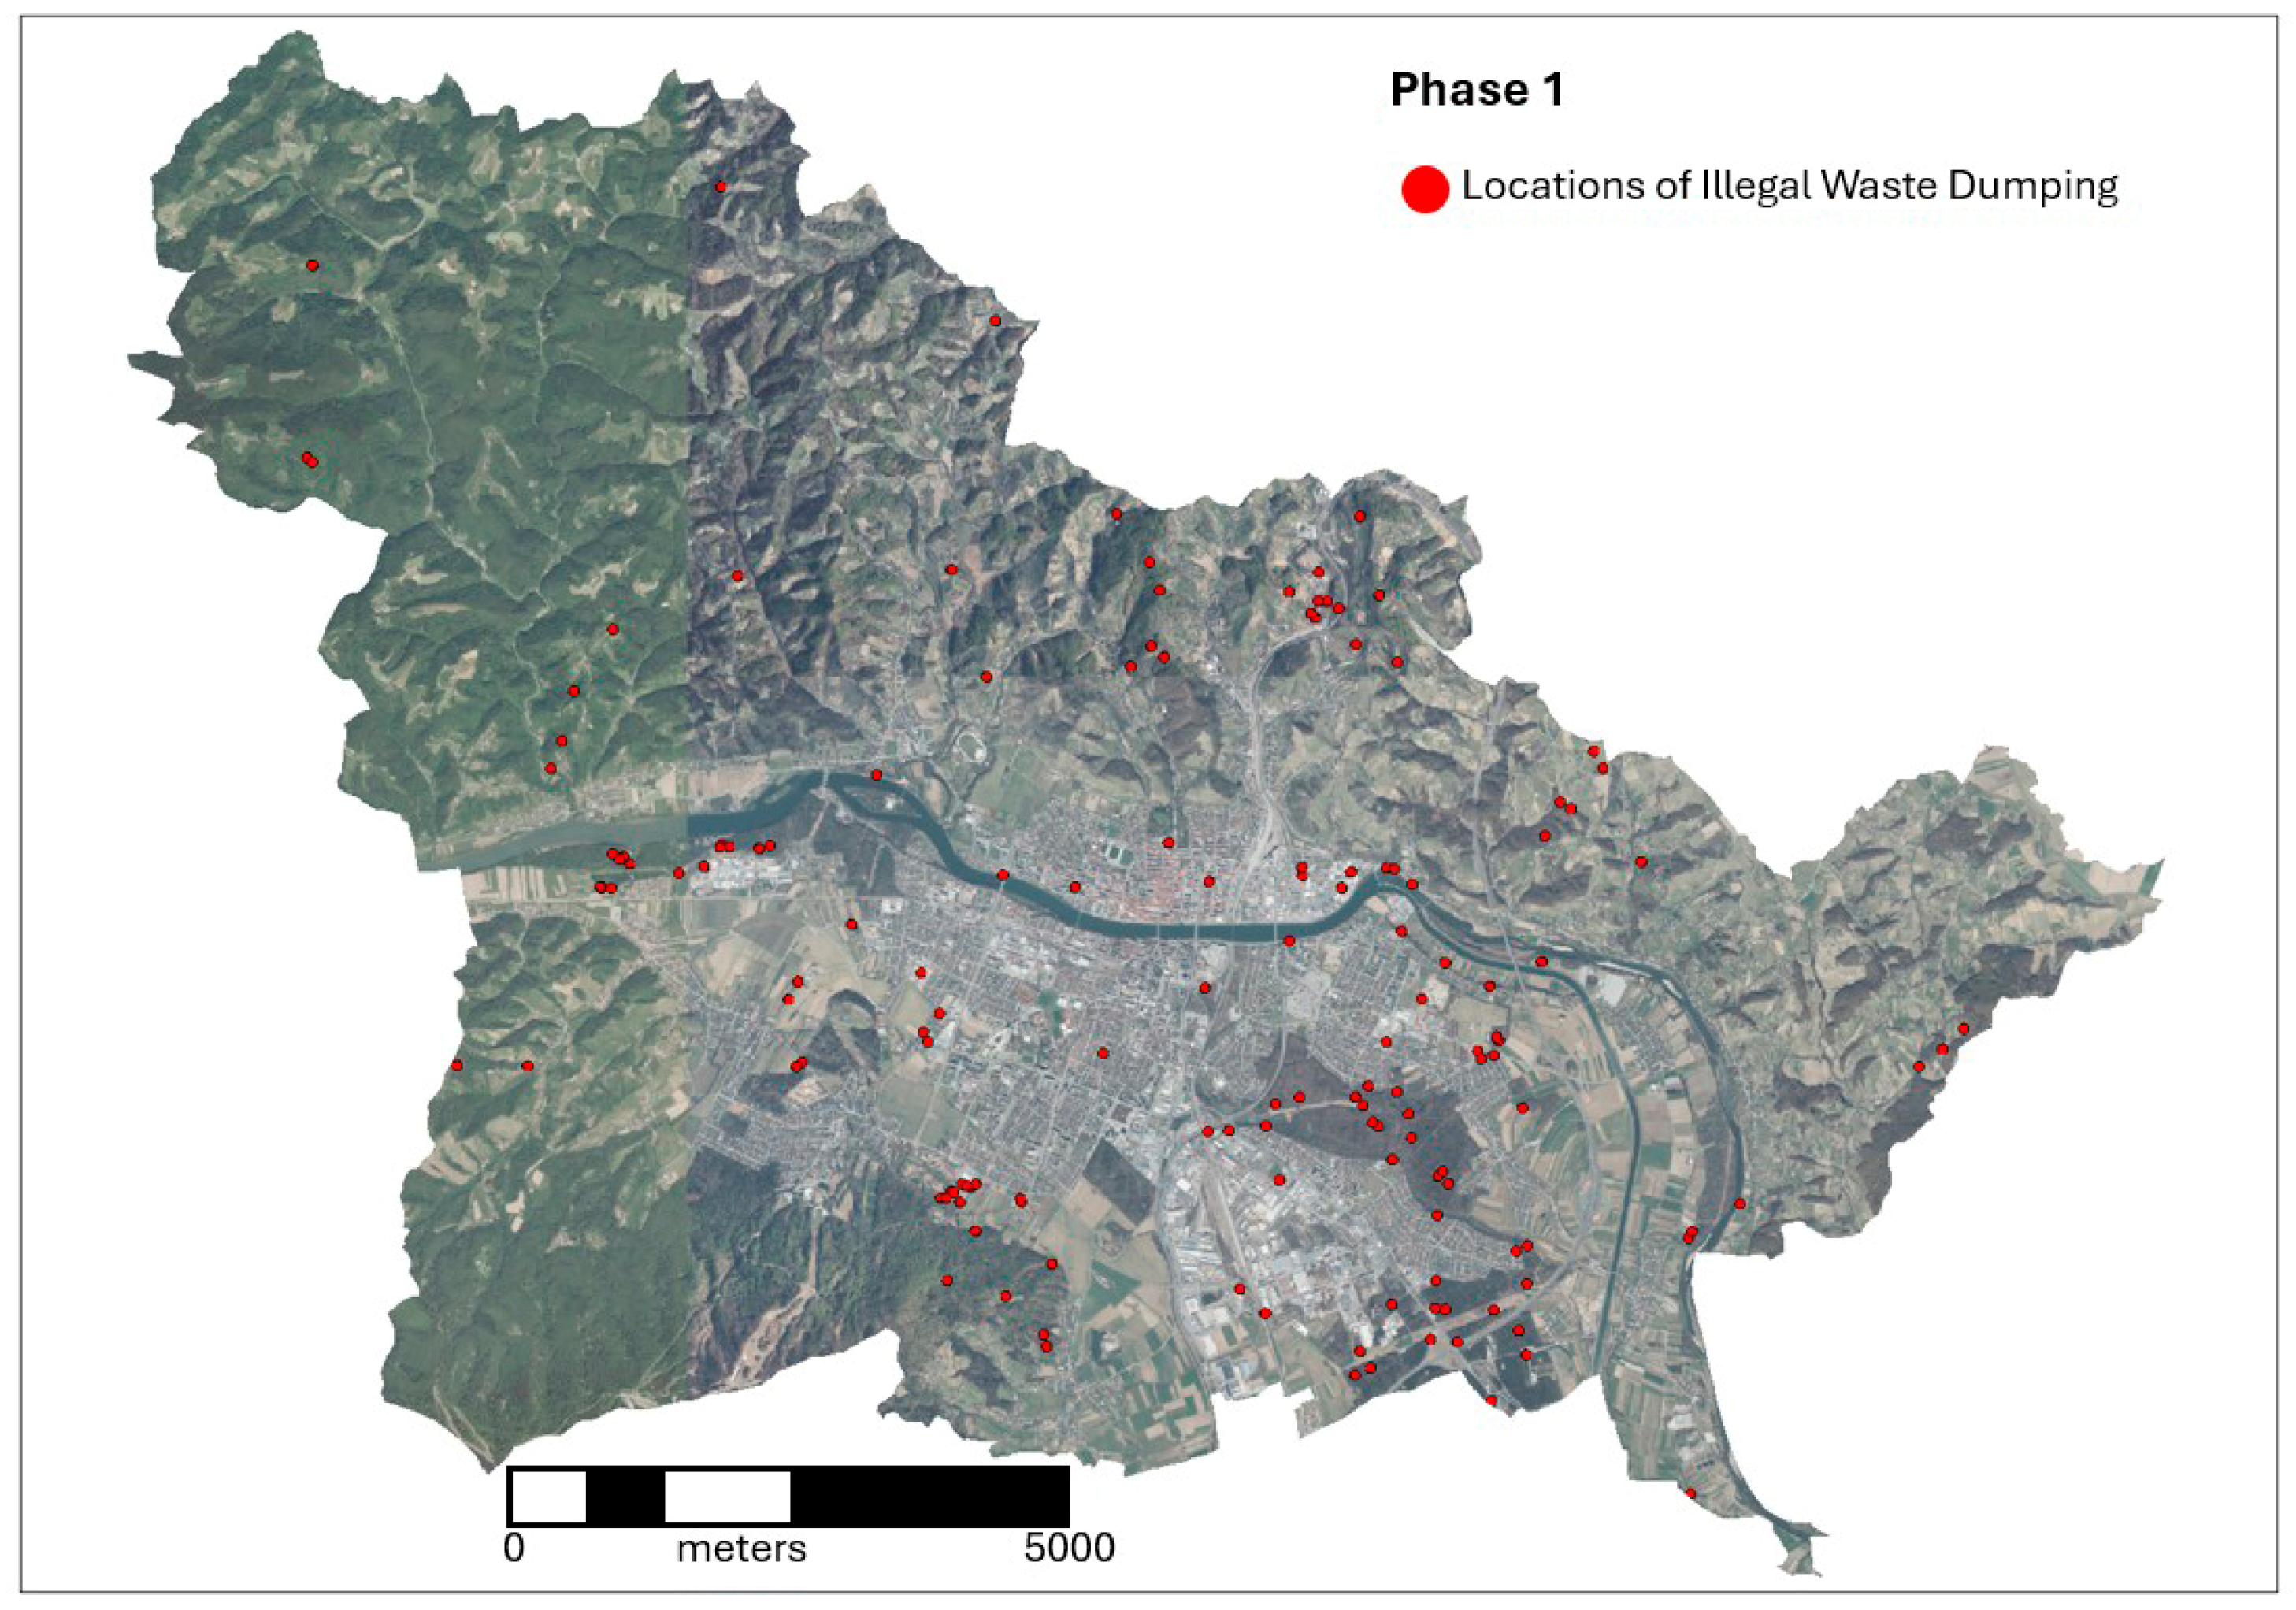
From a quantitative perspective, a total of 1310 m3 of waste across 150 locations was included in the first phase. The dominant waste fractions identified included bulky waste, construction waste, packaging, and biowaste. Spatially, a concentration of locations can be observed at the edges of urban areas.
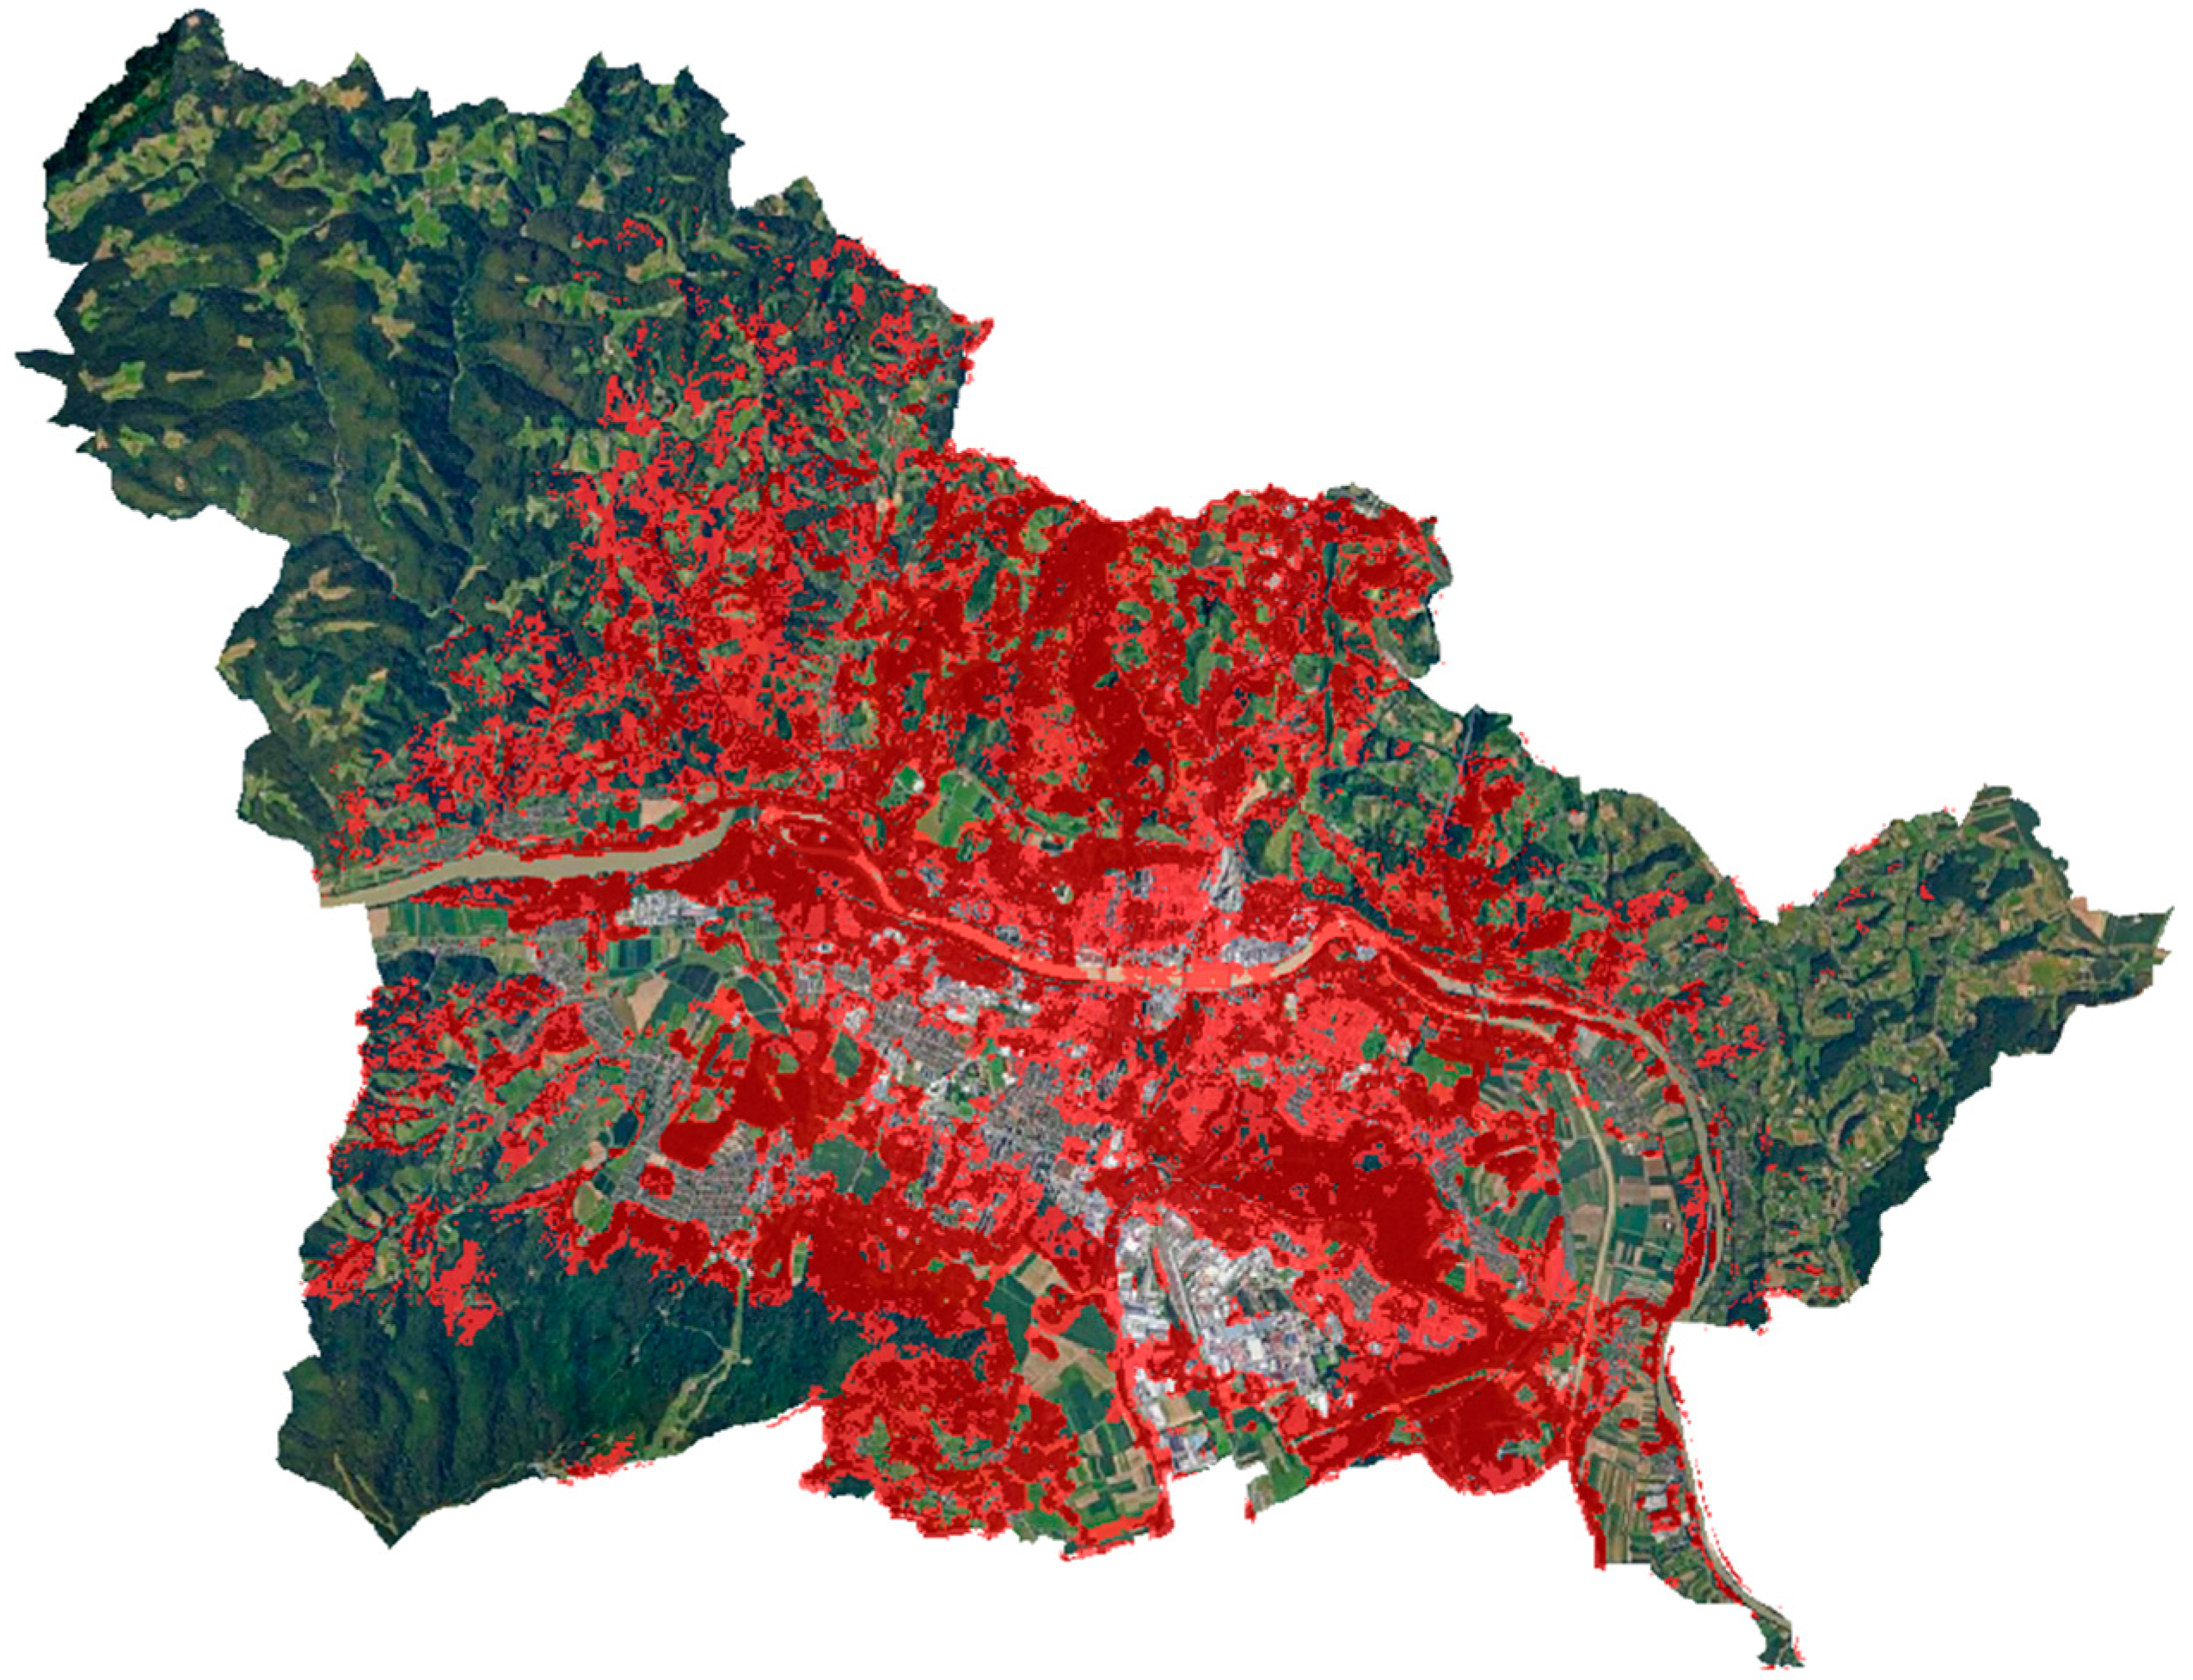
The positional distribution of all locations from the initial dataset is shown in Figure 8, where they are represented with point markers. This spatial distribution served as the basis for the initial validation of the risk area model (Figure 9) and for guiding activities in subsequent phases, including targeted UAV flights and field inspections. The dataset provided by EBM thus represents not only a historical record, but also a critical foundation for building a dynamic registry and supporting the development of predictive tools.

4.2. Second Data Loop—Iteration

The second data input in the circular data feedback loop was based on the implementation of a direct field survey, aimed at verifying previously known LNOP locations and systematically identifying new sites not included in the initial dataset. The fieldwork was carried out in the spring of 2024, during a period when vegetation coverage had not yet significantly hindered visibility and accessibility of individual areas.
The verification process involved rechecking the spatial coordinates of known sites and comparing them with the actual field conditions, with particular attention given to whether the LNOP had been remediated or transformed. New locations were identified based on visual indicators or information provided by residents or representatives of the local community (e.g., the intermunicipal inspectorate).
All sites—both revalidated and newly identified—were entered into the LNOP registry in accordance with the previously defined core data structure. This significantly enriched the initial data input and provided a more representative spatial picture of the LNOP burden in the MOM.
From a quantitative perspective, a total of 2313 m3 of waste was recorded at 299 locations (including both the first and second data inputs). Compared to the initial dataset, this represents nearly a doubling in the number of identified sites and a substantial increase in the volume and detail of content-related information collected.
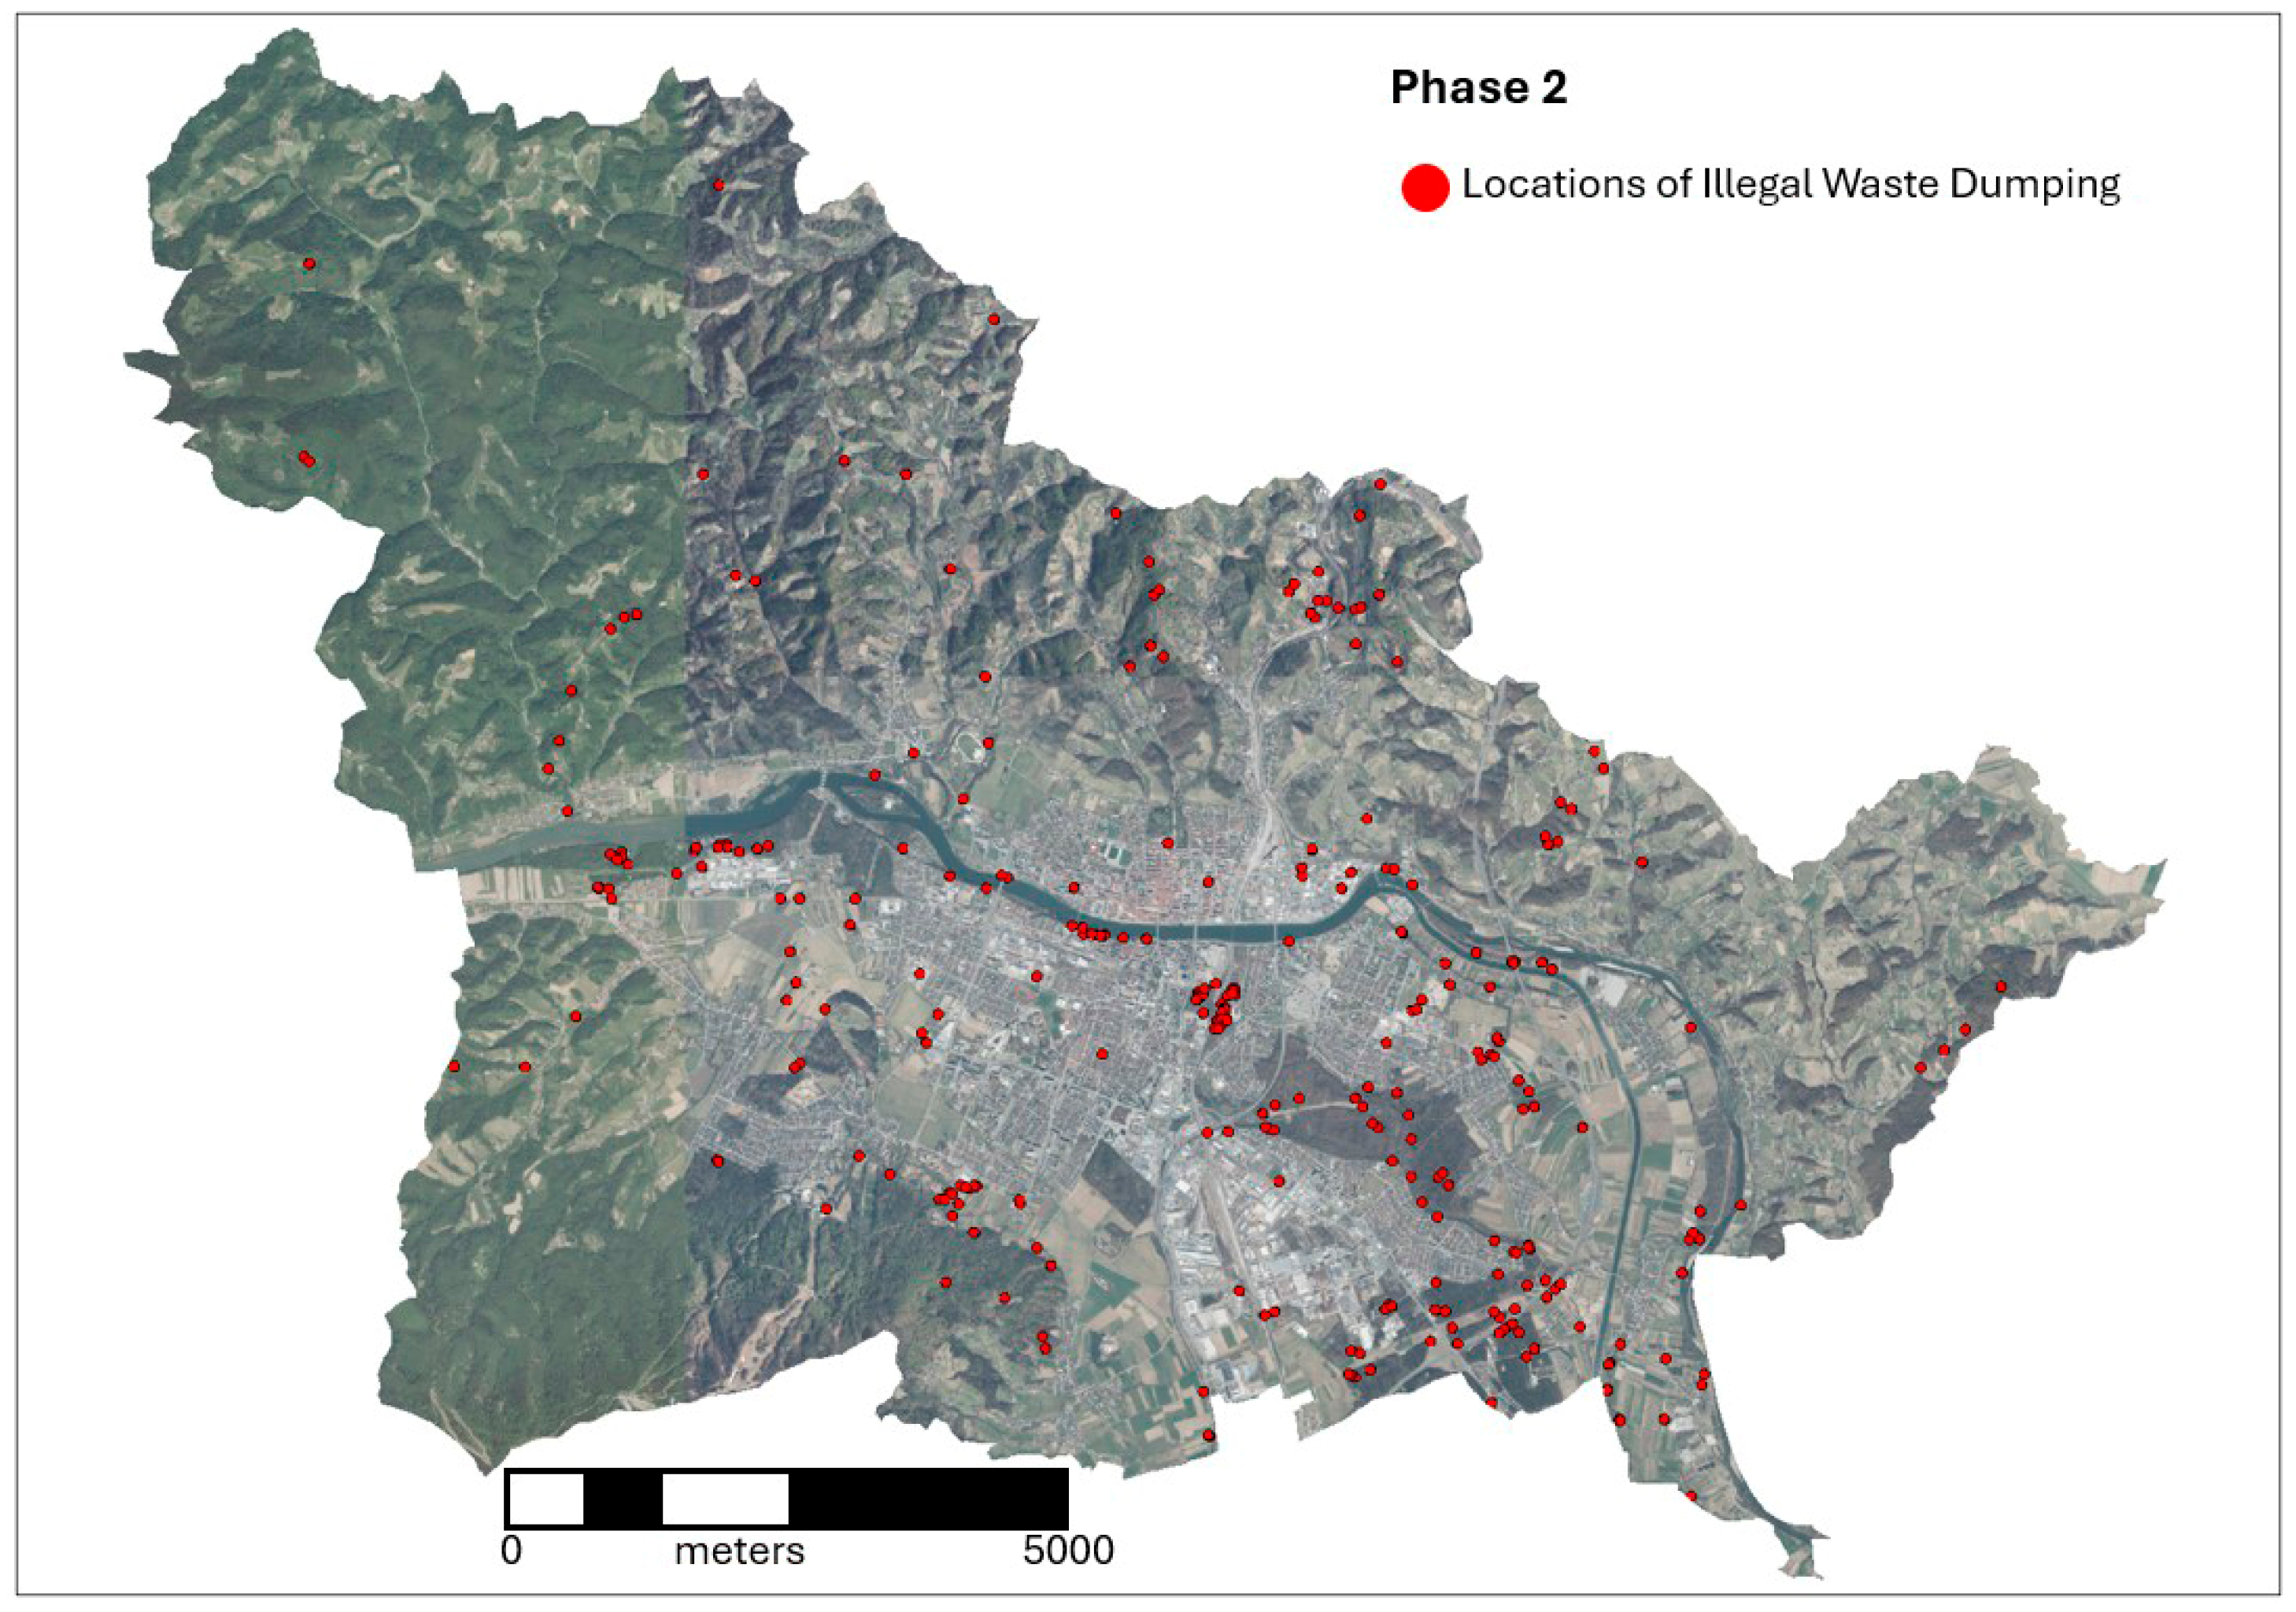
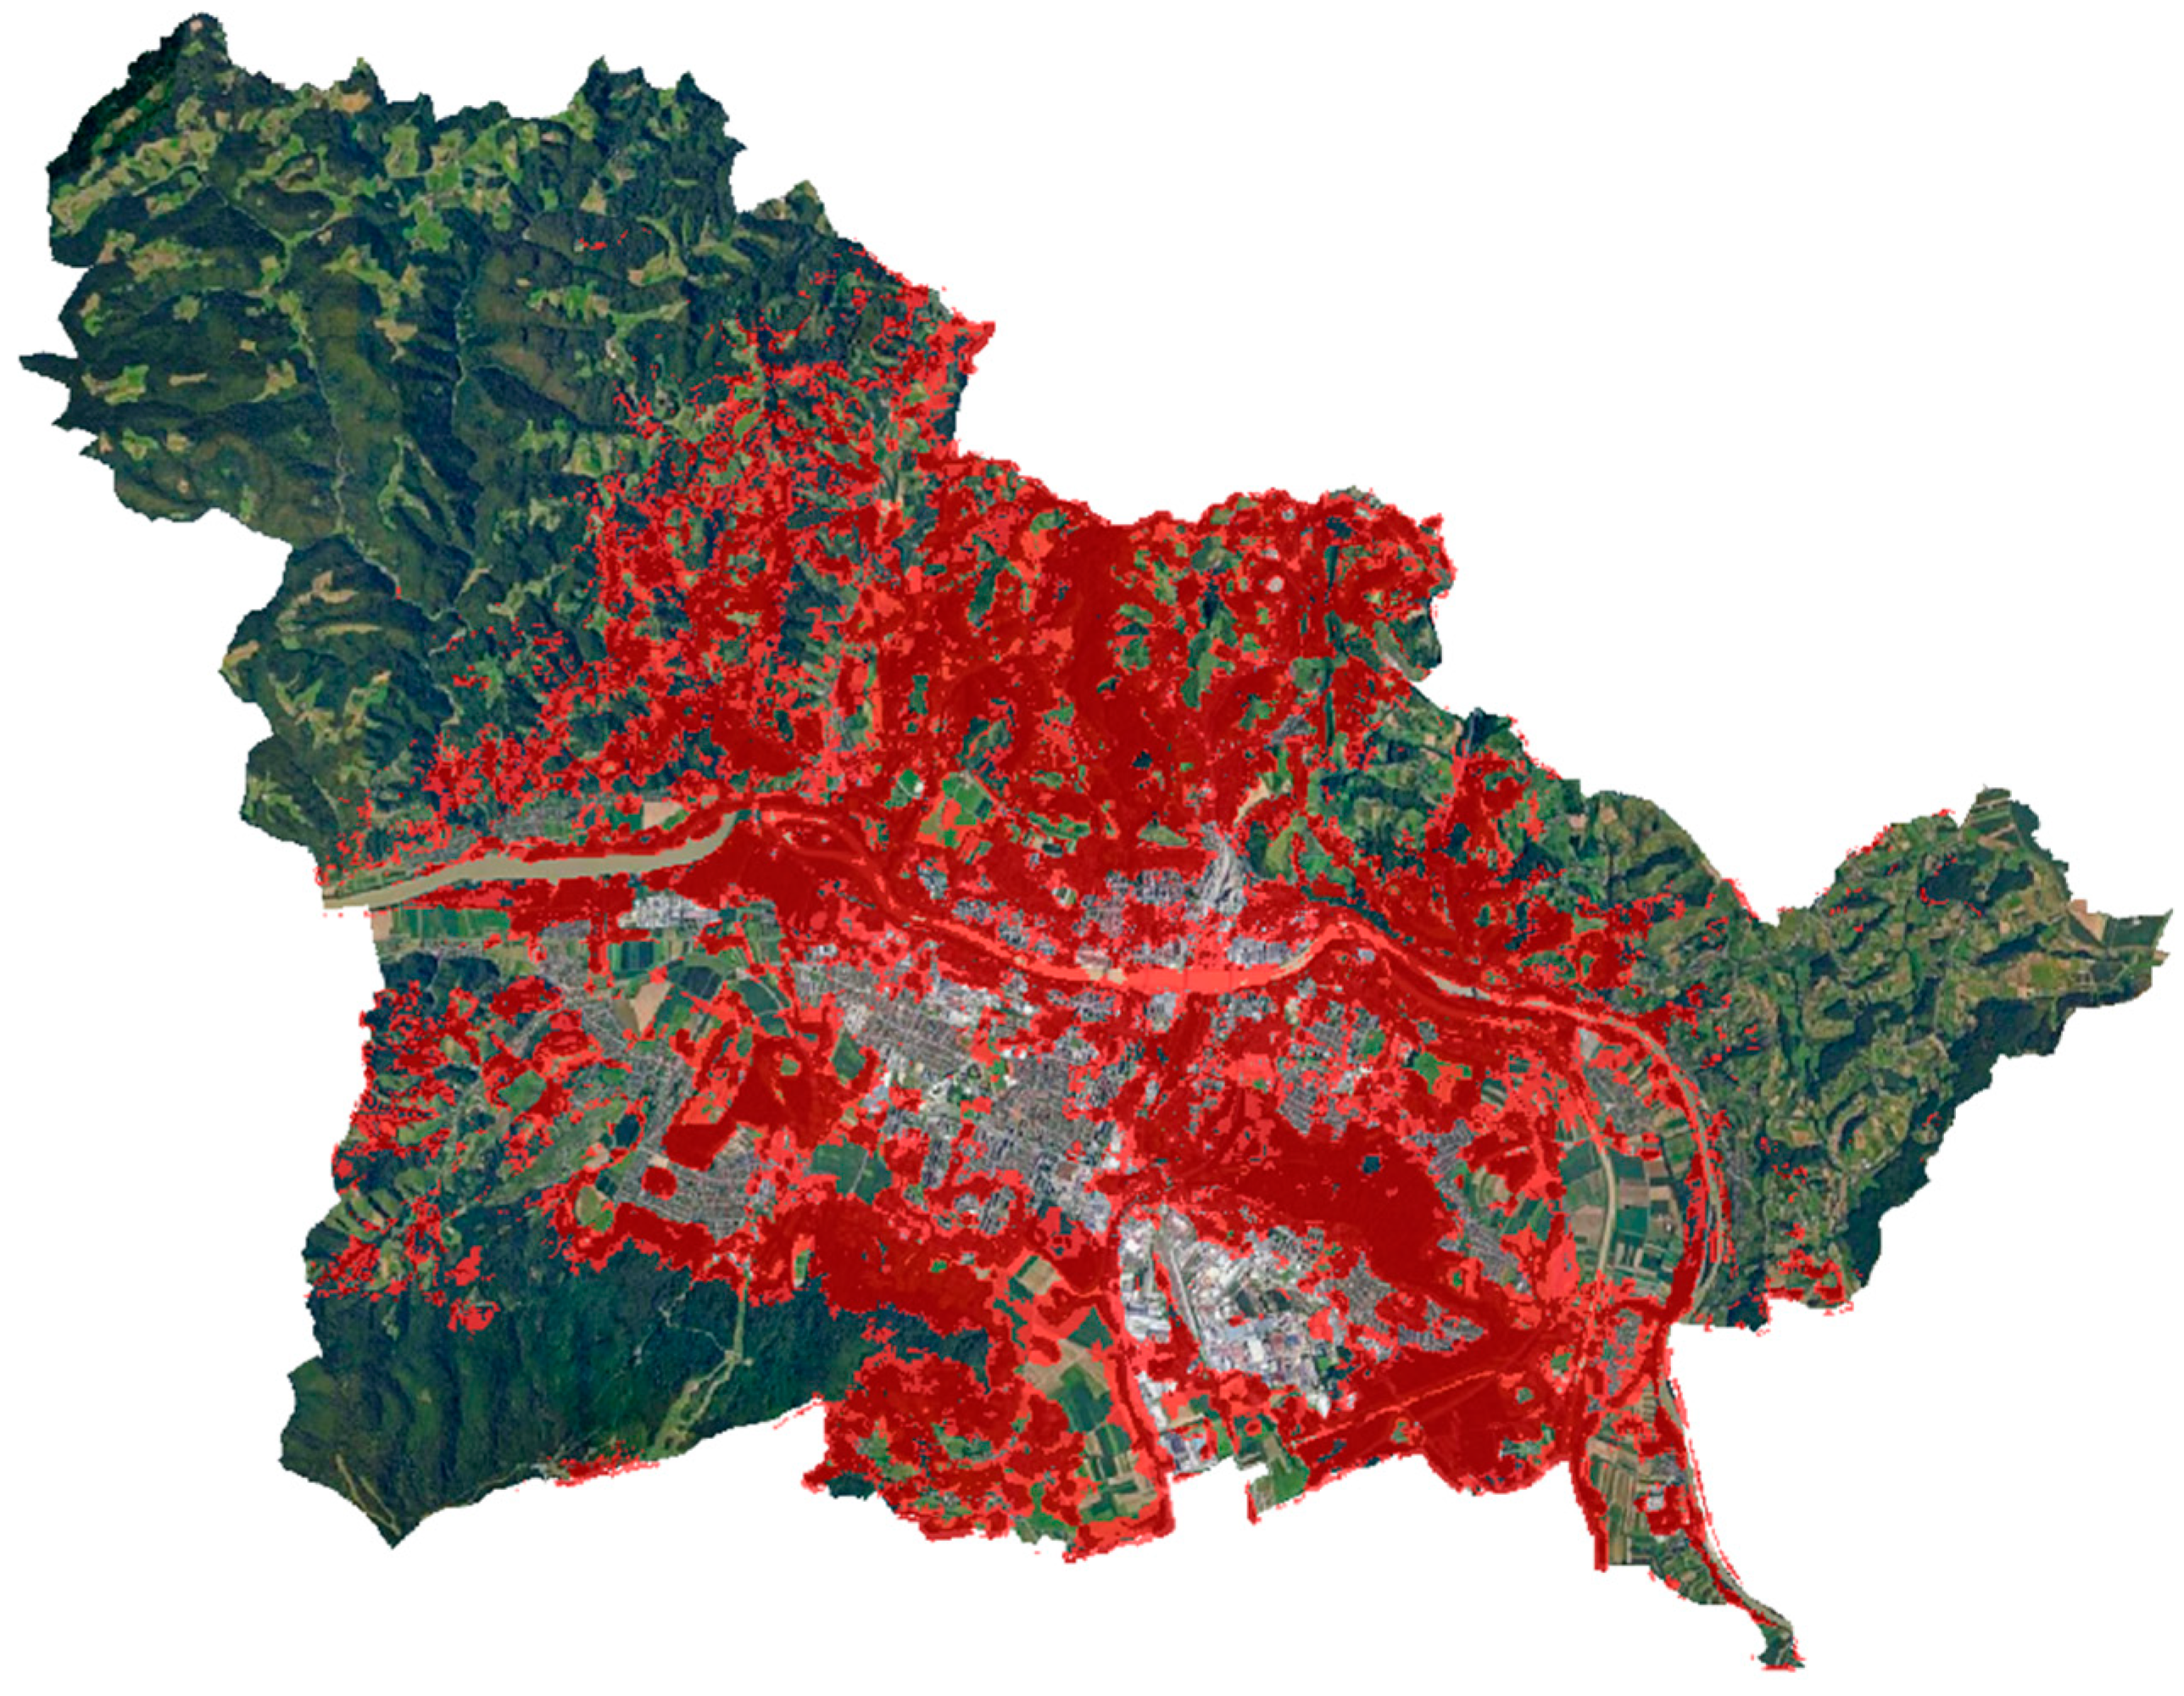
Figure 10 shows the spatial distribution within MOM, revealing a concentration of LNOP along the urban fringe. Additional sites are also observed deeper in rural and less monitored areas. This spatial insight serves as a direct input for subsequent phases of analysis, including risk area modelling (Figure 11) and the planning of surveillance and mitigation measures.

4.3. Third Data Loop—Iteration

The third data input within the circular data feedback loop was based on information collected during the spring campaign “Cleanup Campaign Maribor 2025My Waste, My Responsibility” and through student fieldwork organized in cooperation with the Faculty of Civil Engineering, Transportation Engineering and Architecture at the University of Maribor. The activities took place within the territory of the Municipality of Maribor and involved volunteers, students, municipal workers, and local administrative services.
In this phase, the EkoVaruh mobile application was tested for the first time. It enabled simple field-based recording of LNOP directly on-site using mobile devices. The application supports real-time data collection, including geolocation, waste type and quantity, and photographic documentation. This method of data entry proved highly effective, as it allowed for standardized and systematic data acquisition with minimal user effort, which in turn increased the number of captured locations and improved the quality of spatial data.
Fieldwork was conducted during spring 2025, when weather and vegetation conditions were still favorable for visual identification and physical access to LNOP sites. The collected data were structured according to the predefined data schema, enabling direct integration into the central registry and subsequent processing within the circular data model.
By the end of the third phase, a total of 463 locations had been recorded in the database, including those from the previous two data inputs, with an estimated total waste volume of 2827 m3. This represents a significant improvement of the registry, as the data was sourced from direct volunteer-based efforts and included controlled collection using a digital tool.
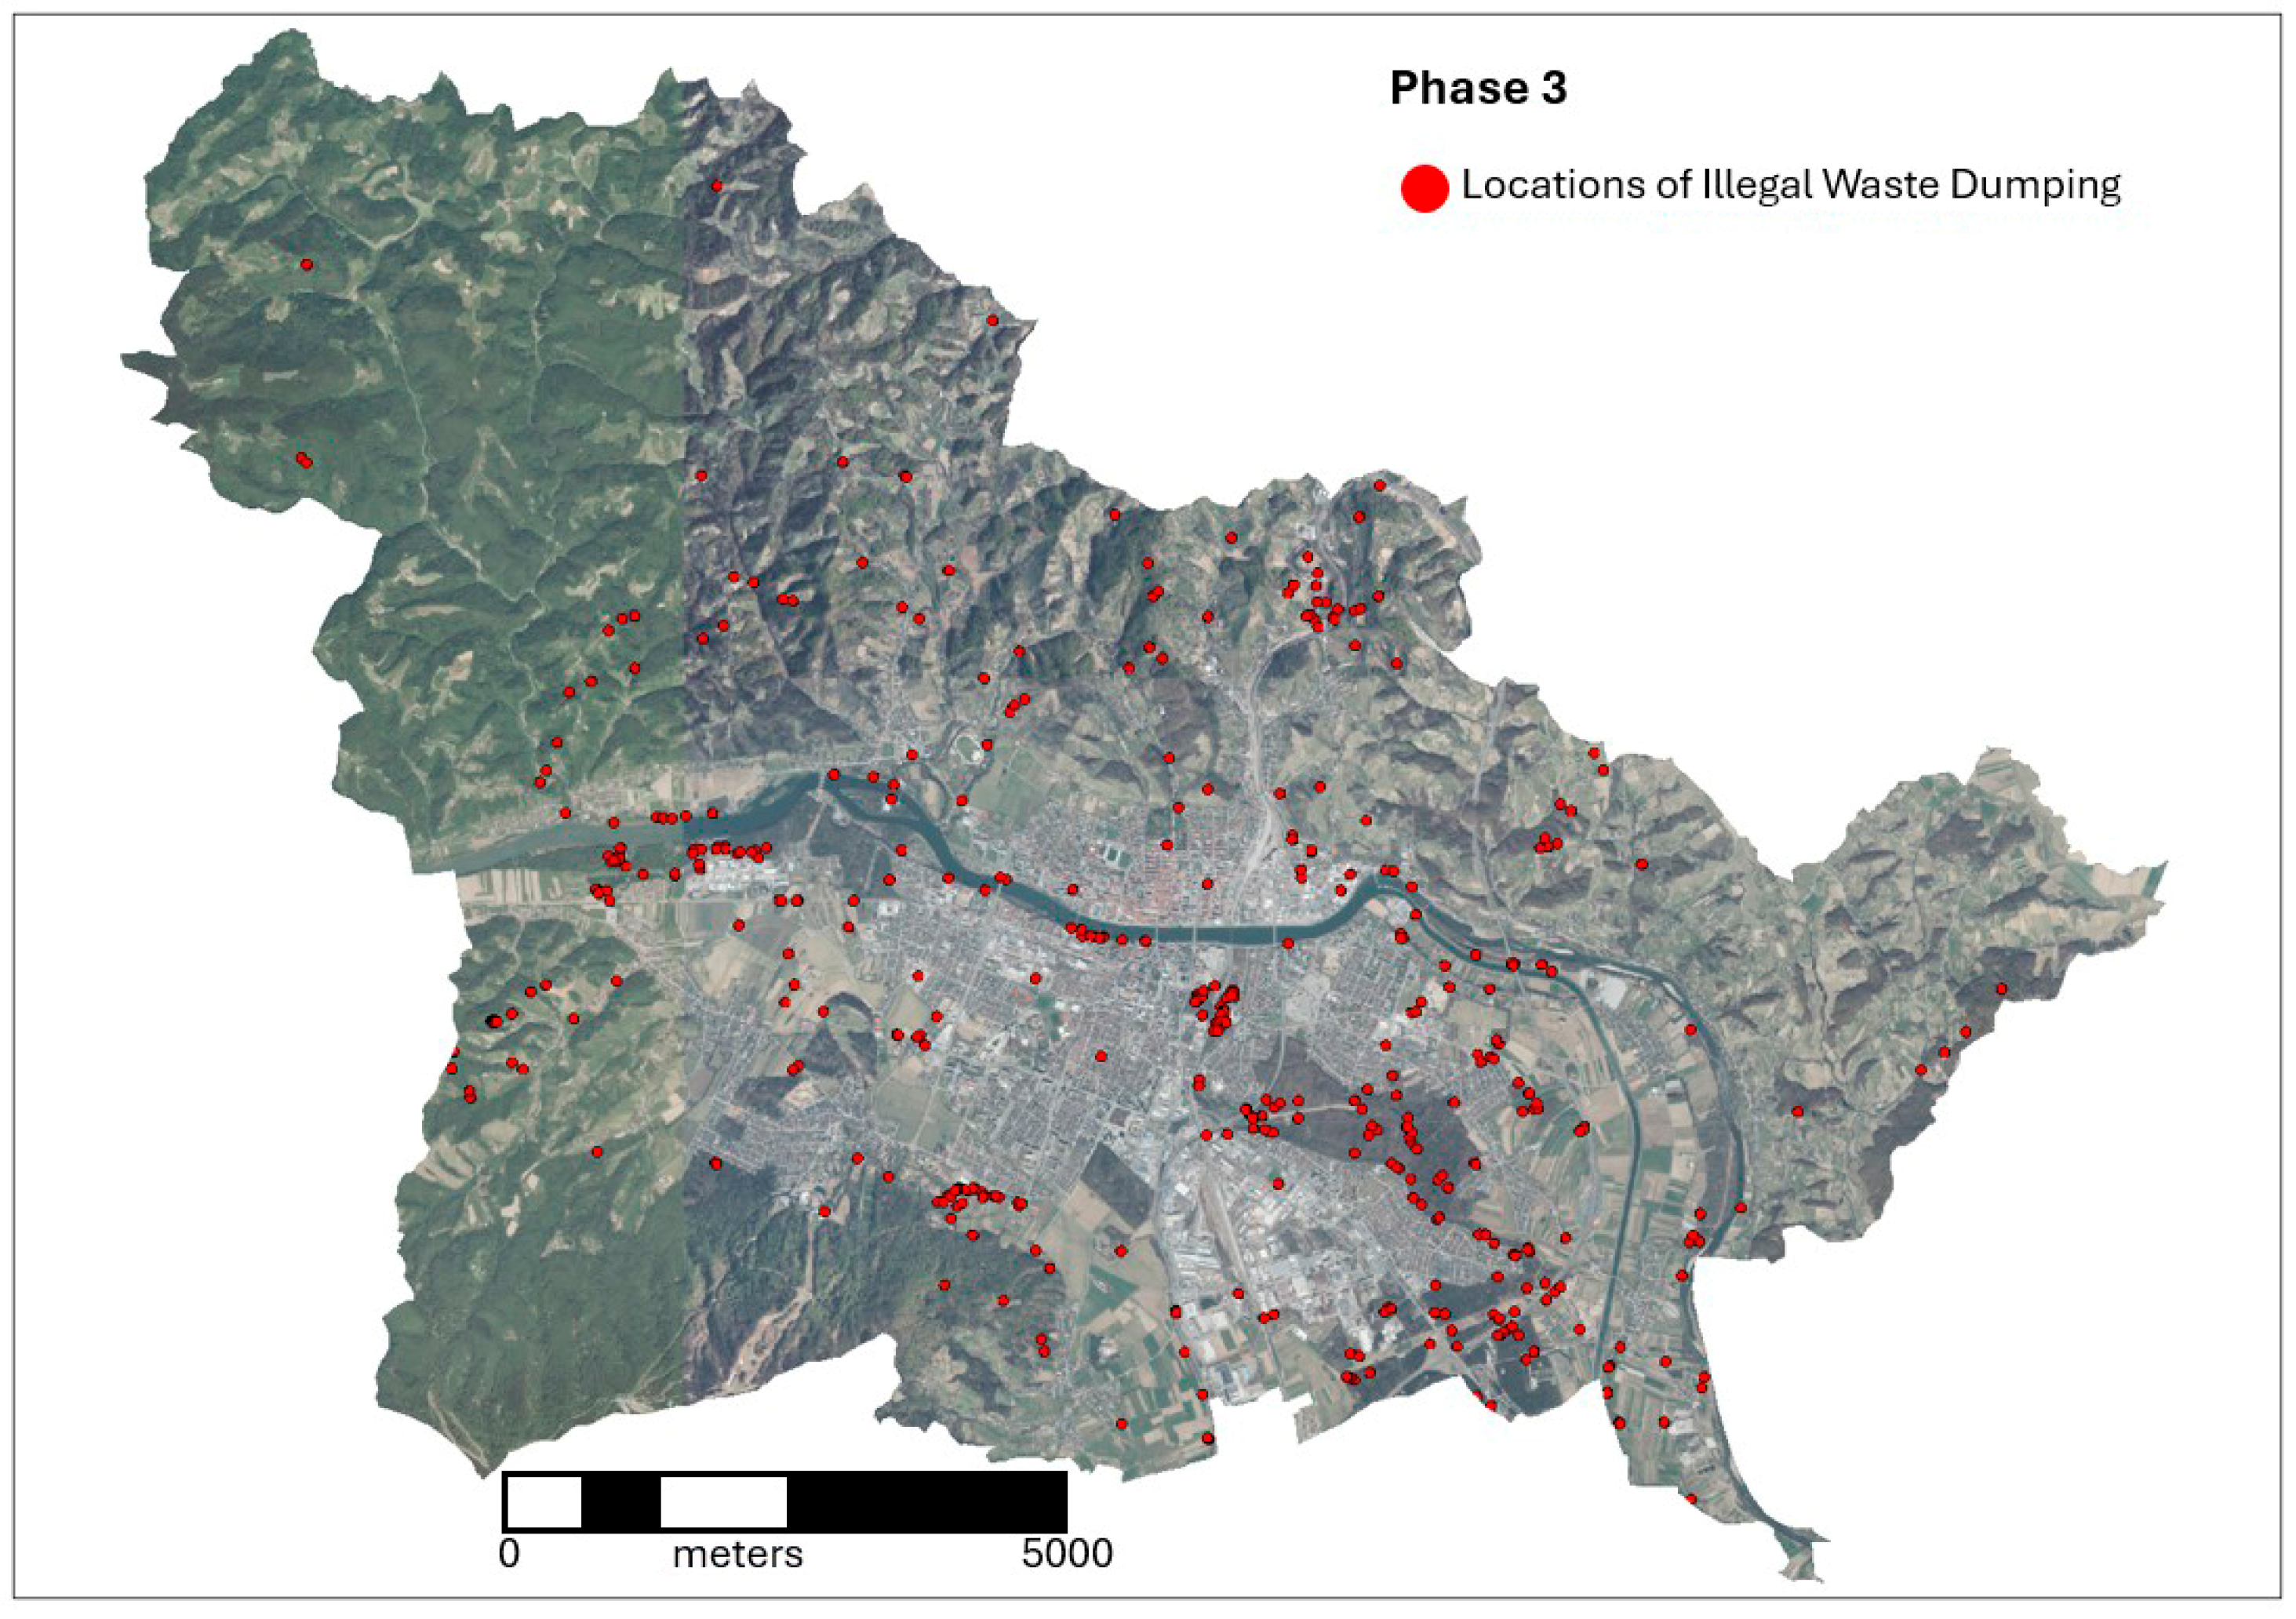
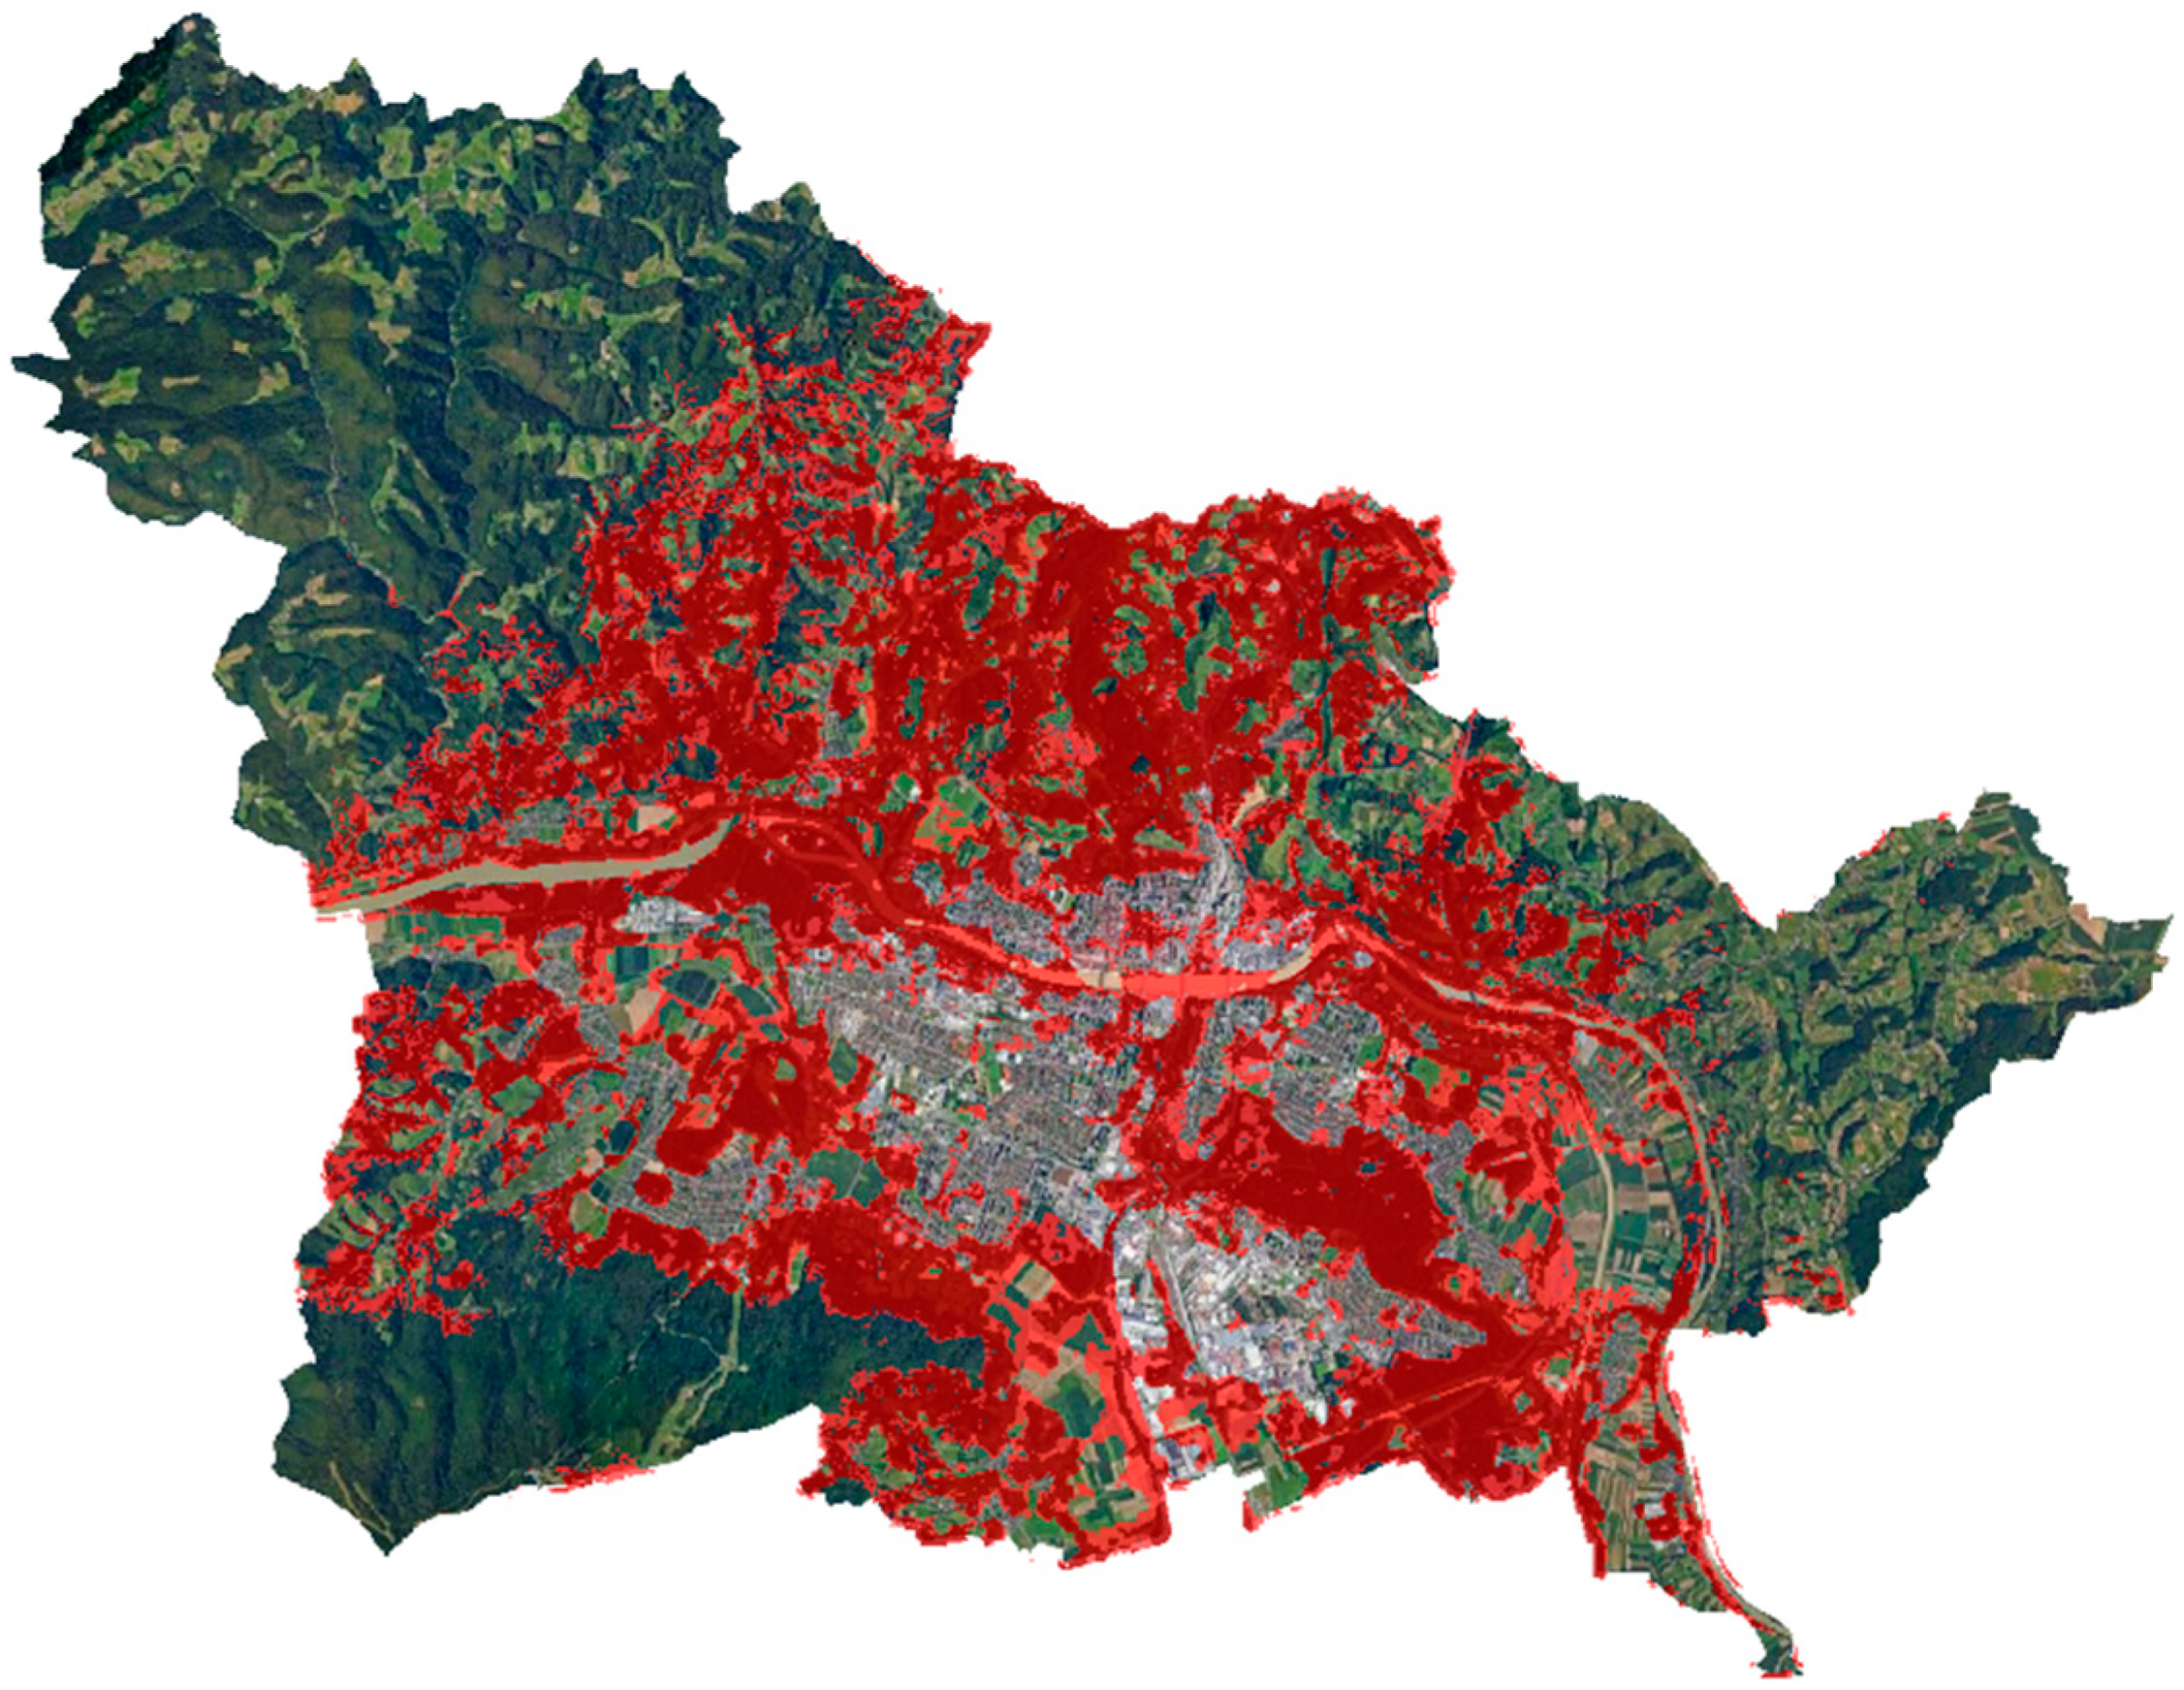
Figure 12 presents the spatial distribution of all documented LNOP collected across the three data inputs. The map confirms a trend of decreasing numbers of undocumented sites in central urban areas, with a simultaneous increase in LNOP presence along the urban fringe and less monitored zones. Accordingly, the results of the risk area model are graphically presented in Figure 13. The third data input thus represents not only a quantitative enhancement of the database, but also a validation and confirmation of the effectiveness of the application-based support, constituting an important step in the further development of the system under consideration.

4.4. Loop Comparison

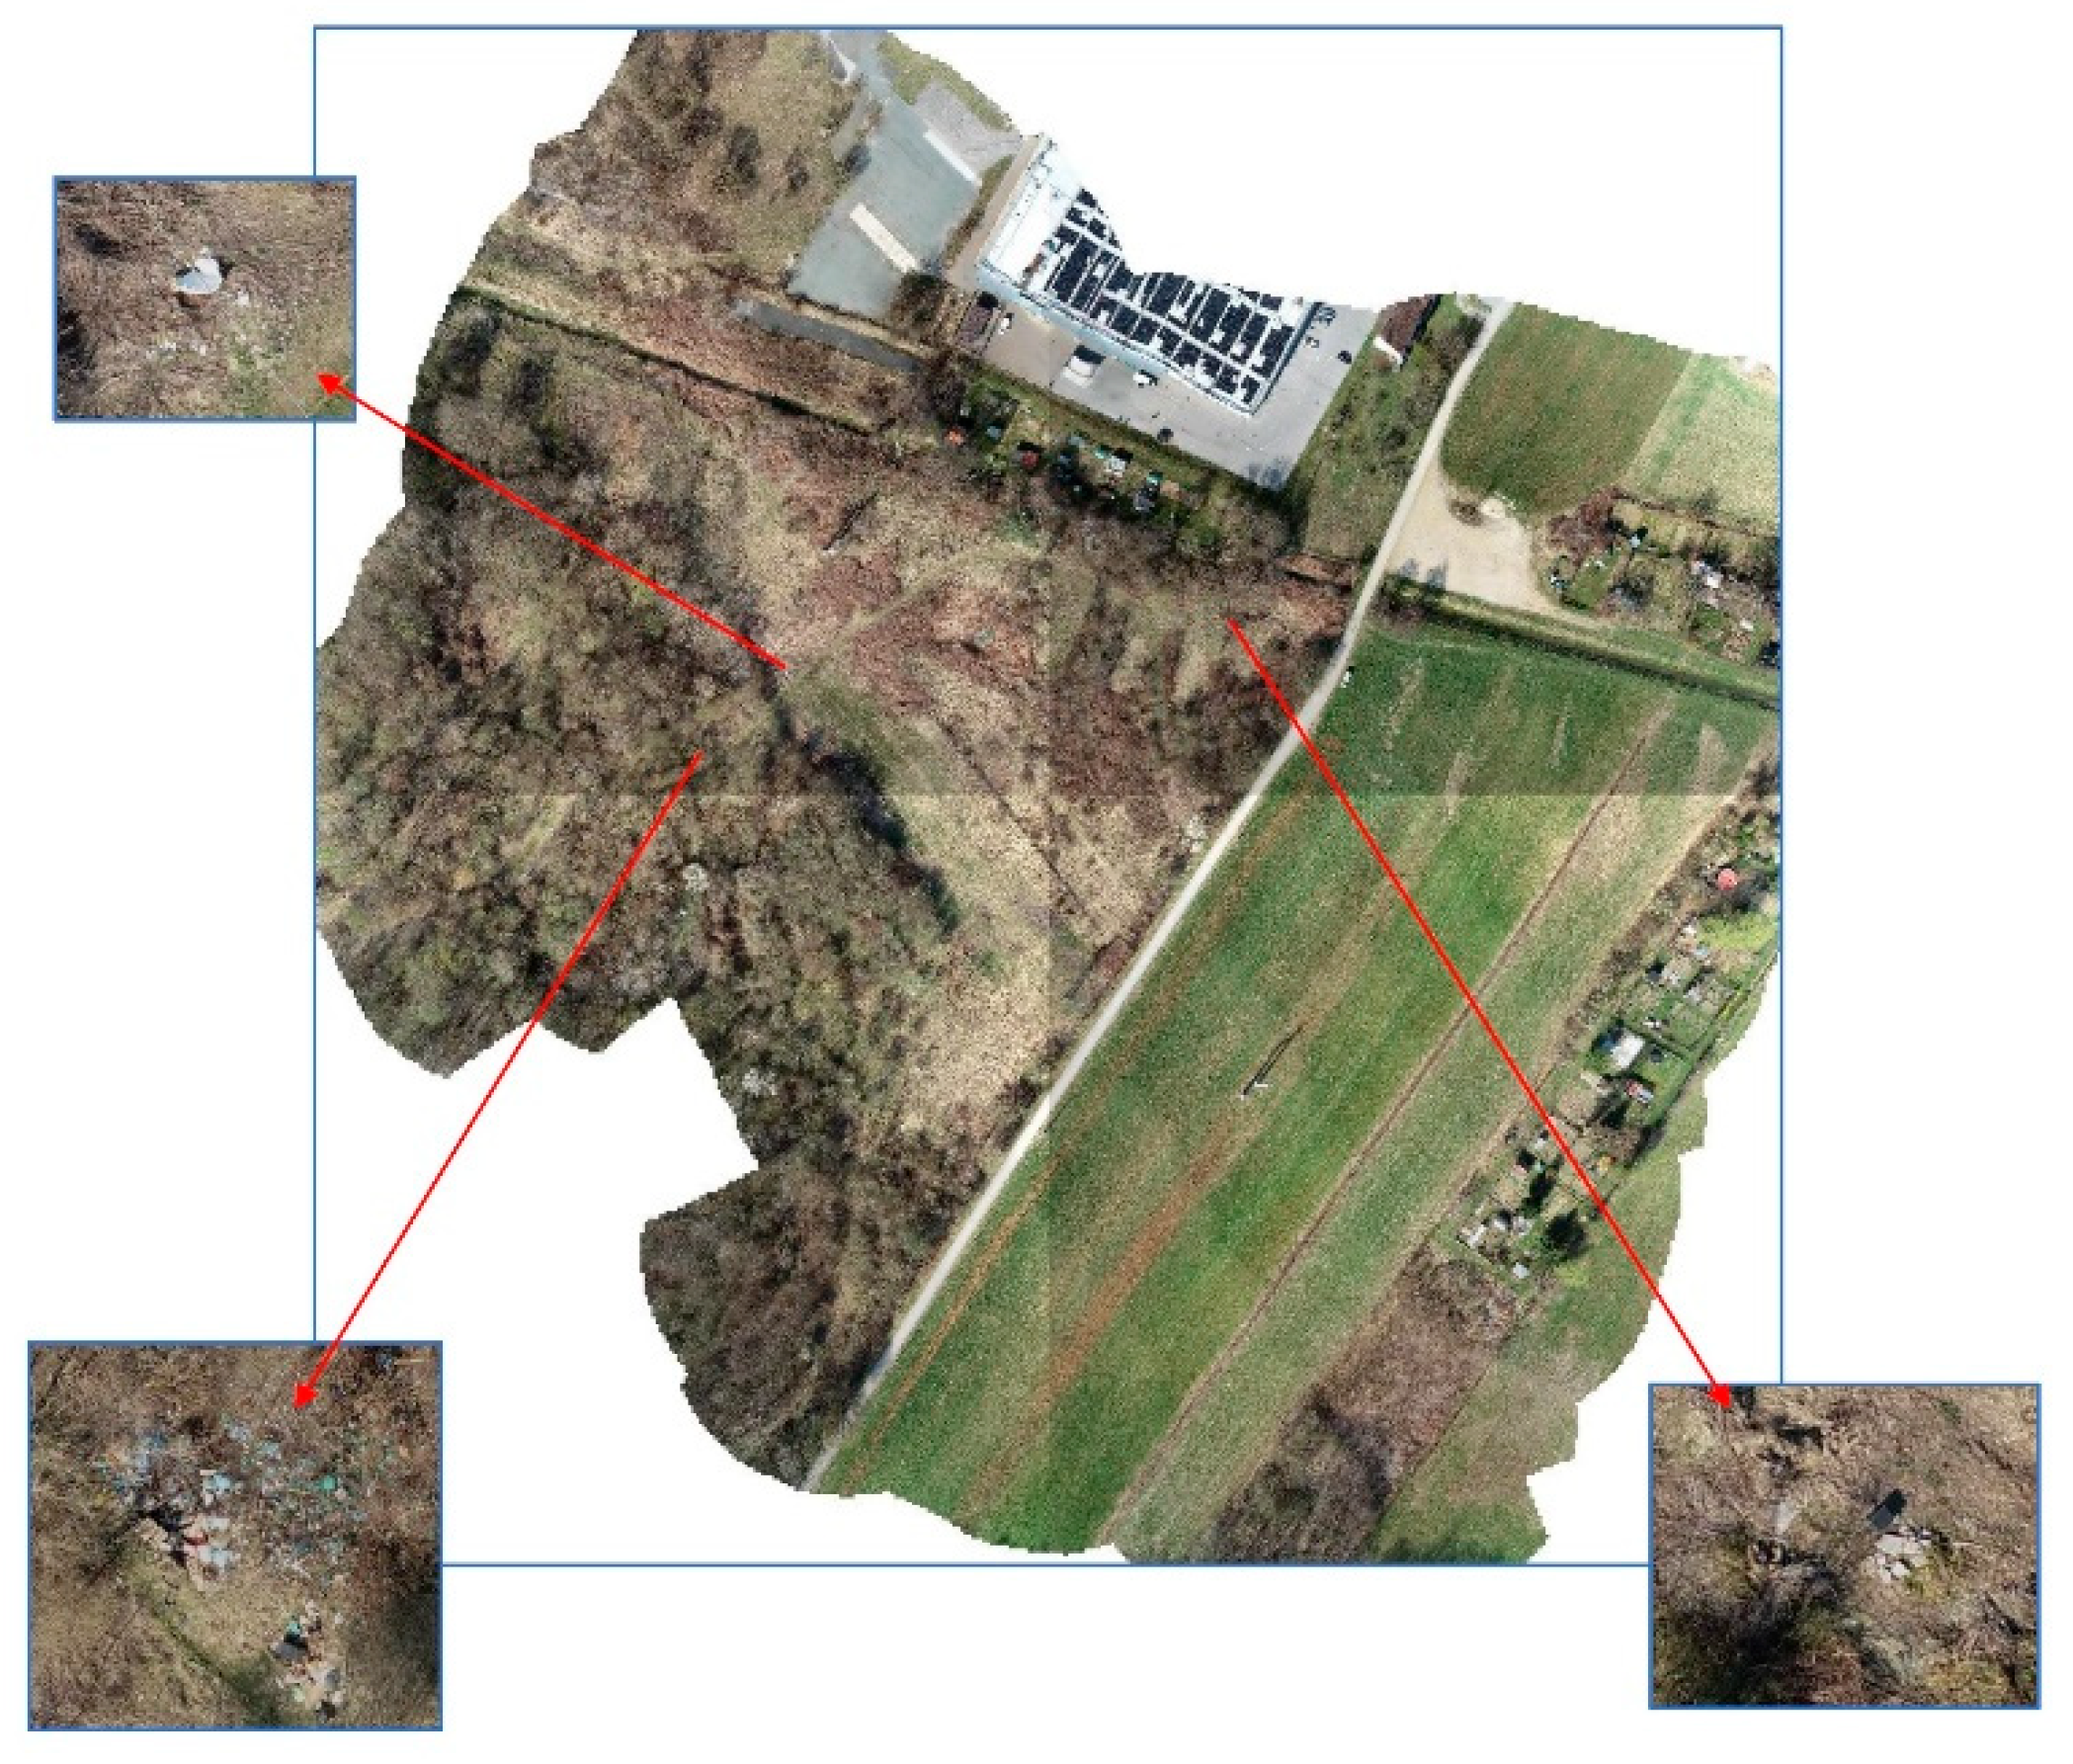
As part of each iteration of the circular data feedback loop, a test UAV flights were conducted. For each loop different environment (risk area) was chosen (urban fringe for Loop 1, Drava River shore for Loop 2 and the area between high traffic road and dense urban zone for Loop 3). UAV flights for the first loop were performed over an urban fringe area in the Municipality of Maribor. This area had been previously identified as high-risk based on the results of the LNOP risk assessment model. The objective of the flight was to evaluate the usefulness of UAVs for detecting new illegal waste dumping and abandonment sites (LNOP) and to verify the correspondence between model predictions and the actual on-site situation.
High-resolution aerial photographs were captured using UAVs, from which an orthophoto raster image was generated. The flight altitude ranged between approximately 50 and 60 m, enabling the production of orthophotos with a spatial resolution of about 2–3 cm per pixel. The total area covered by the flight was approximately 10.1 hectares. The flight and subsequent image processing followed the methodological framework detailed in Section 3.4, with early spring vegetation sparsity leveraged as a critical factor for improved visual detection of waste from the air.
Based on the analysis of the orthophoto imagery, three additional LNOP sites were identified within the surveyed area, confirming the effectiveness of the approach. These newly identified points were subsequently validated through visual interpretation and entered the database in accordance with the LNOP registry’s core data structure.
Figure 14 displays the orthophoto of the urban edge with three new LNOP sites. Each site is further highlighted using zoomed-in extracts that clearly depict the types of detected waste—ranging from construction and bulky waste to smaller illegally discarded fractions. Red arrows connect the precise locations on the orthophoto to their respective magnified insets.
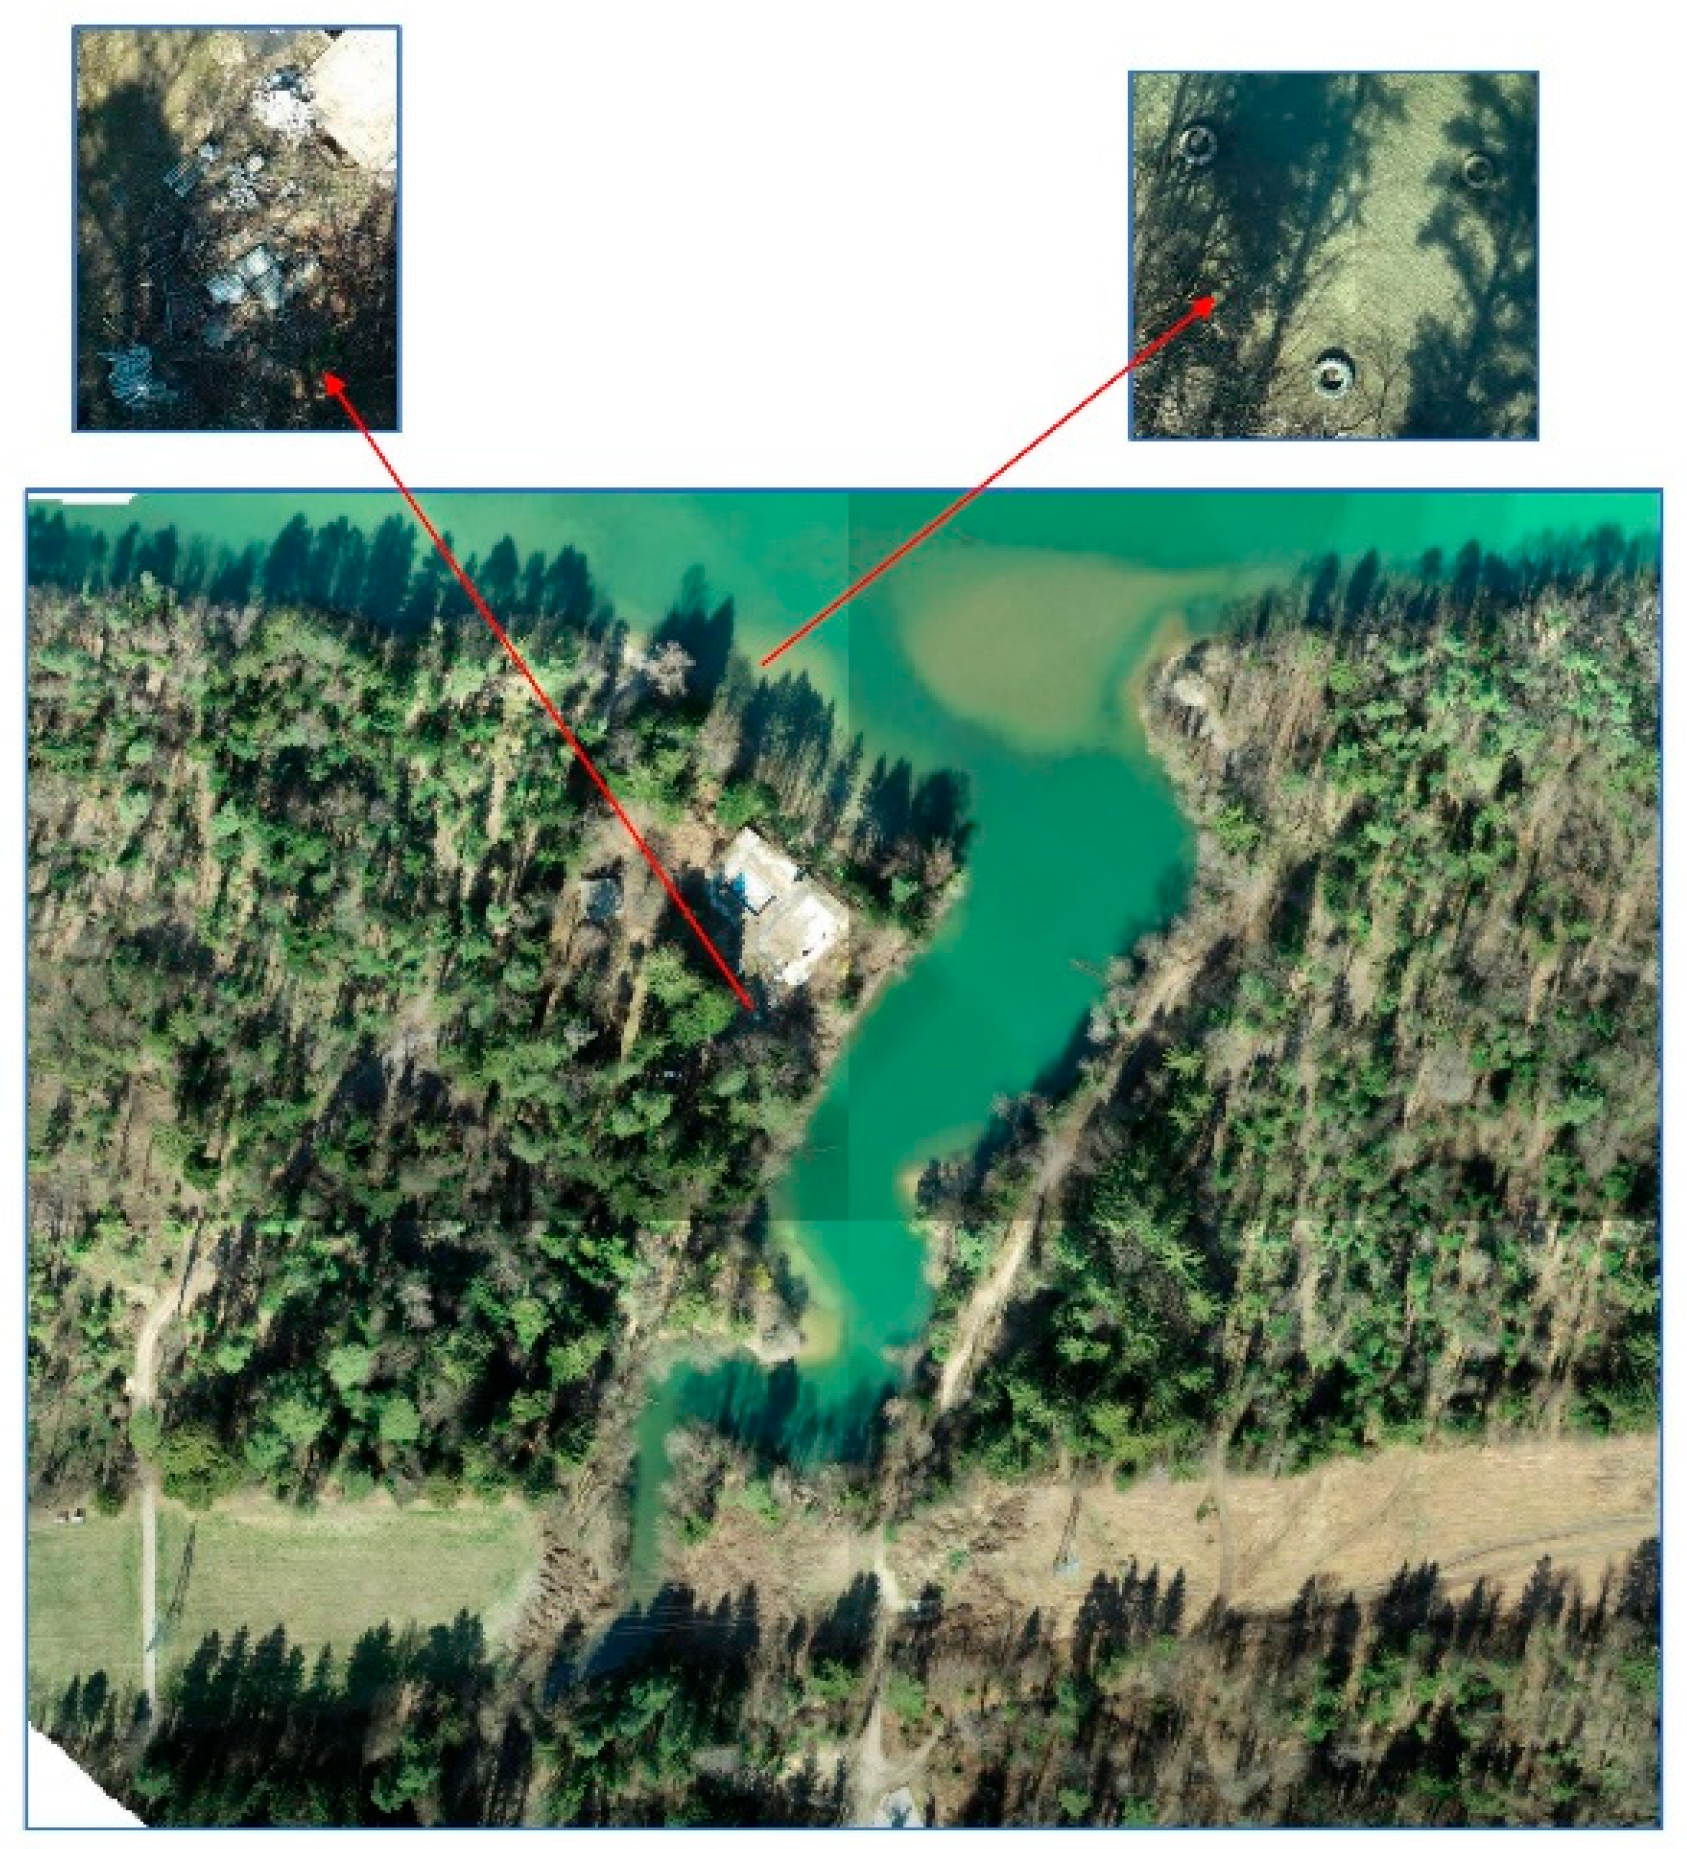
As part of the second iteration of the circular data feedback loop, a systematic UAV survey was conducted over an area along a branch of the Drava River in the western part of MOM. This is a transitional zone where forested land meets a water body, interspersed with remnants of abandoned building infrastructure—features that spatial models have identified as potentially high-risk for illegal waste dumping and abandonment (LNOP).
Using an UAV, an orthophoto raster image was generated for the entire area, covering approximately 14.5 hectares. Aerial imagery was captured at a flight altitude of about 60 m, resulting in a ground resolution of 4 cm per pixel—sufficient to detect environmental changes and visible traces of waste. After post-processing the images into a high-resolution orthophoto mosaic, a visual analysis was performed, which revealed the presence of two sites with distinct types of waste.
The first site contained scattered construction debris, predominantly composed of asbestos roofing material. This hazardous waste requires special handling and remediation procedures in accordance with environmental regulations. The site is in proximity to an abandoned structure, suggesting a likely link to discontinued construction activity or intentional illegal dumping.
The second site showed the presence of large truck or tractor tires that had likely been dumped over the riverbank and into the Drava River itself. Remarkably, the orthophoto image made it possible to identify the tires even though they were partially submerged, demonstrating the added value and effectiveness of the applied method.
Figure 15 shows the orthophoto raster of the entire area with both LNOP sites marked, and magnified insets provide a more detailed view of the identified waste types. The results of this second UAV flight confirm that the combination of UAV imaging and visual interpretation is an effective approach for detecting hazardous and large waste fractions—especially in spatially complex environments with limited direct accessibility.
Both sites were added to the central LNOP database, and the area was designated as a priority for further investigation and potential remediation, due to the type and sensitive location of the waste.
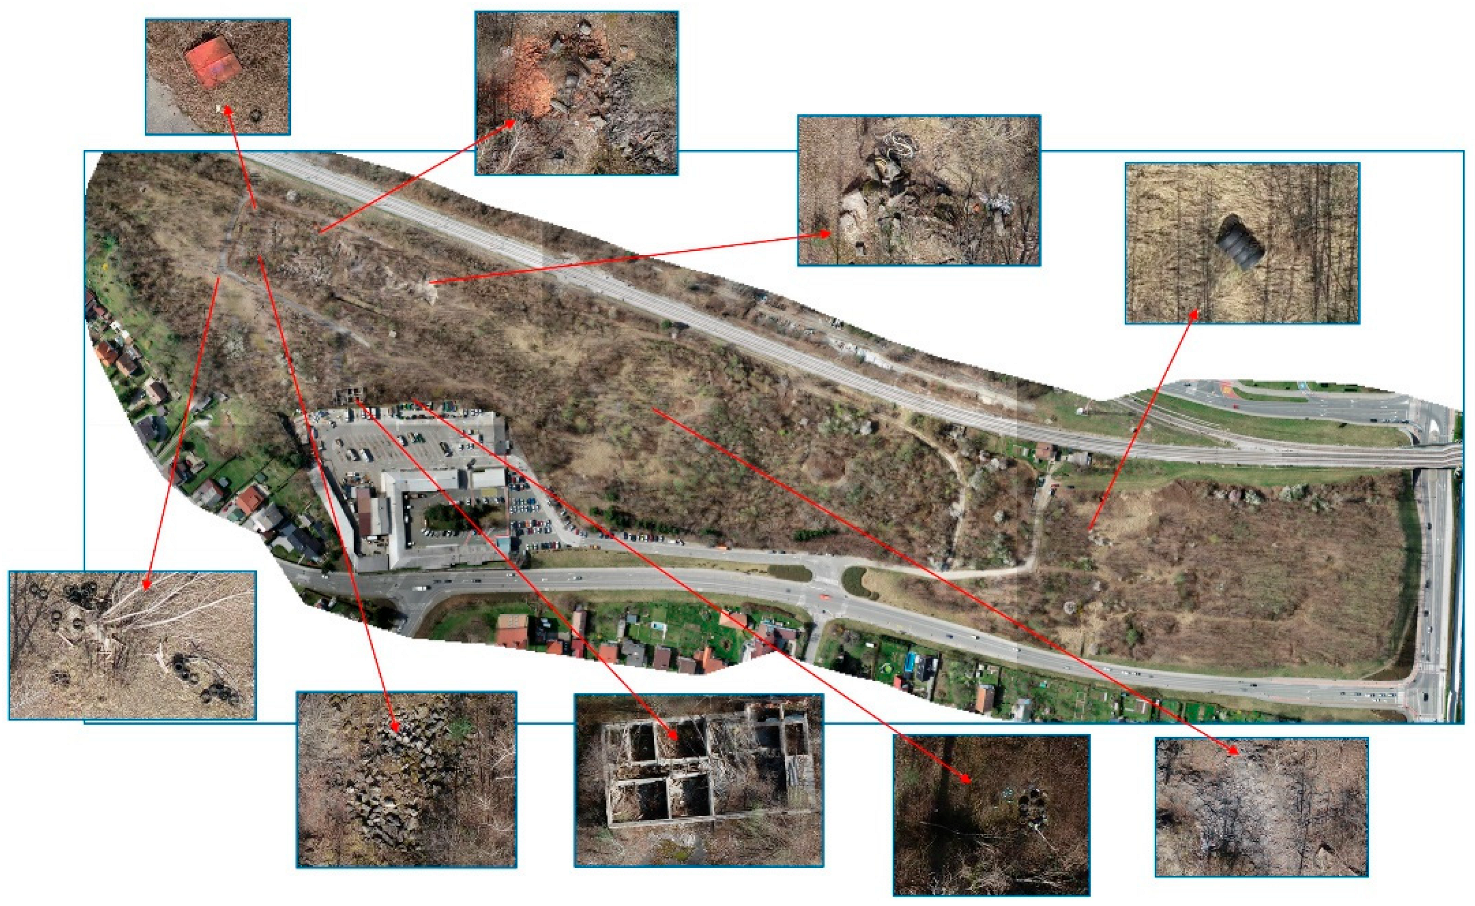
As part of the third phase of the circular data feedback loop, a UAV survey was conducted over an elongated area situated between a high-traffic road and a dense urban zone in the central part of MOM. Due to its combination of accessibility, abandoned surfaces, and partial visual concealment, the area had previously been identified through risk modelling as highly susceptible to illegal waste dumping and abandonment (LNOP).
Using UAV, an orthophoto raster composition was produced for the entire area, covering approximately 17.4 hectares. The images were captured under optimal lighting and vegetation conditions, enabling clear distinction of individual items and materials, including smaller waste fractions. Visual analysis of the high-resolution orthophoto imagery revealed spatial dispersion and diversity of LNOP throughout the area.
More than ten distinct LNOP sites were identified, comprising various types of waste. These include large volumes of construction debris, ruins of former structures, discarded bulky waste, large vehicle components, multiple tire clusters, and individual pieces of heavy equipment and industrial residue. Some of the waste is located directly along access roads or within forested vegetation, while others are found inside abandoned buildings or near infrastructure. The diversity of waste in terms of type and material condition suggests long-term presence and repeated dumping over time.
Figure 16 presents the full orthophoto raster of the area with all identified LNOP locations, supplemented by magnified insets that visually confirm the presence of various waste types. The image serves as a clear illustration of the scale and complexity of the problem in urban fringe zones.
The data from this UAV survey have been incorporated into the central database as the third input dataset and will be used to further refine the risk area model. Given the exceptional density and heterogeneity of observed dumping sites, this area will be classified as a high-intensity LNOP zone, warranting coordinated oversight, inspection, and potentially remediation efforts.
These results confirm that UAV technology is an effective tool for identifying hard-to-reach or otherwise overlooked LNOP locations and serves as a crucial complement to existing field survey methods. When comparing the traditional approach to detecting LNOP with the UAV-based approach, it becomes evident that there is a significant time saving in fieldwork in favor of UAV use. Equally important is the fact that this method enables the identification of locations in inaccessible areas that would otherwise be overlooked. However, it should also be recognized that in the case of UAV use, subsequent data processing is more time-consuming, whereas in the case of traditional field surveys, this is not required. In the future, this will be rationalized using automated data processing procedures and the introduction of AI algorithms for automatic recognition. Nevertheless, in critical or unclear cases, it will still be necessary to apply the traditional method and personally assess each individual case on site. Currently, it is estimated that, in terms of time spent and consequently cost, the use of UAVs is between two and four times more efficient than traditional field surveys.
As part of the research approach based on the circular data feedback loop methodology, three iterations were carried out to incrementally update the database of illegal waste dumping and abandonment sites (LNOP) within MOM. Each iteration—or loop—represents an upgrade of the previous phase in terms of data quantity and quality, applied methods, and spatial coverage. The purpose of comparing the loops is to evaluate the effectiveness of the overall concept in practice and to illustrate the gradual improvement of the risk assessment model. The specific characteristics of each data loop, in terms of collected and processed information, are presented in Table 1.
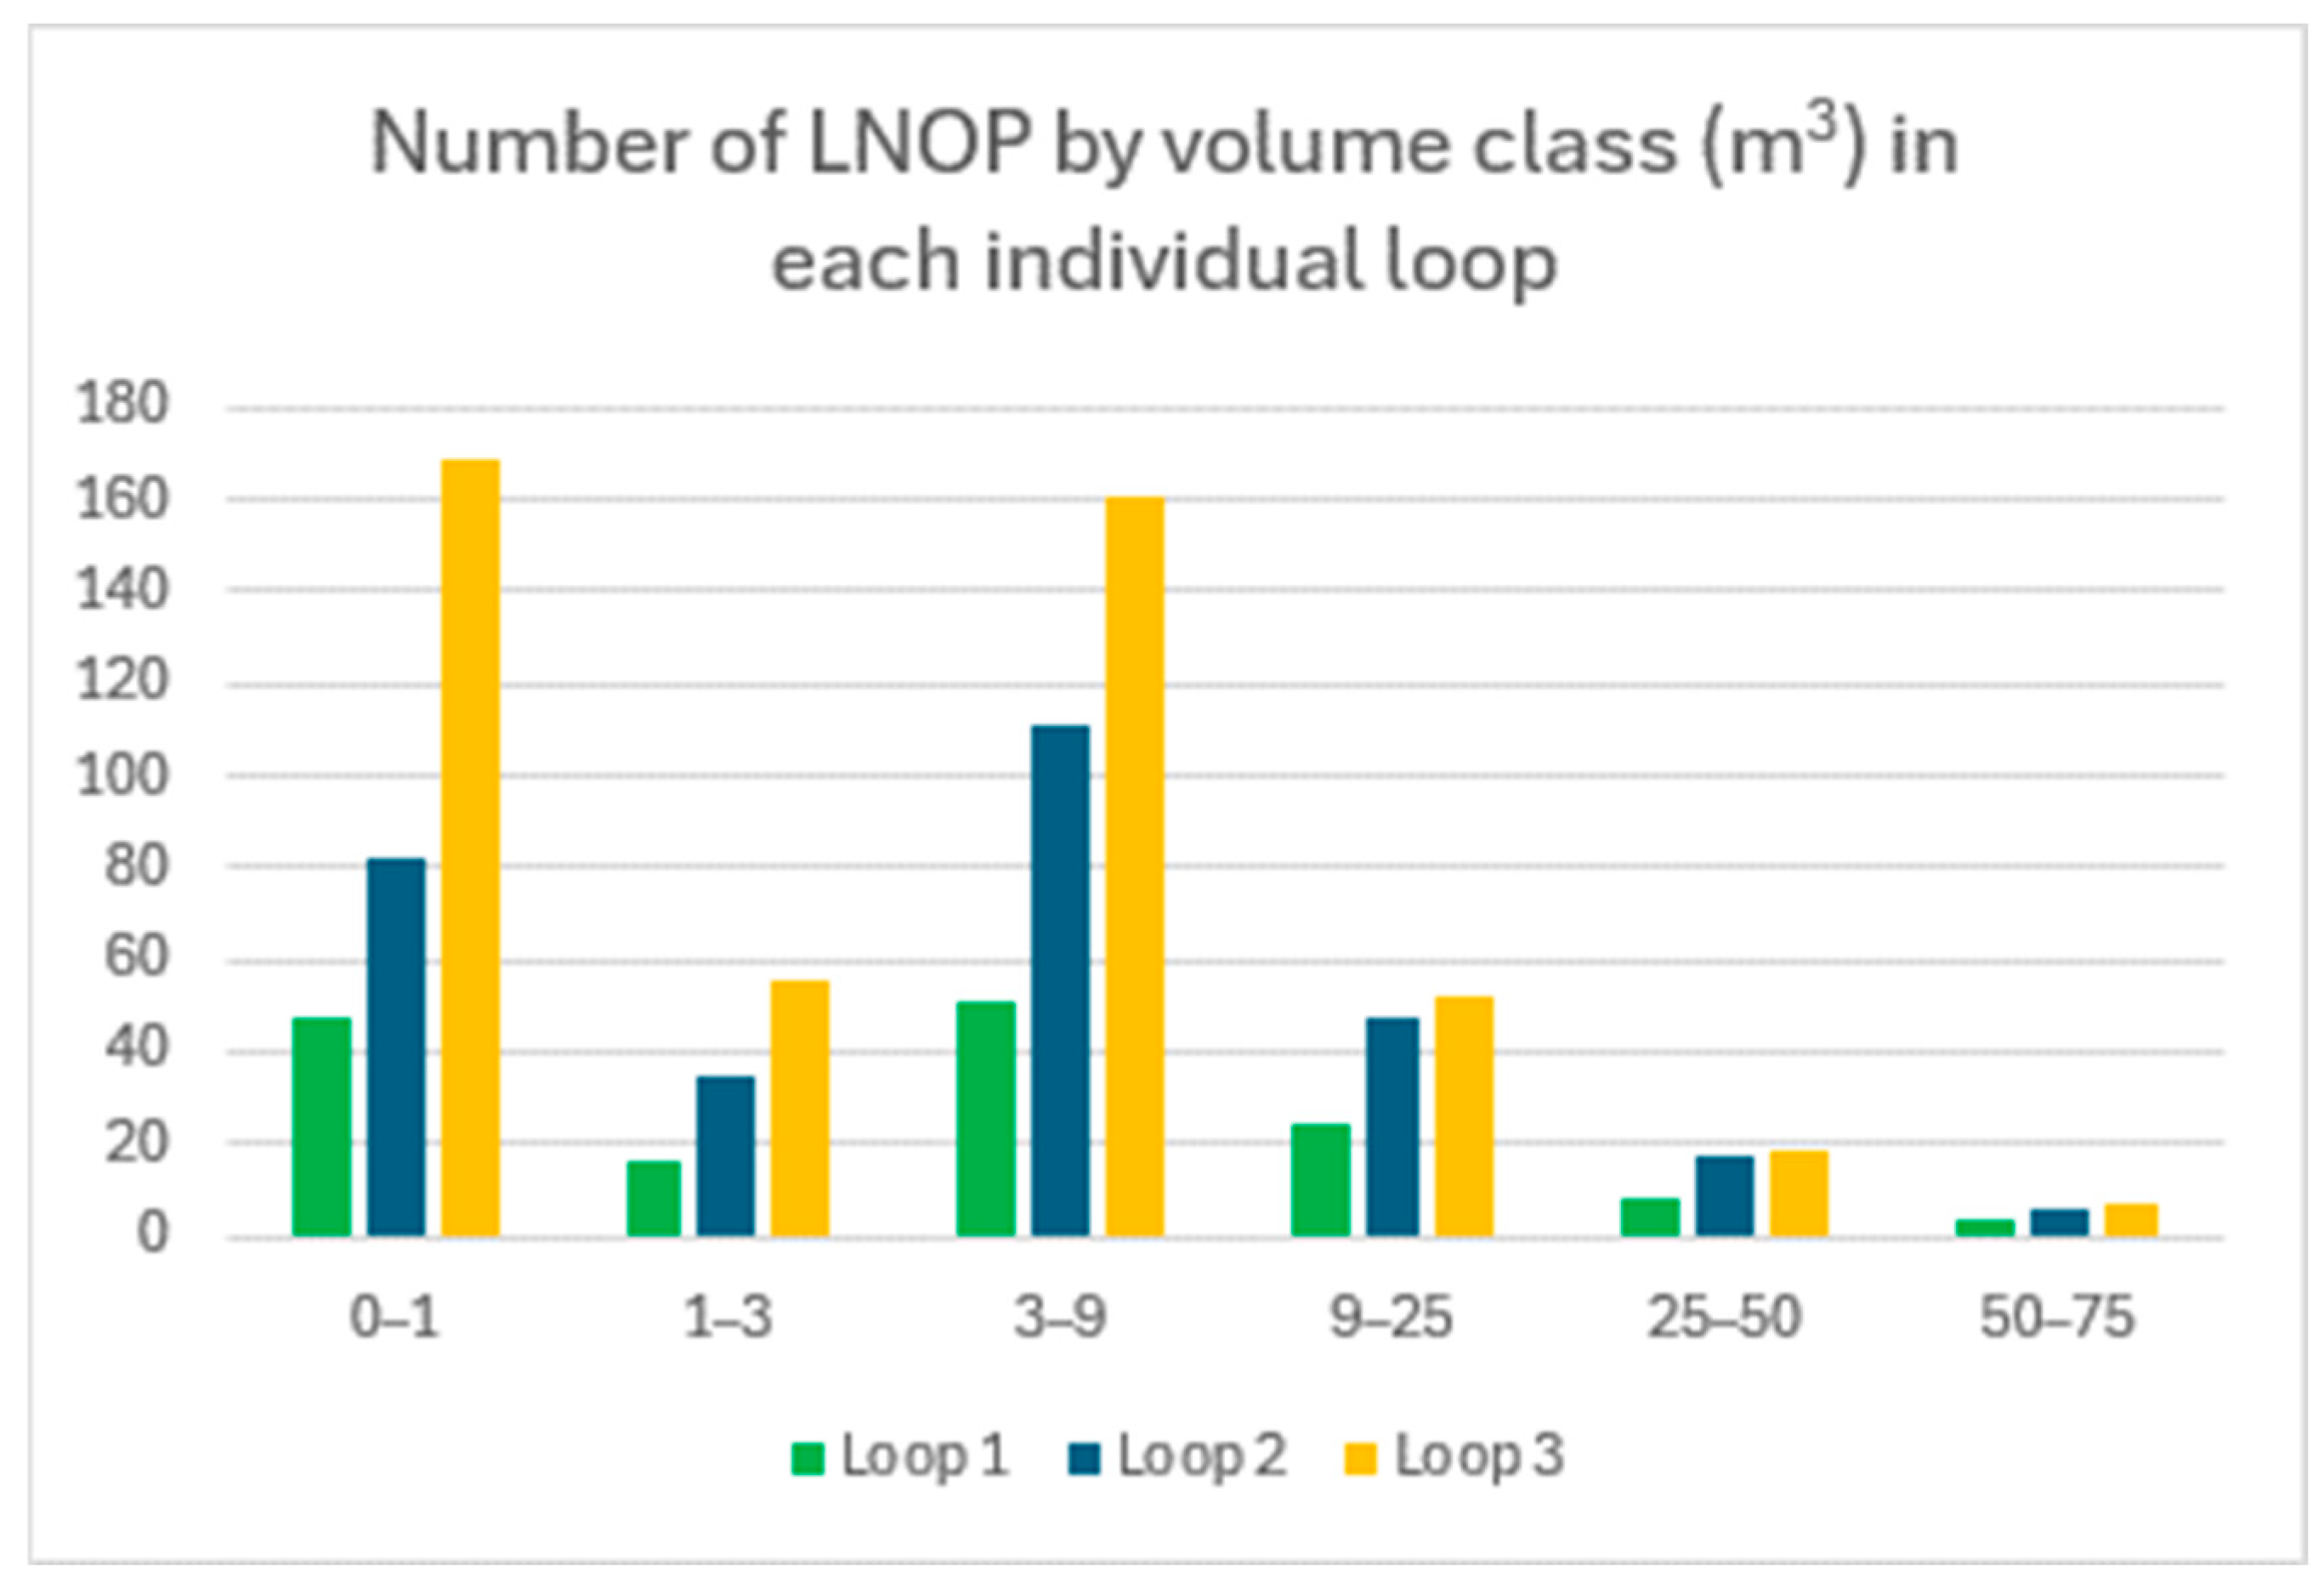
Table 2 and Figure 17 present the recorded illegal waste dumping sites (LNOP) from the perspective of their individual volume and distribution across volume classes. A comparison between loops reveals a very distinct trend of increasing numbers of smaller-volume LNOPs, while the number of larger-volume LNOPs has grown only marginally. This indicates that the most high-risk and environmentally burdensome locations were already identified in the initial phase of assessment, whereas the subsequently identified smaller-volume LNOPs are mostly the result of later illegal activities and, naturally, more detailed field inspections.
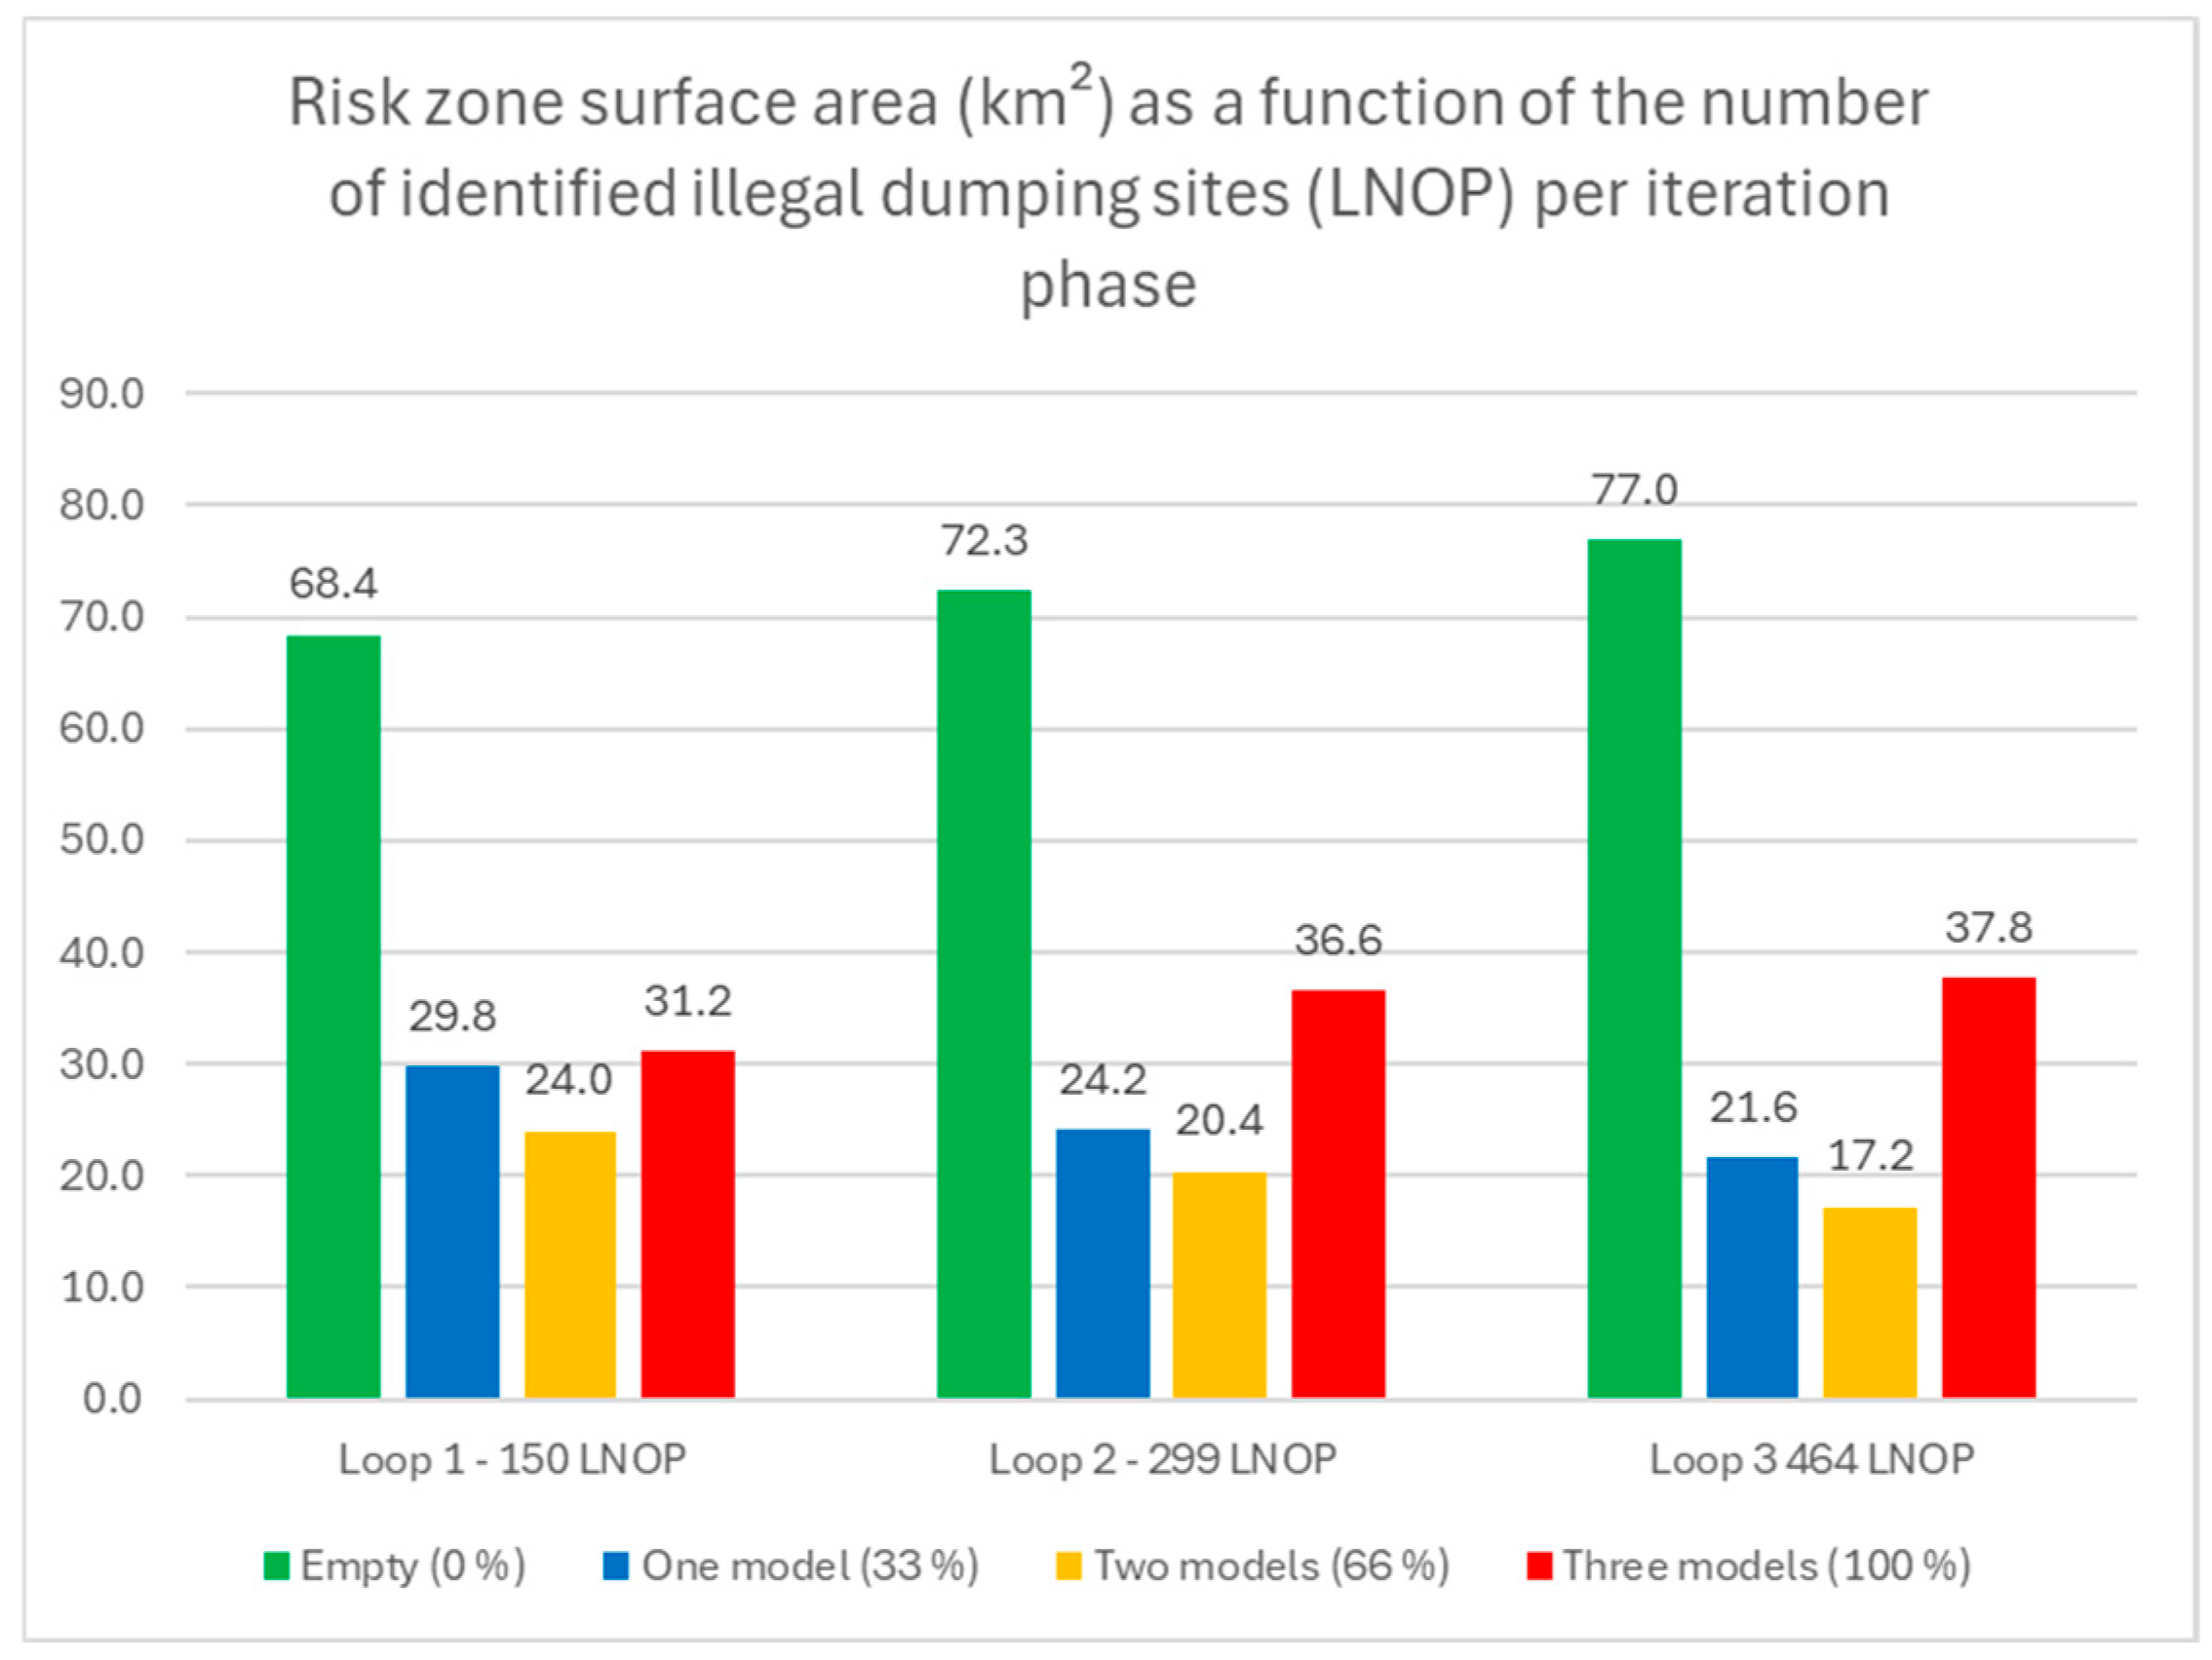
Figure 18 illustrates the surface area of risk zones (in km2), as defined by the risk assessment model, in relation to the number of known LNOP sites recorded in each iteration. The analysis of the graph shows a direct relationship between the number of identified LNOPs and the area assessed as having no risk of LNOPs occurrence, as well as with the area classified as having the highest probability of occurrence. In contrast, an inverse relationship is observed for areas with a lower probability of occurrence. Such distribution indicates an improvement in results with each successive iteration, as the exclusion of non-risk areas and the clear delineation of high-risk zones are crucial for the usability of data in subsequent field identification of new LNOPs. The observed trend reflects precisely this refinement—a clearer definition of the extreme classification levels (complete absence of LNOP and highest likelihood of occurrence). The results also confirm that a greater volume of high-quality data enables more stringent and effective modelling, which in turn allows for more precise targeting of spatial monitoring activities and subsequent remediation.
The results strongly support the effectiveness of the circular data feedback loop approach, as each new iteration contributes to increased spatial selectivity and reliability of the model. Importantly, the system is not solely focused on expanding the database, but rather on enhancing predictive performance through gradual validation, stakeholder involvement, and the use of advanced spatial analysis methods.
The iterative application of the circular data loop through three phases (Loops 1–3) demonstrated clear improvements in both data quality and spatial precision: LNOP locations were increased from 150 to 463 locations, estimated waste volume has increased from 1310 m3 to 2827 m3 and the area with no risk and the area with the highest level of risk were very clearly defined.
As additional confirmation of the approach, model performance was evaluated using the available LNOP data per loop with metrics appropriate for positive-unlabeled learning. Recall was estimated via bootstrap resampling positives and unlabeled locations, providing an assessment of the model’s ability to recover known high-risk areas. Quasi-AUC values were calculated using K-fold cross-validation, treating unlabeled samples in the test folds as negatives.
Table 3 shows the recall achieved by each loop iteration, illustrating consistent improvement across models, with the third-loop model recovering the highest proportion of known positive locations. Correspondingly, Table 4 presents the quasi-AUC values for the three loops, demonstrating that the ensemble models provide a strong ability to rank high-risk locations despite the absence of verified negatives.

5. Discussion

The conducted study demonstrated that it is possible to develop a robust and dynamic system for identifying areas with a higher risk of LNOP by combining spatial data, results of field surveys, and remote sensing analysis. A key role in this process is played by the circular data feedback loop concept, which enables continuous updating of databases and the reverse validation of predictions through fieldwork and integration into the digital registry.
The circular data loop functions as a dynamic learning mechanism in which newly updated datasets obtained in each iteration are continuously reintegrated into the prediction model of risk areas. Each iteration encompasses field inventories, UAV-based remote sensing, and application-supported handling of individual LNOP cases, which together serve to validate existing assumptions and recalibrate the model. This process enables a progressively more precise delineation of probability zones, thereby enhancing the detection of critical locations. By integrating heterogeneous sources—ranging from orthophoto imagery to inspection records, legal procedures, and observations provided by engaged individuals—the model evolves into a more comprehensive and context-sensitive decision-support tool. A key advantage of the circular data loop lies in the possibility of continuous development and the inclusion of new influential datasets, provided that their reliability, maintenance, and availability are comparable with those already integrated. In our approach, iterative model updates are performed using PU learning methods, which enable adaptive learning and continuous improvement of predictive accuracy. As a result, the updated risk maps not only provide more reliable forecasts but also directly support operational planning, guiding targeted inspections and UAV overflights. This confirms the transition of the model from a static analytical framework into an adaptive system that progressively strengthens the understanding of the drivers behind illegal waste dumping and disposal in the environment.
The modelling was based on a positive–unlabeled learning (PU learning) approach, where only known (positive) instances of LNOP are available, while the remaining dataset is unlabeled. This method is particularly suitable for environmental problems, where violation data are often incomplete and unevenly distributed. The models applied in this study successfully extracted influential factors and produced a probabilistic risk map covering the entire area of MOM. The spatial concentration of LNOP confirms an inverse relationship between the number of sites and the surface area of risk zones, as most identified cases fall within quadrants with the highest predicted probabilities. This supports a highly targeted approach that reduces monitoring costs while increasing overall effectiveness.
Findings clearly show that illegal waste disposal is not randomly distributed but is spatially and functionally conditioned. The most significant factors include the presence of degraded areas, distance from waste collection centers, vegetation density, terrain morphology, and degree of accessibility. These results are consistent with previous studies, which emphasize the importance of combining physical, social, and infrastructural variables.
Innovation lies in the use of multimodal spatial data layers, including:
  • Settlement patterns and house number density,
  • Public lighting infrastructure and power corridors,
  • Functionally degraded areas and land cover classes,
  • LIDAR-based terrain features and vegetation masks, and
  • Road and rail infrastructure.
This diversity enables a more comprehensive spatial analysis compared to previous studies that relied on a narrow set of predictors (e.g., population density, road proximity, and landfill distance) (e.g., [21,34]). Our approach considers topographic data from LIDAR (elevation models), the presence of rail infrastructure, the electricity grid, functionally degraded areas, and the density of public lighting, allowing for a more holistic understanding of spatial dynamics. The approach is thus more robust and scalable. As potentially influential datasets, socio-economic spatially linked variables (e.g., income level and educational structure) could also be introduced. However, such datasets, from a maintenance perspective, are not directly comparable to the other influential datasets used in this study, which are regularly and systematically updated. It is also important to note that, from a spatial perspective, such socio-economic contents could not be linked to individual housing units or other small spatial entities, but rather to the entire municipality, which in our case does not represent an added value.
The reduction in the surface area of high-risk zones—despite the increase in detected dumping sites—suggests that the predictive model is improving in spatial accuracy. Between Loop 1 and Loop 3, the number of recorded sites tripled, and waste volume more than doubled (+116%), affirming the method’s capacity for cumulative improvement. UAV surveys and targeted field inspections further validated the iterative enhancement of the model.
The approach offers strong potential for public-sector implementation:
  • Targeted monitoring: Municipalities and inspection bodies can use risk maps to optimize UAV inspections and enforcement operations.
  • Digital civic engagement: The EkoVaruh application enhances public participation, aligning with principles of participatory environmental governance (e.g., LIFE Restart).
  • Scalability and transferability: The model’s reliance on open-source tools and publicly available geospatial datasets makes it applicable across other Slovenian regions and transnational contexts (e.g., Northern Italy, Croatia, Austria and elsewhere).
Furthermore, the model could support the development of a regional environmental risk index to guide strategic planning, investment in remediation, and prioritization of enforcement efforts. The focus will be on developing models capable of distinguishing between various surface types and waste materials, considering variations in lighting conditions, seasonal changes, and environmental structure [53,54].
However, the modelling process is not without limitations. First, the input data are incomplete, as many LNOP sites remain unidentified—particularly in hard-to-reach areas or regions lacking active monitoring. Furthermore, data collection methods may introduce bias (e.g., self-reporting by citizens or targeted inspections). In addition, estimating the quantity and type of waste remains a challenge, as some attributes are based on subjective assessments. Most phases of the modelling process were limited to data from the MOM, meaning the approach is geographically constrained. The selected features and environmental variables were specifically tailored to the characteristics of this region; in other geographical contexts—such as coastal areas—different factors may be more relevant [34] and would require model adaptation.
Validation of the prediction model also presents a significant challenge due to the nature of the available data and the algorithms used. Since the dataset follows a positive-unlabeled (PU) structure—where only known illegal dumping sites are labeled and all other locations remain unlabeled—the absence of confirmed negative examples makes it difficult to objectively evaluate model accuracy using traditional validation methods (e.g., precision, F1). The algorithms employed (One-Class SVM, Isolation Forest, and the Elkan and Noto method) are specifically designed for scenarios where true negatives are unknown, but this also limits the possibility of robust cross-validation or ground truth comparison. Consequently, any assessment of model performance must rely on indirect evidence, expert interpretation, or future detection of new LNOP cases in predicted high-risk areas, which can then serve as post hoc validation. This methodological constraint is inherent to many real-world anomaly detection problems and remains a subject of ongoing research.
It is worth highlighting that the study area considered in this research is relatively small compared to other available studies, while the number of identified LNOP is exceptionally high [55,56,57,58]. This provides a solid foundation for the development of a highly detailed spatial control model.
Another important distinction from other studies lies in the basic assumptions regarding the size of individual LNOP. In the area of MOM only a smaller number of large-scale sites were identified, with the majority being small and best described as “micro” LNOP. Large-scale LNOP are locations where more than 9 m3 of waste has been detected and where it can be reasonably assumed that dumping or abandonment at the site has been recurrent. In contrast, other studies focus on significantly larger units for example, Rosa Jordá-Borrell et al. [58] define a lower size threshold of 2000 m2 per site [58], while Nissim Seror and Boris A. Portnov [57] analyze LNOP ranging from 6 tons to 13,600 tons (with an average of 1544 tons).
From a model performance perspective, it is also worth referencing the work of Lorenzo Carlos Quesada-Ruiz et al., who, similarly to this study, report a predictive accuracy exceeding 80% [55]. These findings support the conclusion that the present study is highly detailed and represents significant progress in terms of precision and methodological rigor.
Despite limitations, this study represents a significant contribution to the development of operational tools for environmental management. The risk map facilitates more efficient planning of interventions, targeted monitoring, and optimized resource allocation—particularly relevant for local communities with limited capacities. In the future, municipalities could use the described approach to systematically identify and prioritize high-risk areas for illegal dumping, schedule UAV monitoring flights in accordance with seasonal patterns, and integrate the results into municipal GIS platforms for real-time decision-making. This would enable faster response to emerging environmental issues, improve the effectiveness of enforcement measures, and support the development of long-term prevention strategies. As a key element, the introduction of a “system manager” role is envisaged, who would oversee all stakeholders and the subject matter, as well as the provision of dedicated budgetary resources to ensure the system’s continuous operation.

6. Conclusions

This contribution demonstrates that the integration of spatial data, remote sensing methods, and machine learning algorithms can provide a reliable tool for predicting areas with a higher risk of illegal waste dumping. The concept of a circular data feedback loop, which includes field inspections, digital recording, cartographic modelling, and continuous updates, enables a responsive, flexible, and accurate monitoring system for the occurrence of LNOP. An advantage of the model lies in its ability to continuously incorporate updated data inputs, leading to progressively more accurate identification of high-risk areas for potential illegal dumping sites.
The findings have direct applicability for spatial planning of monitoring efforts, resource allocation, and raising public awareness. The spatial concentration of LNOP confirms an inverse relationship between the number of identified locations and the risk surface area. A detailed commentary on the subject is provided in the “Results” chapter. This finding also derive from Figure 18 and the ratio between the surface area of zones identified as non-risk and the surface area of the highest-risk zones. The ratio described increases significantly with the implementation of the third loop compared to the first and second, indicating a trend towards a more targeted focus on clearly defined high-risk areas. This supports a highly targeted approach that reduces monitoring costs while increasing its effectiveness.
In future phases, the approach will be upgraded by integrating artificial intelligence methods, particularly deep neural networks such as convolutional neural networks (CNN). The goal is the automatic detection and classification of LNOP based on orthophoto and multispectral imagery, while accounting for contextual factors such as seasonal variation, vegetation dynamics, illumination, and spatial heterogeneity. These algorithms have the potential to significantly accelerate the analysis process and reduce dependency on manual operator input. Furthermore, it is also necessary to consider the possibility of upgrading through additional sensor technologies (e.g., LiDAR and multispectral sensors), aimed at providing Supplementary Data for volume estimation and waste type classification.
The combination of UAV technology with computer vision algorithms thus represents a promising direction for semi-automated or even fully automated detection of LNOP, which could substantially enhance monitoring efficiency and contribute to the reduction in such environmental violations.
Further development of the EkoVaruh application is also planned is also planned in next 12 months, with the introduction of AI functionalities, such as:
  • Automatic recognition of waste types and quantities, including total volume and the share of each waste type, based on uploaded photographs;
  • Intelligent prioritization based on environmental risk;
  • Geographic tasking of field inspection teams;
  • Integration with national-level GIS infrastructure.
For long-term effectiveness, a systemic approach at the national level will be essential. This includes the standardization of data structures, mandatory reporting obligations, and harmonized implementation of circular data feedback loops across all local communities. Only such an approach can ensure data consistency, result comparability, and the establishment of a robust national LNOP monitoring system. Also, public-sector engagement, targeted monitoring, visual inspections, EkoVaruh application improvement, application across other Slovenian regions and over the state border and more consistent citizen participation can be improved and intensified.
By integrating advanced geospatial analytics and citizen-driven reporting into a circular data loop, this approach provides a replicable model for sustainability monitoring and environmental risk governance at local and regional levels.

Supplementary Materials

The following supporting information can be downloaded at: https://www.mdpi.com/article/10.3390/su17188280/s1, Table S1: Basic data structure.

Author Contributions

Methodology, B.H.; Software, G.H. and M.B.; Validation, D.M. and R.K.; Formal analysis, G.H., M.B. and R.K.; Investigation, B.H., G.H., M.B. and R.K.; Resources, B.H.; Data curation, B.H.; Writing—original draft, B.H. and R.K.; Writing—review & editing, B.H., G.H. and R.K.; Visualization, B.H., G.H. and M.B.; Supervision, R.K.; Project administration, B.H. All authors have read and agreed to the published version of the manuscript.

Funding

Selected activities and content presented in this contribution have been partially funded by the integrated project “Boosting waste recycling into valuable products by setting the environment for a circular economy in Slovenia”, Project acronym LIFE IP RESTART, Grant Agreement number—LIFE20 IPE/SI/000021, which is co-financed by the European Union’s LIFE Programme.

Institutional Review Board Statement

Not applicable.

Informed Consent Statement

Not applicable.

Data Availability Statement

The data are available from the authors upon request.

Acknowledgments

We would like to express our sincere gratitude to the project partner Result d.o.o., who played a key role in the development of the application support “EkoVaruh”, which was successfully tested during the field inventory of illegal waste dumping locations (LNOP). We also acknowledge the contribution of Ecologists Without Borders (Ekologi brez meja), whose foundational work and data provided important input for shaping the methodological approach to the issue. Finally, we thank the City Municipality of Maribor for their support in providing access to relevant spatial datasets and for enabling collaboration within the framework of the “Čistilna akcija Maribor 2025” environmental campaign.

Conflicts of Interest

Author Borut Hojnik is employed at the company Javno podjetje Nigrad, komunalno podjetje, d.o.o., which is a project partner in the LIFE IP RESTART project, Grant Agreement number—LIFE20 IPE/SI/000021. Javno podjetje Nigrad, komunalno podjetje, d.o.o. consents to the use of data for this research. Other authors declare no conflicts of interest.

Abbreviations

The following abbreviations are used in this manuscript:
CNNConvolutional Neural Network
CRPCentral Population Register
EBMEcologist without Borders
FROFunctionally Degraded Areas
GISGeographical Information System
GURSGeodetic Administration of the Republic of Slovenia
LIDARLaser Imaging, Detection and Ranging
LNOPIllegal Waste Disposal Sites
MOMMunicipality of Maribor
OSMOpen Street Map
RSODReal-Time Small Object Detection
SLCASocial Life Cycle Assessment
SSDSingle Shot Multibox Detector
UAVUnmanned Aerial Vehicle
ZKGJIConsolidated Cadaster of Public Economic Infrastructure
ZVO-2Environmental Protection Act
YOLOYou Only Look Once

References

  1. European Parliament. Directive 2008/98/EC of The European Parliament and of the Council of 19 November 2008 on Waste and Repealing Certain Directives (Text with EEA Relevance). Available online: https://eur-lex.europa.eu/legal-content/EN/TXT/HTML/?uri=CELEX:32008L0098 (accessed on 7 July 2025).
  2. Vlada Republike Slovenije, Ministrstvo za Okolje in Prostor. Program Ravnanja z Odpadki in Program Preprečevanja Odpadkov Republike Slovenije. 2022. Available online: https://www.gov.si/assets/ministrstva/MOP/Operativni-programi/op_odpadki_2022.pdf (accessed on 17 May 2025).
  3. Chamizo-González, J.; Cano-Montero, E.I.; Muñoz-Colomina, C.I. Does Funding of Waste Services Follow the Polluter Pays Principle? The Case of Spain. J. Clean. Prod. 2018, 183, 1054–1063. [Google Scholar] [CrossRef]
  4. Panzone, L.; Ulph, A.; Areal, F.; Grippo, V. A Ridge Regression Approach to Estimate the Relationship between Landfill Taxation and Waste Collection and Disposal in England. Waste Manag. 2021, 129, 95–110. [Google Scholar] [CrossRef] [PubMed]
  5. Sirimewan, D.; Bazli, M.; Raman, S.; Mohandes, S.R.; Kineber, A.F.; Arashpour, M. Deep Learning-Based Models for Environmental Management: Recognizing Construction, Renovation, and Demolition Waste in-the-Wild. J. Environ. Manag. 2024, 351, 119908. [Google Scholar] [CrossRef]
  6. Alsheyab, M.A.T. Recycling of Construction and Demolition Waste and Its Impact on Climate Change and Sustainable Development. Int. J. Environ. Sci. Technol. 2022, 19, 2129–2138. [Google Scholar] [CrossRef]
  7. Etim, E. Leveraging Public Awareness and Behavioural Change for Entrepreneurial Waste Management. Heliyon 2024, 10, e40063. [Google Scholar] [CrossRef]
  8. van Ewijk, S.; Stegemann, J.A. Recognising Waste Use Potential to Achieve a Circular Economy. Waste Manag. 2020, 105, 1–7. [Google Scholar] [CrossRef]
  9. Kapoor, N.; Sulke, P.; Badiye, A. E-Waste Forensics: An Overview. Forensic Sci. Int. Anim. Environ. 2021, 1, 100034. [Google Scholar] [CrossRef]
  10. Mishra, P.; Kaviarasan, T.; Sambandam, M.; Dhineka, K.; Murthy, M.V.R.; Iyengar, G.; Singh, J.; Ravichandran, M. Assessment of National Beach Litter Composition, Sources, and Management along the Indian Coast-a Citizen Science Approach. Mar. Pollut. Bull. 2023, 186, 114405. [Google Scholar] [CrossRef]
  11. Mondal, S.; Mandal, B. Assessment of Urban Solid Waste Management in a Class II Indian City Using Geospatial and Statistical Approaches: A Case Study of Rampurhat Municipality. Waste Manag. Bull. 2024, 1, 74–92. [Google Scholar] [CrossRef]
  12. Vaverková, M.D.; Maxianová, A.; Winkler, J.; Adamcová, D.; Podlasek, A. Environmental Consequences and the Role of Illegal Waste Dumps and Their Impact on Land Degradation. Land Use Policy 2019, 89, 104234. [Google Scholar] [CrossRef]
  13. Kolenda, K.; Kuśmierek, N.; Kujawa, K.; Smolis, A.; Wiśniewski, K.; Salata, S.; Maltz, T.K.; Stachowiak, M.; Kadej, M. Bottled & Canned–Anthropogenic Debris as an Understudied Ecological Trap for Small Animals. Sci. Total Environ. 2022, 837, 155616. [Google Scholar] [CrossRef]
  14. Northern Ireland Environment Agency. NIEA Reveals Illegal Fly-Tipping Costs. Available online: https://www.daera-ni.gov.uk/news/niea-reveals-illegal-fly-tipping-costs (accessed on 21 March 2025).
  15. BigRentz. Illegal Dumping Facts and the Consequences of Carelessness. Available online: https://www.bigrentz.com/blog/illegal-dumping-facts?srsltid=AfmBOoopMnxvLK3aDtmJOZkAgVw6oO4IMBDWDwVnGY8kI4Bgq8ZB4fnz (accessed on 21 March 2025).
  16. Statista. Average Cost to Landfill Municipal Solid Waste in the United States in 2022 and 2023, by Region (in U.S. Dollars per Ton). Available online: https://www.statista.com/statistics/692063/cost-to-landfill-municipal-solid-waste-by-us-region/ (accessed on 13 June 2025).
  17. Locke, S.; Toma, M.; Beck, J. The Impact of Gunfire on Residential Property Values. Appl. Econ. 2024, 7, 297–314. [Google Scholar] [CrossRef]
  18. Ready, R.C. Do Land Fills Always Depress Nearby Property Values? J. Real Estate Res. 2010, 32, 321–339. [Google Scholar] [CrossRef]
  19. Lu, W. Big Data Analytics to Identify Illegal Construction Waste Dumping: A Hong Kong Study. Resour. Conserv. Recycl. 2019, 141, 264–272. [Google Scholar] [CrossRef]
  20. Persechino, G.; Schiano, P.; Lega, M.; Napoli, R.M.A.; Ferrara, C.; Kosmatka, J. Aerospace-Based Support Systems and Interoperability: The Solution to Fight Illegal Dumping. WIT Trans. Ecol. Environ. 2010, 140, 203–214. [Google Scholar] [CrossRef]
  21. Glanville, K.; Chang, H.C. Mapping Illegal Domestic Waste Disposal Potential to Support Waste Management Efforts in Queensland, Australia. Int. J. Geogr. Inf. Sci. 2015, 29, 1042–1058. [Google Scholar] [CrossRef]
  22. Santos, A.C.; Mendes, P.; Ribau Teixeira, M. Social Life Cycle Analysis as a Tool for Sustainable Management of Illegal Waste Dumping in Municipal Services. J. Clean. Prod. 2019, 210, 1141–1149. [Google Scholar] [CrossRef]
  23. Sliusar, N.; Filkin, T.; Huber-Humer, M.; Ritzkowski, M. Drone Technology in Municipal Solid Waste Management and Landfilling: A Comprehensive Review. Waste Manag. 2022, 139, 1–16. [Google Scholar] [CrossRef]
  24. Li, Z.; Wang, Y.; Zhang, N.; Zhang, Y.; Zhao, Z.; Xu, D.; Ben, G.; Gao, Y. Deep Learning-Based Object Detection Techniques for Remote Sensing Images: A Survey. Remote Sens. 2022, 14, 2385. [Google Scholar] [CrossRef]
  25. Silvestri, S.; Omri, M. A Method for the Remote Sensing Identification of Uncontrolled Landfills: Formulation and Validation. Int. J. Remote Sens. 2008, 29, 975–989. [Google Scholar] [CrossRef]
  26. Torres, R.N.; Fraternali, P. Learning to Identify Illegal Landfills through Scene Classification in Aerial Images. Remote Sens. 2021, 13, 4520. [Google Scholar] [CrossRef]
  27. Paunovic, S.; Krstic, F. GIS Application in the Spatial Analysis of Illegal Landfills in Big Cities: A Case Study of Belgrade. Glas. Srp. Geogr. Drus. 2014, 94, 41–54. [Google Scholar] [CrossRef]
  28. Griggilo, D. Automatic Building Detection from High Resolution Imagery for Maintenance of Topographic Data. Ph.D. Thesis, University of Ljubljana, Ljubljana, Slovenia, 2010. [Google Scholar]
  29. Bekker, J.; Davis, J. Learning from Positive and Unlabeled Data: A Survey. Mach. Learn. 2020, 109, 719–760. [Google Scholar] [CrossRef]
  30. Liu, F.T.; Ting, K.M.; Zhou, Z.H. Isolation Forest. In Proceedings of the 2008 Eighth IEEE International Conference on Data Mining, Pisa, Italy, 15–19 December 2008; pp. 413–422. [Google Scholar]
  31. Noumir, Z.; Honeine, P.; Richard, C. On Simple One-Class Classification Methods. In Proceedings of the 2012 IEEE International Symposium on Information Theory Proceedings, Cambridge, MA, USA, 1–6 July 2012; pp. 2022–2026. [Google Scholar]
  32. Elkan, C.; Noto, K. Learning Classifiers from Only Positive and Unlabeled Data. In Proceedings of the 14th ACM SIGKDD International Conference on Knowledge Discovery and Data Mining, Las Vegas, NV, USA, 24–27 August 2008; ACM: New York, NY, USA, 2008; pp. 213–220. [Google Scholar]
  33. Ekologi brez meja. Register Divjih Odlagališč. Available online: https://ebm.si/glavna/web/ (accessed on 15 April 2025).
  34. Matos, J. Dejavniki Prostorske Razporeditve Divjih Odlagališč Odpadkov. Doctoral Dissertation, University of Ljubljana, Ljubljana, Slovenia, 2015. [Google Scholar]
  35. Wikipedia. Mestna občina Maribor. Available online: https://sl.wikipedia.org/wiki/Mestna_ob%C4%8Dina_Maribor (accessed on 7 September 2025).
  36. Wikipedia. Slovenija. Available online: https://sl.wikipedia.org/wiki/Slovenija (accessed on 7 September 2025).
  37. Ministrstvo za Okolje in Prostor. Uredba o Odpadkih, Uradni List RS, Št. 77/22 in 113/23. Available online: https://www.uradni-list.si/_pdf/2022/Ur/u2022077.pdf (accessed on 9 April 2025).
  38. Mestna Občina Maribor Čistilna Akcija 2025–Moji Odpadki, Moja Skrb. Available online: https://maribor.si/mestni-servis/cisto-okolje/cistilna-akcija-2025-moji-odpadki-moja-skrb/ (accessed on 10 April 2025).
  39. Ministrtvo za Okolje, Prostor in Energijo. Pravilnik o Vsebini in Načinu Vodenja Zbirke Podatkov o Dejanski Rabi. Available online: https://eprostor.gov.si/ (accessed on 25 June 2025).
  40. Geodetska Uprava Republike Slovenije. E-Geodetski Podatki. Available online: https://www.e-prostor.gov.si/ (accessed on 15 May 2025).
  41. Geodetska Uprava Republike Slovenije. Zbirni Kataster Gospodarske Javne Infrastrukture. Available online: https://eprostor.gov.si/imps/srv/slv/catalog.search#/metadata/923dfad8-6172-4ffa-be2a-4436e26a8d78 (accessed on 18 June 2025).
  42. Open Street Map. Available online: https://www.openstreetmap.org/ (accessed on 18 June 2025).
  43. Ministrstvo za Naravne Vire in Prostor—Geodetska Uprava Republike Slovenije. Register Naslovov. Available online: https://www.e-prostor.gov.si/podrocja/prostorske-enote-in-naslovi/register-naslovov/ (accessed on 21 June 2025).
  44. Statistični Urad Republike Slovenije, SURS. Available online: http://www.stat.si/statweb (accessed on 22 May 2025).
  45. Slovenski INSPIRE Metapodatkovni Sistem. Centralni Register Prebivalstva. Available online: https://eprostor.gov.si/imps/srv/slv/catalog.search#/metadata/62d37025-7056-4b20-96c9-db267ec929e6 (accessed on 21 June 2025).
  46. Agencija Republike Slovenije za Javnopravne Evidence in Storitve—AJPES. Poslovni Register Slovenije. Available online: https://www.ajpes.si/registri/poslovni_register/splosno (accessed on 21 June 2025).
  47. Slovenski INSPIRE Metapodatkovni Sistem. Ciklično Lasersko Skeniranje. Available online: https://eprostor.gov.si/imps/srv/slv/catalog.search#/metadata/951eaa88-0f6b-4d29-8d02-eaf56534453e (accessed on 21 June 2025).
  48. Ministrstvo za Naravne Vire in Prostor—Geodetska Uprava Republike Slovenije. Dejanska Raba Zemljišč. Available online: https://www.e-prostor.gov.si/podrocja/parcele-in-stavbe/kataster-nepremicnin/?acitem=1714-2253 (accessed on 21 June 2025).
  49. Oddelek za Geografijo Filozofske Fakultete Univerze v Ljubljani. Funkcionalno Razvrednotena Območja. Available online: http://crp.gis.si/ (accessed on 21 June 2025).
  50. Kamnik, R.; Jelenko, S.D.; Perc, M.N. Applicability of Semi-pro Unmanned Aircraft System for Rapid Archaeological Documentation in Forested Areas. Archaeol. Prospect. 2022, 29, 229–241. [Google Scholar] [CrossRef]
  51. Government of the Republic of Slovenia. Uradni List Republike Slovenije UL Št. 195/20; Government of the Republic of Slovenia: Ljubljana, Slovenia, 2020; Volume 195. [Google Scholar]
  52. TrashOut. Available online: https://www.trashout.ngo/ (accessed on 23 June 2025).
  53. Cicala, L.; Gargiulo, F.; Parrilli, S.; Amitrano, D.; Pigliasco, G. Progressive Monitoring of Micro-Dumps Using Remote Sensing: An Applicative Framework for Illegal Waste Management. Sustainability 2024, 16, 5695. [Google Scholar] [CrossRef]
  54. Youme, O.; Bayet, T.; Dembele, J.M.; Cambier, C. Deep Learning and Remote Sensing: Detection of Dumping Waste Using UAV. Procedia Comput. Sci. 2021, 185, 361–369. [Google Scholar] [CrossRef]
  55. Quesada-Ruiz, L.C.; Rodriguez-Galiano, V.; Jordá-Borrell, R. Characterization and Mapping of Illegal Landfill Potential Occurrence in the Canary Islands. Waste Manag. 2019, 85, 506–518. [Google Scholar] [CrossRef]
  56. Tasaki, T.; Kawahata, T.; Osako, M.; Matsui, Y.; Takagishi, S.; Morita, A.; Akishima, S. A GIS-Based Zoning of Illegal Dumping Potential for Efficient Surveillance. Waste Manag. 2007, 27, 256–267. [Google Scholar] [CrossRef]
  57. Seror, N.; Portnov, B.A. Identifying Areas under Potential Risk of Illegal Construction and Demolition Waste Dumping Using GIS Tools. Waste Manag. 2018, 75, 22–29. [Google Scholar] [CrossRef]
  58. Jordá-Borrell, R.; Ruiz-Rodríguez, F.; Lucendo-Monedero, Á.L. Factor Analysis and Geographic Information System for Determining Probability Areas of Presence of Illegal Landfills. Ecol. Indic. 2014, 37, 151–160. [Google Scholar] [CrossRef]
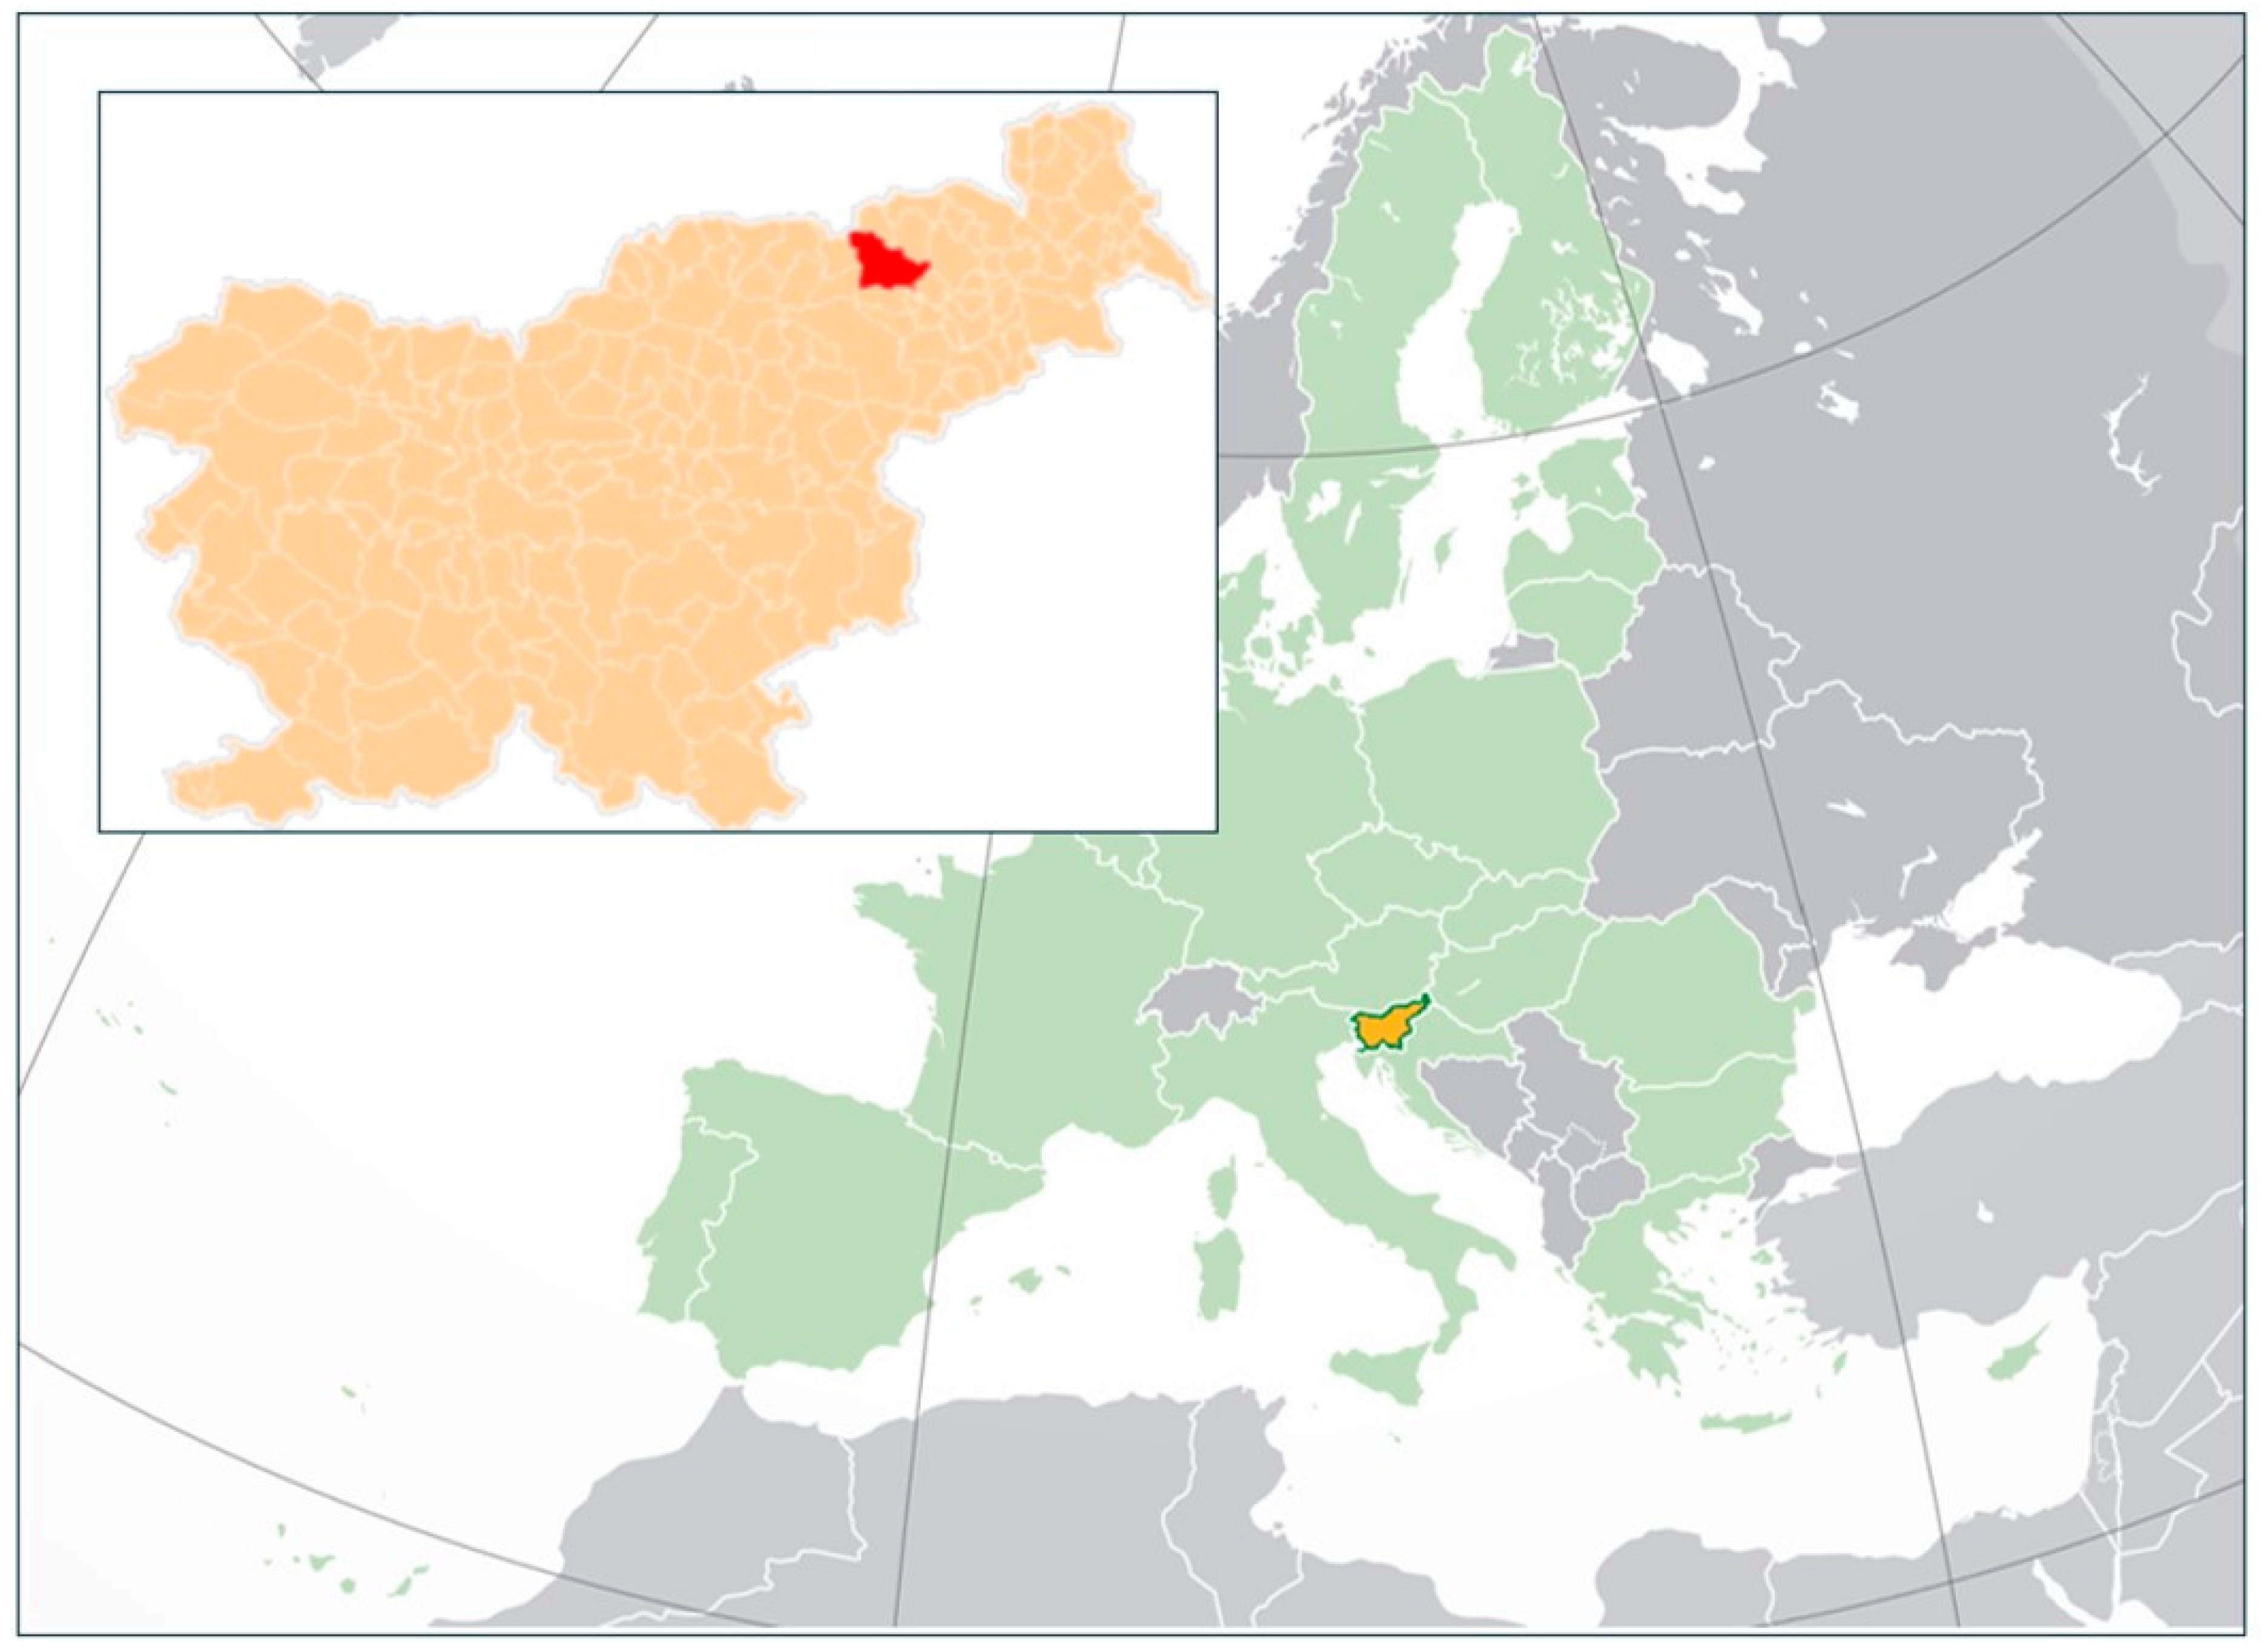
Figure 1. The geographical position of the City Municipality of Maribor (red) within Slovenia [35,36].
Sustainability 17 08280 g001
Figure 2. LNOP circular data environment.
Sustainability 17 08280 g002
Figure 3. Point locations of potential LNOP according to pre-analysis of predictive model.
Sustainability 17 08280 g003
Figure 4. Most critical quadrants according to pre-analysis of predictive model.
Sustainability 17 08280 g004
Figure 5. Inspected quadrants by students in year 2025 (Open Street Map in background).
Sustainability 17 08280 g005
Figure 6. Newly discovered locations.
Sustainability 17 08280 g006
Figure 7. Example of model output for a selected area: light red indicates medium—high-risk zones (P = 2/3), while dark red represents high-risk zones (P = 1) for LNOP occurrence (background: Google Maps).
Sustainability 17 08280 g007
Figure 8. Loop 1—existing LNOP locations in MOM (first dataset); obtained from EBM.
Sustainability 17 08280 g008
Figure 9. Loop 1—a prediction model using machine learning algorithms showing risk areas after first dataset.
Sustainability 17 08280 g009
Figure 10. Loop 2—LNOP locations in MOM (second data loop); obtained from EBM + field survey.
Sustainability 17 08280 g010
Figure 11. Loop 2—a prediction model using machine learning algorithms showing risk areas after second dataset.
Sustainability 17 08280 g011
Figure 12. Loop 3—LNOP locations in MOM (third data loop); obtained from EBM, field survey, campaign and student work.
Sustainability 17 08280 g012
Figure 13. Loop 3—a prediction model using machine learning algorithms showing risk areas after third dataset.
Sustainability 17 08280 g013
Figure 14. One example of an orthophoto of the urban edge with three new LNOP sites—after loop 1.
Sustainability 17 08280 g014
Figure 15. One example of an orthophoto of the Drava River with two new LNOP sites—after loop 2.
Sustainability 17 08280 g015
Figure 16. One example of an orthophoto of a large area with a high concentration of diverse LNOP sites—after loop 3.
Sustainability 17 08280 g016
Figure 17. Number of LNOP by volume class (m3) in each individual loop.
Sustainability 17 08280 g017
Figure 18. Comparison of risk area model results by data loop.
Sustainability 17 08280 g018
Table 1. Comparison of loop iterations in the context of LNOP registry development.
LoopTime FrameData SourceNumber of LNOPEstimated (Recorded) Waste Quantity (m3)Recording Method
12010–2018EBM1501.310Volunteers field records
2Spring of 2024Primary field survey conducted independently, enriched with supplementary information provided by the intermunicipal inspectorate and representatives of the local community2992.313Validation of prior entries, field inspection, and systematic documentation of existing and newly detected LNOP, with UAV-assisted support
3Spring of 2025Data obtained through the “Maribor 2025” cleanup campaign and student field exercises4632.827On-site recording of LNOP using a purpose-built application, with supplementary UAV support
Table 2. Number of LNOP by volume class (m3) in each individual loop, including the increase in number between loops within each class.
Volume Class (m3)Loop 1Difference Between Loop 1 and Loop 2Loop 2Difference Between Loop 2 and Loop 3Loop 3
0–147358287169
1–31619352055
3–9516011150161
9–25242448452
25–508917219
50–7542617
Table 3. Recall (±standard deviation) across loops based on bootstrap resampling of positives and unlabeled samples.
Validation Data
Loop 1Loop 2Loop 3
Training data—Loop 1 64.7 (±4.7) 59.9 (±4.9)63.9 (±5.6)
Training data—Loop 274.0 (±3.5) 80.9 (±3.3) 82.7 (±3.9)
Training data—Loop 374.0 (±3.8)79.9 (±3.3) 84.5 (±3.0)
Table 4. Quasi-AUC for each loop iteration based on K-fold cross-validation of ensemble model scores.
Quasi-AUC (%)
Loop 181.2 (±0.22)
Loop 282.7 (±0.21)
Loop 384.1 (±0.13)
Disclaimer/Publisher’s Note: The statements, opinions and data contained in all publications are solely those of the individual author(s) and contributor(s) and not of MDPI and/or the editor(s). MDPI and/or the editor(s) disclaim responsibility for any injury to people or property resulting from any ideas, methods, instructions or products referred to in the content.