Article

A Multi-Expert FQFD and TRIZ Framework for Prioritizing Multi-Capital Sustainability KPIs: A Smallholder Case Study

1
Energy Applications and Renewable Energy Efficiency Laboratory (LAPER), Faculty of Sciences of Tunis, University of Tunis El Manar, Tunis 1068, Tunisia
2
Analysis, Conception and Control of Systems Laboratory (LR11ES20), National Engineering School of Tunis, Tunis El Manar University, Campus Farhat Hached, Tunis 1002, Tunisia
3
Optimization, Logistics and Decision Support Systems Laboratory (OLID), Higher Institute of Industrial Management, University of Sfax, Techno-Park of Sfax, Road of Tunis Km 10.5, Sfax 3021-BP 1164, Tunisia
*
Author to whom correspondence should be addressed.
Sustainability 2025, 17(18), 8277; https://doi.org/10.3390/su17188277
Submission received: 31 July 2025 / Revised: 25 August 2025 / Accepted: 1 September 2025 / Published: 15 September 2025

Abstract

Smallholder farmers, key actors in agri-food supply chains, still face persistent challenges in applying sustainability strategies due to limited resources, context variability, and weak-performance monitoring systems. Their multidimensional needs, across economic, environmental, and social domains, are frequently inadequately captured by traditional key performance indicators (KPIs). This paper proposes an innovative framework to prioritize KPIs tailored to smallholders by integrating a multi-capital approach with expert-based and contradiction-resolving methods. A five-phase methodology is developed that combines Multi-Expert Fuzzy Quality Function Deployment (FQFD) and the Theory of Inventive Problem Solving (TRIZ). Expert input and field data identified 30 KPIs, narrowed to 19 via a capital-constrained algorithm; TRIZ resolved key contradictions like global warming versus land use efficiency. Expert input and field data are used to identify the sustainability capitals and KPIs, which are then ranked using FQFD and filtered using a capital-constrained algorithm. TRIZ is then used to address contradictions between indicators. Applied to a case study, the framework successfully identified a ranked, coherent set of sustainability KPIs. The sensitivity analysis confirmed the stability of the prioritization. TRIZ offered innovative solutions to trade-offs between key indicators (such as environmental impact versus productivity). This is the first known integration of FQFD and TRIZ in sustainability KPIs for smallholders. This approach is adaptable and replicable within similar agricultural contexts, thereby allowing informed and context-sensitive planning for sustainability. It provides actionable insights to guide smallholder-focused agricultural policies globally.

1. Introduction

Smallholders, the backbone of global food systems, are indispensable in food production and are the main actors in the agri-food supply chain (AFSC) [1]. Yet, they face major systemic challenges, such as limited access to resources, climate variability, market instability, and environmental degradation [2]. The nature and intensity of these constraints vary greatly from one region to another, depending on the size of the farms and the type of crops cultivated, thereby complicating the definition of sustainable strategies [3]. Against this backdrop, the sustainability and resilience of these farms can be strengthened through a rigorous assessment of their current state. Such assessment calls for a highly rigorous identification of key performance indicators (KPIs) specifically tailored to the realities and challenges faced by the smallholders. As stated by Vanlauwe et al. [4], the current frameworks for sustainability, in most instances, use common KPIs, which are not well-suited to cover the great variance in conditions among smallholders. Hence, there is the need to develop context-specific KPIs that consider a smallholder’s realities and have useful implications in terms of decision-making, ensuring that these indicators are usable and relevant [5]. In this context, well-defined KPIs not only enable a better understanding of compliance activities at the local level within the framework of international sustainability goals but also help evaluate their performance and enhance the resilience of smallholders [6]. However, selecting sustainability KPIs and prioritizing them constitutes a challenge for smallholders, essentially because of that variation between contexts—socio-economic and ecological [7]. Although KPIs play a vital role in guiding strategic planning and monitoring performance, smallholders often find themselves without tools that help them prioritize indicators suited to their specific challenges. Most existing sustainability frameworks overlook the day-to-day realities these farmers face, offering KPIs that are too generic, hard to implement, or disconnected from practical decision-making on the ground. Above all, one needs to have indicators that are relevant to local constraints as well as high-level development objectives. Most importantly, the indicators should be operational in such a way that they translate raw data into insights about productivity, resilience, and profitability [8,9].
This paper aims to propose a tool for prioritizing sustainability KPIs for decision-makers to tackle some of the concerned challenges while keeping in view two important dimensions:
(i)
The multi-capital approach to sustainability, which provides a macro-view for the assessment of value created through recognizing the interdependence of different types of capitals, such as financial, natural, human, social, and intellectual, therefore, facilitating a more balanced view of long-term trade-offs and synergies [10,11].
(ii)
The context-specific constraints are particularly relevant in ecologically and institutionally sensitive regions, in which sustainability assessments rely on expert knowledge and adaptive methods rather than standardized indicators to ensure relevance and feasibility [5].
To this end, multi-expert Fuzzy Quality Function Deployment (FQFD) and Theory of Inventive Problem Solving (TRIZ) have been developed. The classical QFD method, an approach that systematically translates customer needs into technical characteristics, was first developed by Akao [12]. FQFD extends this method by incorporating fuzzy logic to address the uncertainties and subjectivities associated with expert judgments to have more robust translations of smallholders’ needs to measurable KPIs [13]. TRIZ, developed by Altshuller [14], is a knowledge-driven methodology that resolves systemic contradictions by applying inventive principles derived from patent analysis. In this context, TRIZ is able to help solve all contradictions associated with sustainability objectives through context-dependent innovative strategies [15]. This is the reason why this paper advocates the integration of these two complementary approaches; thus, this paper contributes to the development of a decision support framework on the issues of the priority of KPIs against real-world constraints specific to smallholders.
In summary, this paper aims to develop a robust and adaptable framework to assist smallholders in prioritizing multi-capital sustainability KPIs that take into account both local conditions and broader sustainability objectives. Three research questions will serve as a guide for this:
Q1.
How can multi-capital KPIs be effectively prioritized while considering their interdependencies across various forms of capital?
Q2.
What major contradictions arise among KPIs, and how do these affect the consistency of sustainability assessment?
Q3.
What recommendations are there to deal with and resolve these contradictions?
Building on these research questions, this work is novel in that it combines FQFD and TRIZ to develop a structured framework that not only prioritizes multi-capital sustainability KPIs but also helps resolve contradictions between them. By enhancing methodological robustness and offering useful recommendations for smallholders, this combined approach supports more flexible and context-sensitive agricultural sustainability strategies.
The rest of the paper is organized as follows: Section 2 provides a review of the relevant literature; Section 3 explains the research methodology; Section 4 presents the empirical case study conducted in Tunisia; Section 5 illustrates the main findings and discusses them as well as their implications for smallholder resilience; and Section 6 concludes with key insights and suggestions for future research.

2. Literature Review

To date, no comprehensive work has developed a definitive framework for selecting multi-capital KPIs specifically tailored to smallholders by combining the FQFD and TRIZ methodologies. Existing evaluation and comparison studies in the literature have predominantly focused on single-capital indicators or have addressed sustainability assessment without explicitly considering the interdependencies and contradictions among multiple capitals and/or indicators.
In order to clarify the added value of the proposed approach and set it within the current field of research, we present a synthesis of related works that apply different methods in the context of sustainability assessment, with a particular focus on smallholders. This synthesis is summarized in Table 1. Each method is evaluated based on its decision-making technique, the sustainability dimensions addressed (economic, environmental, social), and the extent to which a multi-capital perspective is integrated. In this context, the column “Smallholder Focus” uses the following notation: approaches with no reference to smallholders are labeled “No”, those addressing smallholders in a generic way are marked “Partial”, and only those explicitly designed to meet smallholder-specific needs are labeled “Yes”. Although many efforts have been made to develop relevant tools for selecting and prioritizing KPIs in agriculture, the literature still highlights three major limitations, especially when it comes to addressing the specific needs of smallholders. Although a number of studies have used these approaches in agricultural and food systems, none have specifically addressed how multi-capital sustainability KPIs that are adapted to smallholder realities should be considered. This overview identifies a critical gap that our framework aims to address by integrating FQFD and TRIZ to prioritize KPIs and generate innovative ideas and recommendations across multiple sustainability capitals.
First, although QFD and FQFD have been applied in various agri-food contexts, from olive oil production [16] to dairy logistics [17], few studies consider smallholders’ specific constraints, and none offer a comprehensive view that brings in the economic, environmental, and social dimensions simultaneously with the multi-capital sustainability perspective. Moreover, its application is often limited to the House of Quality (HOQ) stage, rather than supporting holistic sustainability decisions. HoQ provides a structured cause-and-effect framework that connects smallholder requirements to KPIs, allowing for the methodical prioritization and coordination of several goals. Its adaptability to various domains shows how this mechanism directs the incorporation of various criteria and smallholder viewpoints [18]. In assessments of multi-capital sustainability, HoQ facilitates the identification of interdependencies and potential trade-offs among economic, environmental, and social KPIs.
Second, although TRIZ has shown much success in engineering and manufacturing, its application in agriculture remains limited. Its applicability is still restricted to technical problem-solving for specific issues in the industry, such as equipment design [19], although some have pointed out its relevance in developing contexts such as smallholder farming and resource-constrained environments [20]. This has not yet been assessed in relation to multi-capital sustainability [21].
Third, many existing approaches lack the practical features needed to effectively support smallholder decision-making. Numerous approaches have been used to select KPIs, including SMART frameworks [22], statistical tools like PCA [23], participatory approaches like SHARP [24], and MCDM techniques like the analytic hierarchy process (AHP), TOPSIS, and VIKOR [25,26]. However, these approaches often fail to consider modifying the context-specific requirements and resource constraints of smallholders. Fuzzy logic has increasingly been used to deal with imprecision in expert assessments to overcome these difficulties. There has been evidence of added value in hybrid models that combine FQFD with other techniques, such as in eco-design [27], lean supply chains [28], or food safety [29]. Nevertheless, none of these models have been specifically developed for smallholder contexts with a focus on multi-capital interdependencies.
Beyond methodological aspects, the multi-capital approach to sustainability also raises theoretical debates. While it provides a holistic view by considering economic, social, natural, human, and intellectual capitals together, its practical use faces challenges, such as measurement difficulties and the risk of oversimplifying complex interactions [10]. Recent research has pointed to the need for methods that are context-specific and adaptive to circumstances, increasingly relying on participatory approaches and fuzzy reasoning [11]. Our previous systematic review [30] highlighted important gaps in agri-food sustainability indicators, particularly in capturing interdependencies among capitals and accounting for smallholder realities; these insights guided the design of the FQFD–TRIZ framework, which combines expert judgment, fuzzy logic, and inventive principles to provide a more relevant and context-sensitive sustainability assessment for smallholders.
In summary, this paper contributes in three major ways. First, it proposes a KPI prioritization approach that integrates multiple expert judgments, particularly from policymakers, with the local realities of smallholders, while explicitly addressing uncertainty through fuzzy logic, to improve the realism of the decision-making process. Secondly, the proposed approach is based on an in-depth case study in Tunisia and demonstrated its robustness and applicability when extrapolated to other regions with similar conditions, such as the Mediterranean region, through sensitivity analysis. Thirdly, the proposed method combines FQFD and TRIZ, two approaches that are rarely used in sustainability assessments. FQFD facilitates the selection and prioritization of relevant KPIs, while TRIZ addresses and resolves contradictions among these KPIs. By integrating the interrelated dimensions emphasized in the multi-capital approach, the framework provides a comprehensive evaluation of smallholders’ sustainability performance within AFSC.
Table 1. Related works on QFD/FQFD and TRIZ applications for multi-capital sustainability KPIs.
Ref.MethodFuzzy
Logic
Smallholder
Focus
Sustainability Dimension
(E/Ev/S)
Multi-Capital PerspectiveContribution
[16]QFD NoE, Ev Optimization of olive oil quality via agronomic and organoleptic parameters.
[29]QFD + AHP*NoE Technical and hygiene prioritization in bread production.
[31]QFD PartialE Tractor brake design improvement based on user feedback.
[32]QFD PartialE, Ev, S Fragmented QFD use and sustainability limitations in agribusiness.
[27]QFD*NoE, Ev, S Industry 4.0 for sustainable product disassembly.
[28]QFD*NoE, Ev Enhancement of lean attributes in AFSC.
[17]QFD*NoE Dairy supply chain strategy definition.
[33]QFD*NoE Collaborative quality design in supply chains.
[20]TRIZ No- Efficiency improvements in agricultural equipment.
[22]Morphological Analysis + TRIZ PartialE, Ev, S Sustainable product design under constraints.
[34]fuzzy AHP + FMABAC*PartialE, Ev, S Prioritized sustainability criteria and ranked dairy farmers
[35]MDS + AHP NoE, Ev, S Sustainable corn area planning integrating ecological, economic, and social criteria.
[36]TRIZ + Extenics PartialE, Ev In situ tilling plow conceptual design.
This paperFQFD + TRIZ *YesE, Ev, S*Prioritizing multi-capital KPIs for smallholders and resolving contradictions among KPIs.
Note: Ev: environmental; E: economic; S: social. * Indicates the application of fuzzy logic in the method and/or the consideration of a multi-capital perspective.

3. Materials and Methods

The objective of this paper is to identify and prioritize multi-capital sustainability KPIs tailored to the specific requirements of smallholders. This study is grounded in existing research and contributions in the field [11,30,37,38,39,40]. For this purpose, a five-phase approach was developed, as illustrated in Figure 1. Phase 1 includes a preliminary study to determine relevant sustainability capitals and associated KPIs for smallholders through expert interviews, a structured questionnaire targeting smallholders, and subsequent data analysis. Using a second round of expert interviews, Phase 2 applies the FQFD method to rank the selected KPIs according to the needs expressed by smallholders. In Phase 3, a capital-constrained algorithm is used to validate the final list of multi-capital sustainability KPIs. A sensitivity analysis of the prioritized KPIs is conducted in Phase 4 to evaluate the robustness and broader applicability of the proposed approach. Phase 5 applies the TRIZ methodology to resolve contradictions between the selected KPIs and to derive strategic recommendations for smallholders. The following sub-sections provide a detailed description of each phase of the methodology.

3.1. Preliminary Study

The preliminary study prepares a structured basis for subsequent indicator selection. As a multi-capital sustainability approach is adopted in this paper, the first step of this study involves identifying the relevant capitals and associated indicators that best reflect the context. As shown in Figure 2, this phase builds upon the contributions previously presented and synthesizes insights from earlier project tasks, including the literature review, contextual analysis, field surveys, and expert input. The application of these elements led to the establishment of an integrated baseline relevant to the studied context. The number of KPIs initially identified is relatively high, considering the variety of information obtained, especially through field surveys and structured questionnaires. To ensure clarity and relevance, expert judgment is then applied in a methodical and repeatable manner to examine for potential overlaps and interdependencies. This guides the refinement towards a specific and representative set of indicators. The specific set of capitals and indicators retained as inputs for Phase 2 will be presented in Section 4, related to the case study. It is within this context that the next phase of this study was motivated and structured.

3.2. Fuzzy QFD Analysis

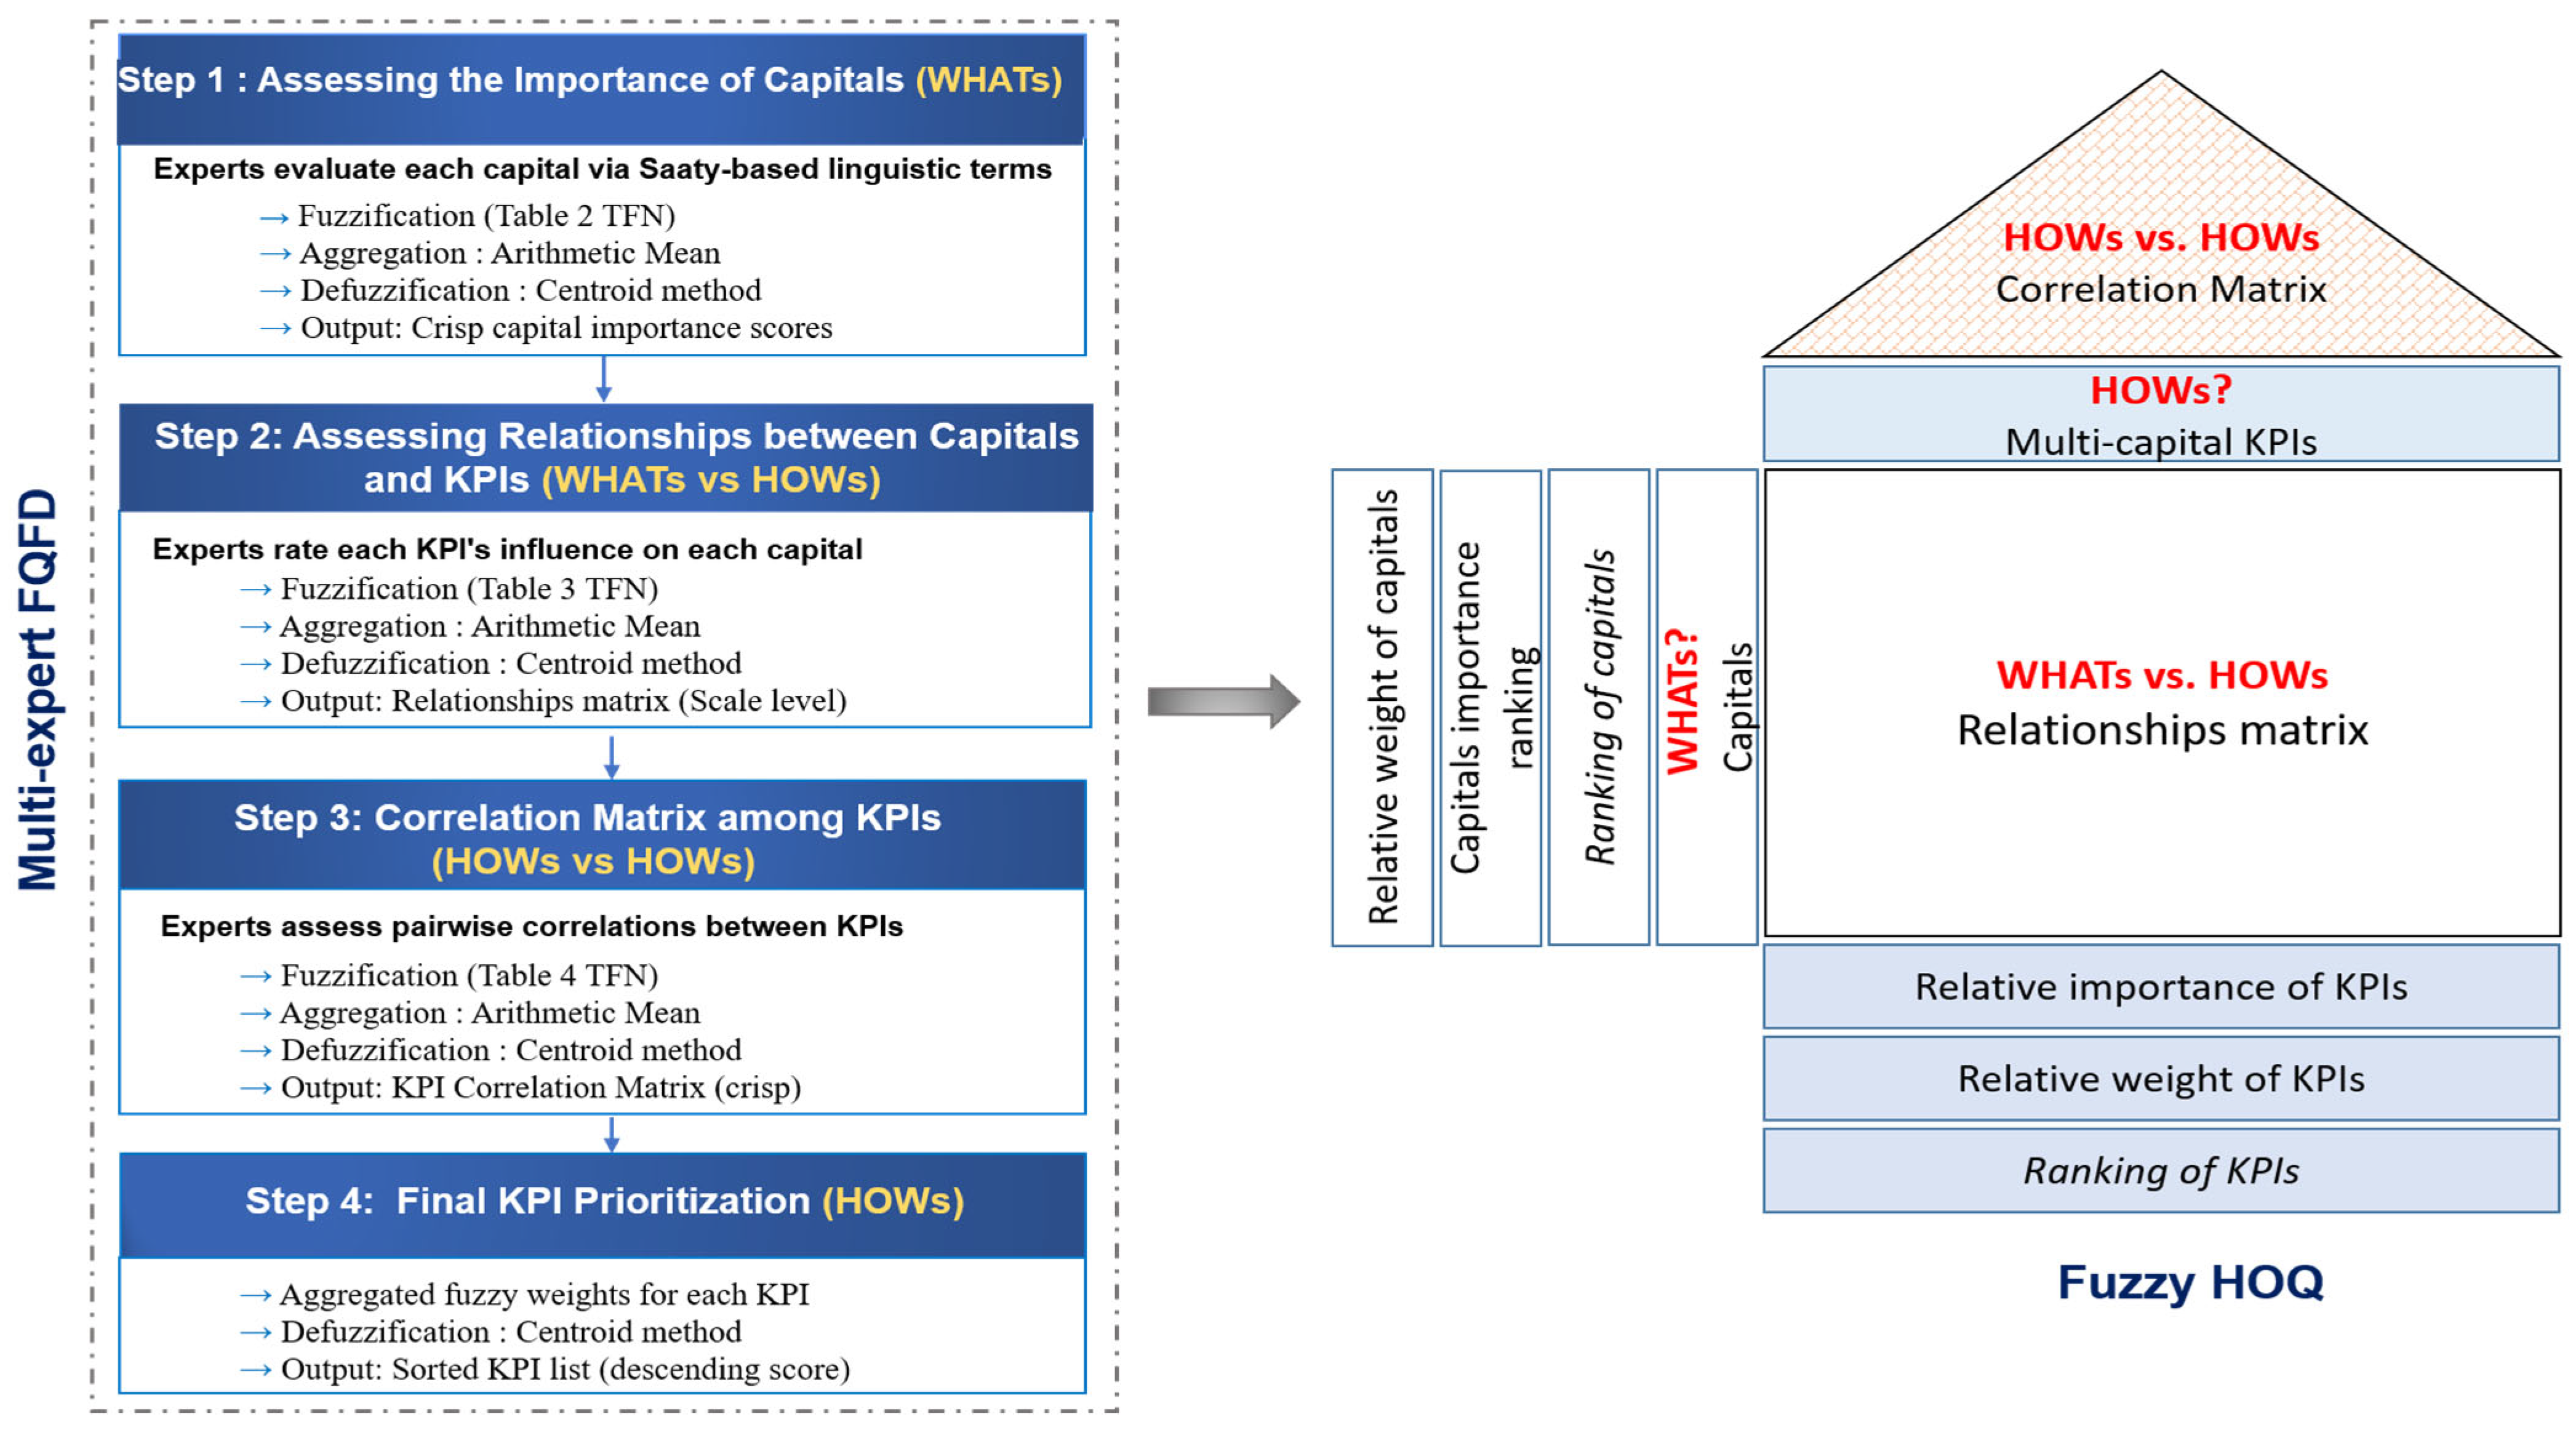
This phase aims to systematically support the selection and ranking of multi-capital KPIs tailored to smallholders’ contexts while considering its inherent uncertainties. To do so, FQFD methodology is applied. This approach merges the structured capability of QFD in prioritizing with the power of fuzzy logic in managing the subjectivity and uncertainty in expert-based evaluations. The QFD approach requires the development of an HOQ, which is a well-established tool that converts smallholders’ needs into KPIs using visual and structured matrices [12]. As illustrated in Figure 3, the HOQ is composed of several interconnected elements: the capitals (WHATs), the KPIs (HOWs), the relationship matrix (HOWs vs. WHATs), the relationships between KPIs (HOWs vs. HOWs), and the resulting importance scores of KPIs. Each element is essential to directing the process to identify priorities. The approach is structured into four sequential steps.
Table 2. Importance weights and corresponding TFN for rating capitals.
Linguistic TermsSaaty Scale
(Relative Importance)
TFN   a ~
Not important1(0.5, 1, 2)
Slightly important3(2, 3, 4)
Important5(4, 5, 6)
Very important7(6, 7, 8)
Crucial9(8, 9, 10)
Note: TFN denoted as ã = (l, m, u), see text for definition.
Table 3. Degree of capital–KPI relationships and corresponding TFN.
Linguistic TermsScale of Importance TFN   R ~ C p , k
Similar importance 1(1, 1, 1)
Moderate importance 3(2, 3, 4)
Strong importance 5(4, 5, 6)
Very strong importance7(6, 7, 8)
Note: TFN denoted as R ~ C p , k = l ,   m ,   u , see text for definition.
Table 4. Degree of correlations, graphic symbol, and corresponding TFN.
Linguistic TermsGraphic Symbol TFN   C o ~ r r j k , p
Strong positive (SP)++(0.3, 0.5, 0.7)
Positive (P)+(0, 0.3, 0.5)
No correlation (NC) (0, 0, 0)
Negative (N)(−0.5, −0.3, 0)
Strong negative (SN)− −(−0.7, −0.5, −0.3)
Note: TFN denoted as C o ~ r r j k , p = l j ,   m j ,   u j , see text for definition.

3.2.1. Assessing the Importance of Capitals

To determine the relative importance of each sustainability capital, a panel of multidisciplinary experts evaluated each capital using predefined linguistic terms. The number and profiles of the experts involved in this work are provided in Section 4. To derive capitals’ importance, four main sub-steps were conducted:
  • Collect individual judgements: Five weight levels were utilized, following Saaty’s classical rating scale [41], as shown in Table 2. This five-level linguistic scale is supported in the literature as an effective compromise between evaluation granularity and expert cognitive load [42].
  • Fuzzification: These linguistic terms were converted into triangular fuzzy numbers (TFN), denoted as a   ~ = l ,   m ,   u , where l represents the minimum possible value, m the most likely value, and u the maximum possible value of the fuzzy evaluation, as shown in Table 2.
  • Aggregation: Individual fuzzy evaluations were aggregated using the arithmetic mean method. This method is frequently employed in fuzzy multi-criteria decision-making to combine expert opinions in a simple yet effective manner, particularly when all expert inputs are treated with equal importance. The arithmetic mean has been shown to preserve the linearity and interpretability of TFNs while maintaining computational simplicity [43]. Let E be the total number of experts. Each TFN provided by expert j is denoted as a ~ j = l j ,   m j ,   u j , where l j , m j , and   u j represent the lower, middle, and upper bounds of the fuzzy evaluation, respectively. Aggregation across all experts is then performed component-wise as follows:
    a ~ a g g   = ( 1 E   j = 1 E l j   , 1 E   j = 1 E m j ,   1 E   j = 1 E u j   )
  • Defuzzification: The centroid method was applied to convert each aggregated TFN into a crisp value, enabling prioritization and comparison. This method is widely adopted due to its ability to reflect the center of gravity of the fuzzy set [44]. Given an aggregated TFN a   ~ = l ,   m ,   u , the crisp value is calculated as follows: a = ( l + 2 m + u ) 4 . This formula is systematically applied in all subsequent defuzzification steps.

3.2.2. Identifying Capital–KPI Relationships

Experts also assessed the influence of each KPI on each capital using linguistic terms. The same four-step process in step 1 was applied. The only difference lies in the use of a distinct linguistic scale and TFN, as proposed by [45] and defined in Table 3.
  • Fuzzification: Linguistic ratings were converted to TFN R ~ C j p , k = l j , m j , u j .
  • Aggregation: Component-wise aggregation (Equation (1)) was applied across experts, producing the fuzzy relationship matrix R ~ C p , k = l ,   m ,   u .
  • Defuzzification: The centroid method was used to obtain crisp relationship scores, which were mapped to the nearest value in the predefined scale (1, 3, 5, 7), maintaining interpretability. To ensure consistency between crisp scores and linguistic assessments, threshold intervals were established to map each defuzzified value to the closest discrete QFD score. Specifically, the following ranges were used: [0–2[ mapped to 1 (similar importance), [2–4[ to 3 (moderate importance), [4–6[ to 5 (strong importance), and [6–8] to 7 (very strong importance). This discretization preserves consistency with the original linguistic scale and is widely applied in FQFD studies [46]. Intermediate values are mapped to discrete crisp levels for interpretability, but all calculations are performed on their TFN representations, with final KPI scores defuzzified to produce the crisp ranking. The use of threshold intervals and discrete mapping is intended solely to facilitate interpretation, while preserving the fidelity of expert judgments throughout the fuzzy calculations.

3.2.3. Developing the KPI Correlation Matrix

To identify potential interactions or contradictions among KPIs, experts evaluated pairwise relationships using linguistic terms, which were then converted into TFNs and corresponding symbols (Table 4). These selected TFN values have been widely used in QFD and decision-making studies because they provide a balanced representation of expert consensus and ensure consistency with similar applications [47].
  • Fuzzification: Each pairwise correlation was expressed as a TFN C o ~ r r j k , p = l j ,   m j ,   u j .
  • Aggregation: Component-wise aggregation (Equation (1)) across experts yielded the fuzzy correlation matrix C o ~ r r k , p = l ,   m ,   u .
  • Defuzzification: Crisp correlation values were obtained using the centroid method, and then used to identify contradictory KPI interactions.

3.2.4. Ranking Multi-Capital KPIs

The weights of the KPIs, which constitute the main output of the HOQ, correspond to the final importance scores of the indicators. The final weights of the KPIs are computed using the fuzzy importance weights of the capitals and the fuzzy capital–KPI relationships obtained in step 2. The formula is shown in Equation (2).
W ~ K k = n = 1 N R ~ C p , k × C ~ I p
where R ~ C p , k is the aggregated fuzzy relationship between capital p and KPI k, and C ~ I p is the aggregated fuzzy importance of capital p. The resulting fuzzy importance weights for each KPI W ~ K k = l ,   m ,   u are calculated by multiplying each component of the aggregated fuzzy relationship R ~ C p , k with the corresponding component of the aggregated fuzzy capital importance C ~ I p across all capitals. This produces the fuzzy importance weight for each KPI.
  • Defuzzification: The centroid method is applied to each W ~ K k , yielding a crisp priority score: W K k = ( l + 2 m + u ) 4 .
  • Ranking: KPIs are ranked in descending order according to their crisp weights W K k , with the highest score indicating the highest priority.

3.3. Capital-Constrained Algorithm

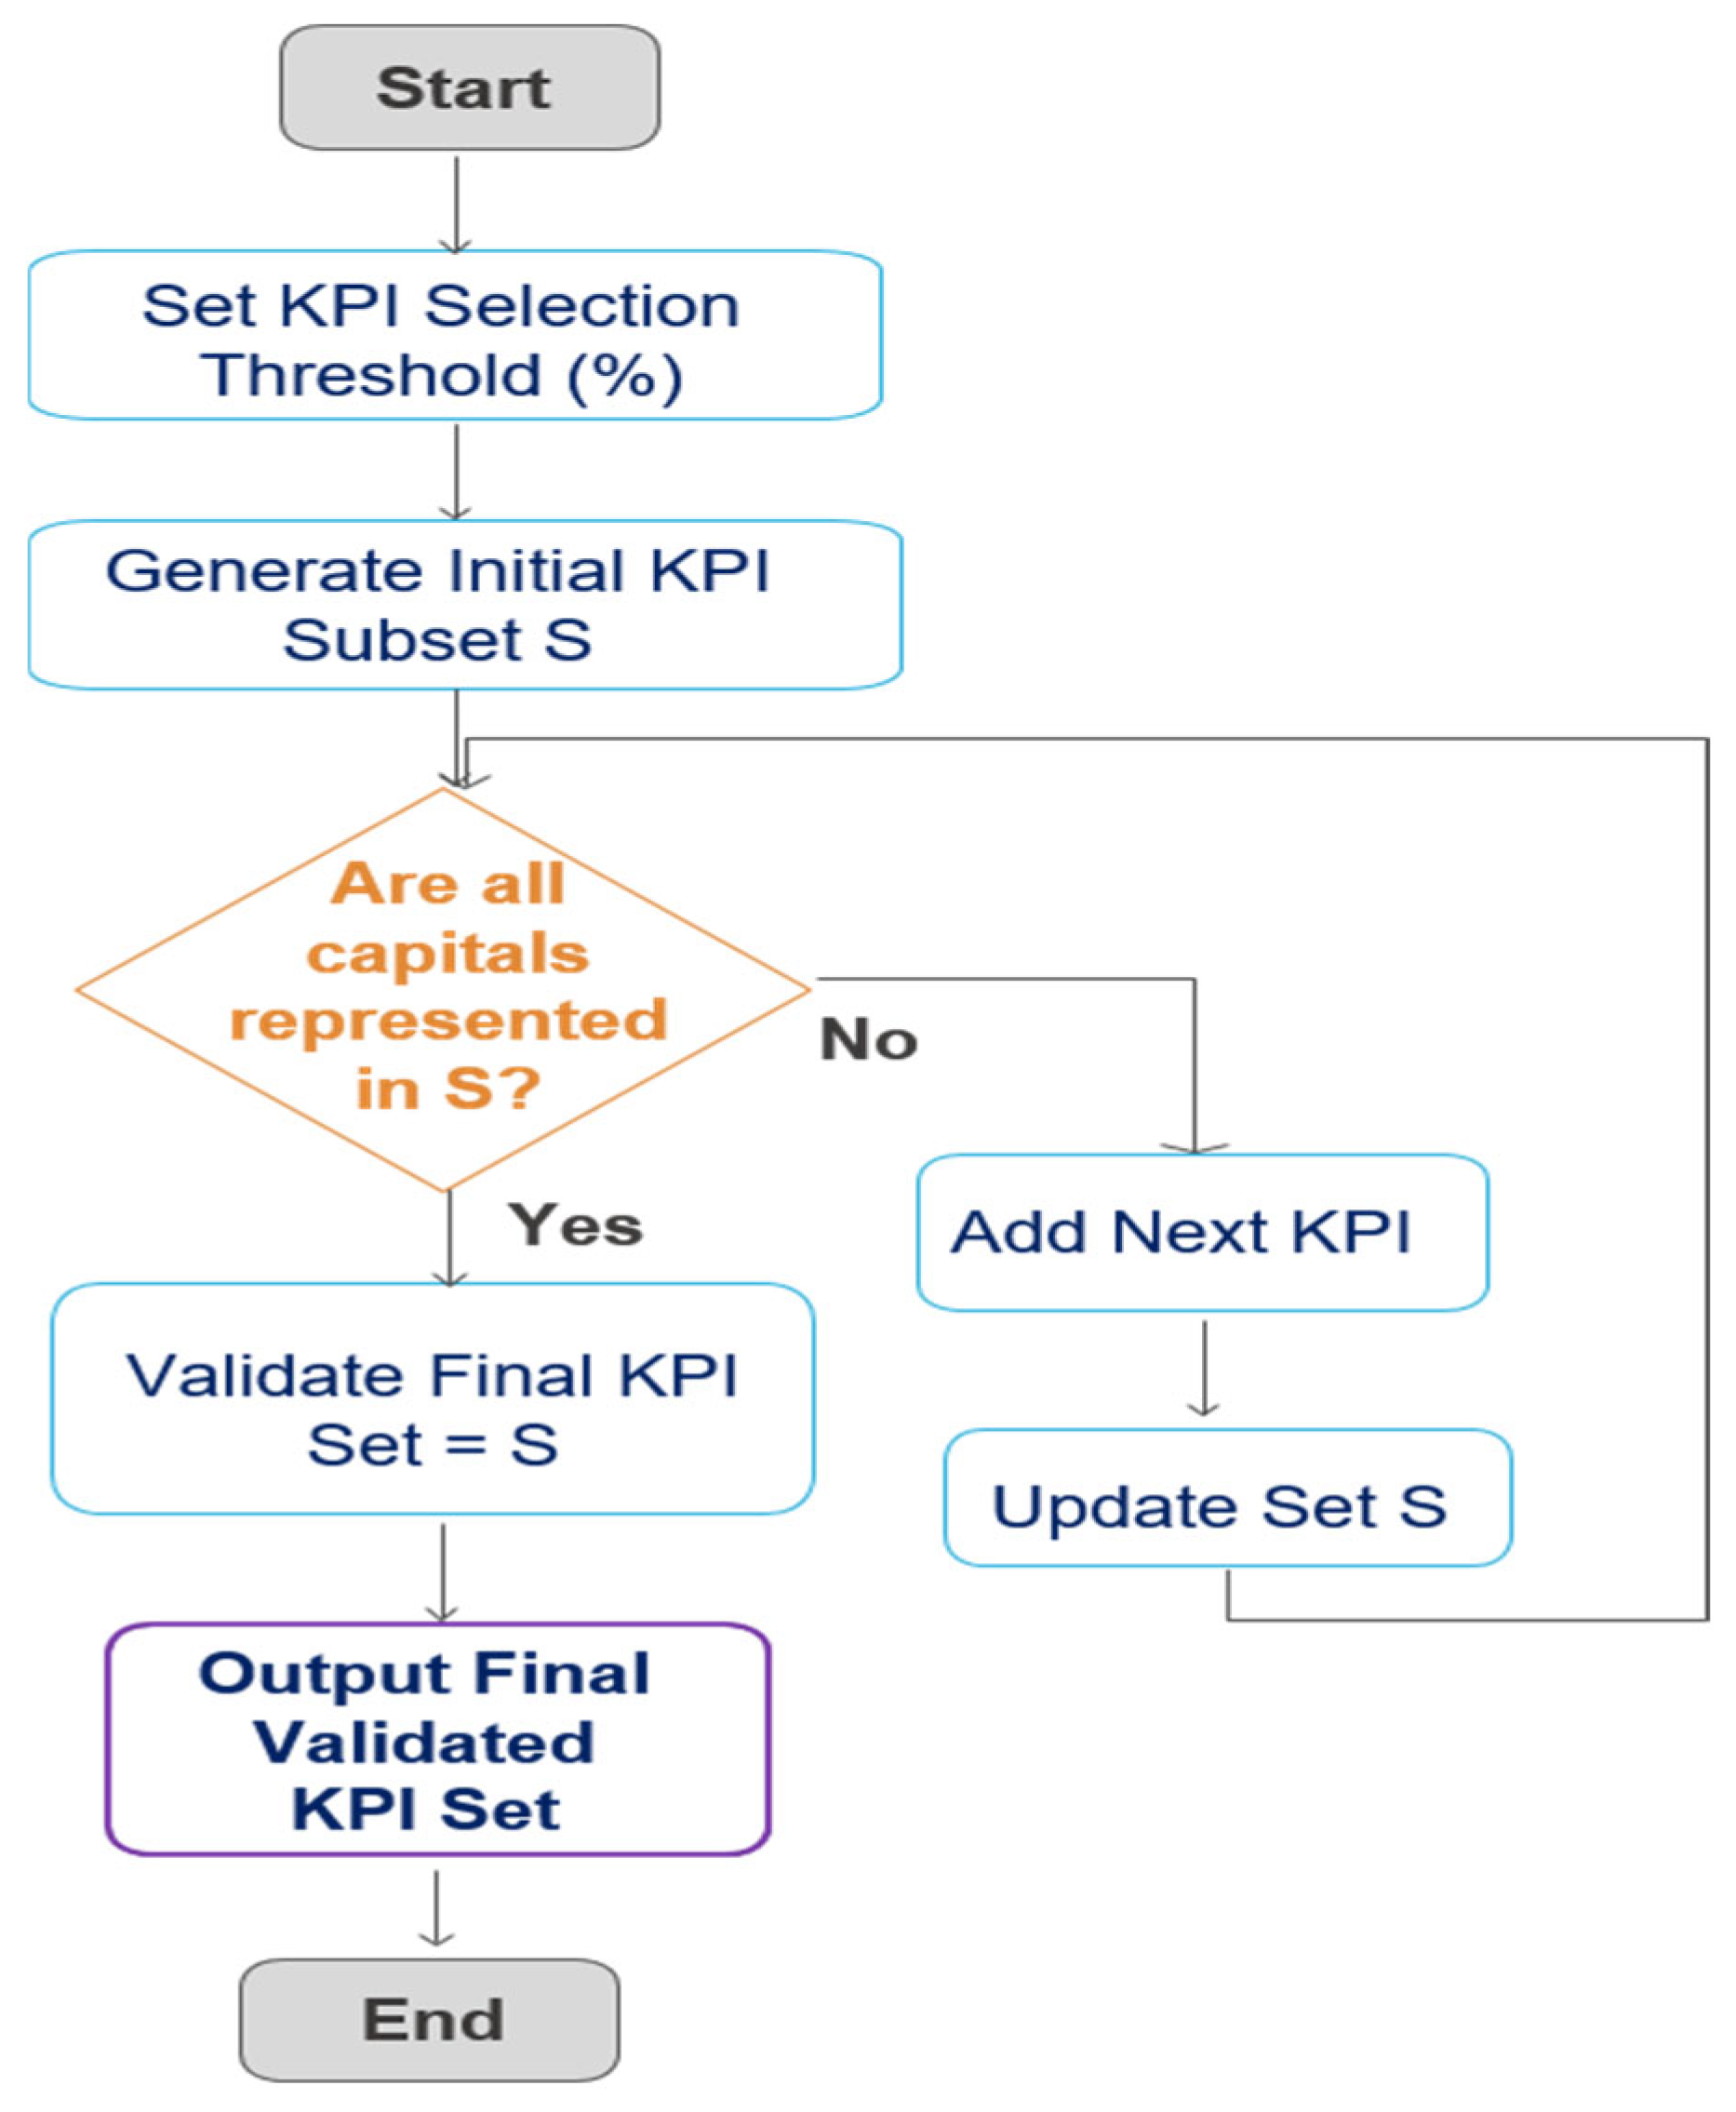
A capital-constrained algorithm is used in this phase to validate the final list of multi-capital sustainability KPIs. The process of this algorithm, illustrated in Figure 4, begins with the complete list of ranked KPIs (the output of the FQFD). Theoretically, Kaplan and Norton [48] advocate keeping the total number of KPIs below 20 to prevent information overload and preserve a focused strategic consideration. Therefore, the implemented algorithm will ensure the representativeness of all capitals that were initially considered in the KPI list. If a capital is omitted, additional KPIs associated with that capital will be drawn from the ranked list. The adopted approach can be considered a greedy heuristic, prioritizing top-ranked KPIs while ensuring that all capitals are represented. This approach guarantees that the set of KPIs represents a thematically rich sustainability assessment without giving up clarity and operational feasibility, which is in line with best practices in MCDM that indicate the importance of information representation and analytical discipline [41]. The detailed stepwise procedure of this greedy heuristic is formally described in Algorithm 1.
Algorithm 1: Capital-constrained KPI selection (Greedy heuristic)
Input: Ranked KPI list (size = N), KPI Selection Threshold (%), Capitals list
Output: Final Validated KPI Set
Steps:
1. 
Initialize SelectedKPISet = [ ]
2. 
Compute the number of KPIs to retain at threshold: ThresholdCount = ceil(N × Selection Threshold %)
3. 
Generate InitialKPISet by selecting the top ThresholdCount KPIs from the ranked list
4. 
Set SelectedKPISet = InitialKPISet
5. 
While not all capitals are represented in SelectedKPISet:
- Add the next highest-ranked KPI belonging to the missing capital(s)
- Update SelectedKPISet
6. 
Validate Final KPI Set = SelectedKPISet
7. 
Return Final Validated KPI Set

3.4. Sensitivity Analysis

A structured sensitivity analysis was carried out to assess the robustness of the multi-capital KPI rankings produced using the suggested FQFD approach. The subjective nature of expert-assigned weights C I p   necessitates testing whether reasonable perturbations in these values have a significant impact on the prioritization result. A one-at-a-time sensitivity method, as described in [49], was employed to isolate the effect of each capital while preserving the internal consistency of the evaluation model. Mathematically, let C I ( 0 ) = ( C 1 ( 0 ) ,   C 2 ( 0 ) ,   ,   C 8 ( 0 ) ) be the baseline vector of crisp capital importance values obtained through the fuzzy aggregation and defuzzification process, as described in Section 3.2. These weights are normalized such that p = 1 8 C p ( 0 ) = 1 . To simulate the effect of varying a single capital, a perturbed weight vector C I ( x )   is constructed by modifying C p ( 0 ) by a factor (1+x), while proportionally adjusting the remaining weights to maintain normalization. This preserves the coherence of the fuzzy evaluation under perturbation. The equations are given by C p ( x ) = 1 + x . C I p 0 for the perturbed capital p , and C I p ( x ) = C I p ( 0 ) · 1 C I p x 1 C I p 0   for all other capitals p p .
Under scenario x, the KPI ranks are recalculated using these updated weights, represented as
S k ( x ) = p = 1 8 R C ( p , k ) · C I p ( x )
The one-at-a-time approach performs well for sensitivity analysis in multi-criteria decision frameworks, especially when inputs represent conceptually distinct dimensions such as sustainability capitals. It is a reliable and open technique for evaluating how parameter uncertainty affects prioritization results since it can separate individual effects while maintaining weight normalization [49].

3.5. TRIZ Contradiction Resolution

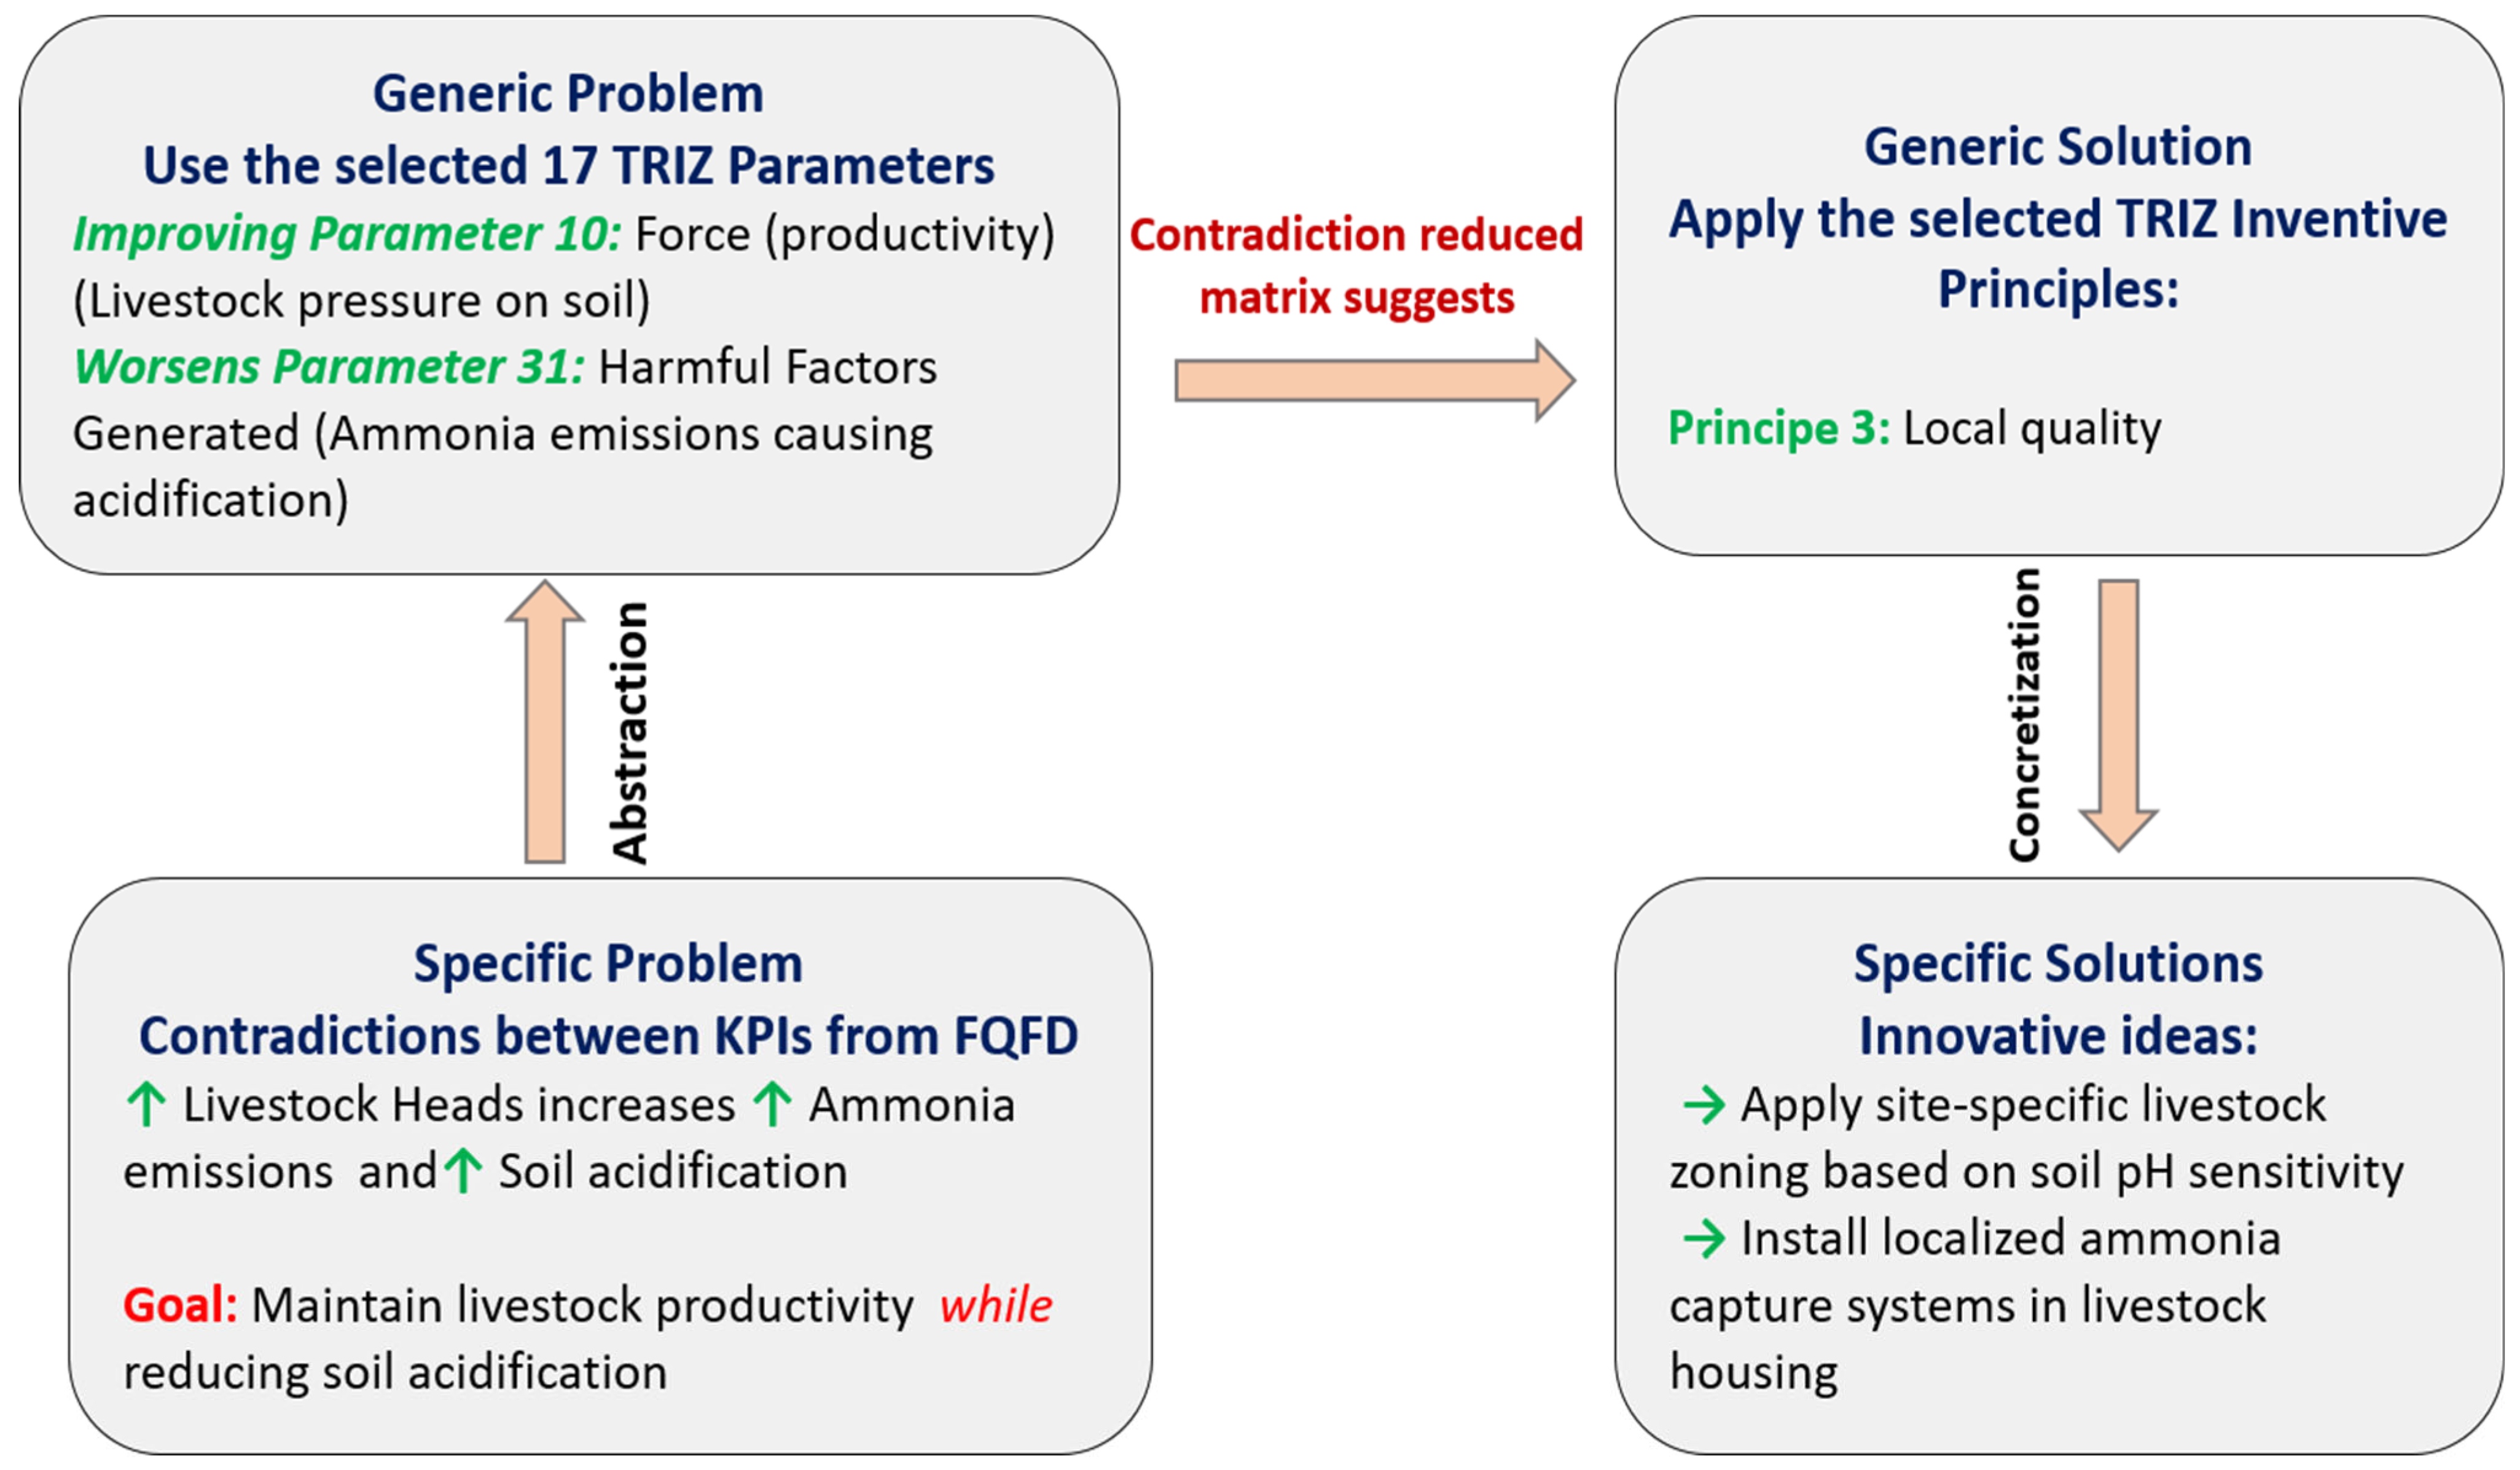
The aim of this phase is to generate recommendations for resolving the conflicts between sustainability KPIs that the HOQ’s roof revealed. Because of negative correlations, improving one KPI might put another at risk. This becomes particularly crucial for trade-offs in smallholder systems where socio-economic vulnerabilities, environmental risks, and resource limitations are intertwined. For instance, increasing fertilizer use in order to improve crop yield while simultaneously compromising the goal to reduce greenhouse gas emissions per unit leads to conflict with the system’s sustainability goals. The TRIZ process follows four stages, as illustrated in Figure 5. The first stage involves the formulation of the specific problem through the identification of the conflicting KPIs, that is, those very strongly negatively correlated with one another in the roof of the HOQ, with these derived from the results of FQFD analysis. The second stage involves abstracting the conflict using TRIZ’s 39 parameters to frame it in generalized technical terms [14].
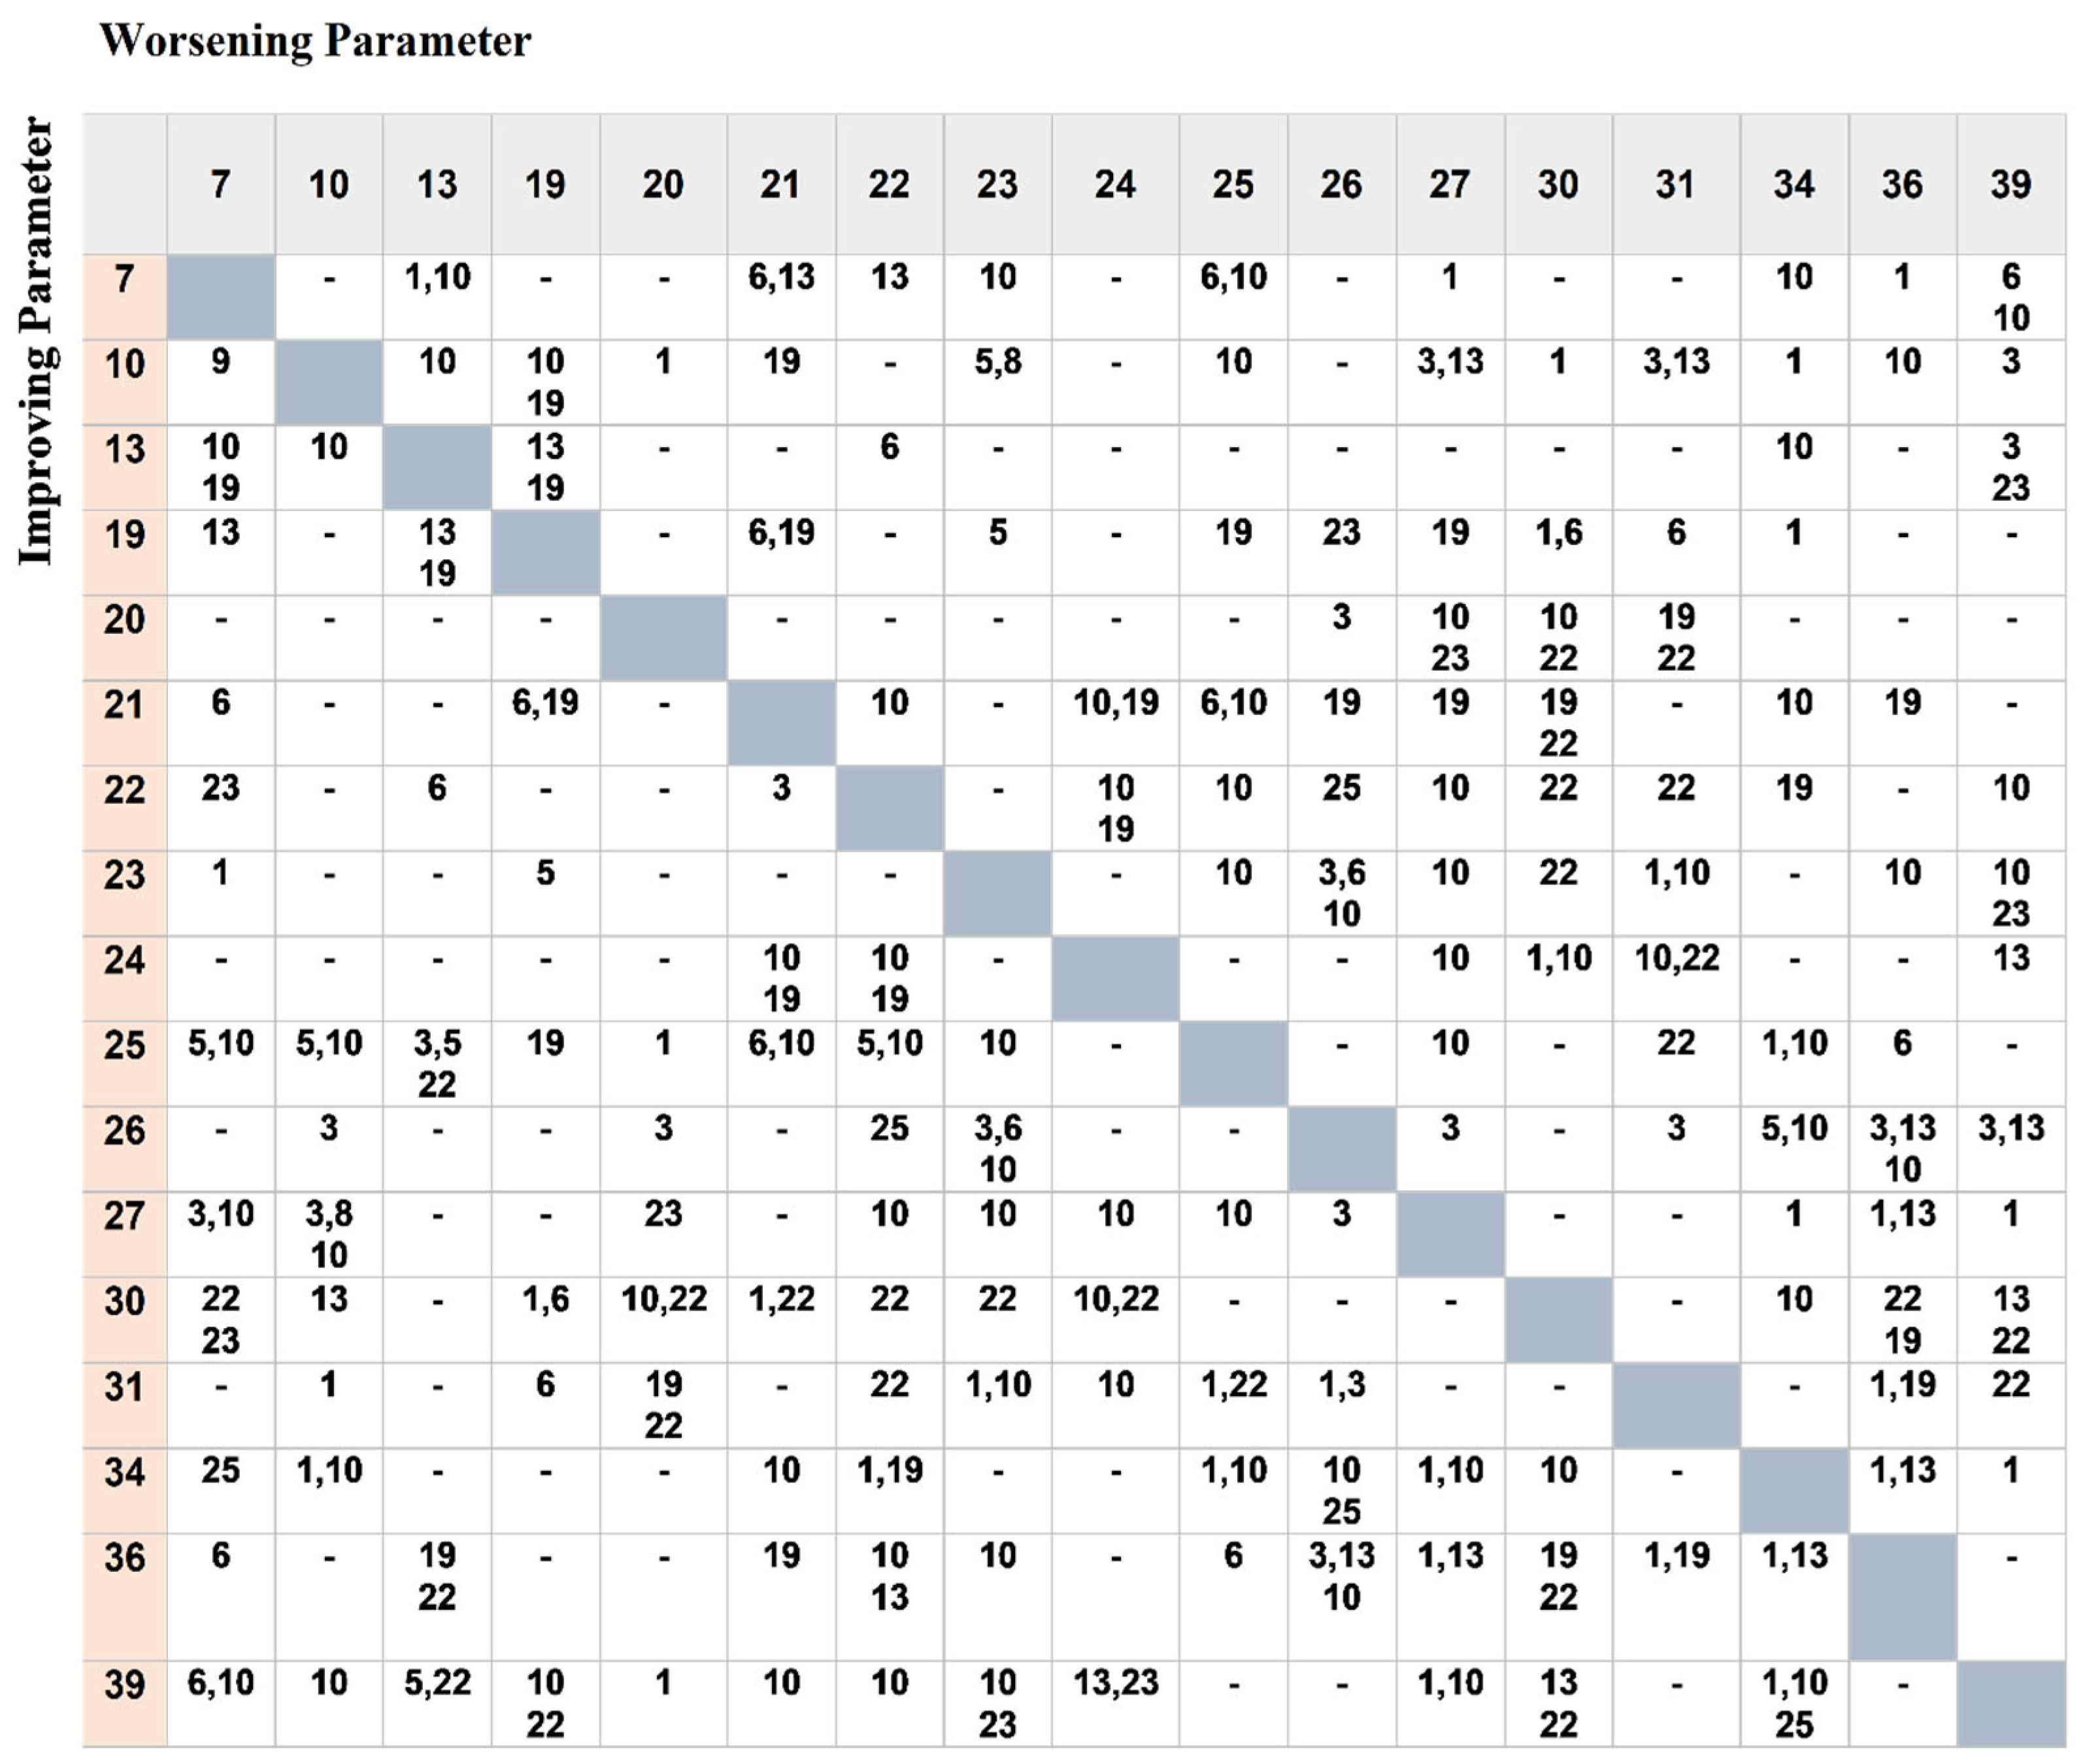
To the best of our knowledge, this paper is the first to apply TRIZ methodology to KPIs within the agricultural context. Consequently, considerable effort was made to identify and justify the most relevant TRIZ parameters through a brainstorming process and expert validation. Out of the 39 classical TRIZ parameters, 17 were selected based on their pertinence to sustainability-related multi-capital KPIs for smallholders (see Appendix A.1), in addition to the selection of 12 inventive principles from the 40 classical ones [50] (see Appendix A.2). This streamlined set improves the practicality and context relevance of the proposed solutions. As a result, the TRIZ contradiction matrix was simplified to fit the chosen parameters (see Appendix A.3). In the third stage, this reduced matrix shall assist in identifying relevant inventive principles to provide universal guidance in developing innovative solutions. In the final stage, these principles are subsequently translated into contextual and specific recommendations [15].

4. Case Study Description and Input Data

The Cap Bon region in the northeastern Nabeul governorate of Tunisia was selected as the case study due to its strategic importance and representativeness. This governorate is one of Tunisia’s main agricultural locations, with a diverse farming system that includes small-scale livestock production, citrus orchards, and vegetable crops. This varied agricultural landscape is characterized by the vast majority of small farms under 5 hectares, many of which are family-owned and -operated. Cap Bon provides nearly 70% of Tunisia’s citrus production, but it faces serious sustainability challenges like water scarcity [51], biodiversity loss [52], and increased vulnerability to climate variability [53]. The case study serves two specific objectives: (i) to validate the proposed approach in this research by grounding it in empirical data and (ii) to tailor the selected sustainability KPIs to the contextual realities of Tunisian smallholders, thereby supporting future policy recommendations and local planning tools. The fieldwork was carried out through two complementary surveys.
The first targeted 200 smallholders and included interviews with experts from the policymaker, namely the Regional Commissariat for Agricultural Development of Nabeul, a local branch of the Ministry of Agriculture, Water Resources, and Fisheries in Tunisia. The majority of respondents were men (94%), mostly aged between 40 and 60 years (54%). They generally had low education levels, with only 11.3% having completed university, while 43.8% reached high school and 40% primary school. For 81% of the participants, agriculture represented their main activity. These characteristics provide a general profile of the sample and help to contextualize the survey results. The survey was implemented using the “Survey Solutions” platform, which facilitated data collection through a structured online questionnaire. In-person interviews were also held to guarantee the completeness and clarity of responses. The policymaker and smallholders both contributed to the discussion of capitals. There was some alignment, even though the policymaker’s response was more specific. The primary difference pertained to natural capital, which smallholders considered significant but the policymaker found to be neutral. The policymaker observed that smallholders were very interested in incorporating environmental strategies, but their current engagement was limited. The interrelations among capitals were considered when structuring the baseline. For example, natural capital (soil fertility, water availability) influences financial capital through agricultural income and human capital via labor productivity and health. Similarly, financial capital affects investment in smart technologies, strengthening intellectual capital and, indirectly, social capital. These interdependencies highlight that capitals form a dynamic system, where changes in one dimension impact others. This systemic perspective guided the refinement of KPIs to reflect both individual capitals and their interactions. The finalized list was further refined with the SMART selection method to retain only the most contextually relevant KPIs for each of the capitals. Appendix B presents the initial list of KPIs identified.
The second survey involved three Tunisian experts with the following profiles: a specialist in sustainable agriculture, an environmental engineer, and an agronomic consultant. While the expert panel was limited in size, the diversity of expertise and perspectives ensured a comprehensive and meaningful evaluation of capital importance and KPI interactions, capturing multiple dimensions of sustainability relevant to smallholder systems. The experts participated in structured online interviews and completed a questionnaire designed and distributed via Google Forms. The questionnaire was divided into two main parts. The first part focused on evaluating how important each type of capital is and how the proposed indicators are linked to these capitals. The second part explored how the indicators might influence or interact with one another. To make the assessment easier, the questions were organized in tables, allowing experts to simply tick the boxes that best reflected their judgment.

5. Results and Discussion

This section presents and analyzes the main findings obtained from the Tunisian case study, which were obtained following the methodology presented in Section 3. The outcomes of the multi-expert FQFD process are explained in detail in Section 5.1. The final list of KPIs validated by the capital-constrained algorithm is provided in Section 5.2. The findings of the sensitivity analysis are covered in Section 5.3. Lastly, recommendations based on the use of TRIZ are described in Section 5.4., and a discussion is held in Section 5.5 to emphasize the methodological implications and contextual relevance of the findings.

5.1. Results of Multi-Expert FQFD

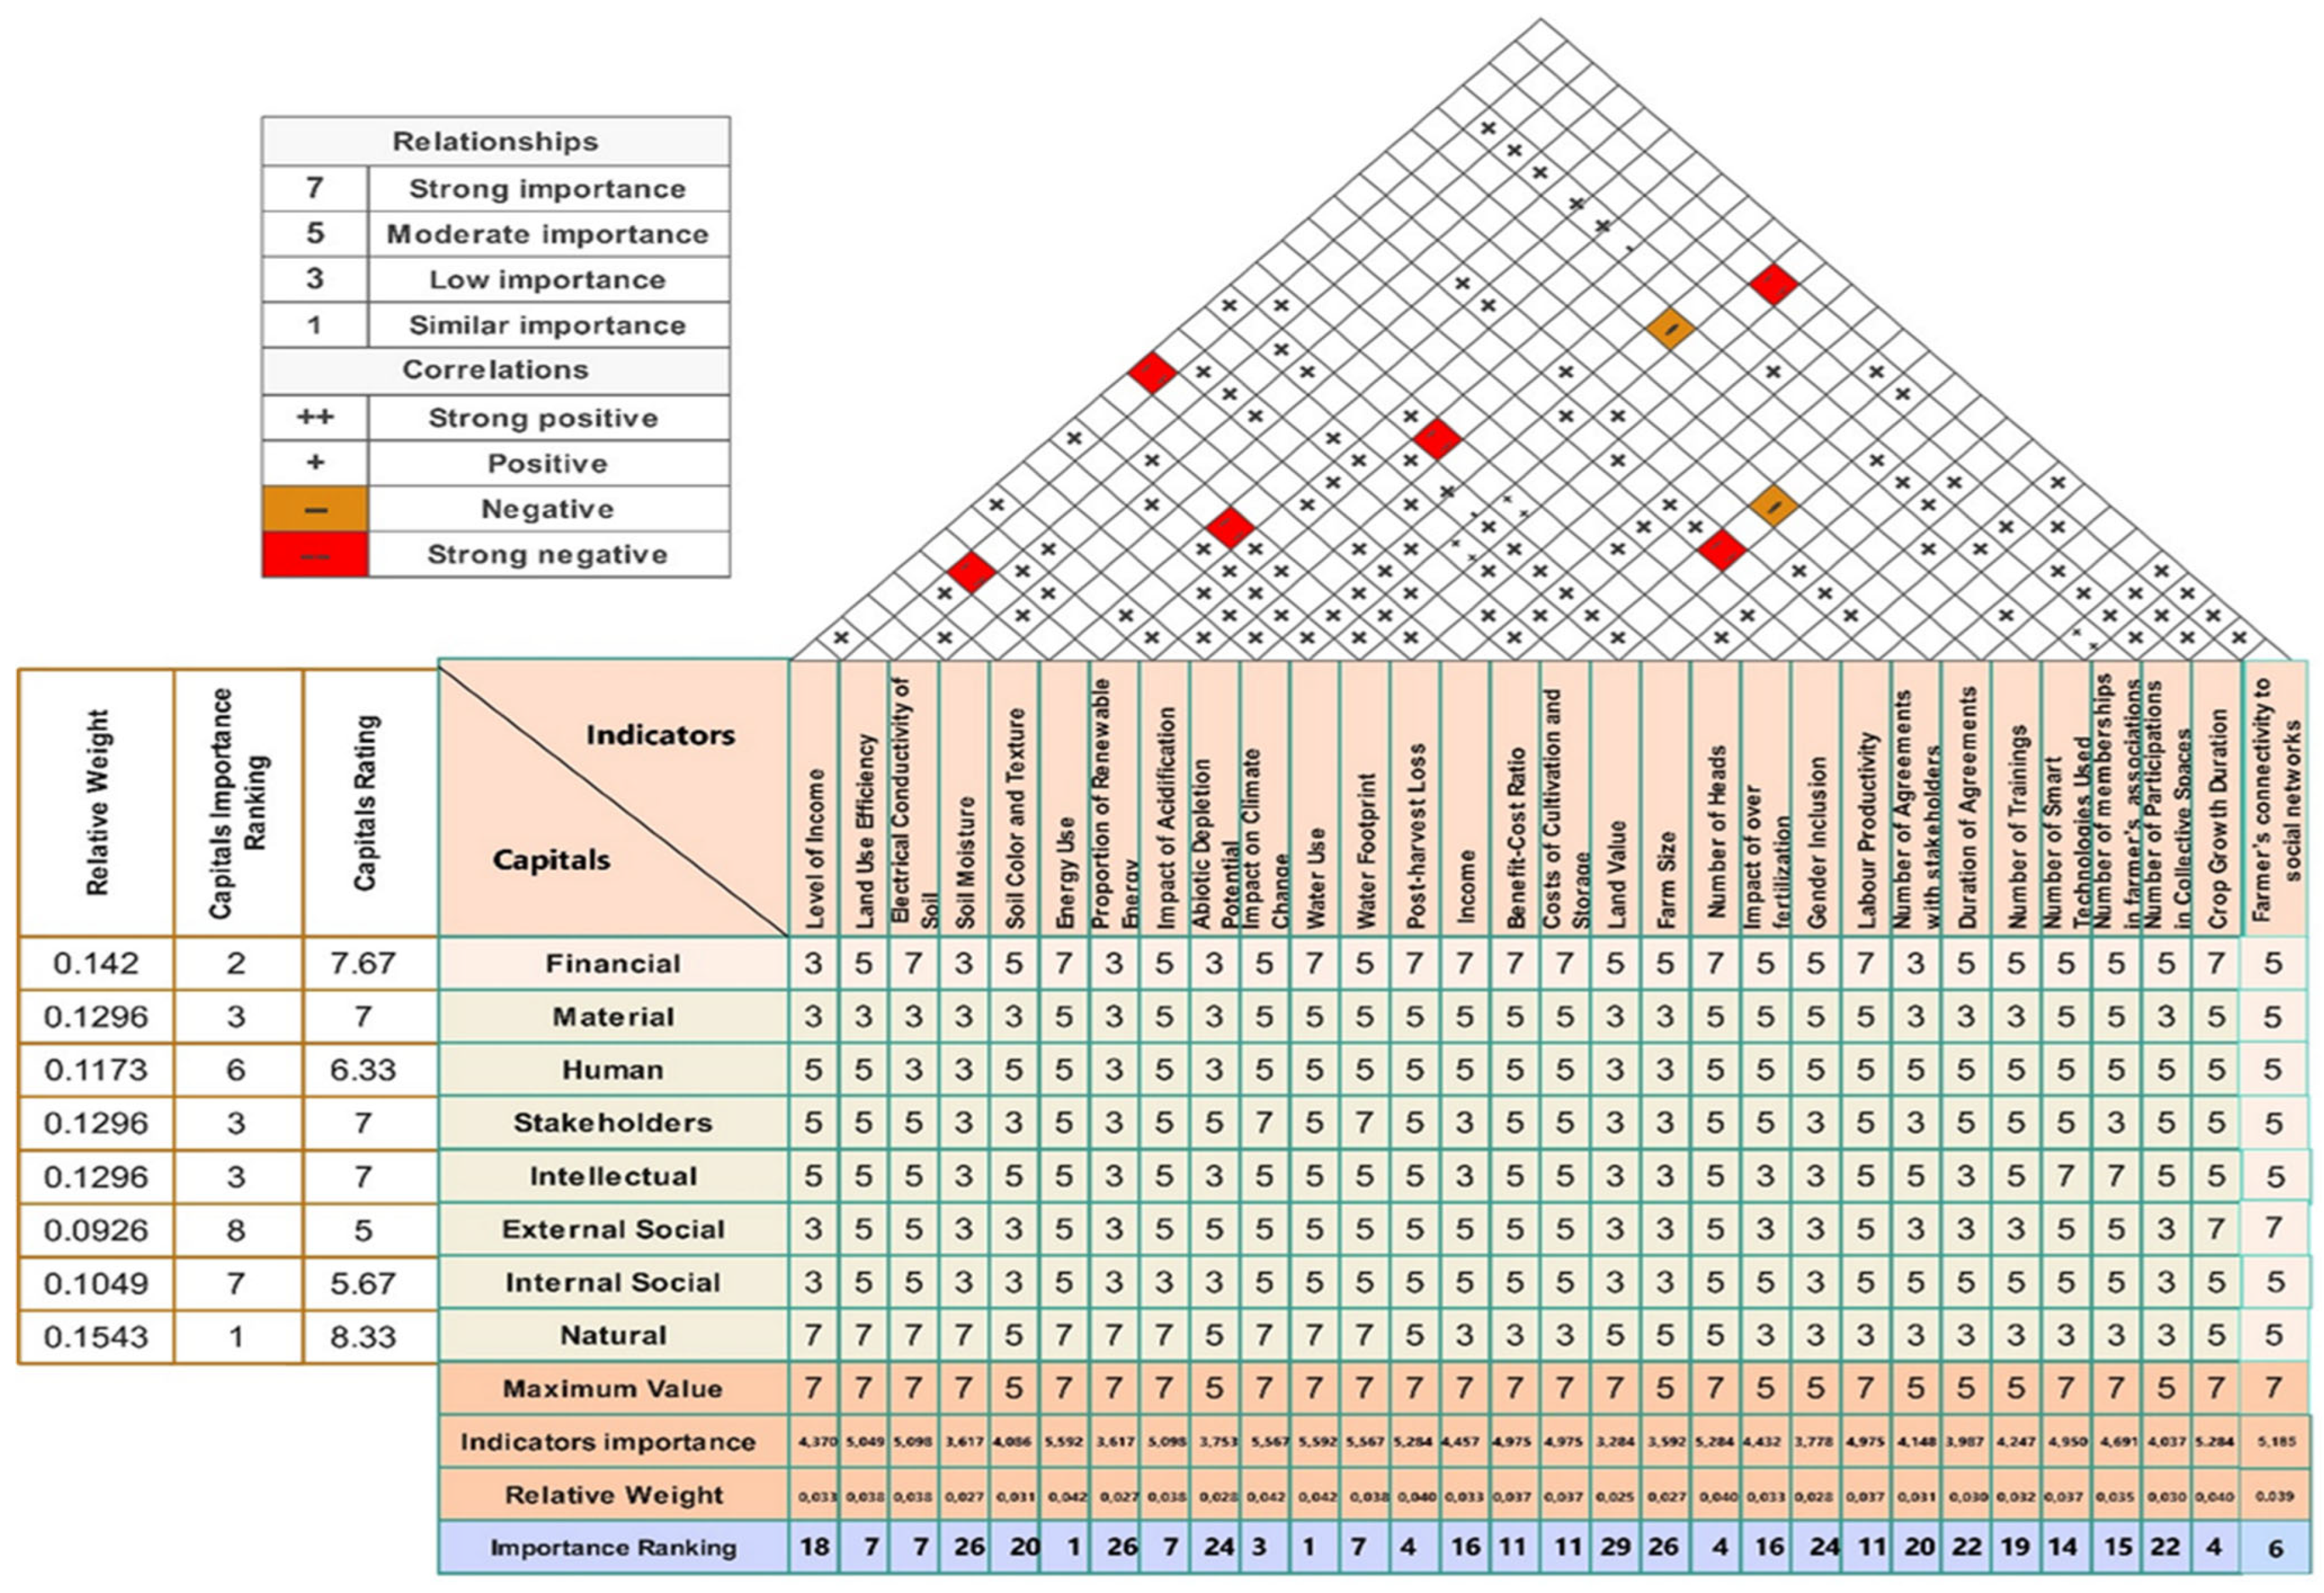
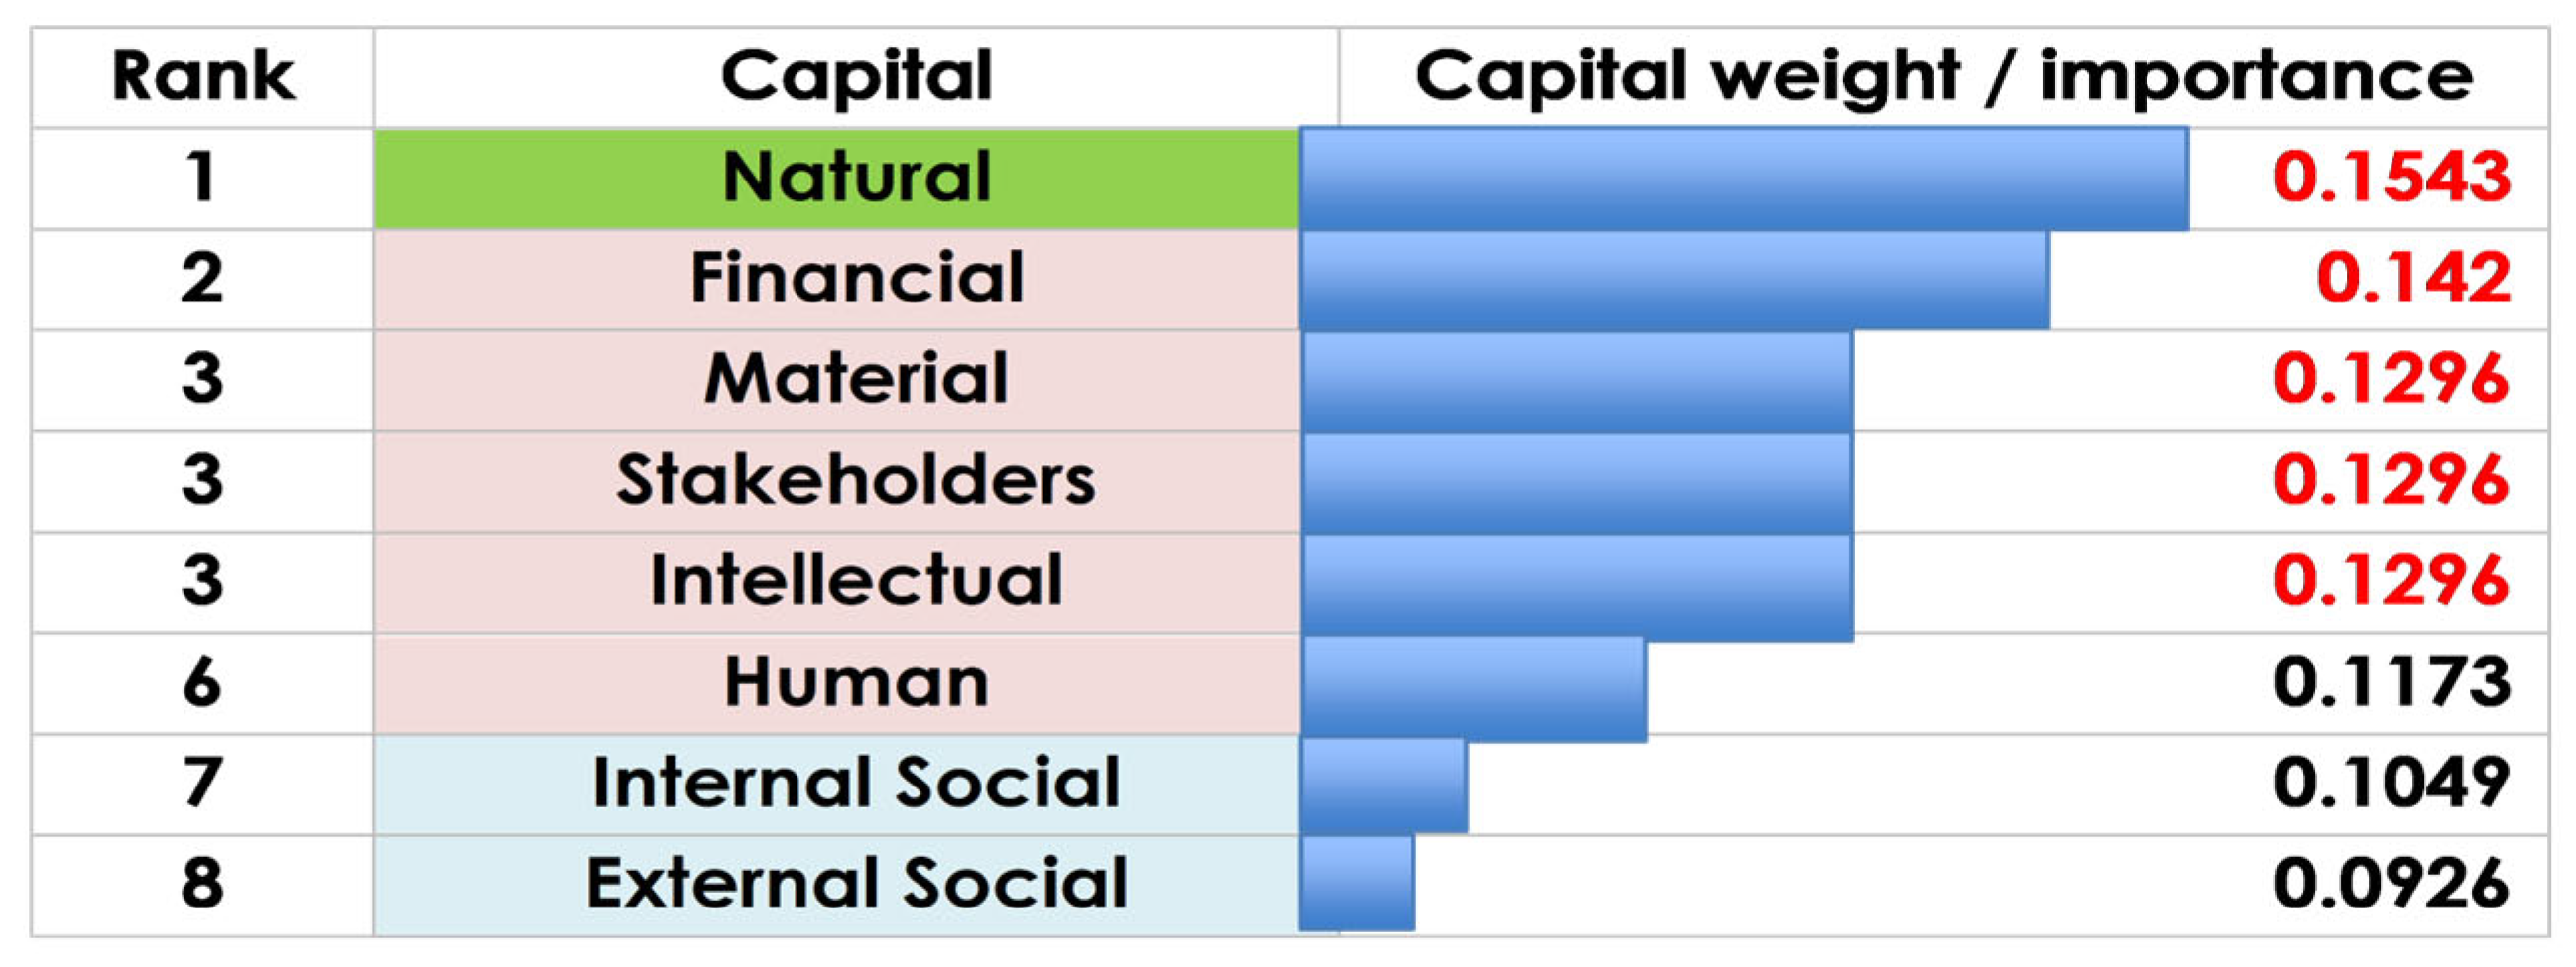
The multi-expert FQFD method was implemented using MATLAB version R2024a, while the HOQ was structured and visualized with EdrawMax version 14.1.0. While Google Forms was used to collect expert responses, the multi-expert FQFD process, including the transformation of linguistic judgments into TFNs, fuzzy arithmetic, aggregation, and defuzzification, was implemented using MATLAB, ensuring accuracy, consistency, and reproducibility. This setup allowed for a clear mapping of the interactions between sustainability KPIs and capital types, as well as the correlations among KPIs. The complete results of the multi-expert fuzzy HOQ are provided in Appendix C. Figure 6 presents the results of the relative importance of sustainability capitals identified by experts, following the fuzzy computation and defuzzification procedures. Among them, “natural” capital emerged as the most critical, followed closely by “financial” capital. These two were consistently regarded by experts as the most influential in shaping the sustainability performance of smallholders. whereas “material”, “stakeholder”, and “intellectual” capitals were assigned equal weight, indicating moderate influence, especially when related to knowledge transfer, institutional participation, and access to inputs. Conversely, “human” capital scored marginally lower, and the lowest-ranked capitals were “internal social” and “external social.” Overall, these results reflect the experts’ emphasis on capitals directly linked to environmental conditions and economic viability, thereby reinforcing the idea that smallholder sustainability hinges on efficient resource use and financial resilience. The relationship matrix between the capitals and the set of candidate KPIs is also illustrated in Appendix C, as part of the fuzzy HOQ. Most KPIs showed moderate to strong levels of importance (values 5 or 7) with at least one capital. This matrix also quantified the contribution of each KPI to the various sustainability dimensions, while revealing interdependencies and potential redundancies among the indicators. Furthermore, the fuzzy HOQ served as the basis for calculating the global priority ranks of KPIs, also reported in Appendix C.

5.2. Results of the Capital-Constrained Algorithm

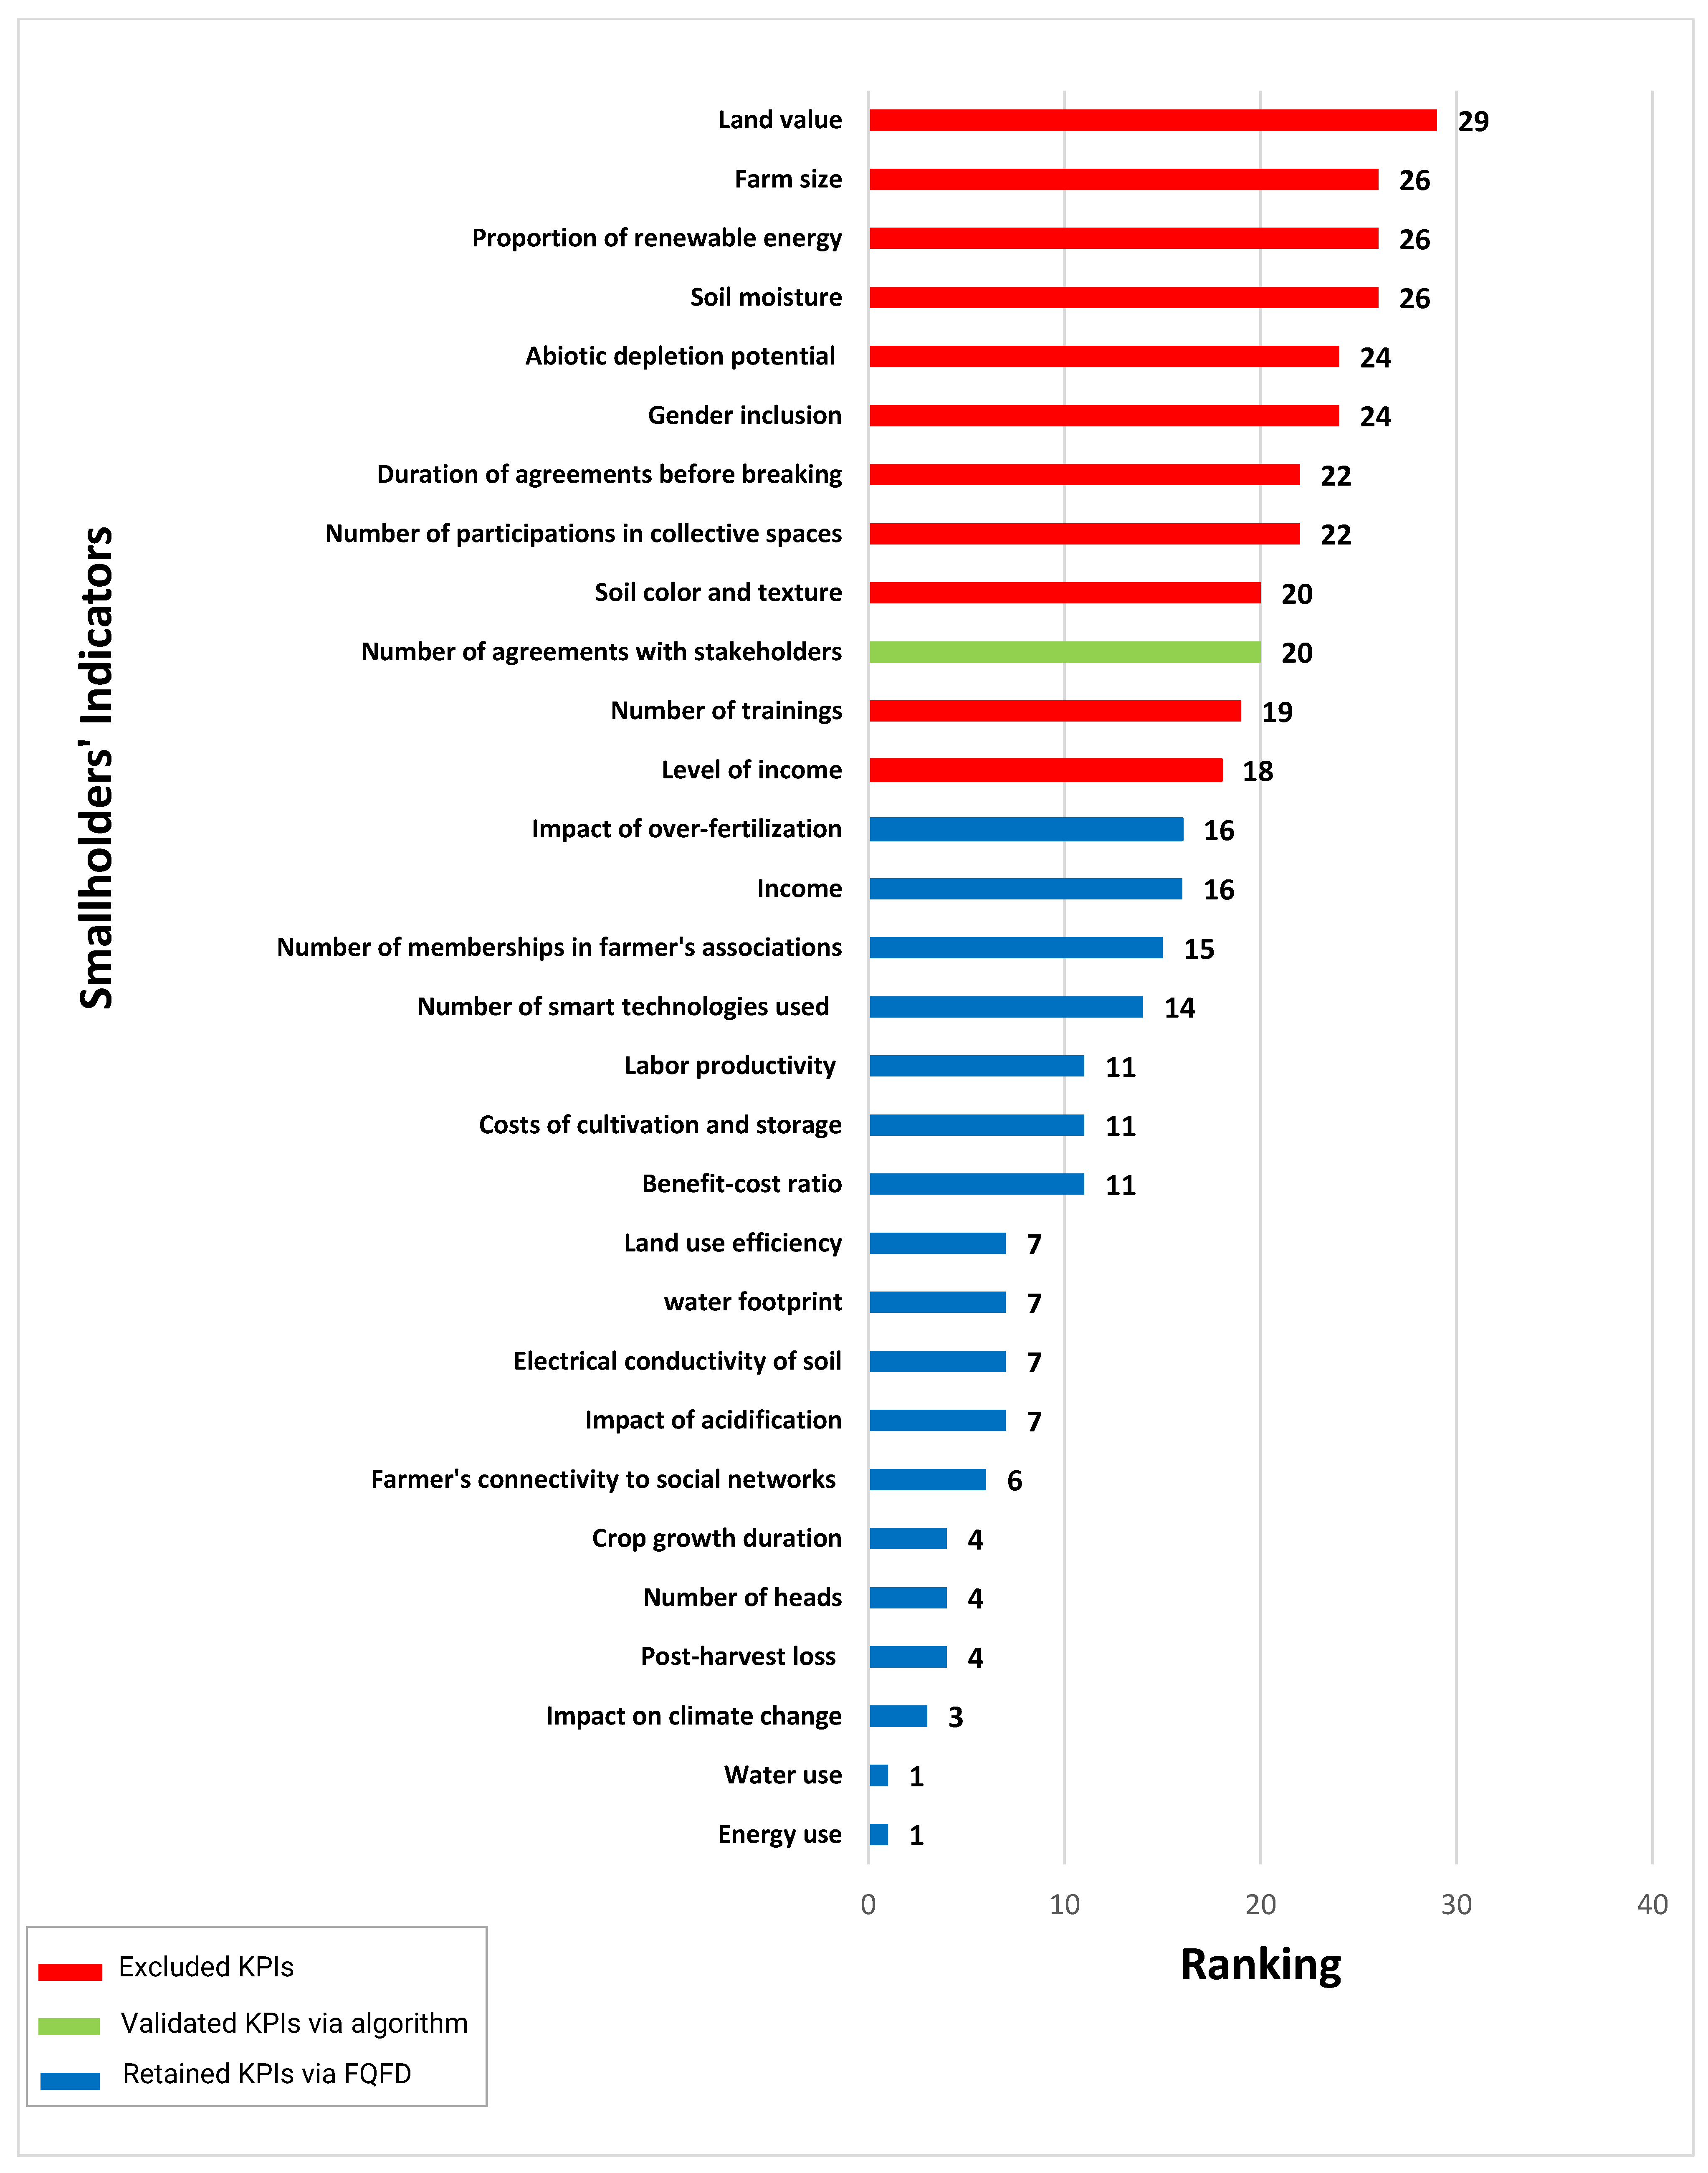
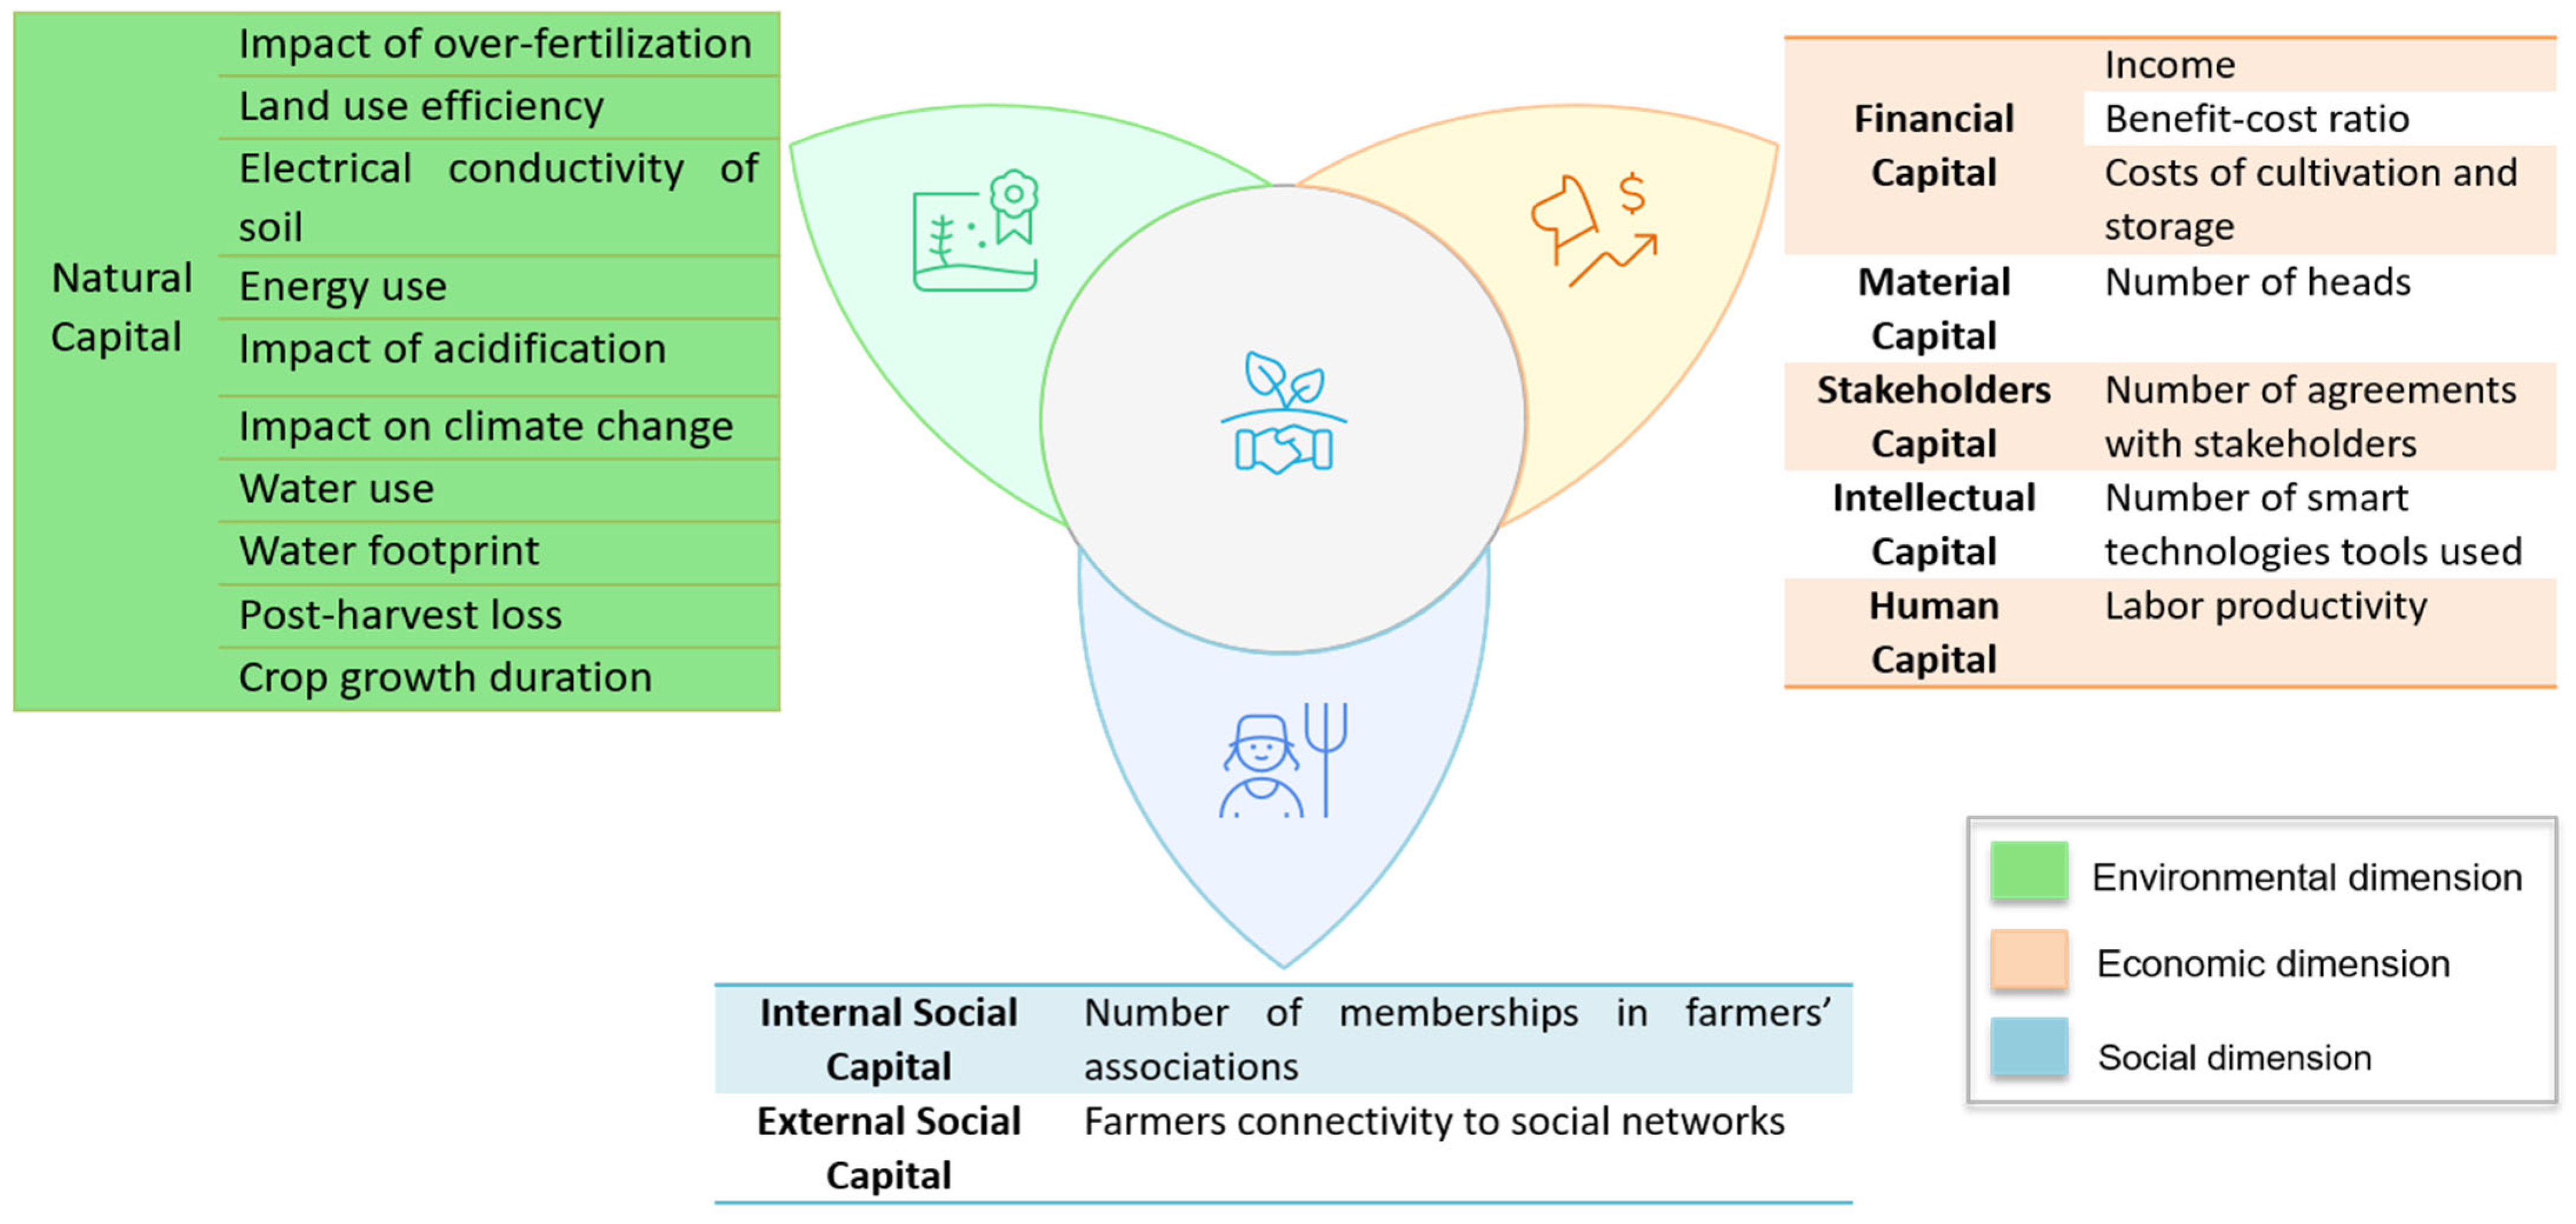
A final list of 19 relevant indicators was validated by the capital-constrained algorithm, ensuring equitable coverage of the eight sustainability capitals. As shown in Figure 7, 11 indicators were excluded (red bars) due to their limited overall contribution. Notably, “energy use” and “water use” ranked first, followed by “impact on climate change” (Rank 3). “Crop growth duration”, “post-harvest losses”, and “number of heads” were all jointly ranked at position 4. “Land use efficiency”, “water footprint”, and “impact of acidification” are other highly ranked KPIs. The “number of agreements with stakeholders” indicator (green bars) was retained by the algorithm due to its strategic significance representation of the “stakeholders” capital. Figure 8 presents the final set of selected KPIs for smallholders. The green, orange, and blue colors refer to the environmental, economic, and social dimensions, respectively.
The distribution of rankings shown in Figure 7 illustrates the convergence between the priorities evaluated by the experts and the capital feasibility constraints, confirming the strategic relevance of certain medium- or low-ranked KPIs. In particular, some indicators were selected not for their rank, but because they addressed essential sustainability capitals. As shown in Figure 7, the indicators most frequently prioritized by experts concern natural and financial capitals, reflecting the complex interdependence between ecological sustainability and economic viability in smallholder systems. The “Land value”, “Farm size”, and “Proportion of renewable energy” indicators are ranked the lowest among the 30 KPIs initially defined. According to experts, these indicators were discarded due to their low applicability and their inadequacy with the actual scope of action of smallholders. Notably, the “natural” capital is represented by a large number of KPIs, including “Impact of over-fertilization”, “Land use efficiency”, “Soil electrical conductivity”, “Water use”, and “Post-harvest loss”. These KPIs demonstrate vulnerability of smallholders to resource inefficiency and environmental degradation. In terms of “financial” capital, “Income”, “Benefit–cost ratio”, and “Costs of cultivation and storage” were selected. These KPIs underscore the economic fragility of smallholders, particularly under market volatility and input price inflation. This is corroborated by the findings in [54], which emphasize the need for profitability metrics in evaluating the resilience and sustainability of smallholders. KPIs such as “Labor productivity”, “Number of memberships in farmer associations”, and “Farmer’s connectivity to social networks” are used to measure “human” and “social” capital. As is widely recognized in frameworks for sustainable agriculture, these KPIs highlight the social embeddedness of Tunisian smallholders and how collective structures can enhance resilience, knowledge sharing, and bargaining power. However, considering its low FQFD ranking (14th), it is probable that practitioners continue to consider these technologies as secondary, requiring capacity building and access facilitation. Finally, the “Number of agreements with stakeholders” indicator, which highlights the importance of multi-actor collaboration in sustainability governance, represents stakeholder capital.
In summary, the comparison of the capital-constrained algorithm and FQFD ranks highlights the importance of integrating structural feasibility analysis and prioritization. The final set of multi-capital KPIs responds not only to expert-based relevance but also to smallholders’ practical capacities and resource availabilities. This dual-filter approach strengthens the robustness of the KPI framework and supports context-sensitive sustainability monitoring, as encouraged in international best practices.

5.3. Sensitivity Analysis of KPI Ranking Results

In this experiment, a one-at-a-time sensitivity analysis was conducted as outlined in Section 3.4. This method was applied in two phases: a global analysis across all capitals, followed by a focused investigation on the most influential natural capital.

5.3.1. Global One-At-A-Time Capital Sensitivity Results

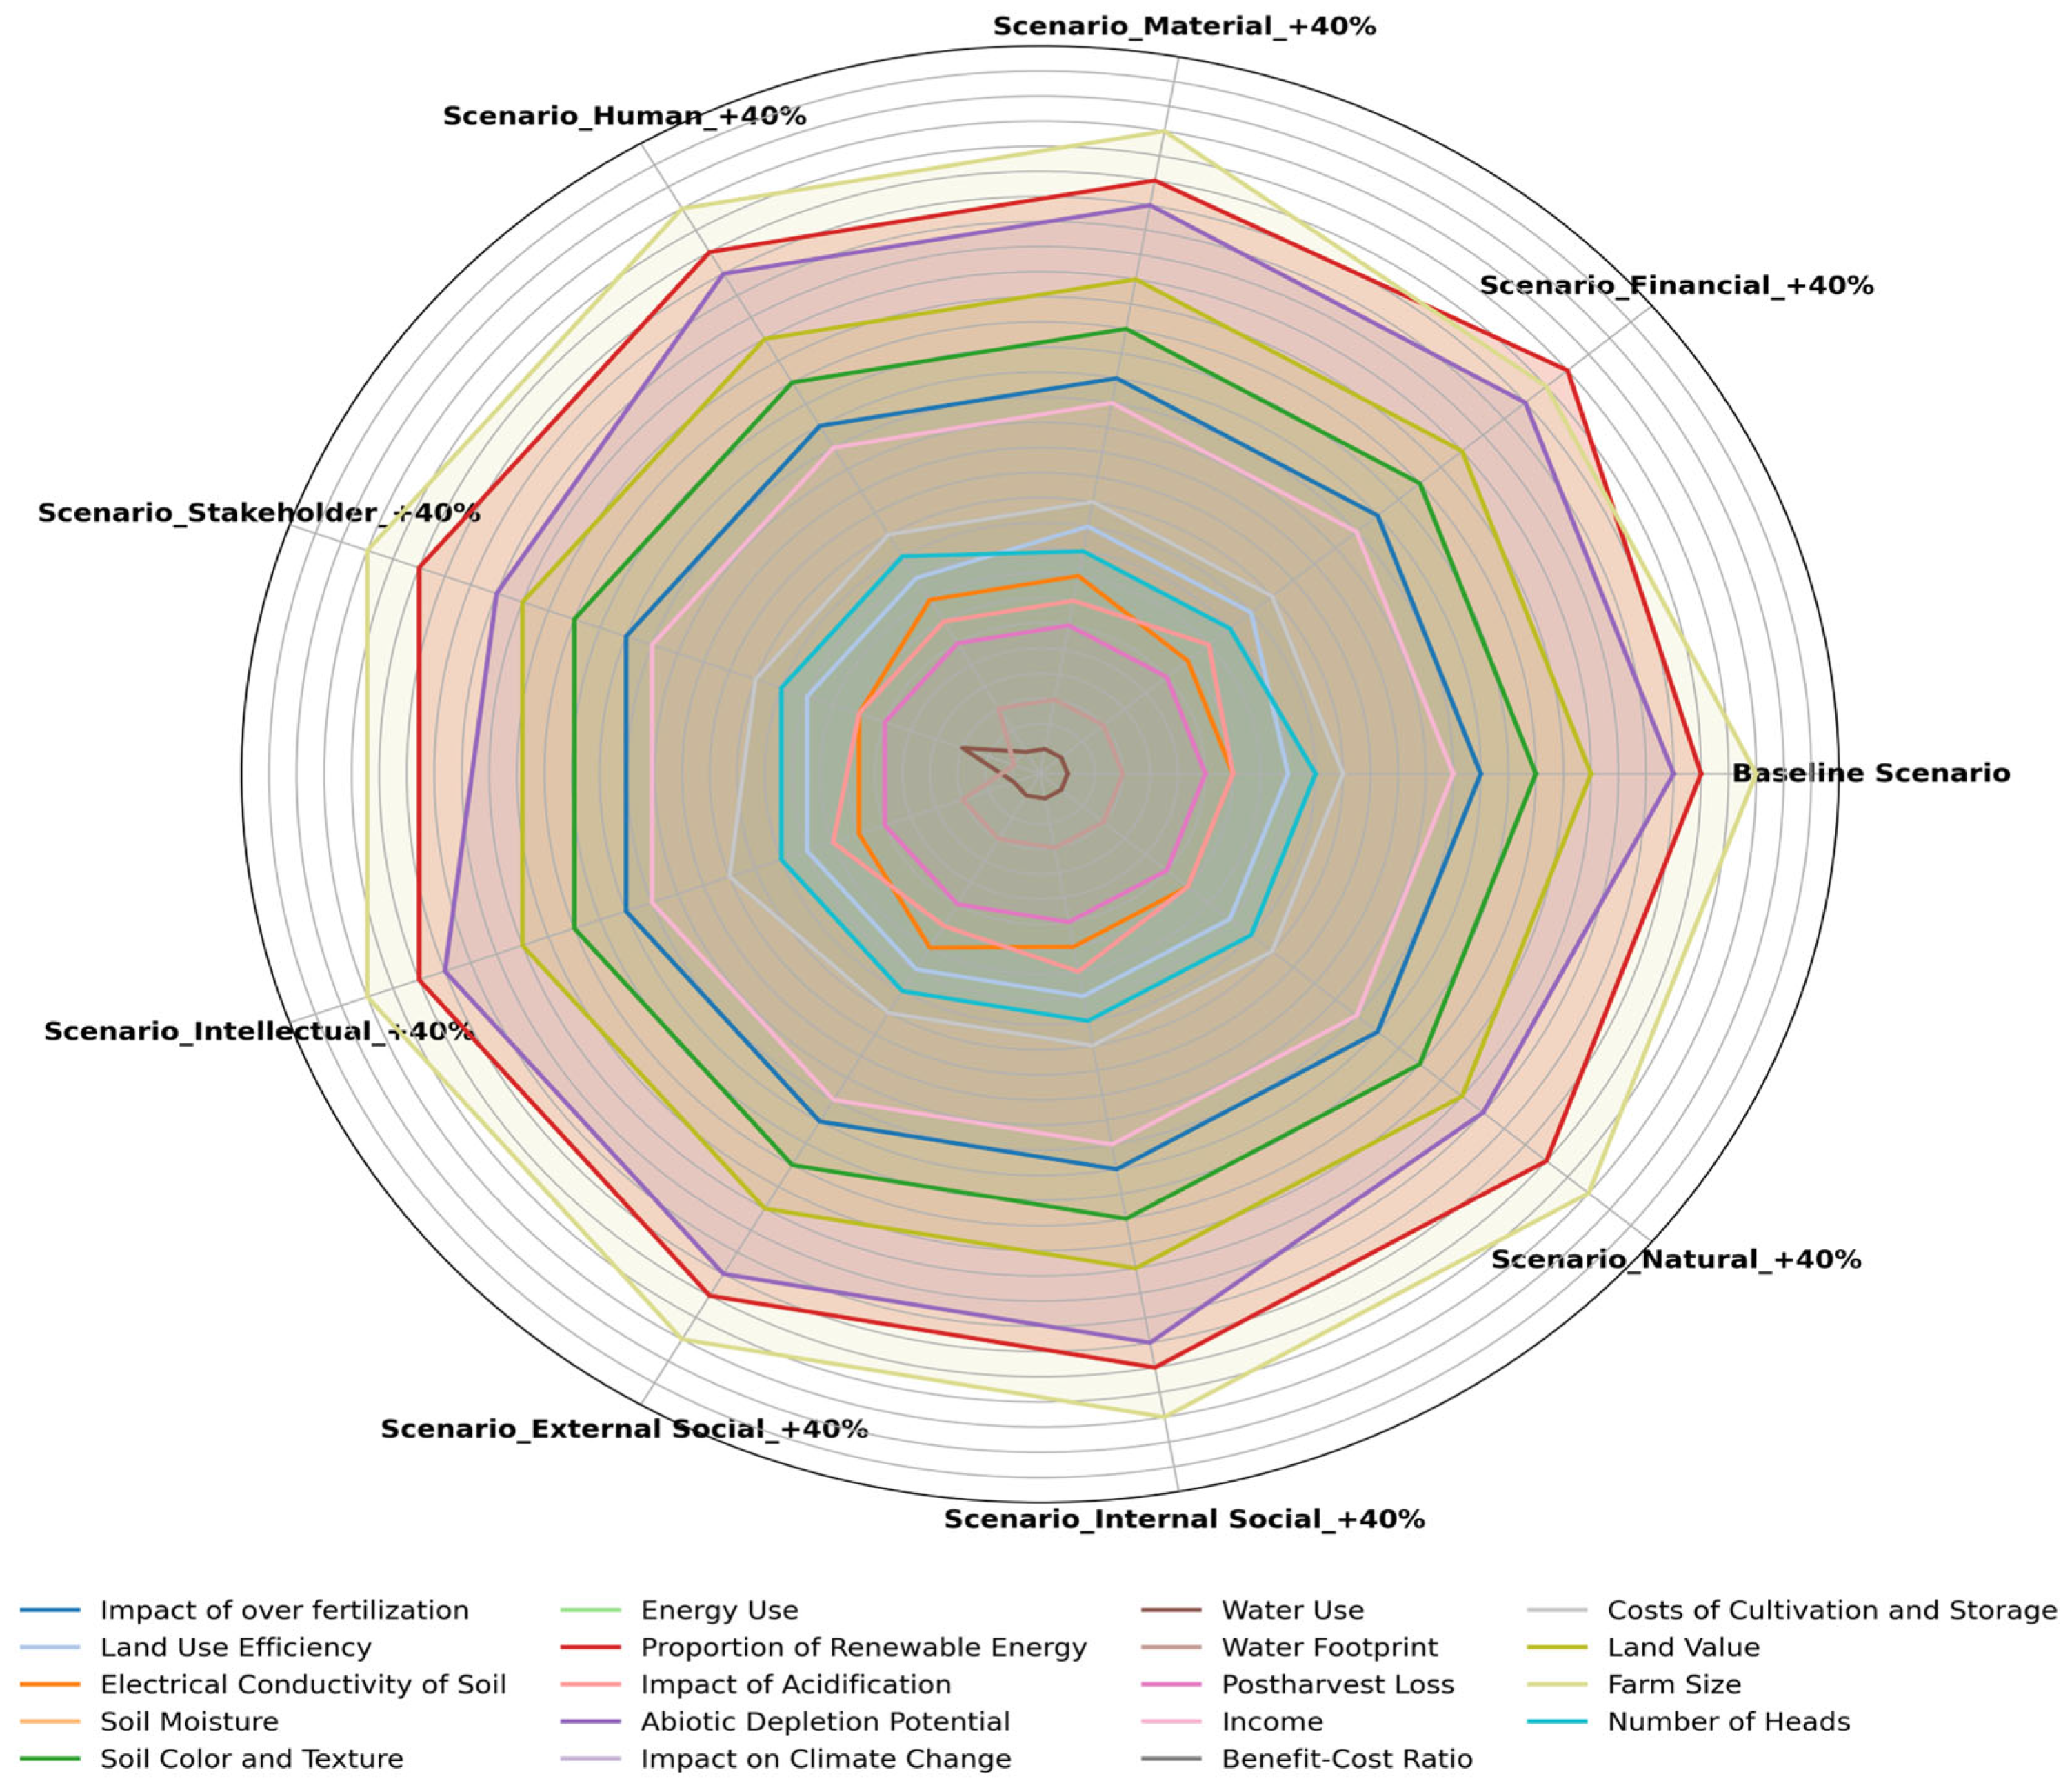
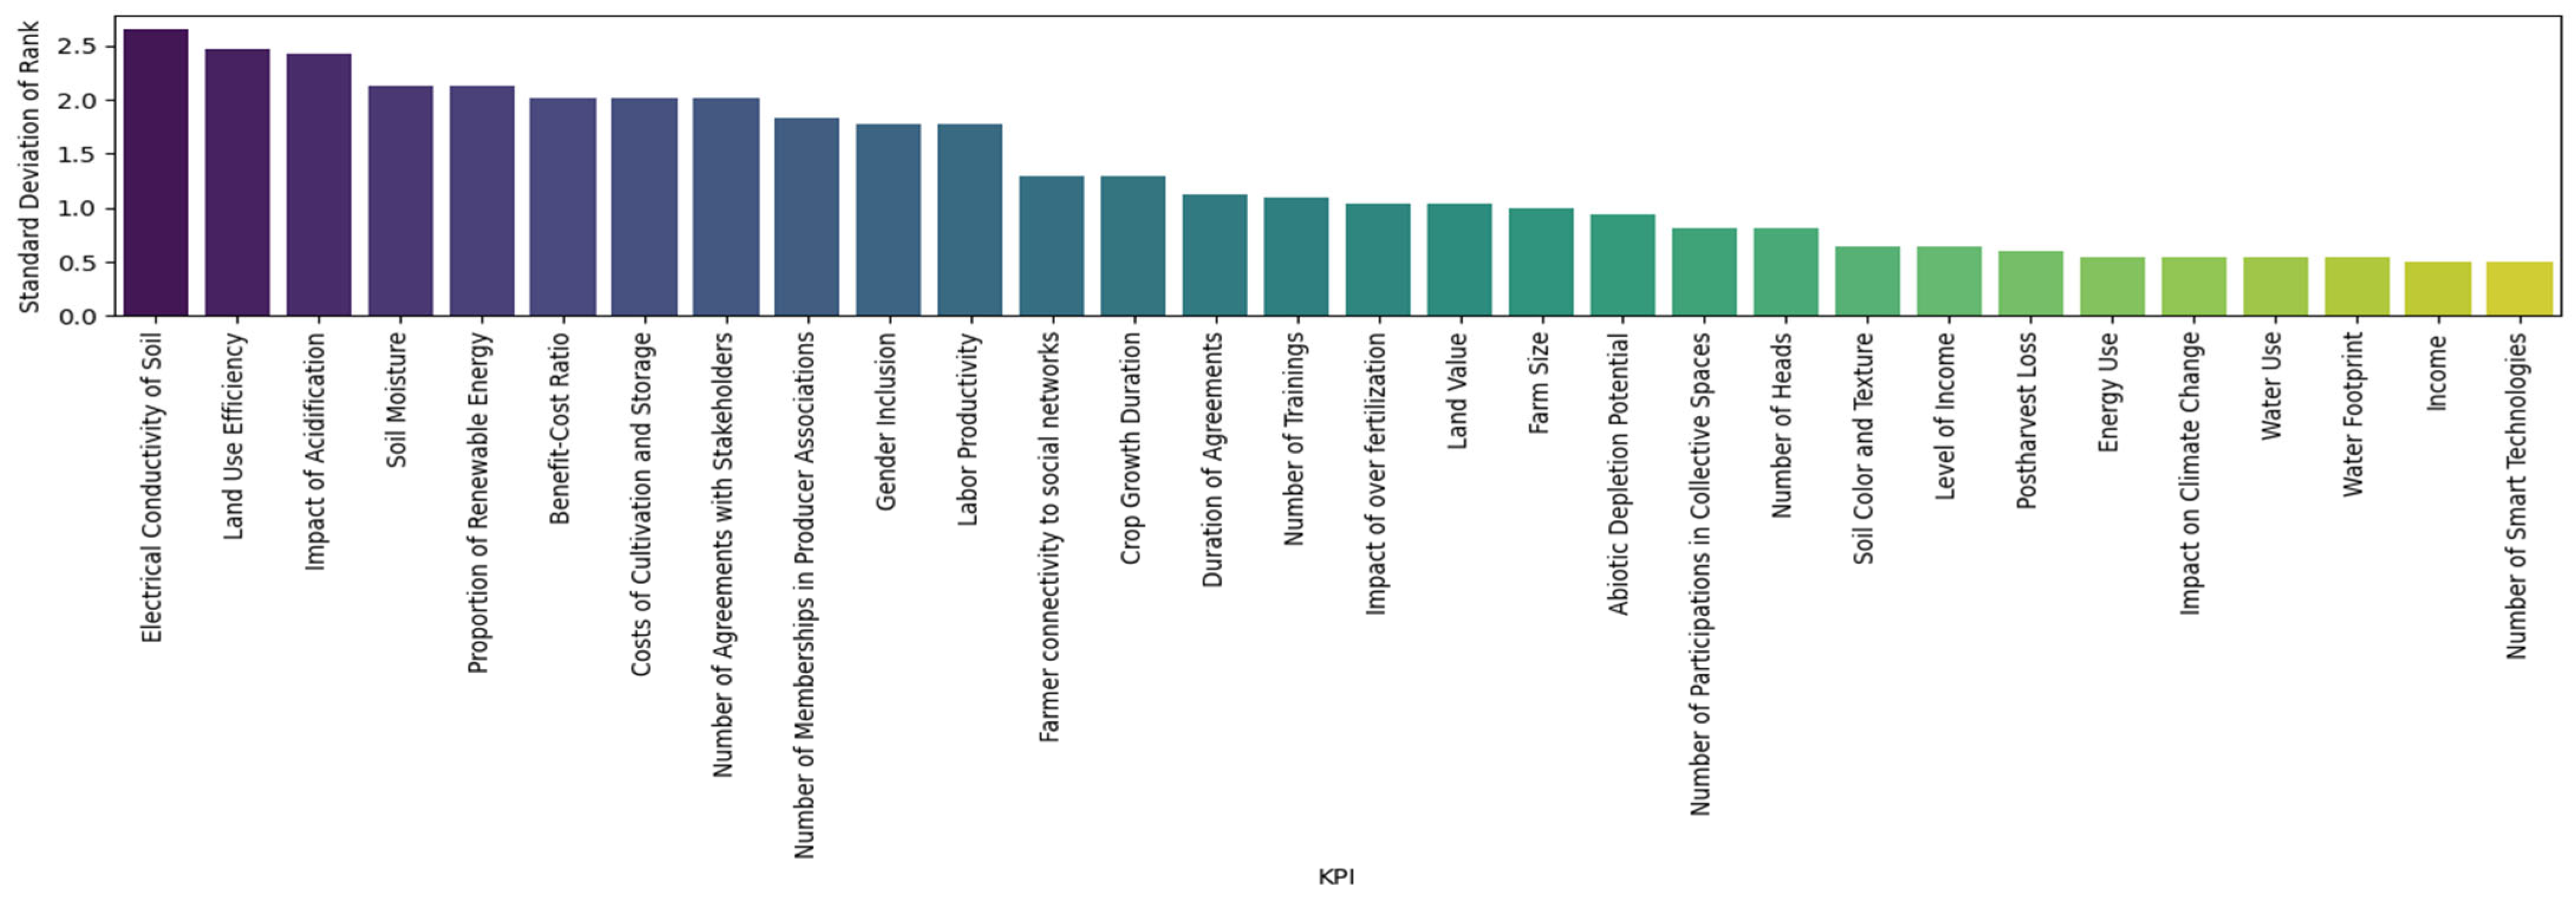
In this phase, the weight of each sustainability capital was individually increased by +40% from its original importance value C I p , while the weights of the remaining capitals were proportionally reduced to maintain the unit sum constraint. The +40% variation applied in the global analysis represents a realistic shift in capital weights, reflecting moderate perturbations in line with expert judgment. This procedure isolates the effect of each capital on KPI rankings and ensures internal consistency with the fuzzy evaluation framework. Given that the initial capital weights ranged between approximately 9% and 15%, this margin was considered sufficient to simulate potential variations in expert assessments. A total of eight simulations were performed, and the baseline scenario was retained, resulting in nine ranking scenarios in total. Figure 9 presents a radar chart showing the top 19 most sensitive KPIs across all scenarios. The radial axis represents the rank position of each KPI, with higher values indicating a lower rank. Each colored line corresponds to a specific scenario, including the baseline and the eight capital-perturbed scenarios. This visual representation allows easy comparison of KPI ranking variations across different capital weightings. Figure 10 displays the standard deviation of KPI rankings across these scenarios. The results show a low standard deviation for most indicators (generally below 1), confirming the stability and robustness of KPI rankings under moderate capital weight perturbations.

5.3.2. Sensitivity Analysis Results on the Natural Capital

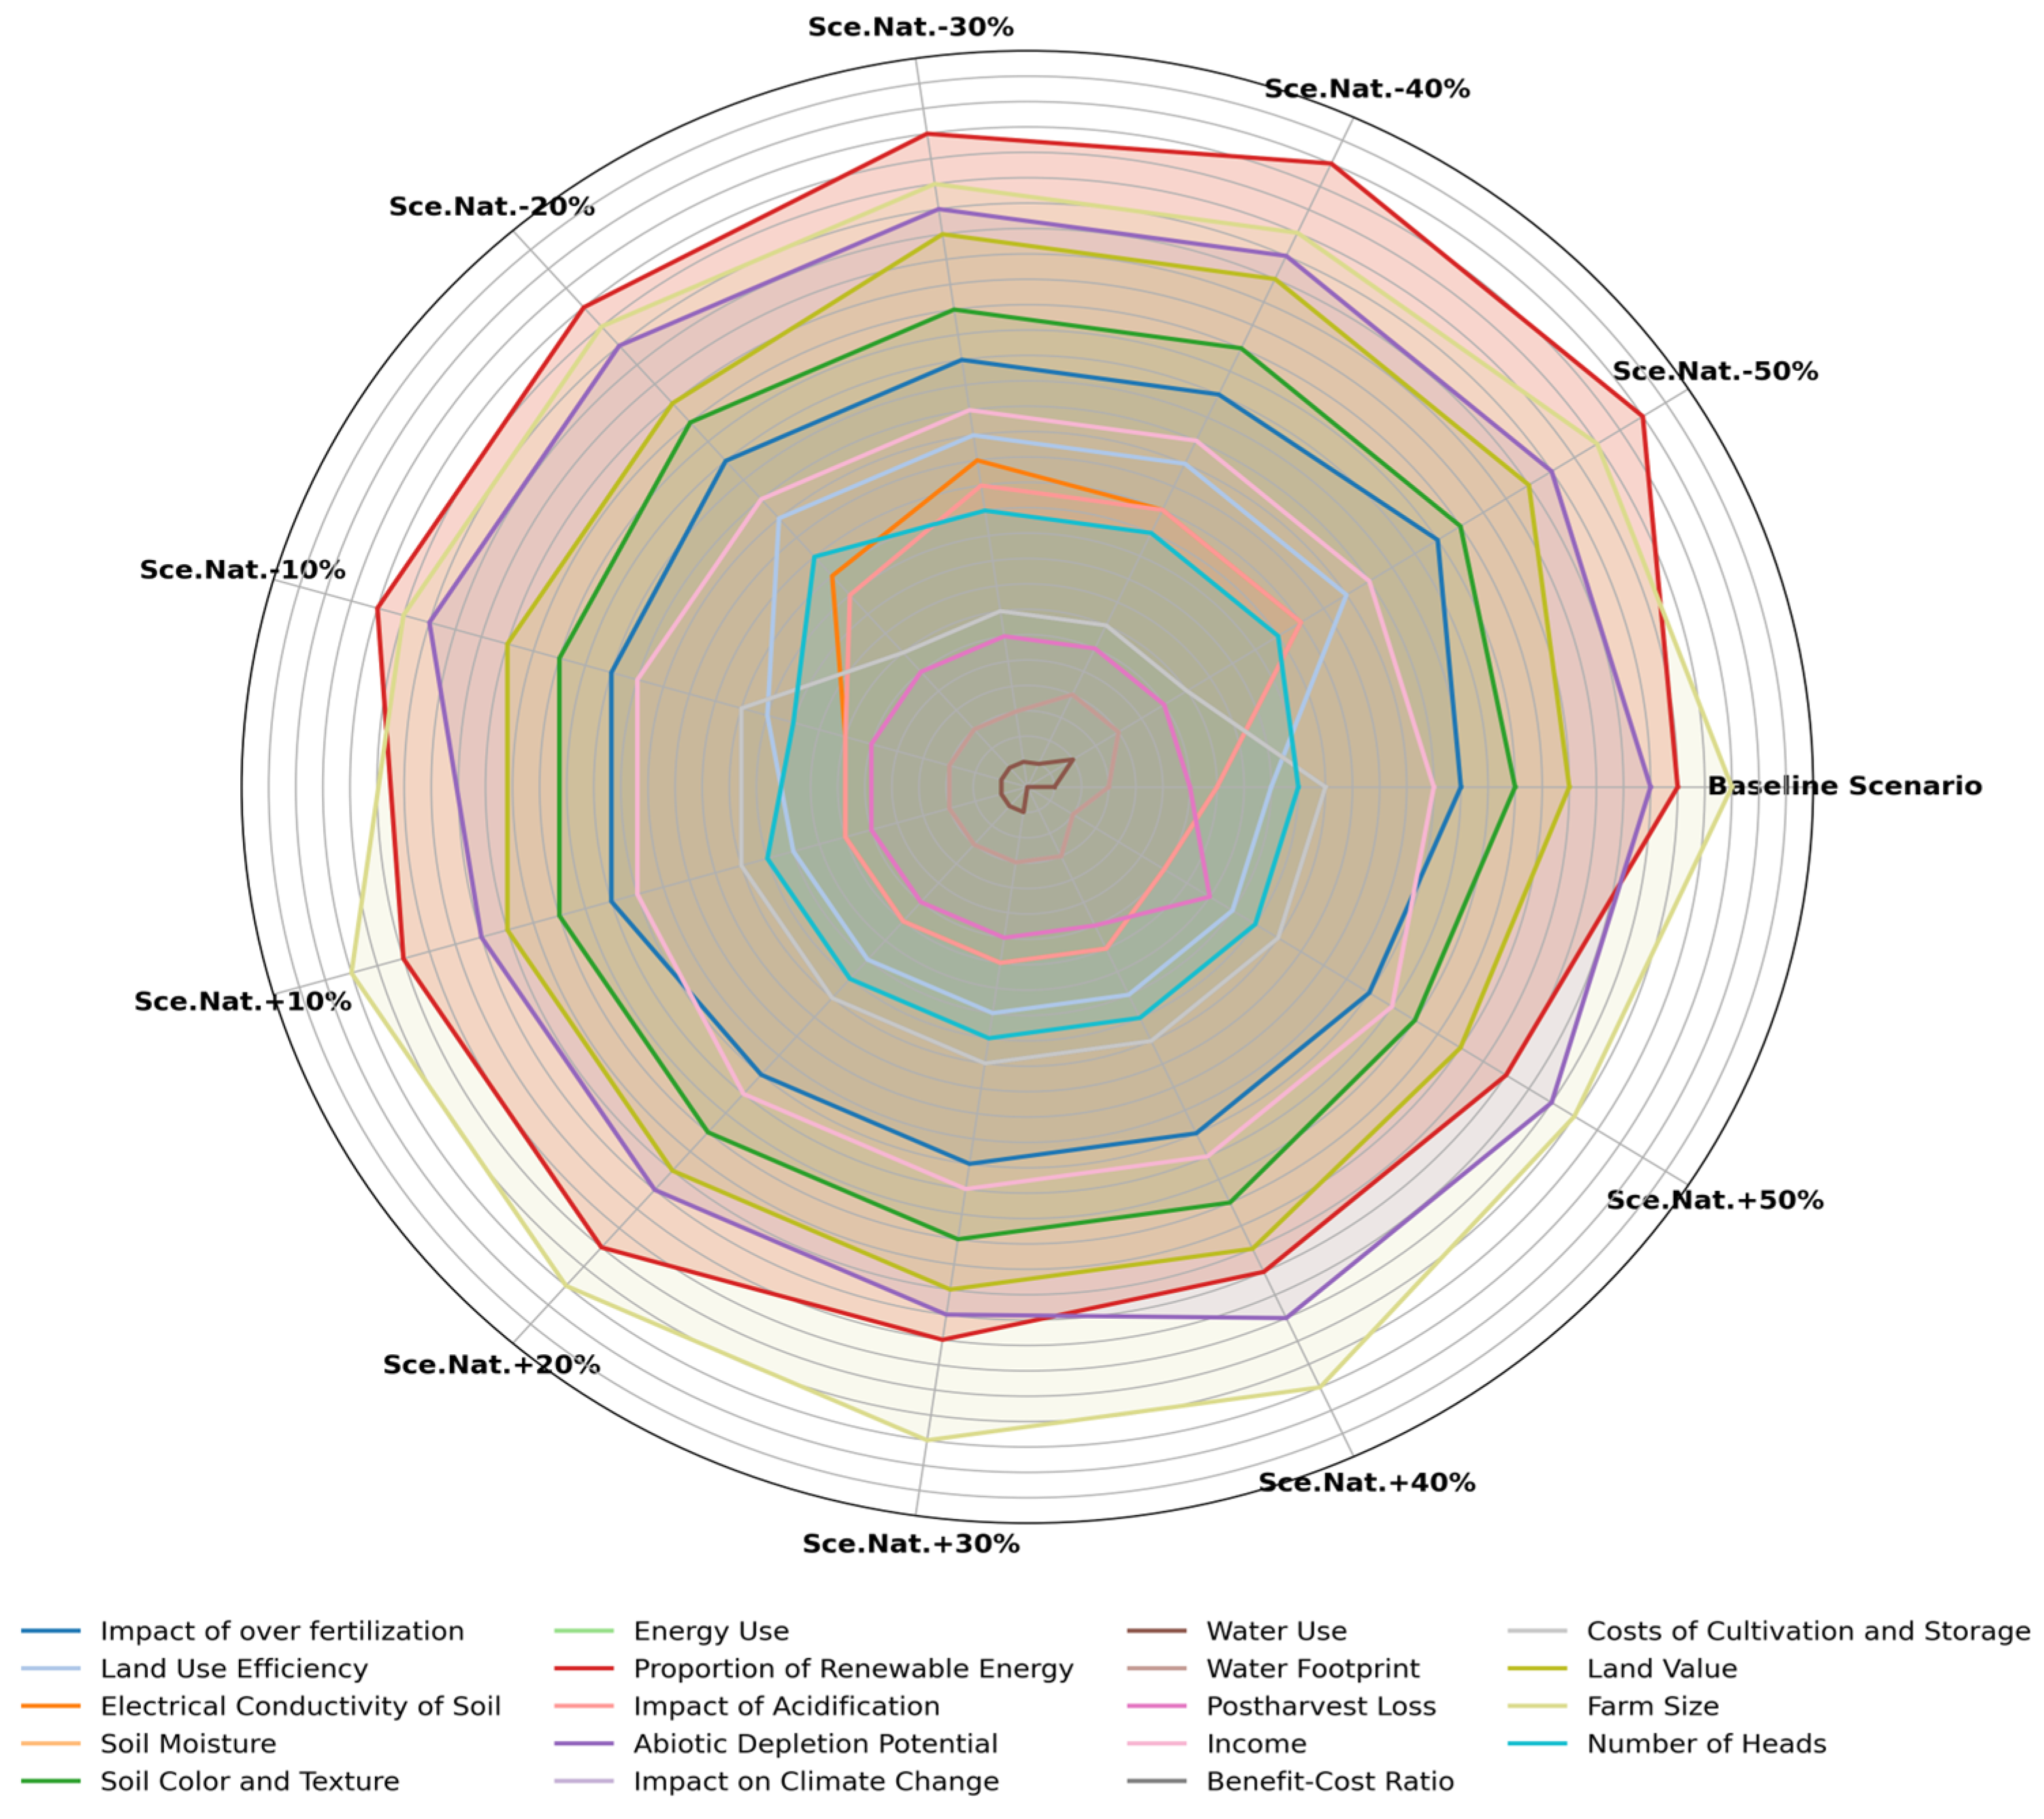
Based on the global sensitivity results, special attention was given to the natural capital, which holds the highest initial importance (~15.4%) and is associated with a significant number of related KPIs. The extended ±50% range for natural capital accounts for its higher influence and allows exploration of both under- and overestimation scenarios, ensuring a comprehensive sensitivity assessment. Therefore, the weight of the natural capital was systematically perturbed across ten incremental scenarios: −50%, −40%, −30%, −20%, −10%, +10%, +20%, +30%, +40%, and +50%. This extended sensitivity analysis allows for the examination of both underestimation and overemphasis of the natural capital, thereby simulating diverse policy or contextual shifts. The resulting KPI scores and ranks were recalculated for each scenario. Figure 11 shows the radar chart illustrating the rank variations in the 19 most sensitive KPIs across all ten scenarios. Figure 12 presents the standard deviation of these ranks. The results confirm that KPI rankings remain generally stable, with moderate fluctuations observed mainly in indicators closely tied to natural capital.
The results from both phases of the sensitivity analysis, the global one-at-a-time analysis on each capital, and the extended perturbation focused on natural capital, confirm the robustness of the FQFD prioritization approach. Indeed, the relatively low standard deviations observed in KPI rankings (generally below 3) demonstrate that moderate and even substantial variations in capital weights do not significantly affect the overall KPI order. This stability is particularly meaningful in real-world decision-making contexts, where the weights assigned to sustainability capitals may vary depending on expert preferences, local policy priorities, or regional strategic agendas. The consistent ordering of KPIs across varying weight scenarios highlights the methodological reliability of the proposed model. Therefore, these findings are consistent with the recommendations of the FAO [55], which emphasize the need for robust evaluation frameworks capable of withstanding uncertainty in expert judgment. Focused sensitivity analysis on natural capital, which has the highest initial importance (~15.4%), showed a slightly higher variability in the rankings of some KPIs that are closely related to environmental factors, like crop growth duration, post-harvest loss, and electrical conductivity of soil. This can be explained by their sensitivity to environmental conditions, making them more responsive to shifts in capital emphasis. On the other hand, KPIs like water use and energy use remained consistently high and stable in all tested scenarios, indicating their strong correlation with multiple capitals. In summary, the results confirm that the FQFD method enables a stable and adaptable prioritization process in a multi-capital setting.

5.4. Results of TRIZ Application

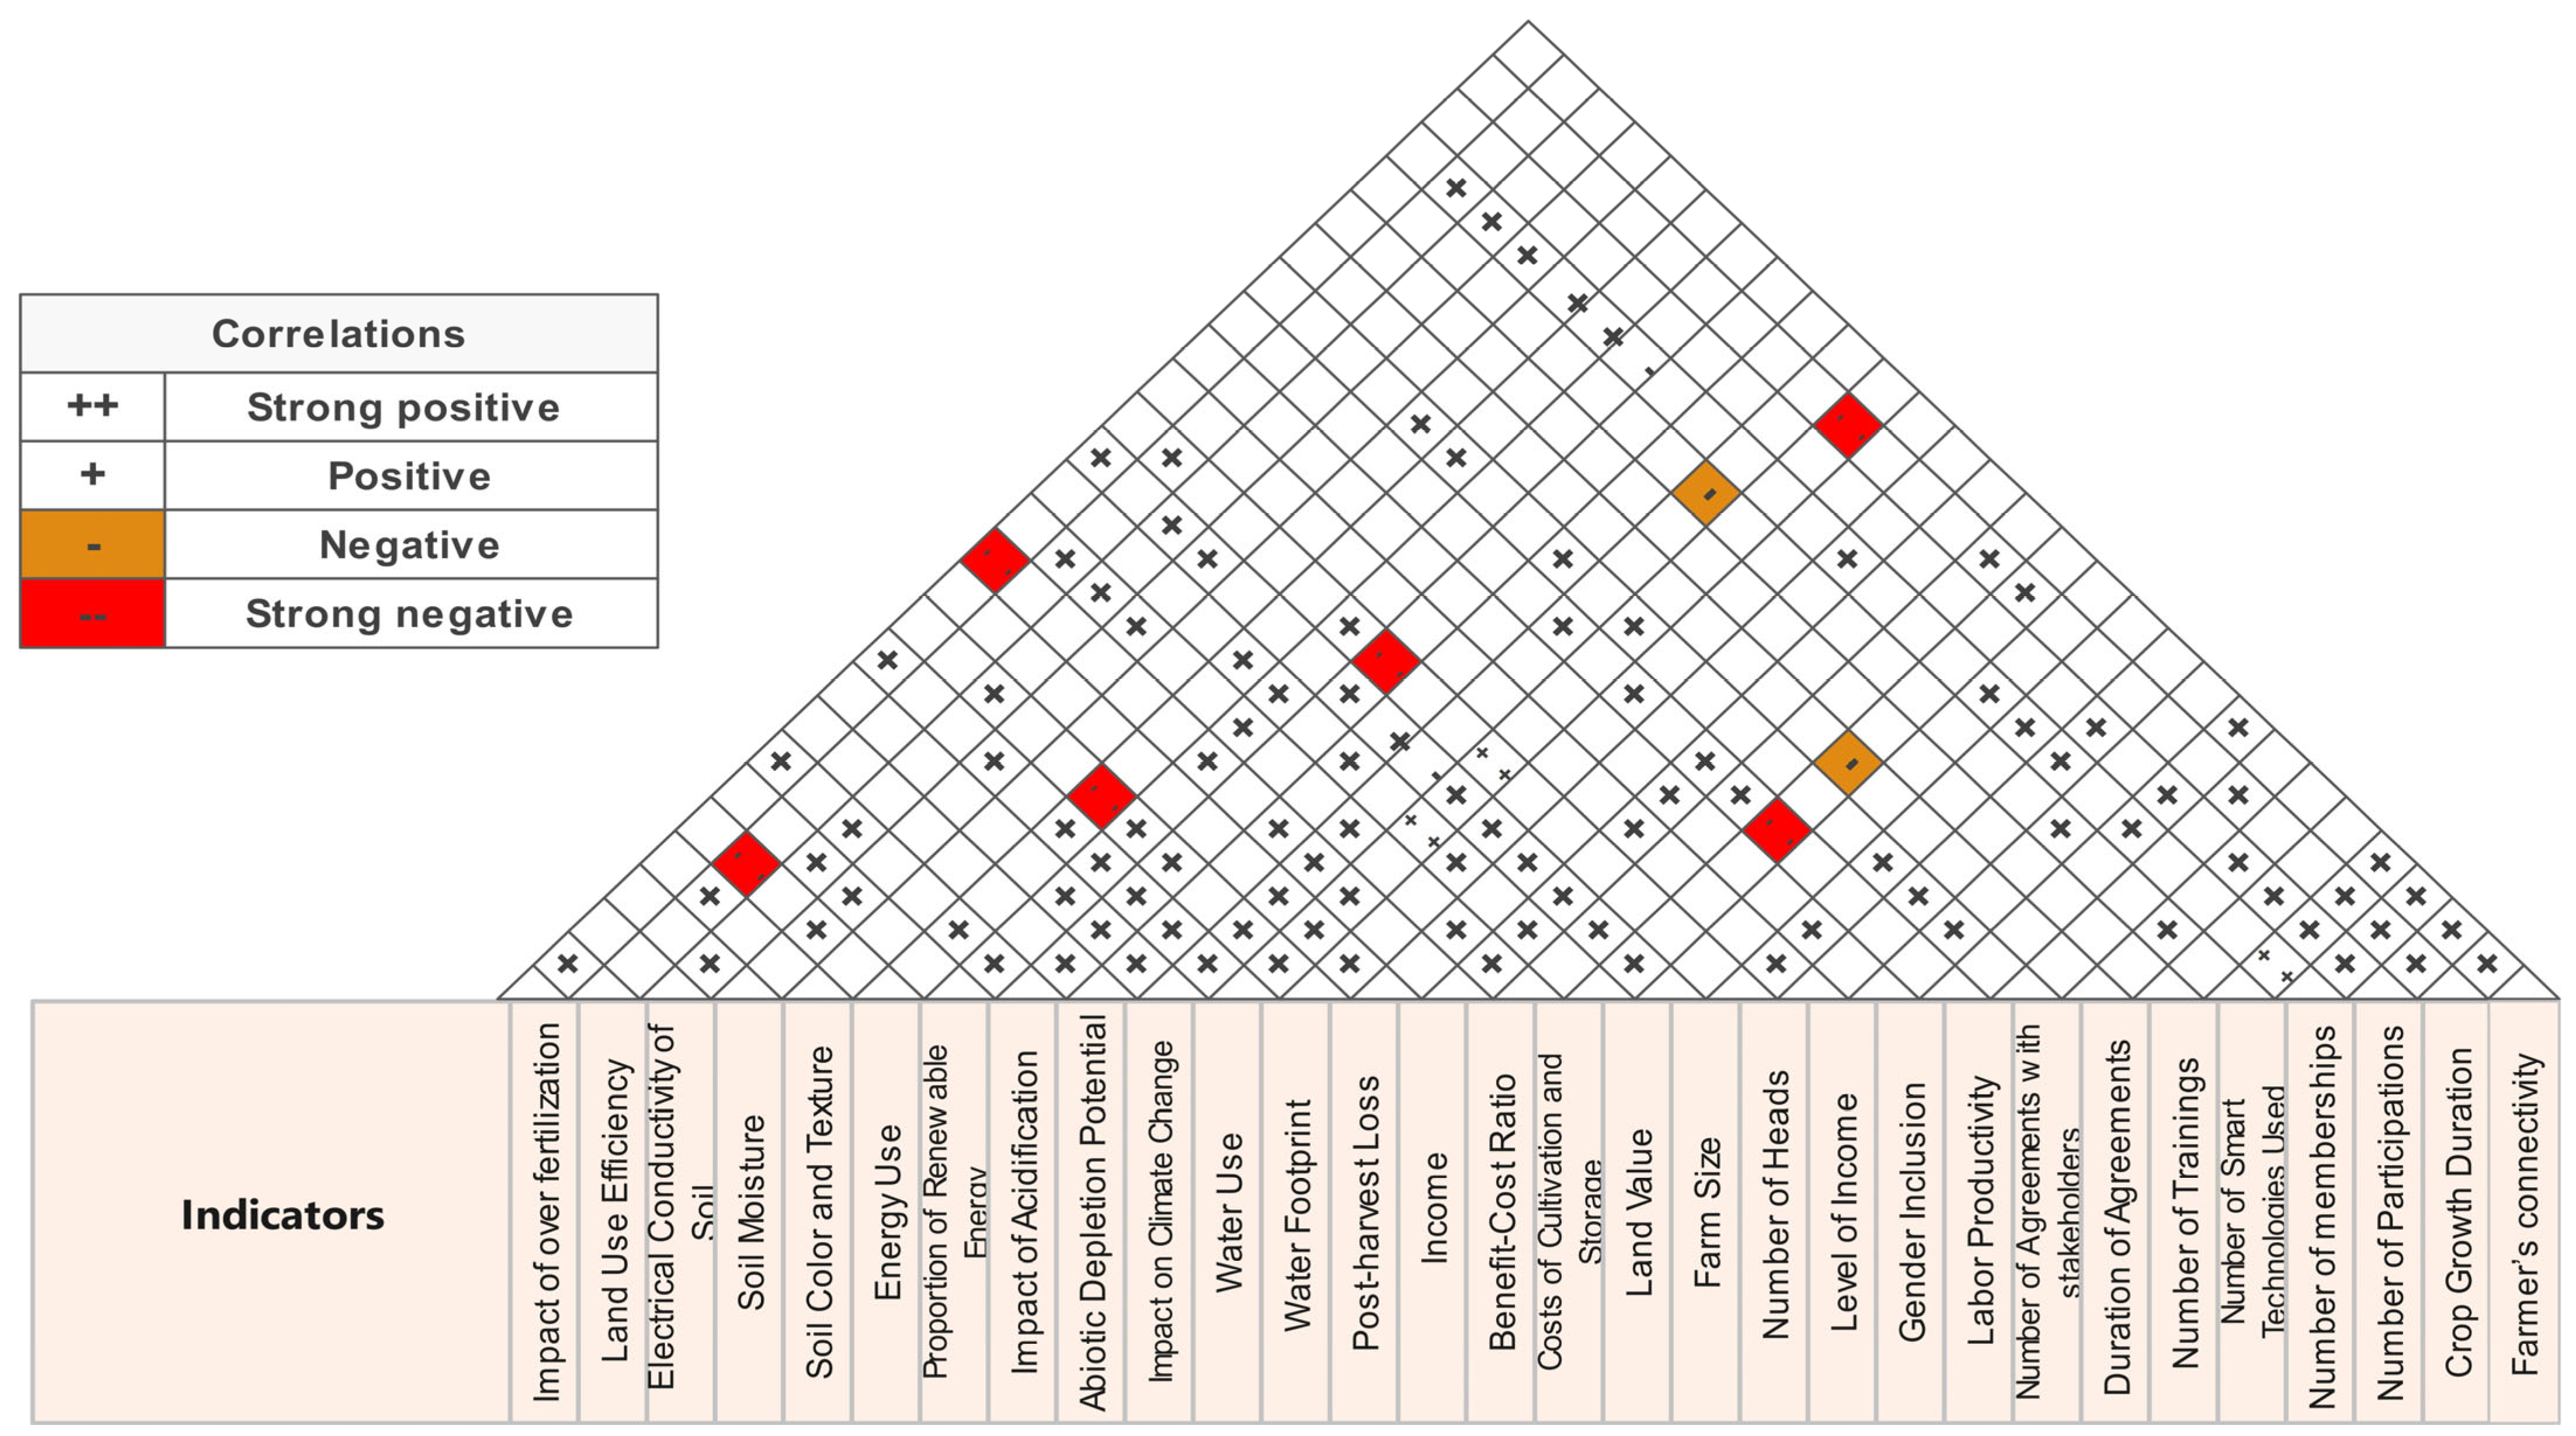
The contradictions derived from the triangular relationships in the correlation matrix at the roof of the HOQ are illustrated in Figure 13. From these results, two contradictions identified are marked with the symbol “−” (orange color), indicating negative relationships as assessed by experts. First, the contradiction between “impact on climate change” and “smart technology tools used” arises because digital and precision agriculture tools often reduce emissions, but their production and operation have a non-negligible carbon footprint. Second, the contradiction between the “number of agreements with stakeholders” and the “costs of cultivation and storage” reflects that certifications, contracts, or stakeholder partnerships often require compliance, audits, and administrative work, increasing operational costs.
In this paper, we focus only on contradictions marked with the symbol “− −” (red color), indicating strong negative relationships. Table 5 presents the list of identified contradictions, each characterized by an improved KPI that contributes positively to sustainability, but at the cost of a worsened KPI that becomes negatively impacted. To systematically address these contradictions, the reduced TRIZ contradiction matrix (Appendix A.3) was used. Each pair of conflicting KPIs was mapped to relevant improving and worsening parameters, which were then used to identify appropriate inventive principles. This enabled the formulation of tailored recommendations aimed at reconciling conflicting sustainability objectives.
The results indicate six major contradictions. For example, the conflict between ‘Land Use Efficiency’ and ‘Energy Use’ illustrates how these contradictions are traced from the FQFD and capital-constrained algorithm results. ‘Energy Use’ was ranked 1 and ‘Land Use Efficiency’ ranked 7, and the HOQ roof revealed a strong negative relationship between these two KPIs, highlighting a major contradiction that requires systematic resolution. This conflict arises when trying to achieve land use efficiency (parameter 39: productivity) through greenhouse cultivation, mechanized operations, or pressurized irrigation techniques. Thus, these methods will certainly lead to increased energy consumption (parameter 19: energy consumption), which involves the costs linked to fuel, electricity, and maintenance. To clear this contradiction, we use inventive principle 10 (preliminary action), which recommends that specific actions be taken beforehand to lessen the constraints or resource needs in the future. For instance, smallholders can apply this by preparing soil during off-peak hours, hence reducing the need for energy-intensive interventions during the growing season. In addition, reliance on electrically powered systems during periods of peak demand can be reduced for effective backup plans by installing manual backup solutions or passive irrigation systems beforehand. Principle 22 (turning harm into benefit) further advocates for the conversion of negative effects into productive ones. For example, greenhouse excess heat could be diverted into heating seedling beds or irrigation water, thus lowering external energy dependence. Similarly to this, agricultural waste could be transformed into biogas or bio-fertilizers, hence providing further on-farm energy sources.
For the other contradictions mentioned in Table 5 the reduced matrix proposes innovative recommendations, clearly defined below, with specific actions to be taken:
  • Contradiction income vs. impact of over-fertilization
    Solution 10: Preliminary Action
    • Conduct thorough soil analyses prior to fertilizer application to accurately determine nutrient needs.
    • Nutrition requirement modeling can be further used to fine-tune timing of fertilizer applications and application dosage.
    Solution 23: Feedback
    • Use nutrient sensors or crop growth indicators to monitor the nutrient status of the plant in real time.
    • Fertilizer applications should then be dynamically adjusted according to monitoring data, so as to maximize its efficiency and minimize its waste.
  • Contradiction crop growth duration vs. water use
    Solution 25: Self-Service
    • Self-irrigating mechanisms like hydrogels can be used to retain moisture in the soils.
    • Mulching can reduce evaporation and conserve moisture in the soils.
    • Use greenhouse systems that recycle condensation to irrigate crops automatically.
  • Contradiction number of heads vs. impact of acidification
    Solution 3: Local Quality
    • Establishing site-specific livestock zoning and managing herds on soils with high buffering capacity to minimize acidification risks.
    • Restricted ammonia removal systems such as bio-filters, acid scrubbers, or enhanced passive ventilation ought to be installed in livestock housing.

5.5. Discussion

The integration of FQFD and TRIZ in this paper provides both methodological and empirical contributions to sustainability assessment in smallholder systems. Unlike traditional approaches such as SMART or AHP, based on hierarchical structures and linear assumptions of the preference, the proposed framework addresses the dynamic interdependencies and conflicting priorities mostly encountered in complex logistic environments. FQFD better accommodates expert knowledge in their structured interaction concerning the evaluation of sustainability indicators, managing vagueness and subjectivity when defining these indicators. Meanwhile, TRIZ puts more emphasis on creating a systematic mechanism in which contradictions can be derived and solved among these KPIs, especially where they represent operational trade-offs based on environmental, social, and economic dimensions. This duality makes the approach more robust and actionable compared to conventional MCDM techniques such as AHP [41] and BWM [56], which primarily stop at weighting and ranking indicators without providing conflict resolution strategies.
Empirical results highlighted natural and financial capitals as the most influential drivers of sustainability, with material, stakeholder, and intellectual capitals of moderate importance, and human and social capitals ranking lower. The capital-constrained algorithm validated 19 high-priority KPIs, including water and energy use, climate impact, post-harvest losses, income, and social/governance indicators such as stakeholder agreements and cooperative memberships. The sensitivity analysis confirmed that KPI rankings remained stable despite substantial variations in capital weights, underscoring the methodological reliability of the model. While natural-capital-related KPIs showed slightly higher variability due to their environmental sensitivity, key indicators such as water and energy use remained consistently robust. This resilience reflects the structural alignment of multi-capital interdependencies and corroborates FAO [51] recommendations on the need for evaluation frameworks capable of withstanding uncertainty in expert judgment. These results draw attention to the double vulnerability of Tunisian smallholders to environmental and economic stress and underline the need to keep a close watch on profitability and resource use efficiency [57,58]. Indicators such as stakeholder agreements and cooperative memberships also highlight the importance of social embeddedness in building resilience and collective governance [59]. The behavior was shown to be robust in the presence of uncertainty. Sensitivity analysis demonstrated consistent KPI ranks even under large-scale changes in capital weighting, implying firmness and some extent of generalizability of these KPIs to other agricultural settings [55]. The sensitivity analysis relies on a compensatory approach, in which decreases in the importance of one capital are proportionally redistributed among the others. This assumption allows the analysis to be conducted, and maintaining the normalization, however, may not be able to fully account for sustainable contexts in which capitals are not substitutable [60].
TRIZ converted contradictions into actionable strategies, including soil preparation, real-time nutrient monitoring, mulching, greenhouse condensation recycling, and site-specific livestock management. These interventions reconcile productivity, environmental, and economic objectives, reflecting best practices in sustainable agriculture [61]. The solutions derived from the TRIZ contradiction matrix show strong alignment with current research and global best practices for sustainable agriculture. These technologies for real-time monitoring and precision fertilization mimic advances in precision agriculture proven to reduce nutrient losses while sustaining yield [62]. In livestock systems, improving manure management and adjusting practices to site-specific conditions are recognized methods of reducing environmental impacts [63]. For water issues, solutions like mulching, recycling greenhouse condensation, and self-watering systems match sustainable intensification strategies aimed at improving water use efficiency [9].
Overall, the resolution of trade-offs along with the prioritization and the treatment of contradictions, built from both FQFD and TRIZ, leads to enriching sustainability science practices in a participative and context-sensitive way. In terms of practice, it feeds dashboards, collective performance contracts, or policy monitoring tools for adaptive and evidence-based decision-making. Future studies can capitalize on the priority KPIs to construct composite sustainability indices [57,64] as well as monitor the added value of the proposed methodology by comparing it to current MCDM methods.
These results reinforce the methodological and empirical contributions of the FQFD–TRIZ framework and provide actionable insights for policymakers, agricultural coordinators, and rural development organizations, supporting adaptive sustainability strategies in smallholder systems and other complex agri-food contexts.

6. Conclusions and Future Research

This paper proposes a novel approach combining multi-expert FQFD and TRIZ for advancing sustainability assessment for smallholders. The approach addresses important issues such as uncertainty, resource limitations, and competing sustainability targets while identifying and prioritizing context-specific, multi-capital, actionable sustainability KPIs. When tested in a Tunisian case study, the proposed approach proved that decision-making can be guided by imposing specific interventions for smallholders. It is scalable, and thus able to adapt to different geographic settings, agricultural sectors, and sustainability frameworks such as the Sustainable Development Goals (SDGs). The adaptability thus increases its relevance as it allows alignment with global and national sustainability agendas for a range of smallholder-focused initiatives. In the Tunisian case study, 19 KPIs were validated, covering eight sustainability capitals. Highly prioritized KPIs are traced by the framework (like energy use, water use, etc.), and contradictions were solved using TRIZ principles. There were practical applications for smallholders that involved optimizing irrigation, redirecting excess greenhouse heat, and preparing soil during off-peak hours. These findings illustrate the power of the proposed framework to guide actionable sustainability decisions, with top-ranked KPIs highlighting priorities for resource management, post-harvest improvements, and participatory governance through social and stakeholder-related indicators. However, this work has some limitations, including the use of only one case in Tunisia and the use of expert opinions, which could affect the generalizability. The framework should be tested on and adjusted to different contexts, with the participation of other stakeholders. Promising future lines of investigation would be the following:
(i)
To enable a more thorough and system-wide sustainability evaluation, the suggested methodological framework could be extended to include a wider range of AFSC actors, such as important stakeholders, transport and logistics providers, and policymakers.
(ii)
A smallholder-specific digital decision support dashboard that builds on the prioritized sustainability KPIs can be created to support alignment with sustainability goals, highlight priority areas for improvement, and offer real-time monitoring. By incorporating dynamic data sources like IoT-enabled sensors and participatory mobile applications, the effectiveness can be further improved.
(iii)
Finally, integrating FQFD and TRIZ approaches into intelligent platforms or AI-powered decision support systems could enhance the responsiveness and preferences of recommendations for smallholders. For example, KPIs prioritization, if coupled with real-time analytics, predictive modeling, and adaptive dashboards, might significantly improve supply chain agility, optimize input use, and improve policy interventions.

Author Contributions

Conceptualization, L.S. and A.Z.; methodology, S.C.; software, A.F.; validation, S.C., L.S. and A.Z.; formal analysis, A.F.; investigation, A.F.; resources, S.C.; data curation, A.F.; writing—original draft preparation, A.F.; writing—review and editing, S.C., A.F. and L.S.; visualization, A.M.; supervision, L.S.; project administration, A.M.; funding acquisition, L.S. All authors have read and agreed to the published version of the manuscript.

Funding

This work is part of the research project entitled “Smart Models for Agri food Local value chain based on Digital technologies for Enabling COVID-19 Resilience and Sustainability” (SMALLDERS), funded by the PRIMA Program-Section 2 Call multi-topics 2021, through the Ministry of Higher Education and Scientific Research (Tunisia).

Data Availability Statement

Data will be made available on request.

Conflicts of Interest

The authors declare no conflicts of interest.

Abbreviations

The following abbreviations are used in this manuscript:
KPIKey performance indicator;
FQFDFuzzy quality function deployment;
TRIZInventive problem solving;
AFSCAgri-food supply chains;
HOQHouse of Quality;
MCDMMulti-criteria decision-making;
TFNTriangular fuzzy number;
AHPAnalytic hierarchy process.

Appendix A

Appendix A.1

Table A1. Selected TRIZ parameters and justifications.
Parameter No.NameJustification in Agricultural Context
7Volume of moving objectCaptures the material flow intensity affecting natural capital and input efficiency.
10Force (intensity)Reflects the effort or intensity involved in manual or mechanized agricultural processes.
13Stability of the objectSupports resilience of soil and system functions under environmental or operational stress.
19Use of energy by moving objectTargets energy consumed by mobile farm equipment like tractors and irrigation units.
20Use of energy by stationary objectFocuses on energy consumption of fixed systems like cold storage or greenhouses.
21PowerMeasures operational capacity and mechanical output affecting productivity.
22Loss of energyHighlights inefficiencies in energy use that increase environmental burden.
23Loss of substanceRelates to physical material losses (e.g., leaching, spoilage) impacting both environmental and financial capitals.
24Loss of informationAddresses data loss or miscommunication that reduces the effectiveness of technological interventions.
25Measurement accuracyEnsures precision in monitoring sustainability indicators under natural capital.
26Loss of timeFocuses on process efficiency and time-related trade-offs in agricultural cycles.
27ReliabilityEnsures consistent functionality of critical infrastructure and tools used in smallholder systems.
30Object-affected harmful factorsRefers to external harmful influences acting on the farming system, including pollution or market volatility.
31Object-generated harmful factorsRelates to harmful by-products or consequences generated by the farming system itself.
34Ease of repairReduces downtime by facilitating maintenance, crucial in low-resource environments.
36Device complexityAffects user-friendliness and appropriateness of technology for smallholder use.
39ProductivityCentral to sustainability; reflects the system’s ability to generate value across multiple capitals.
Source: Based on TRIZ theory [14,50], elaborated by the authors.

Appendix A.2

Table A2. Selected TRIZ inventive principles and justifications.
Principle No.NameDefinitionJustification in Agricultural Context
1SegmentationDivide an object or system into independent parts.Allows modular solutions (e.g., segmented irrigation or land units), improving adaptability and precision.
3Local QualityMake each part of an object suitable for its specific function.Encourages site-specific interventions (e.g., localized fertilization or targeted pest control).
5GroupingCombine similar functions, components, or actions in space/time.Promotes efficiency (e.g., simultaneous field operations or grouping of training/inputs).
6UniversalityMake one object perform multiple functions.Enhances resource efficiency (e.g., tools that serve several purposes, multifunctional farm spaces).
8Anti-weightCompensate an undesirable effect (e.g., weight) using an opposite force or support.Helps counteract environmental burdens (e.g., energy consumption or emission impacts) by passive design or natural balancing.
9Preliminary CounteractionAnticipate and counteract negative effects before they occur.Supports proactive strategies (e.g., soil treatment before expected stress or emission peaks).
13InversionReverse the direction or action of a process.Encourages rethinking conventional practices (e.g., reusing waste, switching roles between manual and automated operations).
19Periodic ActionReplace continuous action with intermittent pulses; adjust timing/amplitude.Applies well to irrigation, energy cycles, or crop rotation to reduce resource consumption.
22Turning Harm into BenefitUse or transform harmful effects into useful ones.Ideal for sustainability, e.g., using ammonia emissions as fertilizers, reusing organic waste.
10Preliminary ActionPerform required changes or preparations in advance.Encourages early interventions (e.g., preparing soil or infrastructure before seasonal stress or demand surges).
23FeedbackIntroduce a feedback loop to monitor and adjust performance.Enhances data-driven decision-making (e.g., monitoring KPIs to guide irrigation, fertilization, or livestock feeding).
25Self-serviceMake objects or systems serve themselves by performing auxiliary functions.Promotes autonomy (e.g., self-regulating irrigation systems, sensors triggering alerts or actions without human input).
Source: Based on TRIZ theory [14,50], elaborated by the authors.

Appendix A.3

Figure A1. Reduced TRIZ Contradictions Matrix The colors indicate the type of parameter: light gray for worsening parameters, pink for improving parameters, and dark gray for empty cells.
Sustainability 17 08277 g0a1

Appendix B

Table A3. First List of KPIs Identified for the Case Study.
DimensionCapitalsIndicators
EnvironmentalNatural
Natural resources and ecosystems supporting the farm’s productivity and sustainability.
Impact of over-fertilization
Land use efficiency
Electrical conductivity of soil
Soil moisture
Soil color and texture
Energy use
Proportion of renewable energy
Impact of acidification
Abiotic depletion potential fossil fuels
Impact on climate change
Water use
Water footprint
Post-harvest loss
Crop growth duration
EconomicFinancial
Monetary resources and investments available to the smallholder for farm operations and growth.
Income
Benefit–cost ratio
Costs of cultivation and storage
Material
Physical assets and inputs used on the farm.
Land value
Farm size
Number of heads
Stakeholders
Relationships and support from family, community, suppliers, and customers linked to the farm.
Number of agreements with stakeholders
Duration of agreements before breaking
Intellectual
Knowledge and skills of the farming household applied to improve productivity and value.
Number of smart technologies tools used
Number of trainings
Human
Individual characteristics and abilities contributing to farm functioning and resilience.
Level of income
Labor productivity
Gender inclusion
SocialInternal Social
Farmer’s integration and participation in local farming groups or cooperatives.
Number of memberships in farmer’s associations
External Social
Links with external actors that support the farm’s outreach and visibility.
Number of participations in collective spaces
Farmers connectivity to social networks

Appendix C

Figure A2. Multi-Expert Fuzzy HOQ.
Sustainability 17 08277 g0a2

References

  1. Lowder, S.K.; Sánchez, M.V.; Bertini, R. Which farms feed the world and has farmland become more concentrated? World Dev. 2021, 142, 105455. [Google Scholar] [CrossRef]
  2. Tendall, D.M.; Joerin, J.; Kopainsky, B.; Edwards, P.; Shreck, A.; Le, Q.B.; Kruetli, P.; Grant, M.; Six, J. Food system resilience: Defining the concept. Glob. Food Secur. 2015, 6, 17–23. [Google Scholar] [CrossRef]
  3. Nyamasoka-Magonziwa, B.; Vanek, S.J.; Ojiem, J.O.; Fonte, S.J. A soil tool kit to evaluate soil properties and monitor soil health changes in smallholder farming contexts. Geoderma 2020, 376, 114539. [Google Scholar] [CrossRef]
  4. Vanlauwe, B.; AbdelGadir, A.H.; Adewopo, J.; Adjei-Nsiah, S.; Ampadu-Boakye, T.; Asare, R.; Baijukya, F.; Baars, E.; Bekunda, M.; Coyne, D.; et al. Looking back and moving forward: 50 years of soil and soil fertility management research in sub-Saharan Africa. Int. J. Agric. Sustain. 2017, 15, 613–631. [Google Scholar] [CrossRef] [PubMed]
  5. Bell, S.; Morse, S. Sustainability Indicators: Measuring the Immeasurable? 3rd ed.; Routledge: Abingdon, UK, 2020. [Google Scholar]
  6. Bathaei, A.; Štreimikienė, D. A systematic review of agricultural sustainability indicators. Agriculture 2023, 13, 241. [Google Scholar] [CrossRef]
  7. European Environment Agency (EEA). Sustainable Development Goals and the Environment in Europe: A Cross-Country Analysis and 39 Country Profiles. 2021. Available online: https://www.eea.europa.eu/en/analysis/publications/sustainable-development-goals-and-the-environment-in-europe-a-cross-country-analysis-and-39-country-profiles (accessed on 17 July 2025).
  8. Silvestri, C.; Silvestri, L.; Piccarozzi, M.; Ruggieri, A. Toward a framework for selecting indicators of measuring sustainability and circular economy in the agri-food sector: A systematic literature review. Int. J. Life Cycle Assess. 2024, 29, 1446–1484. [Google Scholar] [CrossRef]
  9. Food and Agriculture Organization of the United Nations (FAO). Family Farmers Are Key to Achieving the Sustainable Development Goals; Food and Agriculture Organization of the United Nations: Rome, Italy, 2019; Available online: https://www.fao.org/3/ca1465en/CA1465EN.pdf (accessed on 19 July 2025).
  10. Amamou, A.; Sidhom, L.; Zouari, A.; Mami, A. Sustainability-based multi-capital approach for the agri-food supply chain: Research trends based on bibliometric review. In Proceedings of the 2023 International Conference on Innovations in Intelligent Systems and Applications (INISTA), Hammamet, Tunisia, 20–23 September 2023; pp. 1–6. [Google Scholar] [CrossRef]
  11. Longo, F.; Nicoletti, L.; Padovano, A.; Fusto, C.; Gazzaneo, L.; di Matteo, R. Multi-capitals sustainability for firms competitiveness. In Proceedings of the 20th International Conference on Harbour, Maritime & Multimodal Logistics Modelling and Simulation, HMS 2018, Budapest, Hungary, 17–19 September 2018; pp. 83–90, ISBN 978-88-85741-08-9. [Google Scholar]
  12. Akao, Y. Quality Function Deployment: Integrating Customer Requirements into Product Design; Productivity Press: University Park, IL, USA, 1990. [Google Scholar]
  13. Tiewtoy, S.; Moocharoen, W.; Kuptasthien, N. User-centred machinery design for a small scale agricultural-based community using Quality Function Deployment. Int. J. Sustain. Eng. 2024, 17, 25–38. [Google Scholar] [CrossRef]
  14. Altshuller, G.S. Creativity as an Exact Science; CRC Press: Boca Raton, FL, USA, 1984. [Google Scholar]
  15. Livotov, P.; Chandra Sekaran, A.P.; Law, R.; Mas’Udah; Reay, D. Systematic innovation in process engineering: Linking TRIZ and process intensification. In Advances in Systematic Creativity: Creating and Managing Innovations; Springer: Berlin/Heidelberg, Germany, 2019; pp. 27–44. [Google Scholar] [CrossRef]
  16. Erraach, Y.; Sayadi, S.; Parra-Lopez, C. Quality Function Deployment (QFD) in the Spanish olive oil sector. In Proceedings of the International Congress, Zurich, Switzerland, 30 August–2 September 2011; European Association of Agricultural Economists (EAAE): Wageningen, The Netherlands, 2011. [Google Scholar] [CrossRef]
  17. Ayağ, Z.; Samanlioglu, F.; Büyüközkan, G. A fuzzy QFD approach to determine supply chain management strategies in the dairy industry. J. Intell. Manuf. 2013, 24, 1111–1122. [Google Scholar] [CrossRef]
  18. Fargnoli, M.; Sakao, T. Uncovering differences and similarities among quality function deployment-based methods in Design for X: Benchmarking in different domains. Qual. Eng. 2017, 29, 690–712. [Google Scholar] [CrossRef]
  19. Fan, Y.; Wang, G.; Zhu, Z.; He, C. Application of TRIZ theory in agricultural equipment manufacturing. In 2016 ASABE Annual International Meeting; American Society of Agricultural and Biological Engineers: St. Joseph, MI, USA, 2016; p. 1. [Google Scholar] [CrossRef]
  20. Ilevbare, I.M.; Probert, D.; Phaal, R. A review of TRIZ, and its benefits and challenges in practice. Technovation 2013, 33, 30–37. [Google Scholar] [CrossRef]
  21. Liu, Z.; Feng, J.; Wang, J. Resource-constrained innovation method for sustainability: Application of morphological analysis and TRIZ inventive principles. Sustainability 2020, 12, 917. [Google Scholar] [CrossRef]
  22. Meul, M.; Van Passel, S.; Nevens, F.; Dessein, J.; Rogge, E.; Mulier, A.; Van Hauwermeiren, A. MOTIFS: A monitoring tool for integrated farm sustainability. Agron. Sustain. Dev. 2008, 28, 321–332. [Google Scholar] [CrossRef]
  23. Frelat, R.; Lopez-Ridaura, S.; Giller, K.E.; Herrero, M.; Douxchamps, S.; Djurfeldt, A.A.; Erenstein, O.; Henderson, B.; Kassie, M.; Paul, B.K.; et al. Drivers of household food availability in sub-Saharan Africa based on big data from small farms. Proc. Natl. Acad. Sci. USA 2016, 113, 458–463. [Google Scholar] [CrossRef] [PubMed]
  24. Choptiany, J.M.; Phillips, S.; Graeub, B.E.; Colozza, D.; Settle, W.; Herren, B.; Batello, C. SHARP: Integrating a traditional survey with participatory self-evaluation and learning for climate change resilience assessment. Clim. Dev. 2017, 9, 505–517. [Google Scholar] [CrossRef]
  25. Mutea, E.; Rist, S.; Jacobi, J. Applying the theory of access to food security among smallholder family farmers around North-West Mount Kenya. Sustainability 2020, 12, 1751. [Google Scholar] [CrossRef]
  26. Kamali, F.P.; Borges, J.A.R.; Meuwissen, M.P.M.; de Boer, I.J.M.; Lansink, A.G.J.M.O. Sustainability assessment of agricultural systems: The validity of expert opinion and robustness of a multi-criteria analysis. Agric. Syst. 2017, 157, 118–128. [Google Scholar] [CrossRef]
  27. Keivanpour, S. A fuzzy sustainable quality function deployment approach to design for disassembly with industry 4.0 technologies enablers. In Global Conference on Sustainable Manufacturing; Springer International Publishing: Cham, Switzerland, 2022; pp. 772–780. [Google Scholar] [CrossRef]
  28. Zarei, M.; Fakhrzad, M.B.; Paghaleh, M.J. Food supply chain leanness using a developed QFD model. J. Food Eng. 2011, 102, 25–33. [Google Scholar] [CrossRef]
  29. Feili, H.; Molaee-Aghaee, E.; Jahed-Khaniki, G.; Rezaie, S.; Kohkheil, M. Applying fuzzy quality function deployment and fuzzy analytical hierarchy process approach in industrial bread production. J. Food Saf. Hyg. 2015, 1, 53–58. [Google Scholar]
  30. Amamou, A.; Chabouh, S.; Sidhom, L.; Zouari, A.; Mami, A. Agri-Food Supply Chain Sustainability Indicators from a Multi-Capital Perspective: A Systematic Review. Sustainability 2025, 17, 4174. [Google Scholar] [CrossRef]
  31. Telang, S.; Vichoray, C. Development in agricultural tractor brakes through QFD application-A conceptual analysis. IOSR J. Mech. Civ. Eng. 2014, 4, 55–59. [Google Scholar]
  32. Gotardi, J.E.D.; Satolo, E.G.; Mac-Lean, P.A.B. Quality Function Deployment in the Agribusiness Supply Chain in the Food Sector: Has Its Potential Been Thoroughly Exploited? In Creativity Models for Innovation in Management and Engineering; IGI Global: Hershey, PA, USA, 2022; pp. 86–109. [Google Scholar] [CrossRef]
  33. Wang, H.; Fang, Z.; Wang, D.; Liu, S. An integrated FQFD and grey decision-making approach for supply chain collaborative quality design of large complex products. Comput. Ind. Eng. 2020, 140, 106212. [Google Scholar] [CrossRef]
  34. Ben Abdallah, C.; El-Amraoui, A.; Delmotte, F.; Frikha, A. A Hybrid approach for sustainable and resilient farmer selection in food industry: Tunisian case study. Sustainability 2024, 16, 1889. [Google Scholar] [CrossRef]
  35. Haris, A.; Syarif, M.M.; Narolla, H.; Hidayat, R. Multicriteria Analysis Model in Sustainable Corn Farming Area Planning. arXiv 2024, arXiv:2404.01782. [Google Scholar] [CrossRef]
  36. Li, J.; Wu, X.; Zhang, X.; Song, Z.; Li, W. Design of distributed hybrid electric tractor based on axiomatic design and Extenics. Adv. Eng. Inform. 2022, 54, 101765. [Google Scholar] [CrossRef]
  37. Bottani, E.; Tebaldi, L.; Casella, G.; Mora, C. Key Performance Indicators for Food Supply Chain: A Bibliometric and Systematic Literature Review. Appl. Sci. 2025, 15, 3841. [Google Scholar] [CrossRef]
  38. Moreno-Miranda, C.; Dries, L. Integrating coordination mechanisms in the sustainability assessment of agri-food chains: From a structured literature review to a comprehensive framework. Ecol. Econ. 2022, 192, 107265. [Google Scholar] [CrossRef]
  39. Amamou, A.; Taouess, C.B.; Sidhom, L.; Mami, A. Exploring Novel Sustainability Metrics for the Agri-Food Supply Chain. In Proceedings of the 10th International Food Operations & Processing Simulation Workshop 21st International Multidisciplinary Modeling & Simulation Multiconference, Tenerife, Spain, 18–20 September 2024. [Google Scholar] [CrossRef]
  40. Chabouh, S.; Sidhom, L.; Mami, A. Towards baseline sustainability scenario development for the agri-food supply chain in the Mediterranean area. In Proceedings of the 2023 IEEE Third International Conference on Signal, Control and Communication (SCC), Hammamet, Tunisia, 1–3 December 2023; pp. 1–6. [Google Scholar] [CrossRef]
  41. Saaty, T.L. An exposition of the AHP in reply to the paper “remarks on the analytic hierarchy process”. Manag. Sci. 1990, 36, 259–268. [Google Scholar] [CrossRef]
  42. Li, Q. A novel Likert scale based on fuzzy sets theory. Expert Syst. Appl. 2013, 40, 1609–1618. [Google Scholar] [CrossRef]
  43. Büyüközkan, G.; Çifçi, G. A combined fuzzy AHP and fuzzy TOPSIS based strategic analysis of electronic service quality in healthcare industry. Expert Syst. Appl. 2012, 39, 2341–2354. [Google Scholar] [CrossRef]
  44. Chen, S.J.; Hwang, C.L. Fuzzy multiple attribute decision making methods. In Fuzzy Multiple Attribute Decision Making: Methods and Applications; Springer: Berlin/Heidelberg, Germany, 1992; pp. 289–486. [Google Scholar] [CrossRef]
  45. Gumus, A.T. Evaluation of hazardous waste transportation firms by using a two-step fuzzy-AHP and TOPSIS methodology. Expert Syst. Appl. 2009, 36, 4067–4074. [Google Scholar] [CrossRef]
  46. Ahmadizadeh-Tourzani, N.; Keramati, A.; Apornak, A. Supplier selection model using QFD-ANP methodology under fuzzy multi-criteria environment. Int. J. Product. Qual. Manag. 2018, 24, 59–83. [Google Scholar] [CrossRef]
  47. Bottani, E. A fuzzy QFD approach to achieve agility. Int. J. Prod. Econ. 2009, 119, 380–391. [Google Scholar] [CrossRef]
  48. Kaplan, R.S.; Norton, D.P. The Balanced Scorecard: Translating Strategy into Action; Harvard Business School Press: Boston, MA, USA, 1996. [Google Scholar]
  49. Saltelli, A.; Ratto, M.; Andres, T.; Campolongo, F.; Cariboni, J.; Gatelli, D.; Saisana, M.; Tarantola, S. Global Sensitivity Analysis: The Primer; John Wiley & Sons: Hoboken, NJ, USA, 2008. [Google Scholar]
  50. Mann, D.; Domb, E. 40 Inventive Principles. The TRIZ Journal. 2000. Available online: https://the-trizjournal.com/40-inventive-principles-examples/ (accessed on 20 March 2025).
  51. Chebil, A.; Jebari, S.; Thabet, C.; Frija, A.; Makhlouf, M. Effects of Water Scarcity on the Performances of the Agricultural Sector and Adaptation Strategies in Tunisia. In Agricultural Economics; IntechOpen: London, UK, 2019. [Google Scholar] [CrossRef]
  52. Schütze, N.; Thiel, A.; Buhrow, A.; Götz, A. Soil governance in Tunisia: Analyzing the potentials for agroecology transformations. Agroecol. Sustain. Food Syst. 2025, 49, 1595–1622. [Google Scholar] [CrossRef]
  53. Frija, A.; Oulmane, A.; Chebil, A.; Makhlouf, M. Socio-Economic implications and potential structural adaptations of the Tunisian agricultural sector to climate change. Agronomy 2021, 11, 2112. [Google Scholar] [CrossRef]
  54. IFAD. Rapport sur le Développement Rural 2021: Transformer les Systèmes Alimentaires pour Lutter Contre la Pauvreté et la Faim. Fonds International de Développement Agricole. 2021. Available online: https://www.ifad.org/fr/web/knowledge/-/publication/rural-development-report-2021. (accessed on 3 July 2025).
  55. Food and Agriculture Organization of the United Nations (FAO). The State of Food and Agriculture 2023: Revealing the True Cost of Food to Transform Agrifood Systems; Food and Agriculture Organization of the United Nations: Rome, Italy, 2023. [Google Scholar] [CrossRef]
  56. Rezaei, J. Best-worst multi-criteria decision-making method. Omega 2015, 53, 49–57. [Google Scholar] [CrossRef]
  57. Singh, R.K.; Murty, H.R.; Gupta, S.K.; Dikshit, A.K. An overview of sustainability assessment methodologies. Ecol. Indic. 2012, 15, 281–299. [Google Scholar] [CrossRef]
  58. Demiryürek, K.; Stopes, C.; Güzel, A. Organic agriculture: The case of Turkey. Outlook Agric. 2008, 37, 261–267. [Google Scholar] [CrossRef]
  59. Diaz-Balteiro, L.; Alfranca, O.; González-Pachón, J.; Romero, C. Ranking of industrial forest plantations in terms of sustainability: A multicriteria approach. J. Environ. Manag 2016, 180, 123–132. [Google Scholar] [CrossRef]
  60. Chabouh, S.; Sidhom, L.; Zammiti, A.; Mami, A. Assessing Agri-food supply chain multi-capital sustainability using Simple Multi-Attribute Rating Technique: The policy maker case study. In Proceedings of the 10th International Food & Operations Simulation Workshop (FOODOPS 2024), Tenerife, Spain, 18–20 September 2024. [Google Scholar] [CrossRef]
  61. Costanza, R.; De Groot, R.; Braat, L.; Kubiszewski, I.; Fioramonti, L.; Sutton, P.; Farber, S.; Grasso, M. Twenty years of ecosystem services: How far have we come and how far do we still need to go? Ecosyst. Serv. 2017, 28, 1–16. [Google Scholar] [CrossRef]
  62. Hedley, C. The role of precision agriculture for improved nutrient management on farms. J. Sci. Food Agric. 2015, 95, 12–19. [Google Scholar] [CrossRef] [PubMed]
  63. Rotz, C.A.; Corson, M.S.; Chianese, D.S.; Montes, F.; Hafner, S.D.; Coiner, C.U. The Integrated Farm System Model; USDA ARS: Washington, DC, USA, 2012. Available online: https://www.ars.usda.gov/ARSUserFiles/80700500/reference%20manual.pdf (accessed on 10 April 2025).
  64. Ness, B.; Urbel-Piirsalu, E.; Anderberg, S.; Olsson, L. Categorising tools for sustainability assessment. Ecol. Econ. 2007, 60, 498–508. [Google Scholar] [CrossRef]
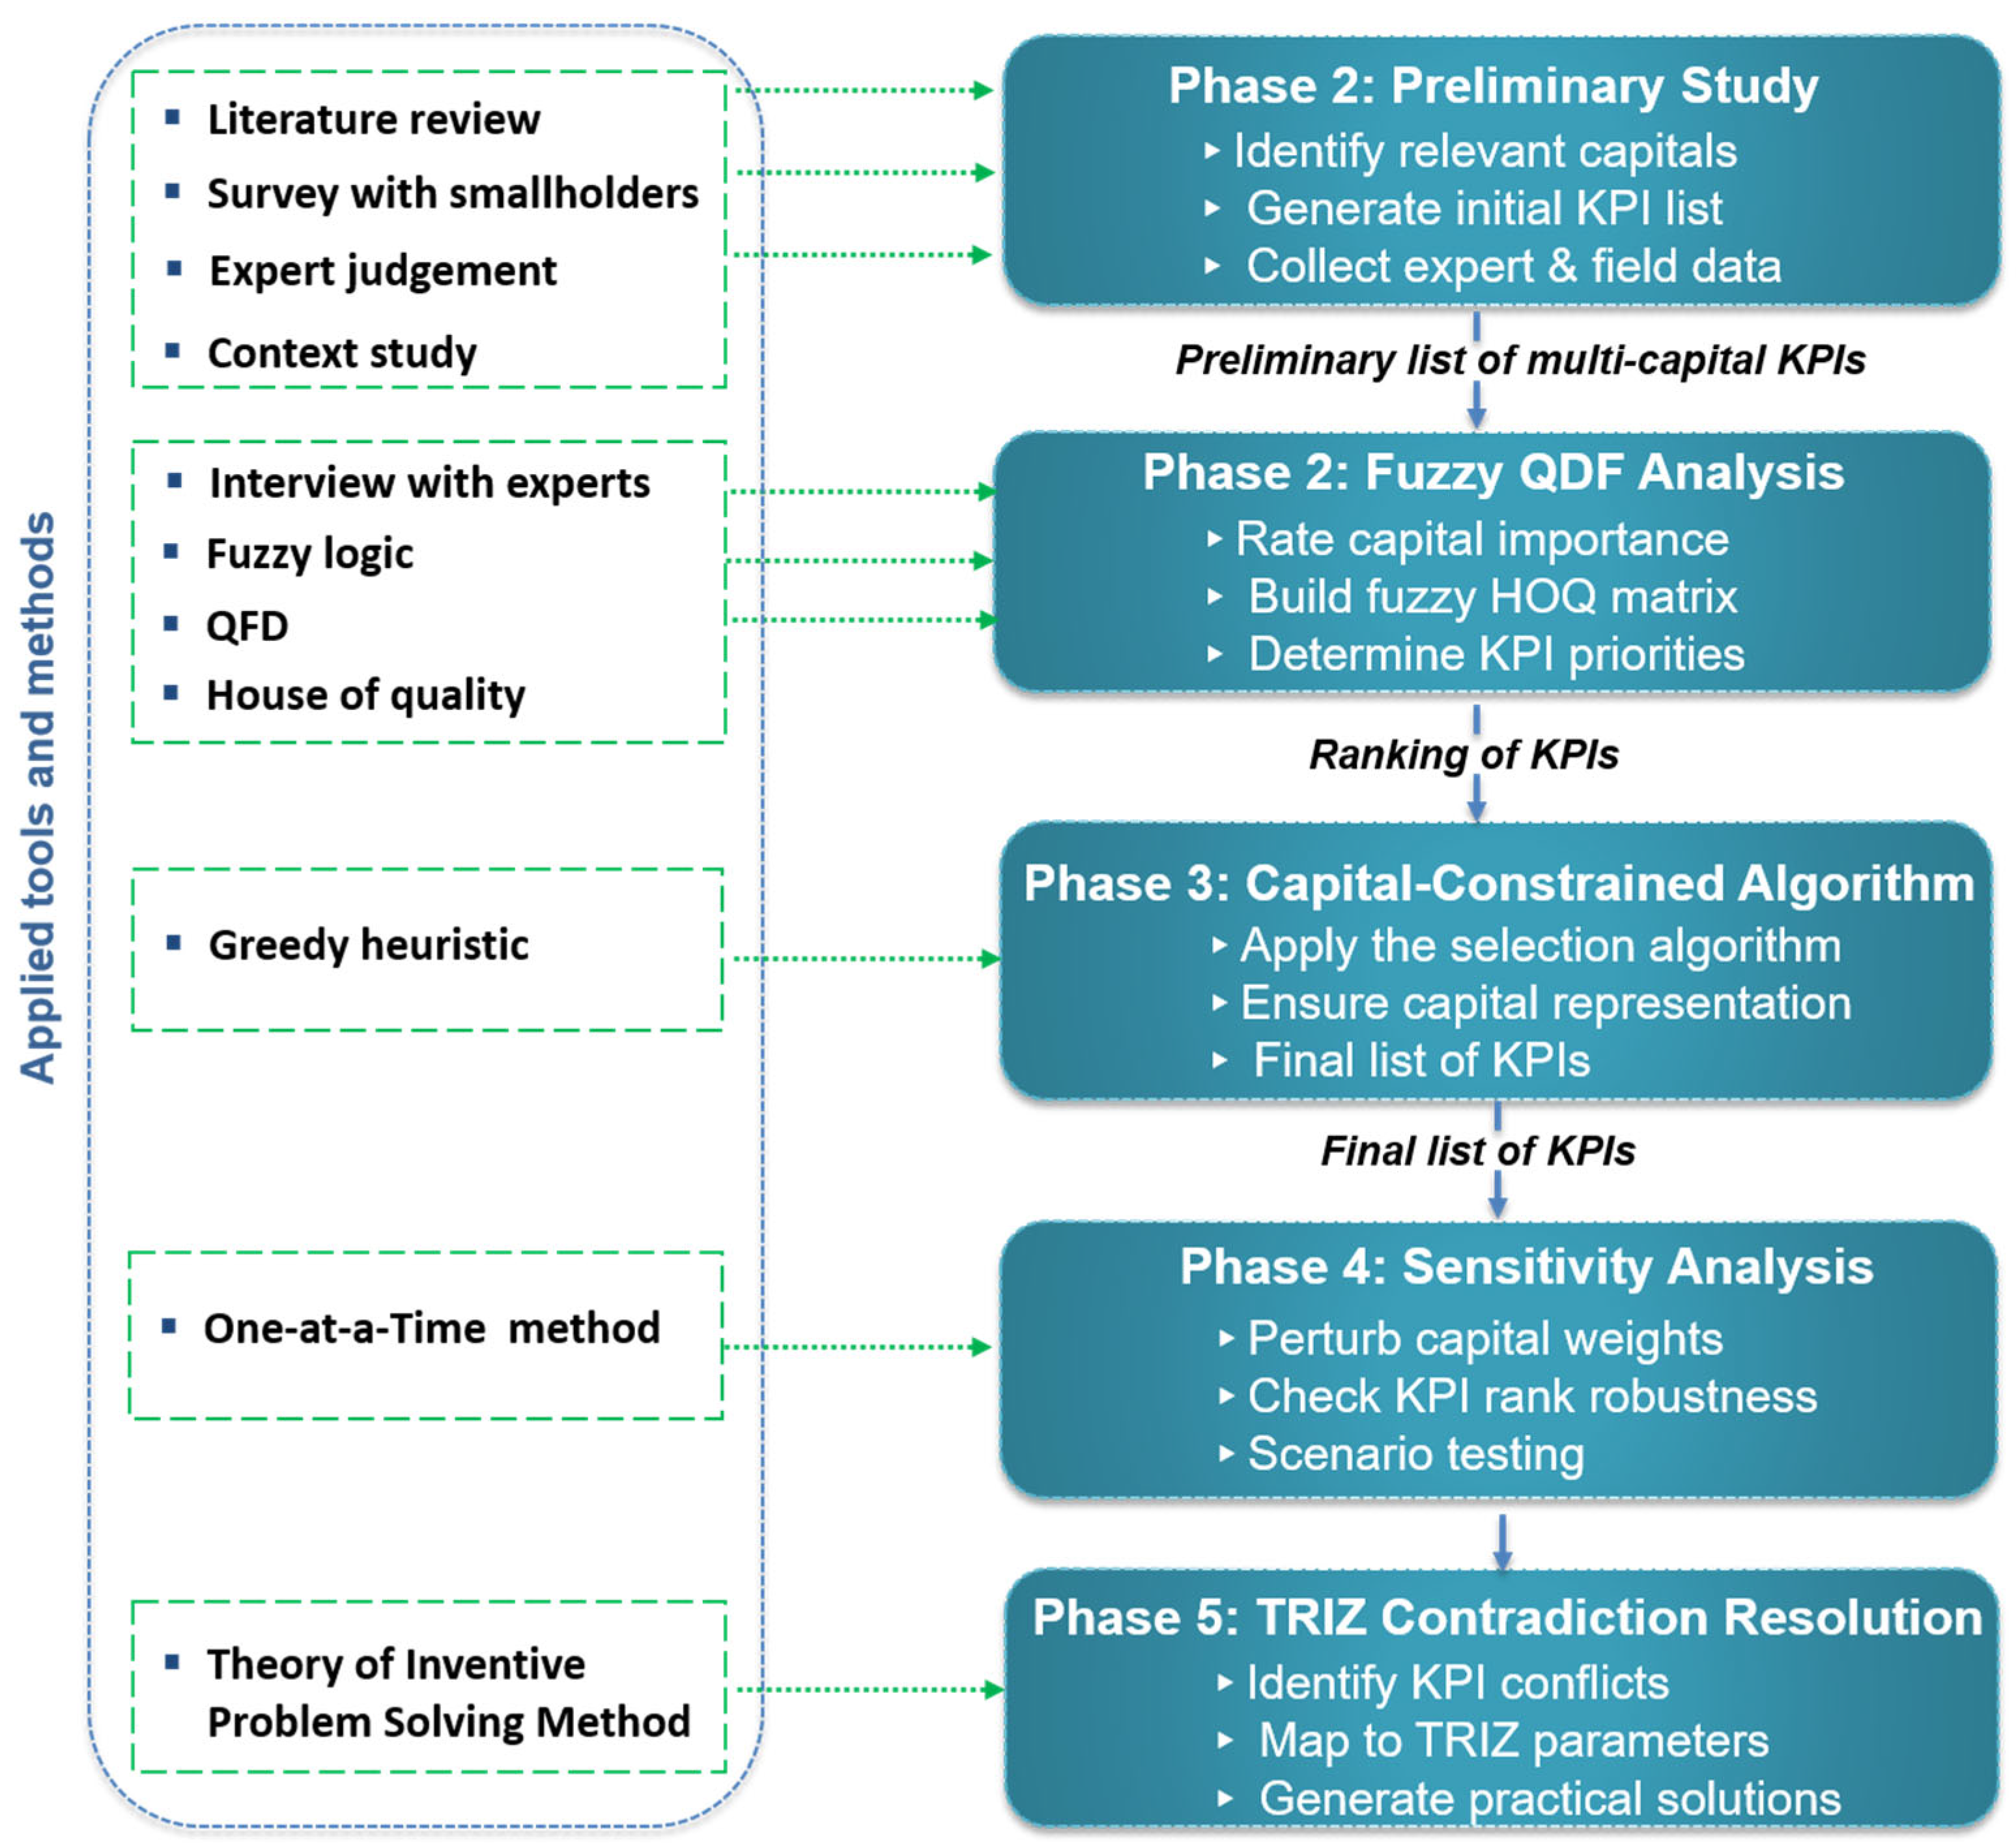
Figure 1. Research methodology.
Sustainability 17 08277 g001
Figure 2. Preliminary study. Source: Developed by the authors.
Sustainability 17 08277 g002
Figure 3. Flowchart of multi-expert FQFD. Source: Developed by the authors.
Sustainability 17 08277 g003
Figure 4. Capital-constrained algorithm: process flowchart. Source: Developed by the authors.
Sustainability 17 08277 g004
Figure 5. TRIZ contradiction flowchart. Source: Authors’ original figure based on TRIZ methodology.
Sustainability 17 08277 g005
Figure 6. Capital’s importance results.
Sustainability 17 08277 g006
Figure 7. Final KPI ranking.
Sustainability 17 08277 g007
Figure 8. Final multi-capital sustainability KPIs for smallholders.
Sustainability 17 08277 g008
Figure 9. Radar chart of top 19 KPI rank variations across all capitals.
Sustainability 17 08277 g009
Figure 10. KPI rank standard deviation across scenarios for global analysis.
Sustainability 17 08277 g010
Figure 11. Radar chart of top 19 KPI rank variations on the natural capital.
Sustainability 17 08277 g011
Figure 12. KPI rank standard deviation across scenarios for natural capital analysis.
Sustainability 17 08277 g012
Figure 13. Indicator correlation matrix.
Sustainability 17 08277 g013
Table 5. Application of TRIZ matrix.
Improved KPIWorsened KPIExplanationImproving ParameterWorsening ParameterInventive Principles
Land use efficiencyEnergy useImproving yields per hectare often requires machinery, greenhouses, or irrigation systems, which increase energy consumption.391910, 22
Labor productivityCosts of cultivation and storageBoosting labor productivity often involves investing in tools, training, and infrastructure, which increases production and storage costs.3936N/A
Post-harvest losses Energy useReducing post-harvest losses involves cold chains, drying, or processing, which significantly increases energy demand.2322N/A
IncomeImpact of over-fertilizationTo increase income, smallholders tend to intensify fertilizer use, leading to runoff and water eutrophication.392310, 23
Crop growth duration Water useEarly-maturing varieties require more frequent irrigation.34725
Impact of Acidification Number of headsLivestock emit ammonia contributing to acidification of soils.10313
Note: N/A: No applicable inventive principle identified.
Disclaimer/Publisher’s Note: The statements, opinions and data contained in all publications are solely those of the individual author(s) and contributor(s) and not of MDPI and/or the editor(s). MDPI and/or the editor(s) disclaim responsibility for any injury to people or property resulting from any ideas, methods, instructions or products referred to in the content.