Article

A Multi-Platform Online Data-Driven Diagnostic Approach for Macro-Level Sustainability of Homestays

Ningbo University-University of Angers Joint Institute, Ningbo University, Ningbo 315211, China
*
Author to whom correspondence should be addressed.
Sustainability 2025, 17(18), 8230; https://doi.org/10.3390/su17188230
Submission received: 21 July 2025 / Revised: 6 September 2025 / Accepted: 9 September 2025 / Published: 12 September 2025

Abstract

The increasing impact of online popularity on consumption calls for integrated sustainability diagnostic frameworks that combine both consumption and production data. This study aims to develop a macro sustainability diagnostic model integrating multi-platform online data and to tackle the challenges of scale, accuracy, and cost in evaluating tourism industries. The model comprises three primary indices: the industry scale index, the social attention index, and the type reference index. It proposes an interpretative and concise development typology including externally dependent, outward spillover, and coordinated types. Using homestay data from three online platforms and the spatial analysis methods of ArcGIS, this study validates the model’ effectiveness in China. It also reveals significant spatiotemporal heterogeneity and four macro influencing factors of the Chinese homestay industry’s sustainability. This study contributes to the methodological and typological frameworks for the sustainability diagnosis, as well as the theoretical understanding of Chinese homestays’ spatiotemporal evolution. It also provides a scientific basis for the rational planning and transformation of China’s homestay industry in the digital tourism economy. The discussion on the model’s limitations regarding data resources and micro-validity provides new insights for future sustainability assessments of other related industries in more regions in the digital era.

1. Introduction

The UNWTO (United Nations World Tourism Organization) emphasizes the critical role of small-, micro-, and medium-sized tourism enterprises in poverty alleviation [1]. Homestays, which originated in the 1960s in Western countries as family-run bed and breakfast operations, have undergone a global transformation and significantly influenced the accommodation landscape under the influence of the sharing economy and experiential tourism [2]. Homestays also have evolved into a sustainable tourism form that contributes to the Sustainable Development Goals [3]. Unlike conventional mass tourism, homestays offer a more community-centric approach that can maximize local benefits [4], revitalize underused resources, enhance local communities and economies, and alleviate poverty, especially in developing regions [5]. Consequently, homestays have emerged as a prominent industry type and a means of sustainable destination development, garnering joint attention from both academia and the industry worldwide [6].
The global vacation rental market was valued at an estimated USD 98.7 billion in 2024 and is expected to reach USD 119.0 billion by 2030, reflecting a compound annual growth rate of 3.7% from 2024 to 2030 [7]. As a leading platform in the homestay industry, Airbnb has expanded to encompass over 5 million hosts and 8 million active listings, accommodating more than 2 billion guest arrivals across more than 220 countries and regions worldwide by 2025 [8]. In China, homestays encompass a variety of options, including rural farmstays (nongjiale), boutique bed and breakfasts (B&Bs), and urban shared apartments, which exhibit a greater diversity in standards and forms [9]. The total number of online homestay listings in China increased from 590,000 in 2016 to over 7.8 million in 2024 [10], while the online homestay gross merchandise volume grew markedly from RMB 540 million in 2012 to RMB 42.27 billion in 2024 [11]. As a rapidly expanding and substantial market, China is an excellent region to observe the evolution of the homestay industry [12].
Behind the growth of the homestay industry, there are also some significant trends. Globally, the development trends and patterns of the homestay industry vary significantly both between countries and within regions of a single country [13]. In some areas, the sector is still in its infancy [14], while in others, it has begun to encounter issues such as high vacancy rates and is transitioning toward a more rational development phase [2]. For instance, in both the Yangtze River and the Pearl River Delta in China, vacancy rates have surpassed 40%, resulting in oversupply and spatial imbalances [15]. Dynamic monitoring of the sustainability levels of the homestay industry across different spatiotemporal scales from a macro perspective has become crucial to ensure its healthy and sustainable development in the future. Nevertheless, the time lag associated with traditional statistical methods [12] and the high cost of data crawling [16] are increasingly inadequate to meet the demands of the rapidly changing market.
Secondly, there is a concomitant growth in the number and influence of boutique homestays [17], accompanied by increasing brand chain expansion and rising investment costs per property [18]. This structural shift necessitates a transition in sustainability diagnosis of the homestay industry—from traditional quantitative metrics toward more granular data analysis—in order to better capture internal industry dynamics. Thirdly, the homestay industry is increasingly reliant on a combination of traditional online sales platforms and internet and social media channels for marketing purposes [19]. This shift in media landscape implies that diagnosing sustainability from a purely supply-side perspective is no longer sufficient; instead, diagnosis must be more closely integrated with demand and market conditions [20].
The overarching objective of this study is to tackle triple challenges of scale, accuracy, and dimensionality in evaluating tourism industries closely tied to online popularity, with a specific focus on homestays. The specific objectives are as follows: (1) developing a macro-dynamic diagnostic model integrating multi-source online platform data and balancing against data cost, accuracy, and response speed for the macro-level performance; (2) proposing an interpretative and concise development typology; (3) validating the model’s effectiveness and recognizing the spatiotemporal differentiation and influencing factors of sustainability of China’s homestay industry. It is anticipated that this study will make a significant contribution to the methodological and typological frameworks for diagnosing the sustainable development of tourism industries impacted by the digital economy, as well as the theoretical understanding of their spatiotemporal evolution and influencing factors. It also provides a scientific basis for the rational planning and transformation of China’s homestay industry.

2. Literature Review

2.1. Homestays and Their Sustainable Development

Compared to traditional hotel accommodations, homestays offer vibrant local living experiences [21], immersive cultural and natural environments [22], personalized amenities, refined services, and rich opportunities for social interaction [23]. With evolving consumer markets and changing perceptions, some homestays, especially those boutique B&B in rural regions, have even emerged as attractive destinations [24], symbolizing an ideal lifestyle and leisure utopia [25]. Existing studies on homestays have explored topics such as consumer experiences [26], host–guest dynamics [27], and tourist perceptions [28]. Given that homestays are generally run by families or small groups [29], research has also focused on the host’s perspective, including location selection, design, management, marketing, business performance, customer relations, and community integration [12,13,30,31,32].
The significant role of the homestay industry in promoting sustainable development has long been highlighted in academic research. As a composite industry integrating cultural experiences, local identity, and spatial transformation [33], the homestay industry plays a crucial role in community development and urban–rural integration. Homestays can revitalize idle housing resources and provide stable rental income [34]. In small- and medium-sized cities, their contribution to employment and tourism income often surpasses that of traditional hotels [35]. Homestays can also shift residents’ roles, foster community empowerment, and promote diverse forms of urban–rural integration [36].
Thus, a systematic and scientific assessment of homestay sustainability is essential to inform evidence-based planning and management strategies for the homestay industry [17]. Some scholars have investigated the spatial distribution of homestays within cities and regions [37,38]. They mostly use data of Airbnb listings directly with web scraping techniques or the application program interface (API) of Airbnb [38]. In China, researchers primarily used to crawled information from the API of the Ctrip website [17]. Some studies have utilized data provided by third-party agencies such as AirDNA [37], while others have collected official guides or government statistical directory in small areas [39]. Nonetheless, as homestays represent a form of non-standardized accommodation and are predominantly administered by small- and medium-sized enterprises, relevant data are frequently costly to collect or suffer from insufficient timeliness. Furthermore, existing analyses typically concentrate on the spatial distribution characteristics of homestays based on a single data source, rather than providing a comprehensive evaluation of their sustainability levels and regional patterns.
Moreover, homestays development is influenced by interactions among natural, socioeconomic, and political factors [21]. Researchers have found that macro environmental factors such as the ecological environment, resource endowment, consumption base, location, accessibility, and policy support are considered key determinants of regional distribution [40,41]. However, when exploring the factors influencing the sustainable development of the homestay industry, a greater proportion of studies have adopted qualitative research methods to conduct micro-level analyses [42]. A comprehensive quantitative methodology is urgently needed to unveil the mechanisms of the sustainability of homestay industry from the macro level [21].

2.2. Online Data in Tourism Research

Due to the rapid advancements in information technology and considerable impact of the internet on consumption trends [43], extensive and varied datasets have been generated. In comparison to conventional data sources, such as questionnaire surveys, official statistics, and interviews, these online data facilitate more immediate and large-scale capture of tourism-related behaviors, preferences, sentiments, and their spatiotemporal dynamics [44]. Consequently, they enable researchers to comprehensively investigate social and economic phenomena [45], significantly enriching the theoretical and methodological foundations of tourism research [46].
In the field of tourism research, online data can be categorized into three primary types. The first and most widely used type is user-generated content (UGC), which includes reviews, images, and other materials shared by tourists on digital platforms [47]. Such data are often collected from travel blogs, online forums (e.g., TripAdvisor, Mafengwo), and social media platforms (e.g., Twitter/X, Weibo, Instagram) via web crawling [48,49]. A range of research methodologies are employed to analyse these texts and images, including content analysis, semantic network analysis, and machine learning [50,51]. The aims of these analysis are to examine collective tourist’s destinations perceptions, satisfaction, and emotions [52,53]. UGC has been demonstrated to offer valuable insights into the shared concerns and preferences of tourists, thereby providing critical support for destination marketing and quality monitoring.
The second category comprises tourism objects data, which refers to tourist attractions listing or service facilities from online platforms [54], or point of interest (POI) data from map applications [55]. Homestays depend heavily on online platforms (e.g., Airbnb, Ctrip) for displaying and booking, generating extensive data on room listings, prices, and user reviews. In addition, an expanding body of business-related data is now accessible through a variety of specialized online data platforms, including corporate registration records [56] and financial reports disclosed by listed companies [57]. Existing studies frequently use these data to analyse the spatial distribution patterns [14] and pricing determinants of short-term rentals in specific meso-scale regions [58].
The third category encompasses emerging types of digital footprints enabled by recent advances in big data and machine learning technologies [59]. These include web search indices (e.g., Google Trends, Baidu Index) [60], geotagged social media check-in data (e.g., Flickr, Weibo check-ins) [61], and social media engagement metrics (e.g., Brandwatch, BuzzSumo, TikTok Creative Center, Ocean Engine data) [62]. These are gaining attention as novel data sources. This type of data is highly timely, as platforms employ algorithms to monitor the popularity index of specific keywords across different platforms almost instantaneously [63]. Previous studies have demonstrated a strong correlation between search volumes and conventional statistics, including ticket sales and the number of visitors [64]. These data can be used to identify tourist hotspots and flow patterns, providing robust support for predicting tourism demand [65].
While there are concerns regarding the reliance and digital divide on online data alone to assess complex social systems [66], an increasing body of research demonstrates the validity of online data as an effective indicator of consumer market dynamics in the digital age [67]. The scale and immediacy of these data sources are particularly noteworthy with respect to the limitations of conventional data sources [68]. Geospatial analysis using multi-source data for complex indicator systems has been widely applied in many fields [69]. The homestay industry relies heavily on online platforms for listings and bookings, and is also increasingly influenced by social media. This particular type business, deeply embedded in the digital ecosystem [70], calls for more comprehensive macro-scale research using large-scale data generated through online platforms. Limited research has addressed the online social attention and spatiotemporal differentiation of homestays and how this relates to broader industry development.

3. Materials and Methods

3.1. A Multi-Platform Online Data-Driven Diagnostic Model

Considering the multiple available online platform sources, a comprehensive macro-level diagnostic model was constructed to evaluate and monitor the performance of consumption industries closely tied to online popularity, incorporating three primary diagnostic indicators: industry scale index, social attention index, and type reference index (Figure 1). This model incorporates performance metrics from both the consumption and production ends and categorizes regional typological differences by analyzing their coupling relationships. At the secondary indicator level, it is necessary to differentially employ available data sources from the assessed regions. This study employs China and its homestay industry as an empirical case to demonstrate and validate the model’s effectiveness.

3.1.1. Social Attention Index

The Social Attention Index (SAI) aims to measure the public’s level of interest in the homestay industry across different regions by analyzing multi-category website behavioral data. In view of the consistency in statistical standards for macro-level homestay industry data, this study focuses on mainland China (excluding Hong Kong, Macao, and Taiwan) as the study area. In China, online data can derived from three major Chinese platforms: Baidu (https://www.baidu.com), Douyin (https://www.douyin.com), and Jinri Toutiao (https://www.toutiao.com). These platforms represent search engines, short-form video social networks, and comprehensive news content, respectively, covering different consumer groups and activities related to homestays.
Baidu Index (https://index.baidu.com), an official service provided by Baidu, offers search volume data for special keyword. In this study, annual data for the keyword “homestay” was manually collected for all provinces and cities in China from 2018 to 2024, as well as monthly data for the year 2024. The data download was conducted between 1 and 3 March 2025. Baidu Index data were collected from 2018 to 2024. The Baidu Index included both the Baidu Search Index and Baidu News Index. The Baidu Search Index, a weighted value, was calculated based on the frequency of user searches for the keyword “homestay” on Baidu webpages, indicating the level and trend of user interest over time. The Baidu News Index, derived from Baidu’s smart content distribution system, was calculated as the weighted sum of actions such as reading, commenting, sharing, liking, and disliking, reflecting online attention and media coverage over time.
Ocean Engine (https://trendinsight.oceanengine.com) is a content consumption trend analysis brand under the ByteDance Engine. In consideration of the emergent trends of video-based consumption, as well as the accessibility of recent monthly data, this study employed the 2024 monthly data of Jinri Toutiao and Douyin (TikTok) from this platform for a within-year comparative analysis. Annual and monthly data for 2024 were collected at national, provincial, and prefectural levels from three platforms between 5 and 7 March 2025.
Comprehensive indices from Douyin and Toutiao were used to measure the overall volume of “homestay”-related content on their platforms. These indices were derived from platform big data models, calculated as weighted composites of content scores (number of articles/videos), communication scores (read/play volume), and search scores (search volume).
To account for differences in data scales and user preferences across platforms, each dataset was normalized by calculating its proportion of national totals. The model is expressed as follows:
S A I t i = x ( t ) i x t i × 100
where S A I t i is the standardized social attention index of single website for region i, and x ( t ) i is the original value of single website index t for region i. The Baidu Composite Index was calculated as the average of the Baidu Search Index (BSI) and Baidu News Index (BNI). The model is expressed as follows:
S A I B a i d u i = S A I ( B S I ) i + S A I ( B N I ) i 2
where S A I B a i d u i is the standardized social attention index of Baidu for region i, and S A I ( B S I ) i and S A I ( B N I ) i are the standardized Baidu Search Index and Baidu News Index for region i, respectively. The overall social attention index was the average of the composite indices from Baidu, Douyin, and Toutiao. The model is expressed as follows:
S A I i = S A I B a i d u i + S A I D o u y i n i + S A I T o u t i a o i 3
where S A I i is the standardized social attention index for region i, and S A I B a i d u i   S A I ( D o u y i n ) i , and S A I ( T o u t i a o ) i are the standardized social attention index of Baidu, Douyin, and Toutiao for region i, respectively.

3.1.2. Industry Scale Index

The Industry Scale Index (ISI) measures the industrial development scale of the homestay sector across different regions using enterprise registration data of homestay businesses. This study collected homestay enterprise data from the Tianyancha website (https://www.tianyancha.com/)—one of China’s leading business information platforms. Tianyancha compiles data from public sources using advanced data science and natural language processing technologies, covering more than 340 million social entities in China. It leads nationally in data comprehensiveness, timeliness, and accuracy.
The premium membership of Tianyancha enables the batch downloading of detailed information for registered enterprises. A bulk search and data download were conducted on 10 March 2025, restricting the business classification under the “National Industry Category” to “Homestay Services” within the “Accommodation and Catering” sector. A total of 242,264 enterprise records were obtained. For each enterprise, information such as name, establishment date, registered address, business scope, enterprise type, registration status, registered capital, and enterprise scale was extracted. Enterprise scale was categorized into four levels—L (large), M (medium), S (small), and XS (micro)—based on Tianyancha’s big data model and indicators such as total assets, business profits, and staff size. After manual cleaning to remove non-homestay enterprises, a final dataset of 238,098 valid homestay enterprise records was obtained.
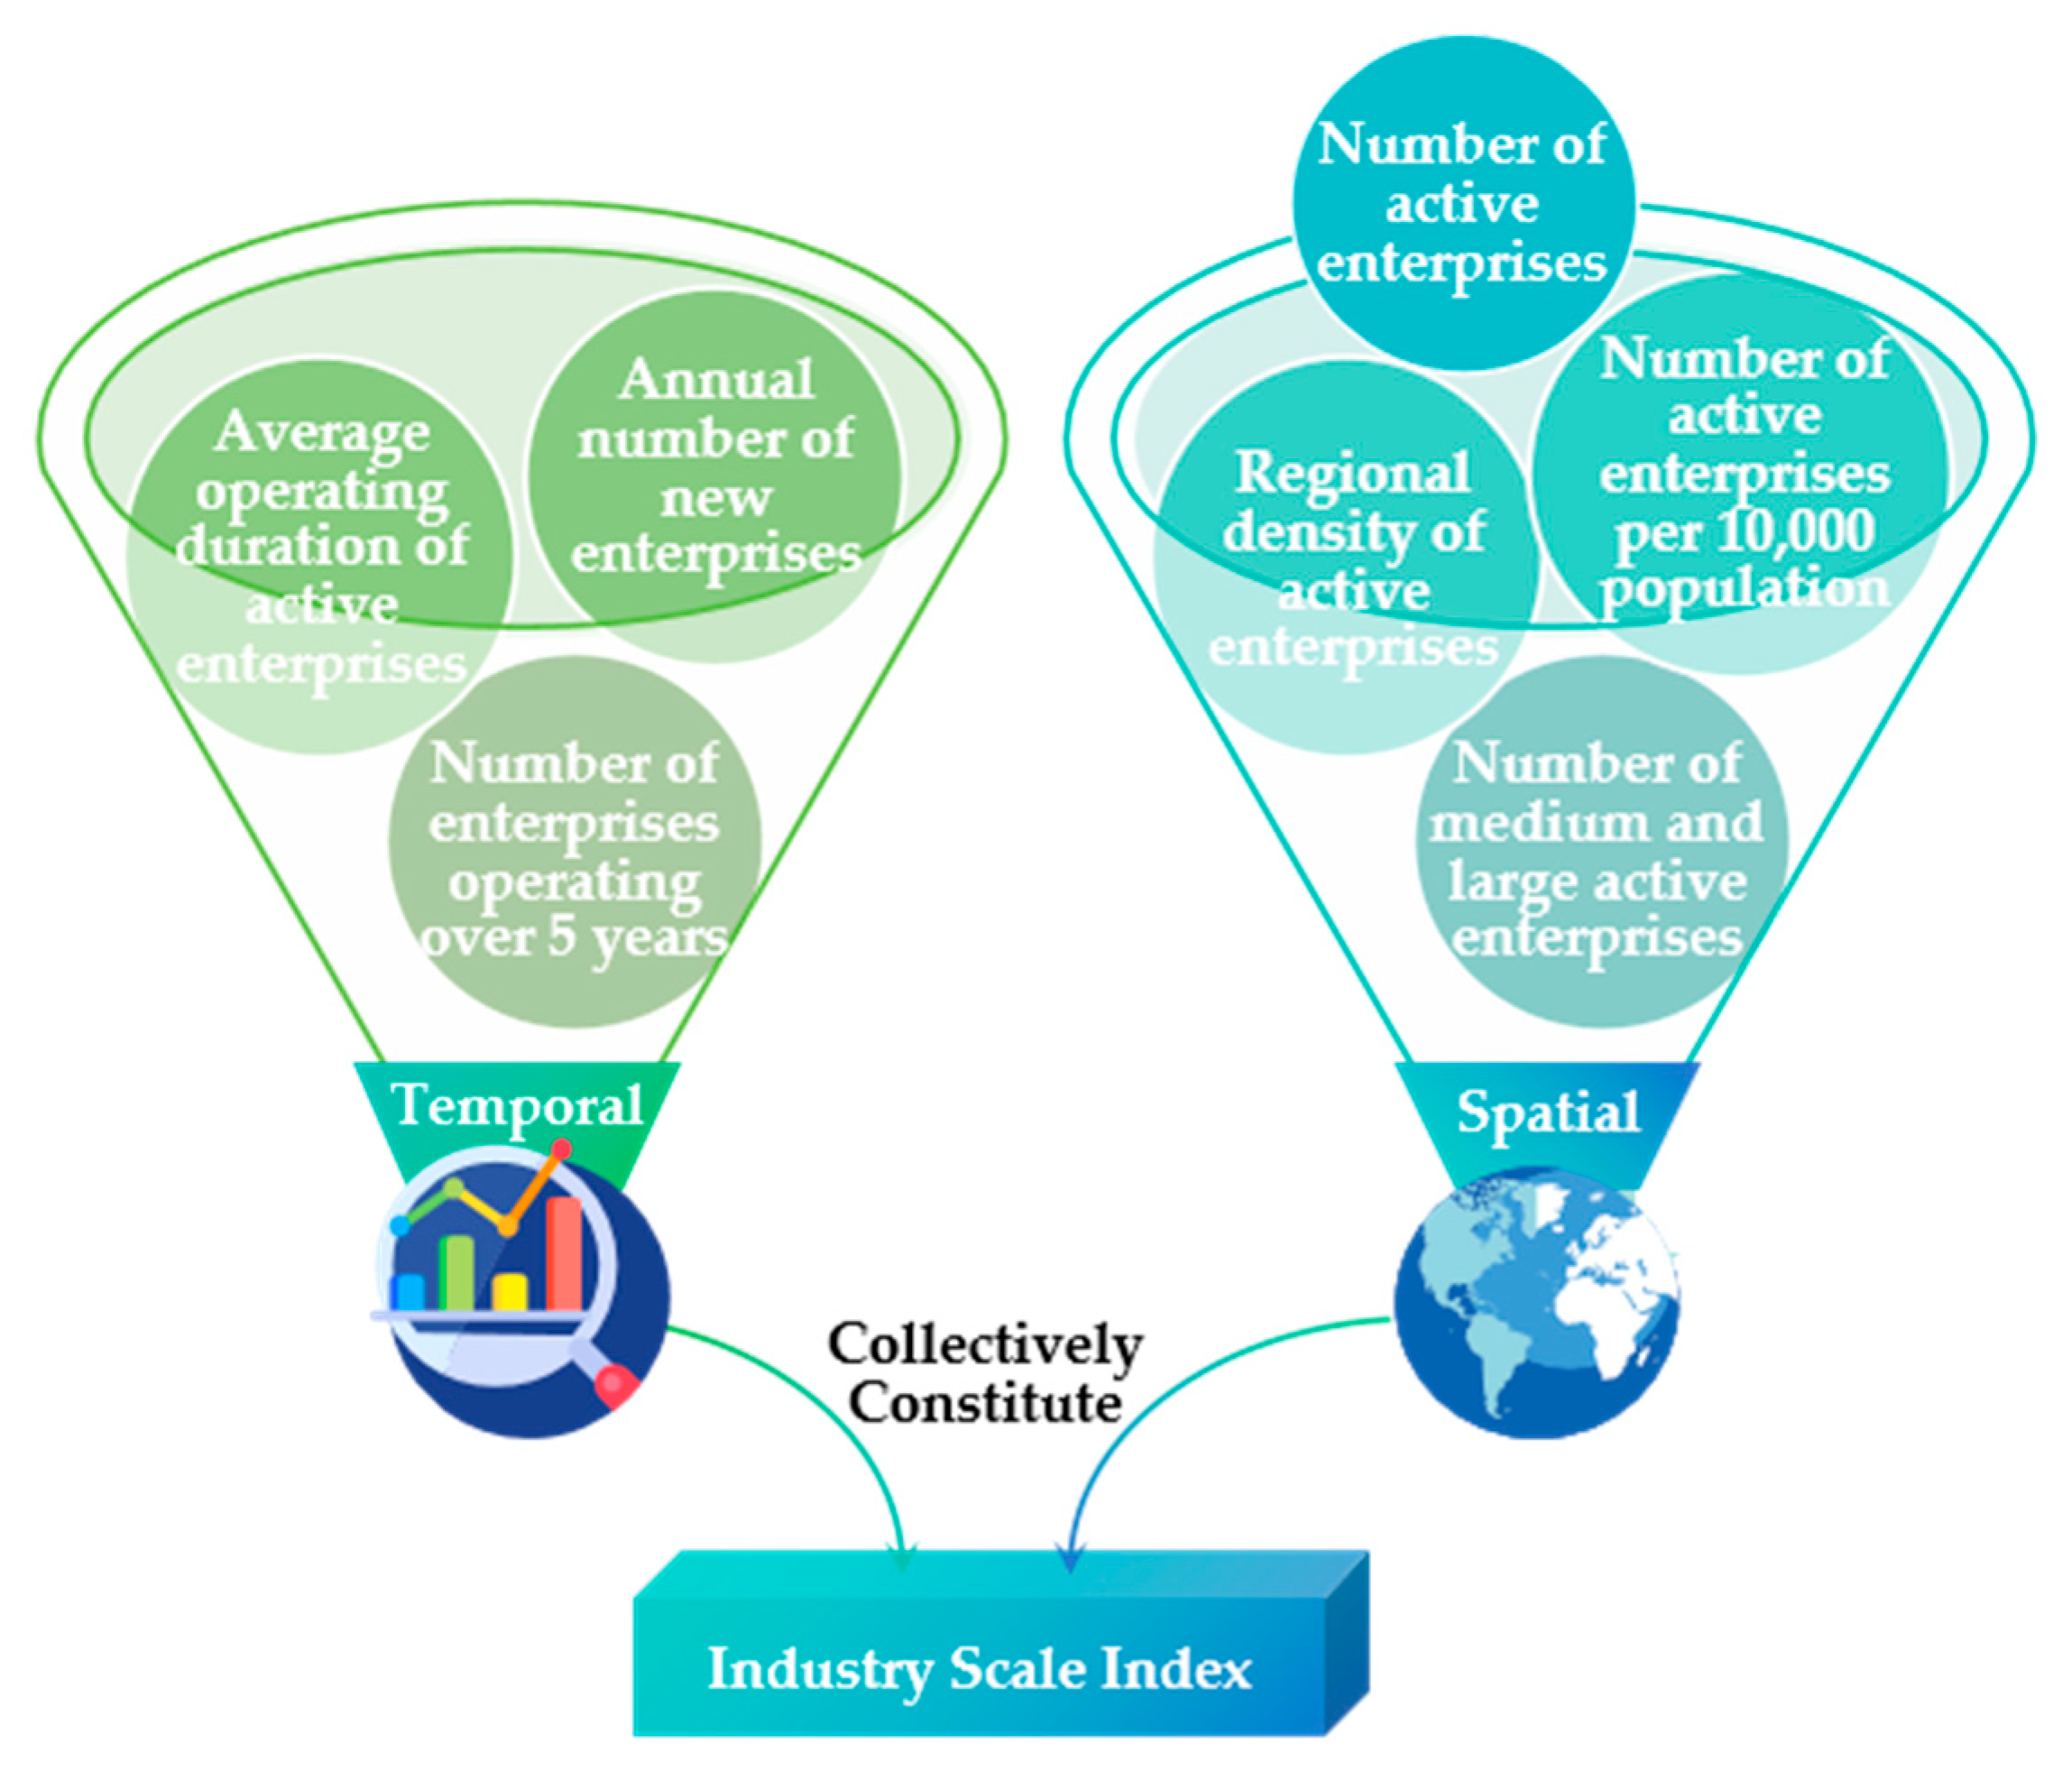
Based on this dataset, an index system was constructed to assess the homestay industry scale (Figure 2). Three indicators were used to evaluate its temporal evolution: the annual number of new homestay enterprises, the average operating duration of active enterprises, and the number of enterprises operating over 5 years. Given the significant regional differences in area and population size, spatial differentiation was assessed using the number of active enterprises, the regional density of active enterprises, the number of active enterprises per 10,000 population, and the number of medium and large active enterprises.

3.1.3. Type Reference Index

The sustainable development of the homestay industry requires a comprehensive diagnosis of coupling relationship between industry scale and social attention. Therefore, the type reference index (TRI) was introduced to diagnose the regional types of sustainable development of the homestay industry. First, the number of active homestay enterprises was normalized by calculating its proportion relative to the national total. The model is expressed as follows:
N A E i = n i n i × 100
where N A E i   is the standardized number of active homestay enterprises for region i; n i is the original number of active homestay enterprises for region i. Subsequently, the type reference index for sustainable development was derived by computing the difference between the social attention index and the total number of active homestay enterprises index. The model is expressed as
T R I i = S A I i N A E i
where T R I i   is the type reference index for region i, S A I i is the standardized social attention index for region i, and N A E i   is the standardized number of active homestay enterprises for region i.
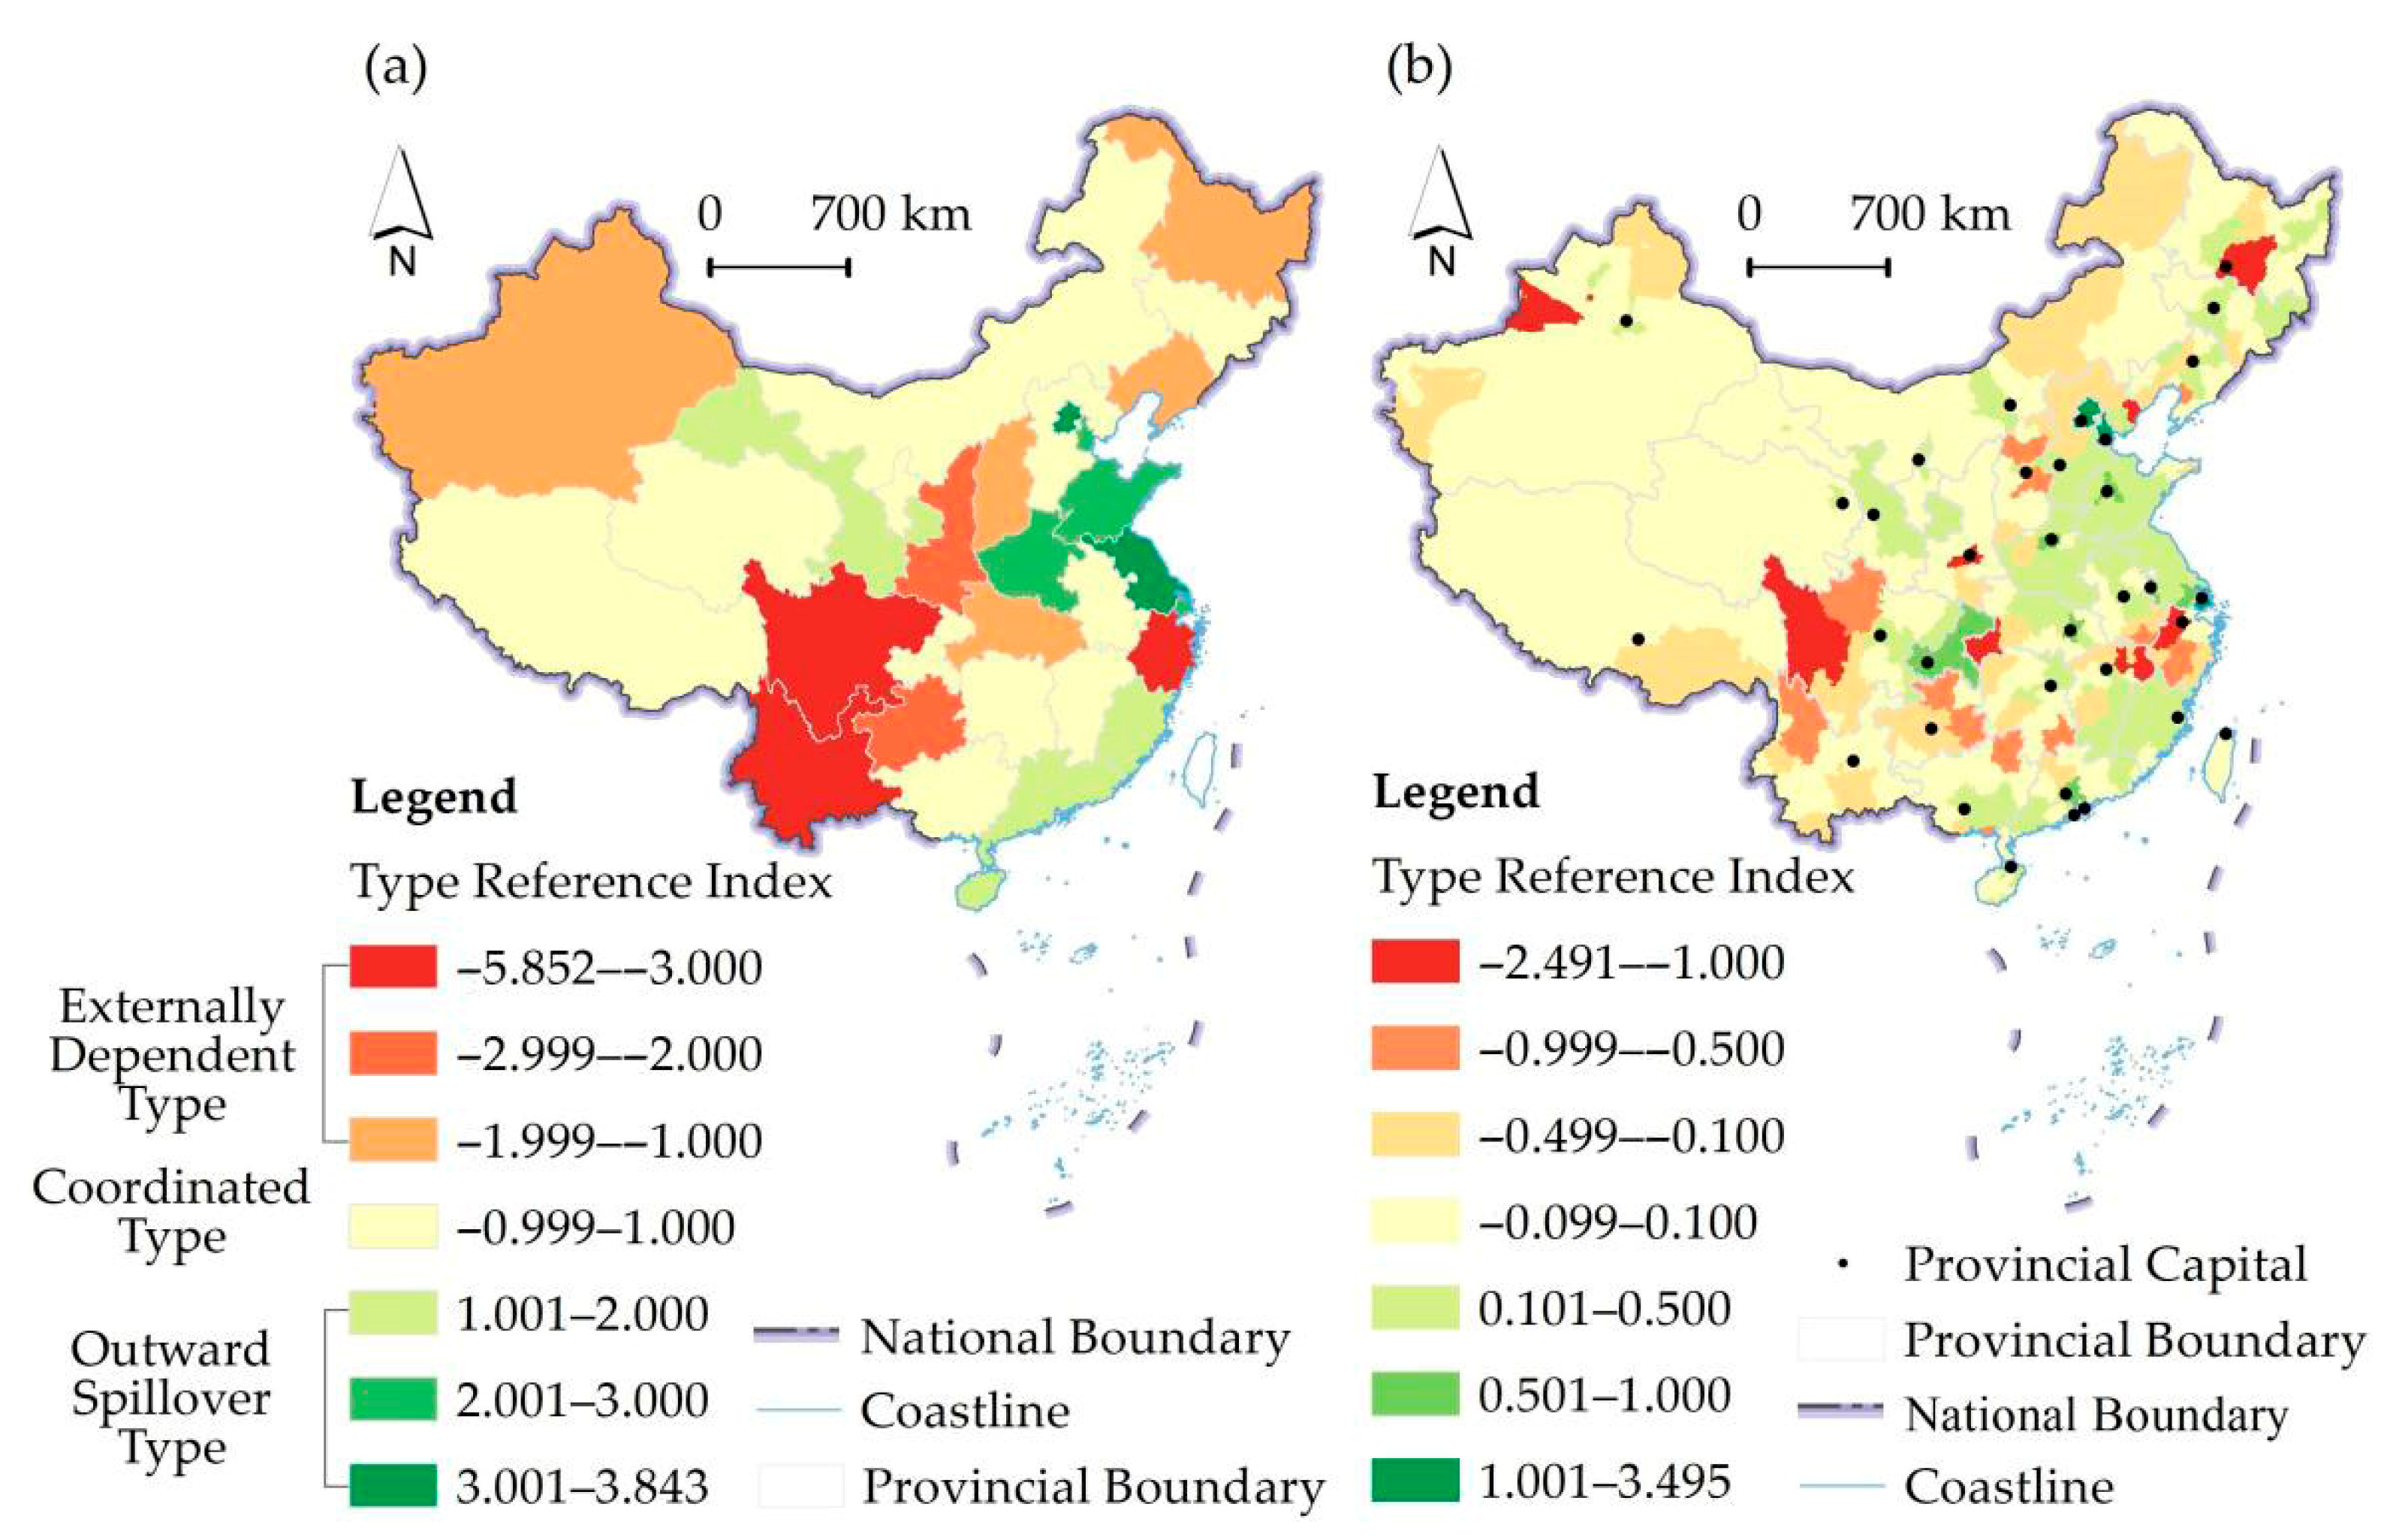
A positive T R I i   indicates that, under the current development level of China’s homestay consumption and industry, the social attention index of homestays in such regions is higher than the regional homestay industry scale index. These areas are termed “outward spillover types”, meaning that they not only have substantial market potential for local leisure activities among residents but can also drive homestay consumption in other regions through cross-regional tourism.
A negative T R I i   indicates that, under the current level of homestay consumption and industrial development in China, the social attention index for homestays in this region is lower than the regional homestay industry scale index. These are termed “externally dependent types”, meaning that the homestay industry scale in these regions has surpassed local consumption potential and relies on cross-regional tourists to sustain the homestay industry’s development.

3.1.4. Potential Influencing Factors of Homestay Industry Sustainability

Drawing on existing research [40,41,45,71], this study included four categories of potential influencing factors:
  • Macroeconomic and Industrial Structure: GDP; output values of the primary, secondary, and tertiary industries; number of nationally recognized high-tech enterprises; and operating income of above-scale service enterprises.
  • Cultural and Tourism Development: number of tourist visits, tourism revenue, number of A-level scenic spots, number of high-star hotels, and number of museums.
  • Local Population Base: permanent resident population, urbanization rate, number of participants in basic pension insurance for urban employees, number of undergraduate and junior college students, and number of preschool and primary school students.
  • Resident Income Level: per capita disposable income.
Data were obtained from the 2024 China Urban Statistical Yearbook [72] and various regional statistical yearbooks and bulletins.

3.2. Data Analysis Methods

3.2.1. Spatial Interpolation Analysis

Spatial interpolation is a key GIS technique that estimates values at unknown locations based on spatial relationships among known data points [73]. The accuracy depends on the interpolation method used [74]. The Kriging method, based on statistical theory [75], effectively accounts for spatial variability. The model is expressed as follows:
Z x = i = 1 n λ i Z i
where   λ i is the Kriging weight, satisfying the condition i = 1 n λ i = 1 . The weights are solved by minimising the mean square error [75]. In this study, the Kriging method was applied to analyse the spatial and temporal evolution of China’s homestay industry with the prefecture-level city centroids as input points and new enterprise counts as weights. This approach generates a smoothed nationwide surface of homestay industry growth, mitigating artificial discontinuities caused by administrative divisions. Multi-temporal interpolation of panel data allows for trend analysis of homestay industry growth patterns beyond jurisdictional limits, reflecting the intrinsic expansion logic of the homestay industry.

3.2.2. Standard Deviation Ellipse and Centre of Gravity Shift Analysis

The standard deviation ellipse is a widely used method for measuring the spatial distribution and orientation of data. It generates an ellipse defined by a long axis, short axis, center point, and azimuth angle. This method is commonly applied in identifying industrial clusters [76] and analyzing spatial pattern evolution [77]. In this study, a comparative analysis of standard ellipses was conducted for newly added homestay enterprises in each municipality across different chronological periods. This enabled the determination of the distribution center of gravity and orientation angle of China’s homestay industry.
The center of gravity shift model reflects the spatial transformation characteristics of an industry and helps to understand the dynamic evolution of the homestay industry [78]. When performing specific operations, the range standardization method is first used to eliminate the dimensional differences between the evaluation indicators:
x i t = ε + x i t min x i t max x i t min x i t × ( 1 ε )
where ε = 0.01 is the offset in extreme value standardisation;   x i t is the original value of indicator t for sample i; x i t is the standardized value; and max x i t and min x i t are the maximum and minimum values of x i t , to enhance comparability across time periods, respectively.
Then, the center of gravity shift model is applied to track the temporal evolution of the homestay industry. Based on the geographic coordinates and weighted indices of homestays, the coordinates of the center of gravity ( x ¯ i , y ¯ i ) are calculated. The movement distances at different system levels are then computed to reflect the spatial aggregation and displacement patterns of the homestay industry. The model is expressed as follows:
x ¯ i = a = 1 z V i x a a = 1 z V i , y ¯ i = a = 1 z V i y a a = 1 z V i
D t = R × ( y ¯ i + t y ¯ i ) 2 + ( x ¯ i + t x ¯ i ) 2
where D t is the distance which the center of gravity moved from yeari to yeari+t, z is the number of regions with homestay industry, and R is a constant.
The results elucidate the historical migration trajectories of the spatial center of homestay industry growth.

3.2.3. Global Moran’s I Index

Spatial econometric analysis often uses Moran’s I statistic to measure spatial autocorrelation. The Global Moran’s I statistic reflects the overall degree of spatial autocorrelation of economic variables within the study area [79] and is helpful to judge the spatial correlation of China’s homestay industry. The model is expressed as follows:
I G = n i = 1 n j = 1 n w i j ( x i x ¯ ) ( x j x ¯ ) i = 1 n j = 1 n w i j ( x i x ¯ ) 2
where I G is the Global Moran’s I statistic; w i j is the element in the ith row and jth column of the spatial weight matrix W; x i and x j represent the homestay industry scale index/social attention index in provinces i and j, respectively; and x ¯ represents the average index of all provinces. In this study, Moran’s I statistic was applied to detect clustering patterns, quantifying the overall spatial correlation of the homestay industry across China and its spatial regions.

3.2.4. Ordinary Least Squares (OLS) and Geographically Weighted Regression (GWR)

To further explore the multifactorial coupling mechanisms of geographical elements, multiple linear regression is often used [80] to establish predictive models characterizing geographic processes. Geographically weighted regression (GWR) builds upon the ordinary least squares (OLS) model by incorporating spatial weights, making it suitable for addressing spatial non-stationary. GWR is an effective analytical tool in the study of regional differences and spatial relationship evaluation. The model is expressed as follows:
y u = β 0 ( u ) + k = 1 P β K u x k u + ε ( u )
where β 0 ( u ) is the intercept term, β K u is the regression coefficient of the kth covariate, x k u is the value of the kth covariate at location u, p is the number of covariates, and   ε ( u ) is the random error term at location u [80].
This study applied these methods to provide robust support for the spatiotemporal analysis of the sustainability of China’s homestay industry. The OLS model was used to identify the potential indicators both for the industry scale index and the social attention index. The GWR model then incorporated spatial variability in regression coefficients, allowing the analysis to capture the spatial heterogeneity in the relationships of key determinants influencing the sustainable development of the homestay industry.

4. Results

4.1. Spatiotemporal Patterns of Social Attention of the Homestay Industry

4.1.1. Temporal Evolution of Social Attention of the Homestay Industry

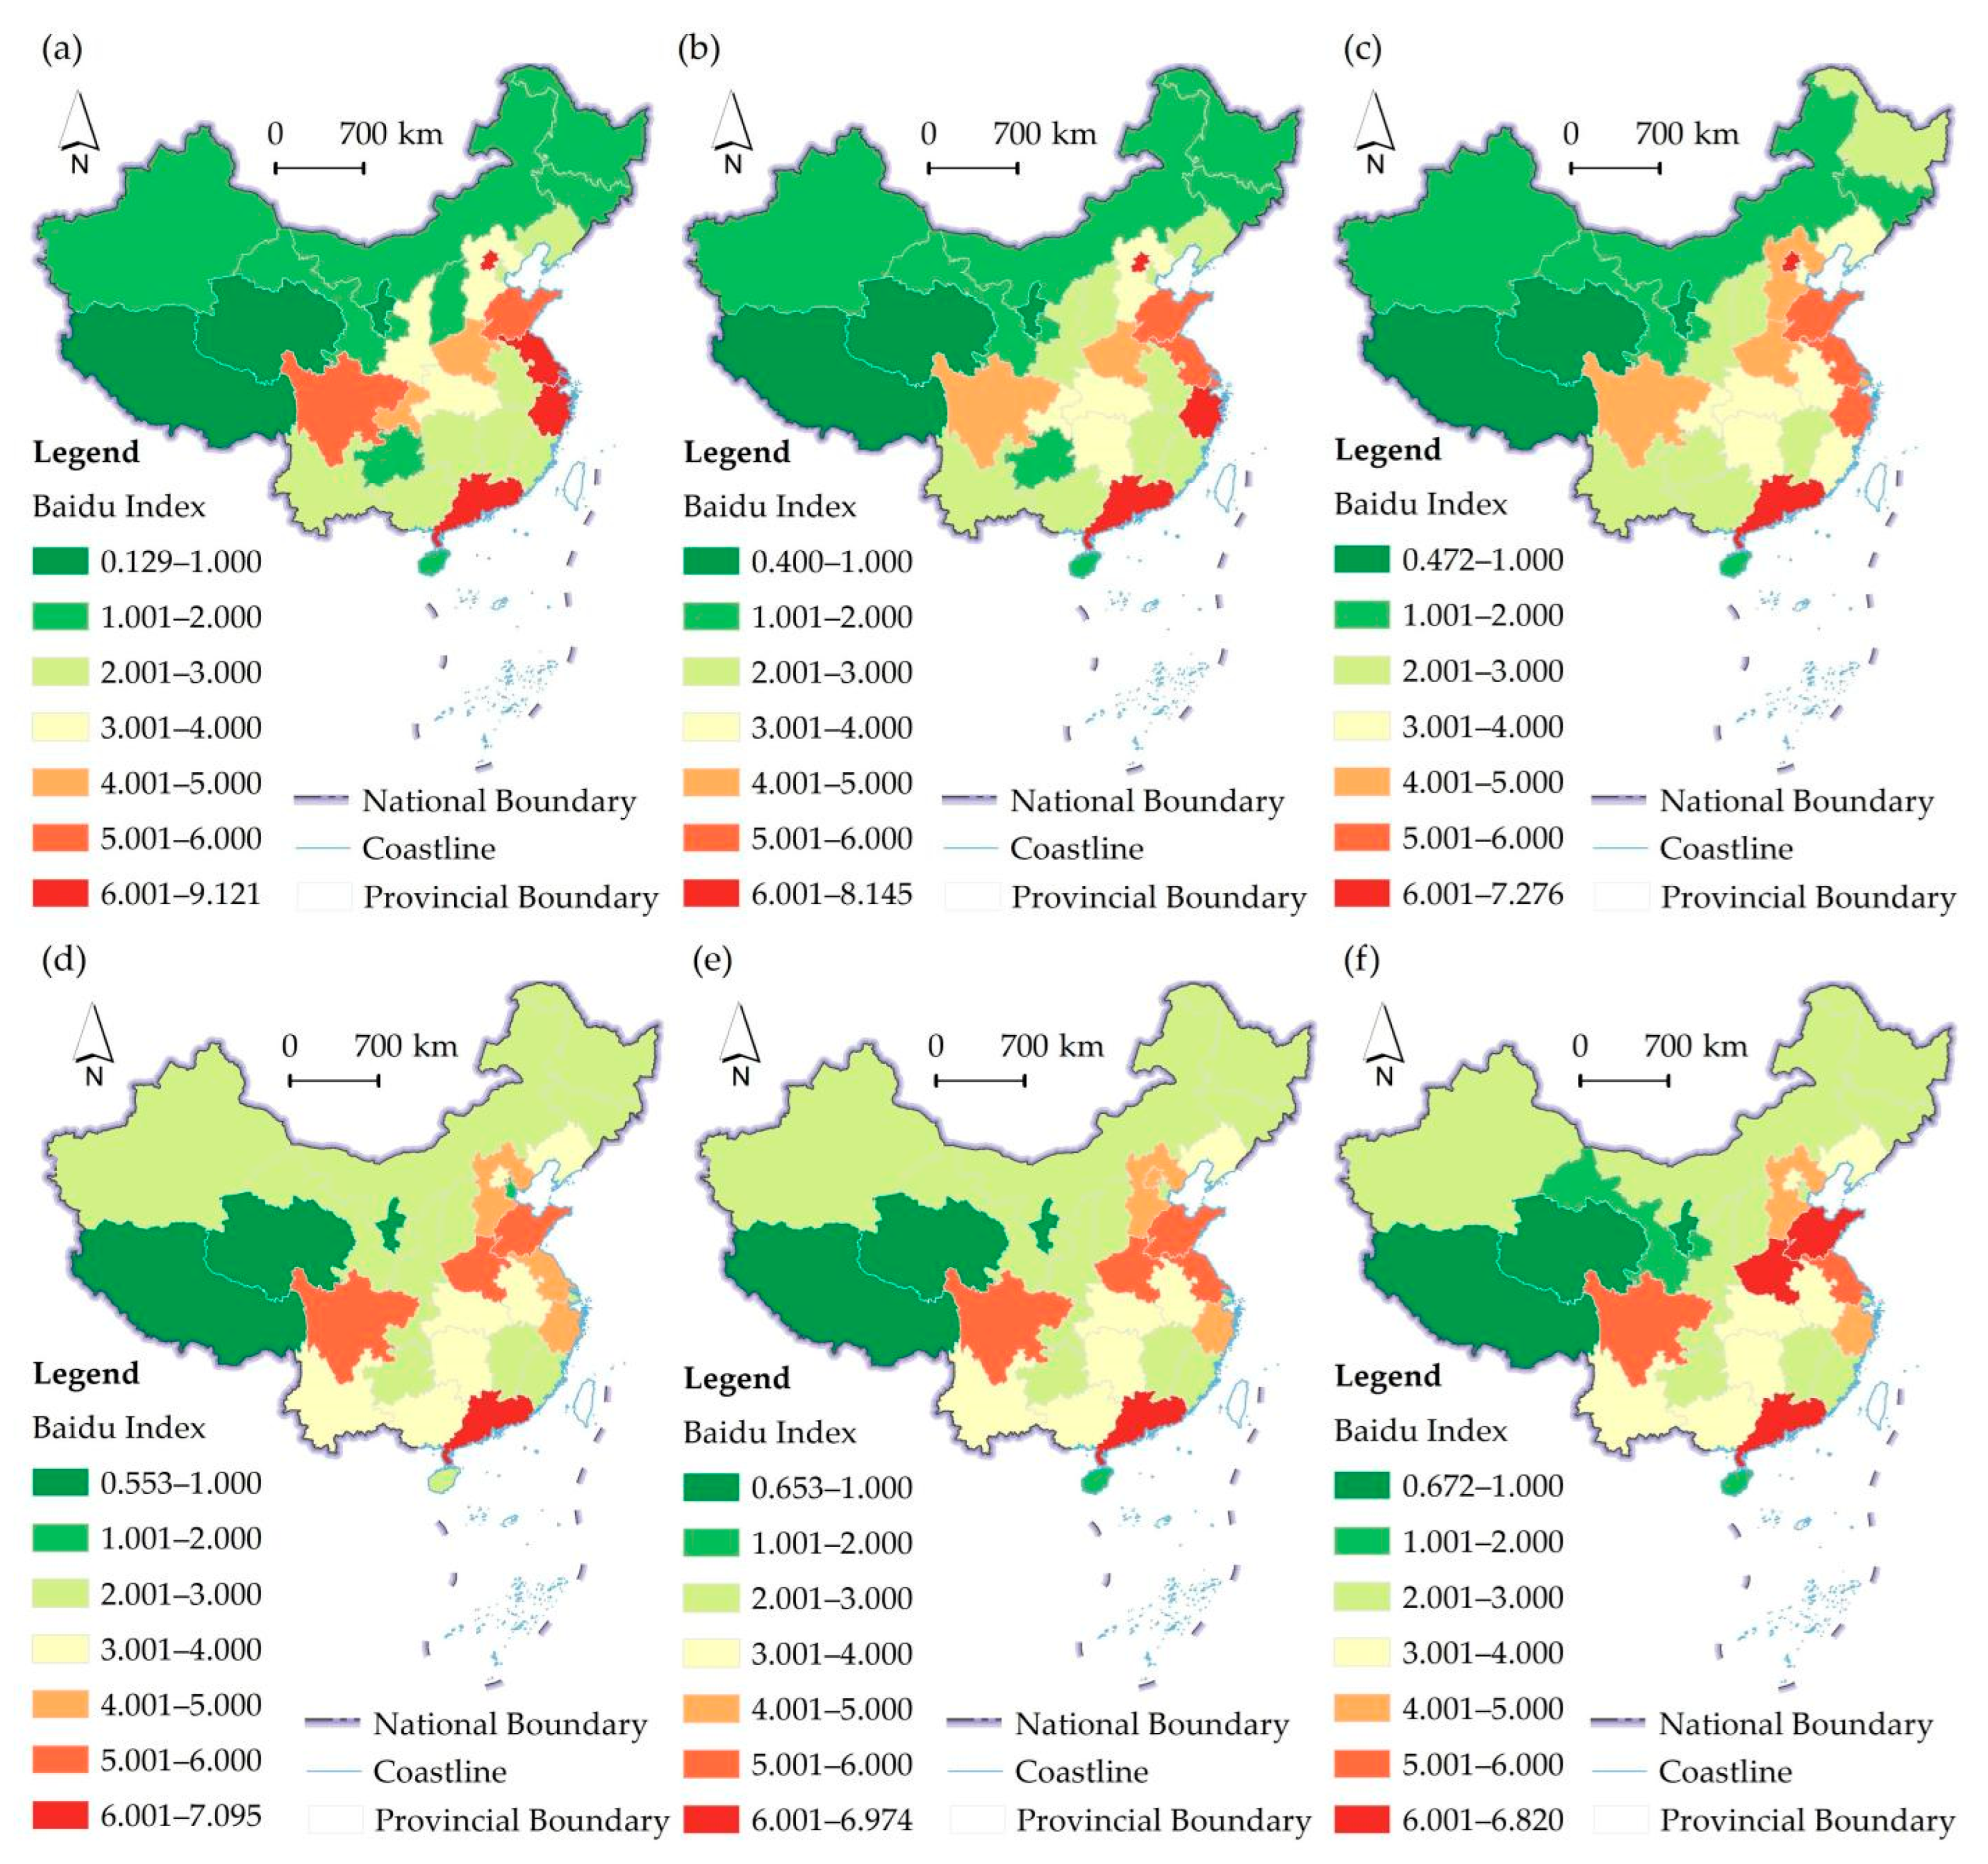
Between 2018 and 2024, the social attention of the homestay industry in China exhibited marked annual and seasonal dynamics (Figure 3a–c). In western regions, particularly those west of the Hu Huanyong Line, the spatial distribution of social attention remained relatively stable. In contrast, the eastern region experienced a gradual diffusion of social attention from core areas (Guangdong, Beijing, Jiangsu, and Zhejiang) to adjacent provinces. Similarly, the Sichuan–Chongqing region transferred part of its social attention to the surrounding Guizhou and Hubei. In North and Northeast China, economically less developed provinces like Hebei, Heilongjiang, and Liaoning demonstrated a clear upward trend in social attention.
In 2024, seasonal variations were apparent (Figure 3d–f) during winter (February), associated with the Spring Festival and winter break, homestay interest peaked in southern resort destinations like Hainan. In summer (August), major northern tourism provinces such as Shandong, Shanxi, and Gansu showed increased social attention due to student vacations and favourable travel conditions. In contrast, major tourism province in central China such as Jiangsu maintained relatively higher interest during spring and autumn but exhibited a notable drop in winter. These seasonal dynamics highlight the interactions among climate adaptation, holiday tourism typologies, and destination attraction categories and the homestay industry.

4.1.2. Spatial Differentiation of Social Attention

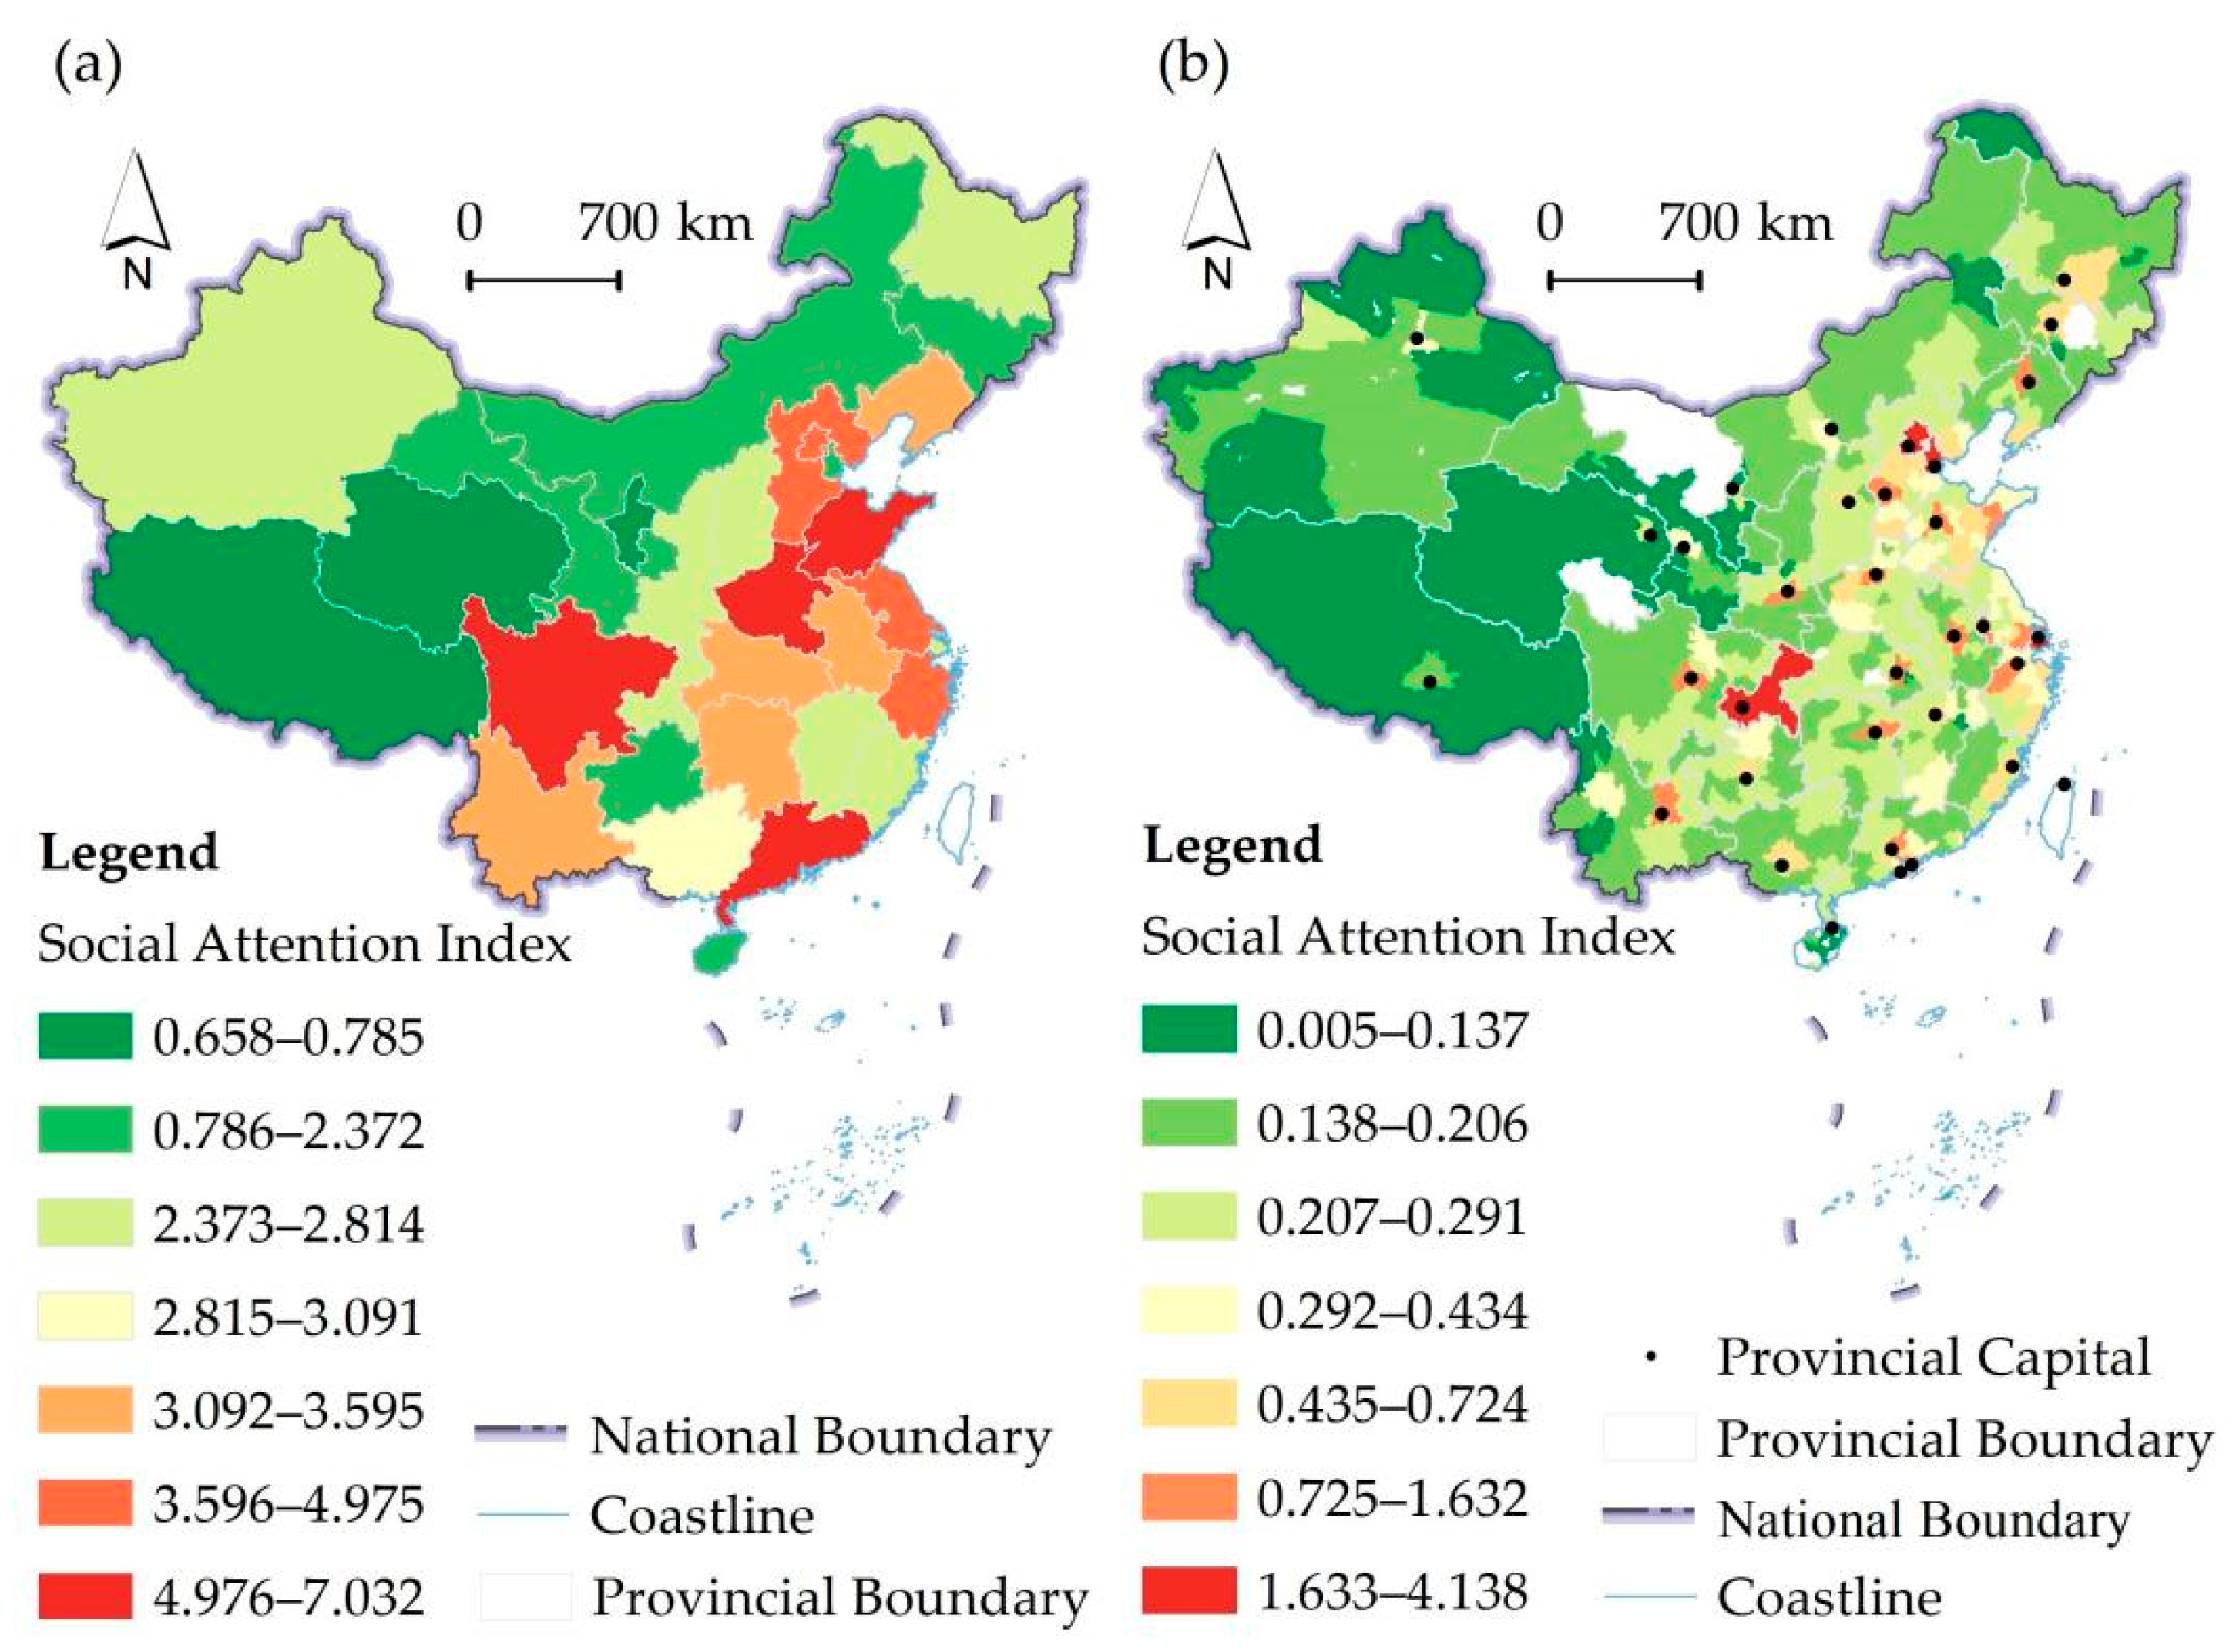
The 2024 spatial distribution of the homestay industry social attention index revealed pronounced east–west contrasts. Regions east of the Hu Huanyong Line exhibited significantly higher social attention index, underlining the imbalance in public attention and market development (Figure 4). At the provincial level, the mean social attention index was 3.226. Major provinces in terms of population and economy are the hotspot regions, including Guangdong, Shandong, Henan, and Sichuan. The sub-hotspot regions are primarily concentrated in North and East China. These values delineate three major hotspot zones: South China, East China, and Southwest China. At the municipal scale, the mean social attention index was 0.292, and clustering effects were evident both nationally and within North and South China (Table 1).
Major cities demonstrated notably high social attention values, with four municipalities (Beijing, Chongqing, Shanghai, Tianjin) leading, followed by major sub-provincial cities and provincial capitals (Chengdu, Guangzhou, Hangzhou, Zhengzhou). Despite these concentrations, 77.49% of cities fell below the national average, indicating that social attention remains highly centralized.

4.2. Spatiotemporal Patterns of Homestay Industry Scale

4.2.1. Temporal Evolution of Homestay Industry Scale

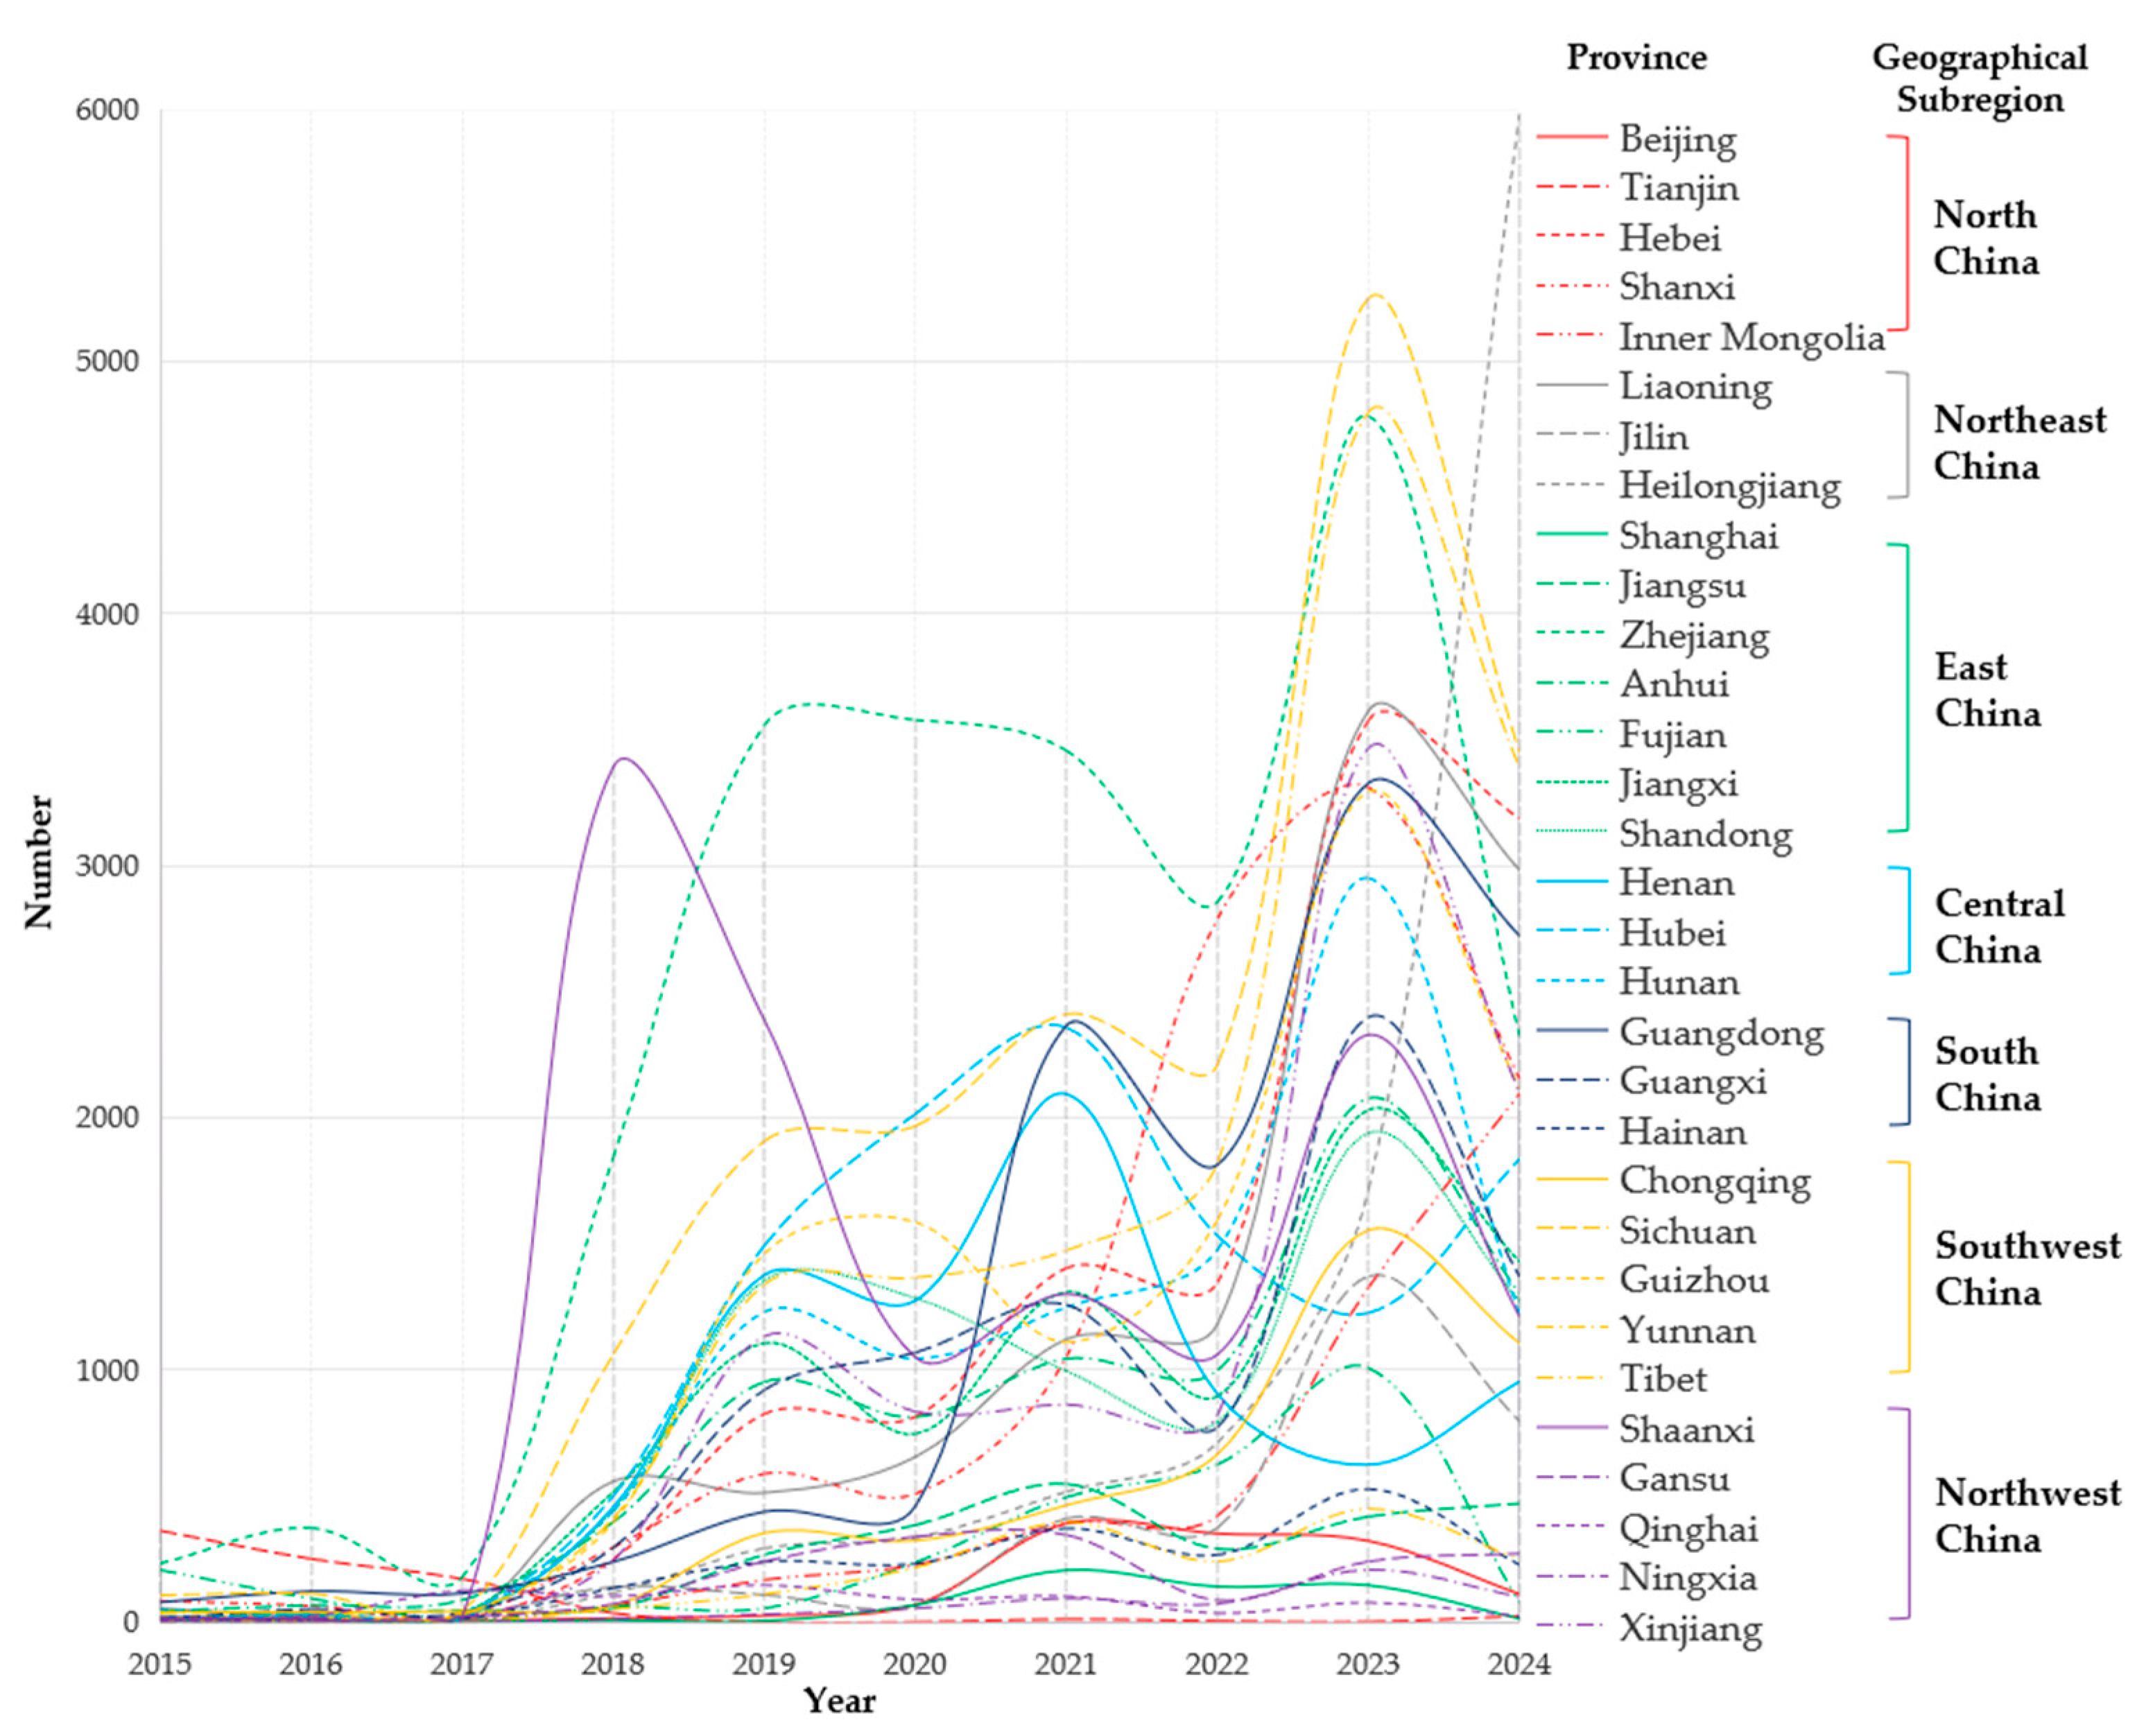
At the provincial level (Figure 5) over the past decade, the annual number of new homestay enterprises across Chinese provinces has shown an overall upward trend with fluctuations, peaking in 2023 and then generally declining in 2024. The temporal evolution characteristics are as follows: (1) Gradualism: Shaanxi led China’s homestay investment boom in 2018. In 2019, Zhejiang took over as the hotspot region, and by 2023, Sichuan had the highest increase in homestay enterprises. (2) Vulnerability: The COVID-19 pandemic in 2019 significantly curbed the investment momentum in the homestay industry. The rural and cultural tourism revival after the end of the COVID-19 pandemic in 2022 boosted the homestay investment boom to a new peak. (3) Cyclicality: In general, homestay investment booms in each province reach saturation within 2 to 3 years, transitioning from hot to cold. (4) Centrality: Within each geographical subregion, the trend of changes in homestay investment is relatively consistent. However, typically only one or two provinces become the core areas of regional homestay investment booms, with significant clustering and siphoning effects.
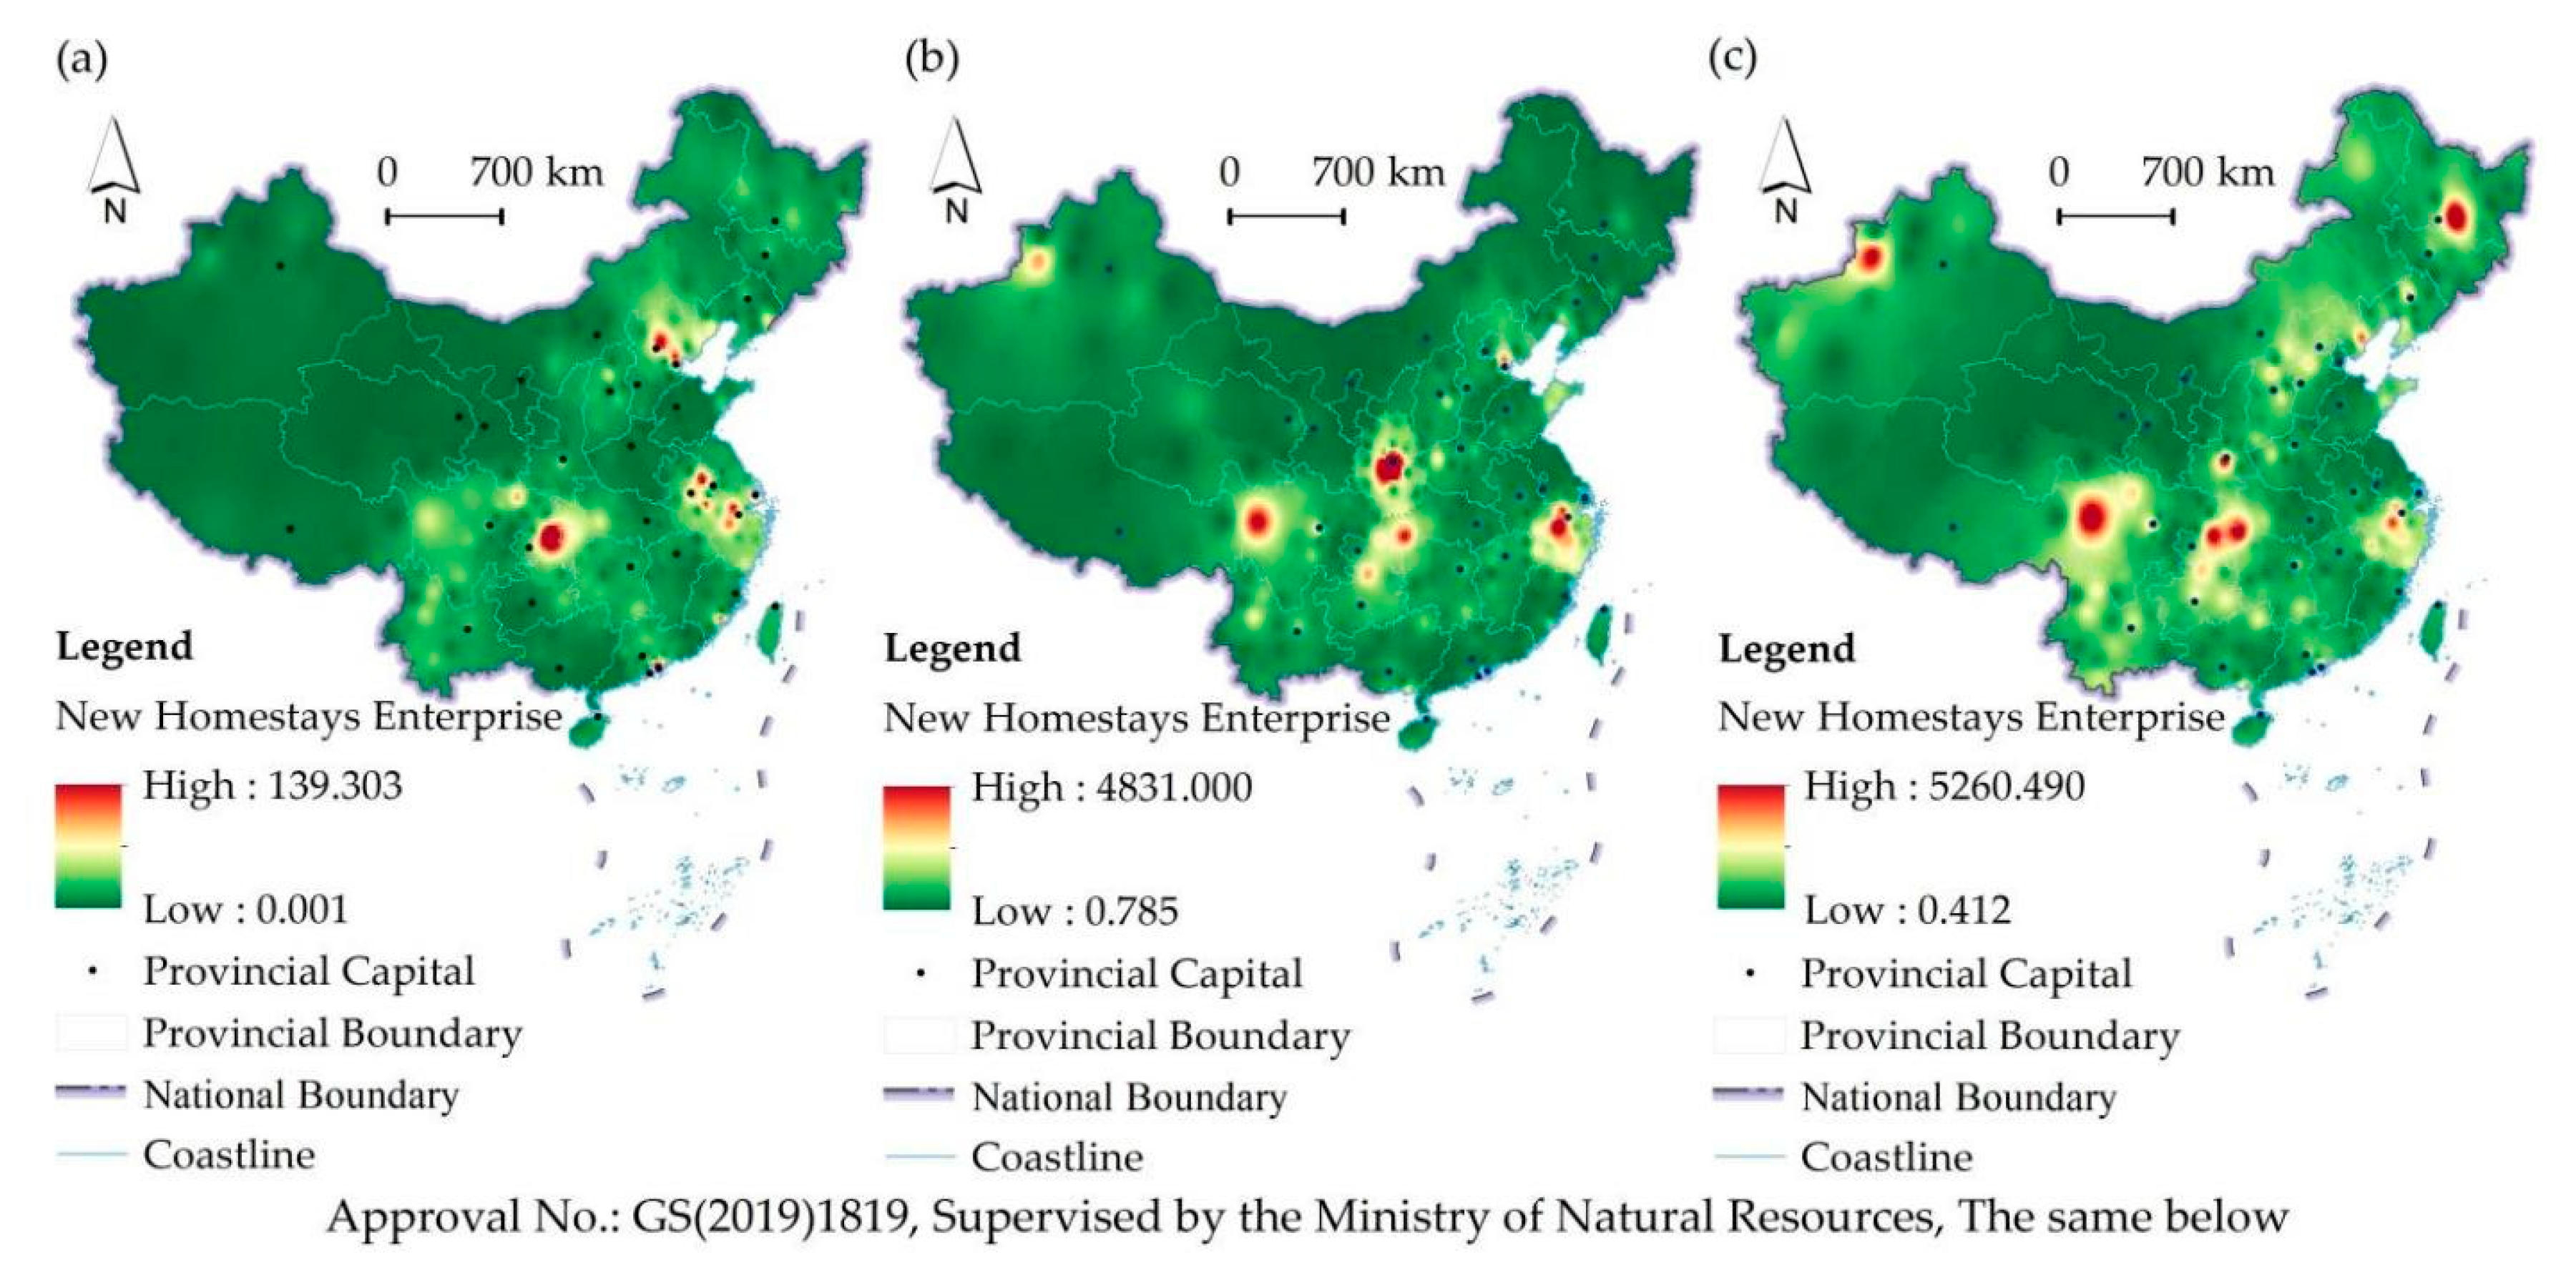
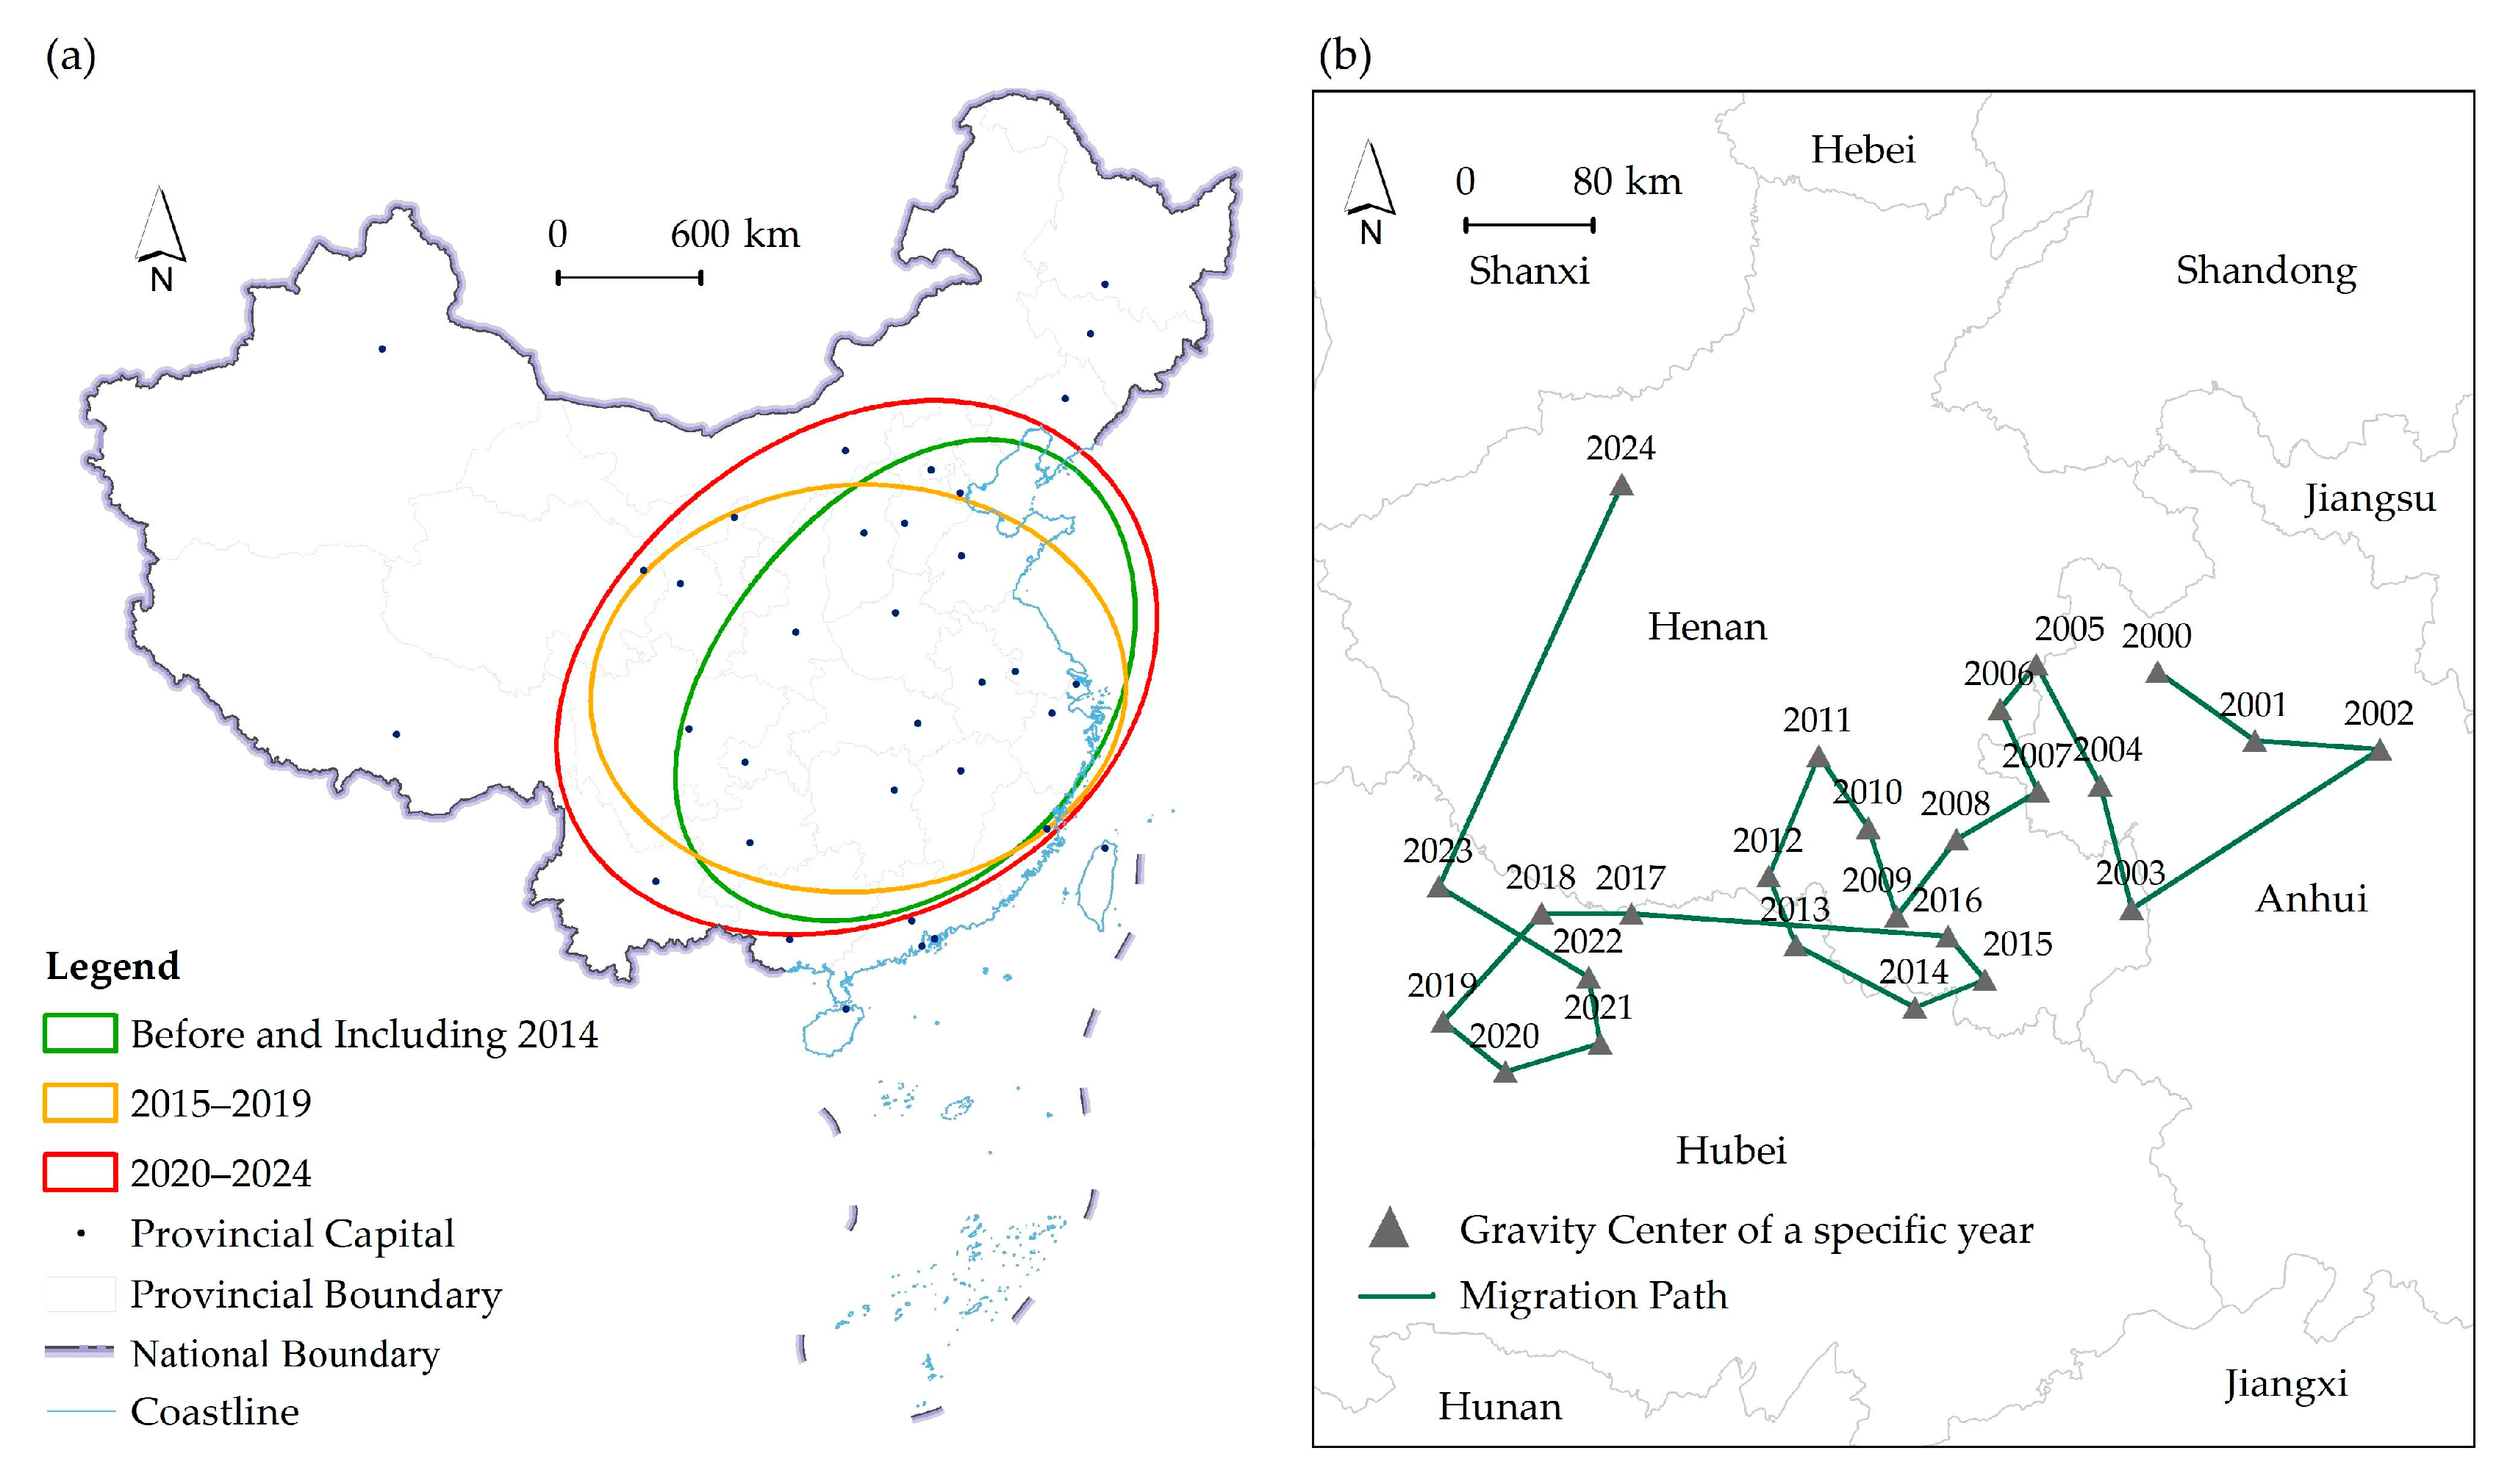
At the municipal scale, the annual number of new homestay enterprises in China exhibits the following characteristics: (1) Stage-wise explosive growth: Before 2014, the average annual number of new homestay enterprises per city was 9.312. From 2015 to 2019, the average annual number increased to 122.512. From 2020 to 2024, the average annual number reached 563.159. (2) Expansion of investment growth hotspot region from the core to the surrounding areas: Before 2014, homestay investments formed three major hotspots—Beijing–Tianjin urban cluster, Chengdu–Chongqing metropolitan area, and areas around the capital cities of Jiangsu and Zhejiang provinces (Figure 6a). Between 2015 and 2019, alongside sustained investment in the Yangtze River Delta (Jiangsu–Zhejiang–Shanghai), new hotspots emerged in western Sichuan and around Xi’an (Figure 6b). Between 2020 and 2024, investment hotspots continued to spread outward, with new activity in Xinjiang, Harbin, and the border area between Hubei and Chongqing (Figure 6c). Standard deviation ellipses for each five-year period show an expanding trend in the number of new homestay enterprises (Figure 7a). (3) Investment boom shift from east to west and then to the north: The migration path of the national center of gravity for new homestay enterprises from 2000 to 2024 shows a clear shift from east to west and from coastal to inland areas (Figure 7b). In the north–south direction, the pattern remained relatively stable until 2024, when a noticeable northward shift occurred due to a tourism boom in Northeast China.
The operating duration of active homestay enterprises shows the following characteristics: (1) Low operating duration. Only six provinces reported this indicator for more than 4 years, but nine had under 3 years. In total, 81 cities had average operational years of more than 4 years, while 99 cities are less than 3 years. (2) Large regional differences in the number of enterprises operating for over 5 years, but overall low proportions. Three provinces surpassing the threshold of 2000, but nine provinces are fewer than 500 which are mostly located in western and northern regions. Three cities had over 1000, forty-three cities had more than 200, and 92 cities had over 100. In contrast, 63 cities had fewer than 10.

4.2.2. Spatial Differentiation of Homestay Industry Scale

The total number and regional density of active homestay enterprises showed significant regional disparities on both sides of the Hu Huanyong Line, while the number of enterprises per 10,000 people exhibited an opposite pattern. All three indicators display significant clustering at the national municipal scale (Table 1), with different clustering types observed across various regions.
(1)
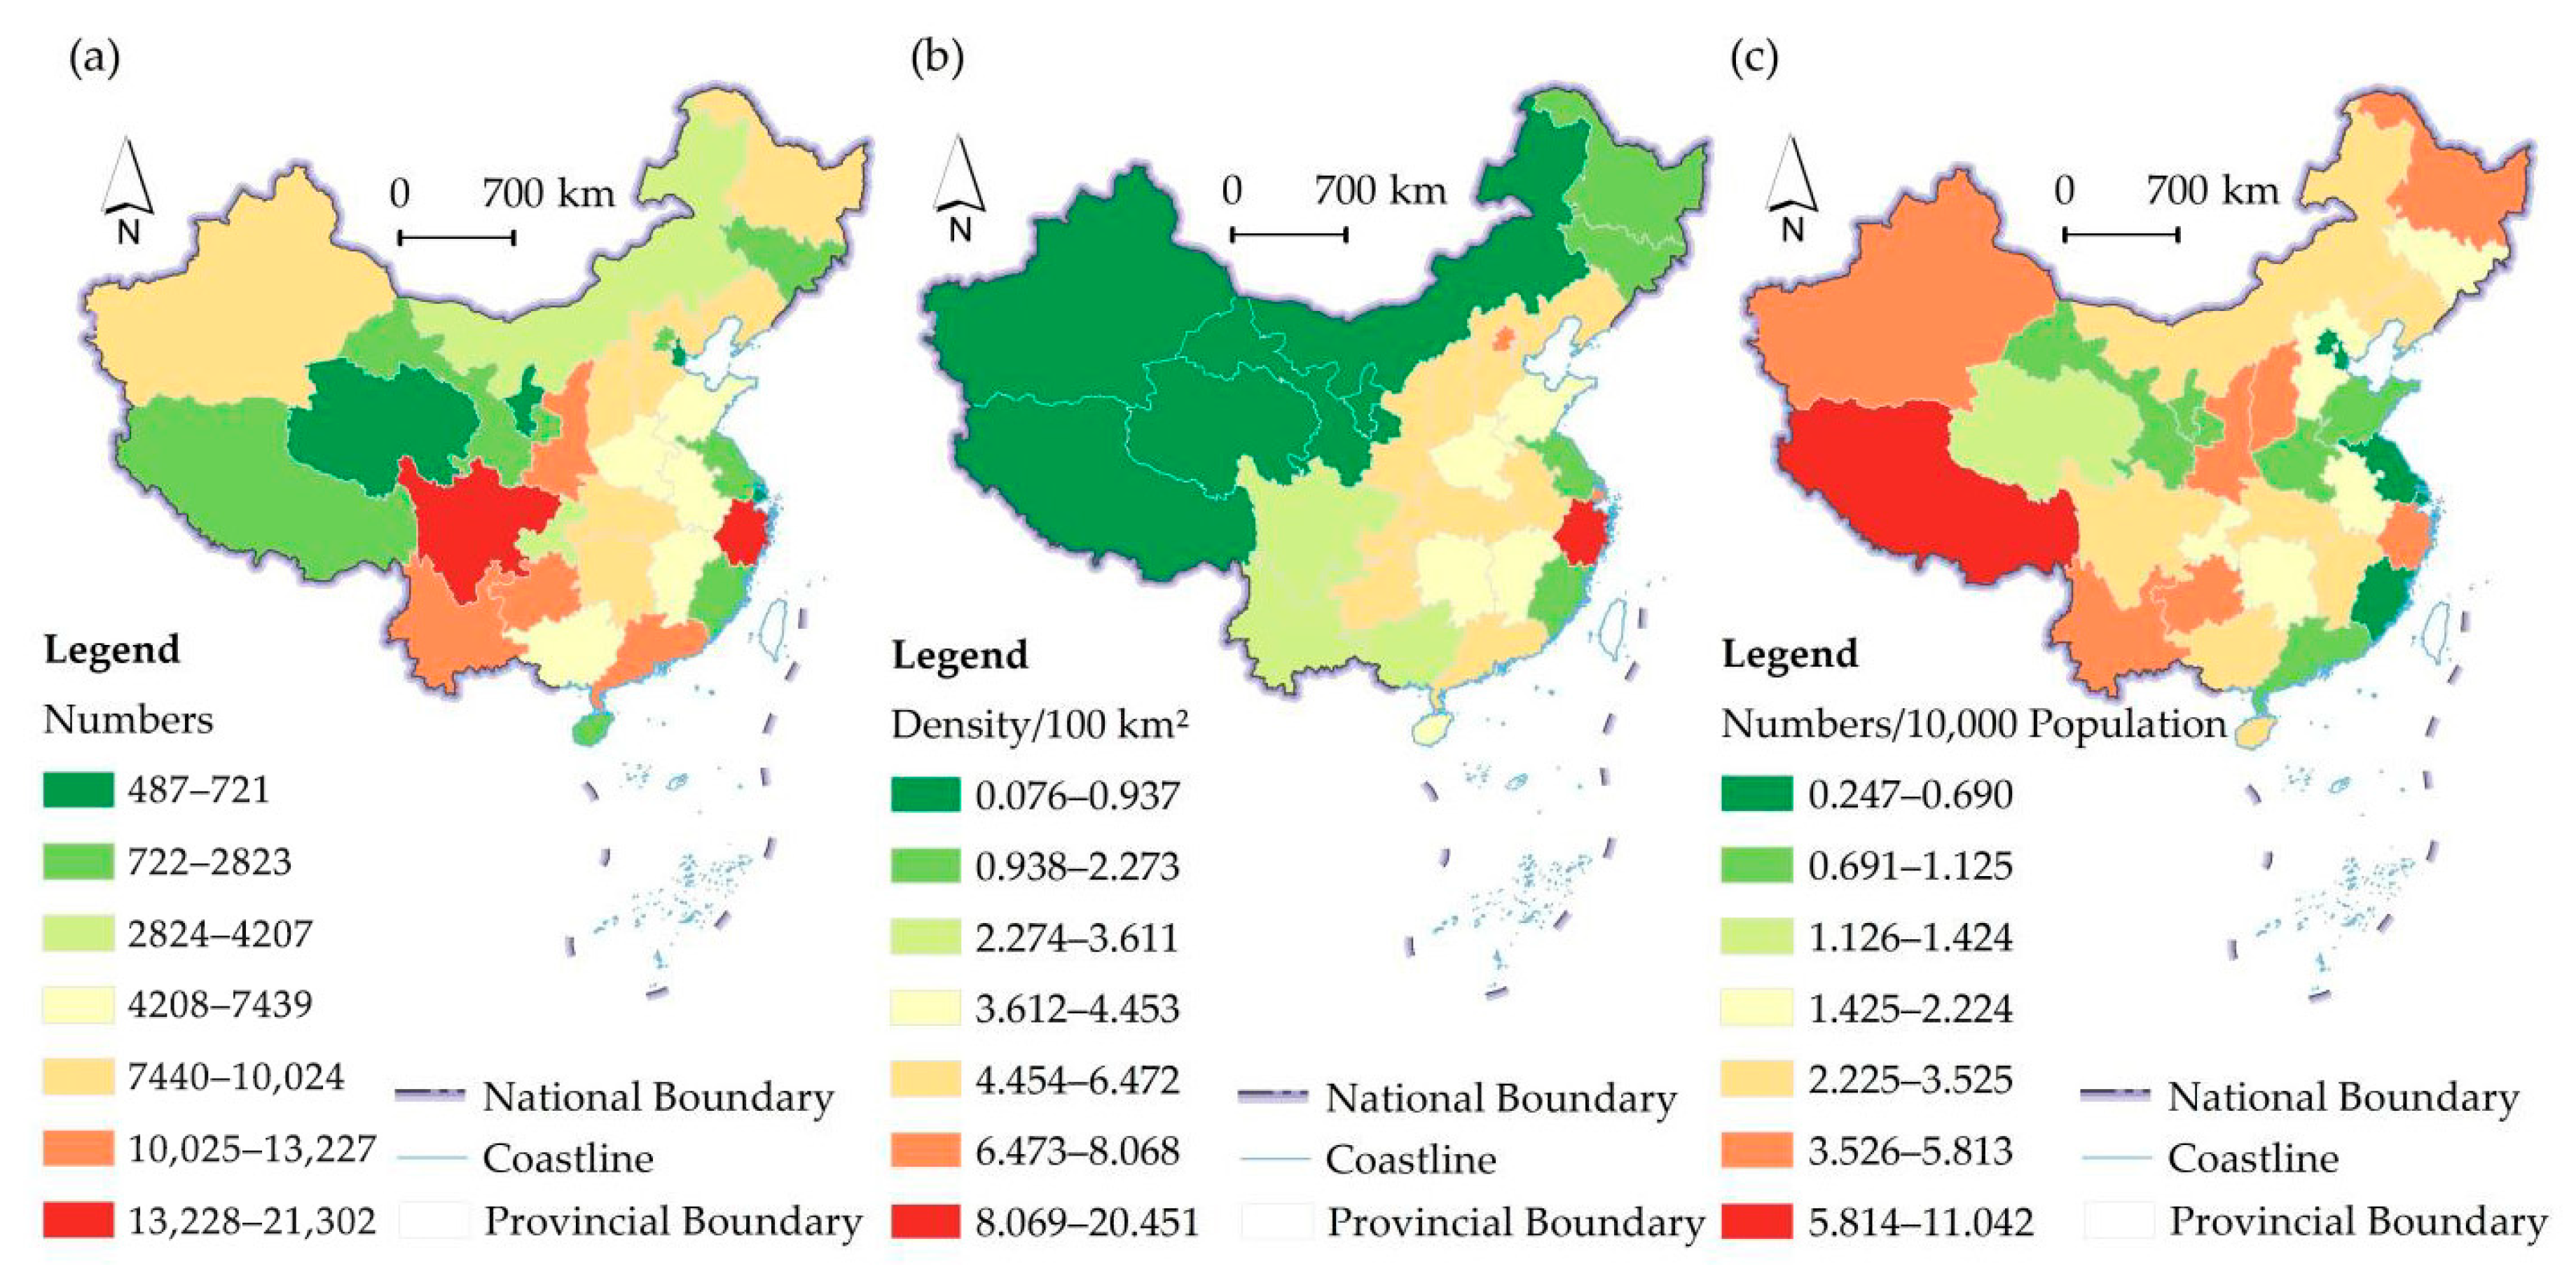
Number of Active Homestay Enterprises: The provincial distribution was random (Table 1). Zhejiang and Sichuan had the highest amount (Figure 8a), followed by four traditional tourism powerhouses. At the municipal level, East China showed strong agglomeration (Table 1), while other regions were randomly distributed. Xi’an, Garzê, and Harbin were major hotspots. Cold spots were mostly inland western cities or scattered across less tourism-driven eastern areas (Figure 9a).
(2)
Regional Density of Active Homestay Enterprises: Significant clustering was observed at the provincial level. Zhejiang led with 20.451 enterprises per 100 km2 (Figure 8b), followed by Beijing and Shanghai. Most provinces west of the Hu Huanyong Line had fewer than 1 per 100 km2. At the municipal level (Figure 9b), clustering was observed in North, Northeast, Central, and Northwest China. Capital cities tended to have the highest densities. Xiamen and Zhoushan exceeded 20, meantime Xi’an, Shenzhen, and Beihai exceeded 10. However, most cities had fewer than 1 per 100 km2.
(3)
Number of Active Homestay Enterprises per 10,000 Population: Due to China’s highly uneven population distribution, considering per capita figures is necessary for assessing enterprise intensity. In many sparsely populated western regions, though the absolute total number and regional density were low, the per capita number was high. At the provincial level (Figure 8c), Tibet ranked first, followed by Xinjiang and Yunnan. Jiangsu, Fujian, and Ningxia were the lowest among non-municipalities. At the municipal level (Figure 9c), clustering was observed in East, Central, South, and Southwest China. Garzê led with 148.313 per 10,000 population, followed by Diqing and Aba. Nearly two-thirds of cities had fewer than 3 per 10,000 population, and one-third have fewer than 1, mostly in agricultural provinces.
(4)
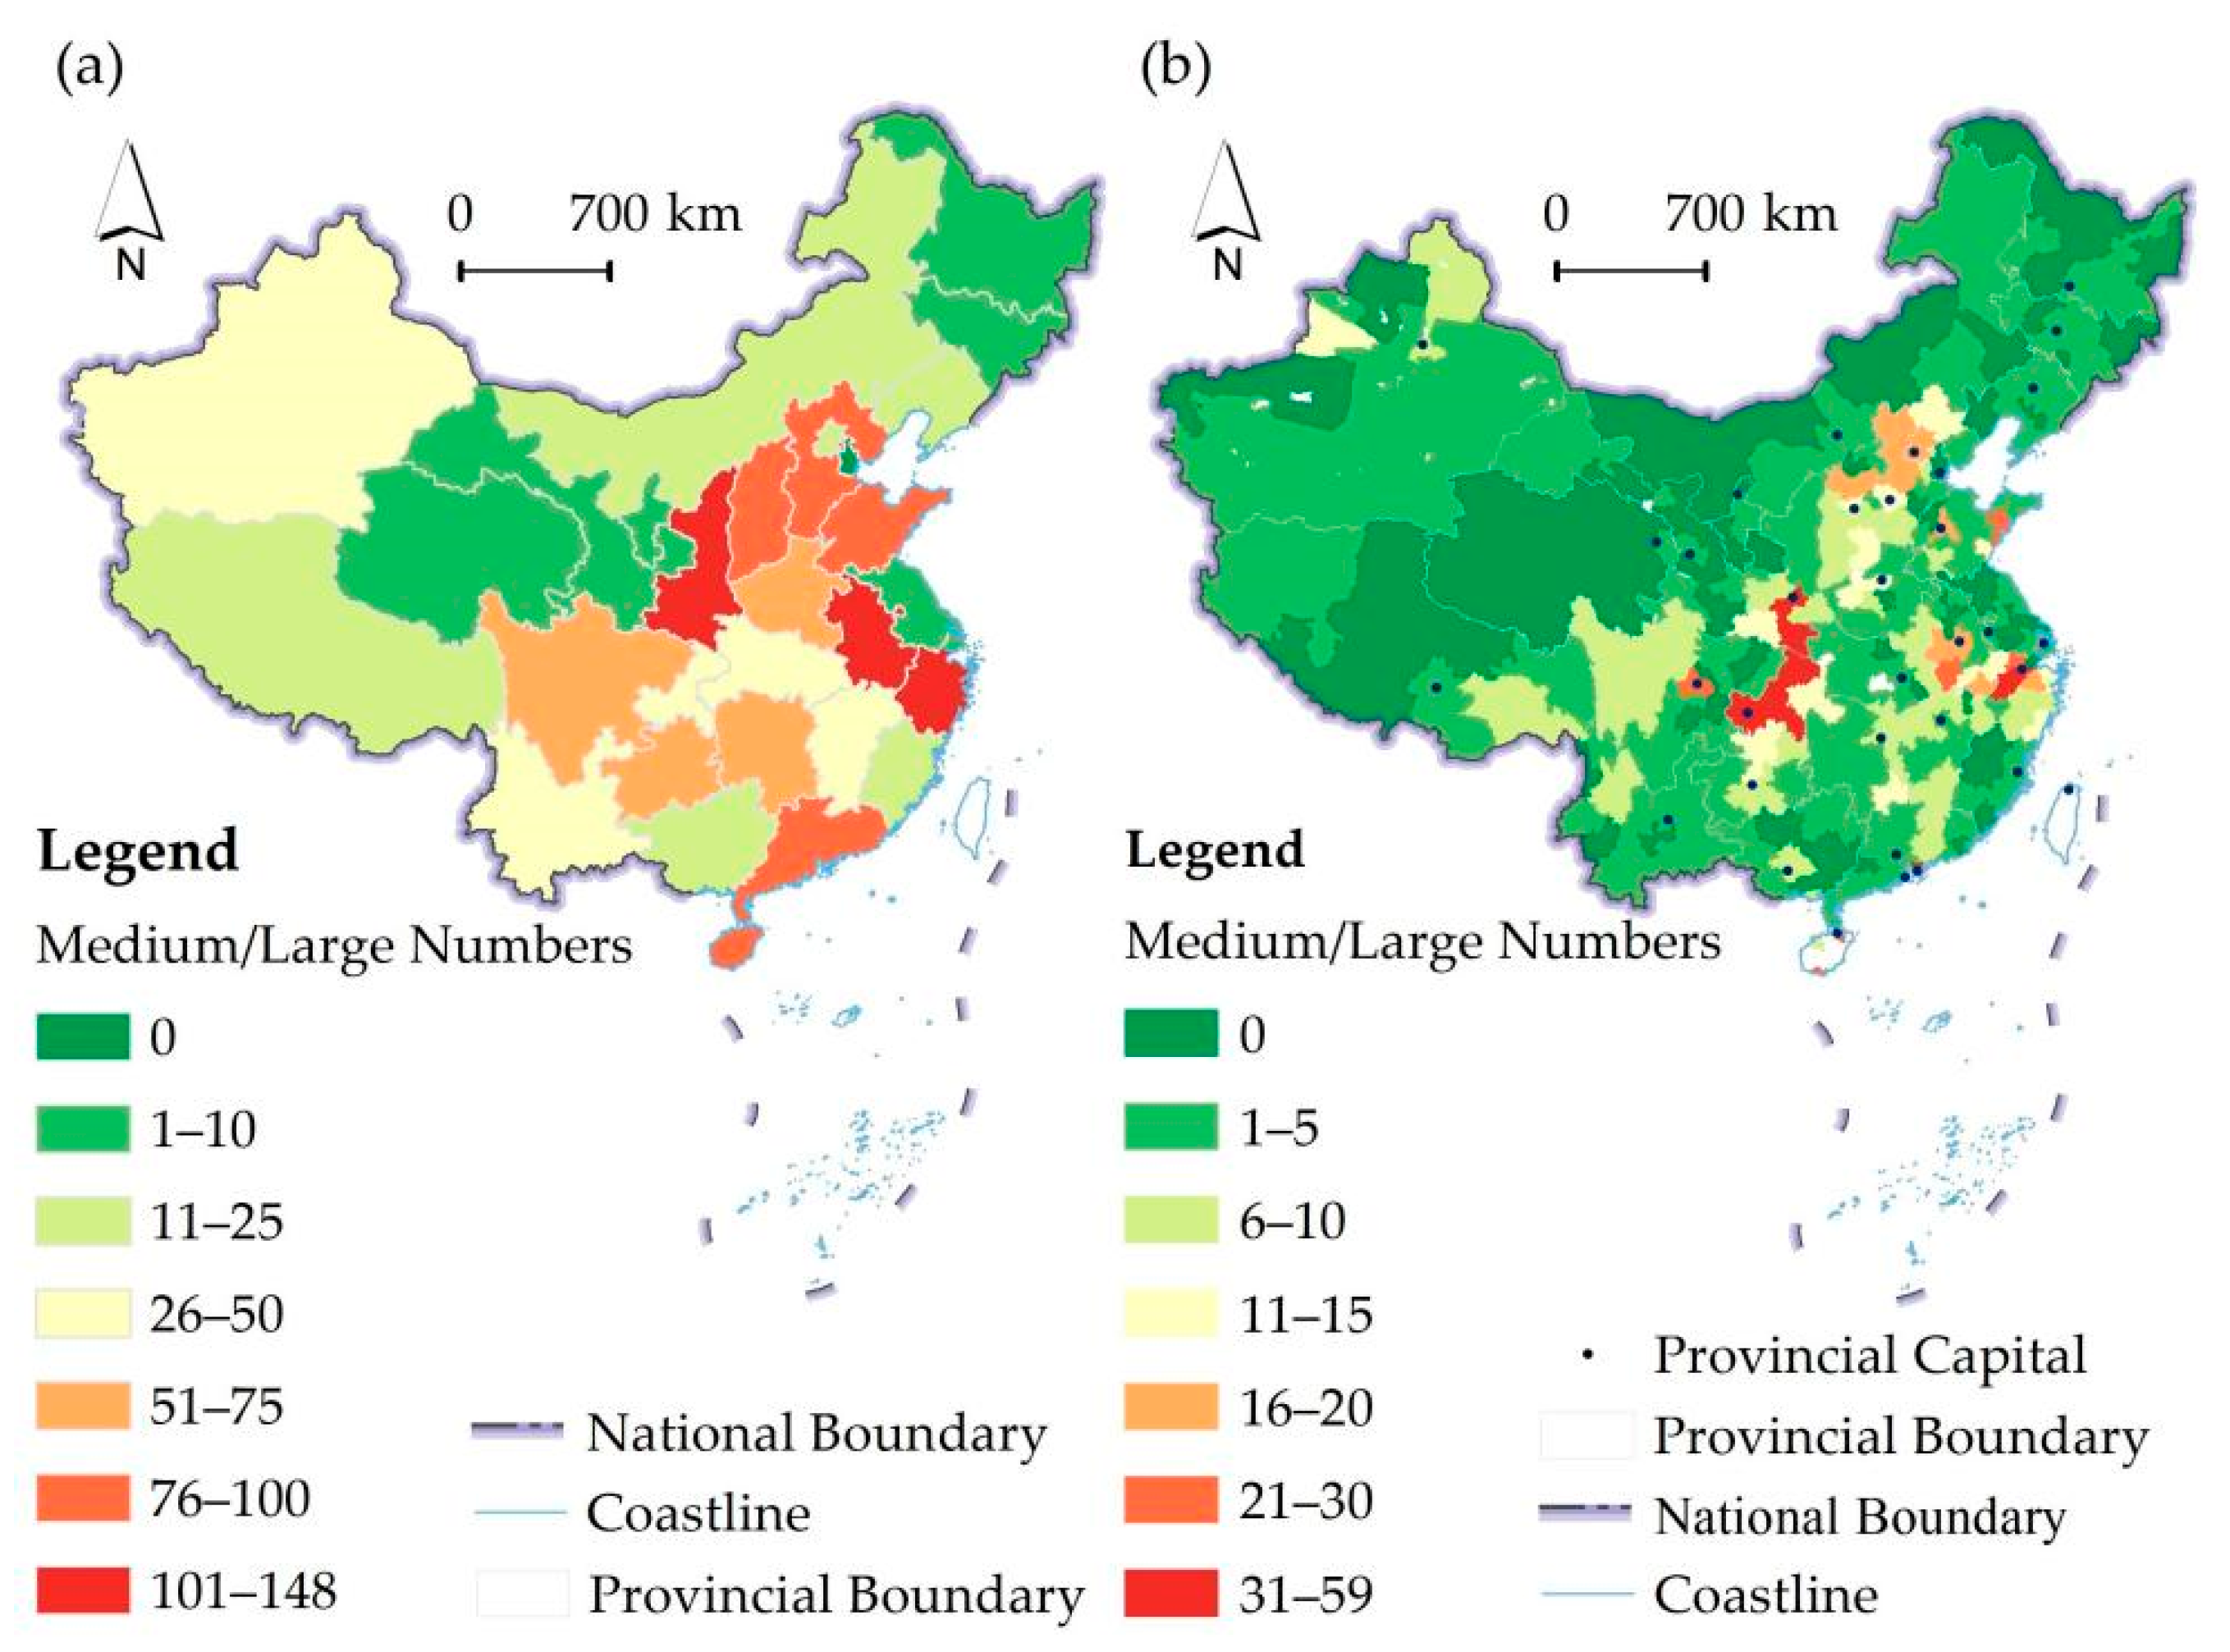
Number of Medium and Large Active Homestay Enterprises: Evaluating homestay industry requires considering enterprise scale. While small homestays suit idle capital and enable local branding, larger enterprises promote standardization and mitigate risk. Medium and large homestay enterprises accounted for 0.705% of the total. Nationwide, 900 enterprises had registered capital over 10 million RMB, and 2238 exceeded 5 million. Shaanxi, Zhejiang, and Anhui had the most medium and large homestay enterprises, while Qinghai and Ningxia had the fewest (Figure 10a). In total, 87.35% of cities had fewer than 10, and 76.47% had 5 or fewer. Enterprise scale showed significant clustering (Figure 10b).

4.3. Regional Typology for Sustainable Development of the Homestay Industry

At the provincial level, there were 10 outward spillover regions (32.26%). Jiangsu and Beijing showed high spillover effects, while Shandong, Shanghai, Henan, and Tianjin showed moderate spillover effects (Figure 11a). There were 139 outward spillover cities (accounting for 37.07%), among which the high-spillover cities were Beijing, Shanghai, and Tianjin. Whole moderate-spillover cities are all economically developed first-tier cities (Figure 11b). Provinces and regions with outward spillover effects have a solid economic foundation, a sizable consumer base for homestays, and well-established consumption habits. To promote the sustainable development of the homestay industry, efforts should focus on stimulating the weekend leisure demand of local residents.
At the provincial level, there were 10 externally dependent regions (32.26%). Among them, highly externally dependent provinces included Zhejiang, Sichuan, and Yunnan, while moderately externally dependent provinces included Xinjiang, Heilongjiang, Shanxi, Liaoning, and Hubei (Figure 11a). There were 70 externally dependent cities (18.67%). Except for Zhejiang Province, these externally dependent regions are typically tourist cities (Figure 11b). To promote the sustainable development of the homestay industry, emphasis should be placed on sustaining the prosperity of the tourism sector targeting non-local visitors, thereby driving the sustainable growth of the homestay industry.

4.4. Factors Influencing the Homestay Industry Sustainability

To explore the drivers behind the homestay industry sustainability, OLS and GWR analyses were conducted on 297 prefecture-level cities using SPSS Statistics 27 and ArcGIS 10.7. Stepwise regression was used to eliminate multicollinearity and statistically insignificant variables. The final OLS models included seven indicators for the industry scale index and six for the social attention index. GWR outperformed OLS models, showing higher R2 values and significantly lower AICc scores—confirming spatial non-stationarity and model superiority (Table 2). Over 95.93% of local GWR regressions passed residual tests.

4.4.1. Factors Affecting the Homestay Social Attention

Macroeconomic and industrial structure, cultural and tourism development, local population base, and resident income level influenced the social attention in the homestay industry at the urban level (Table 2). Specifically, operating income of above-scale service enterprises, number of participants in basic pension insurance for urban employees, number of tourist visits, number of undergraduate and junior college students, and number of preschool and primary school students all had positive effects, with standardized coefficients decreasing in strength (Table 2).
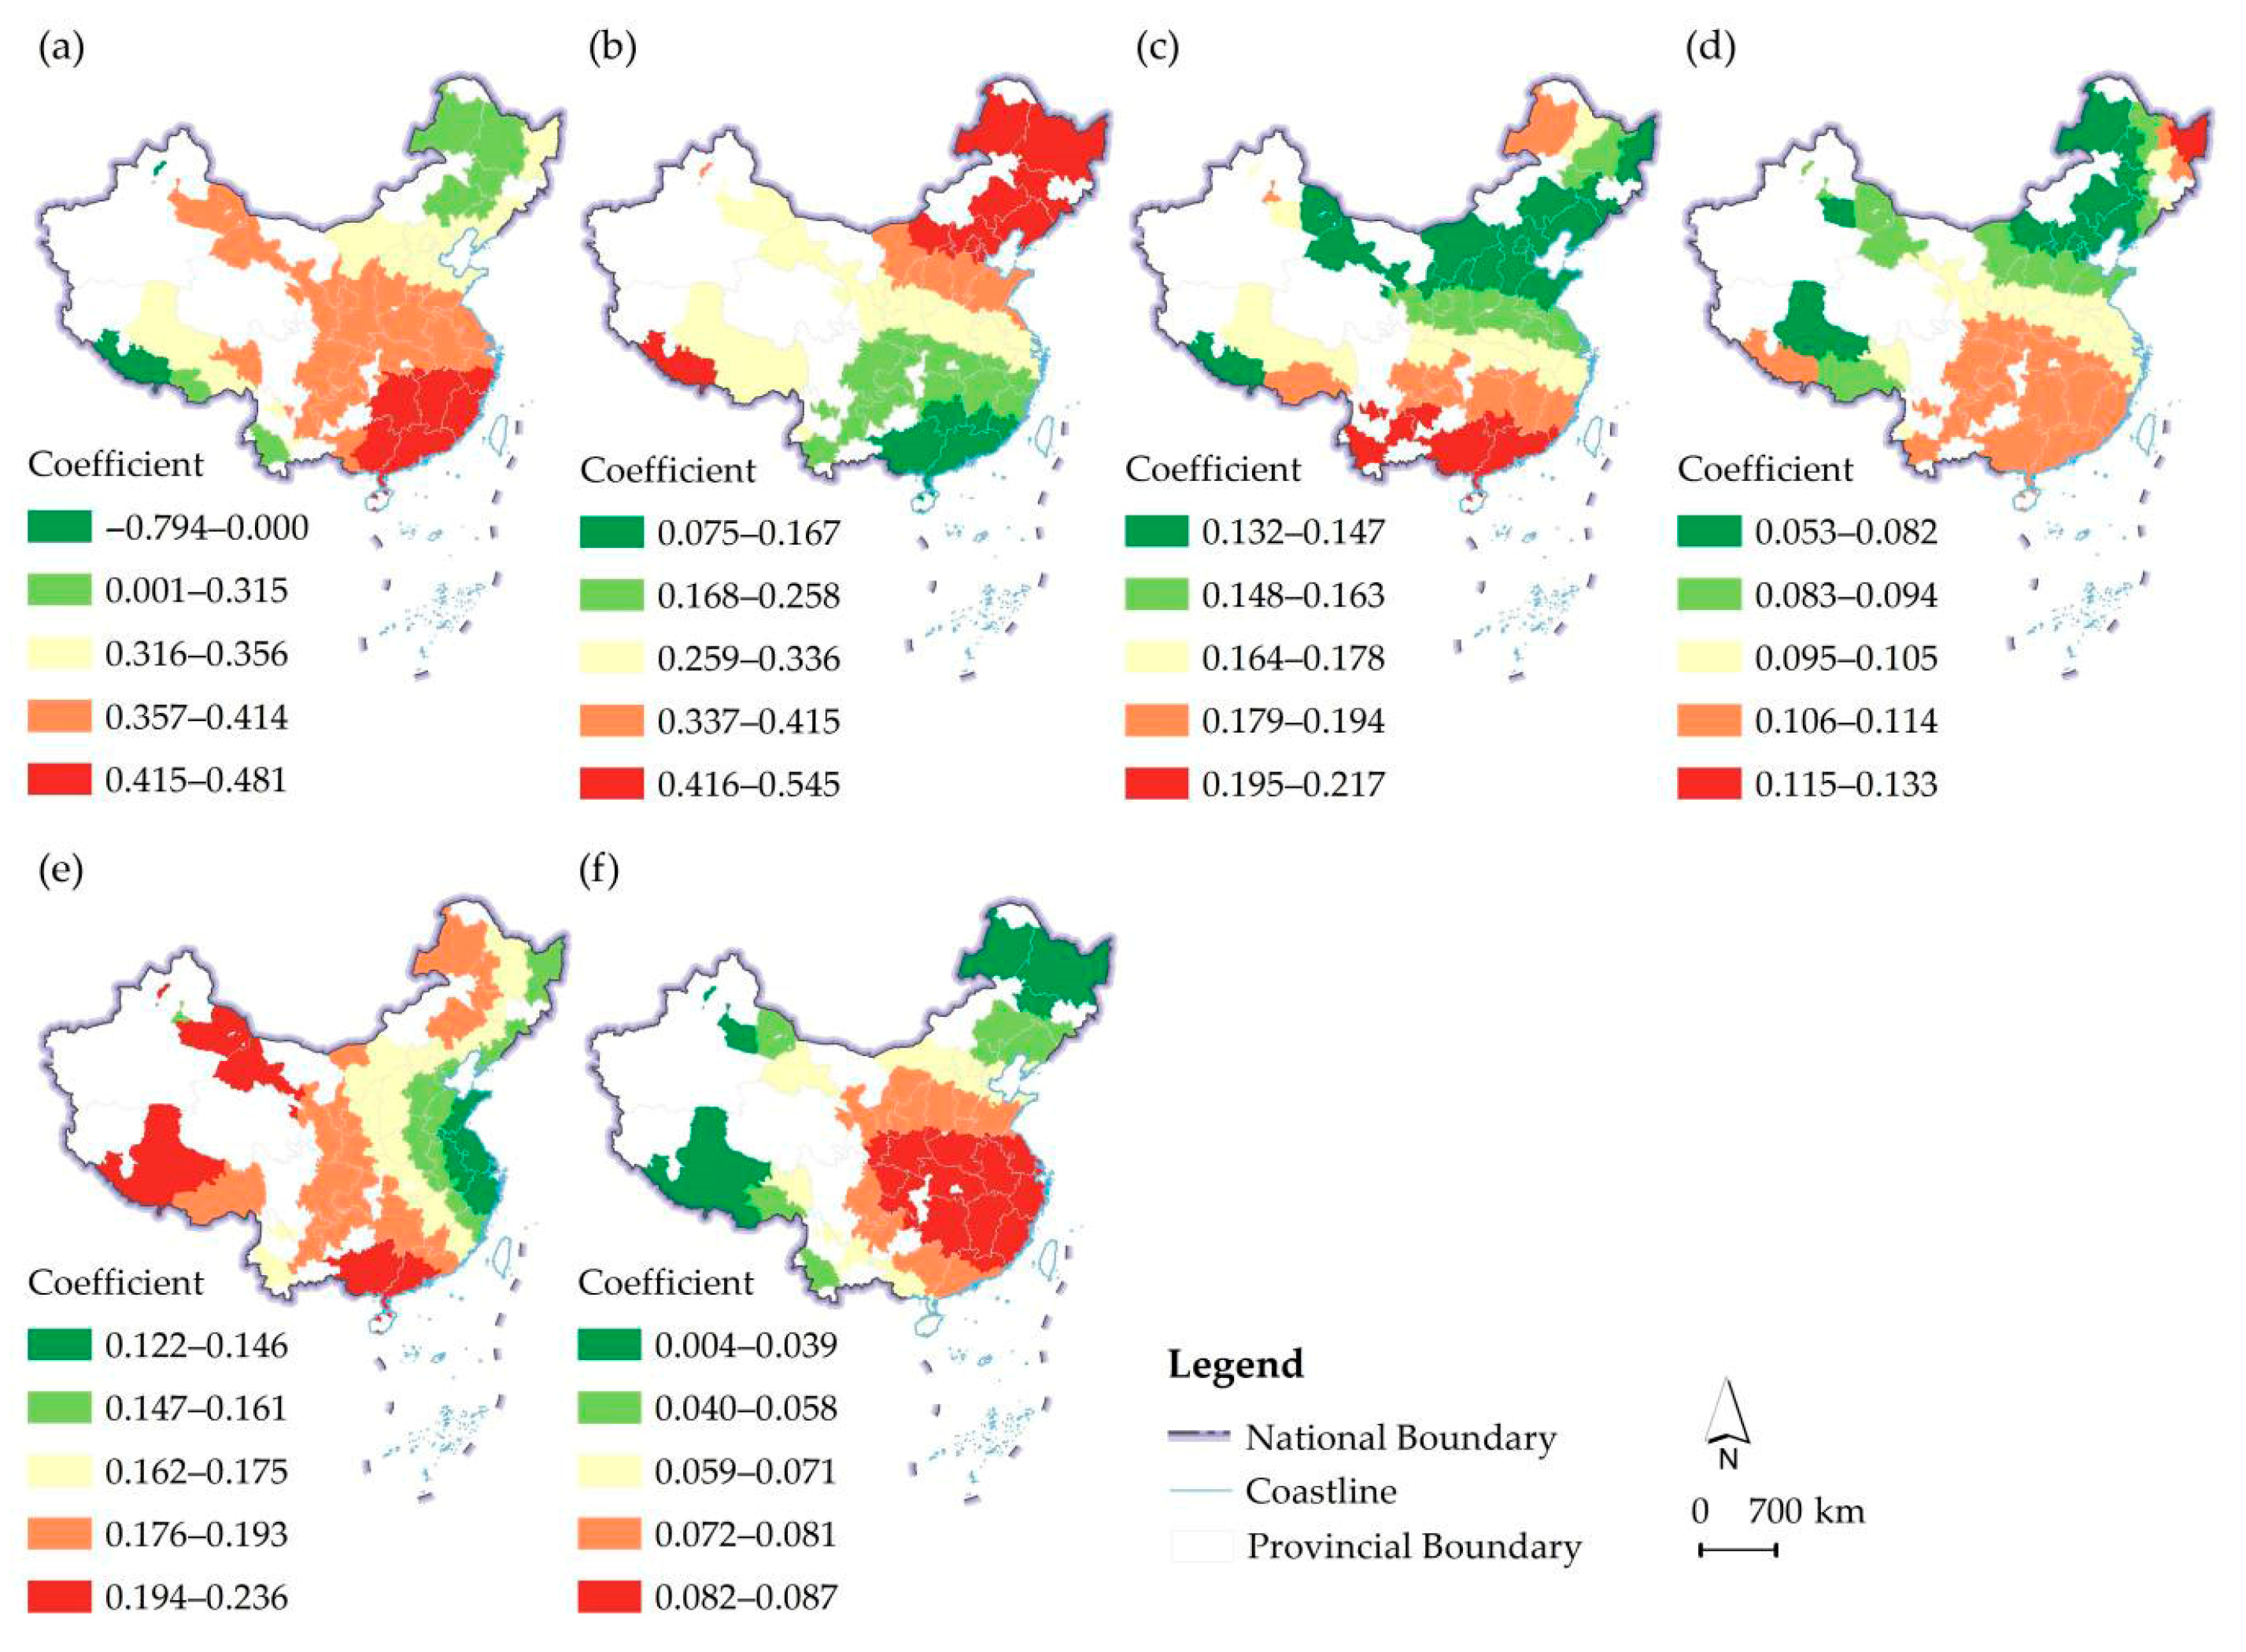
More specifically (Figure 12), except for Shigatse in Tibet, the influence of operating income of above-scale service enterprises showed a declining trend from the southeast toward the southwest and northeast. The influence of the number of participants in basic pension insurance for urban employees displayed the opposite trend. The influence intensity of tourist numbers and university/junior college student numbers generally declined from south to north. For preschool and primary school students, the influence decreased from the west and south toward the east. The effect of the number of A-level scenic spots gradually diffused and weakened from the eastern and central regions to other areas.

4.4.2. Factors Influencing the Homestay Industry Scale

Cultural and tourism development, macroeconomic and industrial structure, and resident income level were the three main factors influencing the homestay industry scale at the city level. Specifically, the number of nationally recognized high-tech enterprises, number of tourist visits, number of high-star hotels, number of museums, and per capita disposable income had positive effects on homestay industry scale, although their standardized coefficients vary in strength (Table 2).
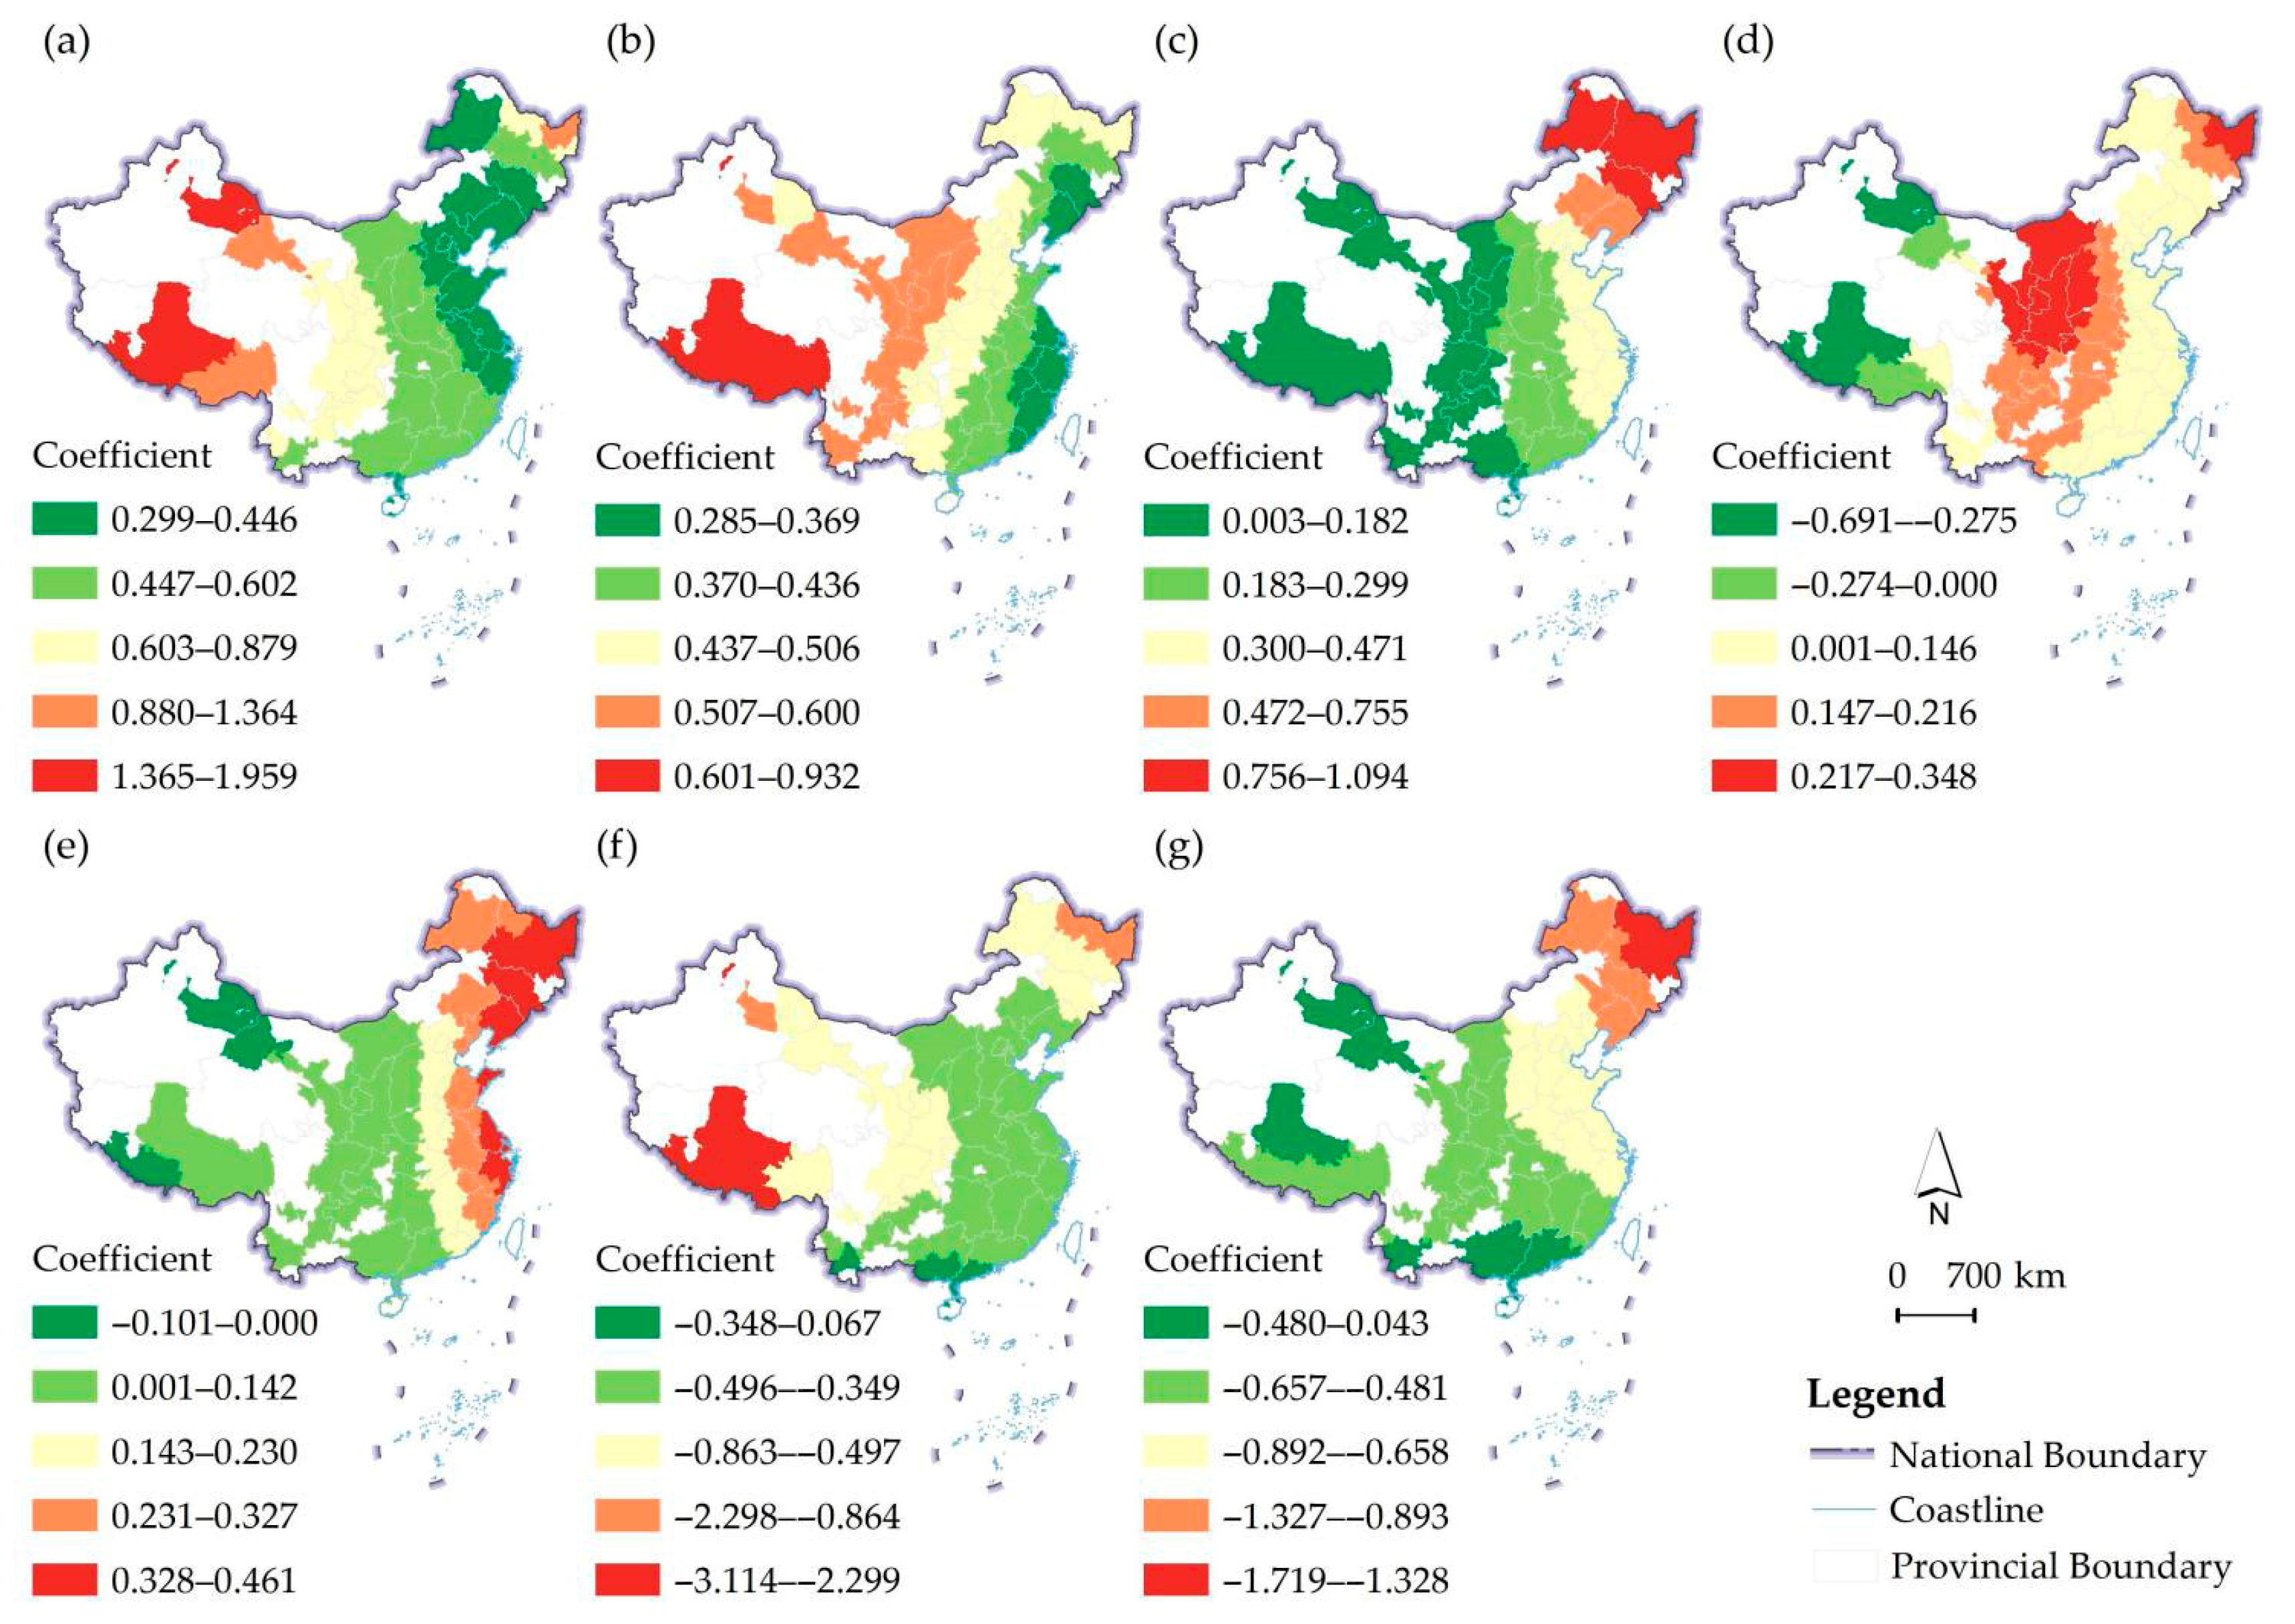
The intensity of influence of the numbers of nationally recognized high-tech enterprises and tourist visits followed a spatial gradient of west > central > east (Figure 13). Conversely, the influence of high-star hotel numbers and per capita disposable income followed an opposite gradient. The influence of museum numbers was strongest in inland provinces such as Shanxi, Shaanxi, and Ningxia—regions known for cultural tourism—and gradually decreased toward the eastern and western regions.
In contrast, operating income of above-scale service enterprises and output values of the secondary industry exerted negative effects, with the latter showing a stronger impact (Table 2). Among the negative factors, the operating income of above-scale service enterprises was strongest in Tibet, followed by in Heilongjiang, and weakest in eastern China (Figure 13). The influence of secondary industry output decreased progressively from the northeast to the southwest.

5. Discussion

5.1. Model Validity

This study aims to address existing gaps in the diagnosis of the sustainability of consumer industries that are deeply embedded within the internet, in an era where digital networks profoundly shape consumption patterns. The primary diagnostic indicators constitute a universal three-dimensional sustainability assessment framework based on “Production–Consumption–Type”. The “Production” dimension employs enterprise data to diagnose the sustainability level from a supply-chain perspective. The “Consumption” dimension employs online public attention to diagnose the sustainability of collective consumption trends. This model provides a universal framework that can be applied to deal with the global research challenge of data fragmentation across digital platforms [81]. It offers a methodological pathway for systematically integrating data from diverse online platforms and achieving multi-source data fusion, thereby establishing a comprehensive and easily accessible diagnostic framework. The empirical examination of the homestay industry in China has confirmed that the general framework and the logic of data acquisition and processing is valid. Secondary diagnostic indicators and their data sources demonstrate a high degree of specificity and flexibility across diverse geographical areas. Researchers can adapt the model to local contexts by replacing data sources with functionally equivalent platforms in the target country or region (Table 3).
Meanwhile, diagnosis of regional sustainability in the homestay industry must shift from relying solely on the number of enterprises to adopting more comprehensive and diverse indicators. The significant variations in land area and population base among Chinese regions result in distinct patterns for total enterprise numbers, density, and per capita figures. Therefore, overemphasis on increasing the number of enterprises could exacerbate regional imbalances and lead to overinvestment. In addition, as homestays appeal to people across different age and generational groups, assessing social attention also requires consideration of user preferences across different media platforms. Diverse online data sources should be integrated as much as possible for accurate measurement.
Moreover, the typology proposed in this study also provides a valuable framework for geographic comparison. By coupling standardized supply and consumption data under the assumption of independent markets, it offers a convenient reference for diagnosing the industrial sustainability of various regions within the study area. On a global scale, the externally dependent type can describe island destinations in Southeast Asia (e.g., Thailand and Malaysia) that rely heavily on international investment and tourism [82]. The outward spillover type corresponds to traditional tourist-source cities in Europe and America (e.g., the UK and the USA) [83]. These regions have a solid economic foundation, a sizable consumer base for homestays, and well-established consumption habits. By contrast, the coordinated types of regions refer to destinations with relatively consistent levels of economic and tourism development (e.g., developed countries like Switzerland and France, or developing regions in Africa) [84]. This finding indicates that, despite differing development pathways, global homestay destinations can be comprehended within a unified analytical framework.

5.2. The Sustainability of the Homestay Industry

As an emerging homestay market, China’s homestay industry began to decline and stabilize in 2024 after a period of rapid growth. The unique features of the homestay industry, combined with China’s context of urban–rural integration, have shaped its evolutionary trajectory. However, the low entry barrier and high expectations led to rapid saturation, resulting in overcapacity and a subsequent cooling of the market. The results showed that this industry is now entering a more rational phase. In the current context of economic slowdown and consumption downgrading, other more flexible service sectors such as cafés—being asset-light and low-cost—are emerging as the new investment trend, gradually replacing homestays in popularity.
Spatially, China’s homestay industry exhibited clear patterns of differentiation and clustering. The scale of the industry shows clear spatial differences across the Hu Huanyong Line, concentrating primarily in major city clusters and tourist destinations. Social attention, as demonstrated by the classic core-periphery diffusion model, is more concentrated in large cities and gradually spreads to adjacent regions. This observation lends further support to the prevailing theory of industrial agglomeration in economic geography [85] within the context of China’s homestay industry. Small- and medium-scale investments, including homestays, demonstrate a high degree of flexibility and a propensity to follow trends. These investments frequently concentrate in areas with established market scale and well-developed infrastructure. This finding is consistent with the observations reported from Japan [86], which emphasizes the urbanized and capital-driven nature of the homestays industry in East Asian regions, including China. In contrast, the dispersed distribution pattern in rural areas of European countries such as France [84] is indicative of their tradition of rural tourism and decentralized cultural background. While the network facilitates the rapid spread of consumption to broader areas in emerging regions, it may also exacerbate regional development disparities. This represents a deviation from the initial objective of reducing the urban–rural disparity. Consequently, it is imperative to direct our attention to the digital and infrastructure divide. In the future, it is essential to implement differentiated and targeted policy support for rural and remote areas. The focus should be on addressing their unique infrastructure bottlenecks and issues related to local participation, rather than simply replicating models from developed regions.
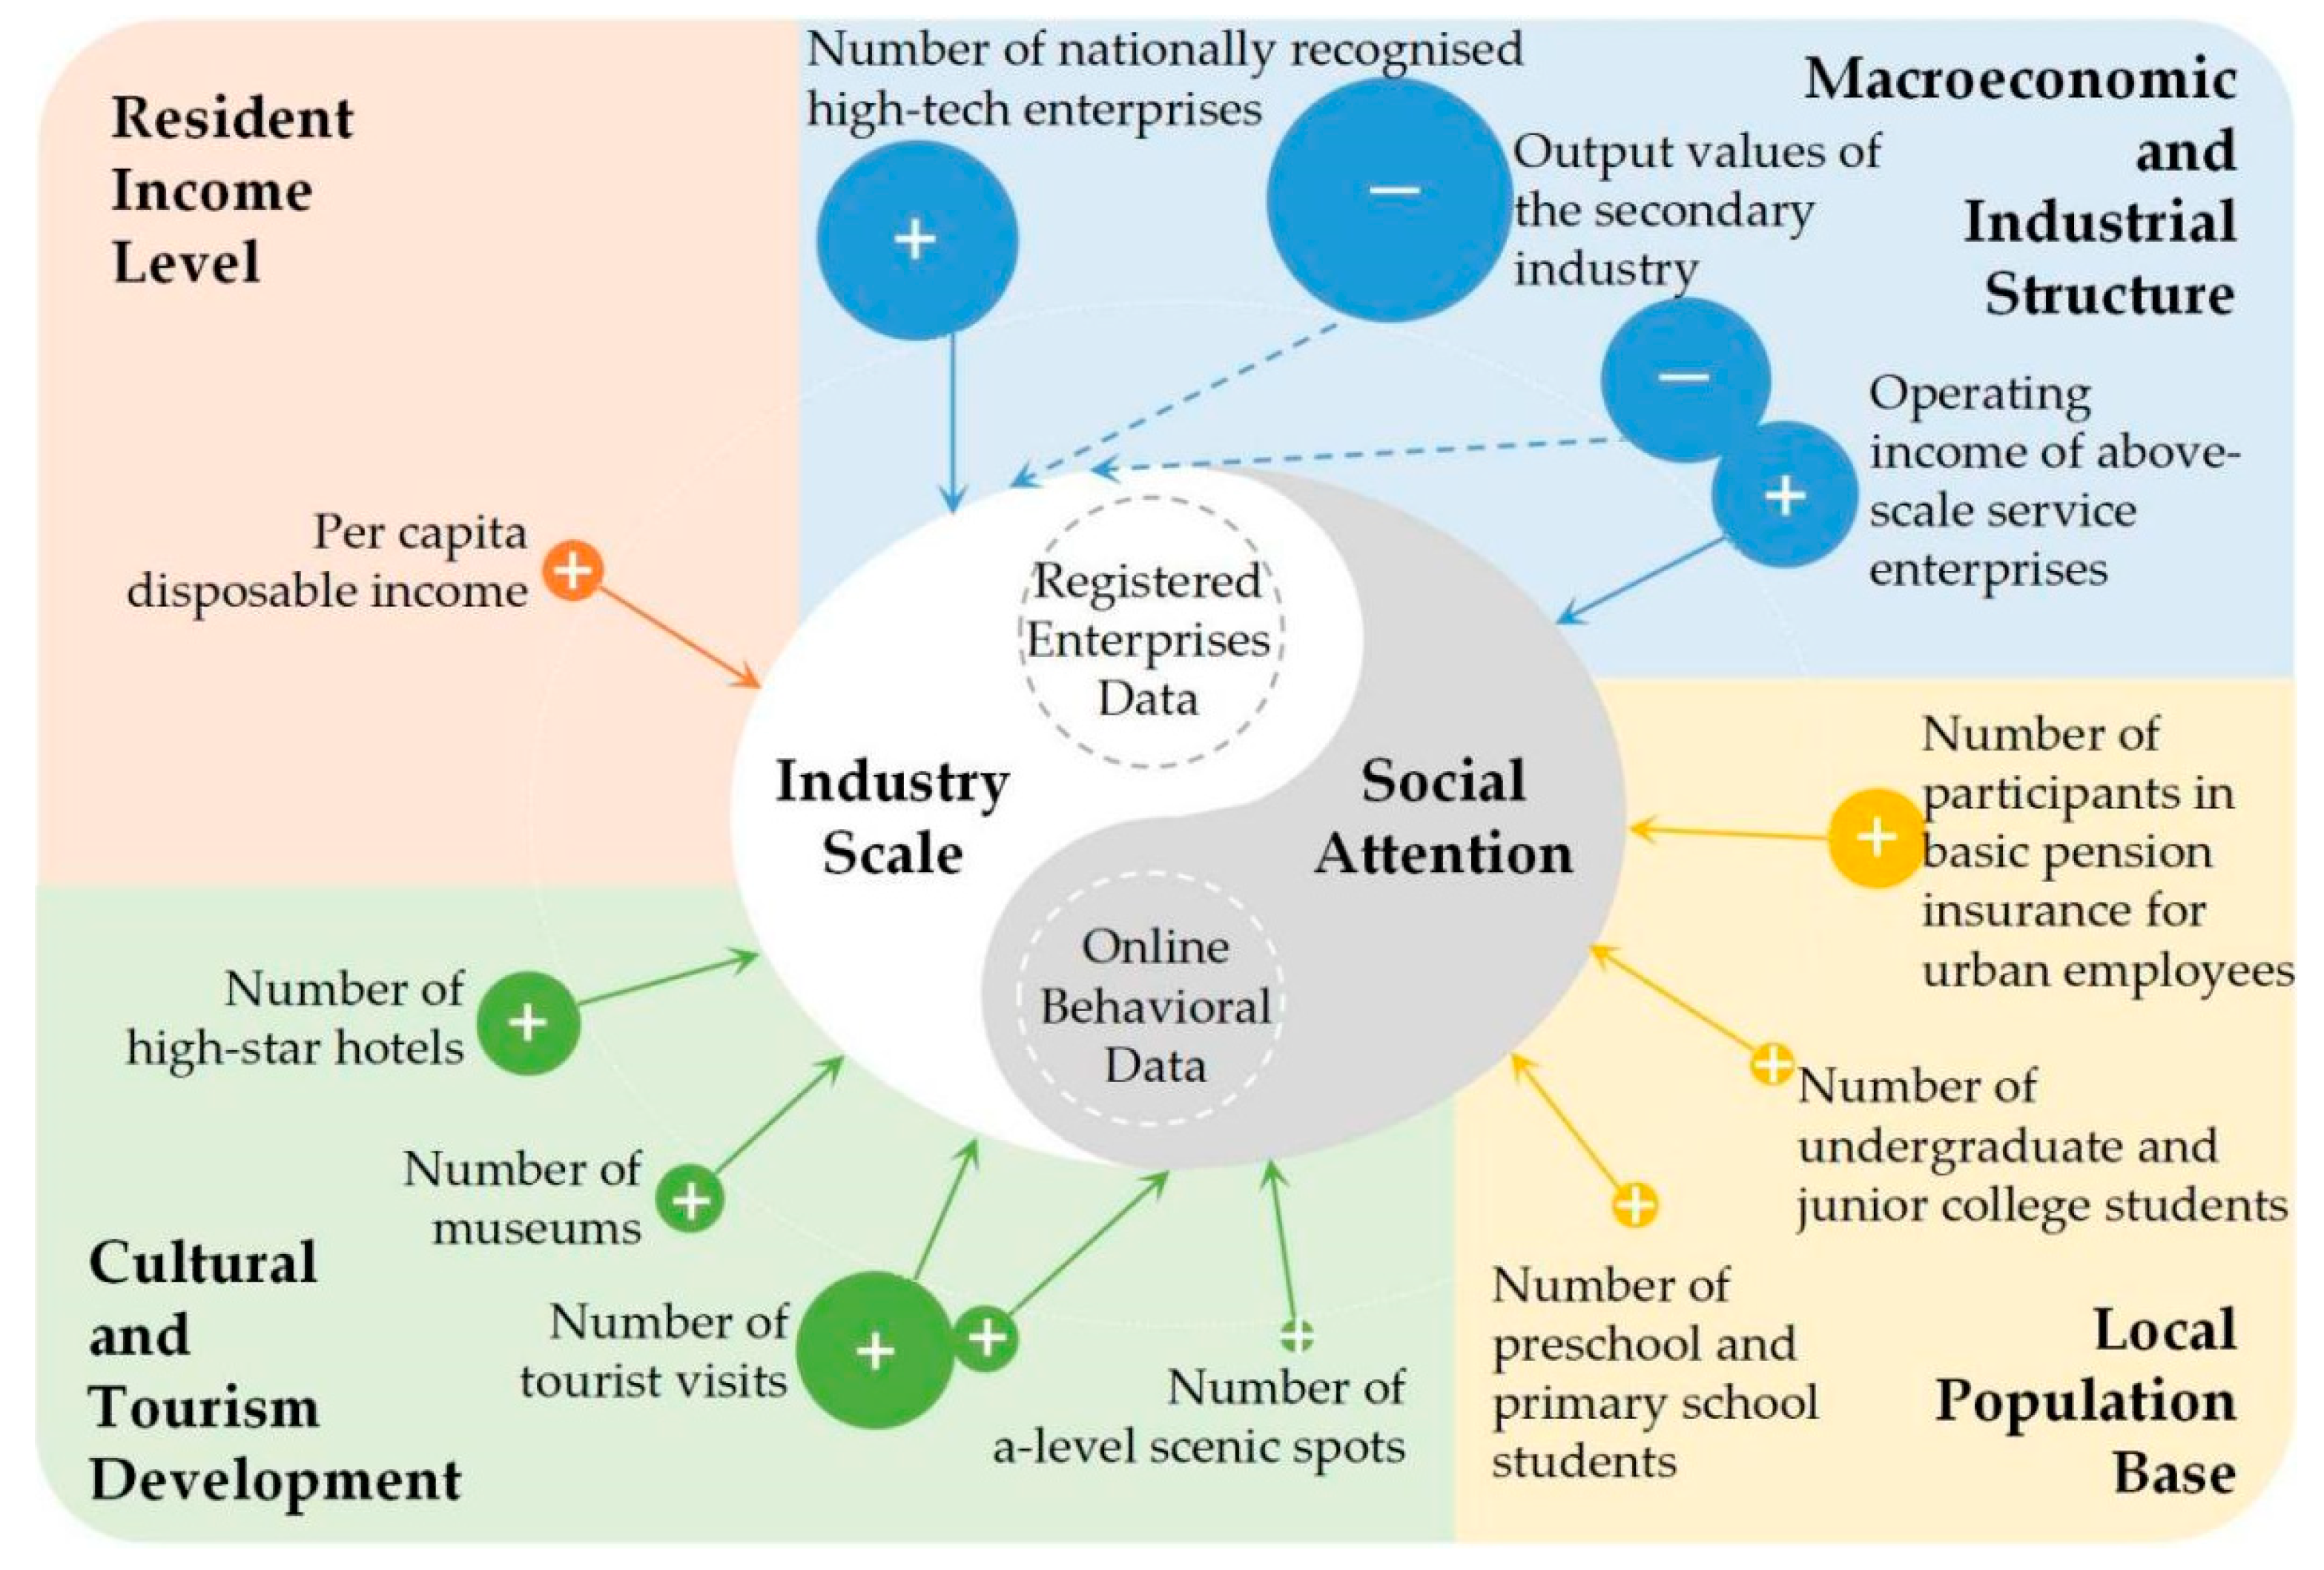
This study also found that macroeconomic and industrial structure, cultural and tourism development, local population base, and resident income level together form the framework for understanding regional differences and temporal fluctuation in homestay industry sustainability (Figure 14). On the consumption side, regions with dominant service sectors are more likely to develop new service-based industries that contribute to the local economy. Key customer groups include residents with stable incomes, educated youth, and family travelers. Scenic attractions affect both local transformation and the attraction of non-local tourists. On the production side, a well-developed secondary industry and large-scale service industries may suppress homestay investment, possibly due to better formal employment opportunities and environmental degradation. In contrast, high-tech enterprises have a positive effect, likely because they attract highly educated individuals who favor immersive leisure experiences, like homestays. Income levels not only indicate the investment capacity of local populations but also reflect investor confidence in the consumption market. The size of the tourism market ensures a customer base for homestays. High-star hotel development provides confidence and overflow customers to the homestay sector, while cultural assets like museums enhance the cultural appeal of a region and attract homestay clientele.

6. Conclusions and Implications

6.1. Conclusions

This study integrated multiple online platform data sources from both the consumption and production ends to construct a macro-level model for diagnosing the performance of consumption industries closely tied to online popularity. This model included three primary diagnostic indices: industry scale index, social attention index, and type reference index. Then, it classified three development types of externally dependent, outward spillover, and coordinated types. The model is validated through analysis of Chinese homestay industry, which also reveals spatiotemporal heterogeneity of the homestay industry’s development in China. Macroscopic influencing factors of China’s homestay industry sustainability also be recognized, including macroeconomic and industrial structure, cultural-tourism development, resident income level, and local population base.

6.2. Implications

6.2.1. Methodological Implications

This study proposes a universal and comprehensive diagnostic framework for industrial sustainability, intersecting of online data and spatial analysis and incorporating a new dimension of online social attention in the digital era. The proposed methodology provides a systematic approach to the integration of data from multiple online platforms, achieving multi-source data fusion. This approach can be applied to cope with data fragmentation across digital platforms. Concurrently, it employs emerging online platform data to address the timeliness and cost issues associated with conventional statistical data or web scraping, offering an readily accessible evaluation approach that better meets the demand for rapid response in the industry. Moreover, the study puts forward three analytical perspectives for developing a typology, thus providing a framework for interpreting the differential development of consumer industries across regions in the context of digital transformation.

6.2.2. Theoretical Implications

The case study of China’s homestay industry not only validates the model’s effectiveness but also enriches the theoretical understanding of sustainable development in the sector. First, it extends the theoretical discussion on sustainability from physical spaces to digital online spaces, highlighting the significant role of online visibility and market resilience in modern tourism. Second, the findings confirm that the homestay industry also follows a pattern of high spatial agglomeration, while the network economy enhances the diffusion effect of online social attention, providing new evidence for the classic core–periphery theory in the digital era. This study also proposes a macro-level model to explain the sustainability of the homestay industry, which is intended to complement previous research that focused on micro-level perspectives.

6.2.3. Practical Implications

This study also provided the following insights for destination diagnosis and management. The macro-level diagnostic model, multi-source data utilization, and classification approach developed in this study have potential applications in the context of sustainability diagnosis of other consumer industries that are highly influenced by online attention. The operational feasibility of the framework is notable, as are the low costs of data acquisition and the clarity and interpretability of the results. It is therefore argued that the framework can provide direct decision-making support to a range of stakeholders. The macro-scale spatiotemporal variation of China’s homestay industry offers insights that assist governments, planners, and investors in identifying both over-invested and potential areas. This, in turn, supports the diagnosis for balanced regional development and targeted policy implementation. Concurrently, research on the macro-level influencing factors provides a scientific basis for promoting rational planning and sustainable transformation of the homestay industry in China and globally in the digital era.

7. Limitations and Future Research

This multi-platform online data-driven diagnostic model represents a methodological innovation at the intersection of online data and spatial analysis. However, it still has limitations in addressing the broader, multidimensional aspects of sustainability, which also presents opportunities for future research.
First, considering the differences among various countries and regions globally, this study adopts double level structure for the core evaluation model. The objective of the primary indicators is to ensure its theoretical applicability on a global scale. In contrast, the secondary indicators are designed to address the availability of local data sources. Although Section 5 of this study has suggested several alternative data sources for regions outside China, the differences in data quality and acquisition costs cannot be overlooked. For instance, Tianyancha operates on the basis of the large-scale disclosure of corporate information by the Chinese government, providing data to the public free of charge or at low cost. This level of openness is uncommon in most countries. However, advances in big data technology and the expansion of data sharing have the potential to open up the use of more online data sources in more regions in the future. Moreover, the empirical testing in this research is limited to China, leading the global applicability remain speculative. It is recommended that future research investigates the applicability of this macro-level model in other regional contexts.
Second, while the model emphasizes macro-scale validity, it sacrifices precision and explanatory power at the micro scale, which leading it only confined to scale and digital level. For instance, the homestay business registration data are not capable of reflecting the actual number of rooms or beds of individual enterprises, nor does it incorporate information such as room rates or rating differences. Given the emerging trends of chain operations and brand development among high-end homestays, large-scale enterprises may increasingly manage multiple homestays across diverse geographical locations. Furthermore, although the use of online data adequately accounts for regional hotness, it falls short in capturing consumer satisfaction at the level of individual destinations or homestays. Conversely, the current sustainability paradigm does not encompass the critical qualitative aspects of sustainability such as environmental pressures, cultural impacts, governance, and community well-being. In light of the recent advancements in the fields of artificial intelligence and big data technologies, it is recommended that subsequent studies employ large-scale data mining from online platforms and digital mapping services. This approach will facilitate the development of comprehensive evaluation models that integrate multi-source data at a medium or destination scale, while incorporating a community dimension.
Finally, as the objective of this study is to construct a sustainability assessment and typology model, the interaction between the industry scale and social attention was calculated in a simplified manner to mere compare their types. It is acknowledged that a strong mutual influence exists between the industrial and online attention ends, a phenomenon which has not been further explored in this study. It is recommended that future research employ econometric methods to examine the correlation between the two. For instance, the Pearson correlation coefficient and time-lagged effects could be explored. The primary function of the case study in this research is model validation, with a relatively basic GWR model employed to address spatial pattern variations. Future research could employ Geographically and Temporally Weighted Regression (GTWR) to dynamically capture these evolutions, utilize Multiscale Geographically Weighted Regression (MGWR) to allow different variables to operate at varying bandwidths, or adopt Geodetector to examine the interactions among factors. While acknowledging the value of this macro-level model in identifying key drivers and their spatial heterogeneity, it is important to recognize the limitations of it in fully capturing the complexities affecting marginalized communities and their vulnerabilities in the digital era. Finally, the methods, while adequate for exploratory spatial analysis, are more descriptive than explanatory, and the lack of ground-truth validation through surveys or field data weakens the robustness of the findings. Complementary approaches, such as ethnographic investigations, remain necessary in future research to more comprehensively understand the intricate relationships between the sustainability of homestay industries and local communities.

Author Contributions

Conceptualization, S.W. and H.X.; methodology, S.W. and H.X.; validation, S.W., M.Z. and J.Y.; formal analysis, S.W. and M.Z.; investigation, S.W., M.Z. and J.Y.; data curation, S.W.; writing—original draft preparation, S.W.; writing—review and editing, S.W. and H.X.; visualization, S.W. and M.Z.; supervision, H.X.; project administration, H.X.; funding acquisition, S.W. All authors have read and agreed to the published version of the manuscript.

Funding

This research was funded by the National Natural Science Foundation of China [grant number 42301248; grant number 42471261], the Research Startup Funding for Talent Recruitment at Ningbo University [grant number ZX2023000137], and the Yongjiang Talent Program of Ningbo [grant number 2022B-026-G].

Institutional Review Board Statement

Not applicable.

Informed Consent Statement

Not applicable.

Data Availability Statement

Data are contained within the article.

Conflicts of Interest

The authors declare no conflicts of interest.

Abbreviations

The following abbreviations are used in this manuscript:
GWRGeographically Weighted Regression
OLSOrdinary Least Squares

References

  1. UNWTO. UNWTO General Assembly Documents. 2005. Available online: https://www.e-unwto.org/toc/unwtogad/2005/1 (accessed on 20 June 2025).
  2. Zhang, H.; Xia, X.; Wang, S.; Xu, C.; Li, Y.; Yang, Y. Spatial dynamics and economic impacts of shared accommodations on urban housing and hotel markets. J. Destin. Mark. Manag. 2025, 37, 101023. [Google Scholar] [CrossRef]
  3. Lee, S.A.; Jeong, M.; Jeon, M.M. Effects of experiential stimuli on customers’ responses: An example of bed and breakfast websites. J. Hosp. Tour. Technol. 2016, 7, 390–404. [Google Scholar] [CrossRef]
  4. KC, B.; Thapa, S. The power of homestay tourism in fighting social stigmas and inequities. J. Sustain. Tour. 2024, 33, 1430–1448. [Google Scholar] [CrossRef]
  5. Kamisan Pusiran, A.; Xiao, H. Challenges and Community Development: A Case Study of Homestay in Malaysia. Asian Soc. Sci. 2013, 9, 1–17. [Google Scholar] [CrossRef]
  6. Pasanchay, K.; Schott, C. Community-based tourism homestays’ capacity to advance the Sustainable Development Goals: A holistic sustainable livelihood perspective. Tour. Manag. Perspect. 2021, 37, 100784. [Google Scholar] [CrossRef]
  7. Grand View Research. Vacation Rental Market Size, Share & Trends Analysis Report by Booking Mode (Online, Offline), by Accommodation Type (Home, Apartment, Resort/Condominium), by Region, and Segment Forecasts, 2024–2030. Available online: https://www.grandviewresearch.com/industry-analysis/vacation-rental-market (accessed on 28 August 2025).
  8. About Us–Airbnb Newsroom. Available online: https://news.airbnb.com/about-us/ (accessed on 28 August 2025).
  9. VICSDF Research Center. Annual Report on Sustainable Development. Available online: https://www.vicsdf.com/doc/7113ad7013b850d1 (accessed on 21 May 2025).
  10. China Industry Research Institute. Market Analysis and Venture Capital Trends Research Report on the Homestay Industry 2025. Available online: https://big5.chinairn.com/hyzx/20250218/170628371.shtml (accessed on 28 August 2025).
  11. Fastdata. China Homestay Industry Development Trends Report 2025. Available online: http://www.ifastdata.com/2025/03/17/fastdata%e6%9e%81%e6%95%b0%ef%bc%9a%e4%b8%ad%e5%9b%bd%e6%b0%91%e5%ae%bf%e8%a1%8c%e4%b8%9a%e5%8f%91%e5%b1%95%e8%b6%8b%e5%8a%bf%e6%8a%a5%e5%91%8a2025/ (accessed on 28 August 2025).
  12. Qiu, W.W.; Yu, H.T.; Lin, P.M.; Au, W.C.W. Evaluating rural homestay accommodations in China using the hospitality index: An online review–based approach. Int. J. Hosp. Manag. 2024, 121, 103792. [Google Scholar] [CrossRef]
  13. Kunjuraman, V.; Hussin, R. Challenges of community-based homestay programme in Sabah, Malaysia: Hopeful or hopeless? Tour. Manag. Perspect. 2017, 21, 1–9. [Google Scholar] [CrossRef]
  14. Xiang, Y.; Zhang, B.; Hou, Y.; Li, F. Identifying the specific features, determinants, and suitability of green homestay inn distribution in rural China. J. Rural Stud. 2025, 119, 103760. [Google Scholar] [CrossRef]
  15. ChinaIRN. Risk Investment Situation and Investment and Financing Strategy Guidance of B & B Industry in 2025. Available online: https://www.chinairn.com/news/20250519/112439708.shtml (accessed on 21 May 2025).
  16. Fu, X.; Pan, L.; Liu, S. To store or not: Online cost optimization for running big data jobs on the cloud. Futur. Gener. Comput. Syst. 2024, 156, 42–52. [Google Scholar] [CrossRef]
  17. Zheng, J.; Huang, L. Characterizing the spatiotemporal patterns and key determinants of homestay industry agglomeration in rural China using multi geospatial datasets. Sustainability 2022, 14, 7242. [Google Scholar] [CrossRef]
  18. Kim, J.J. Brand portfolio extension of international hotel chains: A perspective on consumer confusion and consumer decision-making process. Int. J. Contemp. Hosp. Manag. 2024, 36, 3093–3111. [Google Scholar] [CrossRef]
  19. Xu, X.; Luo, Y. What makes customers “click”? An analysis of hotel list content using deep learning. Int. J. Hosp. Manag. 2023, 114, 103581. [Google Scholar] [CrossRef]
  20. Sung, E.; Kim, H.; Lee, D. Why do people consume and provide sharing economy accommodation?—A sustainability perspective. Sustainability 2018, 10, 2072. [Google Scholar] [CrossRef]
  21. Wang, J.; Chow, Y.S.; Biljecki, F. Insights in a city through the eyes of Airbnb reviews: Sensing urban characteristics from homestay guest experiences. Cities 2023, 140, 104399. [Google Scholar] [CrossRef]
  22. Chiu, C.N. How can managerial efficiency be improved? Evidence from the bed and breakfast industry. Tour. Manag. Perspect. 2018, 27, 111–124. [Google Scholar] [CrossRef]
  23. Huan, Y.; Yu, Q.; He, Z.; Zhao, Q.; Zhang, Z. Spatial differentiation and influencing factors of price classification of rural homestays in Shaanxi Province. Econ. Geogr. 2023, 43, 204–211. [Google Scholar] [CrossRef]
  24. Zhang, X.Y.; Zhang, Q.; Han, J.L. The symbiotic relationship between homestays and local community: Multiple case studies based on rooting theory. Hum. Geogr. 2022, 37, 50–59. [Google Scholar] [CrossRef]
  25. Mura, P. Perceptions of authenticity in a Malaysian homestay: A narrative analysis. Tour. Manag. 2015, 51, 225–233. [Google Scholar] [CrossRef]
  26. Mellors, J.; Egdell, V. Affected and Intrinsic Authenticity: Navigating Internalized Gay Ageism on LGBTQ+ Homestay Platforms. Gend. Work Organ. 2025, 32, 1569–1579. [Google Scholar] [CrossRef]
  27. Deng, L.; Li, C.; Deng, Q. Time of day effects on consumers’ online review characteristics: Evidence from the homestay platform. J. Hosp. Tour. Manag. 2024, 61, 115–134. [Google Scholar] [CrossRef]
  28. Kumar, J.; Chandra, P. Exploring psychological mechanisms behind tourists’ sustainable behaviours at homestays. J. Sustain. Tour. 2024, 32, 2500–2517. [Google Scholar] [CrossRef]
  29. Tavakoli, R.; Mura, P.; Rajaratnam, S.D. Social capital in Malaysian homestays: Exploring hosts’ social relations. Curr. Issues Tour. 2017, 20, 1028–1043. [Google Scholar] [CrossRef]
  30. Peng, L.; Xu, H.; Lu, J.; Luo, J.; Zhan, H. An Integrated Approach with CLFPR-Based ANP and Fuzzy TOPSIS for Evaluating Business Performance of Rural Homestays: Study from China. Sustainability 2023, 15, 538. [Google Scholar] [CrossRef]
  31. Eugenio-Martin, J.L.; Cazorla-Artiles, J.M.; González-Martel, C. On the determinants of Airbnb location and its spatial distribution. Tour. Econ. 2019, 25, 1224–1244. [Google Scholar] [CrossRef]
  32. Chen, H.T.; Chen, K.S.; Tseng, H.P.; Chang, W.F. Usage behavior causal model construction for B&B-owned websites—From the B&B owner/operator perspective. J. Qual. Assur. Hosp. Tour. 2014, 15, 399–424. [Google Scholar] [CrossRef]
  33. Yang, Y.; Mao, Z. Location Advantages of Lodging Properties: A Comparison between Hotels and Airbnb Units in an Urban Environment. Ann. Tour. Res. 2020, 81, 102861. [Google Scholar] [CrossRef]
  34. Wang, Z.Y.; Zhang, S.; Liu, W.F. When a villager is a rural homestay operator: Role expectation research using the machine learning model? Curr. Issues Tour. 2025, 28, 1002–1020. [Google Scholar] [CrossRef]
  35. Janjua, Z.U.A.; Krishnapillai, G.; Rahman, M. A systematic literature review of rural homestays and sustainability in tourism. Sage Open. 2021, 11, 1–17. [Google Scholar] [CrossRef]
  36. Shin, H.W.; Fan, A.; Lehto, X. Peer-to-peer accommodation: A meta-analysis of factors affecting customer satisfaction and loyalty. Int. J. Tour. Res. 2021, 23, 581–596. [Google Scholar] [CrossRef]
  37. Adamiak, C. Mapping Airbnb Supply in European Cities. Ann. Tour. Res. 2018, 71, 67–71. [Google Scholar] [CrossRef]
  38. Domènech, A.; Zoğal, V. Geographical Dimensions of Airbnb in Mountain Areas: The Case of Andorra. J. Rural Stud. 2020, 79, 361–372. [Google Scholar] [CrossRef]
  39. Zhang, H.; Lu, L.; Zhang, D.; Yu, H.; Zhang, X. Spatial pattern and contributing factors of homestay inns in the area around Mogan Mountain. Geogr. Res. 2019, 38, 2695–2715. [Google Scholar] [CrossRef]
  40. Hei, Y.; Sui, Y.; Gao, W.; Zhao, M.; Hu, M.; Gao, M. Geodetector-based analysis of spatiotemporal distribution characteristics and influencing mechanisms for rural homestays in Beijing. Land 2025, 14, 997. [Google Scholar] [CrossRef]
  41. Yang, Y.; Tan, K.P.S.; Li, X.R. Antecedents and consequences of home-sharing stays: Evidence from a nationwide household tourism survey. Tour. Manag. 2019, 70, 15–28. [Google Scholar] [CrossRef]
  42. Li, Y.; Xia, L.; Wang, L.; Qiu, M.; Utomo, S. How are rural homestays achieving sustainable development in the post-COVID-19 period: Value co-creation by operators, tourists, and government. Sustainability 2024, 16, 1088. [Google Scholar] [CrossRef]
  43. Suanpang, P.; Jamjuntr, P.; Lertkornkitja, A.; Jittithavorn, C. Can Optimized Genetic Algorithms Improve the Effectiveness of Homestay Recommendation Systems in Smart Villages? A Case of Thailand. Int. J. Tour. Res. 2024, 26, e2762. [Google Scholar] [CrossRef]
  44. Xiang, Z.; Du, Q.; Ma, Y.; Fan, W. A comparative analysis of major online review platforms: Implications for social media analytics in hospitality and tourism. Tour. Manag. 2017, 58, 51–65. [Google Scholar] [CrossRef]
  45. Acharya, M.; Mohbey, K.K. Exploring the evolution, progress, and future of point-of-interest recommendation over location-based social network: A comprehensive review. GeoInformatica 2024, 29, 305–350. [Google Scholar] [CrossRef]
  46. Chen, J.; Shoval, N.; Stantic, B. Tracking tourist mobility in the big data era: Insights from data, theory, and future directions. Tour. Geogr. 2024, 26, 1381–1411. [Google Scholar] [CrossRef]
  47. Li, S.; Li, Y.; Liu, C.; Fan, N. How do different types of user-generated content attract travelers? Taking story and review on Airbnb as the example. J. Travel Res. 2024, 63, 371–387. [Google Scholar] [CrossRef]
  48. Gholamhosseinzadeh, M.S. Theorizing vloggers’ approaches and practices in travel vlog production through grounded theory. J. Hosp. Mark. Manag. 2023, 32, 196–223. [Google Scholar] [CrossRef]
  49. Mazare, M.; Simion, C.-P. The Influence of Web 2.0 Tools on the Sustainable Development of E-Commerce: Empirical Evidence from European Union Countries. Sustainability 2025, 17, 6237. [Google Scholar] [CrossRef]
  50. Kanwal, B.; Rehman, S.U.; Imran, A.; Shaukat, R.S.; Li, J.; Alzahrani, A.; Alghamdi, A.D.; Alarfaj, F.K. Opinion mining from online travel reviews: An exploratory investigation on Pakistan major online travel services using natural language processing. IEEE Access 2023, 11, 29934–29945. [Google Scholar] [CrossRef]
  51. Oh, M.; Kim, S. Role of emotions in fine-dining restaurant online reviews: The applications of semantic network analysis and a machine learning algorithm. Int. J. Hosp. Tour. Adm. 2021, 23, 875–903. [Google Scholar] [CrossRef]
  52. Qin, Y.; Luo, C.; Ngai, E.W.T. Deconstructing customer satisfaction recipes: A dynamic configurational framework leveraging the power of online reviews in tourism contexts. Tour. Manag. 2025, 110, 105181. [Google Scholar] [CrossRef]
  53. Boyle, S.C.; Earle, A.M.; LaBrie, J.W.; Ballou, K. Facebook dethroned: Revealing the more likely social media destinations for college students’ depictions of underage drinking. Addict. Behav. 2017, 65, 63–67. [Google Scholar] [CrossRef]
  54. Shao, H.; Zhang, Y.; Li, W. Extraction and analysis of city’s tourism districts based on social media data. Comput. Environ. Urban Syst. 2017, 65, 66–78. [Google Scholar] [CrossRef]
  55. Liang, W.; Ahmad, Y.; Mohidin, H.H.B. Spatial pattern and influencing factors of tourism based on POI data in Chengdu, China. Environ. Dev. Sustain. 2024, 26, 10127–10143. [Google Scholar] [CrossRef]
  56. Ye, X.; Miao, L. Digital transformation and green finance efficiency of tourism enterprises: The effect of credit ratings. Int. Rev. Financ. Anal. 2025, 106, 104527. [Google Scholar] [CrossRef]
  57. Tiantian, G.; Hailin, C.; Zhou, X.; Ai, S.; Siyao, W. Does corporate digital transformation affect the level of corporate tax avoidance? Empirical evidence from Chinese listed tourism companies. Financ. Res. Lett. 2023, 57, 104271. [Google Scholar] [CrossRef]
  58. Qiao, H.H.; Wang, C.H.; Chen, M.H.; Su, C.H.J.; Tsai, C.H.K.; Liu, J. Hedonic price analysis for high-end rural homestay room rates. J. Hosp. Tour. Manag. 2021, 49, 1–11. [Google Scholar] [CrossRef]
  59. Gan, Q.; Liao, L.; Kang, X.; Xu, Z.; Fu, T.; Cao, Y.; Feng, Y.; Dong, J.; Lan, S. Cultural ecosystem services and disservices in protected areas: Hotspots and influencing factors based on tourists’ digital footprints. Ecosyst. Serv. 2024, 70, 101680. [Google Scholar] [CrossRef]
  60. Dergiades, T.; Mavragani, E.; Pan, B. Google Trends and tourists’ arrivals: Emerging biases and proposed corrections. Tour. Manag. 2018, 66, 108–120. [Google Scholar] [CrossRef]
  61. Liu, Y.; Shi, J. How inter-city high-speed rail influences tourism arrivals: Evidence from social media check-in data. Curr. Issues Tour. 2019, 22, 1025–1042. [Google Scholar] [CrossRef]
  62. Xiang, Z.; Pan, B. Travel queries on cities in the United States: Implications for search engine marketing for tourist destinations. Tour. Manag. 2011, 32, 88–97. [Google Scholar] [CrossRef]
  63. Li, X.; Pan, B.; Law, R.; Huang, X. Forecasting tourism demand with composite search index. Tour. Manag. 2017, 59, 57–66. [Google Scholar] [CrossRef]
  64. Huang, X.; Zhang, L.; Ding, Y. The Baidu Index: Uses in predicting tourism flows—A case study of the Forbidden City. Tour. Manag. 2017, 58, 301–306. [Google Scholar] [CrossRef]
  65. Li, H.; Hu, M.; Li, G. Forecasting tourism demand with multisource big data. Ann. Tour. Res. 2020, 83, 102912. [Google Scholar] [CrossRef]
  66. Song, H.; Qiu, R.T.; Park, J. A review of research on tourism demand forecasting: Launching the Annals of Tourism Research Curated Collection on tourism demand forecasting. Ann. Tour. Res. 2019, 75, 338–362. [Google Scholar] [CrossRef]
  67. Hu, T.; Wang, H.; Law, R.; Geng, J. Diverse feature extraction techniques in internet search query to forecast tourism demand: An in-depth comparison. Tour. Manag. Perspect. 2023, 47, 101116. [Google Scholar] [CrossRef]
  68. Li, X.; Law, R. Network analysis of big data research in tourism. Tour. Manag. Perspect. 2020, 33, 100608. [Google Scholar] [CrossRef]
  69. Mousa Mousa, M.; Abdulrahman Al Moosa, H.; Naim Ayyash, I.; Omeish, F.; Zaiem, I.; Alzahrani, T.; Hammami, S.M.; Zamil, A.M. Big Data Analytics as a Driver for Sustainable Performance: The Role of Green Supply Chain Management in Advancing Circular Economy in Saudi Arabian Pharmaceutical Companies. Sustainability 2025, 17, 6319. [Google Scholar] [CrossRef]
  70. Bi, J.W.; Wang, Y.; Han, T.Y.; Zhang, K. Exploring the effect of “home feeling” on the online rating of homestays: A three-dimensional perspective. Int. J. Contemp. Hosp. Manag. 2024, 36, 182–217. [Google Scholar] [CrossRef]
  71. Gunter, U.; Önder, I. Determinants of Airbnb demand in Vienna and their implications for the traditional accommodation industry. Tour. Econ. 2018, 24, 270–293. [Google Scholar] [CrossRef]
  72. National Bureau of Statistics, Urban Socioeconomic Survey Department. China City Statistical Yearbook; China Statistics Press: Beijing, China, 2024. [Google Scholar]
  73. Wang, F.; Chen, C.; Xiu, C.; Zhang, P. Location analysis of retail stores in Changchun, China: A street centrality perspective. Cities 2014, 41, 54–63. [Google Scholar] [CrossRef]
  74. Chen, C.S.; Noorizadegan, A.; Young, D.L.; Chen, C.S. On the selection of a better radial basis function and its shape parameter in interpolation problems. Appl. Math. Comput. 2023, 442, 127713. [Google Scholar] [CrossRef]
  75. Tang, G.A.; Yang, X. ArcGIS Geographic Information System Spatial Analysis Experimental Course; Science Press: Beijing, China, 2006. [Google Scholar]
  76. Zhao, Z.W.; Zhao, Z.Q.; Zhang, P. A new method for identifying industrial clustering using the standard deviational ellipse. Sci. Rep. 2023, 13, 578. [Google Scholar] [CrossRef]
  77. Wang, C.; Ibrahim, H.; Wu, F.; Chang, W. Spatial and temporal evolution patterns and spatial spillover effects of carbon emissions in China in the context of digital economy. J. Environ. Manag. 2025, 373, 123811. [Google Scholar] [CrossRef]
  78. Chen, P.; Duan, J.; Wang, Y. Spatio-temporal evolution and driving forces of urban gravity centers and ecological security risk gravity centers in China. Ecol. Indic. 2025, 170, 113025. [Google Scholar] [CrossRef]
  79. Zhou, R.; Chen, J.; Cui, S.; Li, L.; Qian, J.; Zhao, H.; Huang, G. A data-driven framework to identify influencing factors for soil heavy metal contaminations using random forest and bivariate local Moran’s I: A case study. J. Environ. Manag. 2025, 375, 124172. [Google Scholar] [CrossRef] [PubMed]
  80. Soltani, Z.; Hassani, H.; Esmaeiloghli, S. A deep autoencoder network connected to geographical random forest for spatially aware geochemical anomaly detection. Comput. Geosci. 2024, 190, 105657. [Google Scholar] [CrossRef]
  81. Gawer, A. Digital platforms’ boundaries: The interplay of firm scope, platform sides, and digital interfaces. Long Range Plann. 2021, 54, 102045. [Google Scholar] [CrossRef]
  82. Booth, P.; Chaperon, S.A.; Kennell, J.S.; Morrison, A.M. Entrepreneurship in island contexts: A systematic review of the tourism and hospitality literature. Int. J. Hosp. Manag. 2020, 85, 102438. [Google Scholar] [CrossRef]
  83. Mitra, S.K.; Chattopadhyay, M.; Jana, R.K. Spillover analysis of tourist movements within Europe. Ann. Tour. Res. 2019, 79, 102754. [Google Scholar] [CrossRef]
  84. Ruiz-Ballesteros, E.; Gonzalez-Portillo, A. Disentangling the relationship between rurality and tourism from a peripheral rural area of Europe. J. Rural Stud. 2025, 115, 103595. [Google Scholar] [CrossRef]
  85. Krugman, P. Increasing returns and economic geography. J. Polit. Econ. 1991, 99, 483–499. [Google Scholar] [CrossRef]
  86. Nakamura, S.; Baskaran, A.; Selvarajan, S.K. Impact of Airbnb on the hotel industry in Japan. J. Dest. Mark. Manag. 2024, 31, 100841. [Google Scholar] [CrossRef]
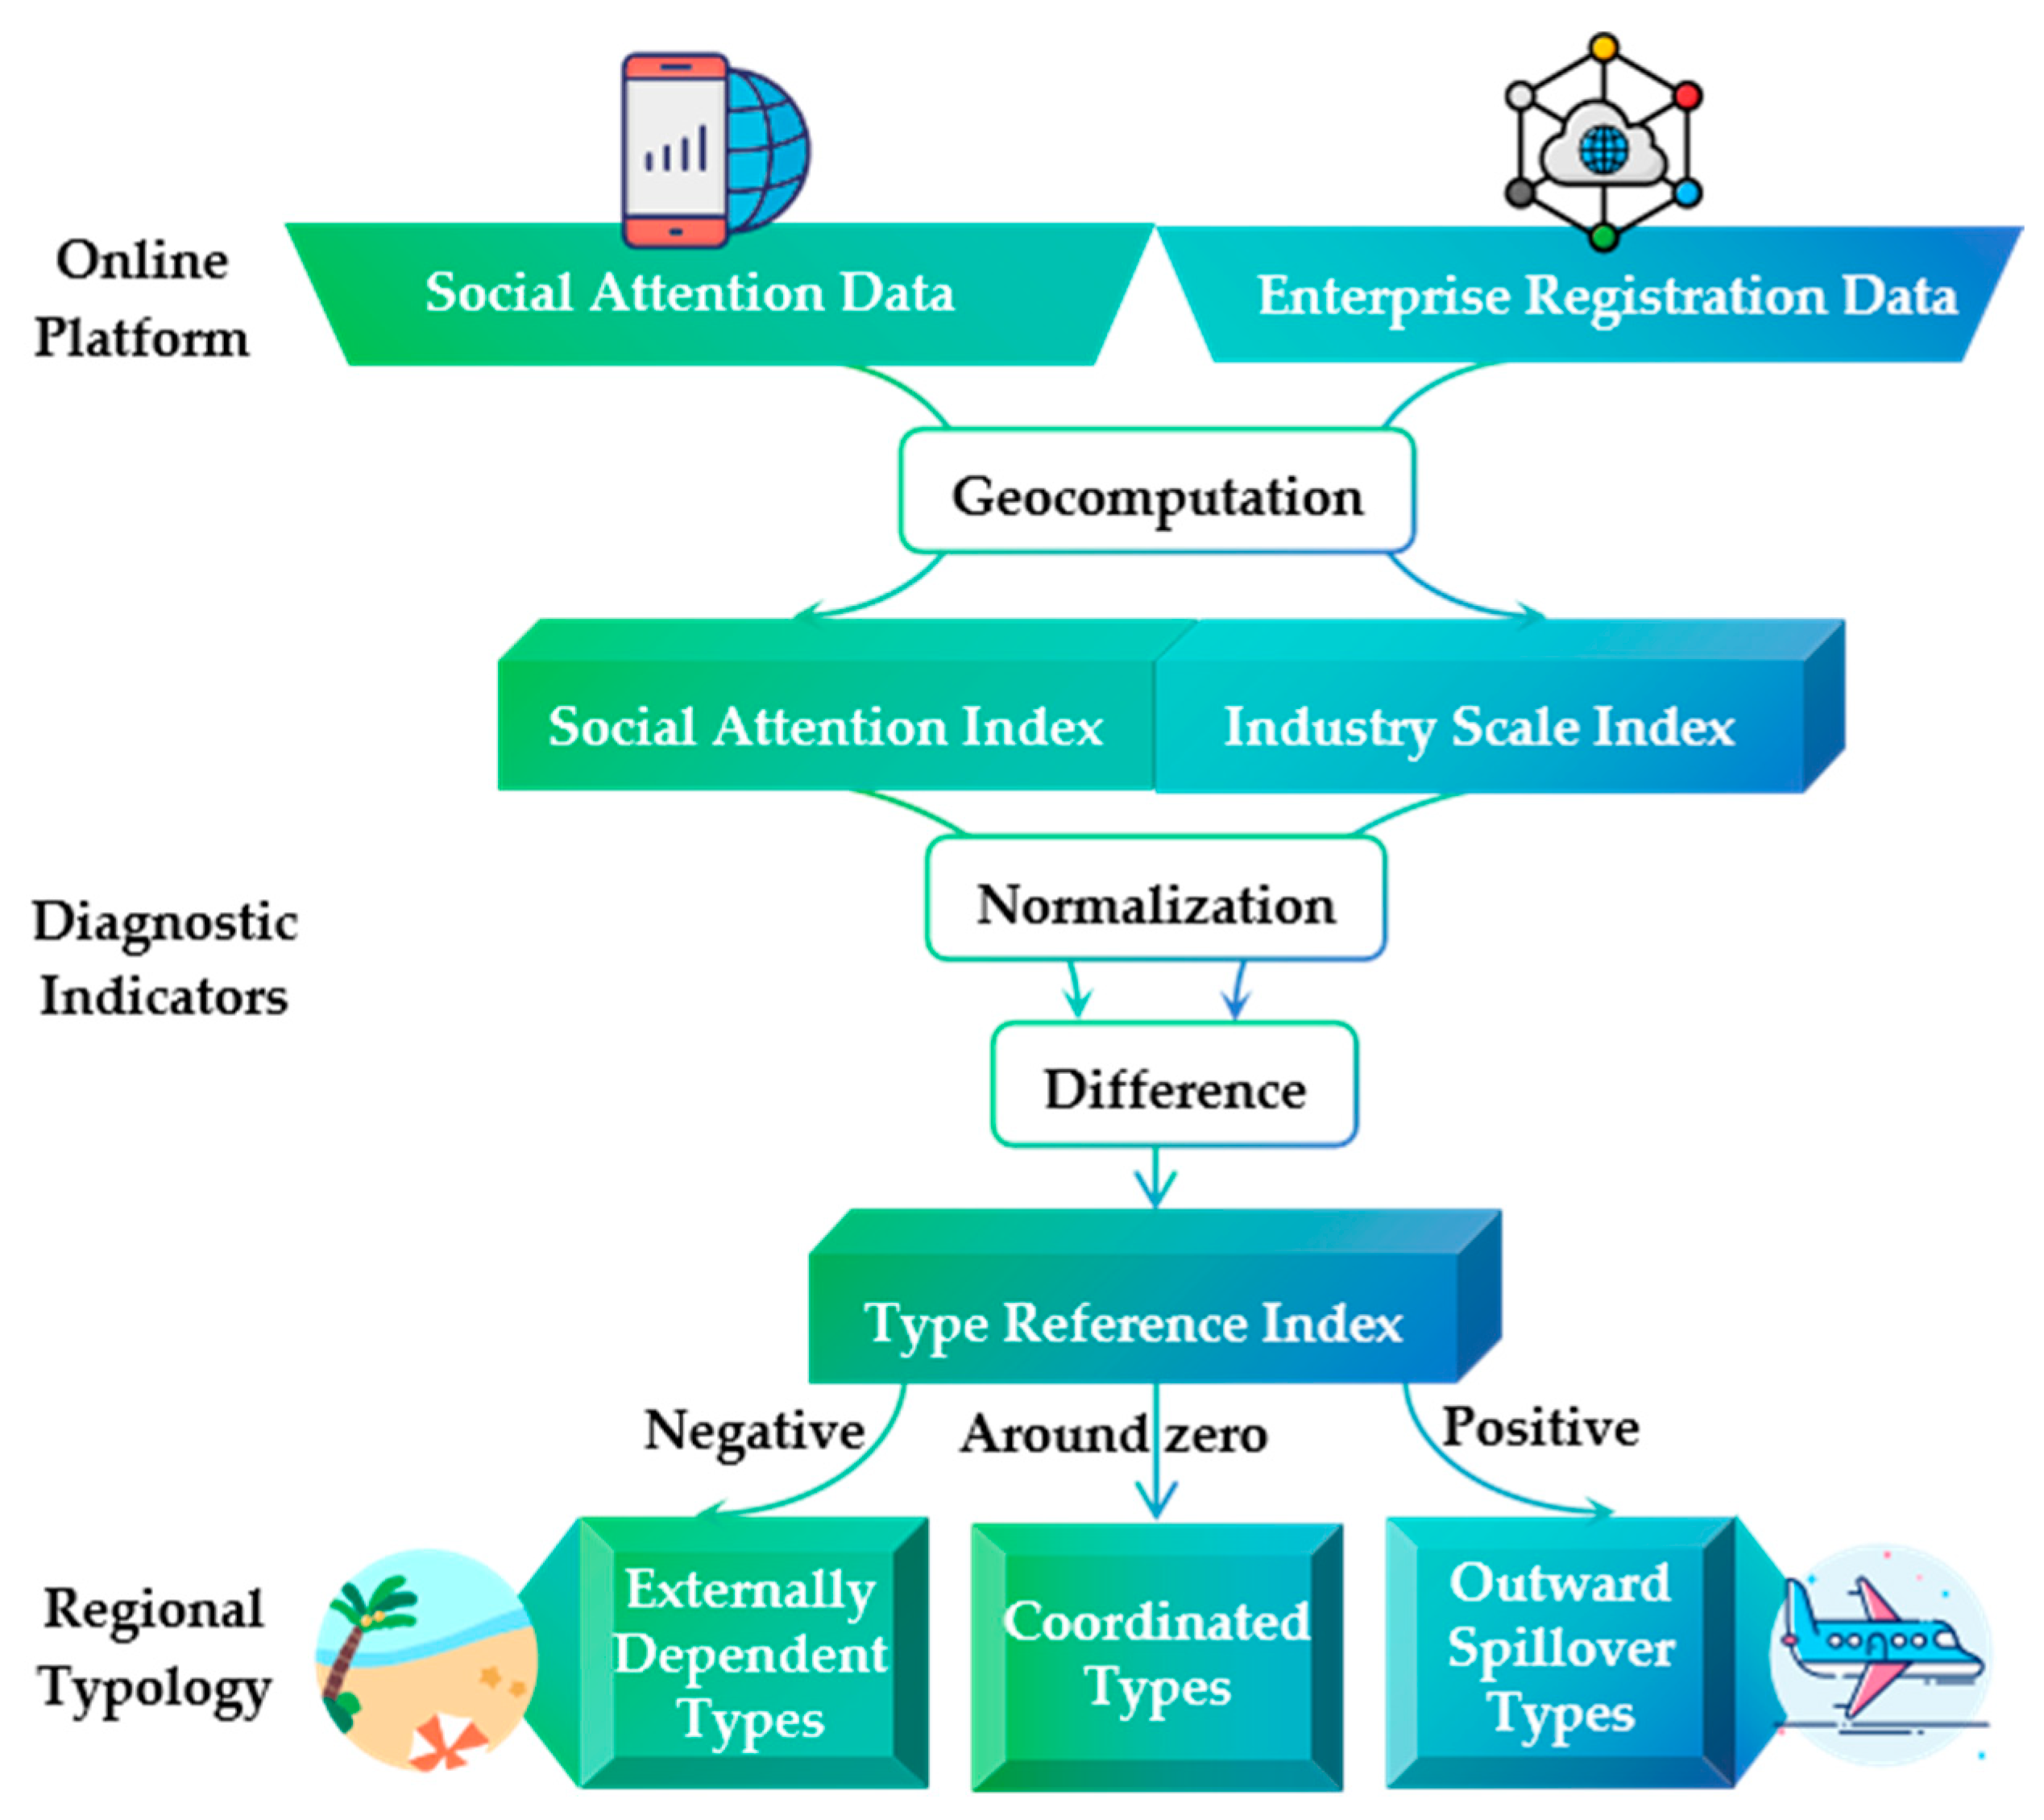
Figure 1. A Multi-Platform Online Data-Driven Diagnostic Model.
Sustainability 17 08230 g001
Figure 2. An index system of the homestay industry scale.
Sustainability 17 08230 g002
Figure 3. Annual and seasonal evolution of the social attention index: (a) 2018; (b) 2021; (c) 2024; (d) winter (February); (e) spring/autumn (April and October); (f) summer (August).
Sustainability 17 08230 g003
Figure 4. Spatial differentiation of social attention in the homestay industry: (a) provincial scale; (b) municipal scale.
Sustainability 17 08230 g004
Figure 5. Numbers of new homestay enterprises by province in China over the past decade.
Sustainability 17 08230 g005
Figure 6. Evolution of municipal homestay enterprise growth: (a) before and including 2014; (b) 2015–2019; (c) 2020 and later.
Sustainability 17 08230 g006
Figure 7. Migration path of newly added homestay enterprises: (a) standard deviation ellipses; (b) migration path of the national center of gravity.
Sustainability 17 08230 g007
Figure 8. Provincial disparities of active enterprises in the homestay industry: (a) number; (b) regional density; (c) per capita number.
Sustainability 17 08230 g008
Figure 9. Municipal disparities of active enterprises in the homestay industry: (a) number; (b) regional density; (c) per capita number.
Sustainability 17 08230 g009
Figure 10. Spatial differentiation of homestay enterprise scale: (a) provincial scale; (b) municipal scale.
Sustainability 17 08230 g010
Figure 11. Regional typology for sustainable development of the homestay industry: (a) provincial scale; (b) municipal scale.
Sustainability 17 08230 g011
Figure 12. GWR regression results of the homestay industry social attention index: (a) operating income of above-scale service enterprises; (b) number of participants in basic pension insurance for urban employees; (c) number of tourist visits; (d) number of undergraduate and junior college students; (e) number of preschool and primary school students; (f) number of A-level scenic spots.
Sustainability 17 08230 g012
Figure 13. GWR regression results of the homestay industry scale index: (a) number of nationally recognized high-tech enterprises; (b) number of tourist visits; (c) number of high-star hotels; (d) number of museums; (e) per capita disposable income; (f) operating income of above-scale service enterprises; (g) output values of the secondary industry.
Sustainability 17 08230 g013
Figure 14. Macroscopic influencing model of China’s homestay industry sustainability. (The arrows marked with “+” indicate a positive influence, whereas those marked with “−” denote a negative influence).
Sustainability 17 08230 g014
Table 1. Clustering Types of Active Homestay Enterprises (Molan’s I/z score).
Spatial RegionSocial Attention IndexIndustry Scale Index
NumberRegional DensityPer Capita Number
National Provincial 0.145/2.4930.284/4.015
National Municipal0.051/5.5940.015/1.7800.027/3.1300.077/8.828
North China0.074/1.906 0.204/2.860
Northeast China 0.154/3.209
East China 0.403/5.703 0.196/3.028
Central China 0.152/1.8200.340/5.411
South China0.220/8.440 0.025/1.716
Southwest China 0.094/2.659
Northwest China 0.019/2.246
Sustainability 17 08230 i001 Random Sustainability 17 08230 i002 Clustered (p < 0.1); Sustainability 17 08230 i003 Clustered (p < 0.05); Sustainability 17 08230 i004 Clustered (p < 0.01).
Table 2. Overview of the OLS and GWR model results.
Dependent VariableParameters of the OLS and GWR ModelIndependent VariableStandardized Regression CoefficientVIF
Industry
Scale
Index
Adjusted R2: 0.439/0.524
AICc: 679.687/639.651
p-value: <0.001
Residual test pass rate: 95.93%
Local R2: 0.386–0.804
Number of nationally recognized high-tech enterprises0.541 ***8.588
Number of tourist visits0.428 ***3.572
Number of high-star hotels0.282 **4.287
Number of museums0.184 *3.501
Per capita disposable income0.168 *2.392
Operating income of above-scale service enterprises−0.488 ***2.766
Output values of the secondary industry−0.663 ***5.907
Social
Attention
Index
Adjusted R2: 0.945/0.957
AICc: −9.281/−75.513
p-value: <0.001
Residual test pass rate: 96.27%
Local R2: 0.930–0.987
Operating income of above-scale service enterprises0.395 ***2.640
Number of participants in basic pension insurance for urban employees0.273 ***9.037
Number of tourist visits0.181 ***3.104
Number of undergraduate and junior college students0.122 ***2.443
Number of preschool and primary school students0.123 ***6.426
Number of A-level scenic spots0.089 ***2.220
*: p < 0.05; **: p < 0.01; ***: p < 0.001.
Table 3. Available data sources for regions outside China.
Primary IndicatorsSecondary IndicatorsData Sources in ChinaData Sources Outside China
Industry Scale IndexEnterprise DataTianyanchaCrunchbase, PitchBook, Orbis, Companies House, Dun & Bradstreet
Social Attention IndexSearch Engine DataBaidu IndexGoogle Trends
Social Media DataOcean Engine dataBrandwatch, BuzzSumo, TweetReach, Keyhole (for Twitter/X)
Disclaimer/Publisher’s Note: The statements, opinions and data contained in all publications are solely those of the individual author(s) and contributor(s) and not of MDPI and/or the editor(s). MDPI and/or the editor(s) disclaim responsibility for any injury to people or property resulting from any ideas, methods, instructions or products referred to in the content.