Article

A Hybrid System Approach to Energy Optimization in Gas–Electric Hybrid Powertrains

1
School of Automobile and Traffic Engineering, Liaoning University of Technology, Jinzhou 121000, China
2
Department of Mathematics and Computer Science, Chaoyang Normal University, Chaoyang 122000, China
3
Yantai Research Institute, Harbin Engineering University, Harbin 150001, China
*
Authors to whom correspondence should be addressed.
Sustainability 2025, 17(18), 8160; https://doi.org/10.3390/su17188160
Submission received: 27 April 2025 / Revised: 2 August 2025 / Accepted: 8 September 2025 / Published: 10 September 2025

Abstract

Amid growing global concerns over environmental sustainability, the shipping industry is under increasing pressure to implement innovative power systems that minimize ecological impact. A promising approach is the marine gas–electric hybrid system, which combines conventional marine propulsion with electric power to offer a cleaner energy solution. Characterized by the integration of continuous and discrete variables, these systems reflect the hybrid nature of gas–electric propulsion. Despite their potential, research on marine hybridization remains limited. To address this gap, a hybrid system model has been developed to optimize energy allocation while accurately capturing the hybrid characteristics of gas–electric systems in ships. Additionally, an energy distribution strategy based on predictive control has been proposed to validate the model’s practical applicability. A weighted evaluation method was employed on a marine gas–electric hybrid test platform to verify the performance of both the model and the control strategy. Results show that different weighting configurations lead to varying torque distribution patterns, confirming the effectiveness of the hybrid system model. Moreover, tuning the weighting parameters within the energy allocation strategy yields diverse control behaviors, further demonstrating the system’s viability for marine applications.

1. Introduction

Natural gas has gained increasing prominence as a preferred energy source for maritime propulsion systems due to its wide availability, cost-effectiveness, and cleaner combustion characteristics [1]. Its combustion process produces substantially lower carbon dioxide emissions compared to conventional marine fuels, thereby contributing to global efforts aimed at mitigating greenhouse gas emissions [2]. However, sole reliance on natural gas engines can lead to limited power output and deteriorated emission performance, especially under low-load conditions, constraining their adaptability to dynamic marine operations. To overcome these limitations, the integration of gas–electric hybrid propulsion systems has been proposed as a viable solution [3]. By employing electric motors as auxiliary power units, these systems synergistically combine the extended operational range and low carbon footprint of natural gas engines with the high responsiveness and superior dynamic performance of electric propulsion. This hybrid architecture effectively addresses the intrinsic shortcomings of purely gas-powered and fully electric vessels, such as restricted cruising range and limited propulsion capability [4]. Despite these advantages, marine gas–electric hybrid propulsion systems (MGHPSs) are characterized by high structural and control complexity, owing to the coexistence of continuous energy flow dynamics and discrete operational modes (e.g., clutch engagement and source switching). Therefore, accurate modeling and intelligent control strategies are crucial to fully realize the potential of MGHPSs. This study addresses these needs by developing a hybrid system modeling framework for the gas–electric powertrain and implementing a hybrid model predictive control (HMPC) strategy aimed at optimizing both dynamic performance and emission reductions.
With advances in modeling theory, research has transitioned from purely continuous-time analysis toward hybrid system modeling, which integrates both discrete events and continuous dynamics [5]. In MGHPSs, frequent switching behaviors, such as energy source transitions and mode changes, necessitate a modeling approach that captures both physical and logical dynamics. Several hybrid modeling paradigms have been proposed, notably the Mixed Logic Dynamic (MLD) framework [6], Piecewise Affine (PWA) models [7], and the Extended Linear Complementarity (ELC) approach [8]. However, the existing literature largely applies these frameworks to non-marine domains, such as aerospace, microgrids, and communication systems, with relatively limited adaptation to maritime hybrid systems.
In multiple engineering domains, such as aerospace, energy systems, and vehicle control, hybrid system modeling approaches including PWA and MLD have demonstrated extensive application potential. Relevant research indicates that PWA modeling not only effectively describes nonlinear relationships within complex systems but can also be integrated with model predictive control (MPC) to enhance system stability and energy efficiency. For instance, this approach has achieved significant improvements in system performance across scenarios including spacecraft attitude dynamics [9], thermal microgrid energy optimization [10], and networked filter design, validating its advantages in capturing dynamic characteristics and enhancing control accuracy [11]. Concurrently, MLD-based modeling and control approaches have yielded favourable outcomes in applications such as voltage regulation for parallel inverters [12], drive–brake mode switching in vehicles [13], and energy distribution in isolated microgrids [14], demonstrating outstanding capabilities in disturbance suppression, torque compensation, and energy allocation optimization. Collectively, these studies demonstrate the strong applicability and promising prospects of hybrid system modeling and control methods for addressing complex nonlinear engineering challenges. Nevertheless, despite extensive cross-domain exploration, their implementation within marine hybrid propulsion systems remains nascent. Further research and validation are urgently required to assess the adaptability and efficacy of these methodologies in this specific context.
In short, the complexity of marine gas–electric hybrid propulsion systems (MGHPSs) arises not only from the constant changes in energy flow but also from the frequent switching between discrete behaviors (such as switching operations and mode changes). These intertwined continuous and discrete dynamics collectively put strict demands on the modeling methods used. The MLD model integrates logical decisions and dynamic behavior into a set of mixed-integer linear inequalities, providing a robust interface for control optimization, and is therefore particularly well-suited for solving complex mixed-integer control problems. In contrast, the Piecewise Affine (PWA) model approximates the local behavior of a nonlinear system by dividing the system state space into multiple regions, each controlled by a linear dynamic representation. However, in MGHPSs, discrete control behaviors (such as energy source switching, operating mode conversion, clutch engagement, etc.) are not only frequent but also inherently complex and have a significant impact on system performance. In such systems, MLD models are better able to capture and express the impact of discrete decisions on the continuous evolution of the system due to their intrinsic ability to represent Boolean variables, logical conditions, and system dynamics within a unified framework. In contrast, PWA models, while offering certain advantages in handling nonlinearities in continuous domains, have limited expressive power for complex logic and struggle to directly model system switching behavior involving logical dependencies. In addition, the MLD model integrates well with the model predictive control (MPC) framework, making it easier to incorporate system constraints, objective functions, and logical rules into the optimization problem, thereby improving the global optimality and execution efficiency of the control strategy.
However, while Petri nets excel at describing discrete-event systems (such as fault diagnosis and task scheduling), their continuous modeling capabilities and compatibility with optimal control methods (such as model predictive control (MPC)) are relatively limited, especially when dealing with multi-physics energy coupling and high-dimensional state-space dynamic systems. Additionally, Petri nets lack a unified mechanism for system-level constraint modeling, making it challenging to represent complex scenarios involving multi-source, multi-objective optimal operation problems. Therefore, this work prioritizes the MLD modeling framework for MGHPSs due to its superior capability to unify discrete logic, continuous dynamics, and system constraints within a single optimization-compatible representation.
To address the limitations associated with the insufficient precision of torque distribution and the inability of conventional model predictive control (MPC) frameworks to concurrently manage continuous dynamics and discrete events in marine gas–electric hybrid propulsion systems (MGHPSs), this study proposes an energy management strategy (EMS) based on hybrid system modeling and hybrid model predictive control (HMPC). The objective of the proposed approach is to optimize the dynamic performance of the powertrain while achieving reductions in carbon emissions. The principal contributions of this research are as follows:
(1)
A unified hybrid modeling framework is developed based on MLD, enabling rigorous representation of both discrete and continuous dynamics in the MGHPS. This framework forms the foundation for subsequent control design.
(2)
An HMPC-based energy management strategy is proposed, which dynamically adjusts control weights in response to varying mission profiles to achieve a balanced improvement in fuel economy and emission reduction. A simulation platform is developed to validate the proposed approach under representative operating conditions, demonstrating its effectiveness in enhancing control performance and energy efficiency.
The structure of this research on optimizing energy distribution in gas–electric hybrid power systems is organized as follows: Section 2 introduces the key modeling theories and methods. Section 3 outlines an energy management strategy based on hybrid system theory, aimed at achieving multiple objectives, such as minimizing torque fluctuations, reducing carbon emissions, and improving propulsion performance. Section 4 evaluates the effectiveness of the proposed strategy through validation on a test platform. Lastly, Section 5 provides the conclusion of the paper.

2. Modeling Theory and Methods

2.1. Hybrid Systems Theory

The MGHPS encounters the challenge of simultaneously controlling discrete and continuous variables, where discrete events trigger the discrete variables. Consequently, strategies that rely solely on continuous or discrete processes are inadequate for managing the entire system effectively. A hybrid system comprises both a continuous variable dynamic system (CVDS) and a discrete event dynamic system (DEDS), which interact through mutual coupling and influence [15]. In such a system, the progression of continuous variables must adhere to physical laws, while the triggering of discrete events is governed by specific logical rules. Notably, the occurrence of discrete events is contingent upon the continuous variables, and the evolution of continuous variables may be affected by the discrete events. This interaction is illustrated in Figure 1. The bidirectional influence between these components creates a tightly integrated feedback mechanism. Research in hybrid systems merges the theories of both continuous and discrete systems, enabling the system to operate in accordance with the physical laws governing the continuous system across various modes, thereby facilitating a more effective integration of continuous and discrete processes.

2.2. Modeling Methods for Hybrid Systems

The MLD model is widely applied in the control field for the modeling, simulation, and analysis of hybrid systems [16]. The MLD model is developed by converting heuristic knowledge, logical reasoning, and constraints into propositional logic, and subsequently translating the logical relationships among propositions into mixed-integer inequalities involving logical variables. These inequalities can be solved using logical operators. During execution, the state of the MLD model evolves in accordance with the progression of the linear continuous dynamic process, subject to the constraints imposed by the mixed-integer inequalities during the solution procedure. As a result, the MLD model effectively integrates continuous dynamics with discrete event interactions, making it a robust and widely used modeling approach in hybrid system control. The state-space representation of the MLD model is provided in Equation (1).
x ( k + 1 ) = A 1 x ( k ) + B 1 u ( k ) + B 2 σ ( k ) + B 3 z ( k ) y ( k ) = C x ( k ) + D 1 u ( k ) + D 2 σ ( k ) + D 3 z ( k ) E 2 σ ( k ) + E 3 z ( t ) E 1 u ( t ) + E 4 x ( t ) + E 5
where k z , x(k) is the state vector at time k, representing system states such as battery SOC, NGE speed, etc. u(k) is the continuous control input (e.g., NGE torque). σ ( k ) is the binary variable, indicating discrete logic states (e.g., whether the battery is charging or discharging). z(k) is the auxiliary continuous variable introduced by logic constraints, and A~E are the corresponding coefficient matrices, respectively. This equation expresses the evolution of system states and outputs under the influence of both continuous and discrete control inputs.
The main challenge is the design of a hybrid controller that guarantees optimal control of the hybrid system once the MLD model has been established. Optimal control entails determining the best control sequence that minimizes the system’s objective function while complying with the given constraints. Since the hybrid system incorporates both a continuous variable dynamical system and a discrete event dynamical system, the optimal control problem becomes much more complex than a typical optimization problem. To address this, the paper proposes the use of mixed-model predictive control based on the MLD predictive model, with the control architecture depicted in Figure 2.
The core principle of MPC lies in utilizing a system model and real-time measurements of system outputs to forecast the system’s behavior over a defined future time horizon. Specifically, at each sampling instance k, the optimization algorithm predicts the control sequence for the specified horizon, computes the sequence, and then applies only the first control value to the system. This ensures that the control remains responsive to changes in system behavior or external disturbances. This optimization process is repeated at the next sampling point, using updated measured output values to refine the control input. Consequently, the system undergoes continuous and adaptive predictive control, with the optimization problem being formulated within the context of the MLD model, as shown in Equation (2). This optimization problem aims to find the optimal control input sequence u(k), u(k + 1),…, u(k + N − 1), as well as the associated discrete variables σ(k + i) and auxiliary variables z(k + i), that minimize the overall cost over a prediction horizon of N steps.
min u , σ , z 0 N 1 J ( u , σ , z 0 N 1 , x ( t ) ) k = 1 N Q x ( x ( k t ) x r ) p + k = 1 N 1 Q u ( u ( t + k ) u r p + k = 1 N 1 Q z ( z ( k t ) z r ) p + k = 1 N 1 Q y ( y ( k t ) y r ) p s . t . x ( k + 1 t ) = A 1 x ( k t ) + B 1 u ( k ) + B 2 σ ( k t ) + B 3 z ( k t ) y ( k t ) = C x ( k t ) + D 1 u ( k ) + D 2 σ ( k t ) + D 3 z ( k t ) E 2 σ ( k t ) + E 3 z ( k t ) E 1 u ( k ) + E 4 x ( k t ) + E 5 u min u ( t + k ) u max , k = 0 , 1 , , N 1 x min x ( k t ) x max , k = 1 , , N y min y ( k t ) y max , k = 0 , 1 , , N 1
where N is the predicted step size, and σ and z are auxiliary discrete and auxiliary continuous variables, respectively. Q is the weight of the relevant variable, and x r , u r , z r , y r are the tracking target value for the state, input, and auxiliary variables, respectively.

3. Energy Management Applications for MGHPS

3.1. Research Objects

The focus of this study is a MGHPS designed for marine applications. The system’s power sources include a natural gas engine (NGE), a permanent magnet synchronous motor (PMSM), and a battery. The propeller is modeled using an electric dynamometer. The mechanical, electrical, and signaling connections between the components are illustrated in Figure 3a. Figure 3b presents the corresponding test simulation platform for this hybrid system, while Table 1 provides a list of the key parameters of the involved equipment. The experimental platform adopts a modular design with strong scalability, allowing for the addition or replacement of various types of power sources and load devices, such as higher-power motors or multiple battery configurations, to meet the requirements of different vessel types and operational scenarios. The platform is located in a temperature- and humidity-controlled indoor environment to ensure data stability and repeatability. However, it is currently intended primarily for functional verification and control strategy evaluation and lacks the capability for long-term durability testing and validation under marine environmental conditions. These limitations highlight the need for further development in future research.

3.2. Gas–Electric Hybrid Modeling Based on Hybrid System Theory

3.2.1. NGE Model

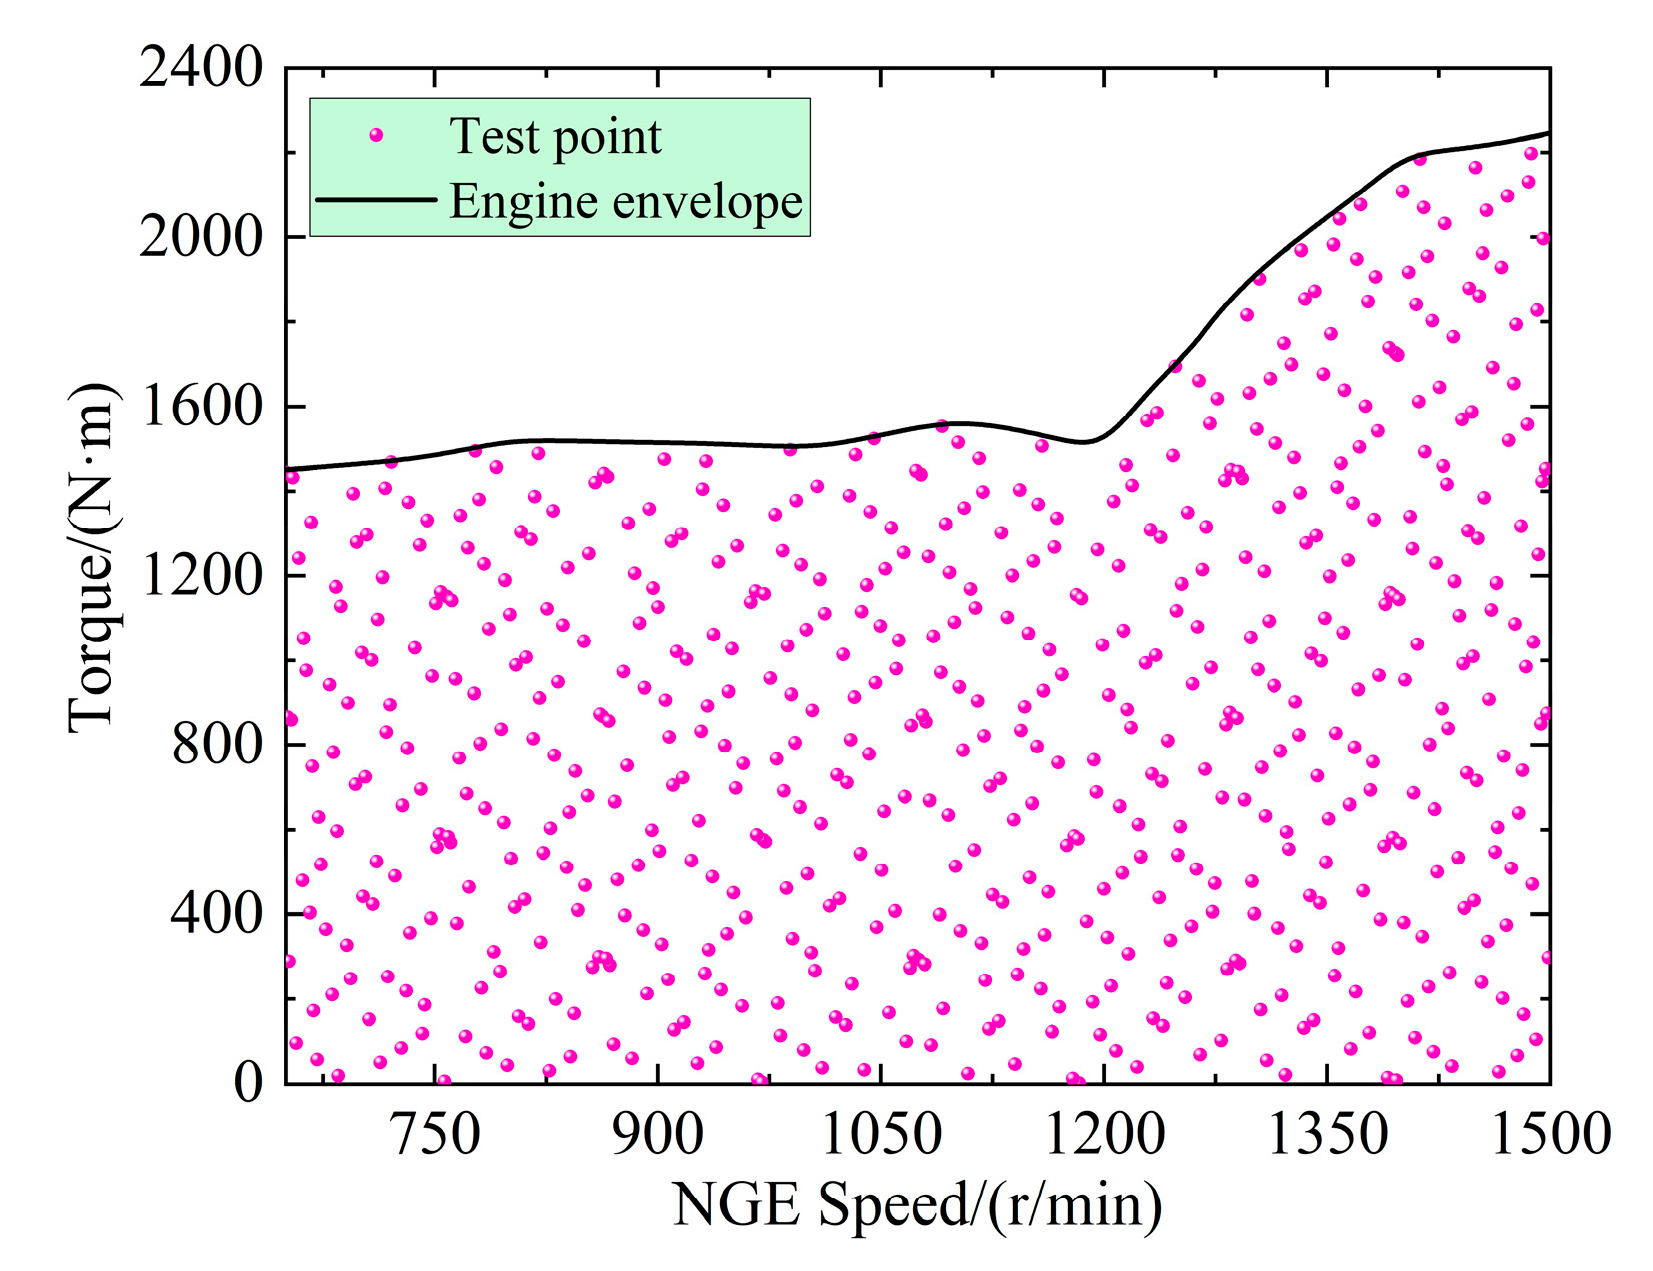
The most important aspect of the NGE is to control gas consumption and NOx and HC emissions during operation. In order to obtain data on the distribution of gas consumption and emissions, a combination of “space-filling experimental design” and “V-optimization design” was applied to design the test points and conduct the experiments. The distribution of the test points is presented in Figure 4. Meanwhile, the “interval + PWARX” method is adopted to model the NGE, inspired by the idea of interval integration in hybrid systems.
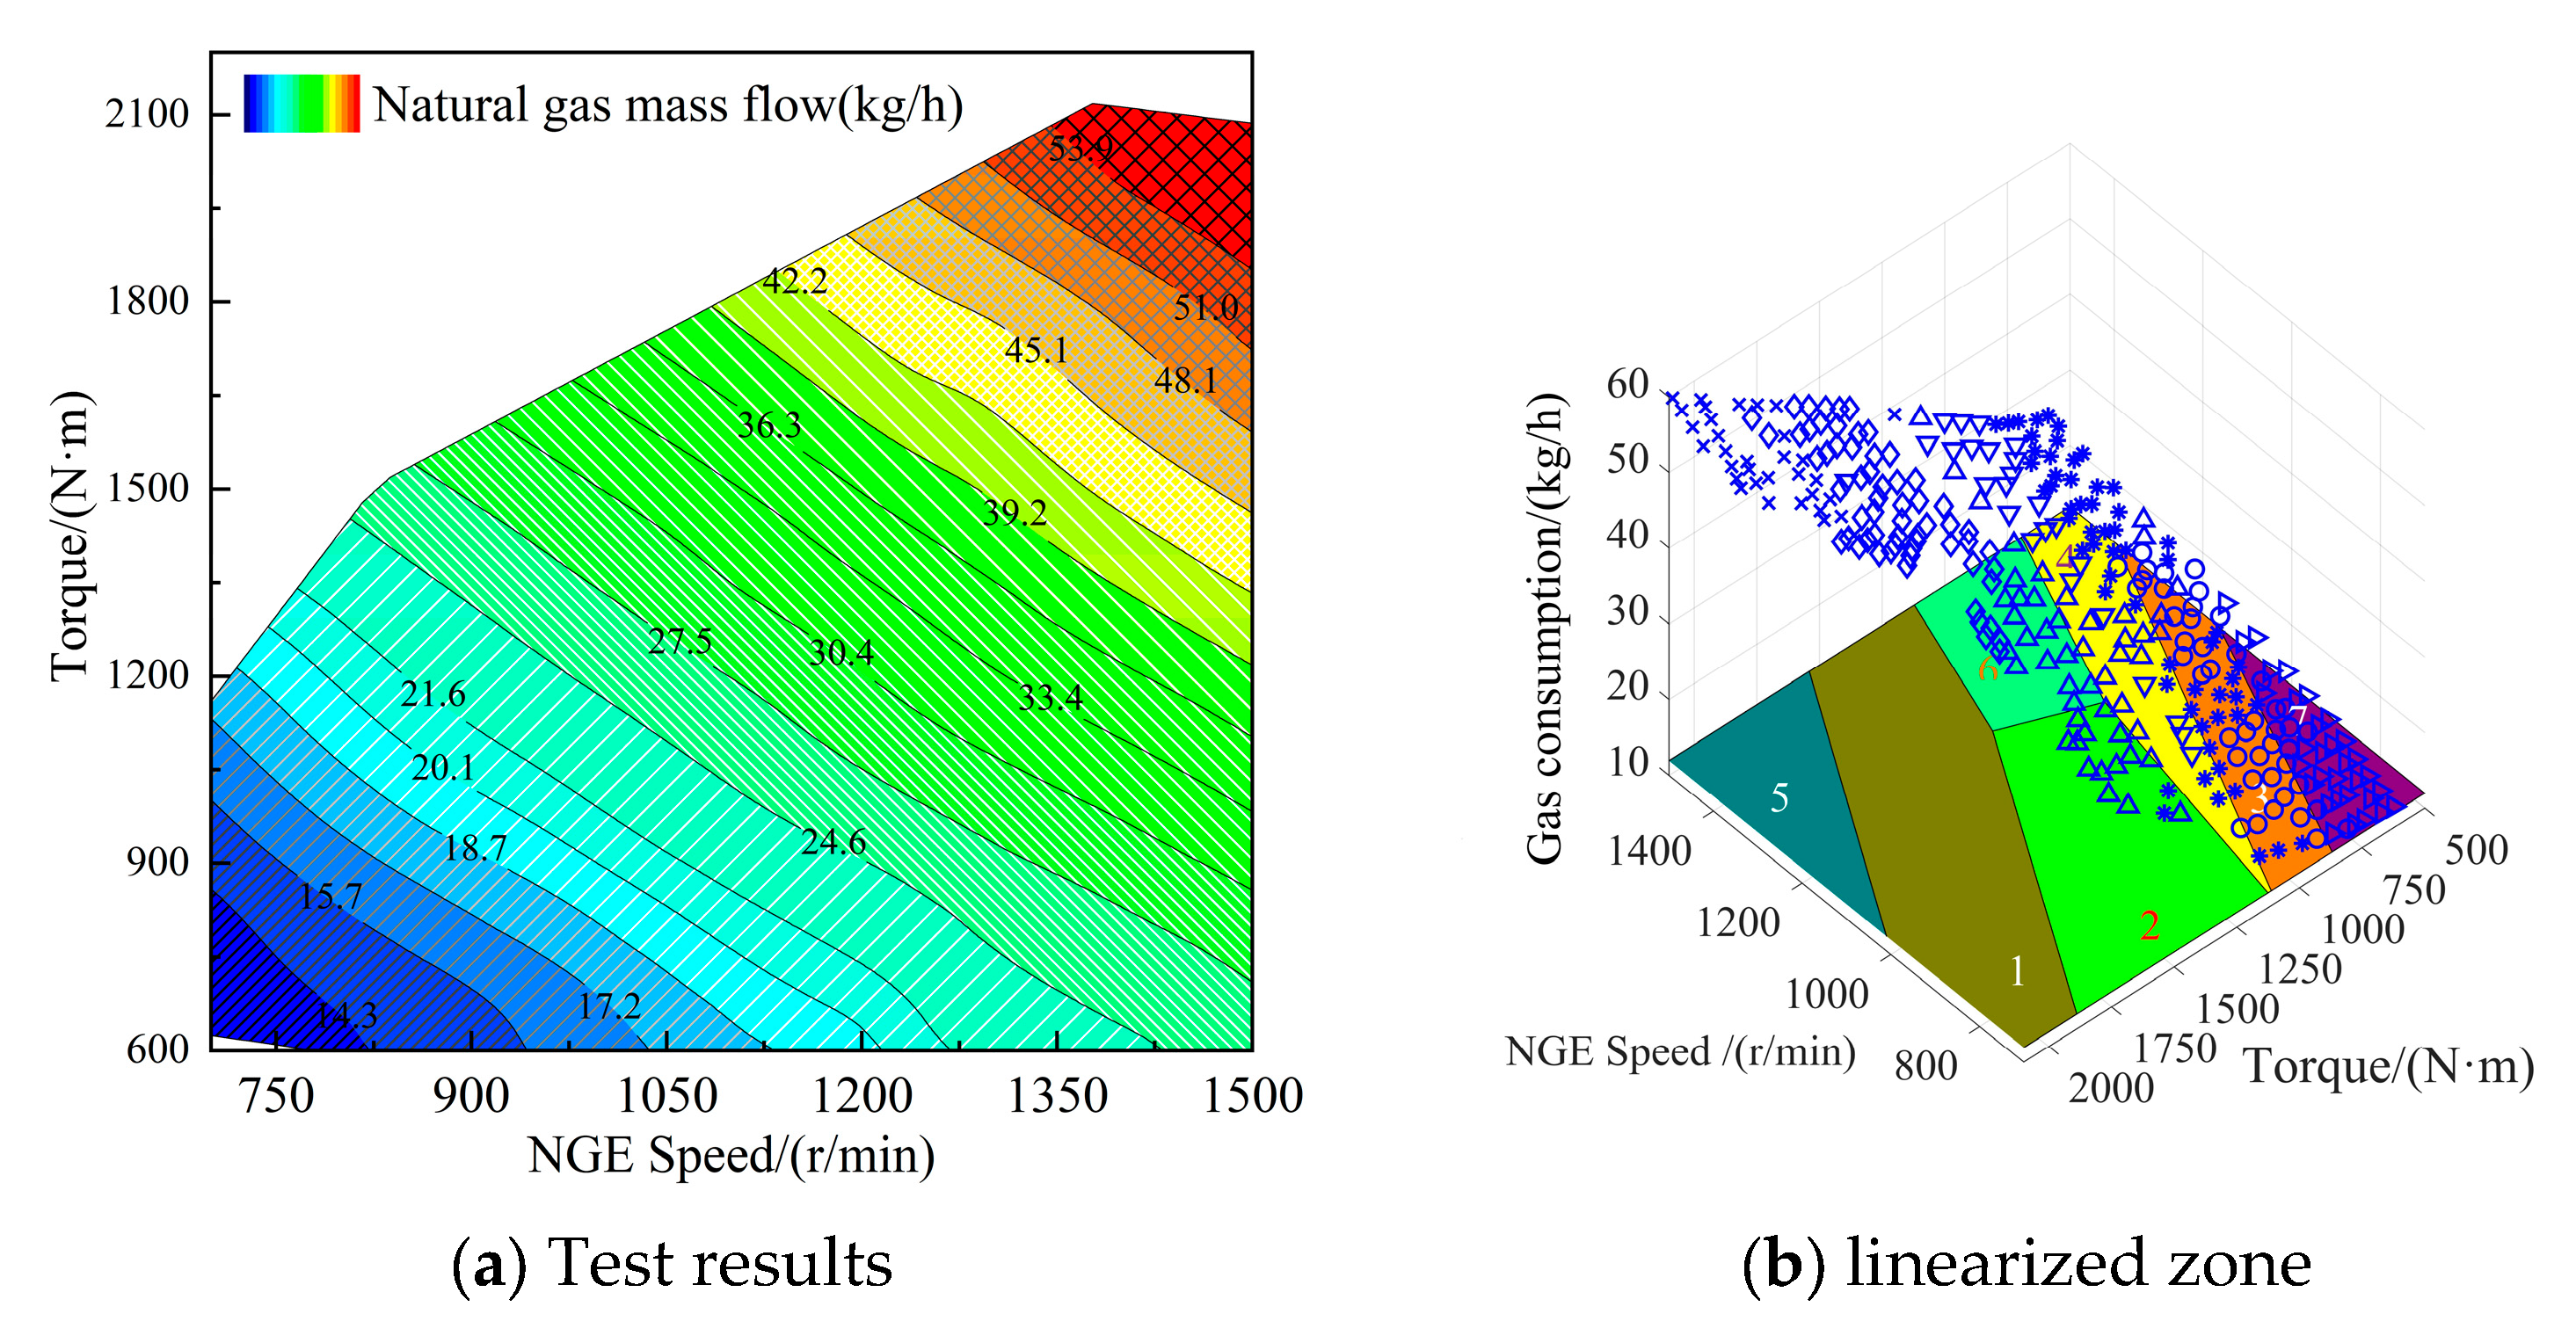
Gas consumption data were collected by running the test points through the test platform. A two-dimensional distribution of gas consumption was then plotted, as shown in Figure 5a. The PWARX method is adopted for piecewise linearization to facilitate the development of the hybrid model, and the corresponding partitioned region is demonstrated in Figure 5b. The linearization equation is illustrated in Equation (A1), and the mean square error (MSE) for each region is presented in Table 2.
The Testo 350 collected data related to NOx and HC by running test points through the test stand. A two-dimensional distribution of emissions was then plotted, as seen in Figure 6a. A similar process was performed for NOx + HC using the PWARX method, as depicted in Figure 6b and shown in Equation (A2). The MSE for each interval is presented in Table 3.

3.2.2. Motor-Energy Storage Systems

The PMSM and the energy storage system are the most important components of the electrical part. A ‘space-filling experimental design + V-optimized design’ approach was adopted to design the test points, with their distribution depicted in Figure 7a. An efficiency map for the PMSM was created using experimental data, as depicted in Figure 7b.
It can be observed in Figure 7b that the PMSM efficiency surface varies significantly, especially in the low-torque region around 0 N·m. The direct fitting error using PWARX is too large to meet the simulation requirements. Hence, the PMSM power is combined with the battery power to address the fitting difficulty caused by the nonlinear behavior in the low-efficiency region, and a relationship between the two is established, as indicated in Equation (3).
P b a t = η b a t η m o t k P m o t = η b a t η m o t k M m o t ω m o t k = 1 M m o t < 0 1 M m o t 0
where P b a t is the battery power (kW), P m o t is the PMSM output power (kW), M m o t is the output torque of PMSM (N·m), ω m o t is the PMSM speed (rad/s), η m o t is the PMSM efficiency (%), and η b a t is the battery efficiency (%).
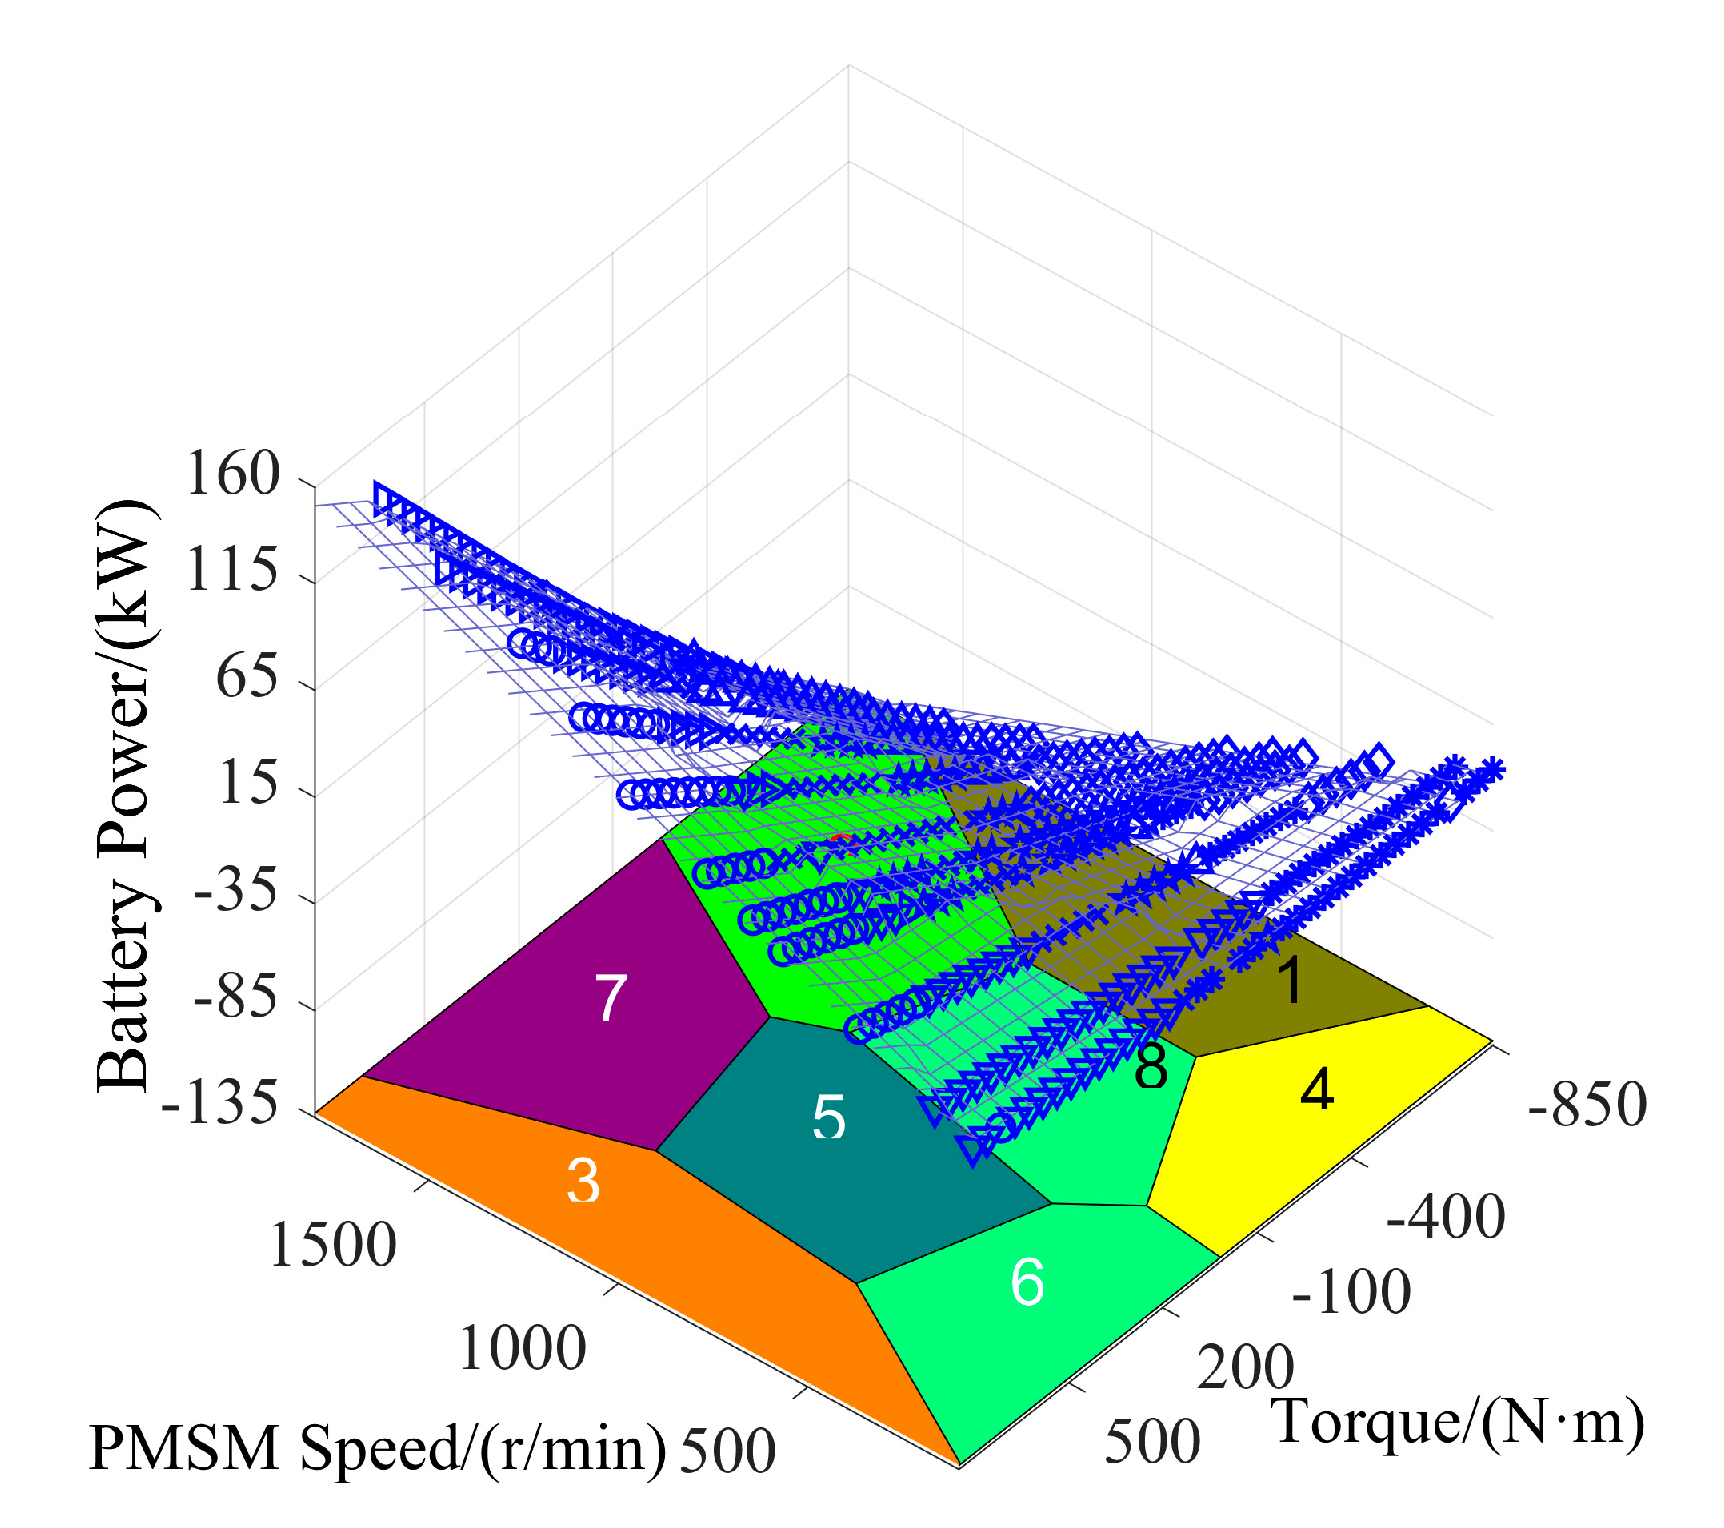
According to Figure 7b and Equation (3), the variation rule of battery power output under different working conditions can be obtained, as seen in Figure 8. The battery power transition is smooth over the entire range of operating conditions, which improves the fitting accuracy. Piecewise linearization was carried out using PWARX and the results obtained are presented in Equation (A3). The MSE for each region is summarized in Table 4.
In order to directly respond to the change rule of SOC, the motor power is combined with the battery power to obtain the following relationship:
d S O C d t = P b a t Q b a t U b a t
where Q b a t is the capacity (A·h), and U b a t is the battery voltage (V).
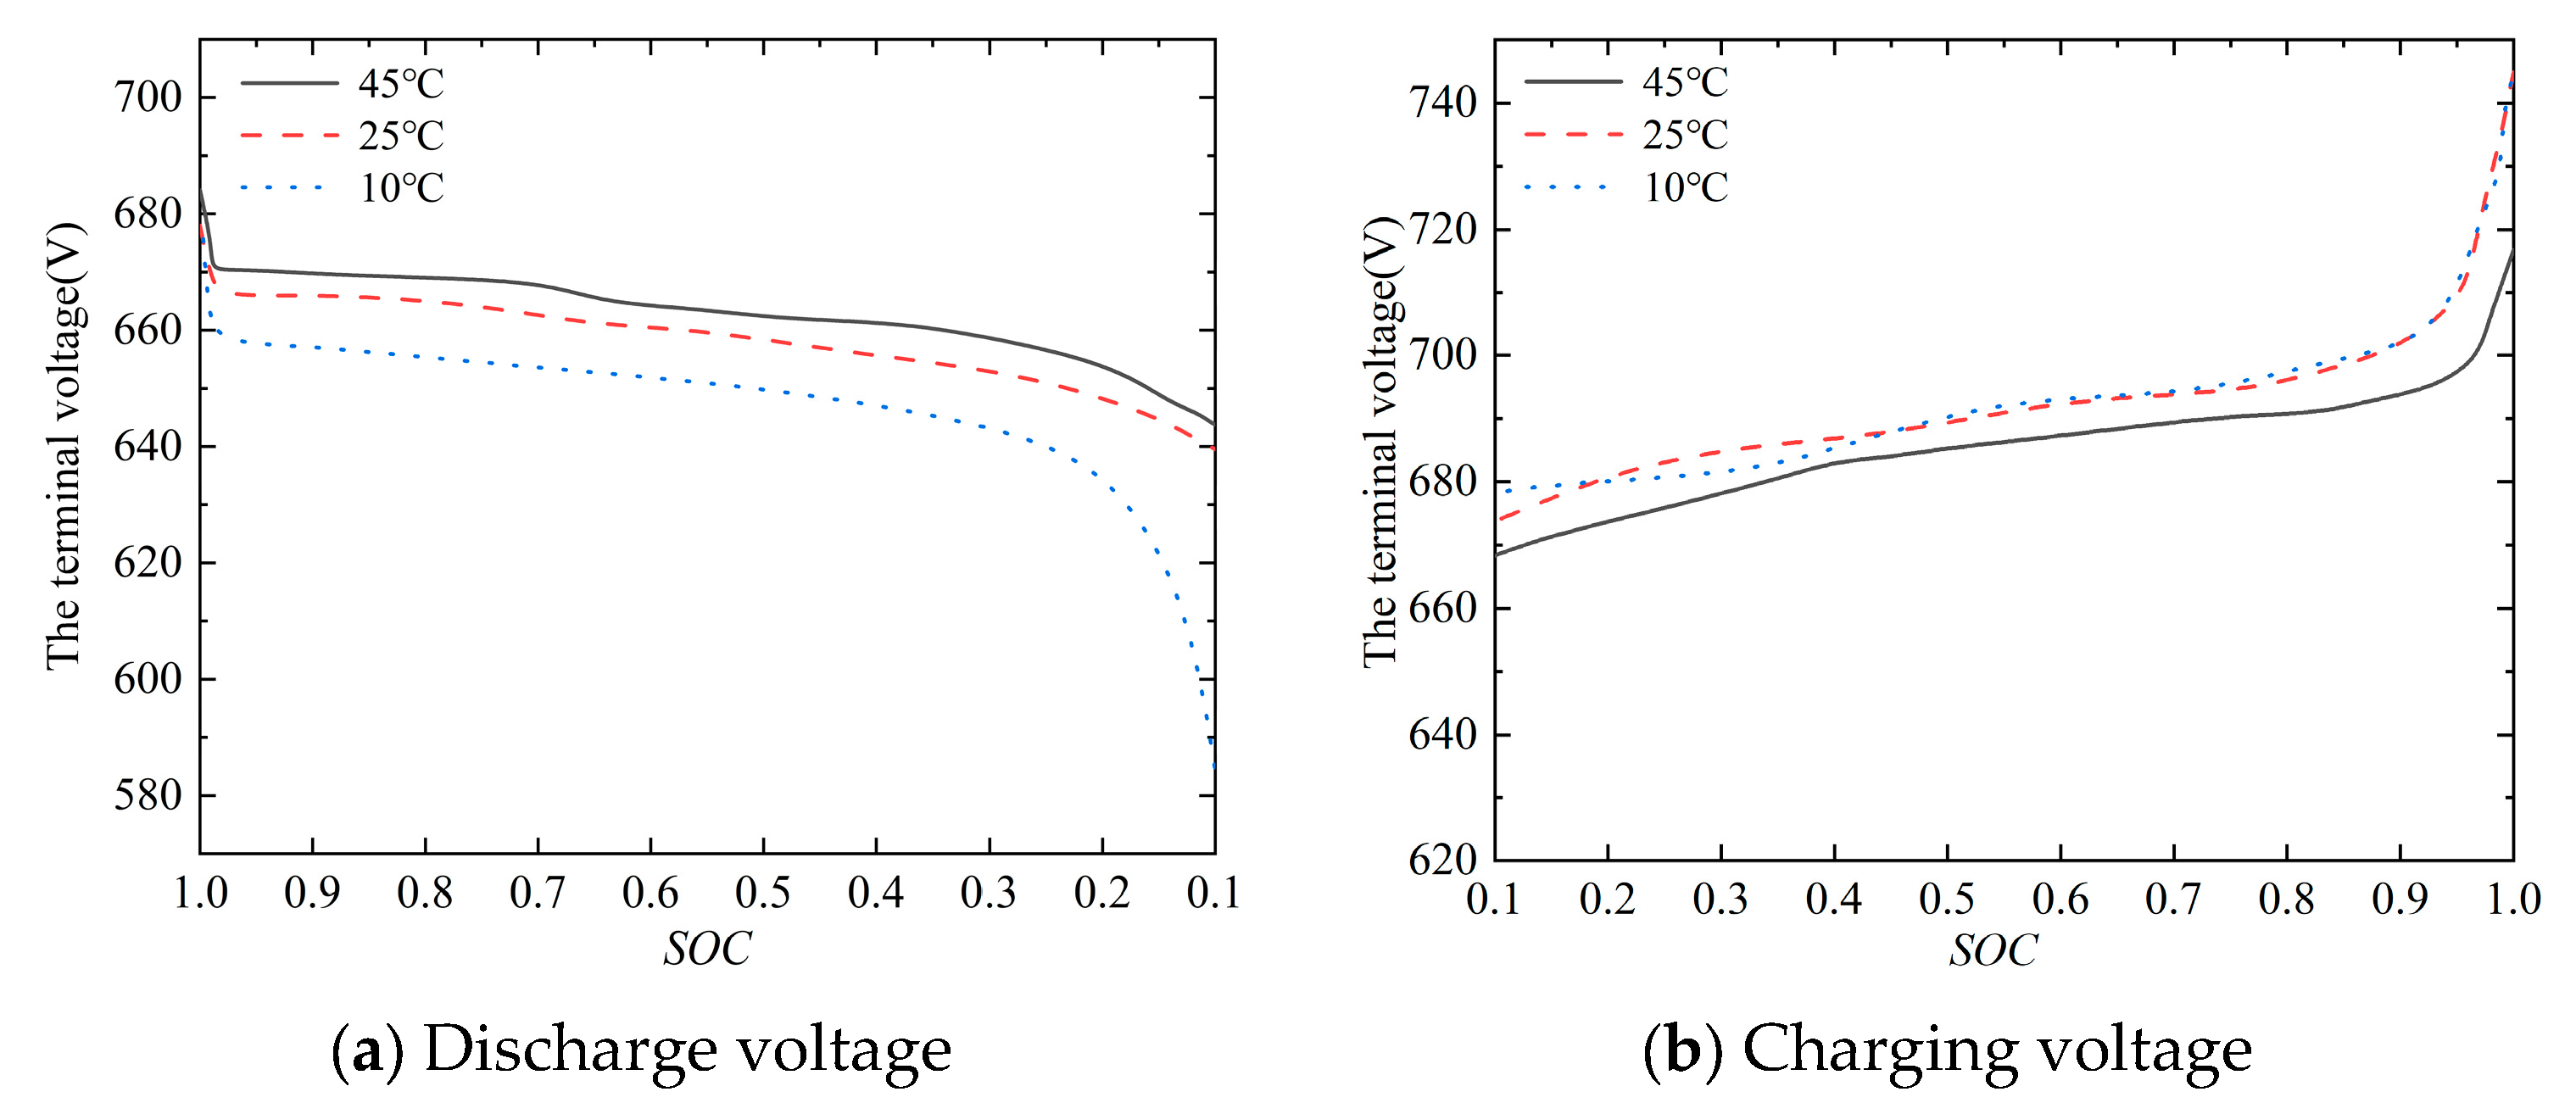
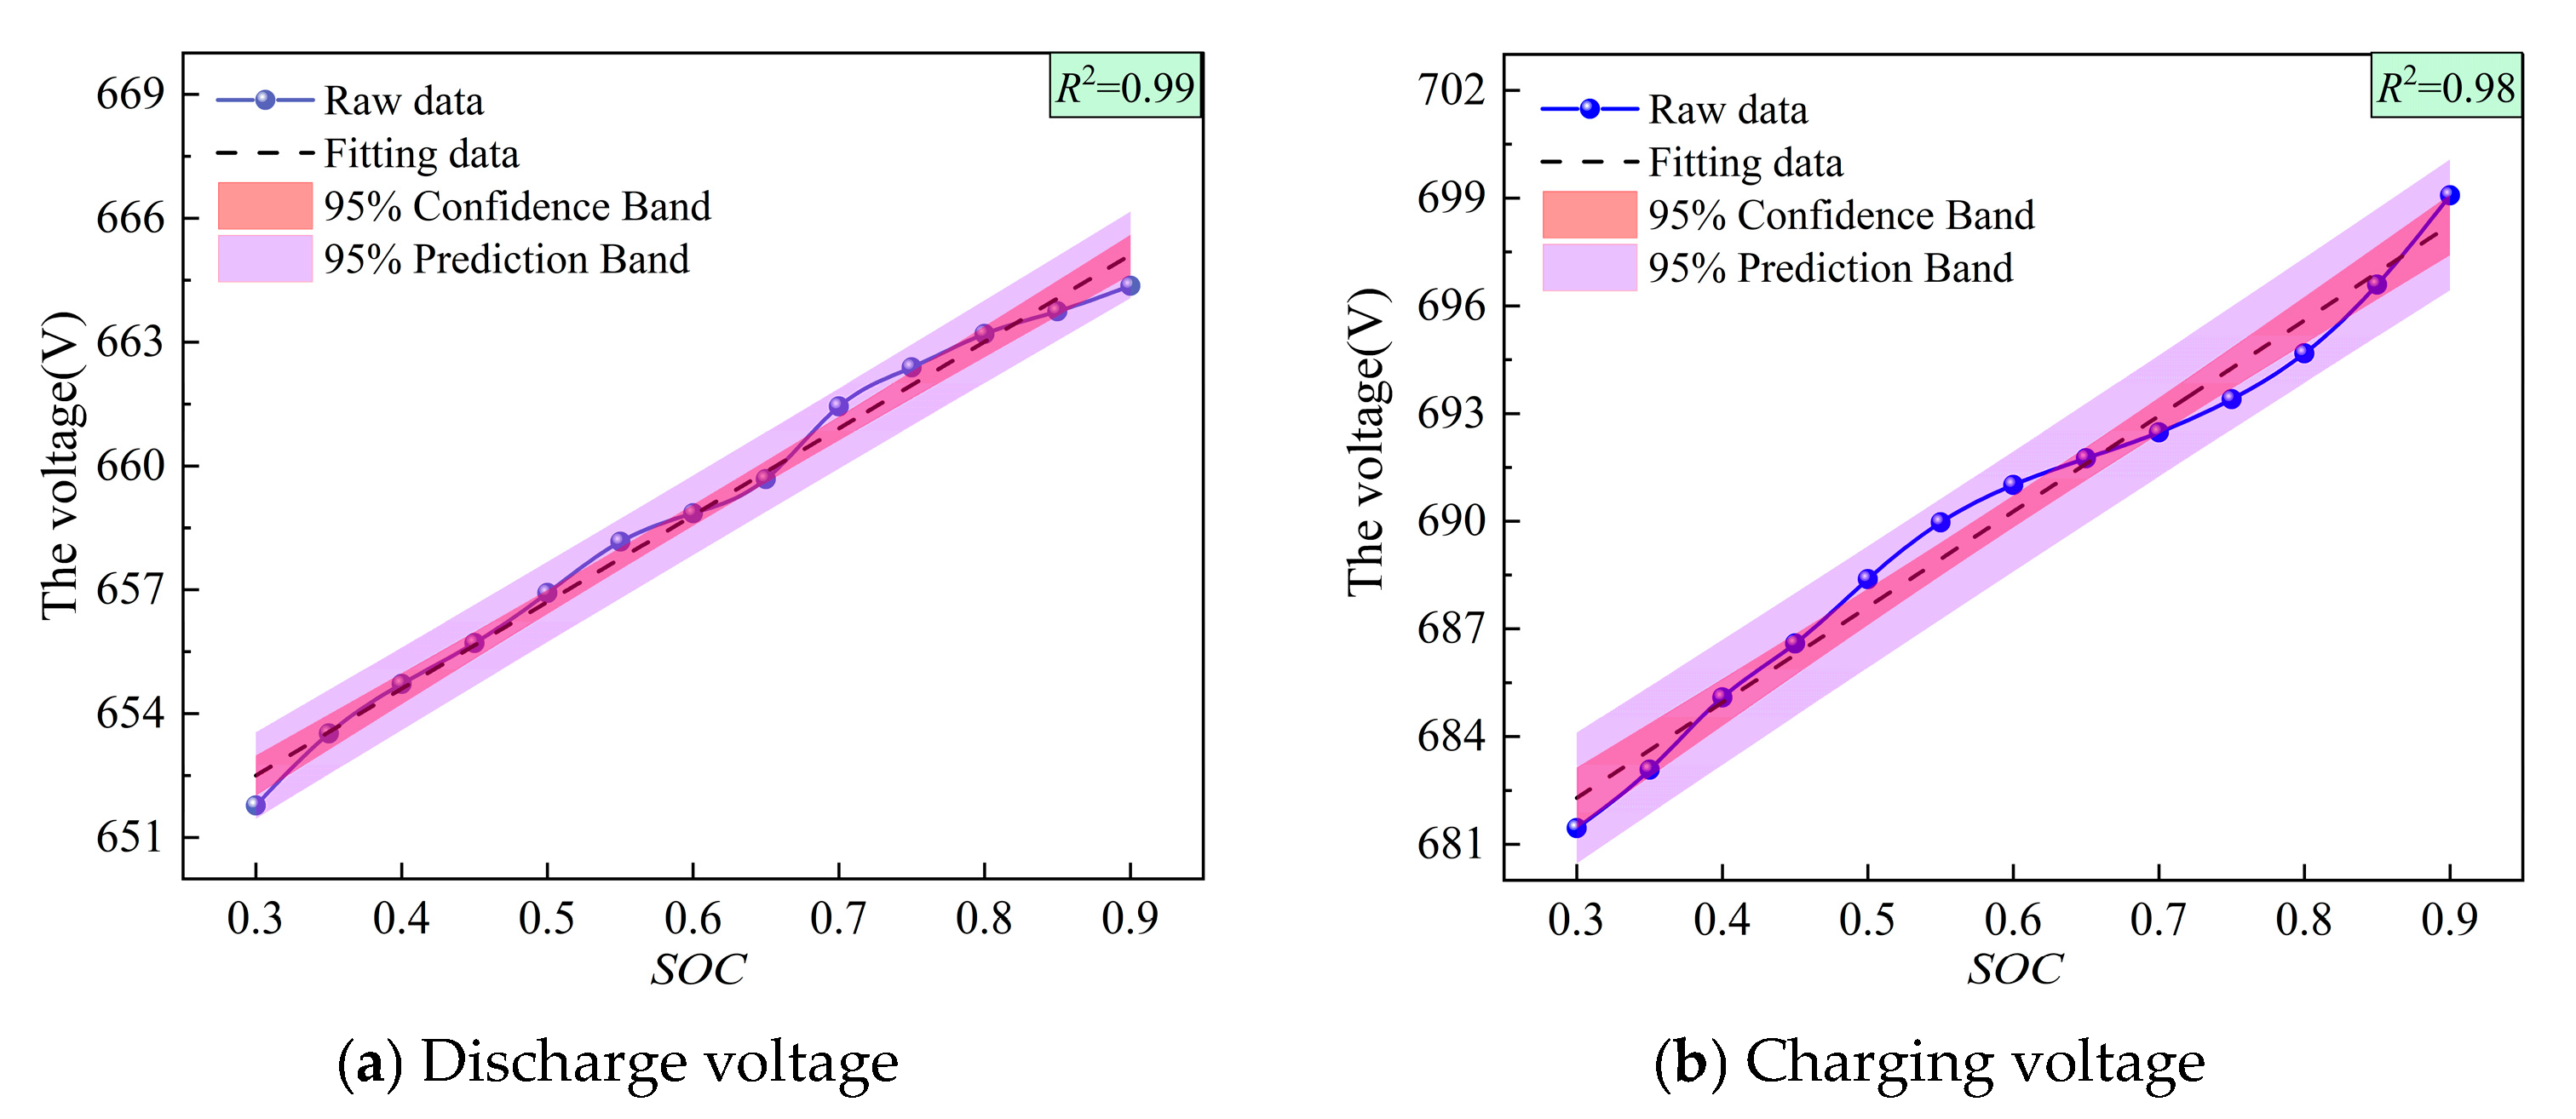
Discharge and charging tests were performed on LiFePO4 batteries at temperatures of 10 °C, 25 °C, and 45 °C to examine the relationship between the SOC and the Ubat [17]. The variation of open-circuit voltage with SOC was recorded, and the results are shown in Figure 9. The relationship between the two was fitted using the least squares method, and the resulting fitting equation is presented in Equation (5). The quality of the fit is illustrated in Figure 10.
U b a t = 21.0107 S O C + 646.2008 i f   discharge   26.5988 S O C + 674.3131 i f   charging

3.2.3. Coupled Power Output

A set-total parameter-based approach is used to establish the coupled dynamics process of multiple power sources [18]. The rotational dynamics behavior of the marine hybrid propulsion system is presented by Equation (6) [17].
2 π 60 d n N G E d t J N G E + J m o t = M N G E + M m o t M l o a d
where J N G E and J m o t are the moment of inertia of the NGE and PMSM, respectively (kg·m2). M l o a d is the load loaded from the outside (N·m).

3.2.4. Linearization of External Characteristic Constraints

To ensure the stable and safe operation of the power source, the operating ranges of the NGE and PMSM are restricted within the outer characteristic envelope (OCE), as shown in Figure 11. The mathematical formulation, which reflects these external characteristic constraints, is given in Equation (7).
0 M N G E M N G E , e x M m o t , e x M m o t M m o t , e x
where M N G E , e x and M m o t , e x are the OCE of the NGE and PMSM, respectively (N·m).
PWARX fitting was applied to the OCE of the NGE and PMSM, yielding fitted curves composed of 7 and 5 straight lines, respectively, as depicted in Figure 12. The red curve illustrates the original machine test data, whereas the blue curve represents the fitted data.
The PWARX-treated NGE and PMSM external characteristic torque expressions are presented in Equations (A4) and (A5).
The MGHPS is compiled using the sub-models outlined in Section 3.2.1, Section 3.2.2, Section 3.2.3 and Section 3.2.4 through the HYSDEL 2.0.5 software, with the results provided in Equation (8).
x k + 1 = A x k + B 1 u k + B 2 δ k y k = C x k E 2 δ k + E 3 z k E 4 x k + E 1 u k + E 5
where the state variables x are gas consumption, NOx + HC emissions, state of charge SOC, and NGE and PMSM speeds; the control variables u are NGE torque and PMSM torque.

3.3. Cumulative Error Analysis of Hybrid Model

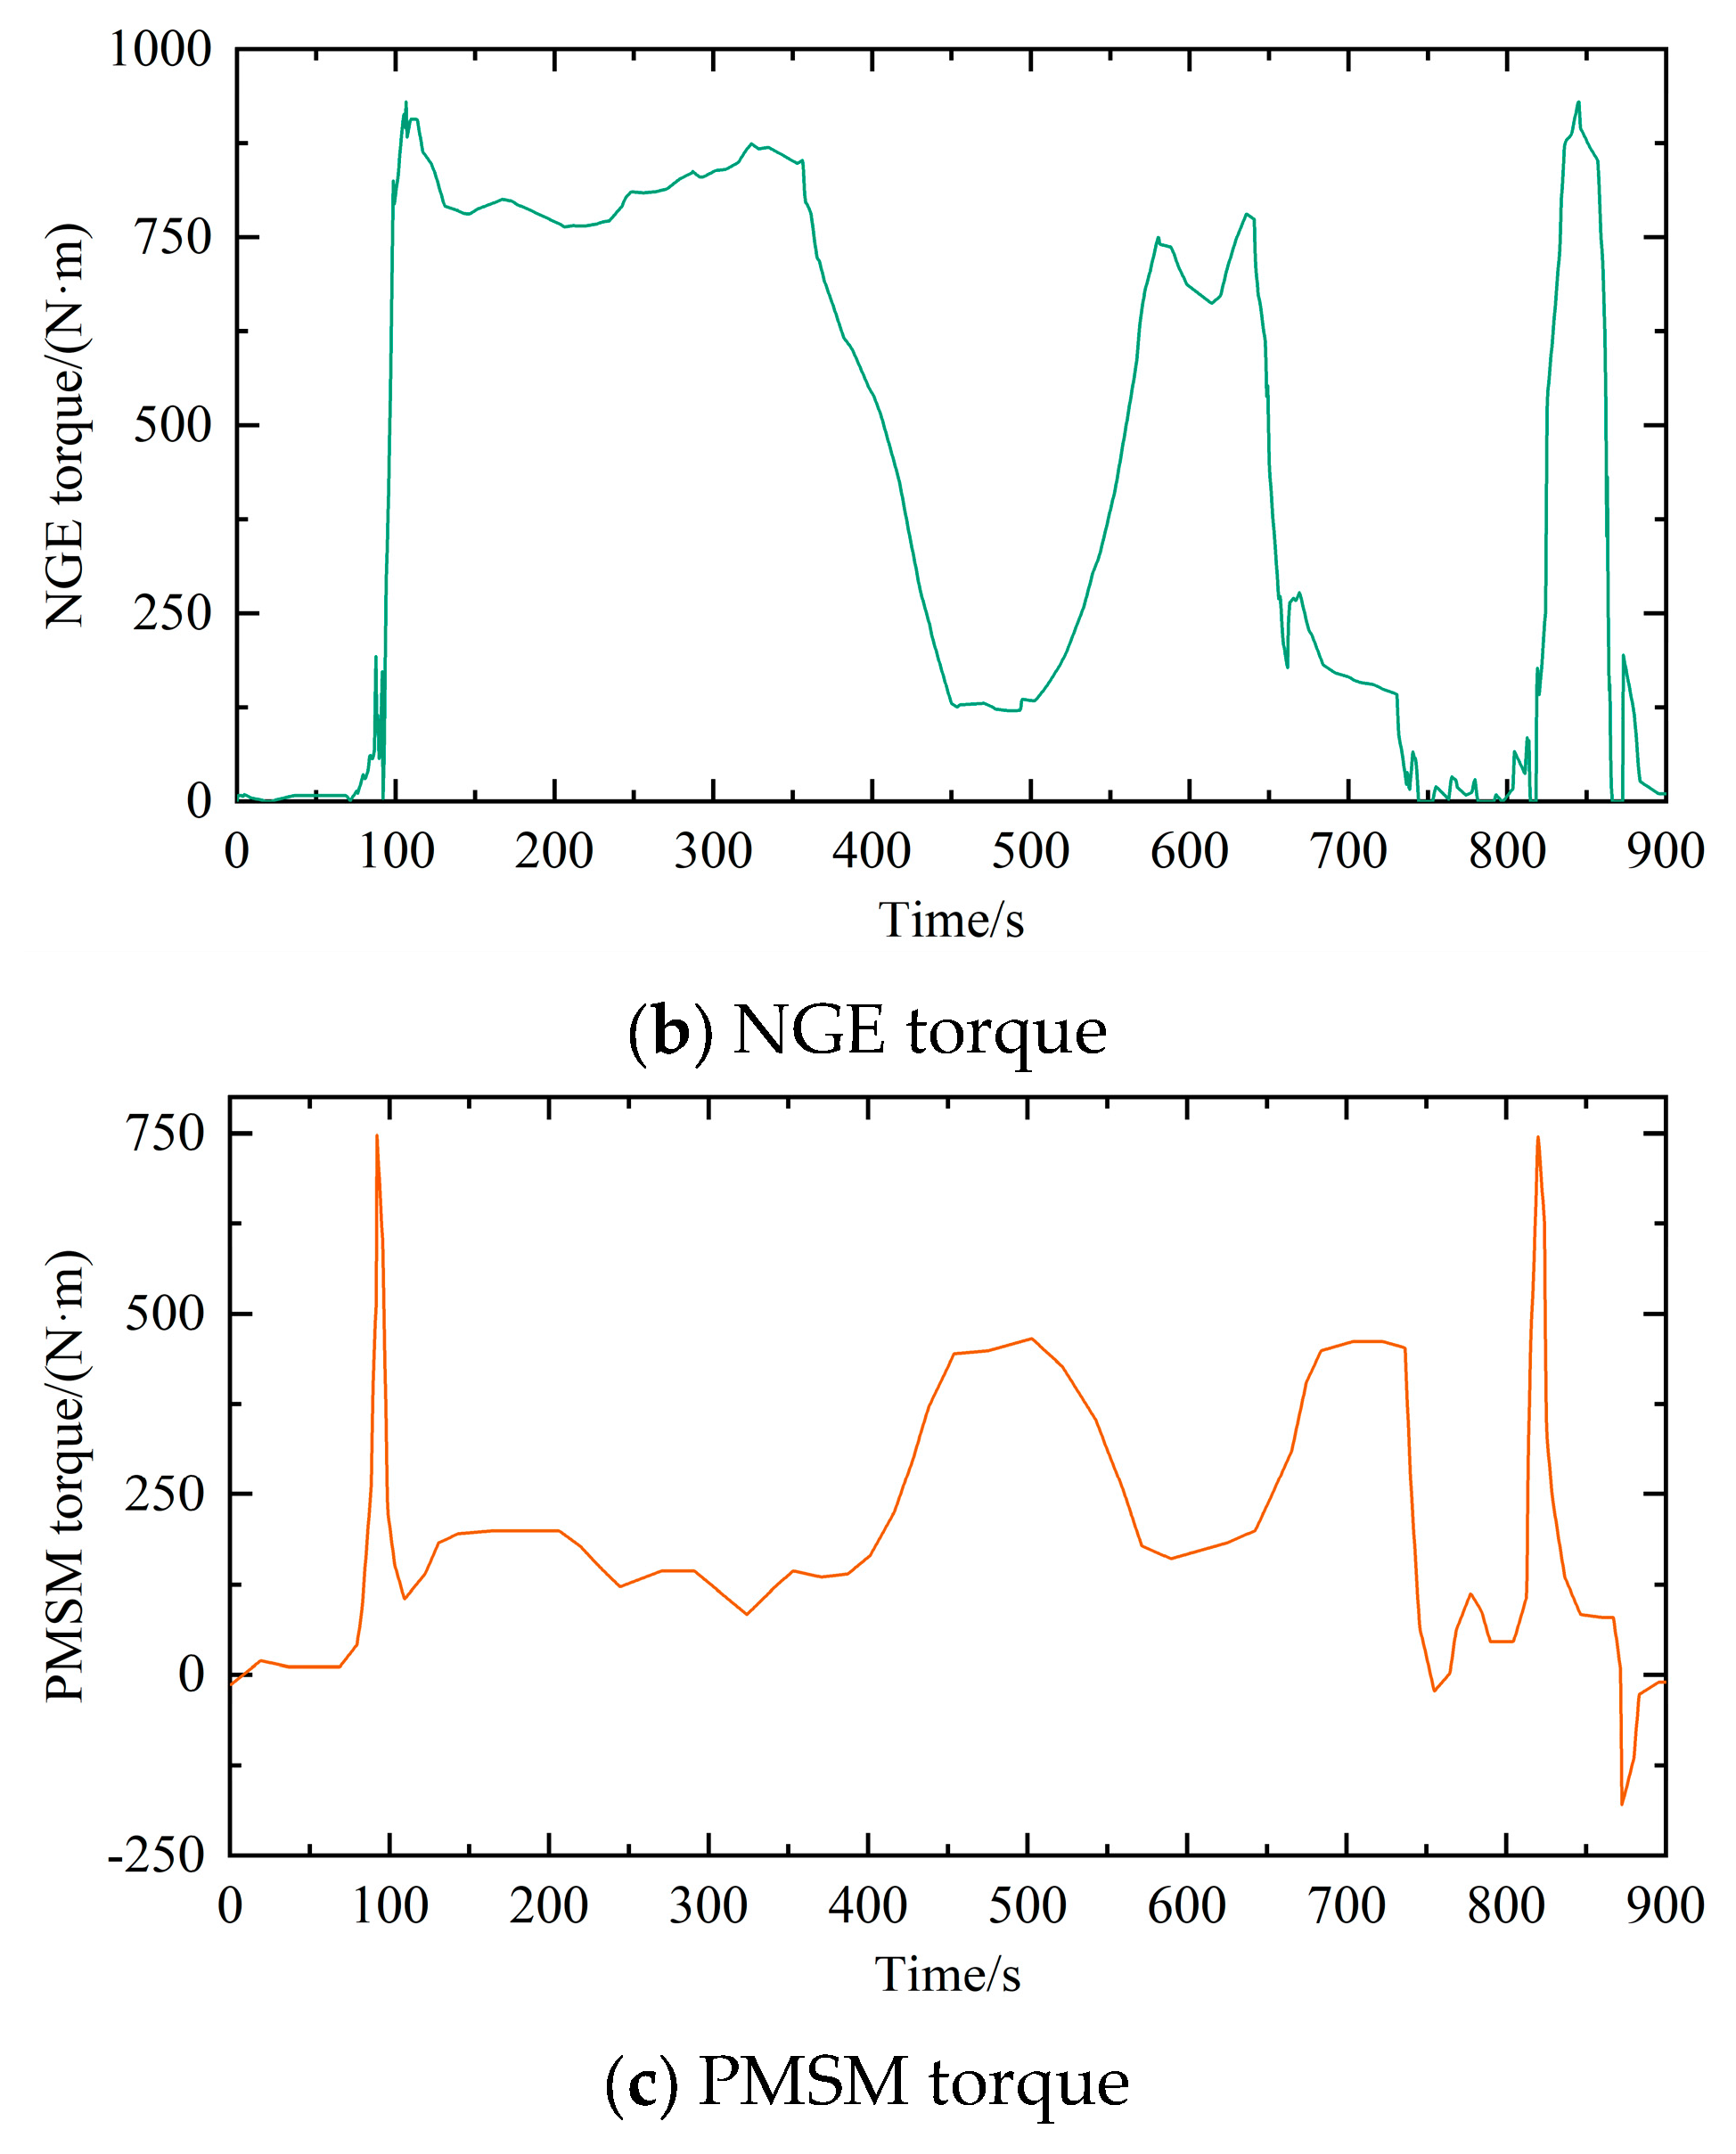
To address the shortcoming in Section 3.2, which only lists the MSE values of each submodel without discussing the error propagation issues during system integration, this research adopts a system-level perspective to evaluate error transmission and accumulation. Using model simulations and real-world experimental comparisons, it systematically analyzes the propagation paths and cumulative effects of submodel errors within a multi-module series architecture. The analysis is conducted under defined input conditions, including rotational speed, NGE torque, and PMSM torque, as illustrated in Figure 13.
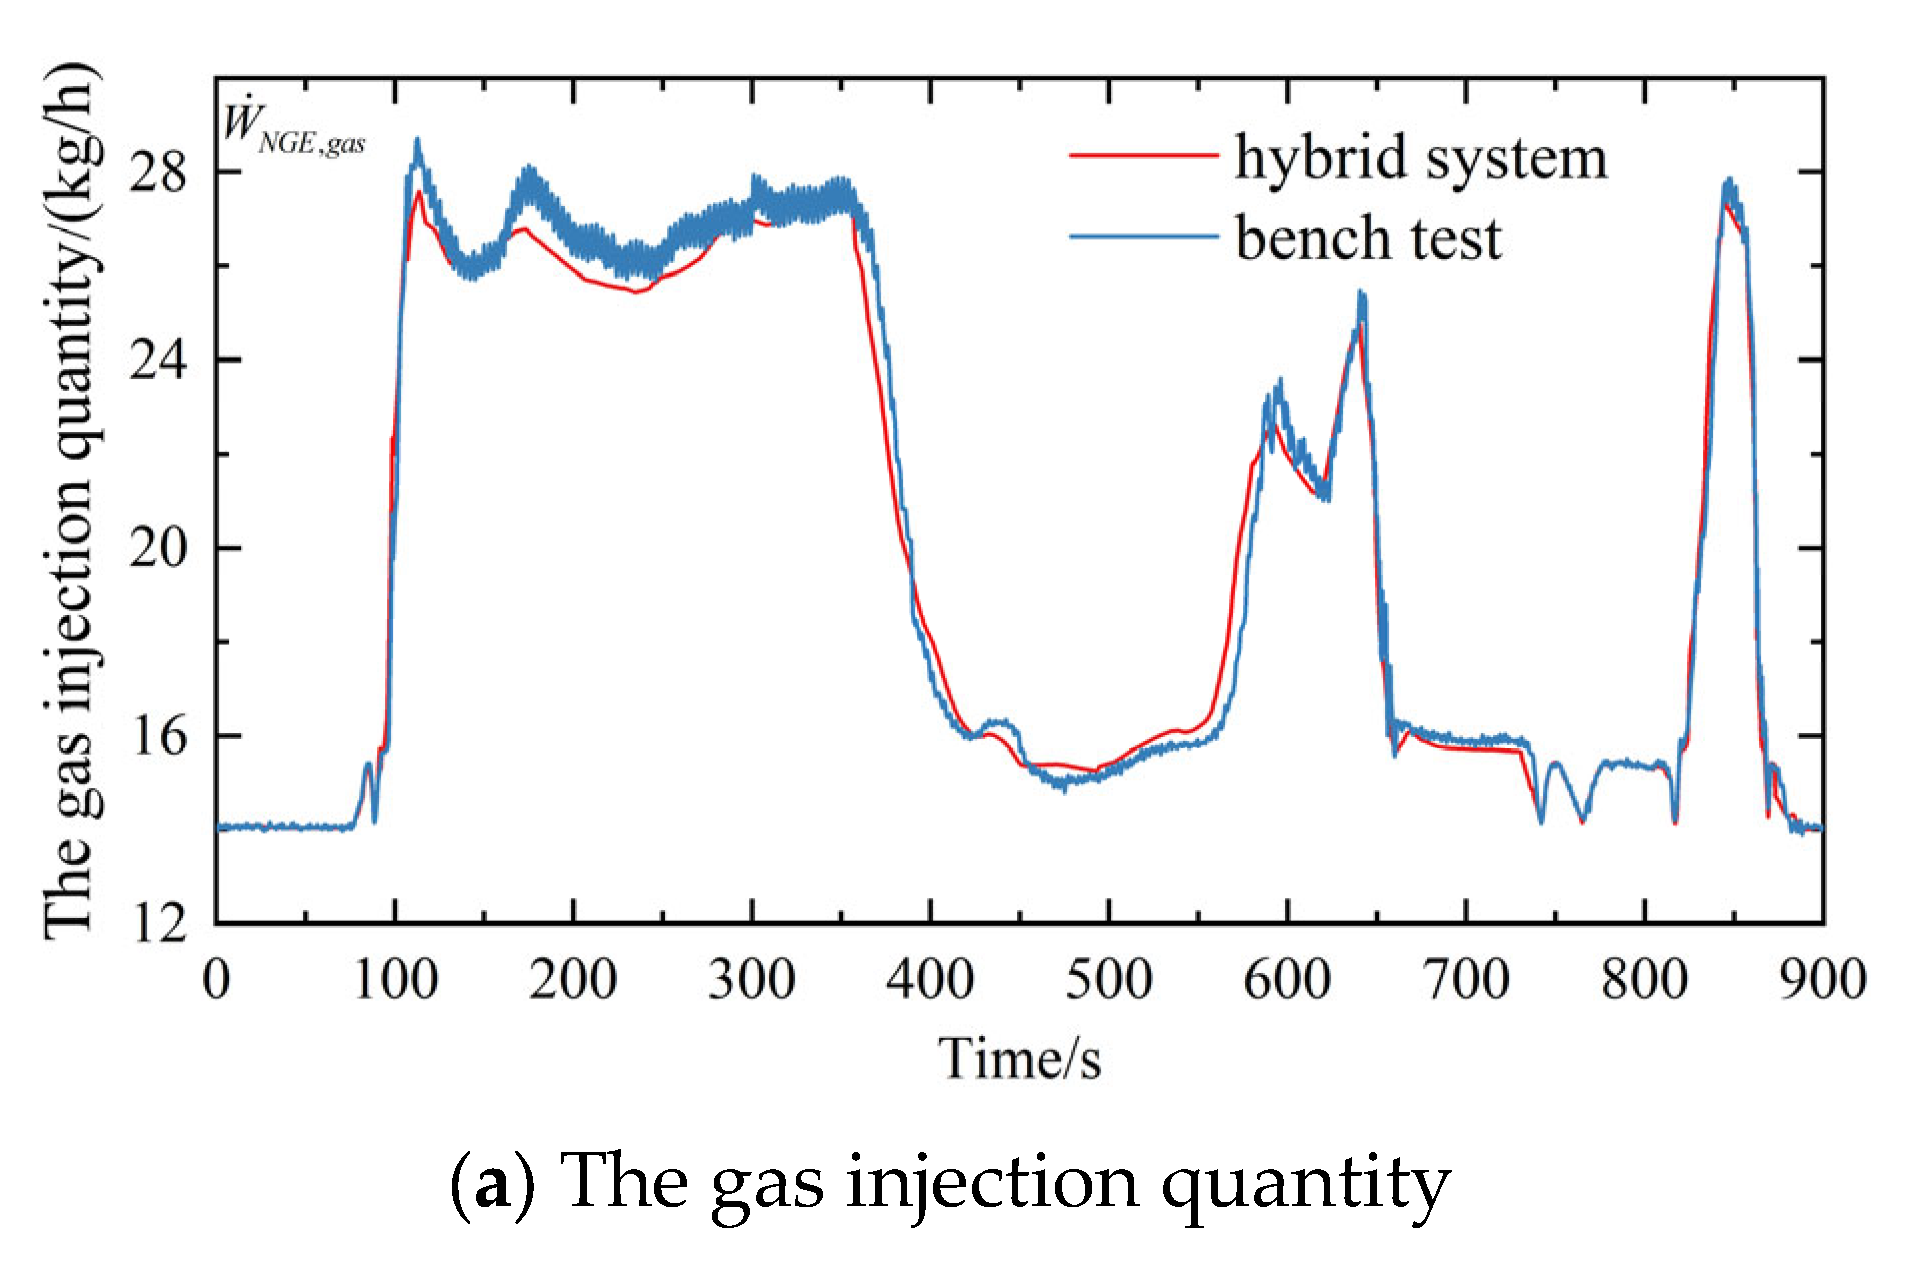
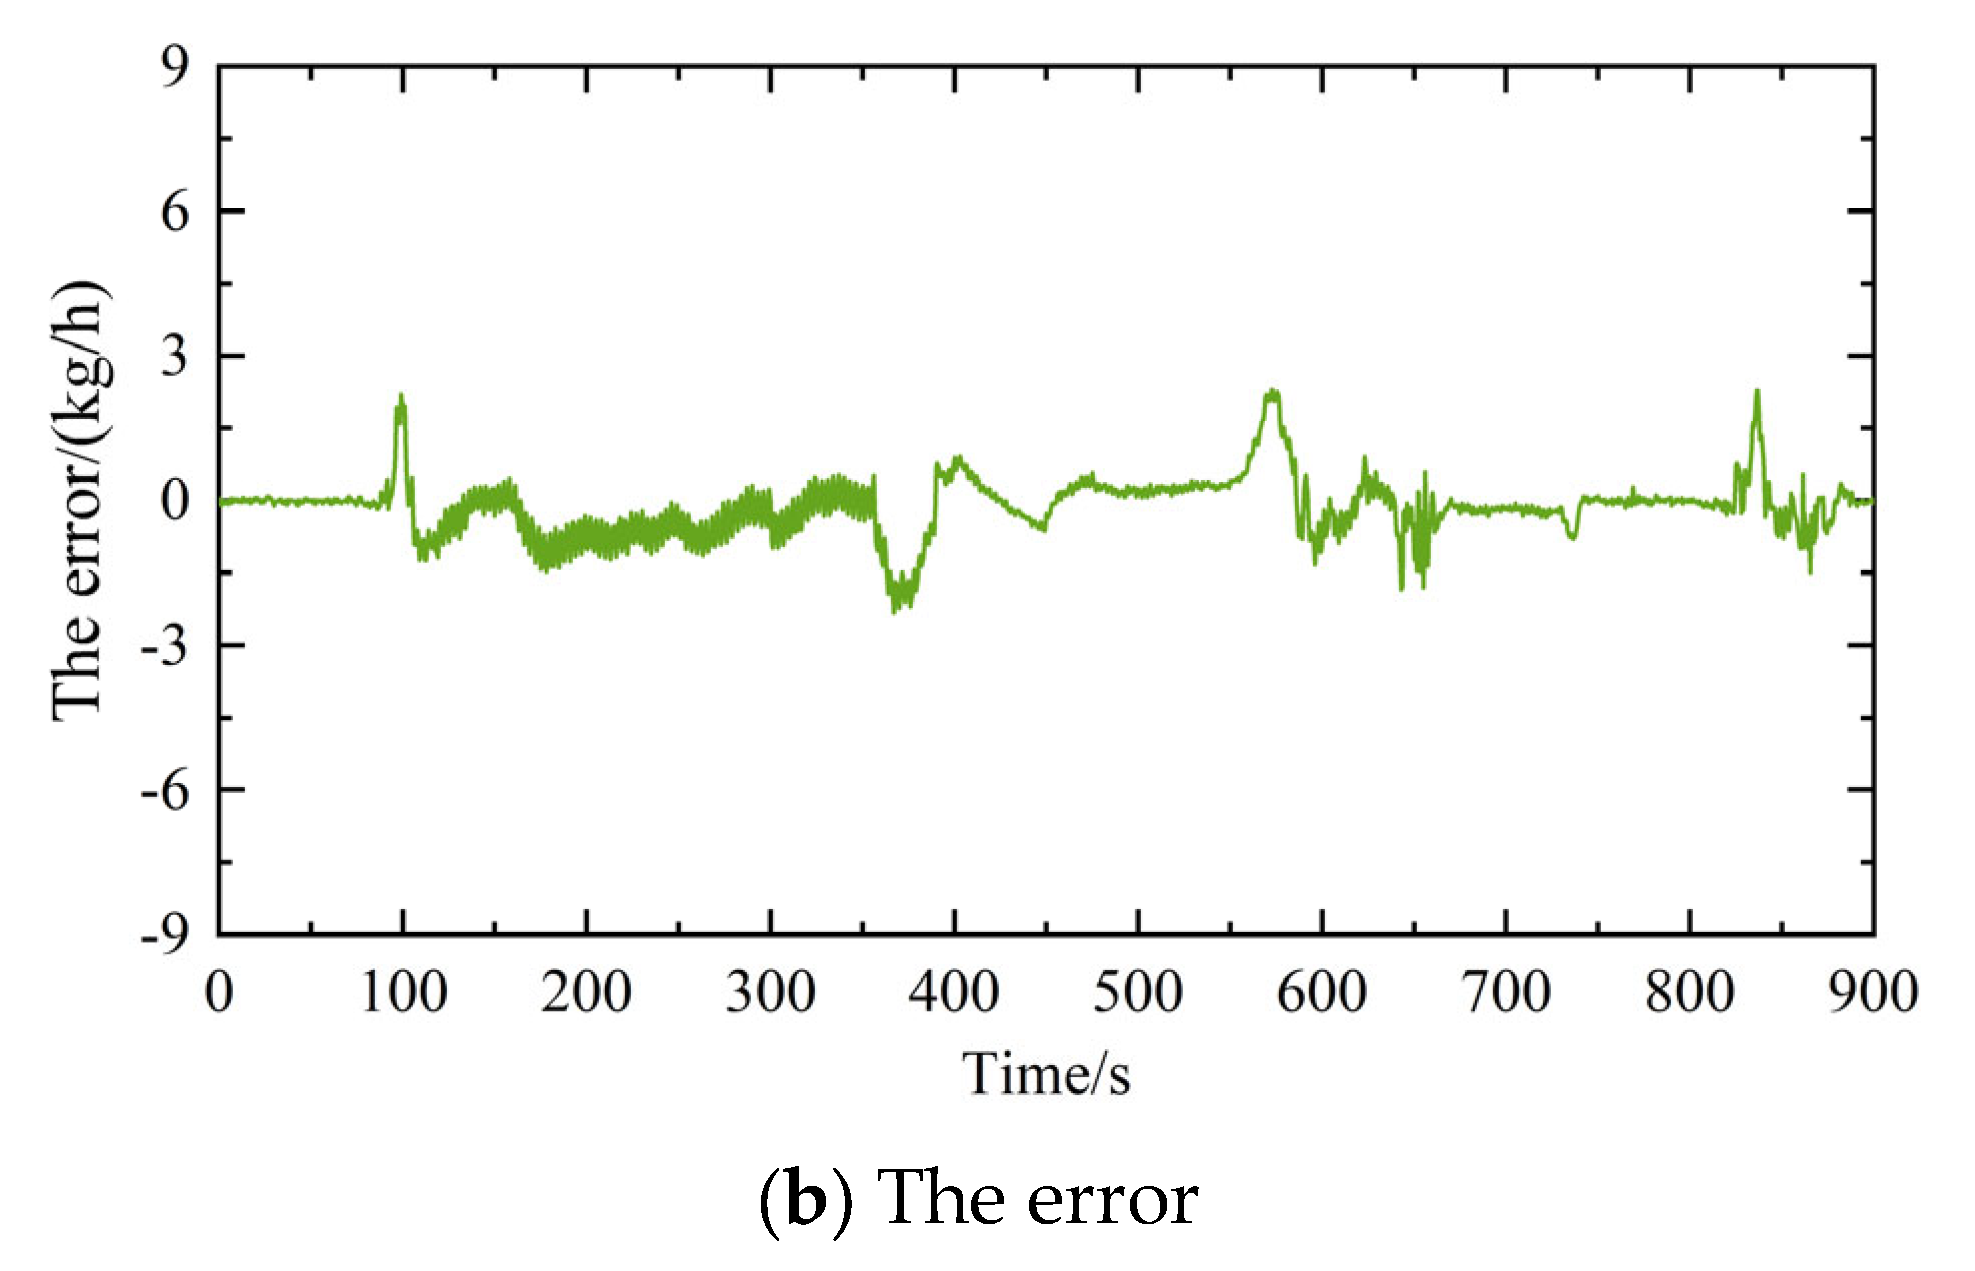
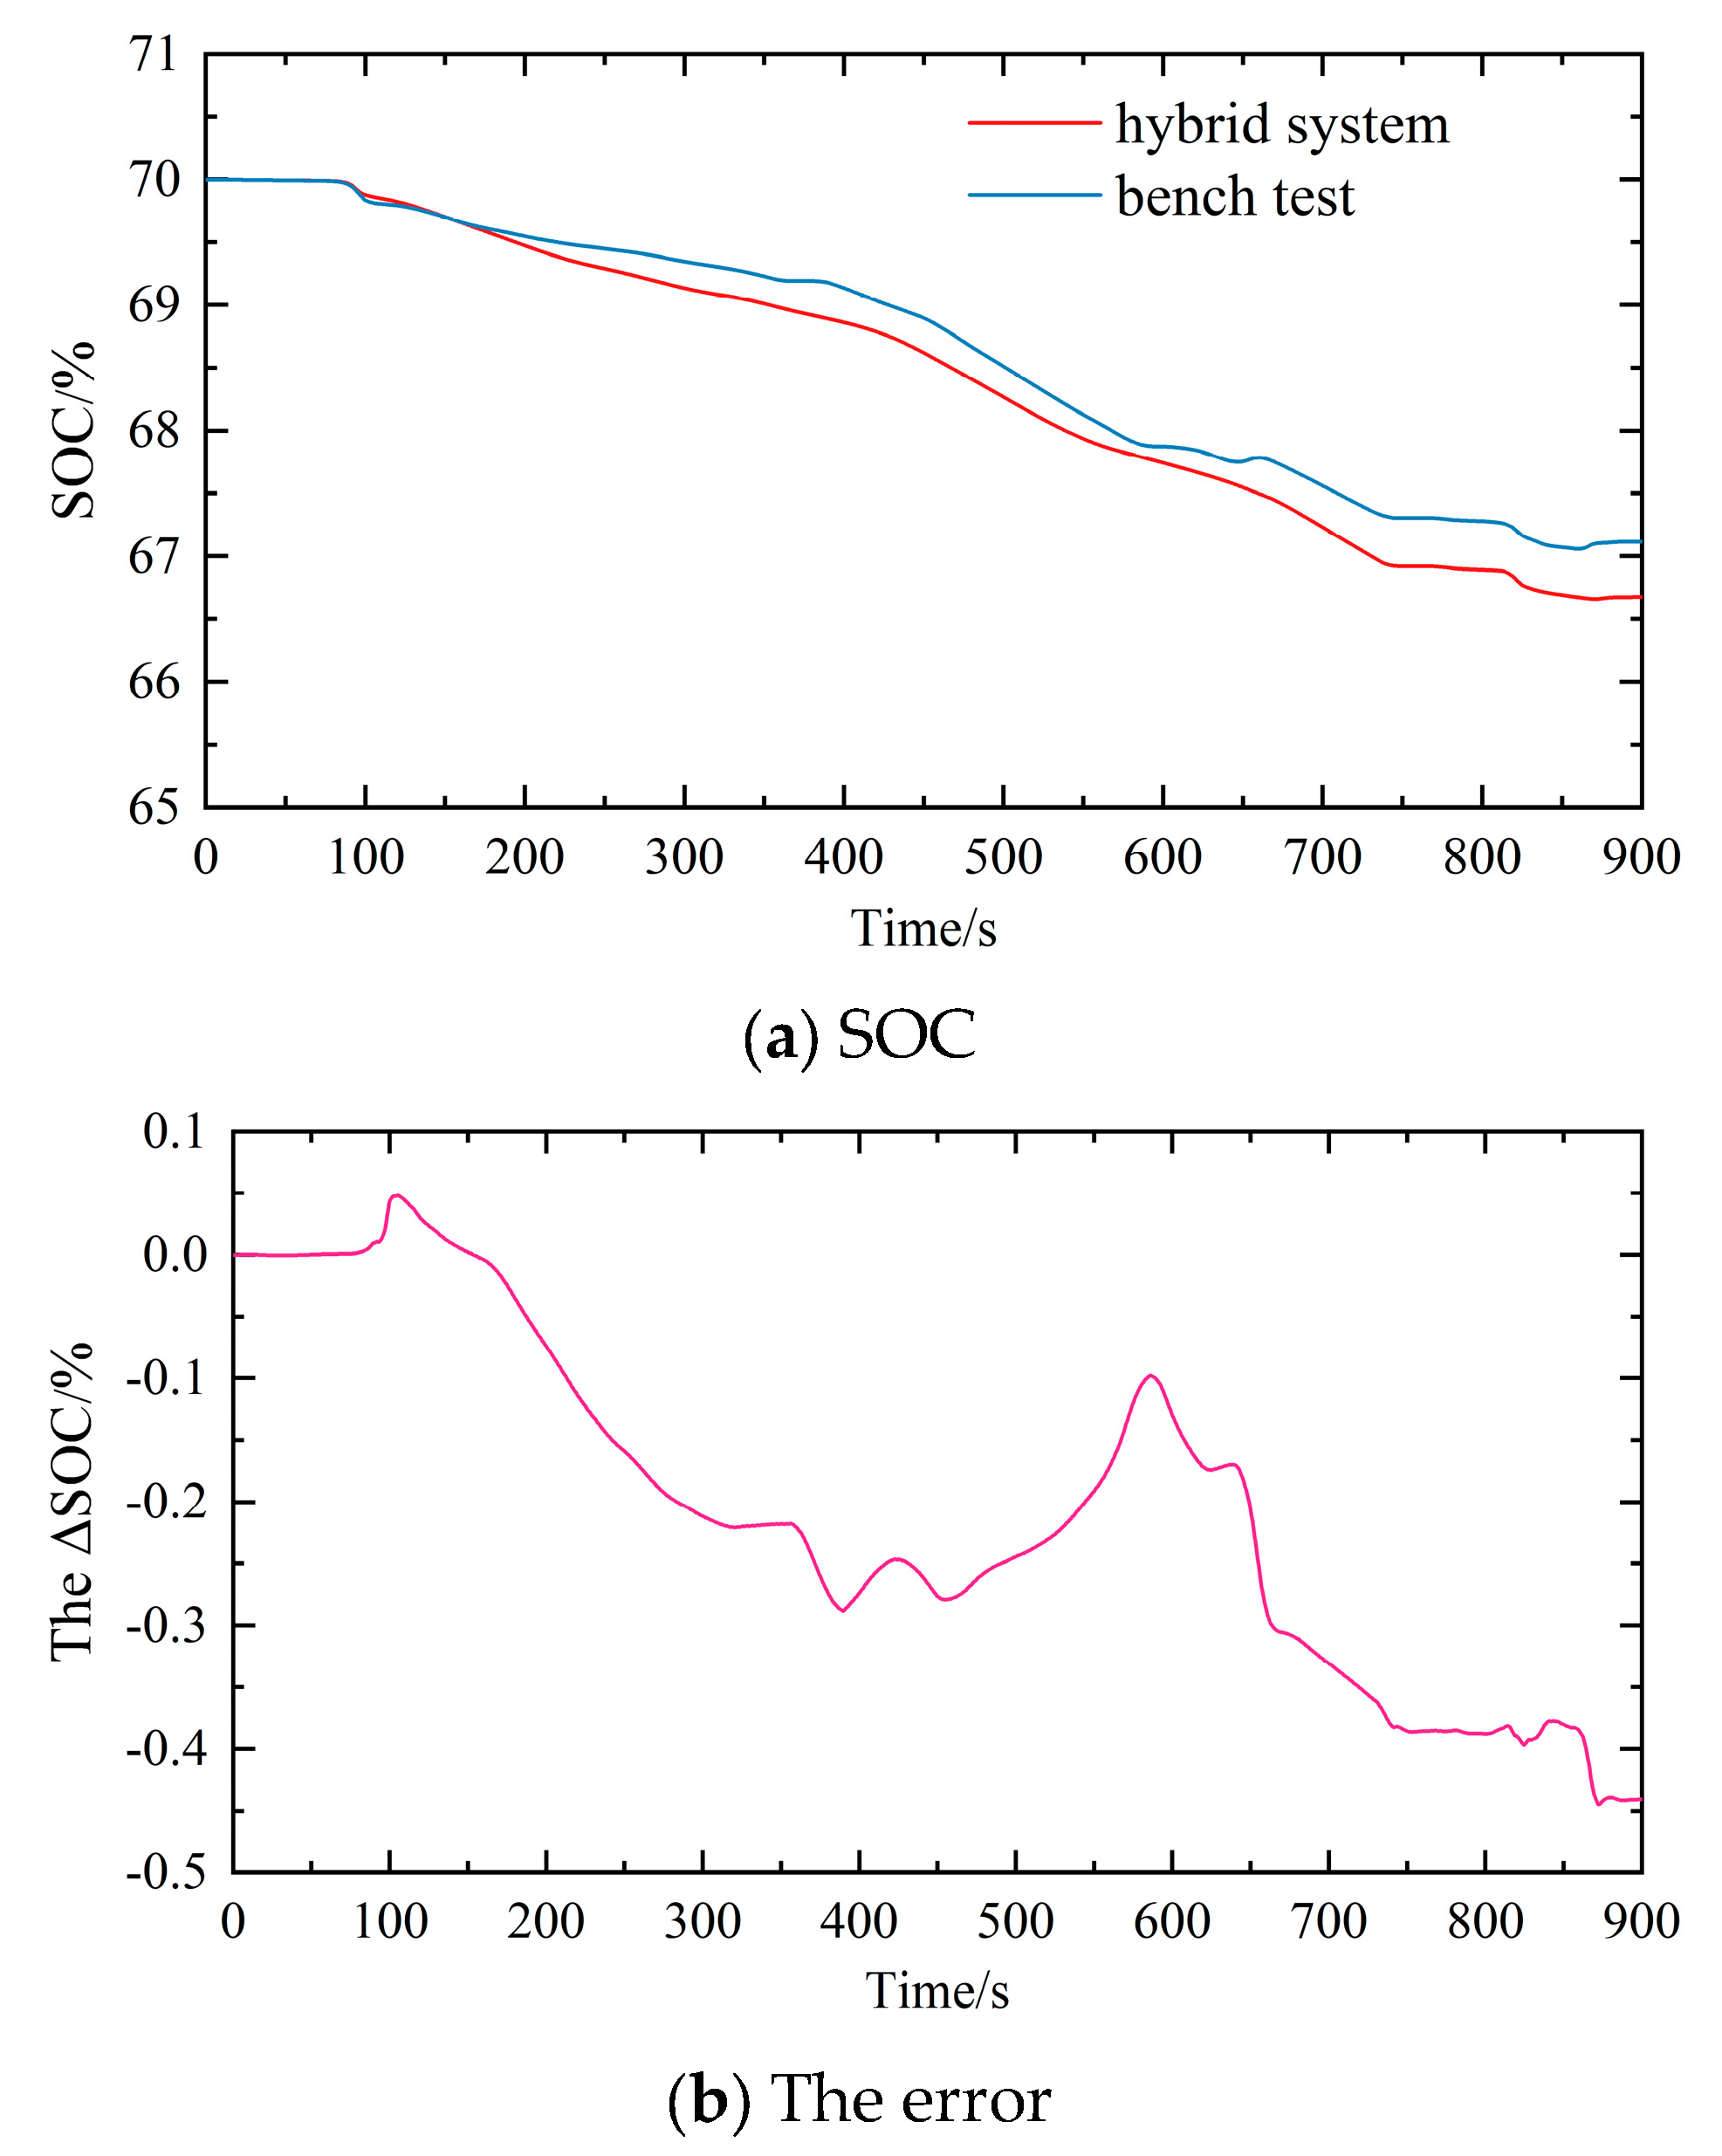
To verify the actual impact of error propagation on system output performance under a given input condition, a combination of experimental and simulation methods was employed to obtain comparative data for fuel injection volume and battery state of charge (SOC), as shown in Figure 14 and Figure 15. As illustrated in Figure 14, the fuel injection volume test results and the hybrid system model exhibit the same fluctuation patterns, indicating that the model has good fitting capability for the engine’s dynamic behavior. To quantify the deviation more clearly, the mean squared error (MSE) was calculated based on the data in Figure 14b, yielding a result of 0.3763. The distribution of experimental and simulated results for SOC is shown in Figure 15a. The overall variation patterns are consistent, which demonstrates that the model can accurately reflect the dynamic charging and discharging process of the battery. Correspondingly, the MSE for SOC was calculated from Figure 15b, yielding a value of 0.0072. These findings collectively demonstrate that, under the implemented control strategy, the discrepancies between simulation and experimental results for key variables are small, and the cumulative error propagation remains within an acceptable range, thereby meeting the requirements for engineering applications.

3.4. Energy Management Allocation Based on Hybrid Control

The energy management strategy for the MGHPS is designed to reduce the gas consumption rate and emissions of the NGE by controlling the torque distribution between the NGE and PMSM, while also ensuring that the actual operating speed consistently aligns with the desired speed. As a result, the torques of the NGE and PMSM are selected as the control variables for the predictive control of the hybrid system. The state variables of the system include the gas consumption rate, NGE emissions, ship speed, and battery state of charge (SOC), with these state variables representing the system’s outputs. Thus, the optimization problem for energy management allocation in the MGHPS is formulated as shown in Equation (9).
min u J = k = 1 N Q N G E , g a s ( W ˙ N G E , g a s ) p + k = 1 N Q N O x + H C ( W ˙ N O x + H C ) p + k = 1 N Q S O C ( S O C 0.6 ) p + k = 1 N Q s p d ( n N G E n r e f , S p d ) p s . t . x k + 1 = A x k + B 1 u k + B 2 δ k y k = C x k E 2 δ k + E 3 z k E 4 x k + E 1 u k + E 5 0 M N G E M N G E , e x                                       i = 1 , 2 , , N 1 M m o t , e x M m o t M m o t , e x                   i = 1 , 2 , , N 1 S O C min S O C S O C max                     i = 1 , 2 , , N 1
where Q N G E , g a s , Q N O x + H C , Q S O C , and Q s p d are the weights of gas consumption rate, emissions, battery SOC deviation, and NGE speed deviation, respectively. n r e f , S p d tracks the rotational speed (r/min), and 0.6 is the battery SOC level.

4. Results and Discussion

4.1. Experimental Scheme

To comprehensively validate the effectiveness and feasibility of the proposed HMPC algorithm in terms of economy and power performance, a rule-based energy management strategy (RB-EMS) was introduced as a control in the comparative analysis. RB-EMS determines the current operating mode based on predefined logical boundary conditions and the operating conditions of the hybrid power system at different times and allocates the output torque of the NGE and PMSM accordingly, as shown in Table 5. Under the premise of ensuring system stability, the corresponding torque allocation is executed. The RB method has the characteristics of simple calculation and rapid response, providing an effective reference for comparing the performance of the HMPC algorithm.
The table encompasses the following parameters: P d m d denotes the system’s power demand (kW). P e , max signifies the external characteristic power of the NGE (kW). P m , max represents the maximum output power of the PMSM (kW). S O C l o w and S O C h i g h denote the lower and upper SOC boundaries for the various operating modes within the energy storage system. The RB-EMS logic block diagram is illustrated in Figure 16.
In this study, the marine operating conditions derived from the literature [19] are employed to validate the hybrid model of the MGHPS. The corresponding test conditions, including the propulsion speed and torque profiles over time, are illustrated in Figure 17.
The contrasting model predictive controller was tested using three different weight configuration schemes, which are presented in Table 6.
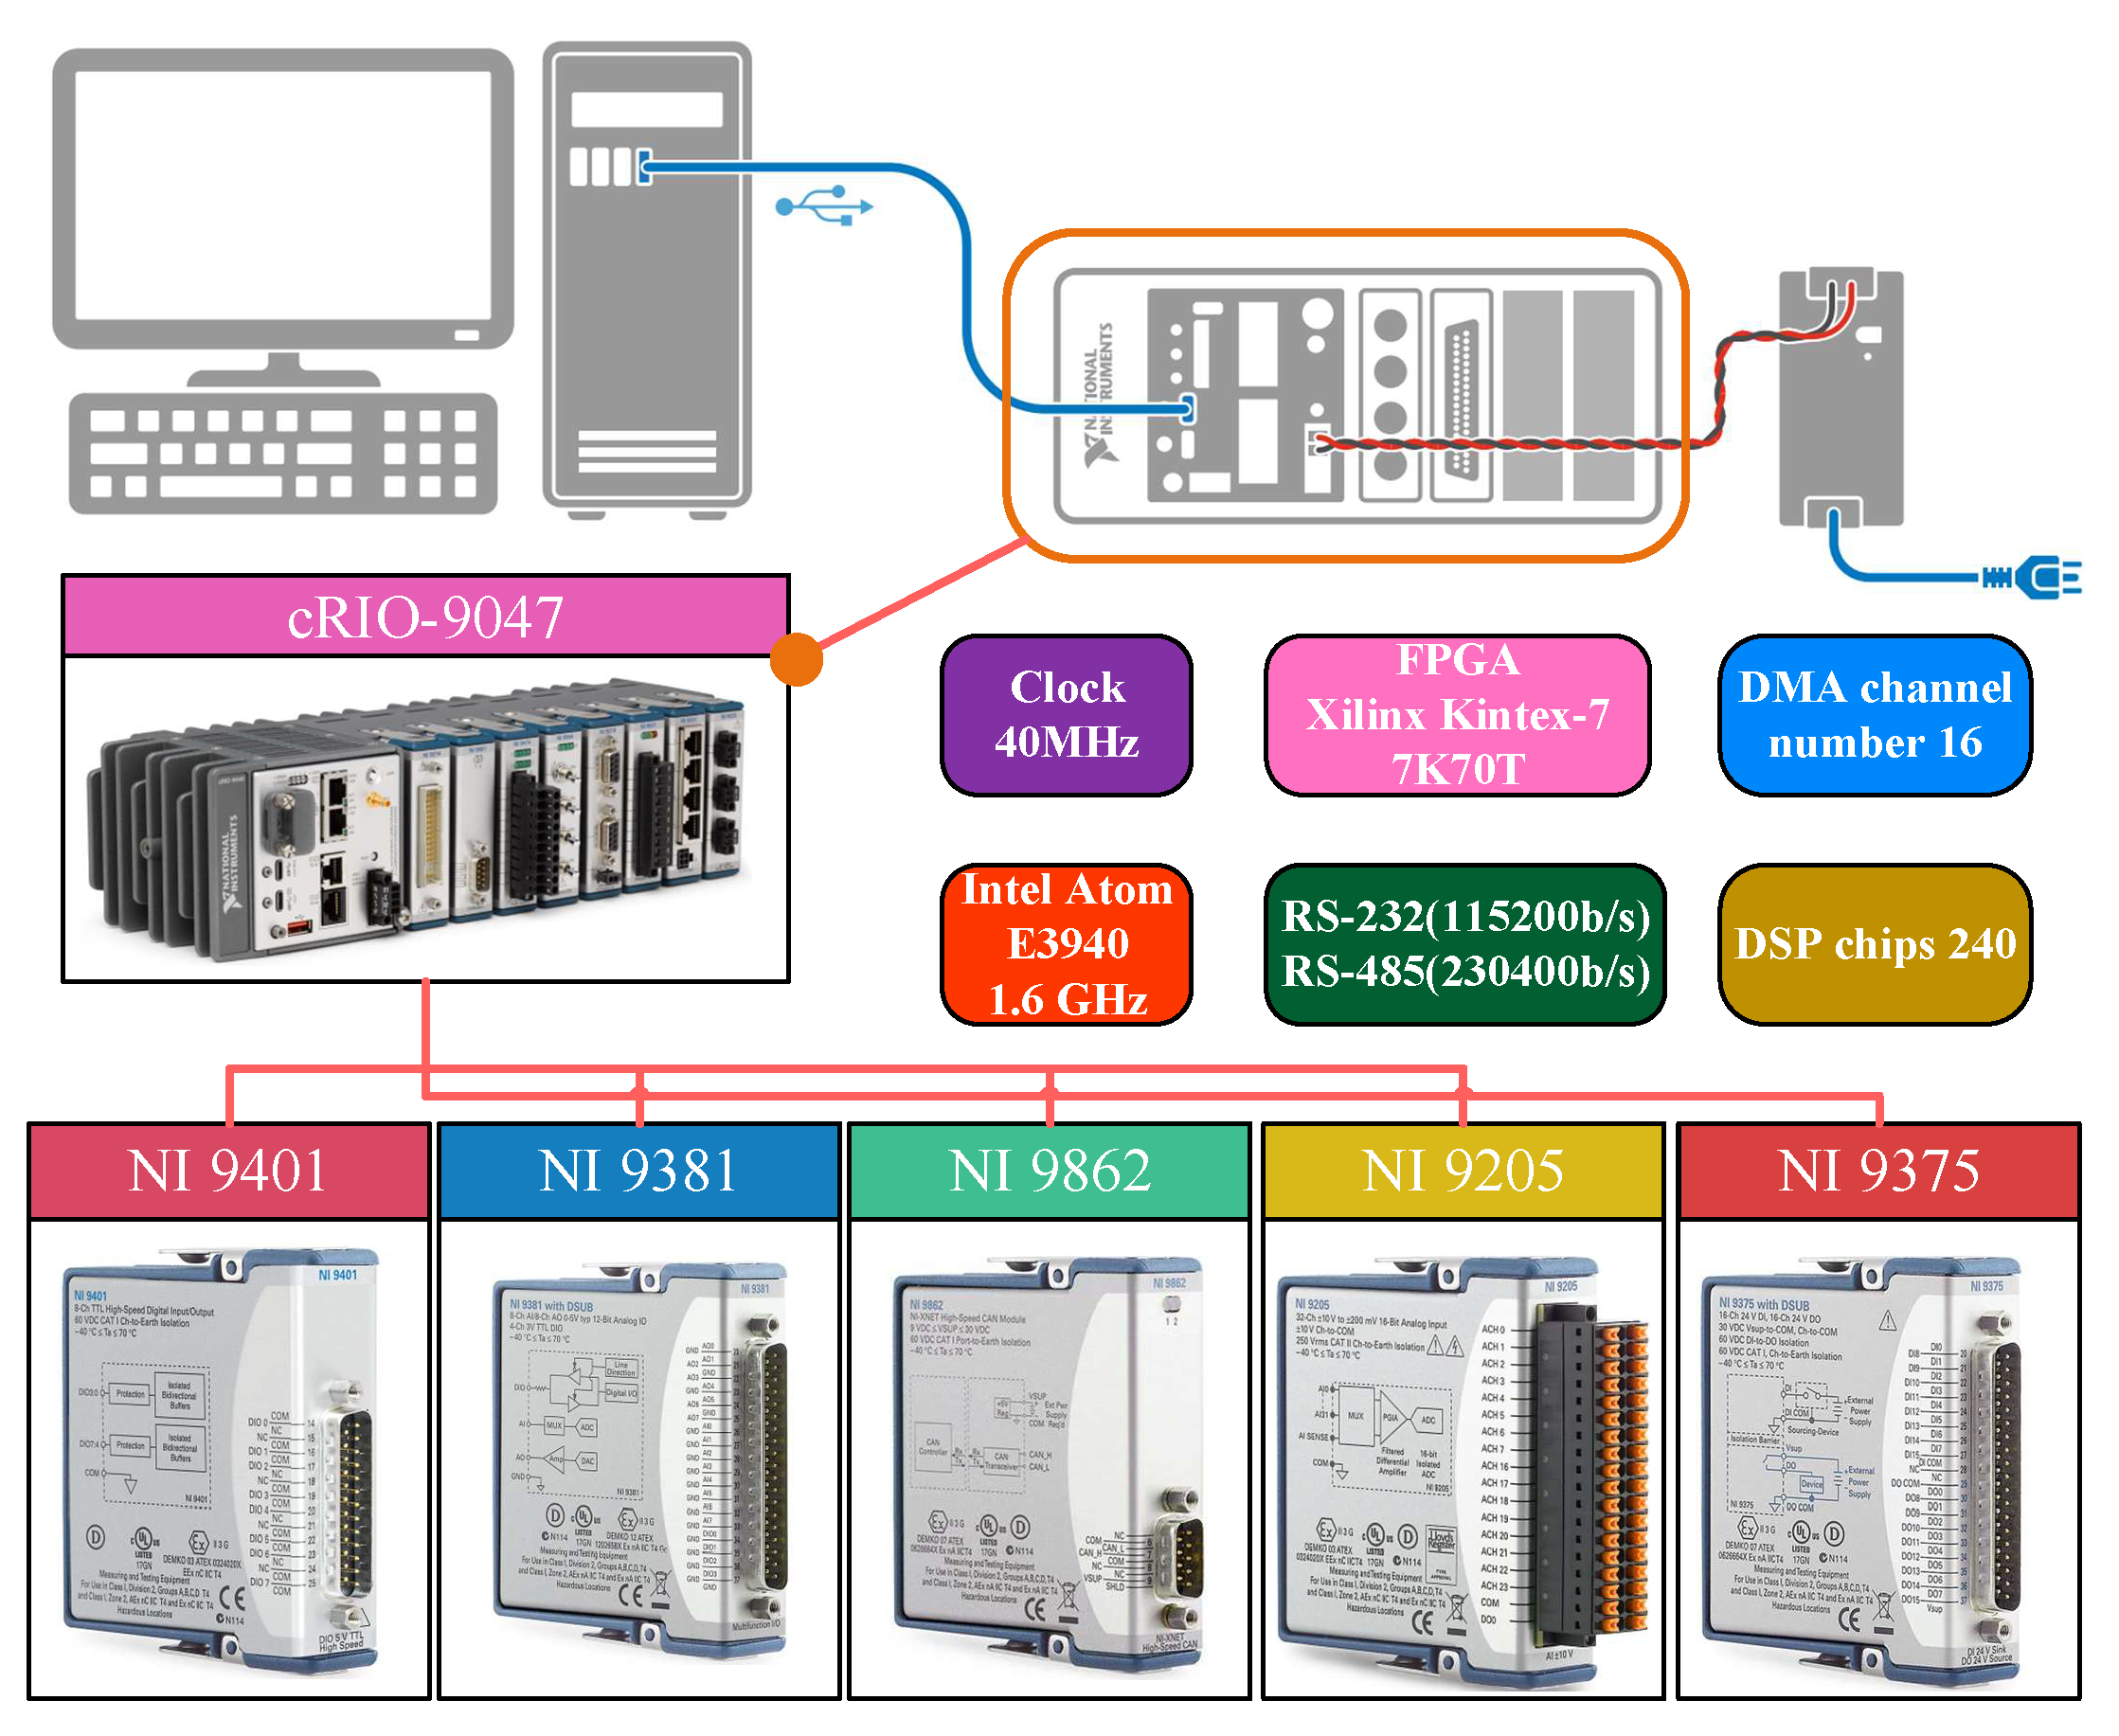
NI CompactRIO (cRIO-9047) was selected for the real-time deployment of the energy management strategy. It features an integrated embedded real-time (RT) controller, a Field Programmable Gate Array (FPGA), and reconfigurable I/O modules, which together provide high-performance capabilities for real-time data acquisition, signal processing, and control tasks. The specific configuration and basic components are illustrated in Figure 18.
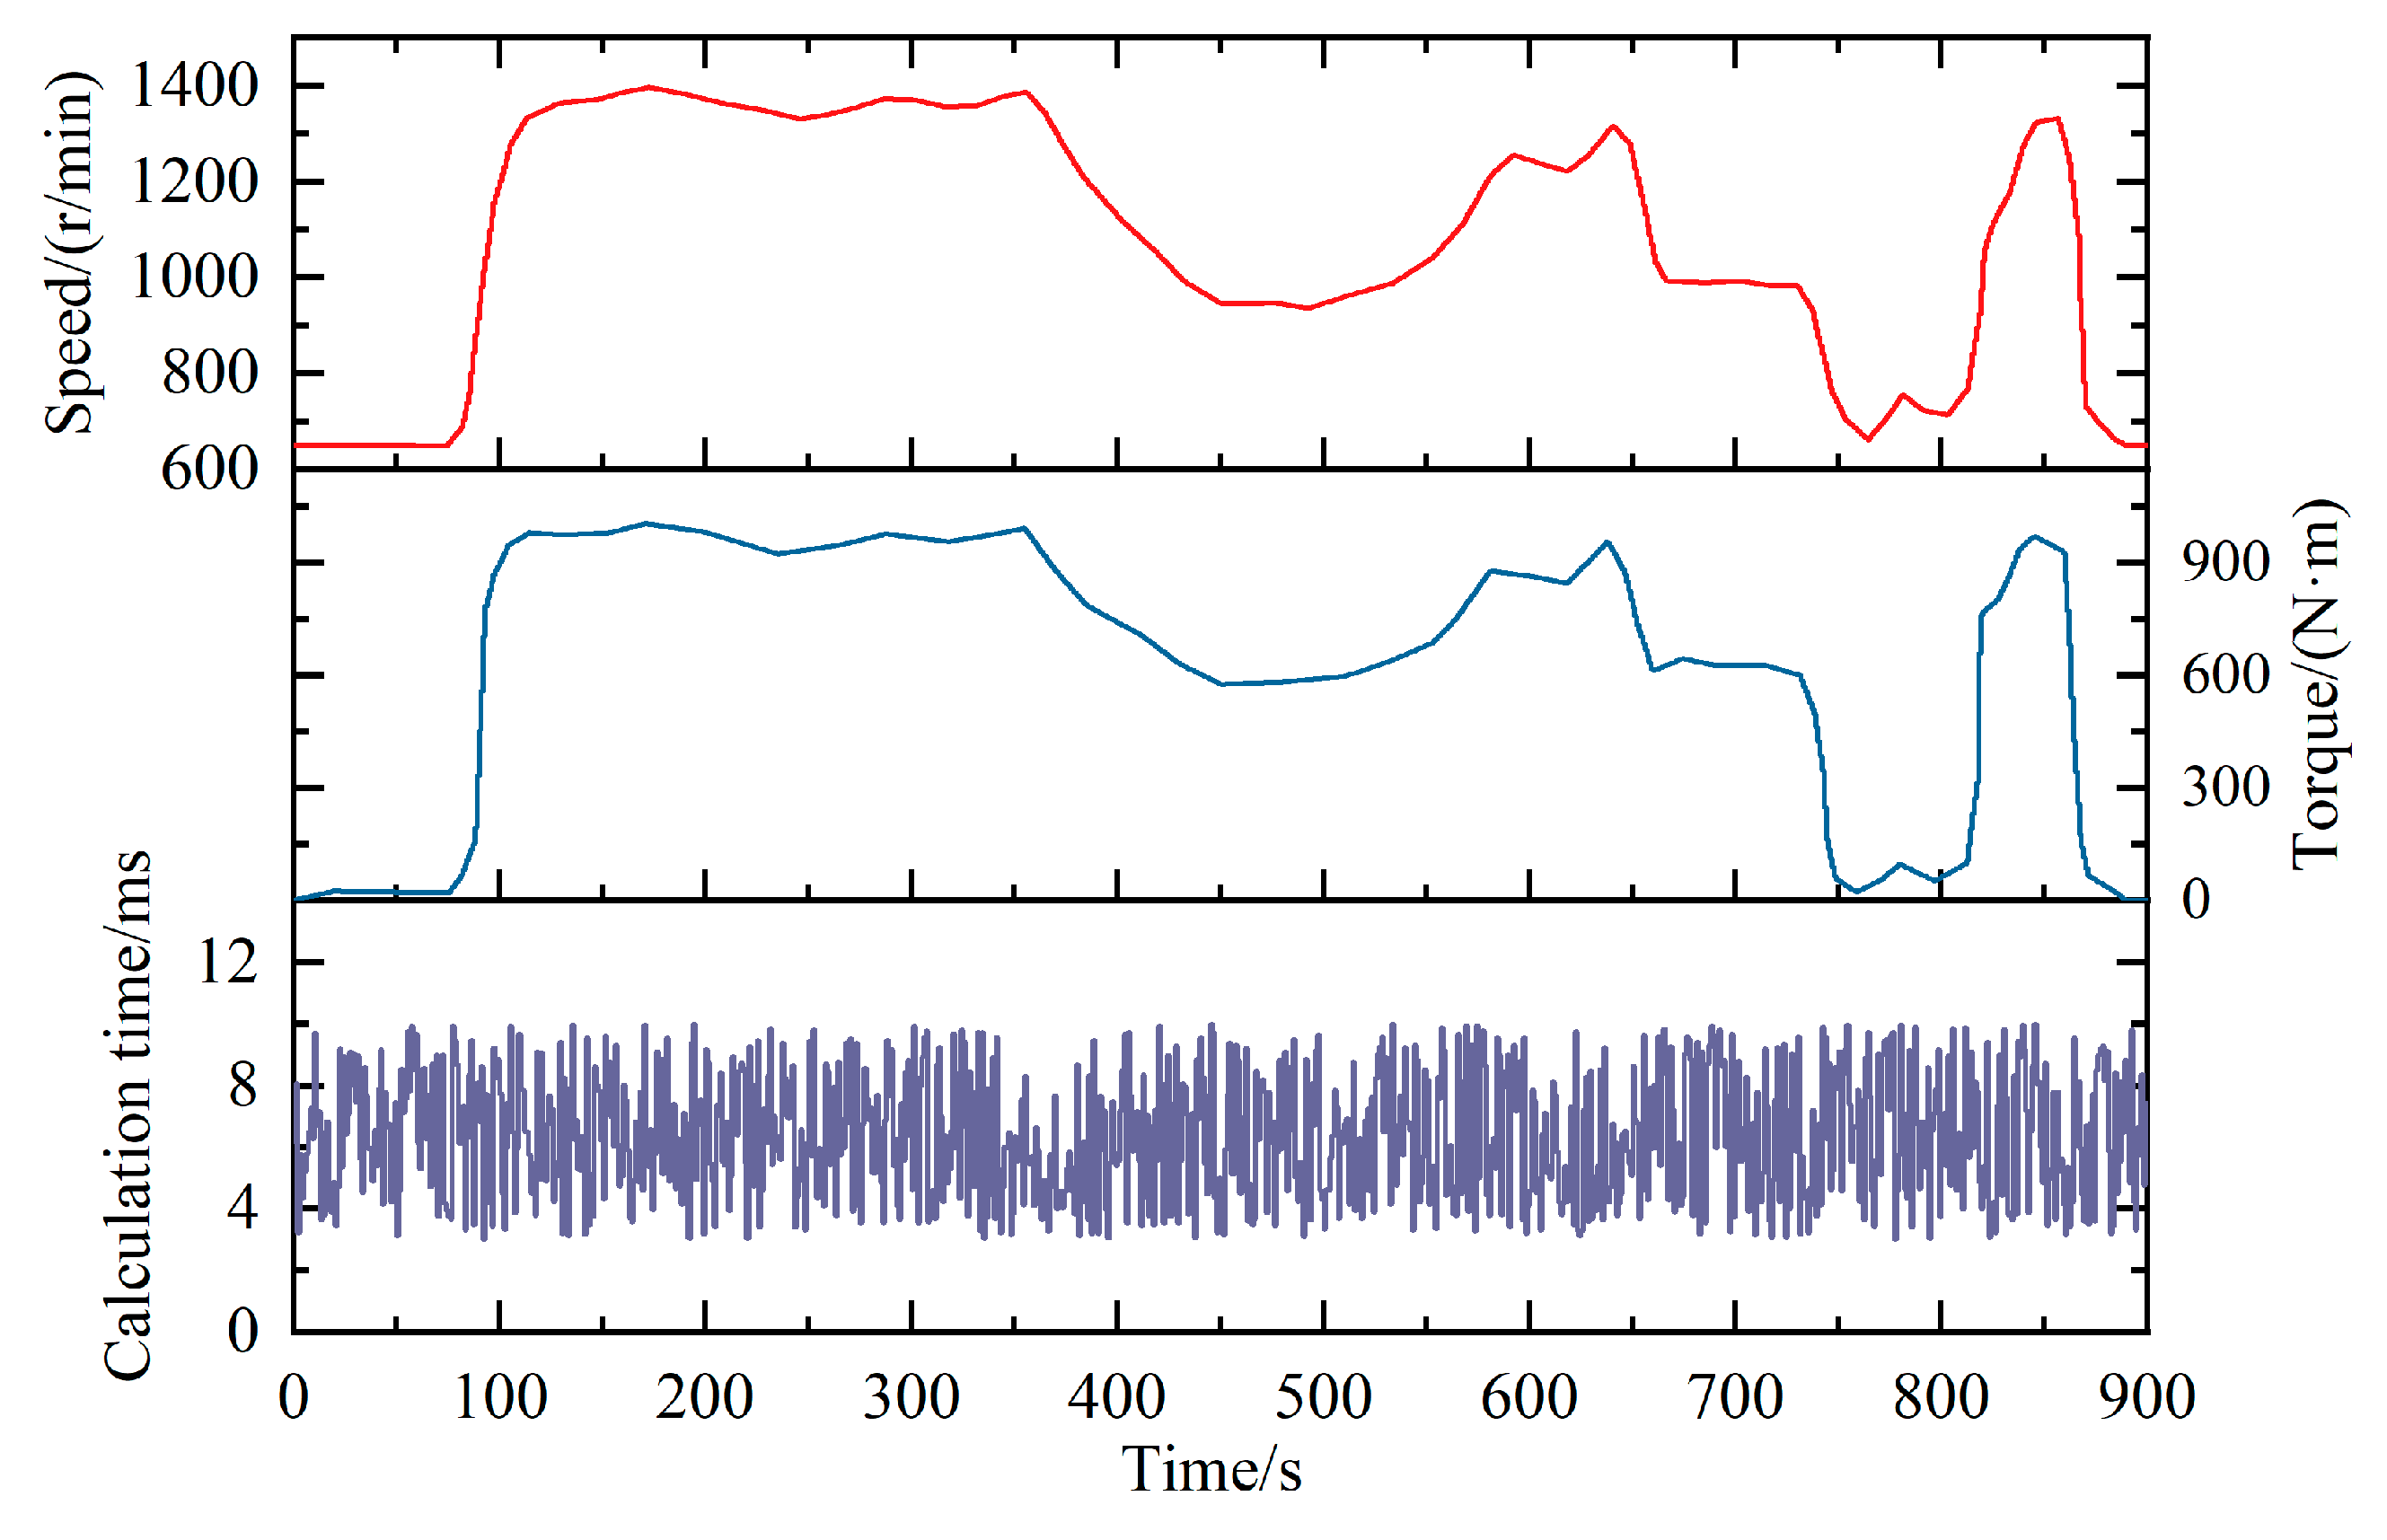
To further validate the feasibility of deploying HMPC on the NI CompactRIO platform, the hybrid dynamic model described in Section 3.2 was selected as the controlled plant for this evaluation. The input conditions for the experiment are derived from the discretized dataset at 1-s intervals, as shown in Figure 17, and are visualized in the first and second subplots of Figure 19. The computation time of the EMS, obtained from the HMPC optimization process, remains consistently below 12 ms. To meet the requirements of real-time control, the control step size of the EMS is configured to 0.02 s. This step size ensures that the control commands are executed well within the available computation time window.

4.2. Result Analysis

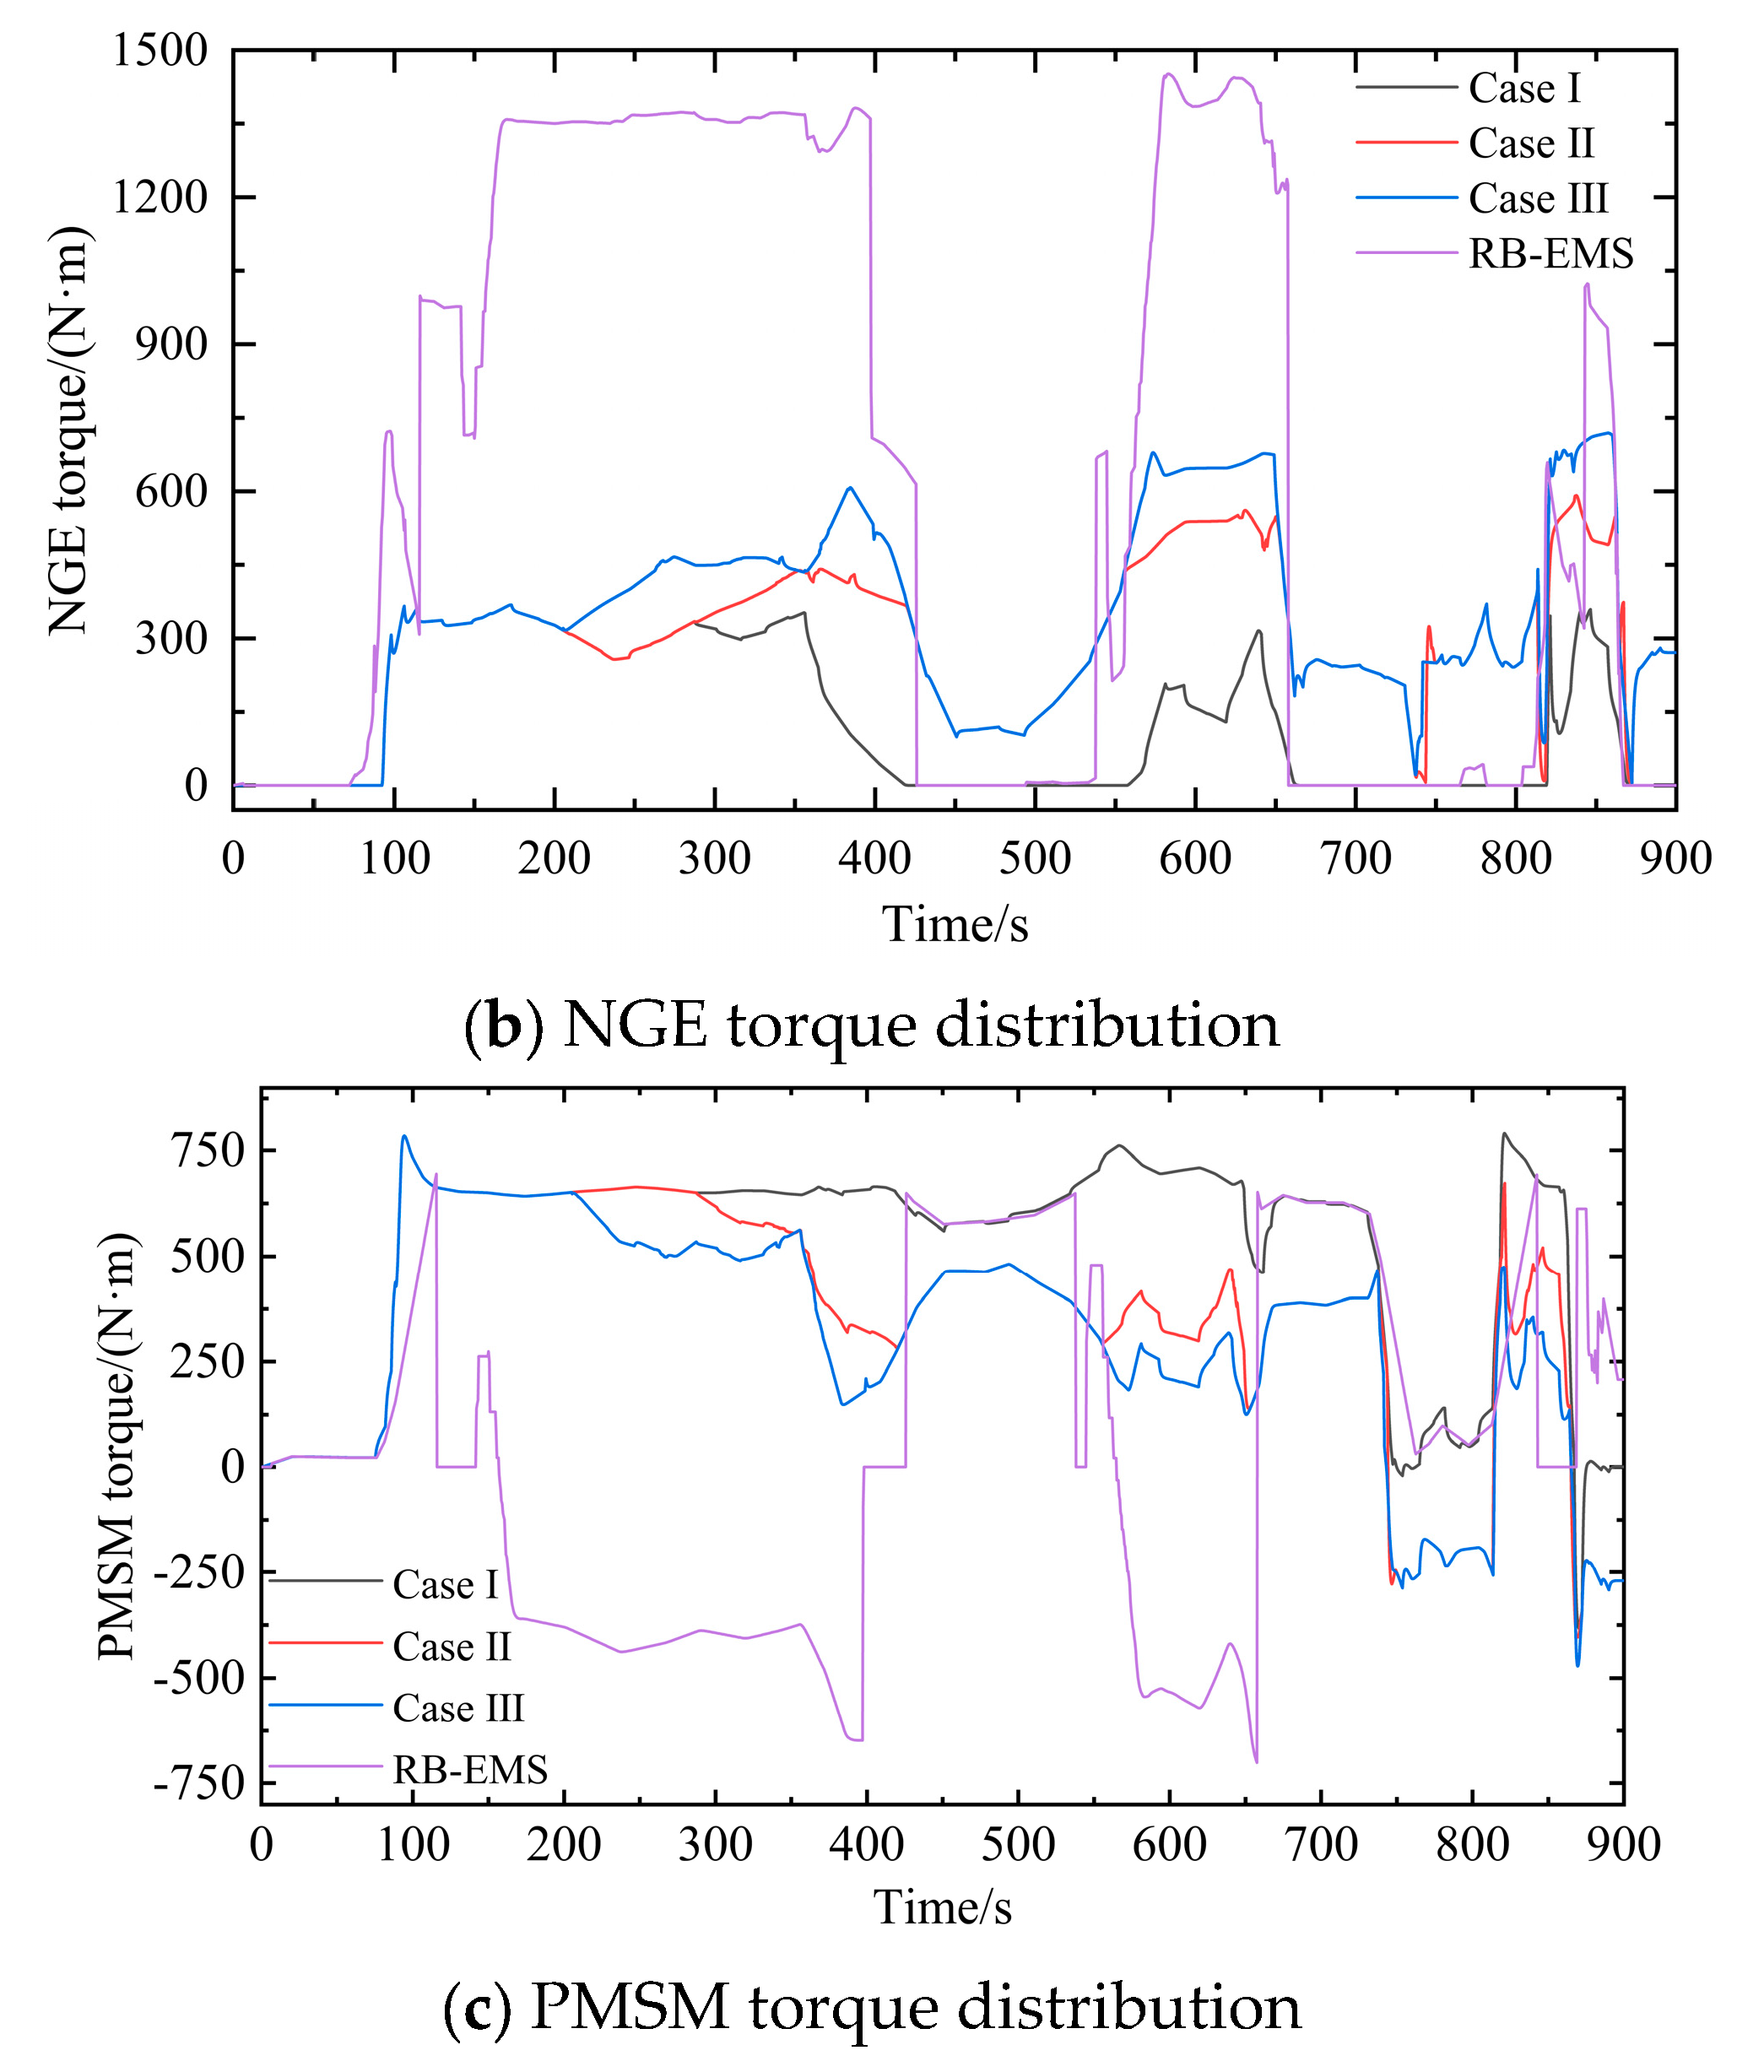
By combining the test platform described in Section 3.1, this paper systematically verifies the economic and emission performance of the proposed hybrid model predictive controller (HMPC) using a weighted configuration scheme. To ensure the validity of the comparison and highlight the advantages of the proposed strategy, the RB-EMS was introduced as a control benchmark. Based on the test conditions illustrated in Figure 17, comparative experiments were conducted on the test platform, with the results shown in Figure 20. Regardless of the three different weighted configurations, both the HMPC and RB-EMS can effectively track the target speed, as shown in Figure 20a. The differences between the two control strategies in terms of torque allocation between the NGE and the PMSM are illustrated in Figure 20b,c. Specifically, compared to RB-EMS, HMPC allocates torque to the NGE primarily in the medium-to-low-torque range around 600 N·m; however, due to RB-EMS’s fixed rules, the NGE operates predominantly in the high-torque range, causing the PMSM to remain in a battery-charging mode for extended periods. Further analysis shows that under the three weight configurations of HMPC, as the equivalent air consumption weight increases, the torque allocated to the NGE gradually increases, and the high-torque operating time correspondingly extends; conversely, the torque allocated to the PMSM gradually decreases, and its operating time in the low-torque range also extends. This inverse relationship clearly demonstrates the controller’s flexible energy allocation capabilities. Especially when the equivalent air consumption weight is 0.8, the NGE significantly takes on more battery-charging tasks, thereby effectively reducing the system’s equivalent fuel consumption.
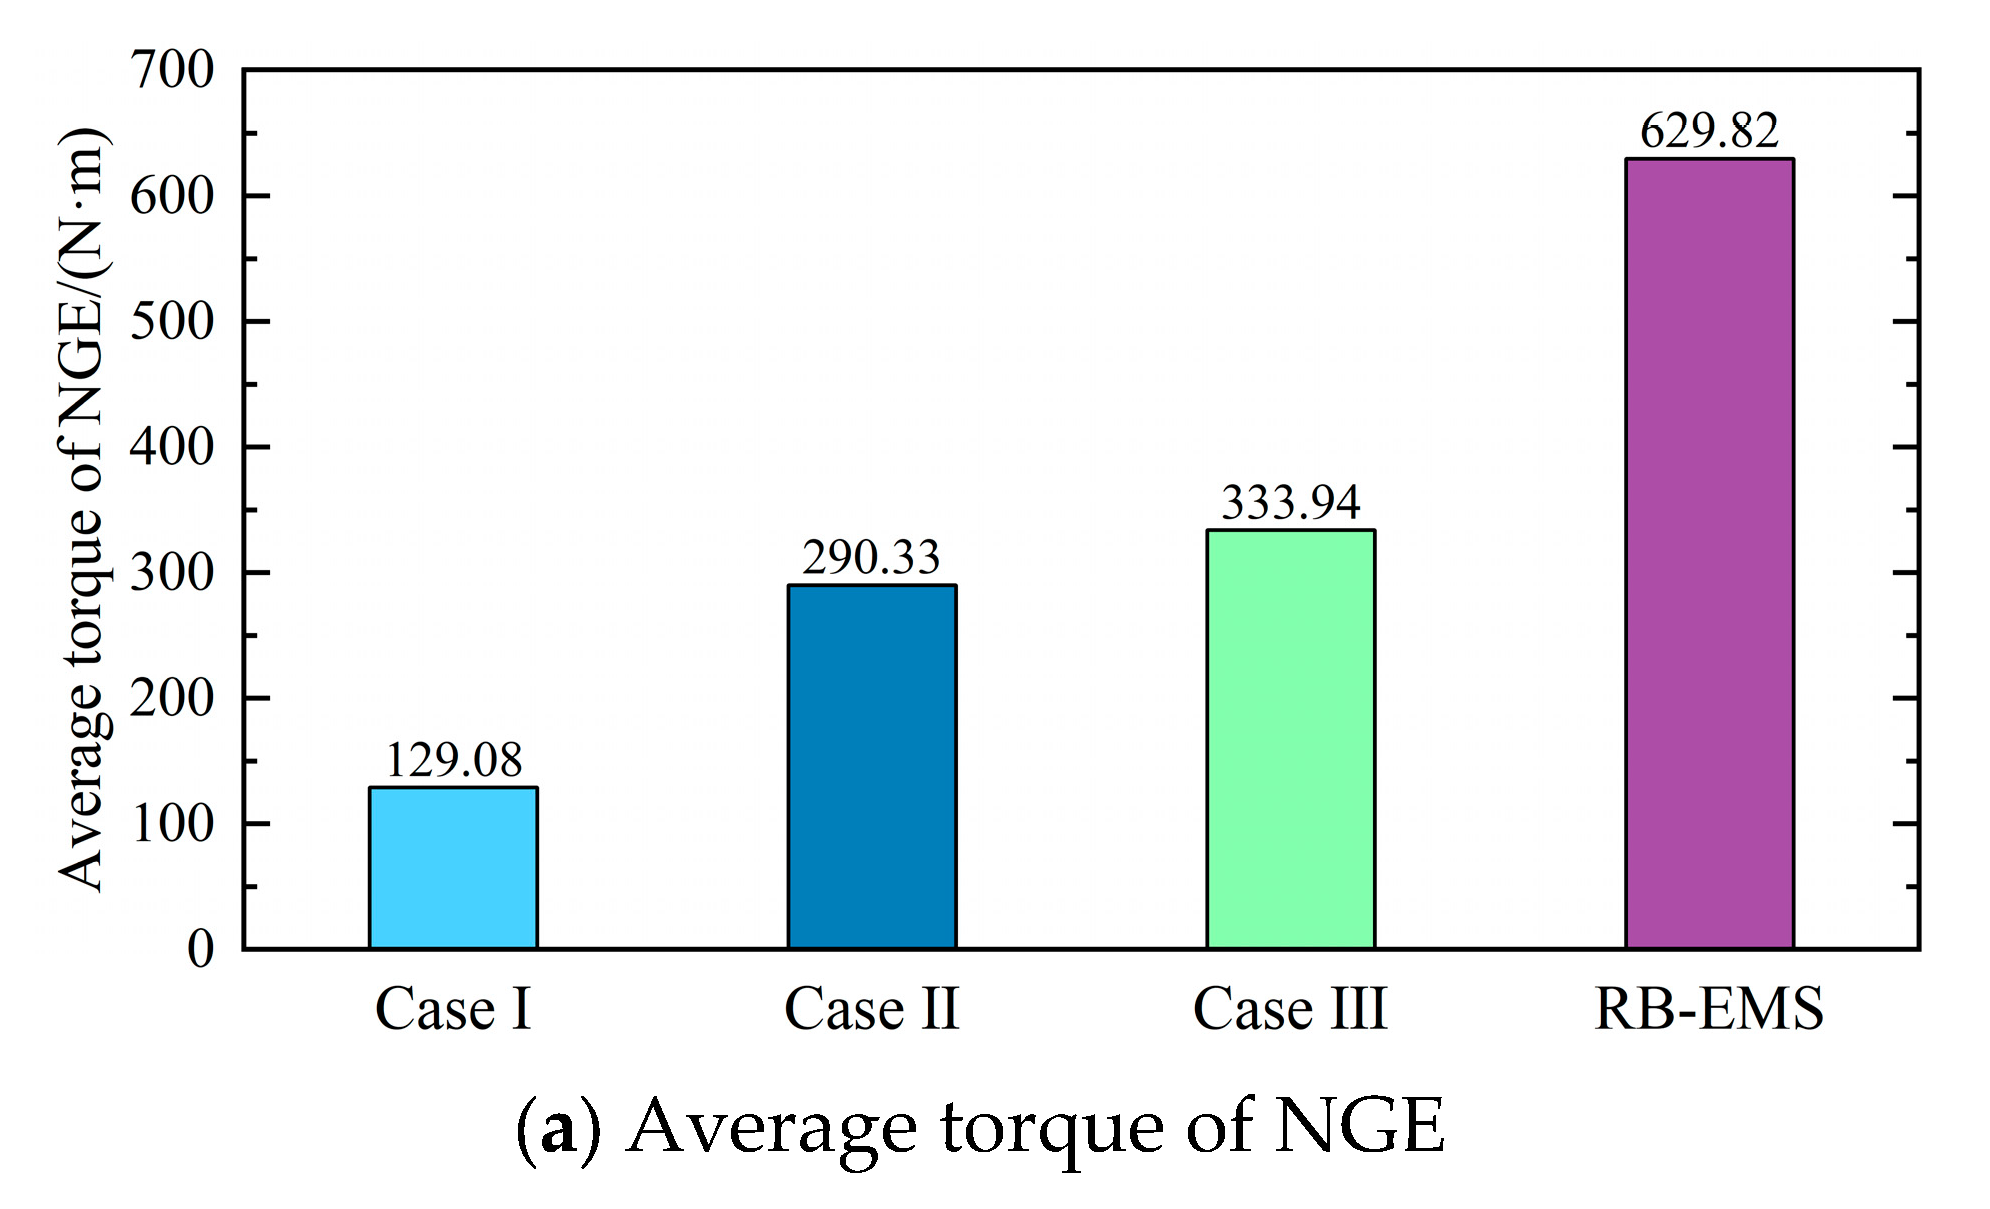
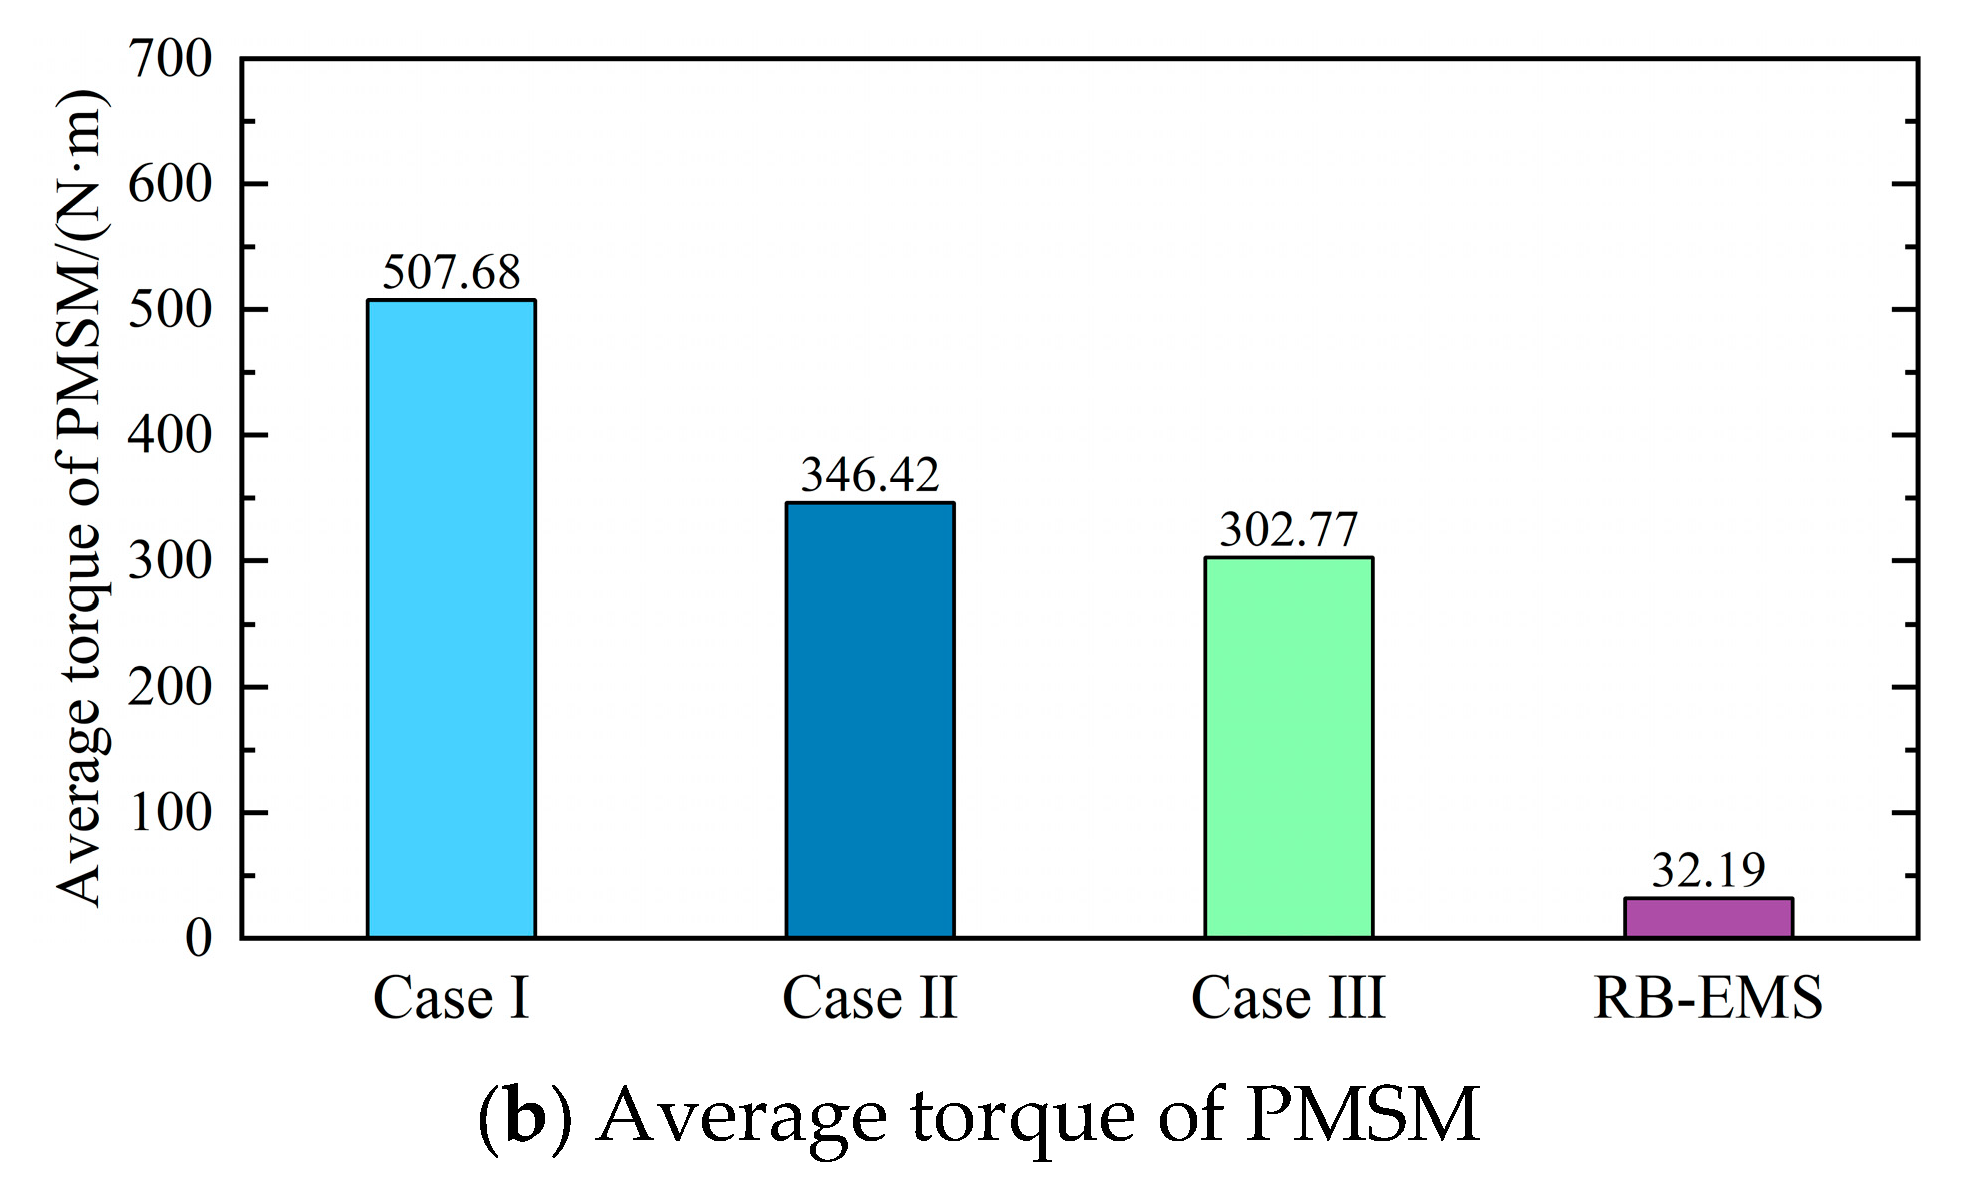
To further clarify the roles played by the NGE and PMSM under different energy management strategies, the average torque of the NGE and PMSM was calculated, as shown in Figure 21. For the RB-EMS, the average torques of the NGE and PMSM are 629.82 N·m and 32.19 N·m, respectively, which clearly indicates that the NGE serves as the primary power source, while the PMSM functions as a power supplement. For Case I, the average torque of the PMSM is 3.9 times greater than that of the NGE, suggesting that the PMSM operates actively, delivering substantial torque to maintain system balance. In contrast, for Case II and Case III, the average torques of the PMSM and NGE are comparable, indicating that both components act as primary power sources. Overall, as the equivalent air consumption weight increases, the average output torque of the NGE shows an upward trend, indirectly highlighting that reducing equivalent air consumption requires increasing the NGE output and reducing the energy loss caused by multiple conversions due to excessive PMSM usage. The average torque of the NGE and PMSM provides quantitative evidence of how adjusting the weight coefficient affects their respective torque outputs.
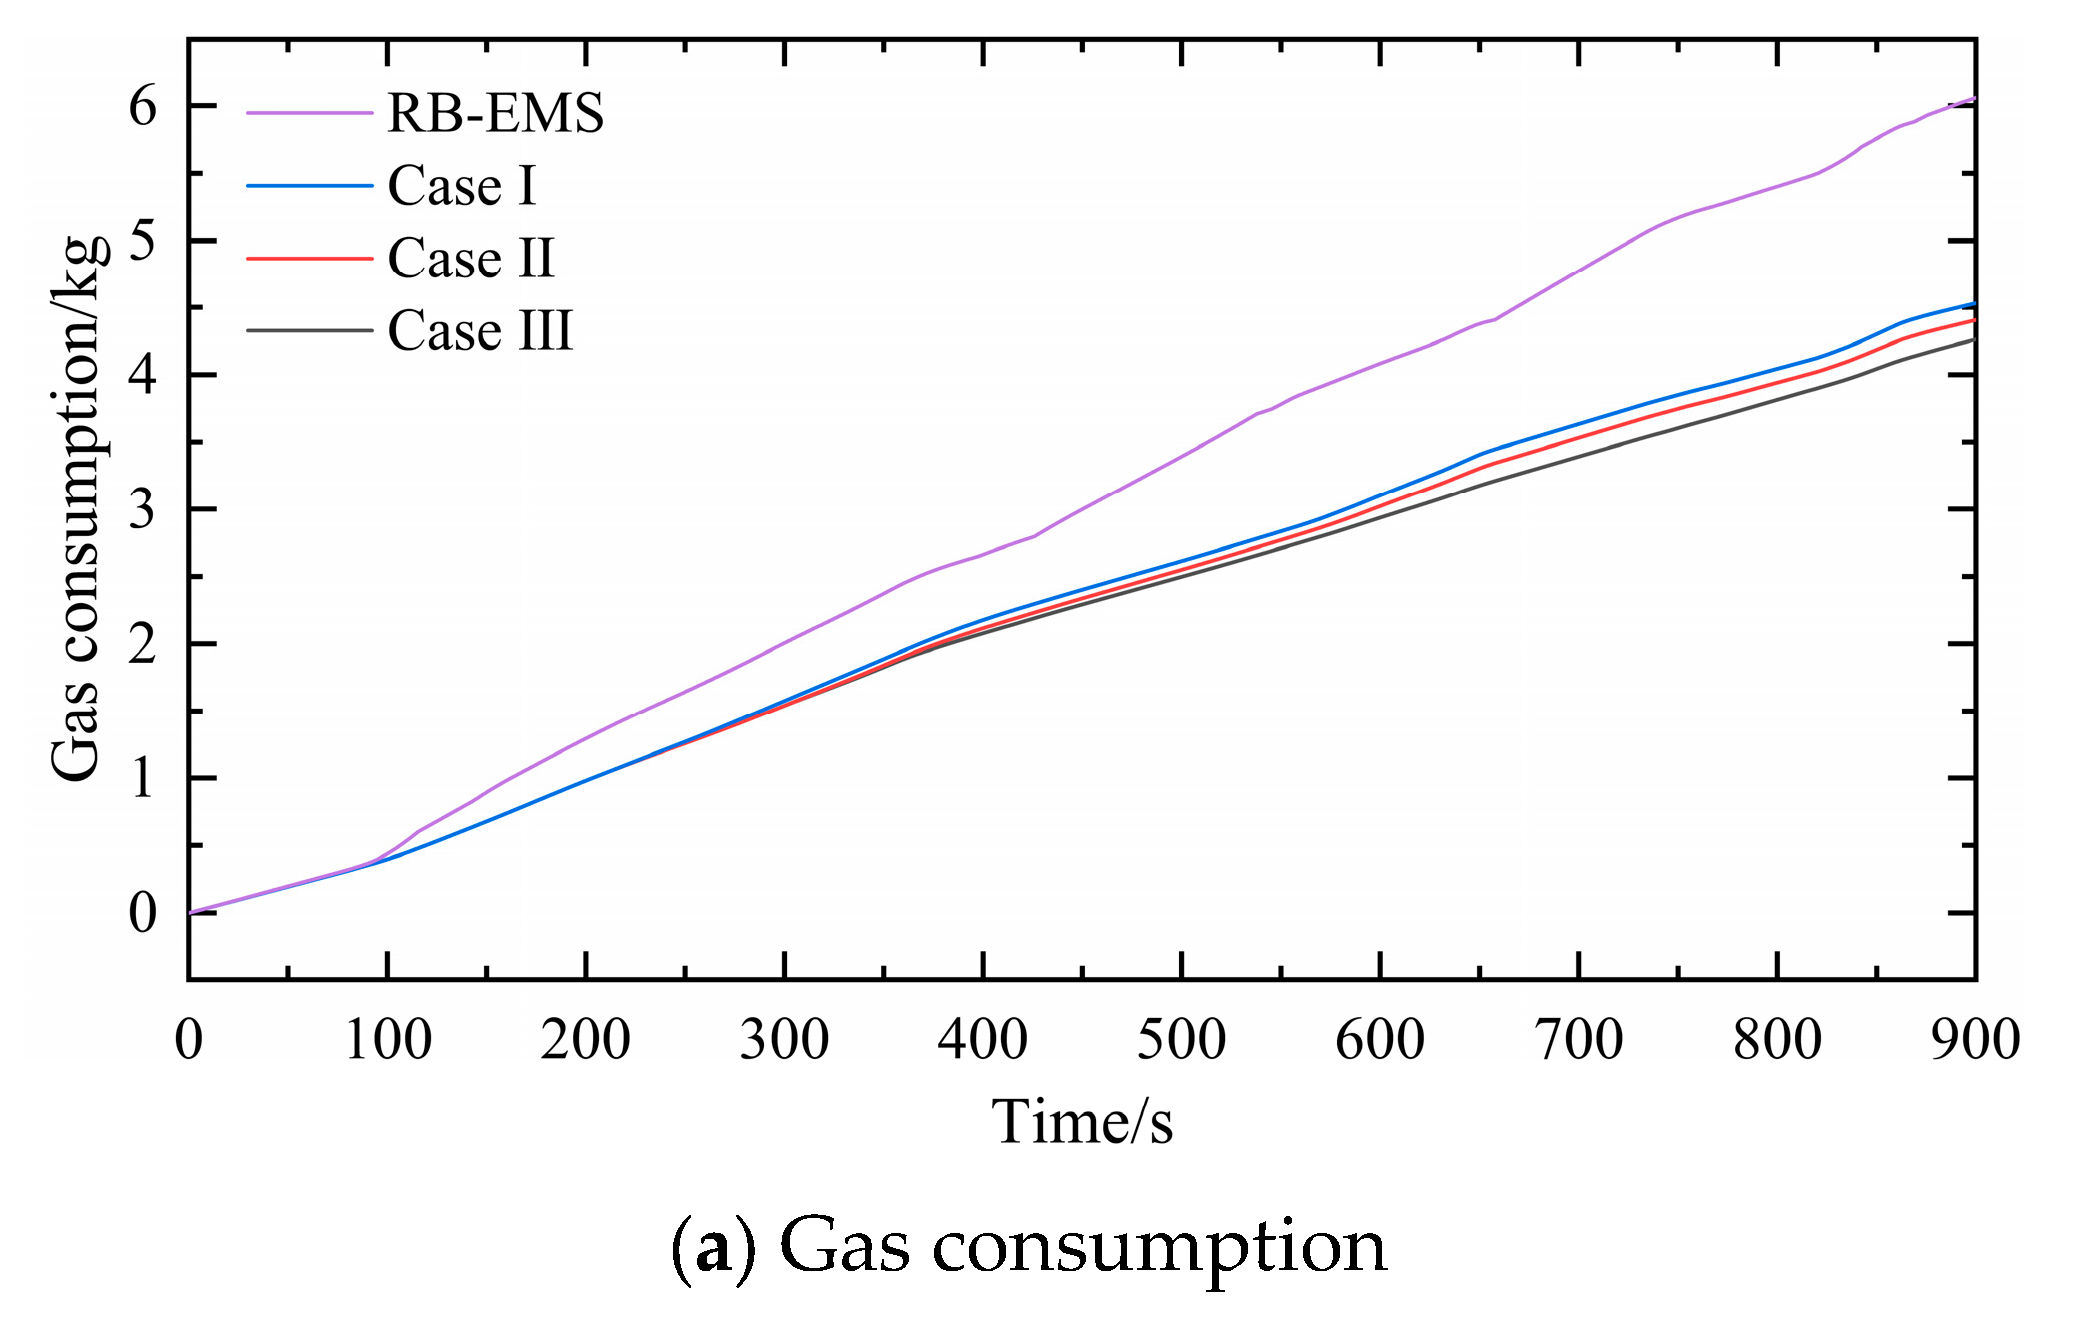
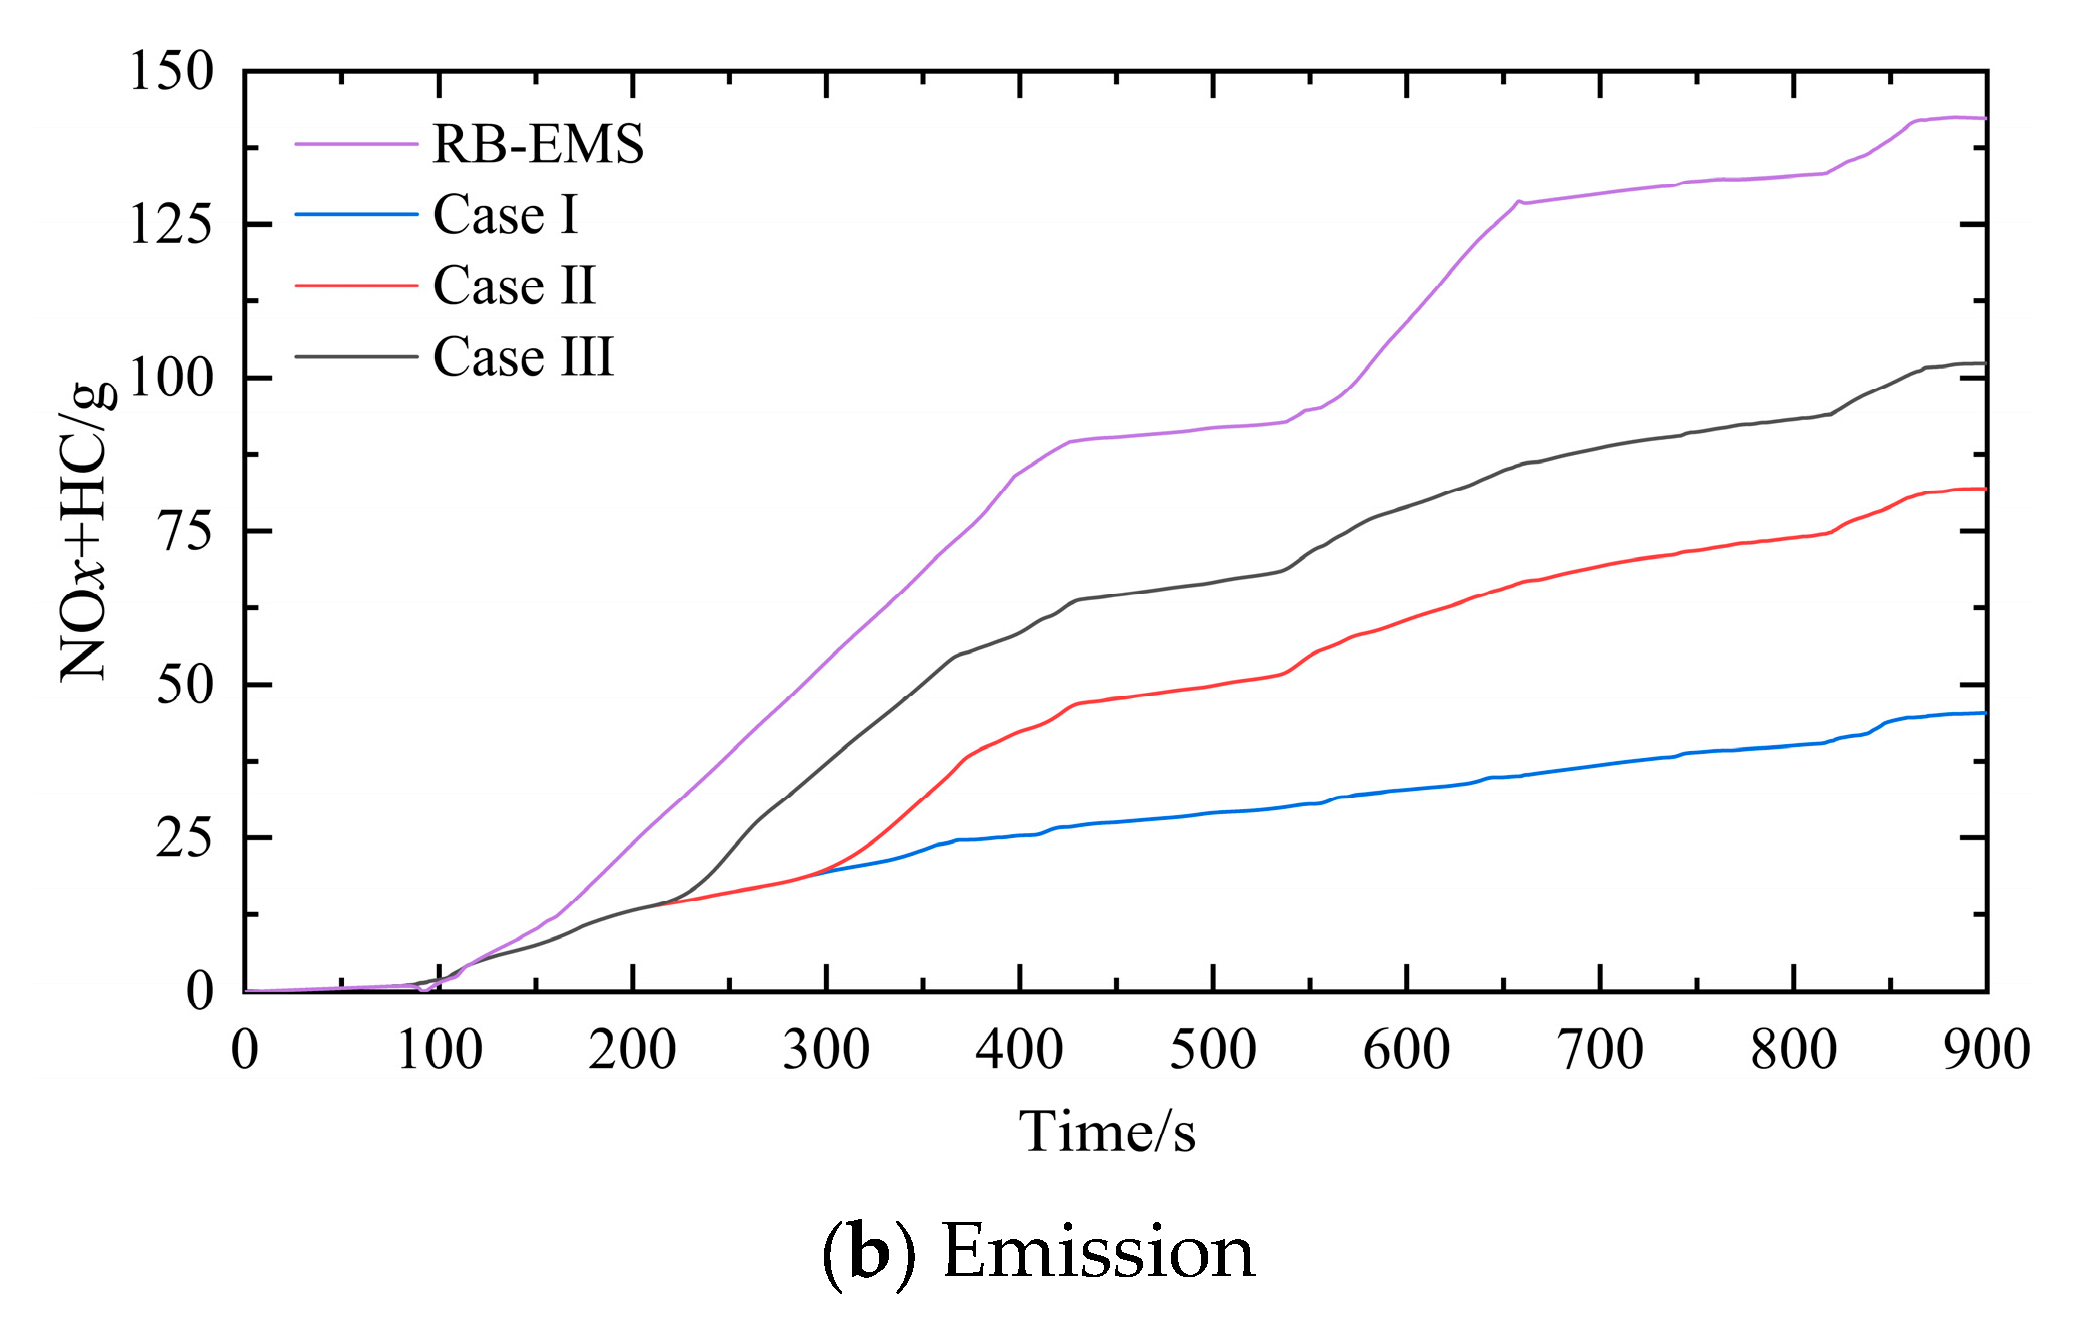
Furthermore, from the perspective of improving economic efficiency and emissions performance, the superiority and feasibility of the strategy are more clearly demonstrated. The distribution results are shown in Figure 22 and Figure 23. As can be observed in Figure 22, the equivalent fuel consumption and emissions of the RB-EMS strategy are significantly higher than those of HMPC, thereby confirming that HMPC has advantages in improving energy efficiency and emissions performance. For HMPC, adjusting the weighting ratios allows for regulation of NGE gas consumption and emissions. As shown in Figure 22, gas consumption and emissions exhibit inverse trends, highlighting the trade-off between economic efficiency and emissions. Therefore, in practical applications, the weighting ratios can be adjusted based on the navigation area to meet route requirements. The impact of different weighting ratios on NGE gas consumption and emissions is quantitatively analyzed in Figure 23. As shown, as the equivalent gas consumption weight increases, compared to Case I, Case II and Case III can save 2.73% and 5.80% fuel, respectively. The larger the emission weight, the better the emission reduction effect, further demonstrating that the hybrid model predictive controller can achieve effective control performance.
Using RB-EMS as a benchmark, we further quantitatively compared the performance improvements in HMPC in terms of economy and power. The calculation results are presented in Table 7. As shown in Table 7, compared to RB-EMS, HMPC can save at least 24.62% of natural gas and reduce emissions by at least 27.98%.
In summary, the application of hybrid systems and hybrid model predictive control in ship hybrid power systems can effectively balance economic efficiency and emission performance, thereby comprehensively demonstrating their effectiveness and feasibility in the maritime domain.

5. Conclusions

This paper utilizes the hybrid model of the MGHPS to design the hybrid model predictive controller, which is tested on an experimental simulation platform. The results show that the MGHPS can effectively track the target rotational speed. In addition, by modifying the weights within the HMPC, the system is capable of operating in different states to accommodate various energy management requirements. The following conclusions can be drawn based on the findings of this study.
(1)
The modeling of the MGHPS can be effectively achieved using hybrid systems theory, which has been demonstrated to be both practical and efficient.
(2)
The hybrid model of the MGHPS provides the foundation for developing an energy management controller capable of efficiently managing the operational states of each power source within the system.
(3)
By adjusting the weights in the hybrid model predictive controller (HMPC), the MGHPS can operate under various states, enabling the ship to meet the performance requirements for different operating conditions.
The proposed energy distribution strategy demonstrates strong potential for industrial application, as it is capable of meeting the multifaceted requirements for energy efficiency and emissions reduction under complex marine operating conditions. It also aligns with the evolving regulatory standards set by the International Maritime Organization (IMO), further reinforcing its practical relevance. Although the initial investment in such systems may be relatively high, the use of optimized energy management can yield favorable cost–benefit outcomes over the full lifecycle. Future research should focus on enhancing the adaptability of the model and the robustness of the control strategy, with particular emphasis on incorporating real-world operational data to conduct comprehensive lifecycle economic assessments, regulatory compliance analysis, and integration studies with other emerging energy technologies such as hydrogen and fuel cells, thereby improving the system’s engineering feasibility and overall competitiveness.

Author Contributions

Conceptualization, C.Y.; Investigation, J.Z.; Methodology, X.S. and B.Z.; Resources, X.S. and J.Z.; Software, J.Z.; Supervision, C.Y.; Validation, X.S.; Visualization, B.Z. and C.Y.; Writing—original draft, X.S. and B.Z. All authors have read and agreed to the published version of the manuscript.

Funding

This work was supported by the 2025 Fundamental Research Project (No. 2025-BS-0497) of the Scientific and Technological Department of Liaoning Province, the Jinzhou City Guiding Science and Technology Plan Project, and the 2024 Fundamental Research Project (No. LJ212410154030) of the Educational Department of Liaoning Province.

Institutional Review Board Statement

Not applicable.

Informed Consent Statement

Not applicable.

Data Availability Statement

The data presented in this study are available on request from the corresponding author.

Conflicts of Interest

The authors declare no conflicts of interest.

Appendix A

Linearized equations for gas consumption, as shown in Equation (A1).
W ˙ N G E , g a s = 0.0322 n N G E + 0.0219 M N G E 35.0867 i f 0.7491 0.6625 0.7523 0.6588 0.5344 0.8452 1.0000 0.0000 1.0000 0.0000 0.0000 1.0000 n N G E M N G E 1775.5456 2143.3187 1749.1750 1500.0000 650.0000 2200.0000 0.0256 n N G E + 0.0174 M N G E 21.2853 i f 0.7491 0.6625 0.3320 0.9433 0.9809 0.1946 1.0000 0.0000 n N G E M N G E 1775.5456 1294.2874 949.6556 650.0000 0.0177 n N G E + 0.0128 M N G E 9.0717 i f 0.6616 0.7498 0.6235 0.7818 1.0000 0.0000 0.0000 1.0000 n N G E M N G E 1297.3555 1116.4617 650.0000 0.0000 0.0200 n N G E + 0.0141 M N G E 12.4037 i f 0.3320 0.9433 0.6616 0.7498 0.6211 0.7837 1.0000 0.0000 1.0000 0.0000 0.0000 1.0000 n N G E M N G E 1294.2874 1297.3555 1475.6601 1500.0000 650.0000 0.0000 0.0357 n N G E + 0.0235 M N G E 42.9637 i f 0.7523 0.6588 1.0000 0.0000 0.0000 1.0000 n N G E M N G E 2143.3187 1500.0000 2200.0000 0.0242 n N G E + 0.0226 M N G E 25.2941 i f 0.5344 0.8452 0.9809 0.1946 0.6211 0.7837 1.0000 0.0000 n N G E M N G E 1749.1750 949.6556 1475.6601 1500.0000 0.0134 n N G E + 0.0064 M N G E 0.5992 i f 0.6235 0.7818 1.0000 0.0000 0.0000 1.0000 n N G E M N G E     1116.4617 650.0000 0.0000
where W ˙ N G E , g a s is the gas injection quantity (kg/h), n N G E is the output speed of the NGE(r/min), and M N G E is the output torque of the NGE (N·m).
NOx + HC emissions are calculated using the PWARX method, with the linearized equation shown in Equation (A2).
W ˙ N O x + H C = 0.00020385 n N G E + 0.00098843 M N G E + 0.1250 i f 0.6561 0.7547 0.9912 0.1324 0.9977 0.0683 1.0000 0.0000 0.0000 1.0000 n N G E M N G E 7.2191 961.8859 1386.5813 1500.0000 2200.0000 0.000040969 n N G E + 0.00051576 M N G E + 0.0076 i f 0.3216 0.9469 0.2399 0.9708 1.0000 0.0000 1.0000 0.0000 0.0000 1.0000 n N G E M N G E 776.7878 116.8326     1500.0000 650.0000 0.0000 0.00053406 n N G E + 0.00068432 M N G E + 0.8404 i f 0.6561 0.7547 0.3216 0.9469 0.9873 0.1591 0.9992 0.0396 1.0000 0.0000 n N G E M N G E 7.2191 776.7878 1111.6026 1208.3969 1500.0000 0.00037888 n N G E + 0.0019 M N G E 0.4860 i f 0.9912 0.1324 0.9684 0.2492 0.7526 0.6585 1.0000 0.0000 0.0000 1.0000 n N G E M N G E 961.8859 690.9930 52.6804 650.0000     2200.0000 0.0021 n N G E + 0.0012 M N G E + 2.1997 i f 0.9977 0.0683 0.9873 0.1591 0.9684 0.2492 0.9476 0.3195 n N G E M N G E 1386.5813 111.6026 690.9930 1263.0587 0.0011 n N G E + 0.00095357 M N G E 1.0100 i f 0.2399 0.9708 0.9992 0.0397 0.7526 0.6585 0.9476 0.3195 1.0000 0.0000 n N G E M N G E 116.8326     1208.3969 52.6804 1263.0587 650.0000
where W ˙ N O x + H C is the NOx and HC emissions from the NGE(kg/h).
The segmented linearization of battery power is performed using the PWARX method, and the results are shown in Equation (A3).
P b a t = 0.0700 n m o t + 0.0775 M m o t + 56.4786 i f 0.5283 0.8491 0.8487 0.5289 0.0159 0.9999 0.0000 1.0000 n m o t M m o t 148.4759   677.6599 418.6613 850.0000 0.0318 n m o t + 0.1433 M m o t + 46.2313 i f 0.5283 0.8491 0.3951 0.9186 0.4777 0.8785 0.9407 0.3391 1.0000 0.0000 0.0000 1.0000 n m o t M m o t 148.4759 477.3193 636.7388 1068.1680 1800.0000 850.0000 0.07540 n m o t + 0.1032 M m o t 71.7237 i f 0.0961 0.9954 0.4918 0.8707 0.3181 0.9481 1.0000 0.0000 1.0000 0.0000 0.0000 1.0000 n m o t M m o t 607.8318   783.8901 90.2394 1800.0000 100.0000 850.0000 0.0453 n m o t + 0.0124 M m o t + 6.1450 i f 0.8487 0.5289 0.1218 0.9926 0.8887 0.4584 1.0000 0.0000 0.0000 1.0000 n m o t M m o t 677.6599 28.4799 277.2272   100.0000 850.0000 0.0155 n m o t + 0.0966 M m o t 13.110 i f 0.3951 0.9186 0.0961 0.9954 0.9481 0.3179 0.9839 0.1788 0.2156 0.9765 n m o t M m o t 477.3193 607.8318   411.2406 1262.5163 205.8571 0.0482 n m o t + 0.0238 M m o t 9.8895 i f 0.4918 0.8707 0.1218 0.9926 0.9481 0.3179 0.6100 0.7924 1.0000 0.0000 n m o t M m o t 783.8901 28.4799 411.2406 201.5854   100.0000 0.0450 n m o t + 0.1888 M m o t 75.4292 i f 0.4777 0.8785 0.3181 0.9481 0.9839 0.1788 1.0000 0.0000 n m o t M m o t 636.7388 90.2394 1262.5163 1800.0000 0.0106 n m o t + 0.0707 M m o t + 7.9041 i f 0.0159 0.9999 0.9407 0.3391 0.8887 0.4584 0.2156 0.9765 0.6100 0.7924 n m o t M m o t 418.6613 1068.1680   277.2272 205.8571 201.5854
The PWARX-treated NGE and PMSM external characteristic torque expressions are presented in Equations (A4) and (A5).
M N G E , e x = 0.4569 n N G E + 1146.5000 i f 1 1 n N G E 816.0686   650.0000 0.6353 n N G E + 866.3004 i f 1 1 n N G E 1005.5707 1101.7259 0.0751 n N G E + 1580.7001 i f 1 1 n N G E 816.0686     1005.5707 3.8496 n N G E 3102.0000 i f 1 1 n N G E 1309.3358 1197.1064 0.5734 n N G E + 1383.5002 i f 1 1 n N G E 1402.8765 1500.0000 2.6663 n N G E 1552.7001 i f 1 1 n N G E 1309.3358 1402.8765 0.6279 n N G E + 2258.0000 i f 1 1 n N G E 1101.7259 1197.1064
M m o t , e x = 0.4377 n m o t + 1244.3001 i f 1 1 n m o t     926.0001 1310.0000 5.8124 n m o t + 850.0002 i f 1 1 n m o t         866.0000 0.0000 0.1840 n m o t + 1009.3000 i f 1 1 n m o t 926.0001   866.0000 0.3361 n m o t + 1111.2000 i f 1 1 n m o t 1310.0000 1518.5502 0.2486 n m o t + 978.3002 i f 1 1 n m o t 1518.5502 1800.0000

References

  1. Wei, W.; Li, G.; Zhang, Z.; Long, Y.; Huang, Y.; Zhang, H.; Zhou, M. Fuel Consumption and NOx Emissions Optimization of a Marine Natural Gas Engine with Lean-Burn and Reformed Exhaust Gas Recirculation Strategies. Fuel 2024, 357, 129970. [Google Scholar] [CrossRef]
  2. Lu, Z.; Ma, M.; Wang, T.; Lu, T.; Wang, H.; Feng, Y.; Shi, L. Numerical Research of the In-Cylinder Natural Gas Stratification in a Natural Gas-Diesel Dual-Fuel Marine Engine. Fuel 2023, 337, 126861. [Google Scholar] [CrossRef]
  3. Sun, X.; Yao, C.; Song, E.; Liu, Z.; Ke, Y.; Ding, S. Novel Enhancement of Energy Distribution for Marine Hybrid Propulsion Systems by an Advanced Variable Weight Decision Model Predictive Control. Energy 2023, 274, 127269. [Google Scholar] [CrossRef]
  4. Sun, X.; Yao, C.; Song, E.; Yang, Q.; Yang, X. Optimal Control of Transient Processes in Marine Hybrid Propulsion Systems: Modeling, Optimization and Performance Enhancement. Appl. Energy 2022, 321, 119404. [Google Scholar] [CrossRef]
  5. Taghavian, A.; Safi, A.; Khanmirza, E. Constrained Computational Hybrid Controller for Input Affine Hybrid Dynamical Systems. J. Frankl. Inst. 2024, 361, 107142. [Google Scholar] [CrossRef]
  6. Li, X.; Zhao, T.; Xu, J. Research on MLD Modeling and Predictive Control of Magnetically Coupled Resonant Bidirectional WPT System. Electronics 2024, 13, 1290. [Google Scholar] [CrossRef]
  7. Cai, B.; Ning, Z.; Ji, W.; Zhu, Y.; Han, M. Quantized Output-Feedback Control of Piecewise-Affine Systems with Reachable Regions of Quantized Measurements. Inf. Sci. 2024, 677, 120828. [Google Scholar] [CrossRef]
  8. Yadav, P.K.; Karuppaiah, P. On Finiteness of the Solution Set of Extended Horizontal Linear Complementarity Problem. Oper. Res. Lett. 2024, 54, 107112. [Google Scholar] [CrossRef]
  9. Zhang, X.; Ling, K.V.; Lu, Z.; Zhang, X.; Liao, W.; Lim, W.S. Piece-Wise Affine MPC-Based Attitude Control for a CubeSat during Orbital Manoeuvres. Aerosp. Sci. Technol. 2021, 118, 106997. [Google Scholar] [CrossRef]
  10. Mansoor, M.; Stadler, M.; Zellinger, M.; Lichtenegger, K.; Auer, H.; Cosic, A. Optimal Planning of Thermal Energy Systems in a Microgrid with Seasonal Storage and Piecewise Affine Cost Functions. Energy 2021, 215, 119095. [Google Scholar] [CrossRef]
  11. Mei, Z.; Li, Z.; Su, L.; Wang, J.; Li, F. Quantized H∞ Filtering for Networked Persistent Dwell-Time Switched Piecewise-Affine Systems. ISA Trans. 2023, 136, 173–181. [Google Scholar] [CrossRef] [PubMed]
  12. Lu, X.; Chen, M.; Zhang, Q. Research on Mixed Logic Dynamic Modeling and Finite Control Set Model Predictive Control of Multi-Inverter Parallel System. Energy Eng. 2023, 120, 649–664. [Google Scholar] [CrossRef]
  13. Wang, F.; Wu, T.; Ni, Y.; Ye, P.; Cai, Y.; Guo, J.; Wang, C. Torsional Oscillation Suppression-Oriented Torque Compensate Control for Regenerative Braking of Electric Powertrain Based on Mixed Logic Dynamic Model. Mech. Syst. Signal Process. 2023, 190, 110114. [Google Scholar] [CrossRef]
  14. Zhao, H.; Xing, Y.; Zhou, C.; Wang, Y.; Duan, H.; Liu, K.; Jiang, S. Research on Hybrid Logic Dynamic Model and Voltage Predictive Control of Photovoltaic Storage System. Energies 2024, 17, 4285. [Google Scholar] [CrossRef]
  15. Dassios, I.; Vaca, A.; Milano, F. On Hybrid Dynamical Systems of Differential–Difference Equations. Chaos Solitons Fractals 2024, 187, 115431. [Google Scholar] [CrossRef]
  16. Zhang, Y.; Chu, X.; Liu, Y.; Liu, Y. A Modelling and Control Approach for a Type of Mixed Logical Dynamical System Using in Chilled Water System of Refrigeration System. Math. Probl. Eng. 2019, 2019, 7131380. [Google Scholar] [CrossRef]
  17. Papalambrou, G.; Planakis, N.; Kyrtatos, N. Transient and Disturbed Propeller Load Compensation in Hybrid Propulsion Using Propeller Estimator and Predictive Control. Proc. Inst. Mech. Eng. Part M J. Eng. Marit. Environ. 2022, 236, 86–102. [Google Scholar] [CrossRef]
  18. Khajiyeva, L.; Sabirova, Y.; Kudaibergenov, A.; Kudaibergenov, A. Application of the Lumped-Parameter Method for Modeling Nonlinear Vibrations of Drill Strings with Stabilizers in a Supersonic Gas Flow. Appl. Math. Model. 2022, 110, 748–766. [Google Scholar] [CrossRef]
  19. Planakis, N.; Papalambrou, G.; Kyrtatos, N. Ship Energy Management System Development and Experimental Evaluation Utilizing Marine Loading Cycles Based on Machine Learning Techniques. Appl. Energy 2022, 307, 118085. [Google Scholar] [CrossRef]
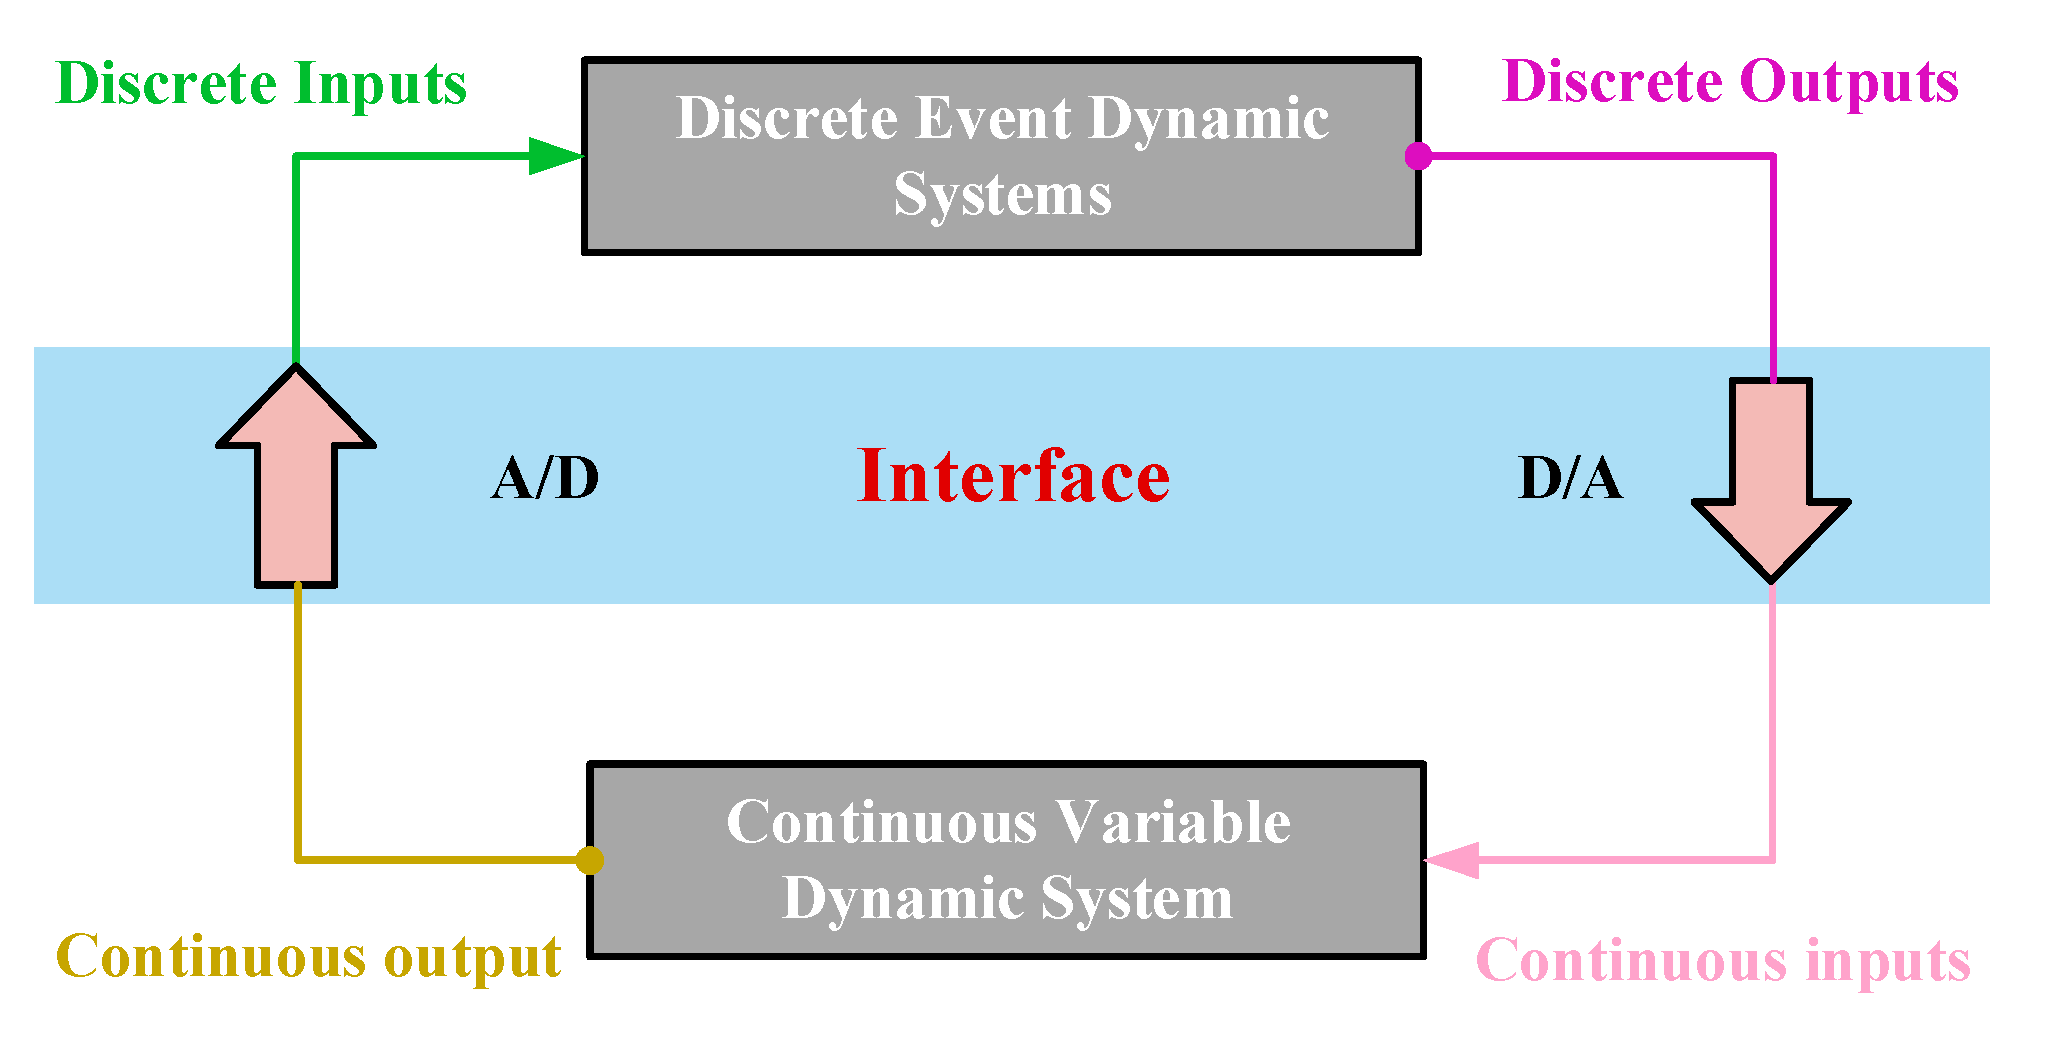
Figure 1. Hybrid system structure model.
Sustainability 17 08160 g001
Figure 2. Hybrid system model predictive control structure diagram.
Sustainability 17 08160 g002
Figure 3. MGHPS.
Figure 3. MGHPS.
Sustainability 17 08160 g003
Figure 4. NGE test points.
Sustainability 17 08160 g004
Figure 5. Gas consumption rate measurement and linearization.
Sustainability 17 08160 g005
Figure 6. NOx + HC measurement and linearization.
Sustainability 17 08160 g006
Figure 7. PMSM operating conditions and efficiency profiles.
Sustainability 17 08160 g007
Figure 8. Subinterval plots for battery linearization.
Sustainability 17 08160 g008
Figure 9. The test results.
Sustainability 17 08160 g009
Figure 10. Fitting effect.
Sustainability 17 08160 g010
Figure 11. External characteristics of the power source.
Sustainability 17 08160 g011
Figure 12. Segmented fitting of external characteristic curves.
Sustainability 17 08160 g012
Figure 13. Input operating conditions.
Sustainability 17 08160 g013aSustainability 17 08160 g013b
Figure 14. Comparison between fuel injection quantity simulation and experiment.
Sustainability 17 08160 g014aSustainability 17 08160 g014b
Figure 15. Comparison between SOC simulation and experiment.
Sustainability 17 08160 g015
Figure 16. RB-EMS.
Figure 16. RB-EMS.
Sustainability 17 08160 g016
Figure 17. Operating cycle profiles.
Sustainability 17 08160 g017
Figure 18. Basic components of the cRIO-9047.
Sustainability 17 08160 g018
Figure 19. NI real-time calculation time.
Sustainability 17 08160 g019
Figure 20. Distribution of speed and torque for three scenarios.
Sustainability 17 08160 g020aSustainability 17 08160 g020b
Figure 21. Average output torque of NGE and PMSM under different energy management.
Sustainability 17 08160 g021aSustainability 17 08160 g021b
Figure 22. Fluctuations in performance metrics under three scenarios.
Sustainability 17 08160 g022aSustainability 17 08160 g022b
Figure 23. Growth in performance indicators.
Sustainability 17 08160 g023
Table 1. The characteristics and parameters of the test stand equipment.
No.EquipmentModel NumberParametersFunction
1NGE6M33Minimum no-load stabilized speed: 650 r/min
Rated power: 330 kW
Rated speed: 1500 r/min
Power source
2PMSMsurface mountedRated power: 98 kW
Rated voltage: 380 V
Rated current: 285 A
Power source
3Energy storage systemsLiFePO4Battery storage: 205.6 kW·h
Capacity: 315 Ah
Rated voltage: 652.8 V
Provides power to the PMSM and energy storage.
Table 2. Statistical values for the error analysis of gas consumption rates.
Operating Area1234567
MSE0.03410.06210.03930.05030.04500.05670.0264
Table 3. Statistical values for error analysis of NOx + HC.
Operating Area123456
MSE0.07030.01030.01830.07600.07890.0121
Table 4. Statistical values for error analysis of battery power.
Operating Area12345678
MSE0.69650.76881.14680.47182.14730.70211.65410.5790
Table 5. Modified boundary conditions.
Pdmd Boundary ConditionsSOC Boundary ConditionsNGE Power/(kW)PMSM Power/(kW)
P d m d P m , m a x S O C > S O C h i g h P e = 0 P m = P d m d
P m , m a x < P d m d P e , m a x S O C > S O C h i g h P e = P d m d P m = 0
P d m d > P e , m a x S O C > S O C h i g h P e = P e , m a x P m = P d m d P e , m a x
P d m d P e , m a x S O C l o w S O C S O C h i g h P e = P e , m a x P m = P e , m a x P d m d
P d m d > P e , m a x S O C l o w S O C S O C h i g h P e = P e , m a x P m = P d m d P e , m a x
P d m d > P e , m a x S O C < S O C l o w P e = P e , m a x P m = 0
P d m d P e , m a x S O C < S O C l o w P e = P e , m a x P m = P e , m a x P d m d
Table 6. Weight setting scheme.
Operating Conditions Q N G E , g a s Q N O x + H C Q S O C Q s p d
Case I0.20.8110
Case II0.50.5110
Case III0.80.2110
Table 7. Comparison of economic efficiency and emissions.
EMSGas Consumption(kg)VS RB-EMS(%)Emission(g)VS RB-EMS(%)
RB-EMS6.05838/142.21448/
HMPC(Case I)4.5671024.6245.4605768.03
HMPC(Case II)4.4423626.6781.9810542.35
HMPC(Case III)4.3021628.99102.4261627.98
Disclaimer/Publisher’s Note: The statements, opinions and data contained in all publications are solely those of the individual author(s) and contributor(s) and not of MDPI and/or the editor(s). MDPI and/or the editor(s) disclaim responsibility for any injury to people or property resulting from any ideas, methods, instructions or products referred to in the content.