1. Introduction
Smart manufacturing is reshaping production by embedding recent technological advances into factory workflows and thereby creating systems that are both highly flexible and resilient. This integration allows plants to respond quickly to changing customer preferences and volatile market conditions [
1,
2]. Through pervasive use of the Internet of Things (IoT), Artificial Intelligence (AI) techniques, and sophisticated analytics, firms can achieve end-to-end digital links between machines, information platforms, and physical assets. Such connectivity improves real-time visibility and control, and it supports decentralized decision processes in which intelligent subsystems adjust operating parameters on the fly to keep performance at its peak [
3].
Within this environment, cognitive and autonomous production lines learn continuously from data, anticipate disruptions, and fine-tune their own settings without direct human oversight. The result is a marked lift in product capability and throughput. Because these data-centered methods shorten reaction times, manufacturers can realign processes quickly whenever market signals shift. Interoperability, a core principle of smart manufacturing, ensures that heterogeneous devices and software platforms exchange information effortlessly, raising overall efficiency [
4,
5,
6,
7,
8]. Firms that cultivate agile and highly responsive shop floors routinely secure greater productivity and tighter operating costs, outcomes that flow directly into revenue growth and a more resilient competitive footing. Thus, smart manufacturing is not a modest technical refinement; it represents a strategic leap toward production that is intelligent, efficient and sustainably profitable.
Large multinational corporations have already travelled a considerable distance down this path, although adoption levels still differ across planning, production, operations and logistics [
3]. Many of these enterprises now harness data analytics for evidence-based decisions, maintain Internet of Things networks that monitor lines in real time, employ AI-driven models for predictive maintenance, and introduce automation to remove bottlenecks and raise efficiency [
9]. Integrating such tools is indispensable for remaining competitive in the current volatile marketplace. Continuing improvements among leading firms demonstrate how the approach accelerates innovation and operational performance, establishing a benchmark that smaller organizations increasingly feel compelled to reach.
Small and medium sized enterprises (SMEs), which underpin national industrial ecosystems, face a set of hurdles quite distinct from those encountered by multinationals. Their transition to digital production is frequently constrained by tight capital budgets, limited specialized expertise and the difficulty of scaling pilot projects to plant-wide practice. Nonetheless, digital production remains vital if these firms are to improve efficiency, consolidate their market position and satisfy customer expectations within an increasingly connected economy.
This study begins by pinpointing the specific requirements of smaller manufacturers undertaking that transition. It then reviews existing readiness, maturity and assessment models for smart manufacturing, evaluating the extent to which each one reflects SME realities. The analysis exposes several design gaps and culminates in a recommendation that new frameworks crafted especially for SMEs should be developed.
Research Objectives and Questions
Despite the growing number of maturity and readiness models proposed in the context of Industry 4.0, most remain either overly generalized for SMEs or insufficiently grounded in emerging market contexts like India. Existing frameworks often lack operational clarity, rely on rigid scoring mechanisms, or fail to account for sector-specific digital constraints. Moreover, there is a paucity of readiness assessments rooted in both expert validation and empirical clustering of SMEs based on real-world digital maturity levels. These limitations point to a clear research opportunity to adapt a robust international framework to India’s automotive SME ecosystem, validate its relevance through field data, and offer actionable segmentation of firms for targeted policy and managerial interventions. In response to these identified gaps, this study pursues the following objectives:
What is the current state of smart manufacturing readiness among Indian automotive-sector SMEs across six core dimensions?
How do internal capabilities such as workforce skills, strategic intent, and IT infrastructure correlate with observed levels of digital maturity?
What typologies emerge when SMEs are clustered based on readiness profiles, and how can these inform targeted policy interventions and ecosystem strategies?
These objectives stem from key shortcomings observed in prior maturity models, especially their limited fit for SMEs, lack of empirical grounding, absence of tier-zero readiness benchmarks, and minimal treatment of contextual constraints like infrastructure, funding gaps, or workforce digital alignment. This study attempts to bridge these gaps through a re-calibrated assessment framework rooted in the well-established IMPULS model but customized for small firms in emerging markets.
3. Maturity Models
SME readiness for smart manufacturing can be defined as the capacity of smaller firms to exploit new production opportunities, manage associated risks, and stay resilient during industrial change. Hamidi et al. adapted the IMPULS maturity model for Malaysian SMEs to measure readiness [
17]. Pirola et al. assessed twenty Italian SMEs using an Industry 4.0 lens [
21]. Ganzarain and Errasti proposed a three-stage framework with goals, actions, and challenges for initial, intermediate, and advanced phases [
22]. Kolla et al. created an assessment tool blending lean principles with Industry 4.0 for manufacturing SMEs [
23].
Since 2011, researchers have produced numerous frameworks to monitor digital preparedness. Rockwell Automation’s Connected Enterprise Maturity Model addresses large firms in five stages: auditing IT-OT infrastructure; securing and upgrading networks; structuring data; applying analytics for continuous improvement; and fostering organization-wide collaboration to enhance responsiveness and cut costs [
24].
Geissbauer et al. introduce the PwC model, which places companies at four maturity levels—digital novice, vertically integrated, horizontal collaborator, and digital champion—and assesses eight areas: digital business models, digital products, value-chain integration, data analytics, IT adaptability, compliance and security, legal and tax matters, and creation of a digital culture [
25].
Schumacher et al. present the Industry 4.0 Maturity Index, evaluating seven dimensions: strategy, leadership, culture, personnel, governance, technology, and processes, classifying firms from Initial to Optimizing. The index guides companies in identifying gaps and planning structured improvement [
26].
The IMPULS Industry 4.0 readiness framework has recently gained widespread acceptance. Originally designed to assess the digital preparedness of German SMEs, the IMPULS model evaluates six core dimensions: Strategy and Organization, Smart Factory, Smart Operations, Smart Products, Data-Driven Services, and Employees, through a structured set of 18 indicators. However, given that the model was formulated in the context of German manufacturing ecosystems, it assumes infrastructural and organizational capabilities that many SMEs in emerging economies like India may lack. To address this gap, the present study adapts and extends the original IMPULS framework by expanding it to 43 indicators, adding Tier-0 readiness levels for firms yet to initiate digital transformation, and recalibrating the assessment criteria to reflect the specific constraints faced by Indian Tier-2 and Tier-3 automotive SMEs. This contextual adaptation ensures that the model remains diagnostically relevant and operationally practical for resource-constrained firms while retaining the structural rigor of the original IMPULS methodology.
Strategy and Organization: Industry 4.0 transformation starts with a clear corporate strategy and supportive culture. Organizations must articulate a digital vision and align their structure, leadership and resource plans with Industry 4.0 goals. For instance, Vogel-Heuser and Hess and Ghobakhloo emphasize that firms need a comprehensive strategic roadmap to guide the transition to a fully digital enterprise [
27,
28]. In practice, leading companies have launched top-down initiatives to drive this alignment. Siemens, for example, has introduced a “Digital Enterprise” strategy that integrates its global manufacturing and IT systems. This integration enables greater operational flexibility, shorter time to market, and enhanced product quality. Surveys corroborate that culture and leadership are as important as technology: PwC found that companies often cite “a lack of digital culture and skills” as their biggest barrier, more so than any particular hardware or software [
18]. Thus, a successful I4.0 strategy involves not only technology investment but also organizational change (new roles, cross-functional teams, agile processes) and executive commitment to foster innovation and continuous learning [
29].
Smart Factory: The Smart Factory dimension examines the factory as a network of Cyber–Physical Systems (CPS) that largely automate and self-organize production. A smart factory is characterized by pervasive sensors, intelligent machines and embedded communications that allow equipment and products to coordinate autonomously. In such a factory, manufacturing steps and material flows can be reconfigured in real time: systems continuously read data tags on products and make scheduling decisions without human intervention. The result is often called “lights-out” manufacturing, with high flexibility and efficiency [
30]. For example, contemporary factories deploy fleets of Automated Guided Vehicles (AGVs) and robotic work cells that adjust their tasks on the fly based on production demands. Siemens reports that customers using its Digital Enterprise solutions have achieved “greater flexibility, shorter times to market, higher efficiency and better quality” through this approach. In general, Industry 4.0 envisions a shift “from adaptive manufacturing… to autonomous manufacturing, increasing efficiency and productivity through intelligent, interconnected factories”.
Smart Operations: Smart Operations refers to tightly integrated Information Technology/Operational Technology (IT/OT) infrastructures and analytics that optimize the entire workflow. In practice, this means connecting data from the shop floor (machines, sensors, robots) with enterprise IT systems (Enterprise Resource Planning (ERP), Manufacturing Execution System (MES), supply-chain and quality software) to enable real-time decision loops. For example, companies now build digital-twin models of factory lines that can be simulated and adjusted virtually before physical deployment. By unifying OT and IT data, advanced analytics and AI can continuously “sense–respond–decide–do,” automatically tuning production parameters, scheduling maintenance and adjusting orders as conditions change. Oracle describes smart operations as mixing OT data from production lines with business data, then feeding AI-generated insights back to adjust operations without human intervention [
31]. This closed feedback loop boosts overall equipment effectiveness and drives “lights-out” automation. As one industry review notes, in a smart factory “technologies like digital twins enable precise simulations, reducing errors and enabling… customized products” through such integrated data flows
Smart Products: Smart Products are physical goods enhanced with embedded ICT (sensors, processors, software and connectivity) so they can capture data and interact with their environment. Kolla et al. coined the term “smart, connected products” to describe systems that combine hardware, sensors, data storage, and connectivity into a single package [
23]. These products can monitor their own status, report usage and even control themselves via remote software updates. For example, modern automotive and aerospace components are laden with sensors: GE and Rolls-Royce jets incorporate dozens of real-time sensor feeds that relay engine performance data during flights. Tesla’s electric cars and industrial IoT devices (e.g., smart meters, intelligent HVAC systems) similarly send continuous data to manufacturers. Embedding such ICT enables features like real-time tracking, usage monitoring and over-the-air updates. As Rauch et al. noted, this heralds “a new era” where products are complex technical systems with continuous data flows. In sum, Smart Products turn ordinary equipment into data sources—the raw material for analytics and new services [
32].
Data-Driven Services: Data-Driven Services refers to the new services and business models enabled by analyzing the data collected from products and processes. Industry 4.0 greatly expands the scope for servitization: instead of selling hardware alone, companies can offer performance-based and analytics-based services. As one literature review observes, “connecting products enables manufacturers to provide services such as predictive maintenance and remote control”. In practice, this means using operational data to add value. For instance, Rolls-Royce now sells “Power by the Hour” maintenance contracts for jet engines: sensors on each engine stream performance metrics, and Rolls-Royce continuously analyzes that data to optimize maintenance schedules. The manufacturer thus assumes full responsibility for engine health, using analytics to minimize downtime. Similarly, companies like Siemens (with MindSphere) and General Electric (with Predix) offer cloud-based platforms that turn machine data into actionable insights for customers. In short, by leveraging big data analytics, manufacturers transform one-time product sales into ongoing digital services and outcome-based contracts, enriching their value proposition and creating new revenue streams [
33].
Employees: Employees are the enablers of Industry 4.0, and their skills and adaptability are critical. Industry 4.0 requires new technical competencies (data analytics, cyber-security, robotics, etc.) as well as soft skills (cross-disciplinary collaboration, continuous learning) [
34]. Analysts warn that by 2025 roughly half of all workers will need reskilling to meet Industry 4.0 demands. In fact, companies often find the skills gap to be the most difficult obstacle: Widayani reports that many manufacturers cite “a lack of digital culture and skills” as the top implementation challenge [
35]. To address this, forward-looking firms invest heavily in training and education. For example, Siemens operates global training centers and co-innovation labs to up-skill factory workers in automation and data literacy. Overall, the “Employees” dimension gauges whether the workforce has the readiness in both mindset and know-how to adopt digital tools. In a well-prepared organization, employees embrace change through lifelong learning and are equipped for Industry 4.0 roles; in contrast, a rigid or undertrained workforce will significantly slow the digital transformation [
36].
Although each model offers a structured procedure for evaluating maturity, the literature makes clear that SME readiness is multidimensional. Hamidi et al. focus chiefly on technology, culture, skills, finance, and process integration when studying Malaysian firms [
17]. Pirola et al. add technological infrastructure and external ecosystems to their assessment, while Ganzarain and Errasti emphasize awareness, strategic vision, and explicit road-mapping [
21,
22]. The resulting diversity highlights the complexity of Industry 4.0 readiness and reinforces the need for models that match the varied contexts and constraints of smaller firms.
Various frameworks have been proposed over the past decade to assess the maturity of Industry 4.0 adoption, especially in manufacturing environments [
37]. However, many of these models were designed for large enterprises or advanced economies and are often ill-suited for assessing the smart manufacturing readiness of resource-constrained SMEs. A comparative understanding of these models provides a theoretical foundation for customizing more context-appropriate approaches [
38].
Table 1 below summarizes selected maturity and readiness models developed globally. It outlines each framework’s core focus areas, applicability, scoring mechanism, and key limitations relevant to SMEs.
While the models compared in
Table 1 offer diverse theoretical approaches, many present limitations in terms of scalability, SME-relevance, and diagnostic utility. Some models rely on highly technical multi-criteria methods unsuitable for SMEs, while others lack contextual validation for emerging markets. Even the widely cited models often fall short in operationalizing smart manufacturing for enterprises with limited digital maturity or sectoral diversity, particularly common among Indian Tier-2 and Tier-3 suppliers [
45].
To retain academic depth while ensuring clarity, a full, detailed version of this comparison, including framework-specific dimensions, indicator structures, and scoring methodologies, is presented in
Supplementary Table S1. This extended table supports transparency and provides researchers with a richer foundation for understanding how global frameworks differ in scope and orientation.
In order to extract actionable insights, we further clustered the reviewed models by analyzing the nature and impact of their limitations. These clusters reflect common structural gaps in areas such as adoption complexity, sectoral generalization, and contextual misalignment. The results of this thematic categorization are presented in
Table 2, offering a synthesized view of where current maturity models fall short when applied to SME ecosystems. This gap analysis directly informed our adaptation of the IMPULS model to better suit the Indian automotive SME context.
Each study is distinct in its approach to exploring the dimensions necessary for successful smart manufacturing integration in small and medium enterprises. Notable amongst some of the academic literature available for SMEs is the work done by Chonsawat and Sopadang who, along with others, have proposed the following major dimensions [
46,
47]:
Business and Organizational Strategy: The first dimension, business and organizational strategy, underscores that Industry 4.0 readiness begins with strategic alignment that links a firm’s business model, culture and collaborative capacity. A forward-looking strategy joins disciplined financial planning with steady investment in digital infrastructure, structured innovation roadmaps and adaptable supply-chain design. Global manufacturers such as Bosch and Siemens have embedded long-term digital innovation into their corporate DNA, promoting real-time information sharing and end-to-end supply-chain visibility [
49]. Partnerships across the value chain further enable co-development of digital capabilities while safeguarding flexibility and resilience [
50].
Organizational Resilience: Organizational resilience in the context of Industry 4.0 is multifaceted, encompassing the adaptability of business models, the flexibility of strategic planning, and the robustness of supply chains [
51]. This concept refers to an enterprise’s capacity to absorb disruptions, respond effectively to crises, and recover stronger by integrating lessons into long-term strategic adjustments. According to Duchek, resilient organizations demonstrate dynamic capabilities that allow them to continuously evolve through proactive sensing, adaptation, and transformation [
47]. Leadership plays a critical role here: resilient firms typically have leadership structures that foster transparency, rapid decision-making, and employee empowerment [
18]. Furthermore, digital transformation enhances resilience by enabling real-time visibility into operations, which is crucial during supply chain disruptions such as those witnessed during the COVID-19 pandemic. Supply chain digital twins, for example, allow companies to simulate crisis scenarios and adjust procurement or logistics strategies accordingly. Hence, resilience is not merely about surviving disruptions but using them as catalysts for innovation and improved competitiveness [
42].
Infrastructure Systems: The strength of infrastructure systems lays the foundation for successful Industry 4.0 adoption. This includes the availability of high-speed networks, standardized communication protocols, scalable computing resources, and secure data exchange mechanisms [
52]. Infrastructure readiness is often an overlooked dimension, yet it plays a pivotal role in facilitating interoperability between different production and enterprise systems. As noted by Kolla, a lack of standardized infrastructure can significantly slow down digital integration, especially among SMEs with legacy systems. Investment in smart grid technologies, edge computing, and secure industrial IoT platforms is critical to ensure seamless data flow across machines, departments, and business units [
23]. Moreover, the development and adherence to global standards such as OPC UA and ISO/IEC 62264 enable integration of devices and systems from multiple vendors [
47]. Without a robust and standardized digital infrastructure, even the most advanced analytics tools cannot function effectively, leading to data silos and fragmented decision-making. Therefore, infrastructure is not just technical support but a strategic enabler of real-time intelligence and automation [
48].
Manufacturing Systems: Contemporary production operations can now adapt, learn and even self-optimize because of advances in cyber–physical systems, collaborative robotics and intelligent logistics. These technologies enable continuous, fine-grained coordination along production and supply networks, raising both flexibility and efficiency [
40]. Zuo et al. note that smart manufacturing fuses sensing, automation and control so that factories can switch from fixed-schedule batches to on-demand production, mass customization and rapidly adjusted logistics [
53]. Logistics activities in particular gain from artificial intelligence-based routing, predictive material replenishment and alignment with rolling demand forecasts. Amazon’s fulfilment centers, for instance, rely on mobile robots to reposition inventory and track items in real time, sharply shortening lead times and cutting errors. Decentralized options such as additive manufacturing are also reshaping where items are produced, allowing localized hubs closer to end users. The evolution of manufacturing systems therefore extends far beyond simple automation and redefines production around responsiveness, accuracy and long-term sustainability.
Technology-Driven Processes: Digitally mature firms use a variety of technology enablers to optimize production and logistics workflows. Cloud computing, cyber–physical systems (CPS), and advanced IT infrastructure enable seamless data collection and process integration. Real-time data analysis and distribution control help businesses shift from reactive to predictive operations. For instance, General Electric’s “Brilliant Factory” model uses self-optimizing systems that dynamically adapt based on real-time performance data [
41].
Data Transformation: Data transformation encompasses the capture, transmission, cleansing, integration and interpretation of live data drawn from many points inside an enterprise. Within Industry 4.0, information is the decisive asset that directs decision making, automation and innovation. The sequence begins with sensor collection at the edge, moves through secure industrial networks such as generation mobile network (5G) or time-sensitive networking, and finishes with real-time processing on cloud or edge platforms. Widayani emphasize that converting raw operational data into actionable insight strengthens both responsiveness and efficiency [
35]. Data lakes, application-programming-interface-enabled systems and semantic middleware help standardize and merge diverse datasets. A common illustration is predictive maintenance in automotive plants, where vibration and temperature signals trigger alerts and maintenance schedules via machine-learning models. Robust data transformation, in turn, supports digital twins, scenario simulations and closed feedback loops across interconnected systems [
54].
Digital Technology and Support System: Digital technology supplies the operational backbone of Industry 4.0 by providing connectivity, intelligence and protection across organizational processes. Large-scale analytics let firms detect patterns and anomalies in intricate datasets, thereby improving quality control, supply-chain transparency and customer insight. Robust digital support layers enhance every stage of production and decision-making. These include big data analytics, digital modeling, and advanced ICT platforms. Digital twins, for instance, allow real-time simulation of factory conditions, informing strategic decisions. Pirola et al. show that predictive analytics and artificial intelligence not only heighten efficiency but also unlock fresh business models [
21]. Tracking solutions such as radio-frequency identification and blockchain raise traceability and trust, especially in tightly regulated sectors like pharmaceuticals and aerospace. Predictive-maintenance platforms that combine Internet-of-Things inputs with machine-learning algorithms help organizations avoid unplanned downtime and optimize asset performance. Meanwhile, cyber-security has become a strategic concern, since cyber–physical systems and connected devices enlarge the attack surface of factories. IT security is equally crucial, as increasing interconnectivity amplifies vulnerability to cyber threats [
50]. Secure and scalable systems ensure that digital services remain reliable, agile, and insightful. Adopting artificial-intelligence-driven threat detection and zero trust architecture keeps systems secure without limiting interconnectivity. For example, BMW’s smart factories utilize AI-powered systems to coordinate robotic assembly and human intervention with high precision [
47]. Integration of these technologies leads to responsive, efficient, and safer operations. Digital technologies are therefore integrated enablers of resilience, agility and continual innovation rather than isolated tools.
People Capability: Human capital remains central to any successful digital transformation. Firms must continuously invest in skill development, leadership training, and digital up-skilling to meet the challenges of smart manufacturing. As Feng and Shanthiraman highlight, organizations with structured programs for workforce reskilling are better positioned to implement Industry 4.0 tools. Leadership also plays a pivotal role in driving change, fostering a culture of innovation and cross-functional collaboration [
4].
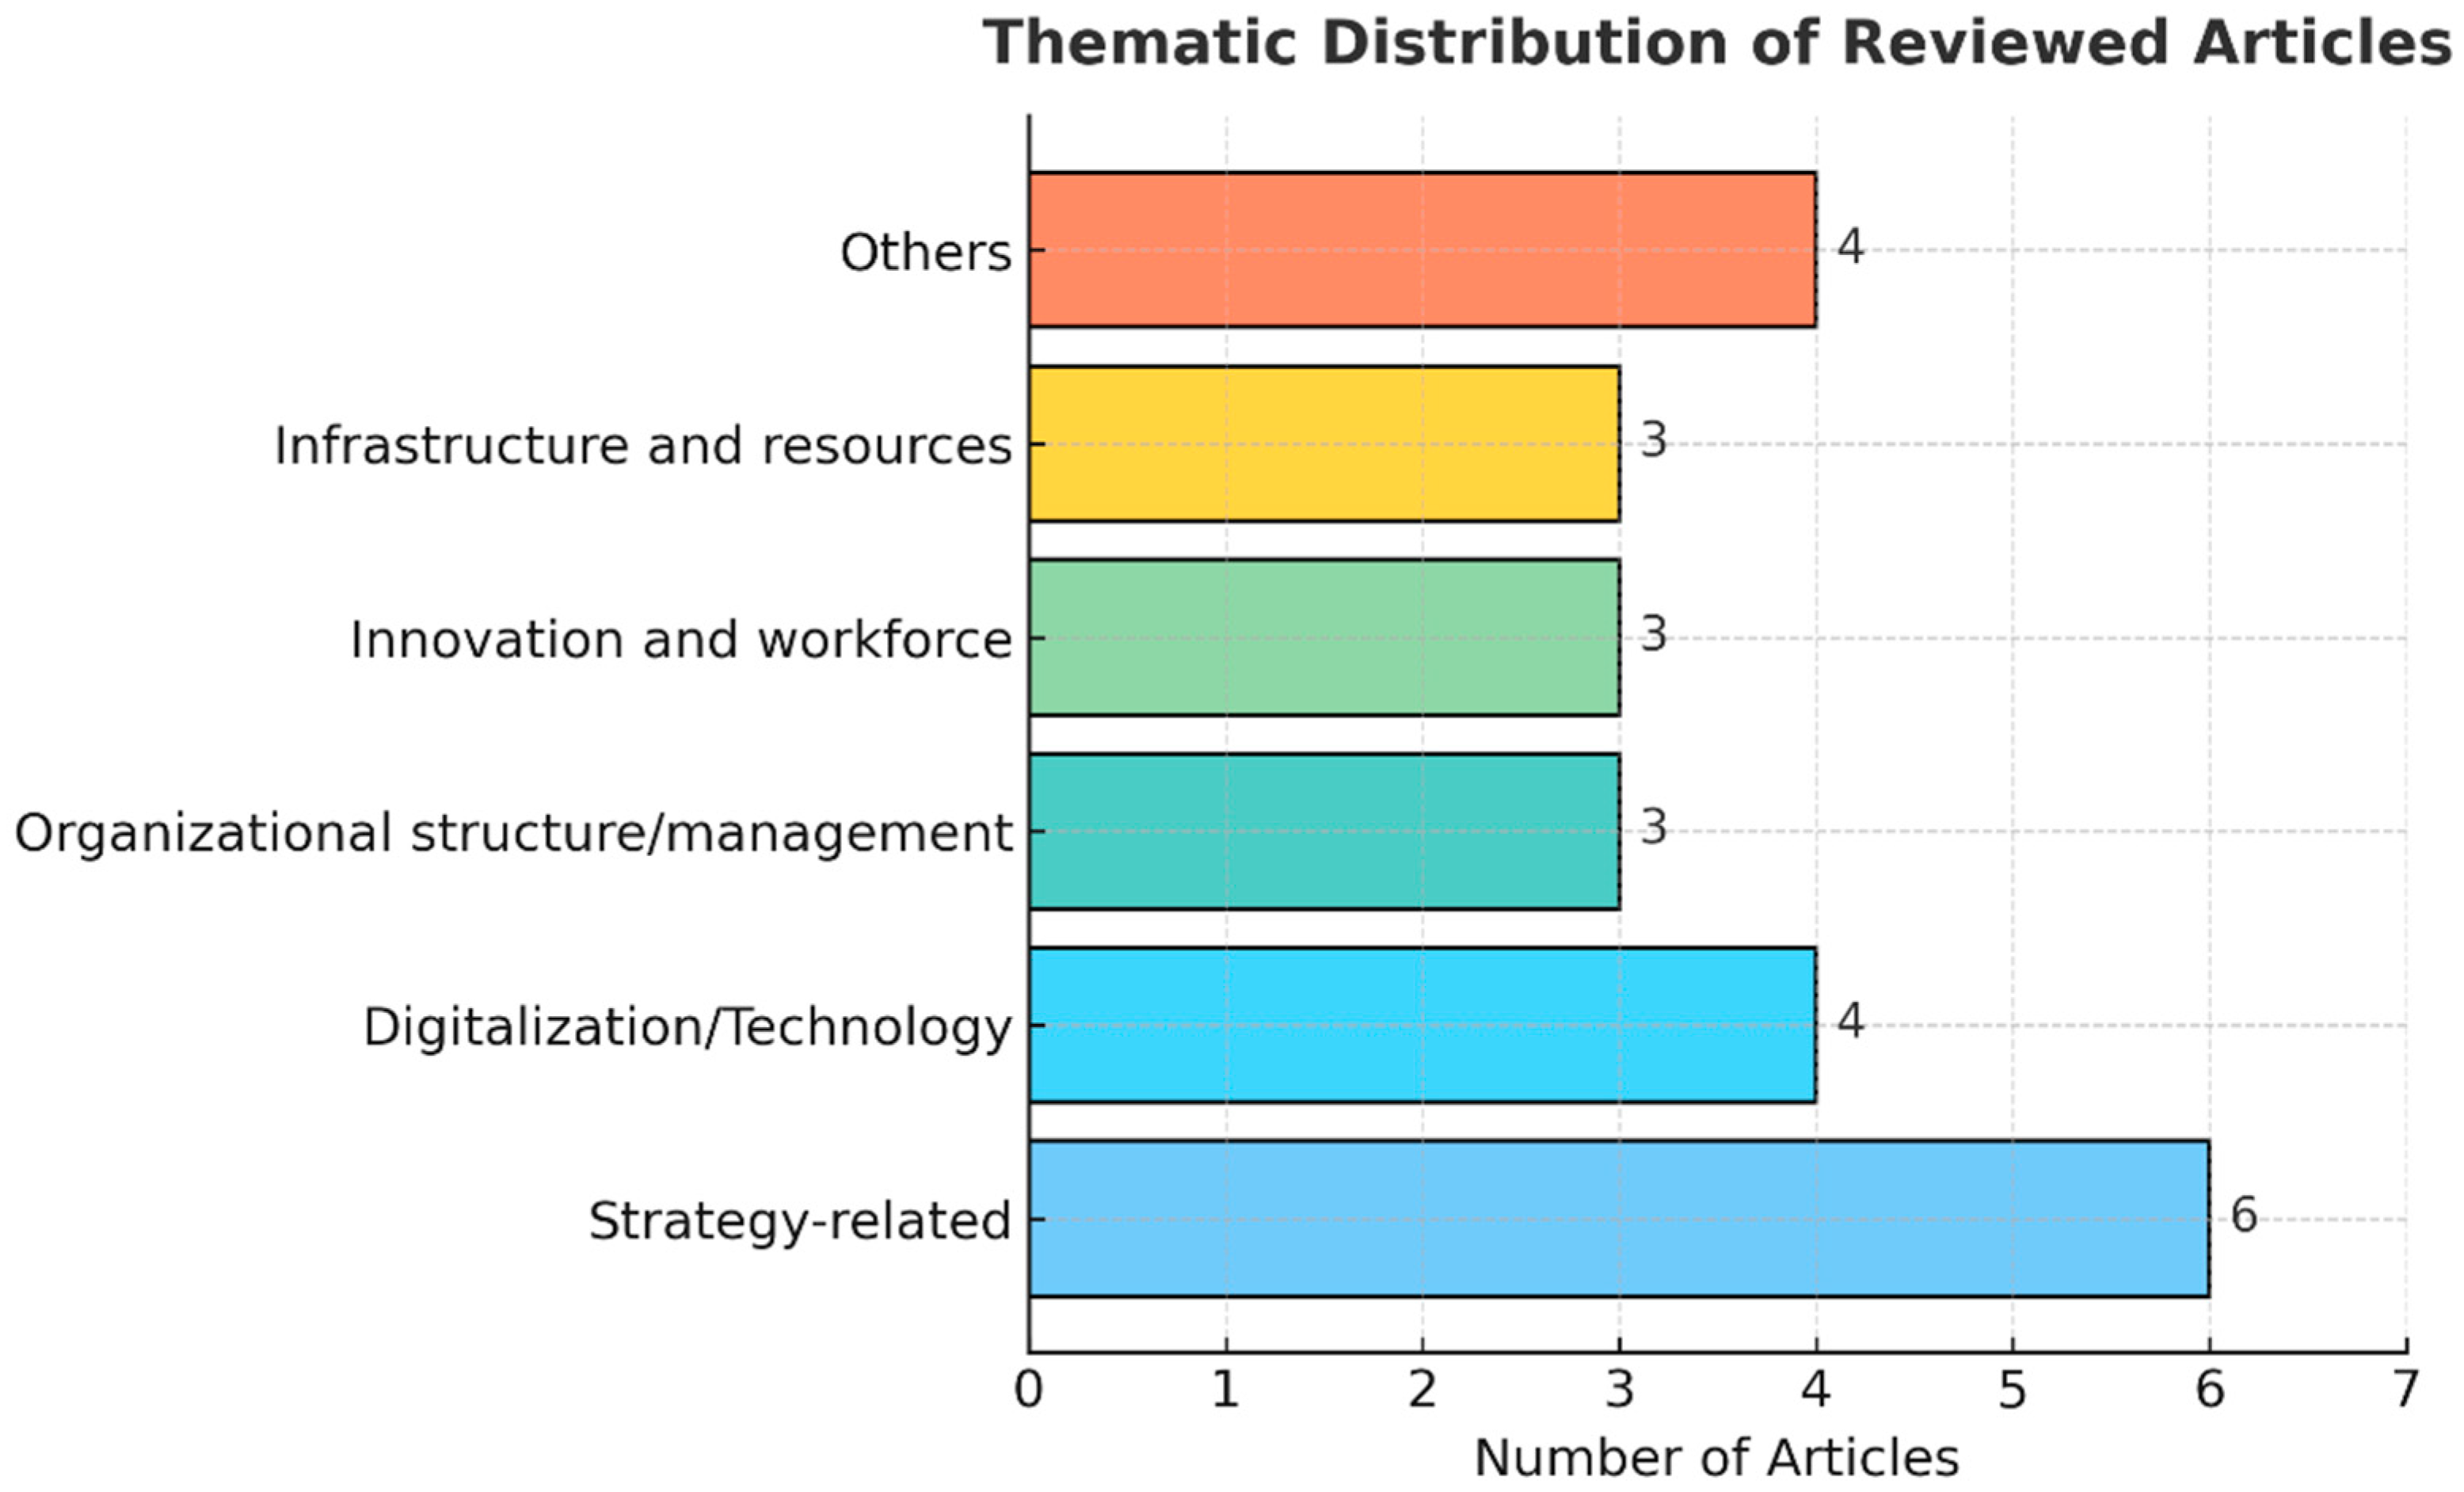
The frequency of articles addressing each major dimension such as strategy-related, digitalization/technology, organizational structure/management, and more are shown in
Figure 1.
Schumacher et al. introduced their own model by analyzing five existing models. Among these is the IMPULS—Industries 4.0 Readiness assessment by Lichtblau et al., which evaluates six dimensions across 18 Industry 4.0 fields [
26,
39]. The IMPULS model is based on solid scientific principles and has a clearly articulated structure. Given that the research question of this study focuses on the readiness levels of SMEs, the IMPULS model is likely the most appropriate choice as it assesses a company’s preparedness for Industry 4.0 implementation. Sony and Naik argue that the IMPULS framework is suitable across a wide range of industries, which supports its selection for the present study [
44]. In their review, Mittal et al. stress that SMEs face distinct hurdles when adopting smart-manufacturing tools and therefore require assessment models and readiness instruments shaped to their circumstances [
2]. Current readiness scales usually start large firms at level 1; yet manufacturing SMEs in emerging or low-income contexts often begin below that point, at what might be called level 0. As a result, many smaller firms cannot map their status onto the early tiers of standard models because their baseline levels of digitalization and automation are lower. To accommodate these realities, maturity frameworks must include an entry tier beneath the first level used for multinational enterprises. The effort an SME must invest to move from level 0 to level 1 is typically greater than the step from level 1 to level 2, underscoring the need for tailored guidance. Several maturity schemes in the literature also lack empirical testing and overlook crucial dimensions or departmental variations [
53].
Among the available tools, the IMPULS Industry 4.0 Readiness model is cited most often for gauging organizational preparedness. It evaluates six areas: strategy and organization, smart-factory capability, smart-operations processes, smart-product development, data-driven services, and workforce readiness. Hajoary applied this model to a steel producer in India to measure its Industry 4.0 maturity [
55].
The present article adapts the IMPULS framework specifically for small and medium-sized firms. A systematic literature review evaluates how SMEs perform across six dimensions: strategy, factory capability, operations, product innovation, data-driven services, and workforce skills. Based on this analysis, the study proposes new indicators that more precisely reflect the unique constraints faced by SMEs.
5. Results
To assess how well the proposed smart manufacturing readiness model applies to SMEs, we carried out a structured field survey between January and March 2024 among selected automotive-sector SMEs in India. This survey was administered in person followed by reminders through emails with company representatives—often operations managers or plant supervisors coming from small- and medium-sized enterprises within the Indian automotive manufacturing ecosystem. The full questionnaire used for this survey is provided in
Supplementary Materials.
In total, data were gathered from over 40 firms. This included large, well-known OEMs and suppliers such as Hero MotoCorp, Honda Cars India, Sharda Motor Industries, Isuzu Motors India Pvt. Ltd., Larsen & Toubro, and BEML Limited alongside smaller and mid-sized organizations like Nanochip Skills Pvt. Ltd., Varicon Pumps and Systems, and Besmak Components Pvt. Ltd. By choosing companies that vary in workforce size, annual turnover, and digital maturity, we aimed to capture a representative cross-section of Tier-1 and Tier-2 suppliers in India’s automotive supply chain.
5.1. Overview of the Analysis Process
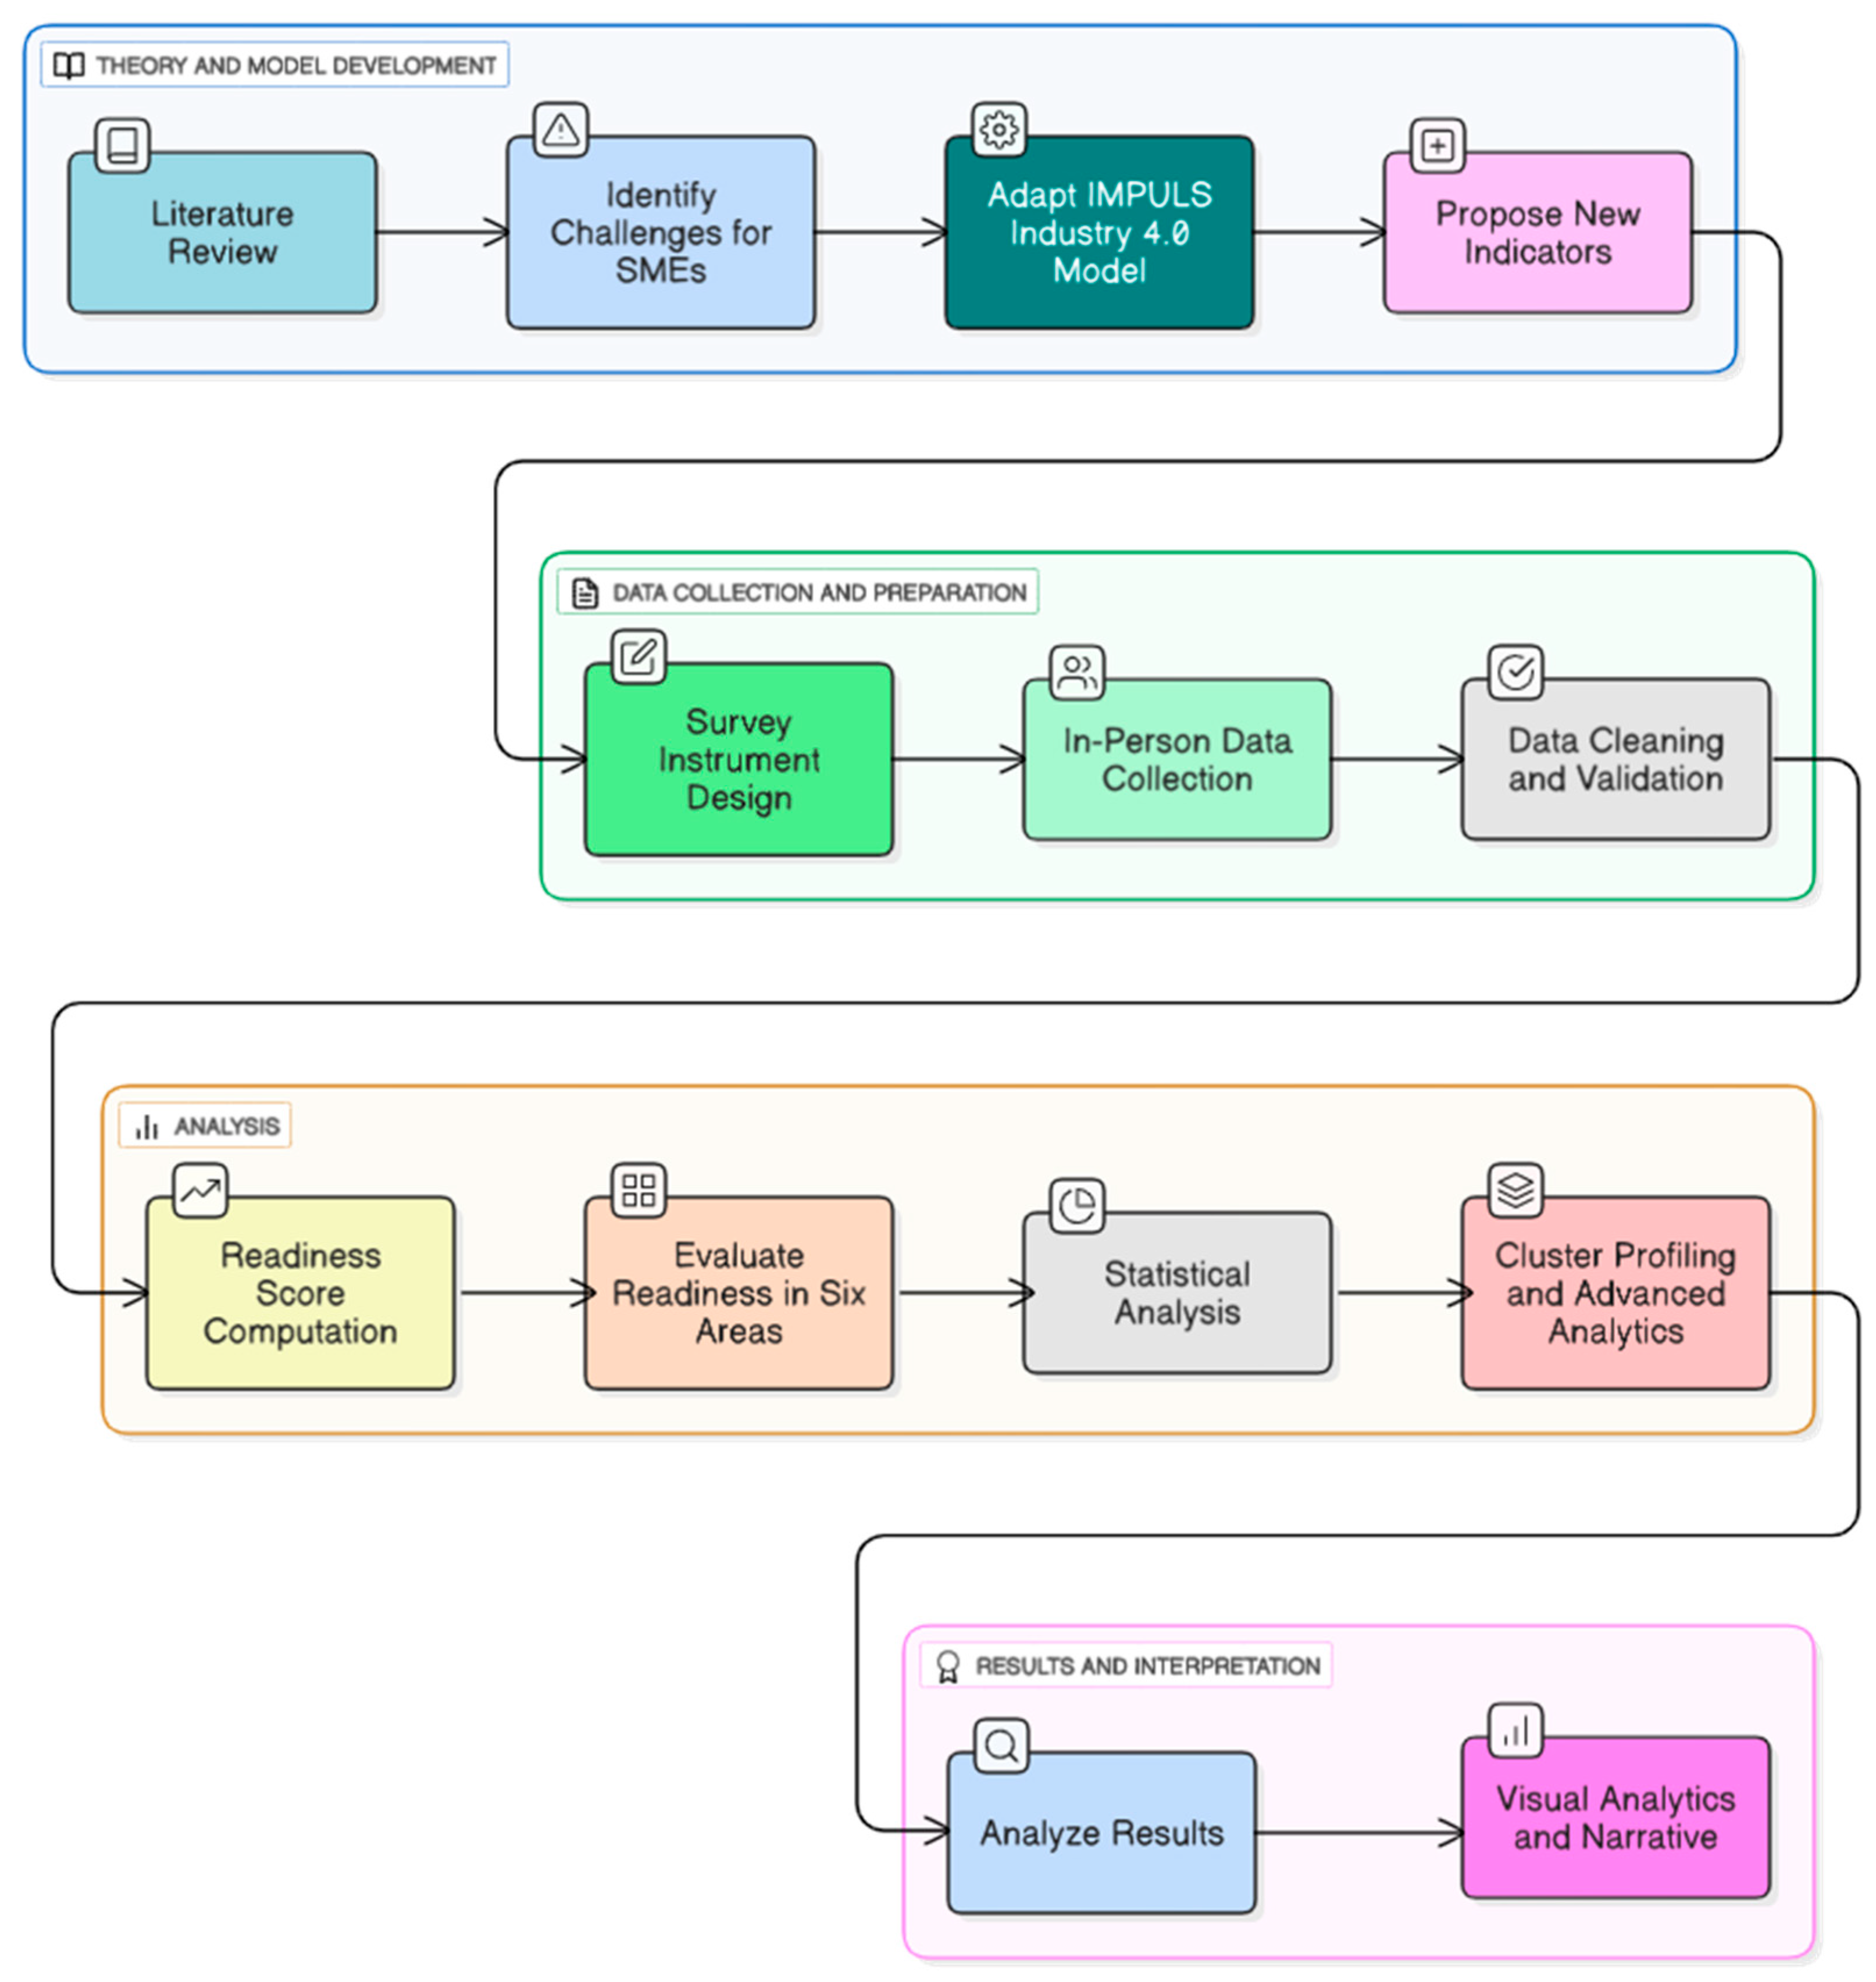
To ensure transparency and academic rigor, the complete methodology for data acquisition, transformation, and interpretation is summarized in the following flowchart (see
Figure 6).
This systematic process allowed us to convert raw organizational assessments into structured data representing readiness levels across critical smart manufacturing parameters. Statistical treatment included computation of means, standard deviations, Pearson correlation coefficients, and hierarchical clustering to reveal firm profiles and gaps.
5.2. Data Cleaning and Preprocessing
Before conducting the readiness analysis, a systematic data cleaning and preparation process was undertaken to ensure the integrity and usability of the survey responses. The original dataset comprised responses from 40+ automotive-sector SMEs in India. However, after initial review, the 43 indicators were derived by grouping related survey items under broader constructs as defined by the IMPULS model and literature adaptation (see
Supplementary Materials).
The 43 indicators employed in this study were adapted from the IMPULS Industry 4.0 Readiness Model [
39], refined through an iterative review of the recent academic literature (see
Table 1 and
Table 2) and expert consultations with ten domain specialists across academia and industry. Each of the six dimensions was restructured to better reflect the contextual realities, constraints, and transformation pathways of Indian SMEs. To ensure measurement validity, the instrument underwent two pilot surveys, and adjustments were made based on expert and respondent feedback regarding clarity, relevance, and applicability. Reliability analysis confirmed strong internal consistency, with Cronbach’s alpha exceeding 0.82 across all dimensions. Given the sample size of 31 firms, the study employed dimensionality reduction techniques and cross-validated clustering methods to enhance robustness and avoid over-fitting. Analytical focus was maintained at the aggregate level, ensuring that the interpretation of readiness indices and correlation structures remained statistically meaningful and generalizable within the scope of the study.
Several responses contained partial or missing entries, particularly in sections related to Smart Operations and Smart Products. To address this, the following data handling protocol was adopted: list-wise deletion was applied for firms missing more than 20% of responses across indicators, while mean imputation was used selectively at the indicator level for firms with two or fewer missing entries within a given dimension. This approach preserved the overall sample size without introducing significant bias or distorting variance. Categorical firm characteristics, such as workforce size and annual revenue, were recoded into ordinal variables to enable structured comparative analysis. All Likert-scale responses (1–5) were normalized prior to clustering and Principal Component Analysis (PCA), ensuring comparability across dimensions. The cleaned dataset was then exported in matrix form (firm × indicator) to serve as input for subsequent statistical and multi-criteria decision-making analyses. This preprocessing protocol strengthened the validity and reliability of the readiness assessment and clustering structures presented in the following sections
5.3. SME Demographics and Sampling Characteristics
This study analyzed data from 31 valid responses collected from Indian automotive-sector SMEs through structured, in-person surveys. The firms represent a diverse spectrum of size, scale, and technological maturity within the automotive value chain which ranges from small component manufacturers to high-tier suppliers.
A breakdown of company size reveals that 71% of the firms employed over 500 people, placing them in the upper end of the SME classification. Firms with 100–499 employees comprised around 16%, and those with fewer than 100 employees made up approximately 13% of the sample. In terms of financial scale, 68% of the surveyed firms reported annual turnover exceeding INR 2500 million, with the rest spread across lower turnover categories ranging from INR 50 million to INR 2500 million. This demographic spread, summarized in
Table 3 and
Table 4, indicates that a majority of respondents come from relatively mature SMEs with greater organizational complexity and investment capability.
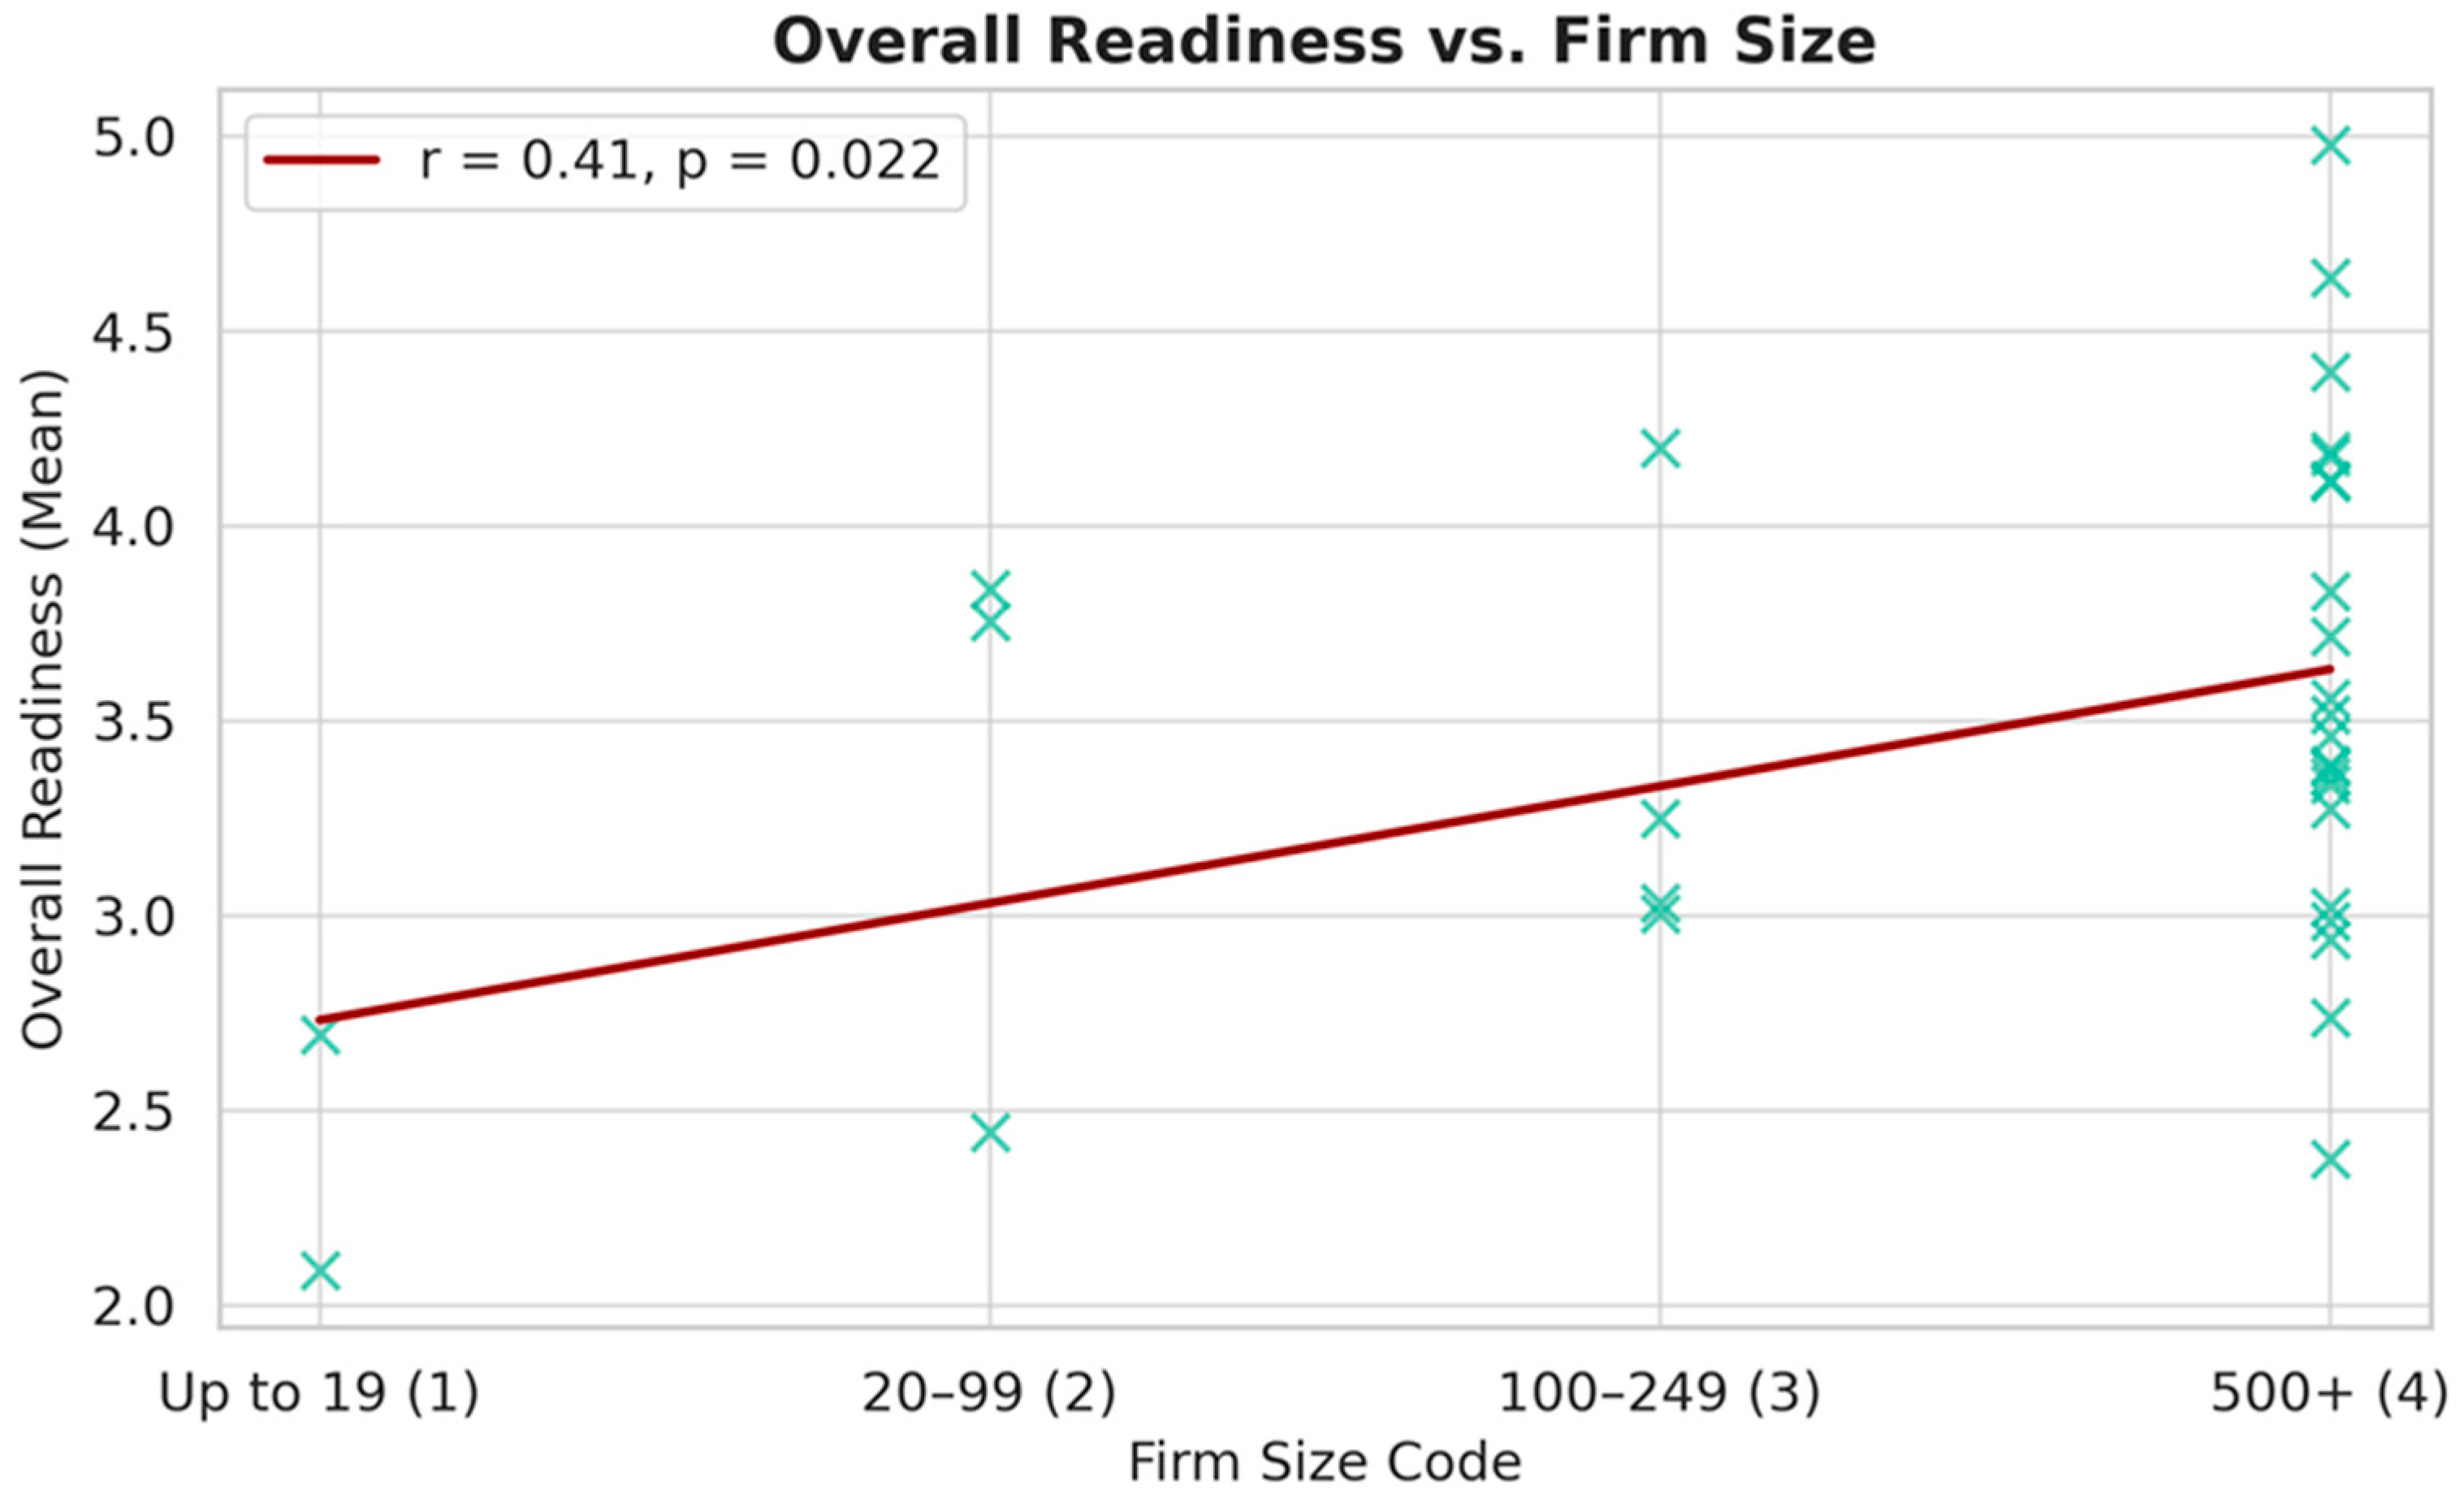
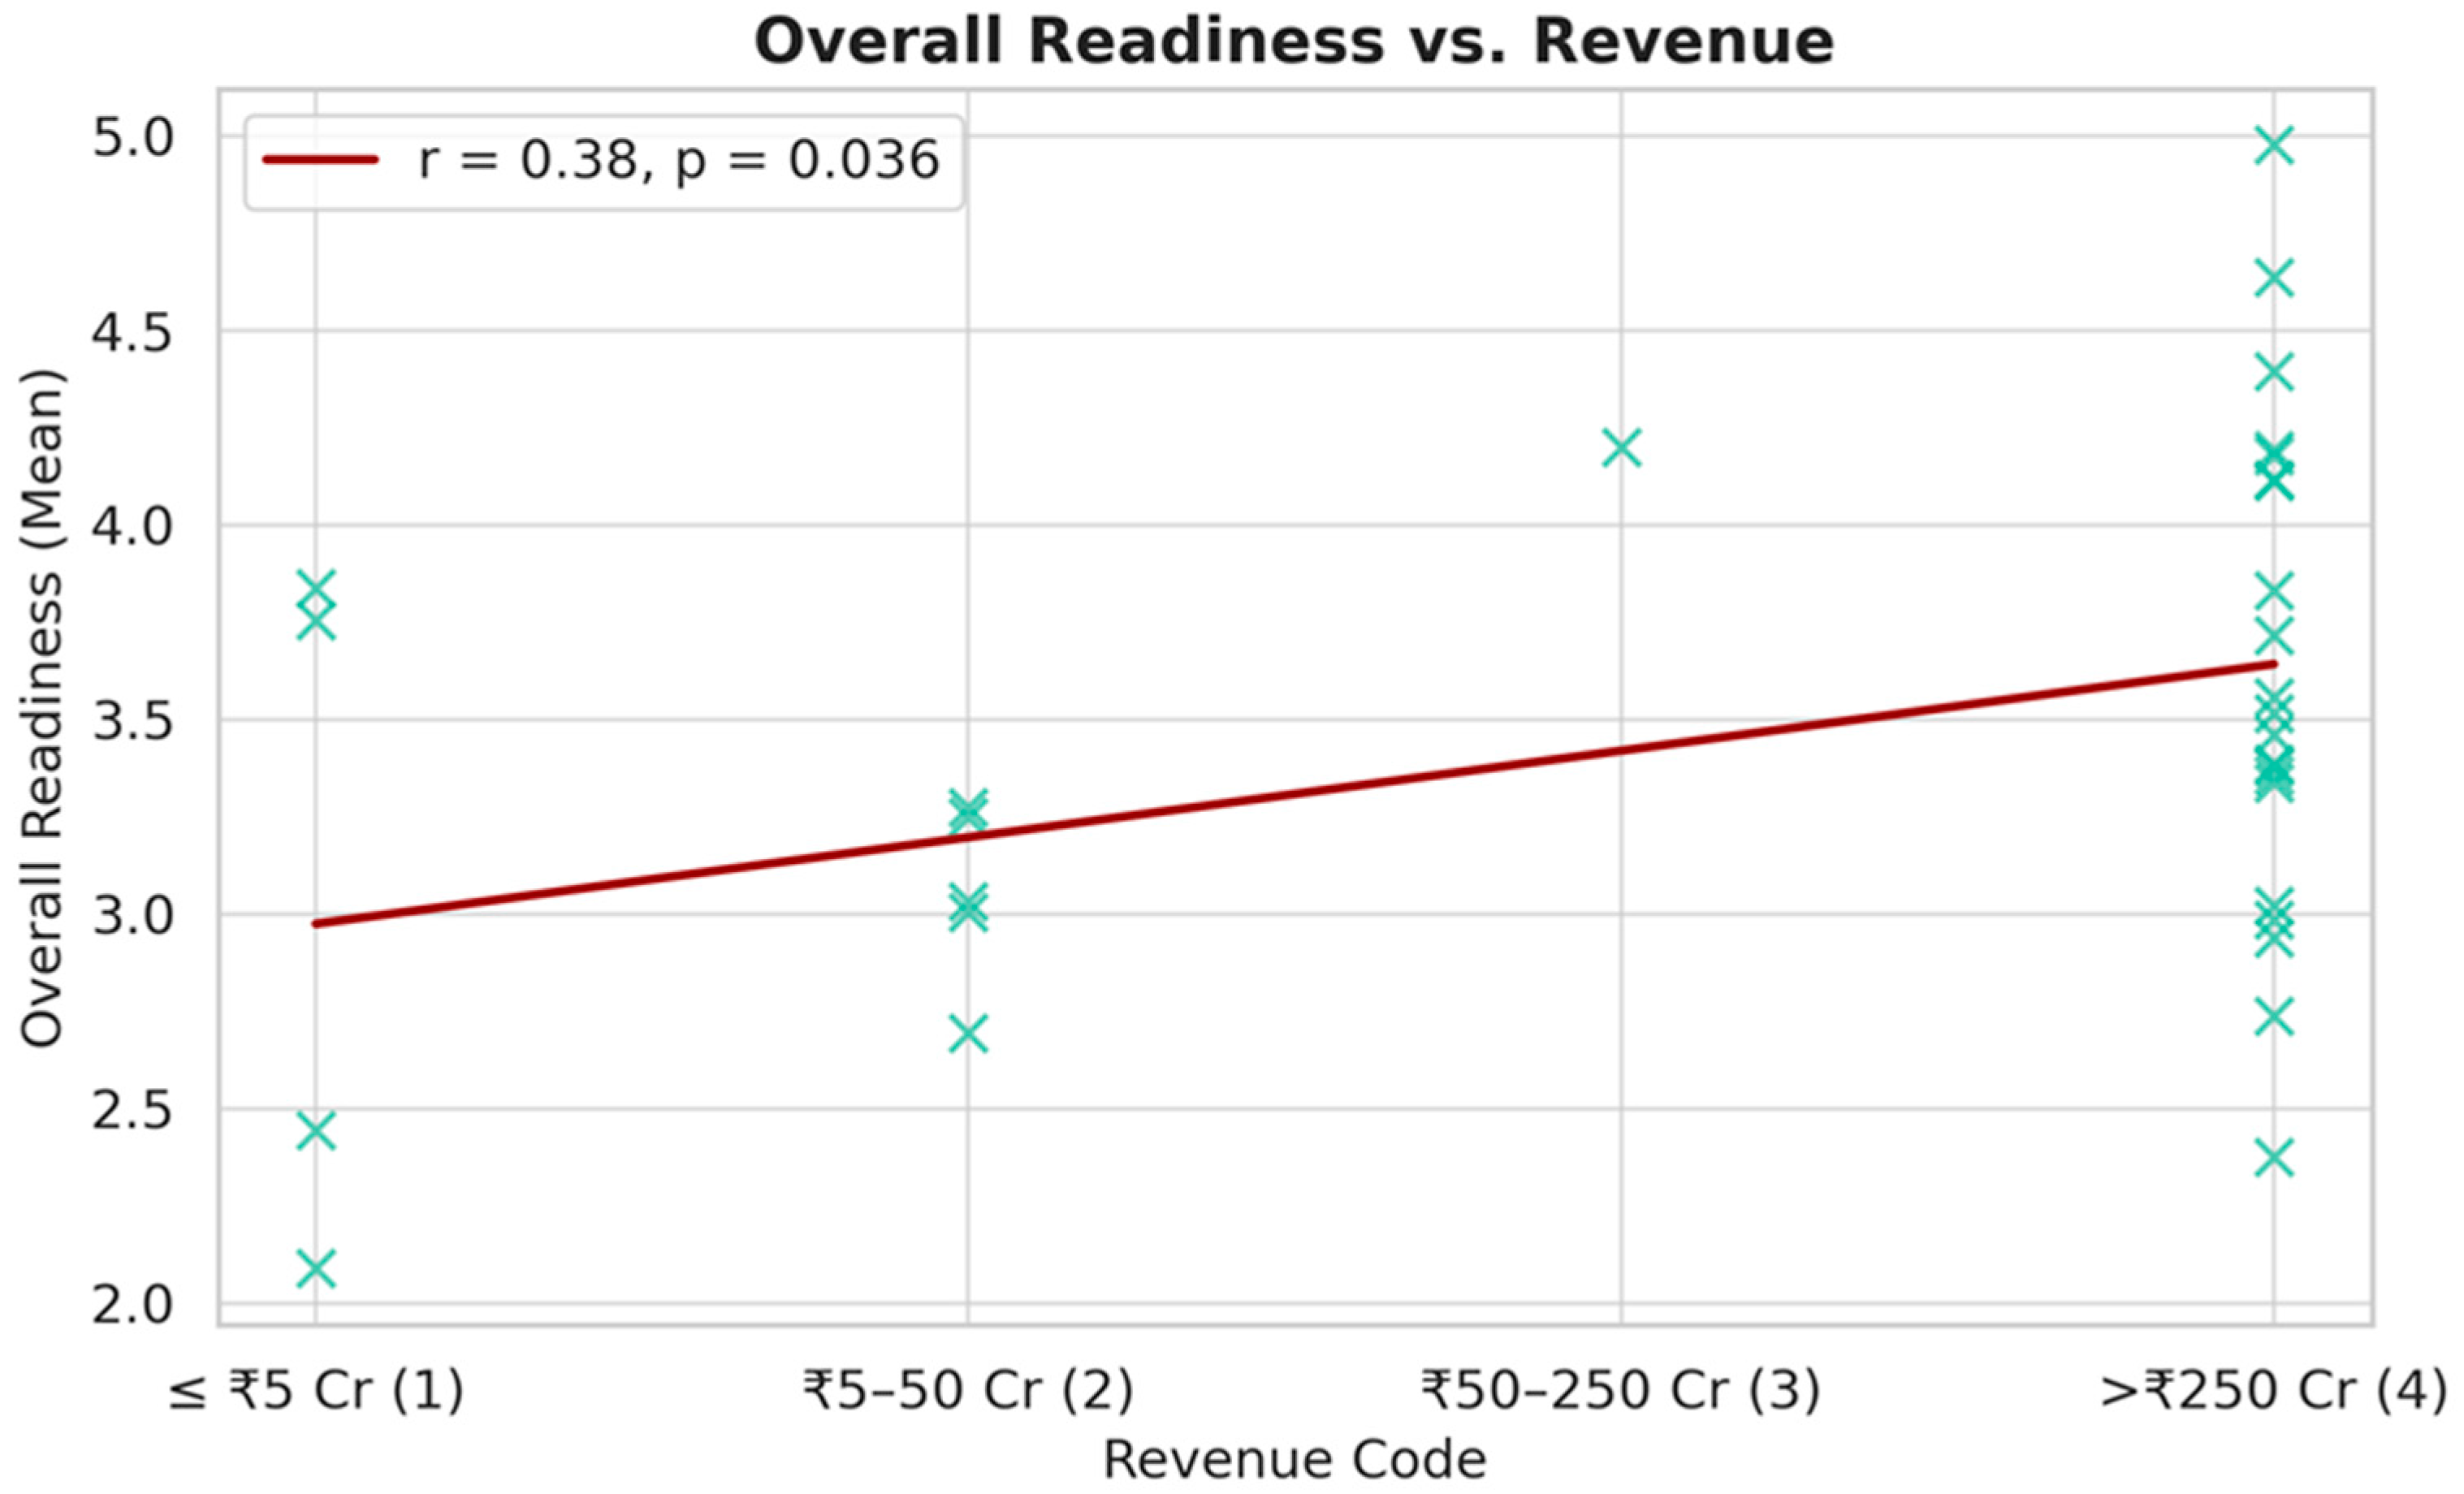
To investigate whether organizational characteristics influence smart manufacturing readiness, the relationship between firm size, revenue, and IMPULS-based dimension scores was explored.
Figure 7 and
Figure 8 illustrate the scatter plot of overall readiness index with respect to firm size and annual revenue, respectively. A moderate positive correlation (r ≈ 0.41) was observed between workforce size and average readiness score, particularly in Strategy, Workforce, and Smart Factory dimensions. Larger firms consistently reported more advanced practices in areas like strategic planning, employee training, and early-stage factory automation. Similarly, annual revenue showed a mild positive correlation with overall readiness (r ≈ 0.38), especially in data infrastructure and employee capability indicators, suggesting that financial strength contributes to both the capacity and willingness to invest in transformation.
5.4. Overall Smart Manufacturing Readiness
Respondents rated 43 indicators on a five-point Likert scale, reflecting both how far they have implemented each element and their strategic outlook for future adoption. To interpret these ratings, we adopted a tiered classification framework that clearly delineates an organization’s progression through Industry 4.0 maturity. Specifically:
Level 1 (Outsiders): Companies at this stage have little to no planning or implementation of Industry 4.0 initiatives.
Levels 2–5: These successive levels capture increasing stages of digital integration, automation, and optimization, culminating in full deployment of Industry 4.0 capabilities.
To establish a baseline, we computed the average readiness scores for each of the six IMPULS dimensions: Strategy (D1), Smart Factory (D2), Data-Driven Services (D3), Smart Operations (D4), Smart Products (D5), and Workforce (D6). The formula for overall readiness index is given as follows:
where
Ri denotes the overall readiness score of firm
i.
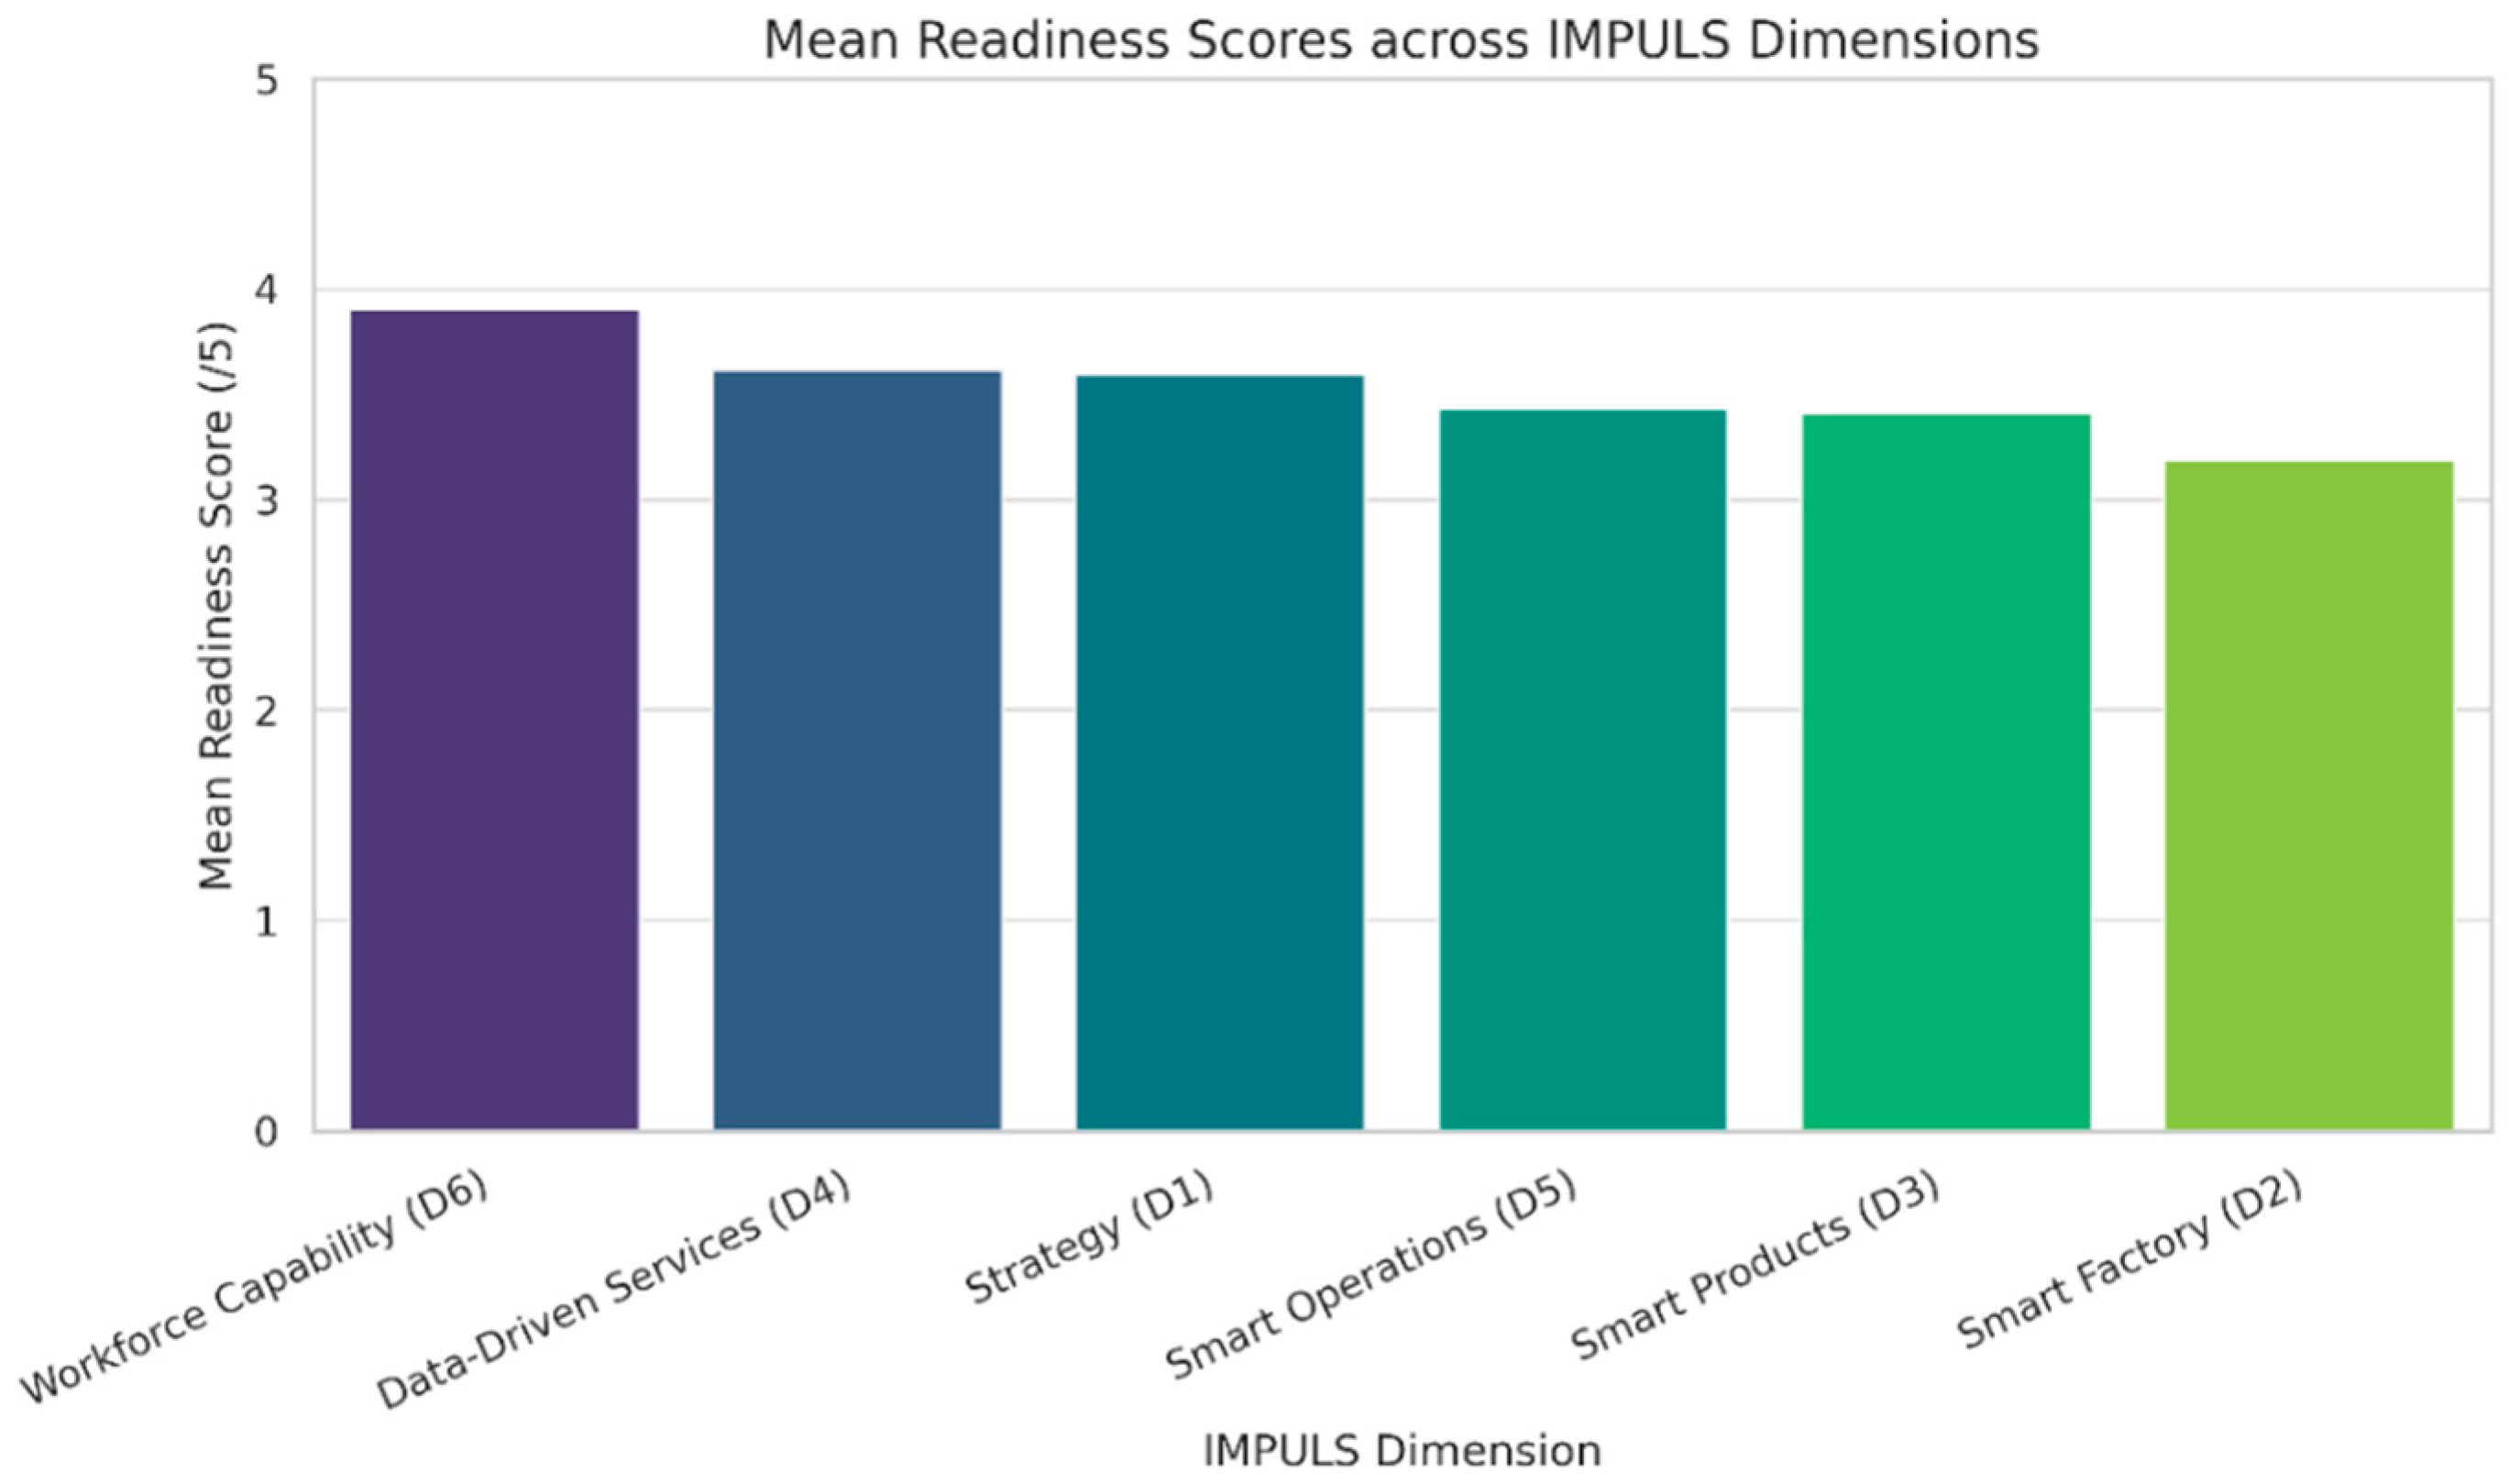
The readiness assessment reveals (see
Figure 9 and
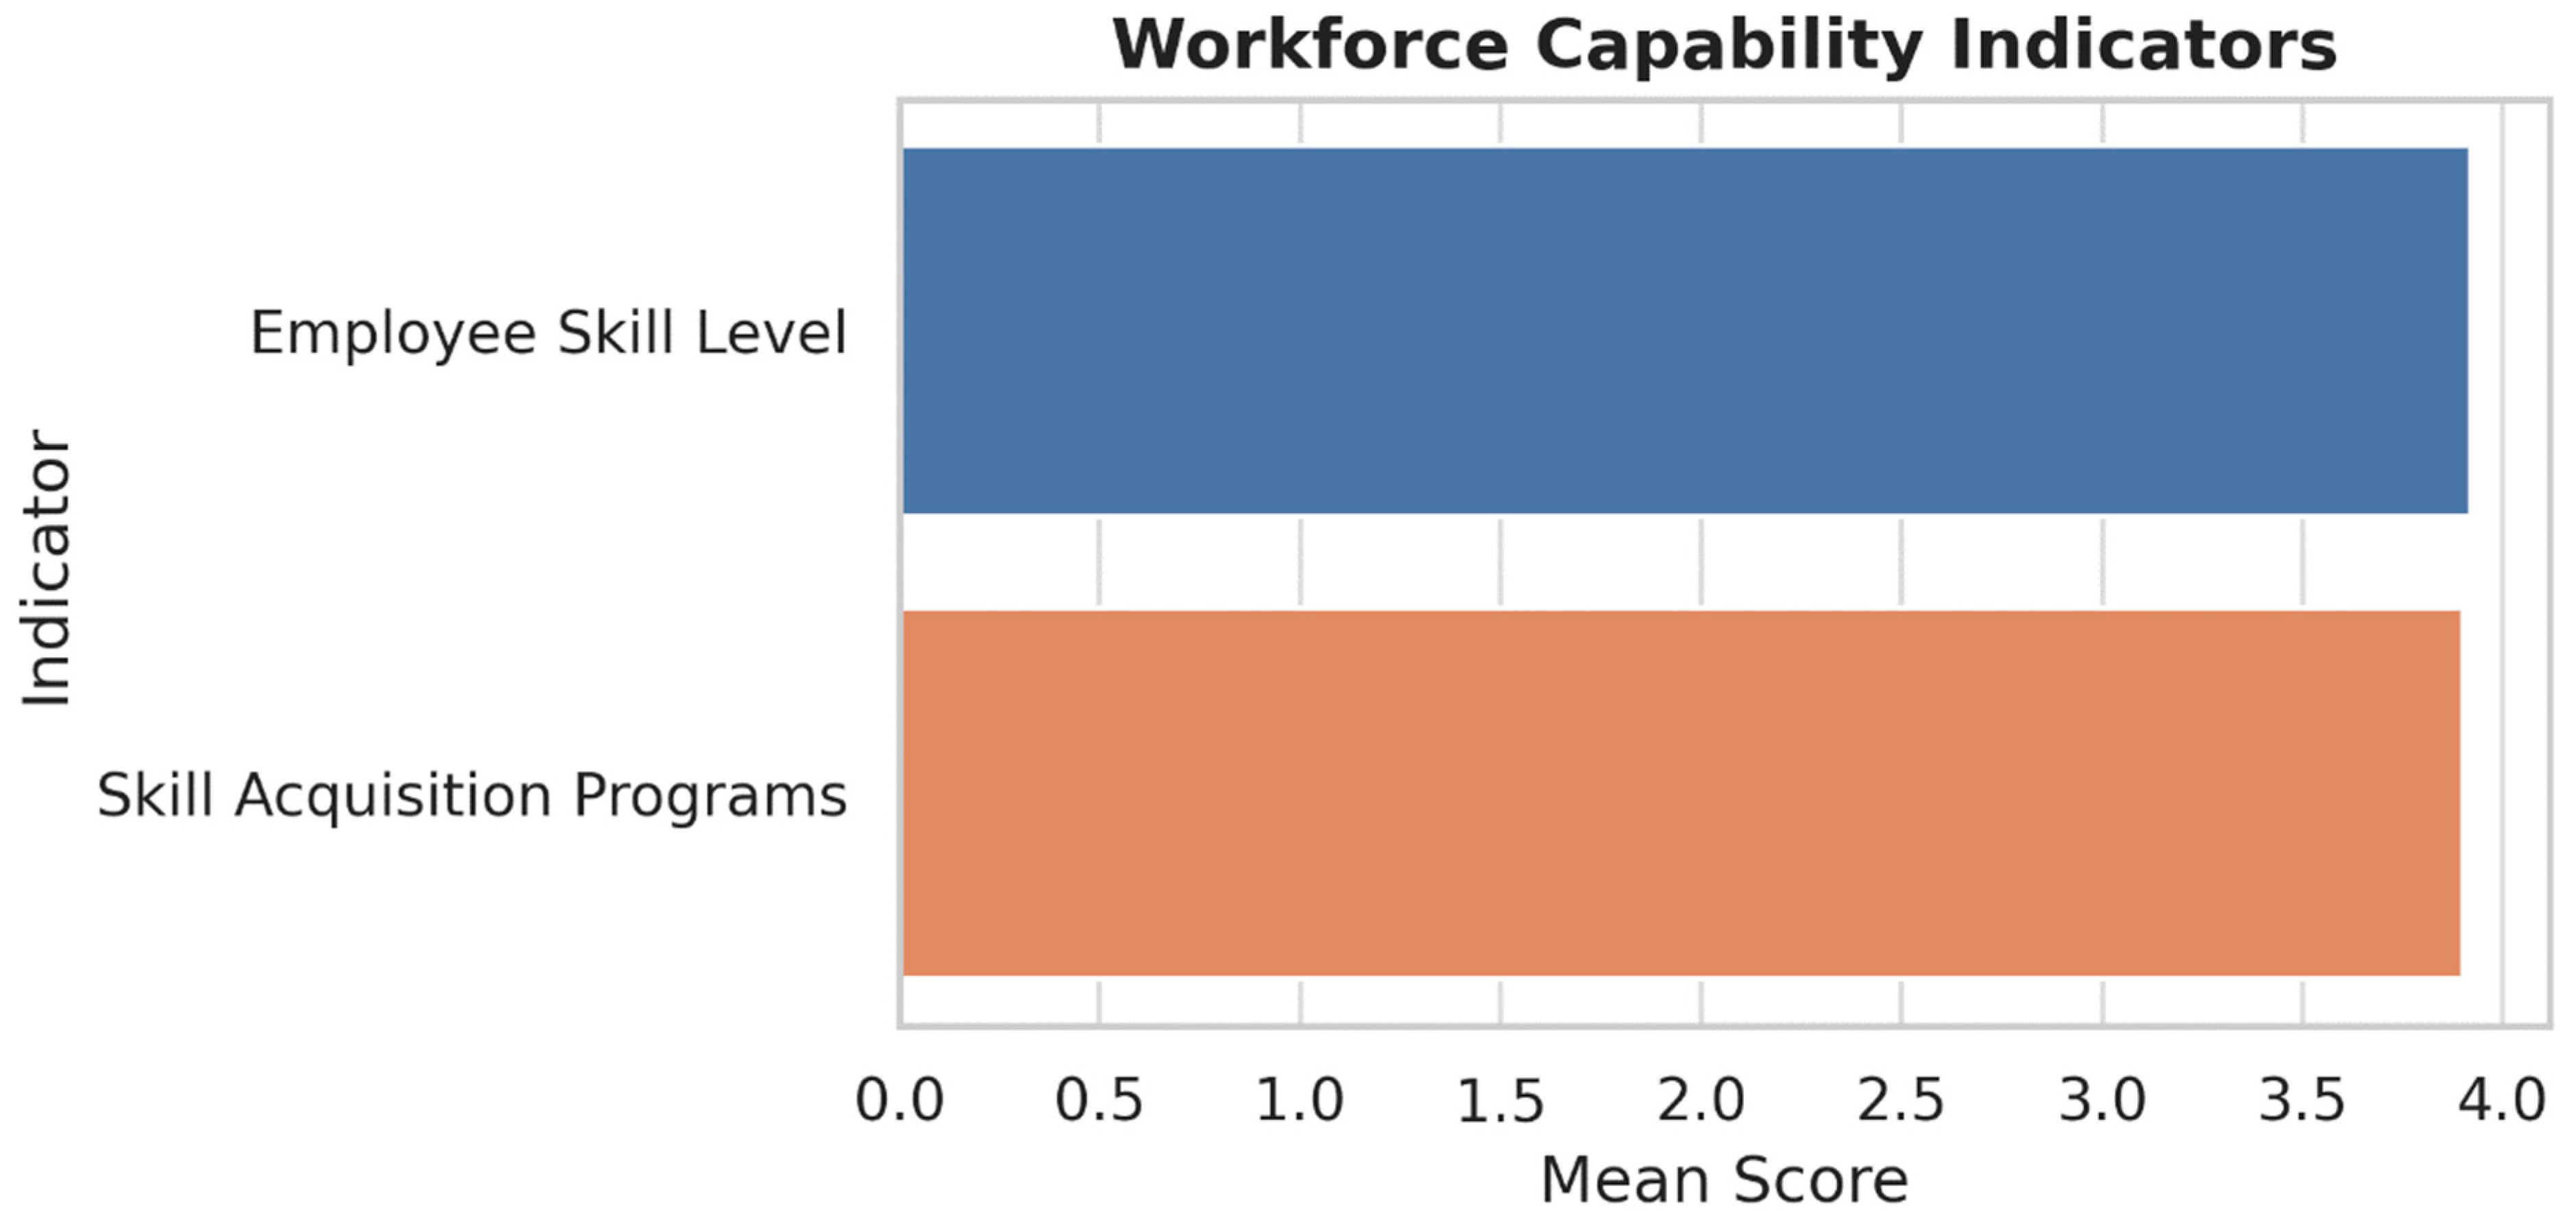
Table 5) a varied landscape of digital transformation across SMEs, with Workforce Capability (D6) emerging as the most mature dimension (mean score: 3.91). This suggests a strong commitment among firms to equip their employees with the skills required for modern manufacturing environments. Regular training, openness to digital tools, and the ability to adapt to evolving roles appear to be well-established across the sample, indicating that human capital is not the limiting factor in most firms’ transformation journeys.
In contrast, dimensions that rely heavily on technological infrastructure and capital investments, such as Smart Factory (D2) and Smart Products (D5), reported lower average scores of 3.19 and 3.41, respectively. These figures reflect the structural and financial challenges faced by many SMEs when attempting to implement advanced automation, machine-to-machine communication, and embedded product intelligence. While firms may be conceptually aligned with Industry 4.0 ideals, the transition from awareness to execution is clearly hindered by limitations in infrastructure, integration capability, and long-term investment planning.
The intermediate performance of Strategy (D1, mean: 3.60) and Data-Driven Services (D3, mean: 3.62) indicates that firms are actively thinking about transformation at the strategic level and beginning to explore how operational data can support customer value and service innovation. However, the partial readiness scores suggest that these efforts are still fragmented. For many SMEs, strategic intent is present, but execution is uneven due to gaps in funding, technical capacity, and scalable IT platforms.
Interestingly, when these results are viewed alongside firm demographic data (
Table 3 and
Table 4), a clear pattern emerges. SMEs with larger workforce sizes and higher turnover tend to report higher readiness scores across all six dimensions. For example, firms employing more than 500 people had a mean readiness score of 3.57, compared to just 2.81 for those with fewer than 20 employees. Similarly, firms with annual revenue above INR 2500 million reported significantly stronger performance than those in lower revenue brackets. This reinforces the conclusion that organizational maturity and financial strength are key enablers of digital transformation.
These findings illustrate a widening gap between digitally proactive firms and those struggling to initiate or scale their transformation efforts. It also underscores the need for targeted policy support, particularly for smaller SMEs that may lack the internal resources to keep pace with industry-wide shifts. In the absence of such support, the maturity curve risks becoming more polarized, with only a subset of firms capturing the benefits of smart manufacturing while others remain digitally marginalized.
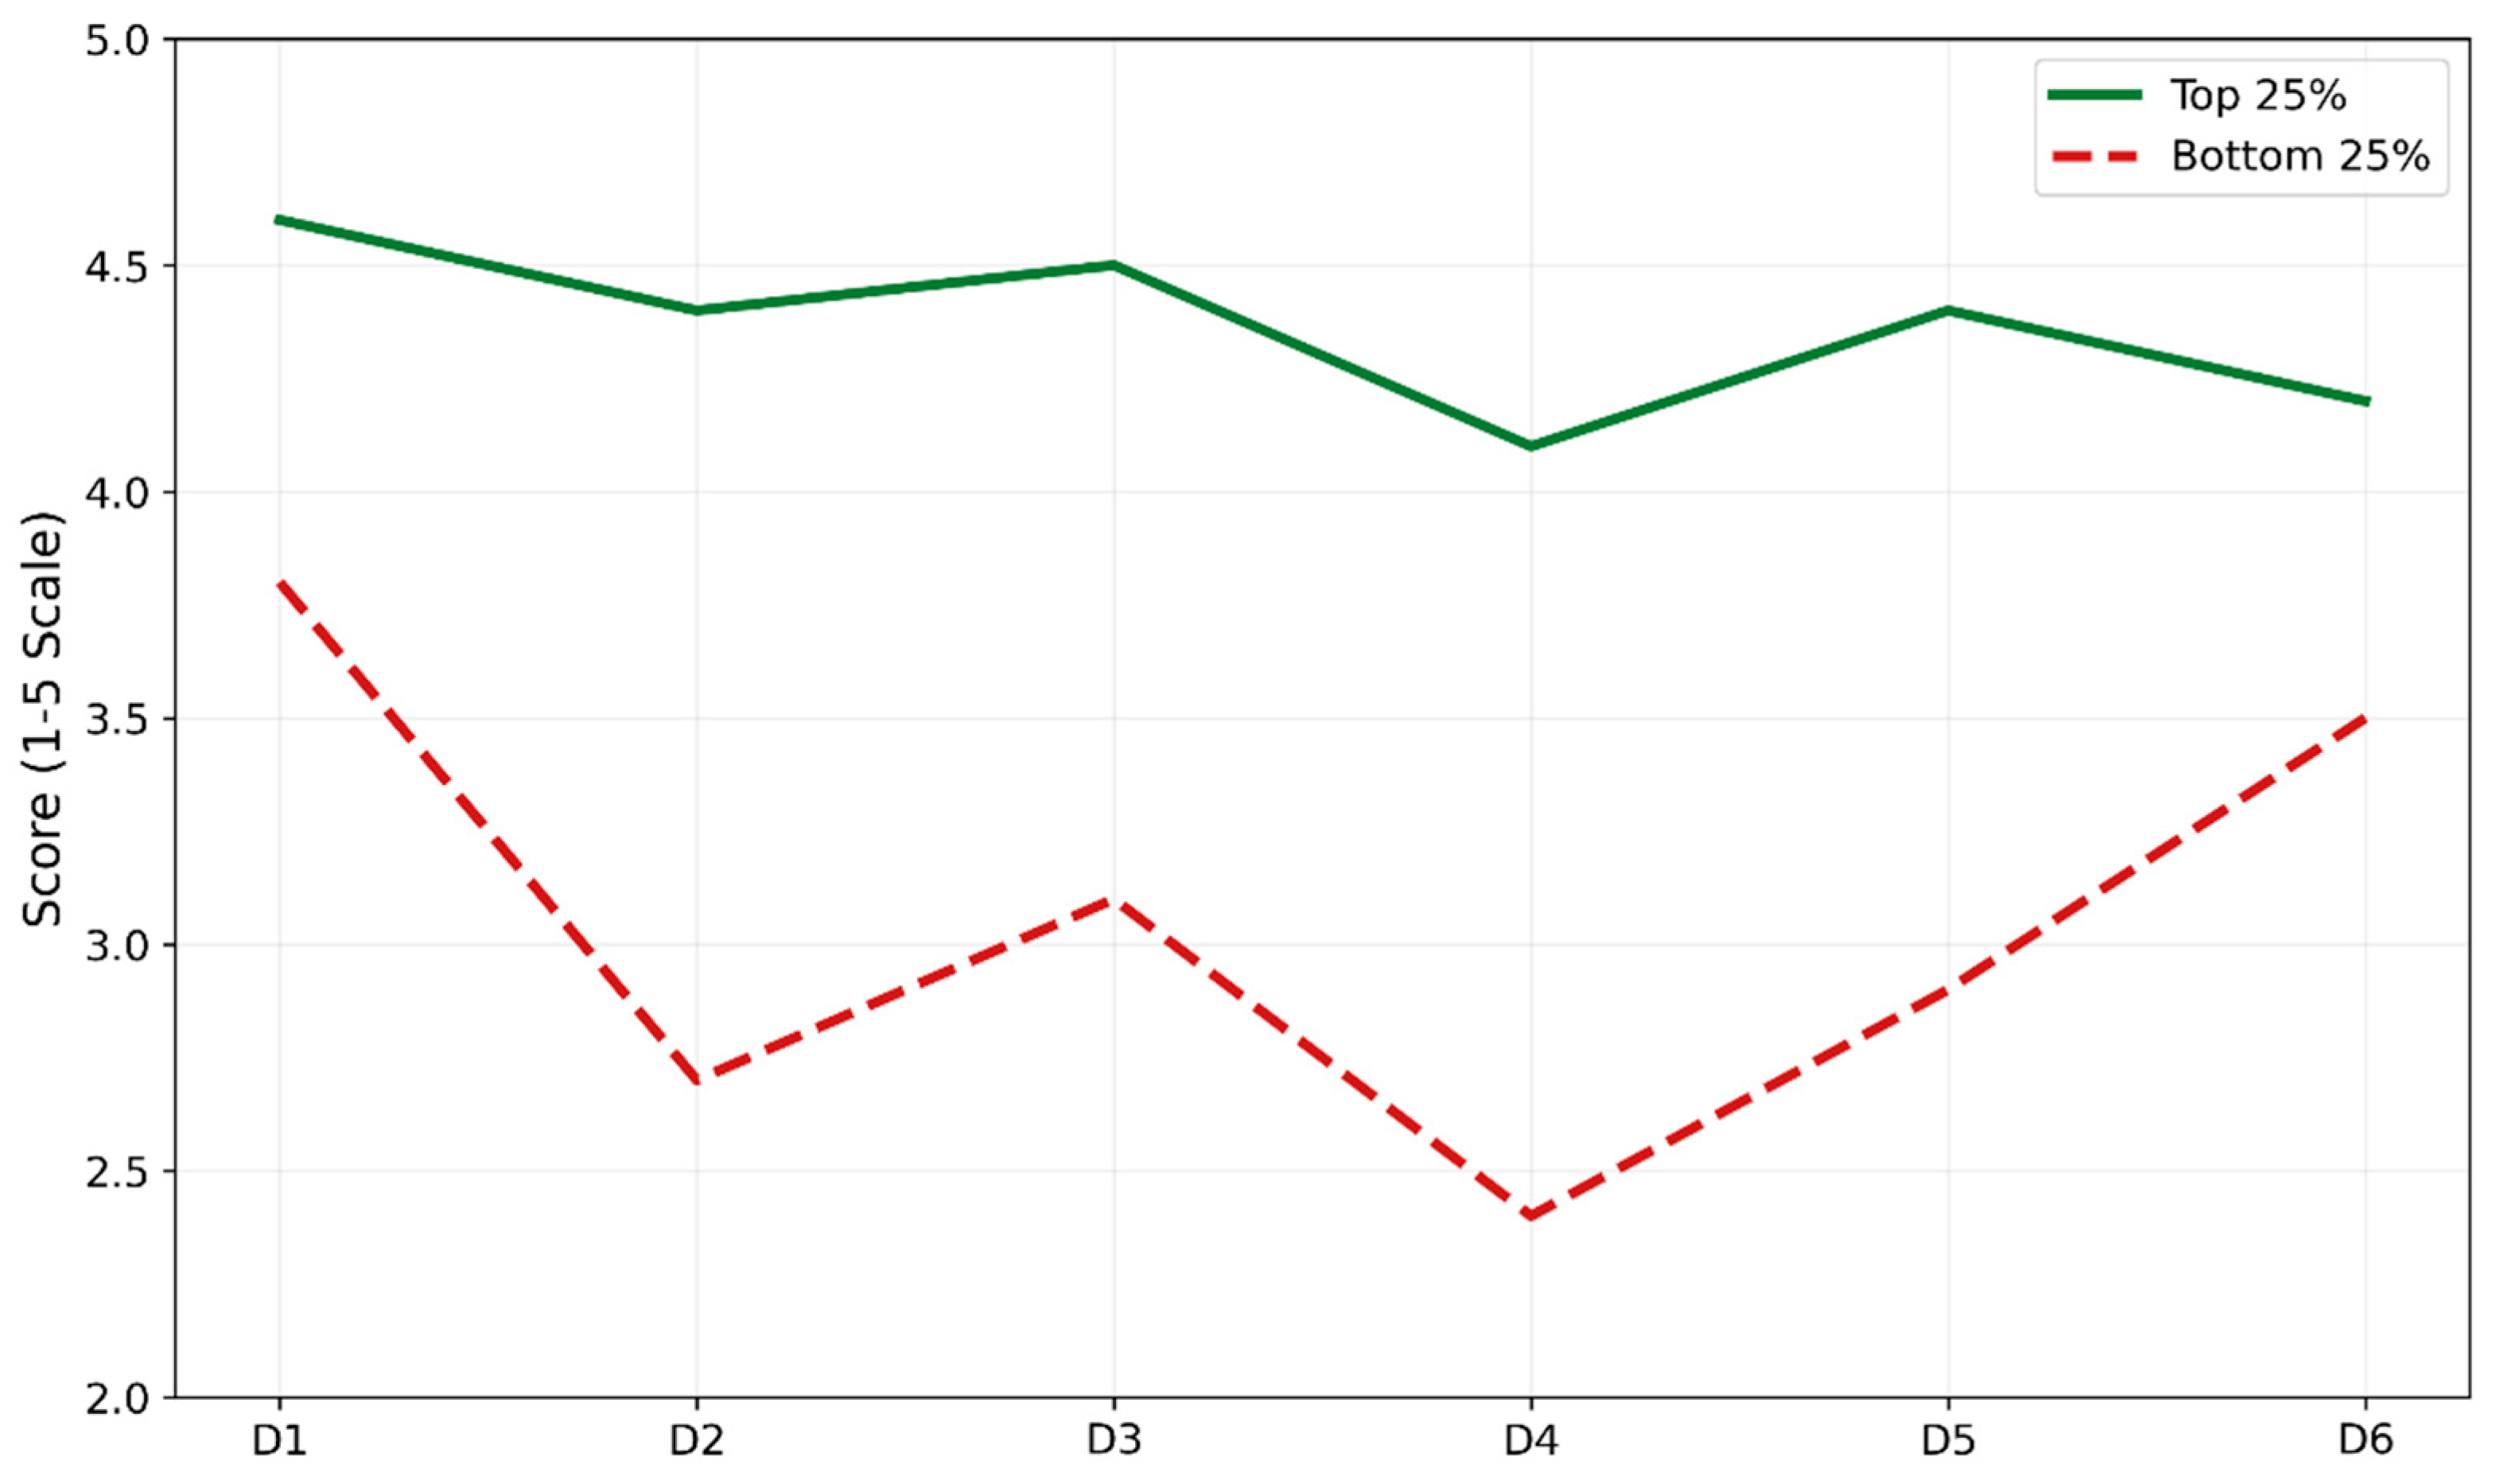
To further distinguish patterns between high- and low-performing firms, a parallel coordinates plot was created to visualize the variation in readiness scores across the six IMPULS dimensions for the top 25% and bottom 25% of surveyed SMEs (
Figure 10). This approach highlights comparative performance and maturity gaps across strategic, operational, and technological domains.
The top 25% of SMEs demonstrate consistently high scores (4.1–4.6) across all six dimensions, representing uniformly mature practices. In contrast, the bottom 25% firms show a sharp decline, with scores below 3.0 in D2 (Smart Factory), D4 (Smart Operations), and D5 (Smart Products), indicating foundational gaps in digital infrastructure and integration.
This visual comparison illustrates a clear bifurcation in smart manufacturing maturity. While top-tier SMEs exhibit balanced advancement in strategic planning, automation, and workforce development, lower-performing firms struggle particularly with physical infrastructure and data-enabled production systems. These findings suggest that tailored interventions such as subsidized digital tools, modular factory retrofitting, and cloud-based MES solutions are essential to help lagging SMEs advance beyond Level 2 maturity thresholds.
5.5. Readiness Gap and Latent Potential Analysis
Digital transformation programs can stall not because firms lack ambition, but because the distance between their present capabilities and the benchmark for Industry 4.0 remains unclear. To make this gap visible, we introduce two complementary metrics: the Readiness Gap Index (RGI) and the Latent Potential (LP) flag. The RGI quantifies the shortfall between a firm’s current smart manufacturing readiness score and the theoretical full maturity threshold on a 5-point Likert scale, averaged across the six dimensions. A higher RGI indicates a greater need for strategic and infrastructural support. Latent Potential, in contrast, is flagged when a firm demonstrates strong human capital (i.e., a score of 4.0 or higher in Workforce Readiness—D6), but lags in at least two of the core technology-intensive dimensions, namely Smart Operations (D2), Smart Products (D4), and Data and IT Infrastructure (D5) with scores of 2.5 or lower. This configuration suggests the presence of transformation capacity that remains under-leveraged due to external or infrastructural constraints. Together, these two indicators allow policymakers and managers to not only rank-order firms by urgency of intervention, but also to distinguish between firms that lack readiness outright and those that are constrained despite strong foundational assets.
A single composite score captures the gap. For every firm i,
where
Ri is that firm’s overall readiness on the five-point IMPULS scale. In our sample, RGI ranges from 0.03 to 2.80 (median = 1.84); any value above 2.0 (equivalent to an overall readiness below 3.0) signals a critical shortfall that calls for foundational intervention. A low RGI therefore denotes proximity to advanced practice, whereas a high score highlights substantive capability deficits. To decide whether these deficits stem from missing infrastructure rather than human capital, we add a binary Latent Potential indicator:
where Employees is the average score for Dimension D6 and
di are the firm’s scores for Smart Factory (D2), Smart Operations (D4), and Smart Products (D5). Firms with LP = 1 combine a digitally capable workforce (≥4.0) with at least two deficient technology dimensions (≤2.5), indicating that skills are present but the enabling infrastructure is not. Applied to our dataset, eight SMEs register RGI ≥ 2.5 and half of these also carry the Latent Potential flag, confirming that targeted technology upgrades and not additional training should be the priority for this subgroup. This unified gap-plus-potential lens therefore moves the analysis beyond simple ranking and pinpoints whether assistance should concentrate on skills, systems, or both, ensuring that scarce resources are channeled to the constraints that matter most.
Table 6 presents the five most- and five least-mature SMEs ranked by Overall Readiness. The top quintile records RGIs below 0.70 and balanced excellence across all dimensions, corroborating theories that smart manufacturing success is systemic rather than piecemeal. By contrast, the bottom quintile combines RGIs exceeding 2.40 with Employees scores above 4.0, illustrating a capability–infrastructure mismatch that policy must urgently resolve.
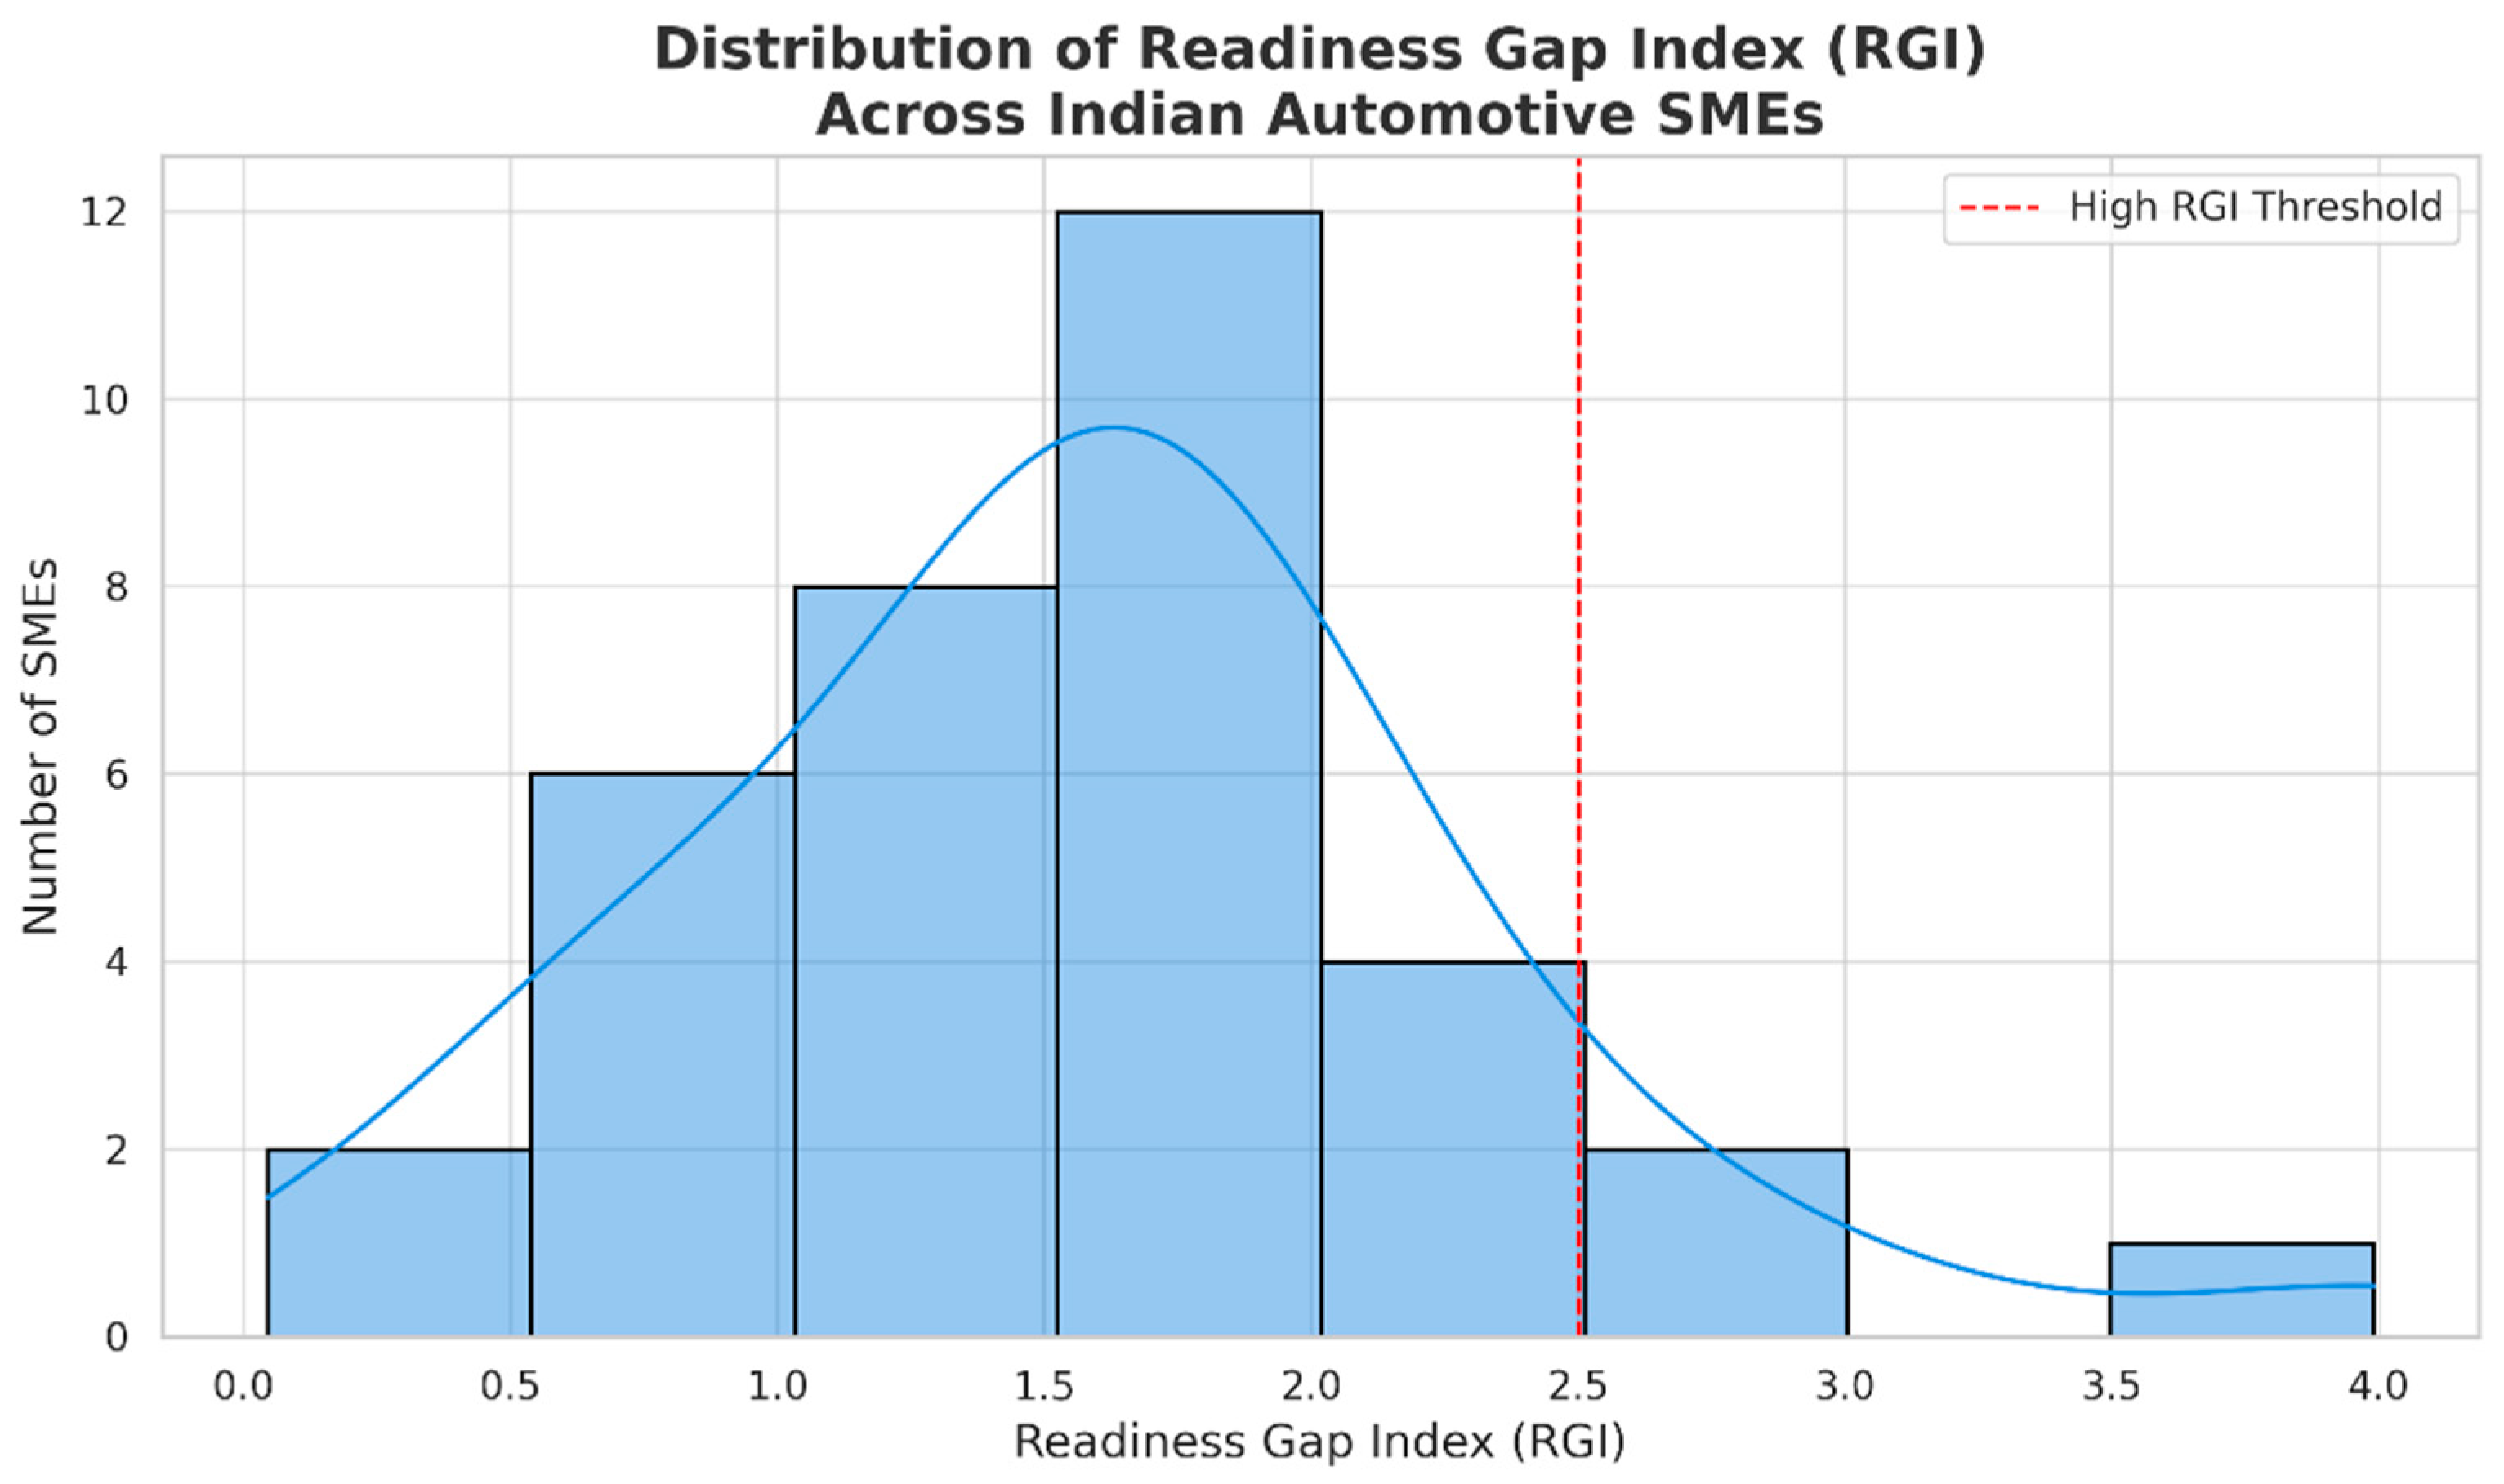
As observed in
Figure 11, across the full cohort (
n = 37), RGI ranges from 0.05 to 3.24 (median = 1.64; IQR = 0.77). Roughly one-third of firms operate within a single maturity point of the frontier, whereas eight SMEs exceed an RGI of 2.5, a threshold associated with structural transformation barriers in prior Industry 4.0 studies [
56]. Half of those high-gap firms carry the latent-potential marker, underlining infrastructure but not human capital as the binding constraint.
From a policy perspective, the dual-metric lens advocates a bifurcated strategy. Low-RGI firms benefit most from advanced analytics, servitization initiatives, and cross-enterprise data orchestration, given that their foundational readiness is already consolidated. In contrast, high-RGI Latent Potential firms warrant rapid deployment interventions such as subsidized sensor retrofits, cloud-based MES modules, and peer mentorship programs that align existing workforce strengths with enabling technologies. Without such targeted support, the sector risks widening the digital divide, perpetuating a scenario in which only a subset of SMEs captures the economic and productivity gains promised by smart manufacturing.
5.6. Inter-Dimension Correlations
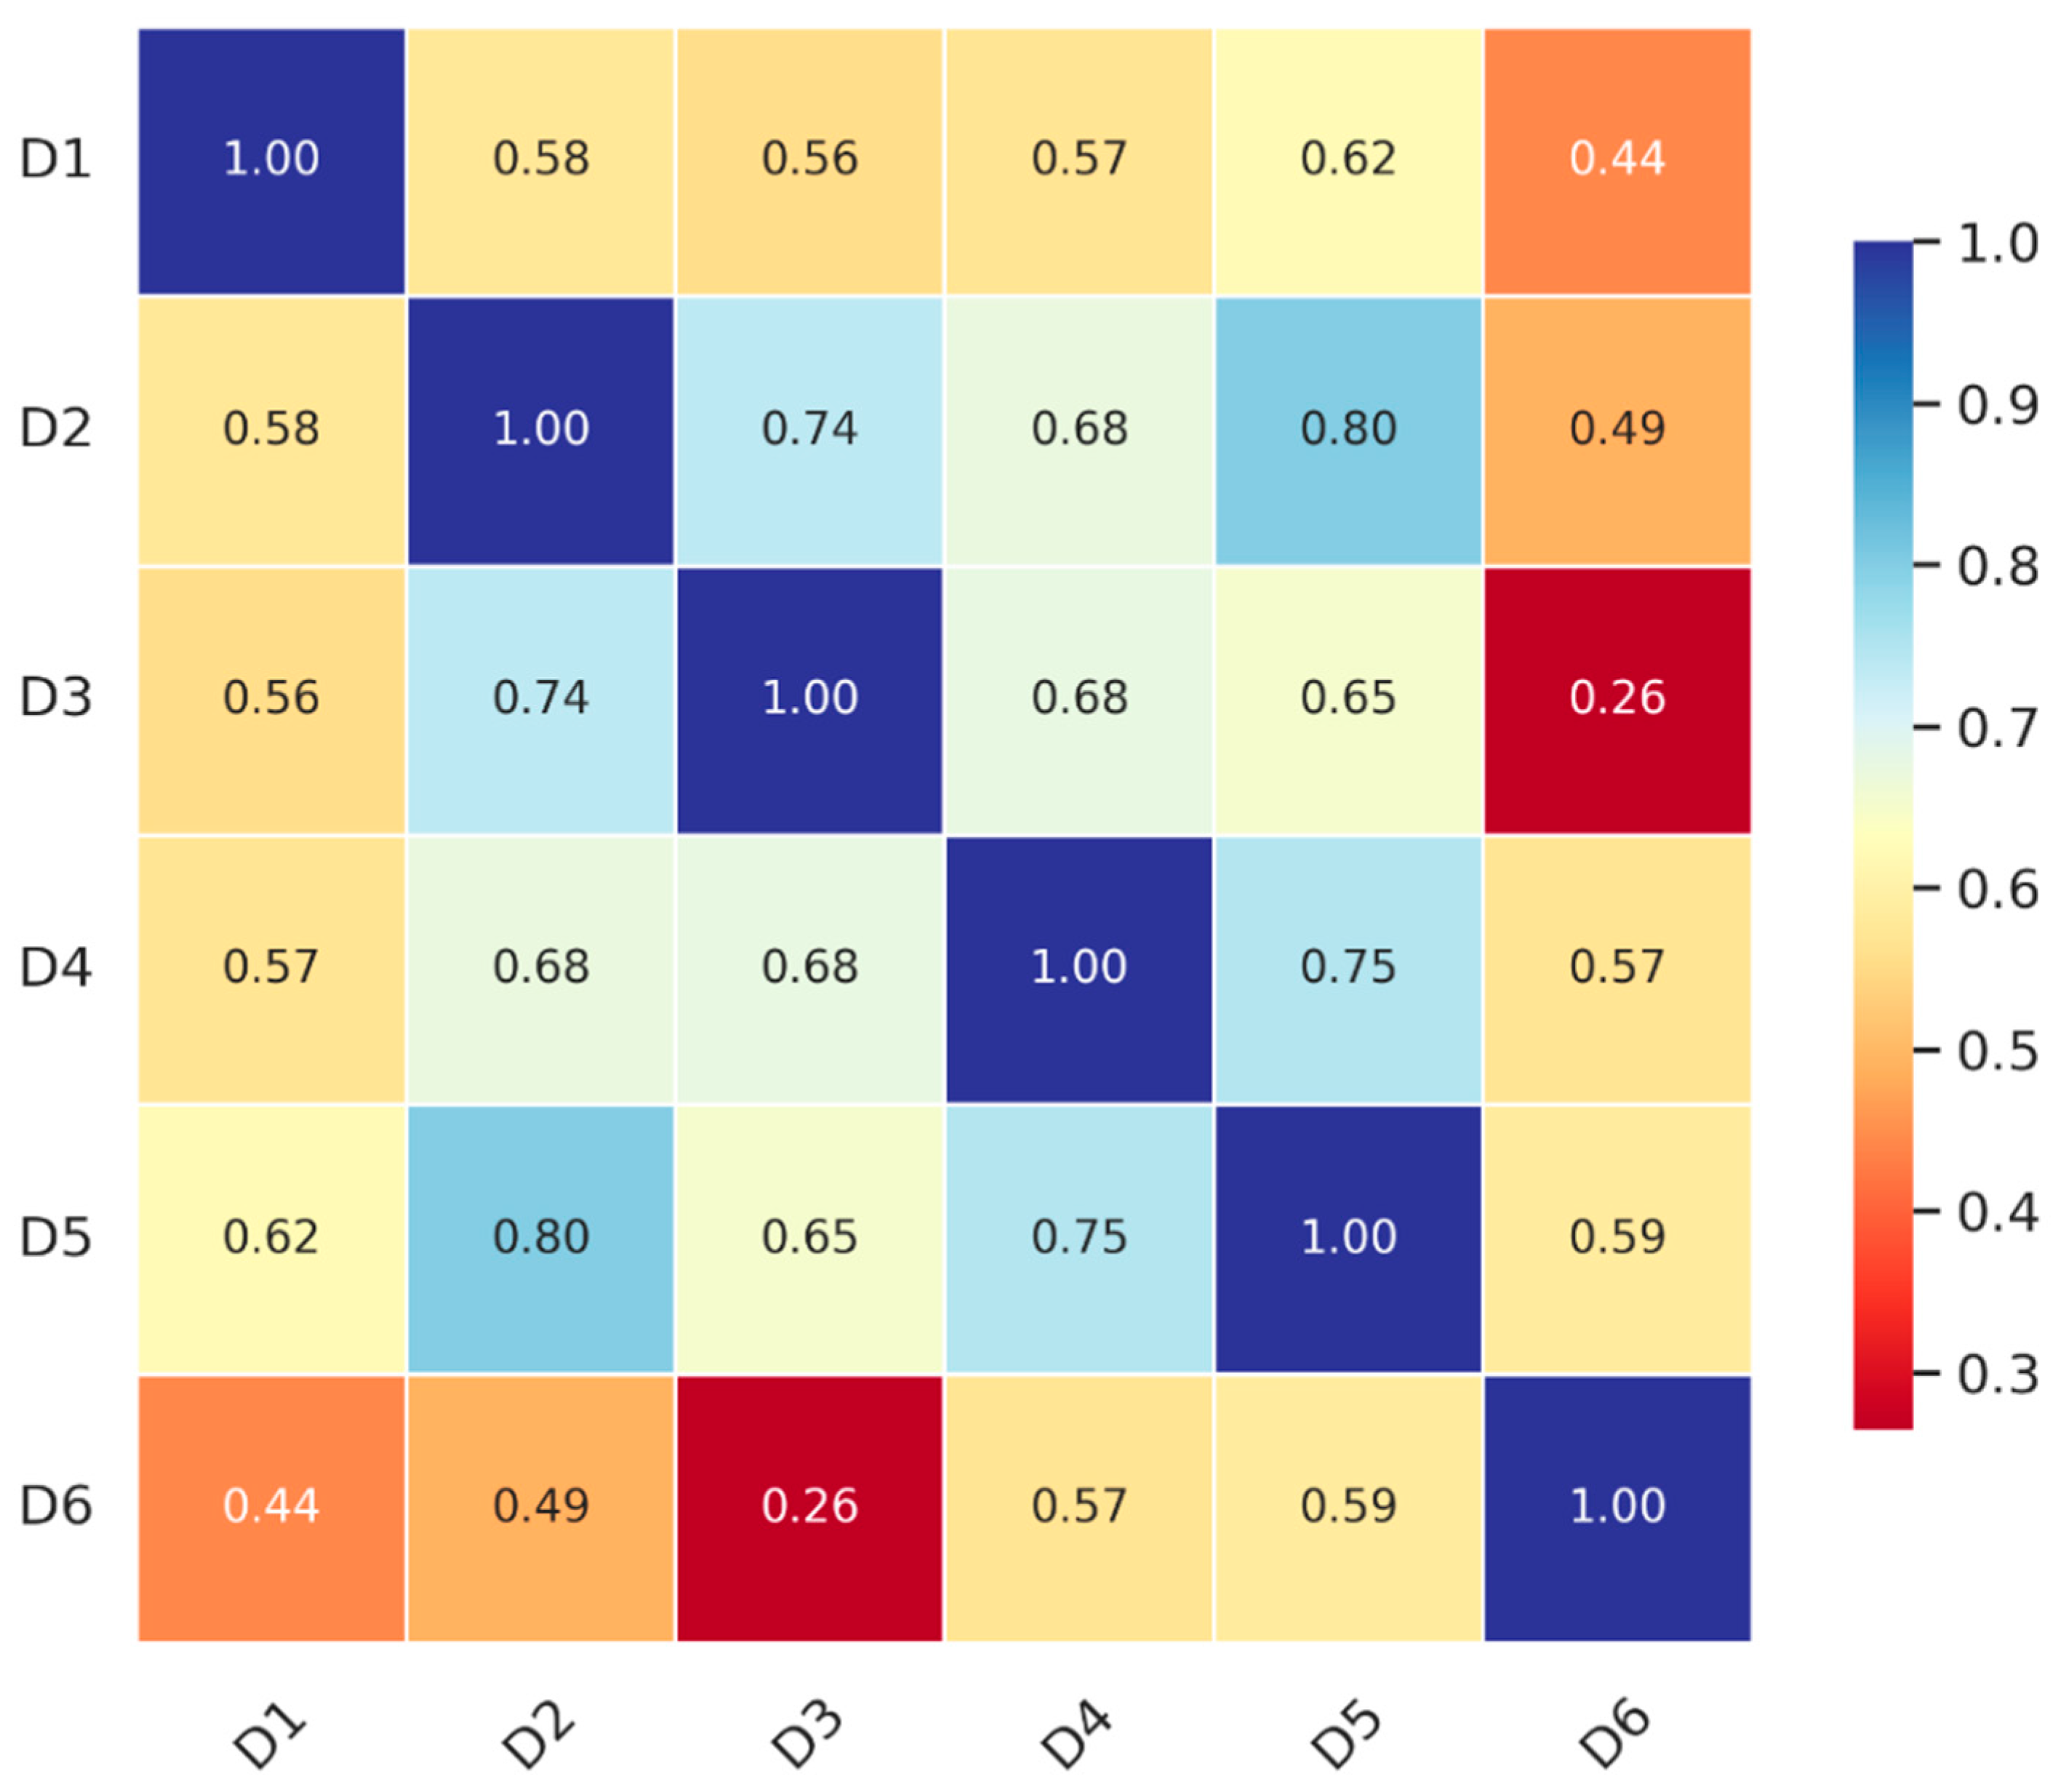
To explore the interplay between various dimensions of smart manufacturing readiness, Pearson correlation coefficients were calculated based on the mean scores for each of the six IMPULS dimensions. The resulting correlation matrix (
Table 7) and heatmap (
Figure 12) provide valuable insights into the systemic relationships that underpin digital maturity among SMEs.
One of the most prominent findings is the strong correlation between Smart Factory (D2) and Smart Operations (D4) (r = 0.80), suggesting that progress in physical automation and machine connectivity is tightly linked to advances in operational efficiency. This reflects the interconnected nature of Industry 4.0 technologies, where investments in infrastructure such as IoT sensors or real-time monitoring systems simultaneously enhance operational workflows, data visibility, and production control.
Another strong relationship appears between Smart Products (D5) and both Smart Factory (D2) (r = 0.80) and Smart Operations (D4) (r = 0.75). This finding implies that the ability to produce intelligent, connected products is highly dependent on a firm’s capacity to digitize its production environment and automate its internal operations. In practical terms, it suggests that product-level innovation does not emerge in isolation but evolves in tandem with improvements in the manufacturing process and IT integration.
Strategy (D1) also demonstrates moderate to strong correlations with all other dimensions (ranging from 0.55 to 0.62), particularly with Smart Products and Smart Operations, reinforcing the idea that a clearly articulated strategic vision supports broader transformation. Firms that prioritize digital readiness at the strategic level tend to perform better across operational and technical domains, likely because they align organizational goals, funding, and human capital initiatives with long-term transformation objectives.
Interestingly, Workforce Capability (D6) exhibits only weak to moderate correlations with the other dimensions, particularly with Smart Products (D5) (r = 0.26) and Data-Driven Services (D3) (r = 0.27). This indicates a possible disconnect between human resource development and technical implementation. While many firms invest in training and skill development, these efforts may not yet be fully leveraged to drive innovation in product design or customer-centric digital services. It also suggests that skills are being developed, but without the necessary platforms, infrastructure, or processes to apply them effectively. From a practical standpoint, these correlation patterns highlight the importance of treating smart manufacturing as a cohesive transformation journey, rather than a series of isolated upgrades. Advancements in one area tend to support or require progress in others. For instance, upgrading factory infrastructure without aligning operations or workforce skills may limit the value realized from such investments. Therefore, SMEs should be encouraged to pursue integrated strategies that balance investments across people, processes, and platforms.
These insights also have implications for support programs and policy design. Public and private interventions should aim to simultaneously target high-leverage dimensions such as strategy, factory digitization, and operations. In parallel, mechanisms should be established to ensure that workforce capabilities are actively aligned with technological needs, such as through cross-training, role redesign, and real-world application of digital skills within production environments.
5.7. Readiness Clustering: Profiles of Digital Maturity
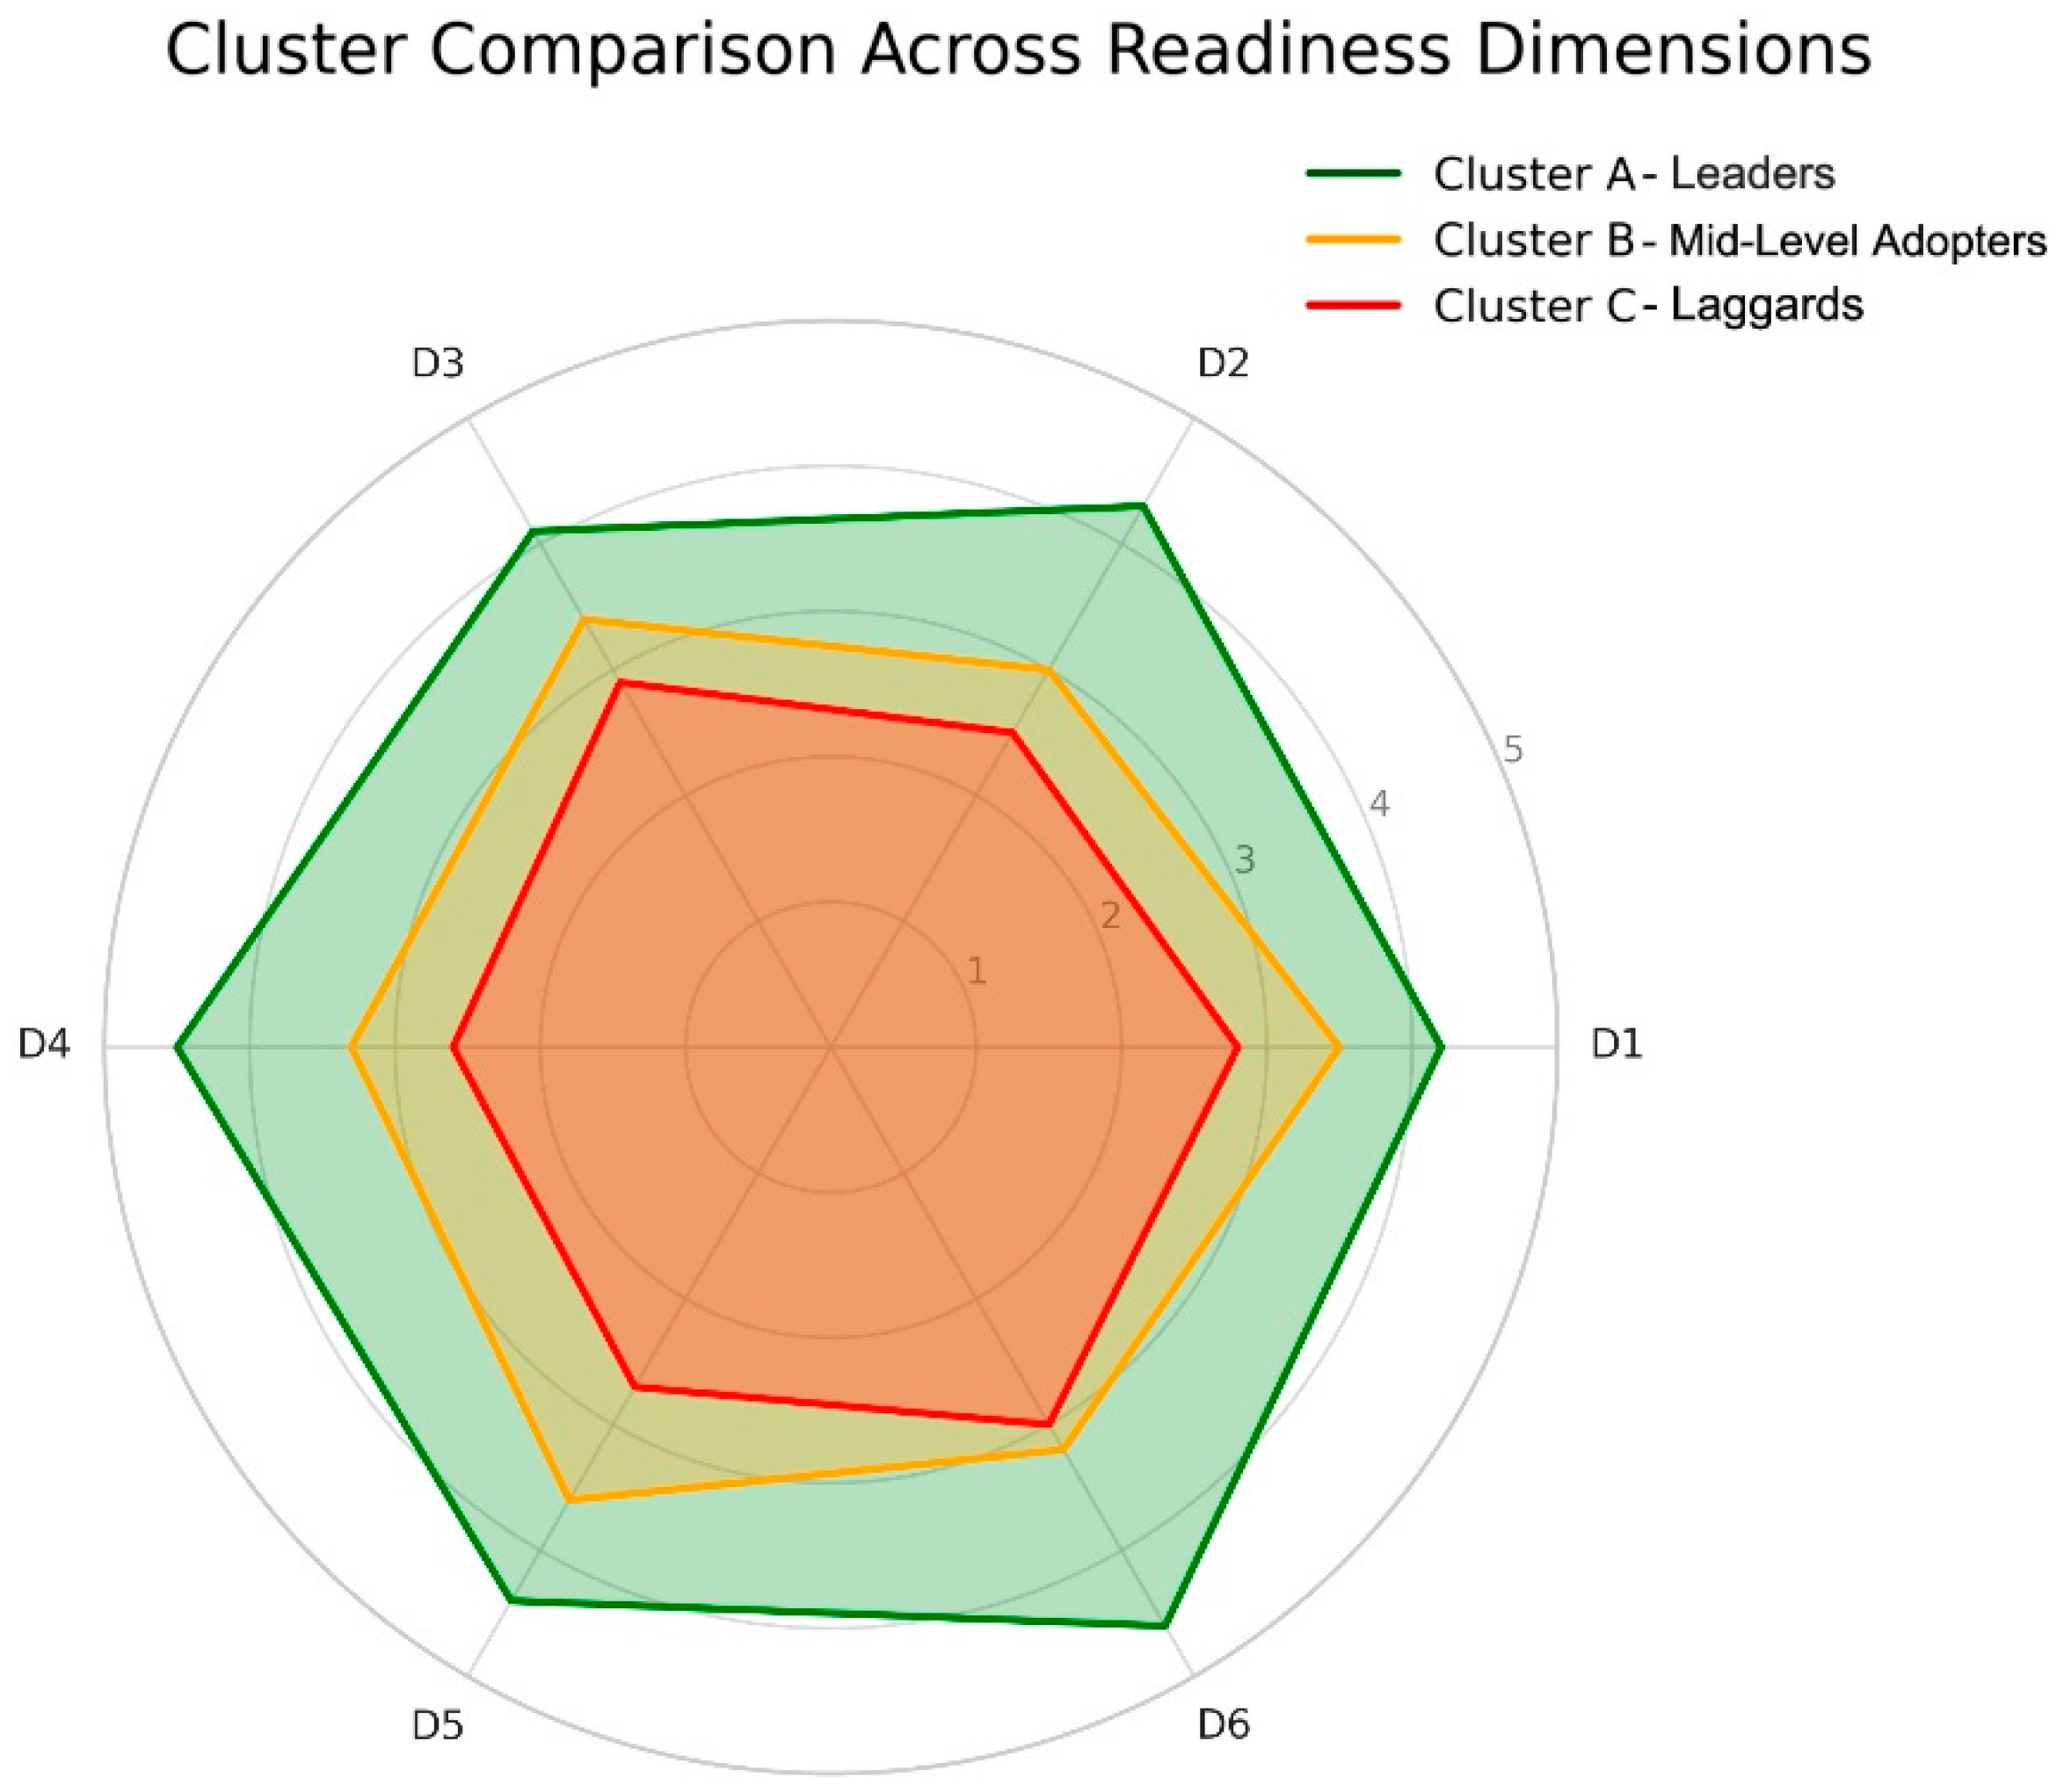
To capture the diversity of smart manufacturing readiness among Indian automotive-sector SMEs, a hierarchical clustering analysis was conducted based on the standardized scores of the six IMPULS dimensions. The analysis yielded (see
Figure 13) three distinct clusters, each representing a different stage of digital maturity: Leaders (Cluster A), Mid-level Adopters (Cluster B), and Laggards (Cluster C). This segmentation offers valuable insights into the relative strengths, weaknesses, and developmental needs of firms across the ecosystem.
Three distinct groups emerged:
Cluster A—Leaders (n = 9): These firms demonstrate high and balanced scores across all six dimensions, with average values consistently above 4.0. These companies have outlined well-defined digital strategies, aligned their IT systems with operational workflows, and committed notable resources to workforce development and product innovation. A significant number also deliver smart products and data-enabled services, suggesting that digital transformation has become central to their business models. Many of these firms are likely to be high-tier suppliers or closely associated with original equipment manufacturers, benefiting from stronger infrastructure, deeper technical knowledge, and robust external collaborations. Their readiness profiles reveal comprehensive digital integration, positioning them as potential leaders within the SME landscape.
Cluster B—Mid-level Adopters (n = 12): These firms represent a transitional category. Their overall readiness ranges from approximately 3.0 to 3.6 and tends to vary more noticeably across dimensions. While most have made progress in employee training and exhibit a degree of strategic direction, they often fall short in Smart Factory (D2) and Smart Operations (D4) because of infrastructure deficits or lack of integration capabilities. Although they show promise, financial constraints, vague implementation plans, and underdeveloped ecosystems remain barriers. The presence of a motivated workforce indicates that targeted interventions such as modular digital tools, cloud-based management platforms, and focused mentorship could significantly accelerate their development.
Cluster C—Laggards (n = 10): This group scored below 3.0 in multiple areas, especially Smart Factory, Smart Operations, and Smart Products. These companies often lack the foundational infrastructure needed for Industry 4.0 integration, and their transformation efforts are either in early planning stages or not yet initiated. While some firms in this group demonstrate moderate strength in workforce development or strategic intent, their technological capabilities are limited, and readiness for end-to-end digitization is minimal. Most of these firms likely fall on the smaller end of the SME spectrum, both in terms of size and financial capacity.
What emerges from this clustering exercise is a clear digital maturity divide. While some SMEs have embraced transformation holistically, others are still navigating basic readiness requirements. Importantly, the cluster profiles also indicate that readiness does not evolve dimension by dimension, but rather as a composite of multiple coordinated efforts. For example, firms in Cluster A do not merely excel in one area but exhibit maturity across strategy, infrastructure, operations, and workforce as a reflection of well-aligned organizational priorities.
This differentiation has critical policy implications. Firms in Cluster C would benefit most from foundational support, such as government-funded infrastructure upgrades, access to entry-level digital platforms, and basic capacity-building in digital literacy and planning. Meanwhile, Cluster B firms represent high-potential targets for acceleration and could advance rapidly with mid-level interventions such as systems integration guidance, co-investment incentives, and access to shared analytics services. Finally, Cluster A firms are well positioned to act as knowledge hubs or peer mentors, offering best practices and technology-sharing platforms within regional SME networks.
Tailoring support mechanisms to the specific needs of each cluster can ensure that digital transformation in the SME sector is both inclusive and sustainable, preventing further polarization and enabling more firms to participate in the emerging smart manufacturing economy.
5.8. Cluster-Wise Maturity Mapping Across IMPULS Dimensions
To synthesize the multidimensional diagnostic framework developed in the preceding sections, a maturity mapping exercise was undertaken to compare the average digital readiness of each SME cluster across the six core IMPULS dimensions. Firms were grouped into clusters using a quantile-based segmentation of Overall Readiness scores: the top quartile formed Cluster A (Leaders), the interquartile range defined Cluster B (Mid-Level Adopters), and the bottom quartile constituted Cluster C (Laggards). This approach ensures empirically defensible partitions while retaining interpretive clarity for policy and managerial applications.
Table 8 presents the aggregated maturity levels by cluster and dimension. To aid interpretability, raw numerical means were translated into categorical maturity bands based on established thresholds: High (≥4.0), Moderate (3.0–3.99), Low (2.0–2.99), and Immature (<2.0). These bands reflect not only statistical distribution but also managerial salience, as readiness gaps of one maturity level typically denote meaningful operational and strategic implications.
Table 8 confirms the systemic resilience of Trailblazer firms: they post high readiness in every domain, proving that their transformation is an enterprise-wide shift that spans structure, people, and data. Tinkerers show intermediate maturity on all fronts; baseline digital capability is present, yet the coherence needed for advanced deployment is still lacking. Traditionalists demonstrate persistently low maturity, exposing structural barriers that leave them stalled at the stage of experimentation.
Viewed through an ecosystem lens, the maturity matrix has immediate policy value. It enables cluster-specific action packages: Traditionalists benefit most from plug and play infrastructure kits and facilitation cells led by government, whereas Tinkerers need scalable platforms, finance, and mentorship from the broader network. Trailblazers, by contrast, can serve as anchor peers who accelerate readiness across regions by guiding supplier development, sharing effective practice, and providing visible digital leadership. These calibrated responses align resources with distinct readiness profiles and maximize collective industrial value.
Taken together, the matrix formalizes a readiness landscape that is at once comparative, actionable, and contextually grounded. This type of synthesis aligns with the expectations of top-tier journals that seek research capable of informing both theory and practical transformation strategies.
5.9. Principal Component Analysis (PCA)
To uncover the underlying structure within the 43 readiness indicators and reduce dimensionality without significant information loss, a Principal Component Analysis (PCA) was performed. PCA is a statistical technique that transforms correlated variables into a set of uncorrelated principal components (PCs), which represent orthogonal directions of maximum variance in the dataset.
All indicator values were normalized prior to PCA using z-score standardization:
In this equation:
xij: original Likert score of firm i on indicator j;
μj, σj: mean and standard deviation of indicator j.
Component Selection and Variance Explanation
Eigen decomposition of the covariance matrix was conducted, and the Kaiser criterion (eigenvalues > 1) was applied to determine the number of components to retain. Additionally, we considered the cumulative explained variance threshold of 80%.
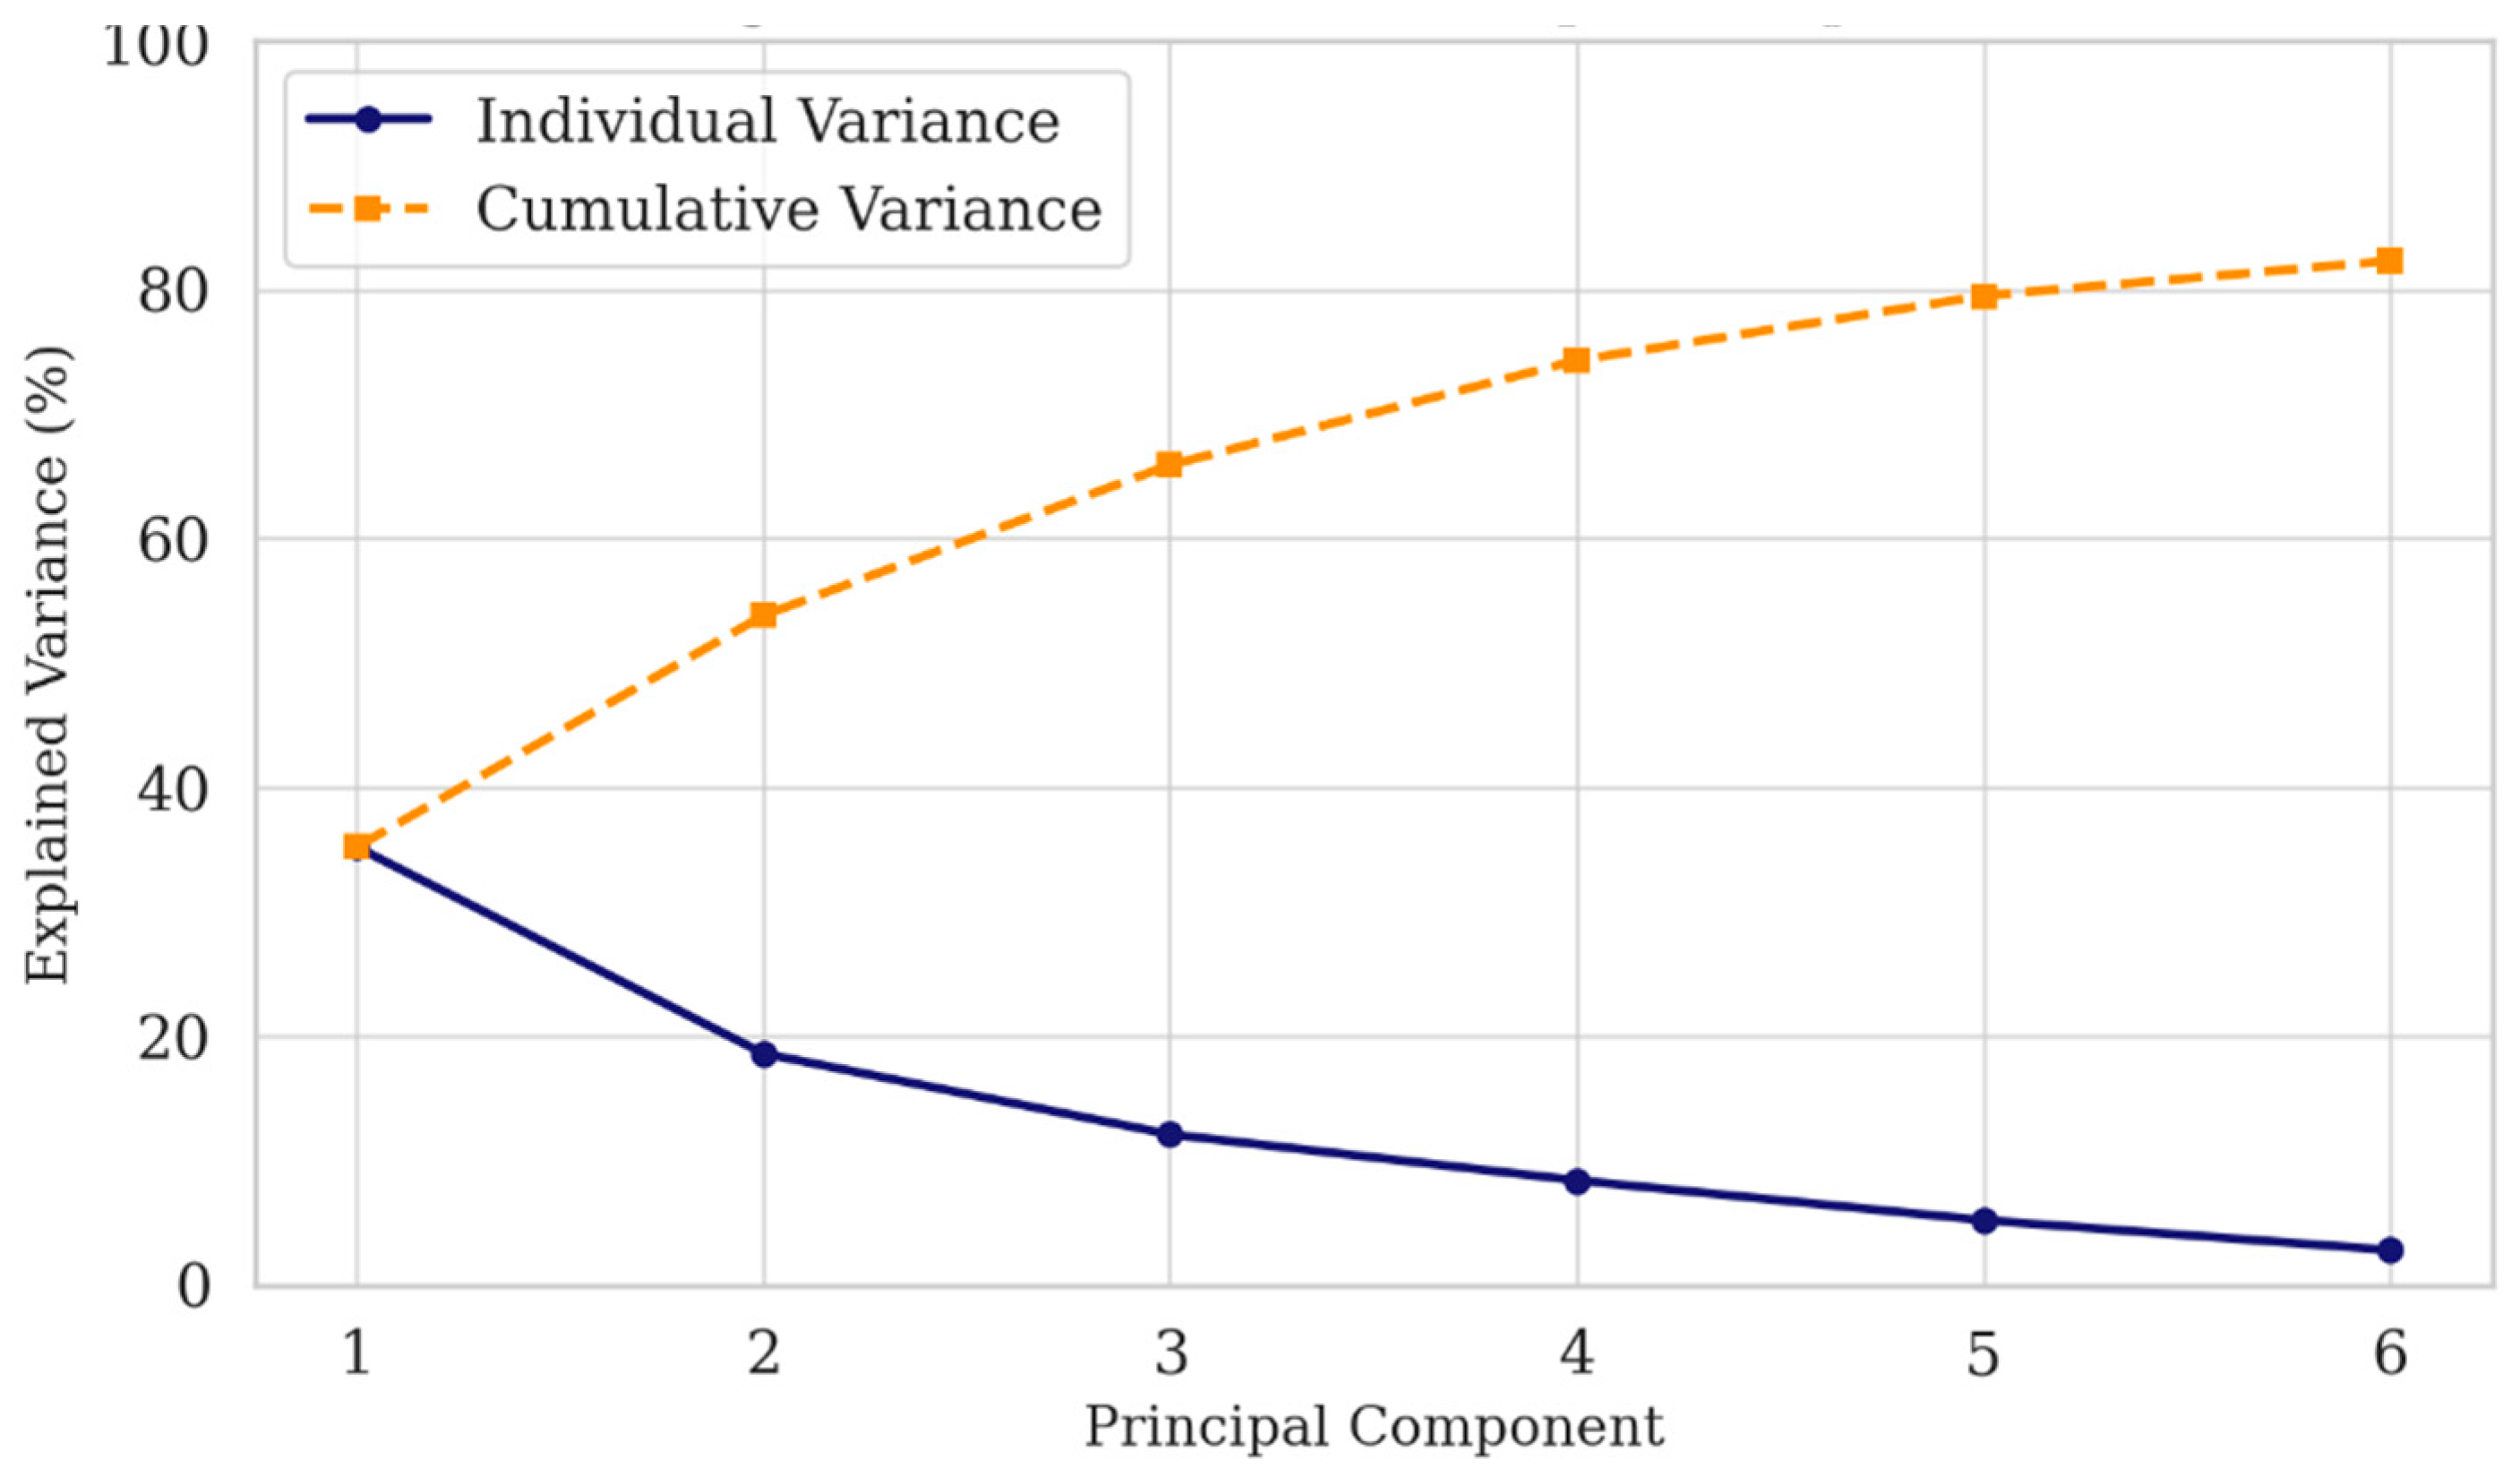
The scree plot (
Figure 14) reveals a clear inflection point after the third principal component, signaling a sharp decline in marginal explanatory power beyond the top factors. The first three components together explain 65.9% of the total variance in the dataset, indicating a compact and coherent latent structure suitable for interpretation. Although six components exceed the Kaiser criterion of eigenvalues greater than one, only the top three were retained to ensure parsimony, minimize noise, and enhance interpretability, particularly in the context of a modest sample size (
n = 31). These three components correspond meaningfully to distinct thematic dimensions: organizational readiness, technological integration, and value-chain connectivity. Retaining only the dominant components allowed for a more focused clustering and readiness segmentation framework, without compromising analytical robustness or conceptual clarity.
Figure 14 shows the Scree plot which explains the variance trends among the components.
As detailed in
Table 9, the first principal component (PC1), which explains 35.2% of the variance, is best interpreted as Strategic Alignment. It draws heavily on variables related to innovation management, financial planning, organizational readiness for change, and the clarity of transformation roadmaps. Firms scoring high on this component tend to have well-defined digital strategies, supported by leadership commitment, investment planning, and cross-functional coordination. This dimension reflects the foundational governance and vision-setting necessary for meaningful transformation. Notably, this component also showed the strongest correlation with overall readiness in the regression model, indicating its pivotal role in driving successful Industry 4.0 adoption.
The second component (PC2), explaining 18.6% of the variance, captures the strength of a firm’s Technical Infrastructure. A prominent component of the readiness analysis shows high loadings from machine-to-machine communication, sensor integration, digital monitoring systems, and enterprise-wide IT connectivity. This element reflects the physical and digital backbone needed to support smart operations and product innovation. It distinguishes firms that have progressed beyond pilot projects and are actively incorporating Industry 4.0 technologies across their production environments.
The third component (PC3), which accounts for 12.1% of the variance, represents Data-Driven Operations. Indicators loading heavily on this component include the use of cloud-based platforms, big data analytics, predictive maintenance, and real-time production optimization. This element measures a firm’s ability to extract value from operational data and convert it into actionable insights. It captures the transition from reactive management to a more predictive, adaptive, and autonomous operational model.
Taken together, the three principal components form a clear structure for interpreting smart manufacturing maturity. Firms that perform well across all components are likely to combine strong strategic intent with the technical and analytical capacity needed to realize their goals. In contrast, companies that fall short in one or more areas tend to progress unevenly; for example, digital tools implemented without strategic alignment, or analytics adopted without reliable infrastructure, limit the overall impact.
The principal component analysis also confirms the internal coherence of the proposed readiness model. Every dimension within the IMPULS framework is reflected in at least one component, demonstrating that the survey captures related yet distinct aspects of readiness. Strategic Alignment aligns closely with Dimension D1 (Strategy), Technical Infrastructure corresponds to D2 (Smart Factory) and D4 (Smart Operations), and Data-Driven Operations links D3 (Services) with D5 (Smart Products).
From a practical standpoint, these findings show that meaningful readiness assessments must move beyond surface checklists to consider deeper organizational capabilities. Policymakers and ecosystem partners can use the component structure to design modular support. Firms with low scores on PC1 might benefit most from mentorship and strategic planning guidance, whereas those lagging in PC2 or PC3 could advance through subsidized IT infrastructure or partnerships focused on data analytics.
By isolating the main drivers of readiness, the analysis strengthens the credibility of the assessment tool and provides concrete insights into the levers of digital transformation available to SMEs.
5.10. Regression Modeling
To measure how these three components influence overall readiness, a multiple linear regression was performed. The dependent variable was the composite readiness score, calculated as the average of the six-dimension scores. Independent variables were the component scores derived from the principal component analysis: Strategic Alignment (PC1), Technical Infrastructure (PC2), and Data-Driven Operations (PC3). The model thus quantifies each component’s contribution to a firm’s readiness level and highlights which areas drive the most significant improvements.
The model was statistically robust, with an adjusted R2 of 0.79, indicating that these three factors explained 79% of the variance in readiness outcomes. The model’s F-statistic (F = 22.4, p < 0.001) confirmed high significance and fit.
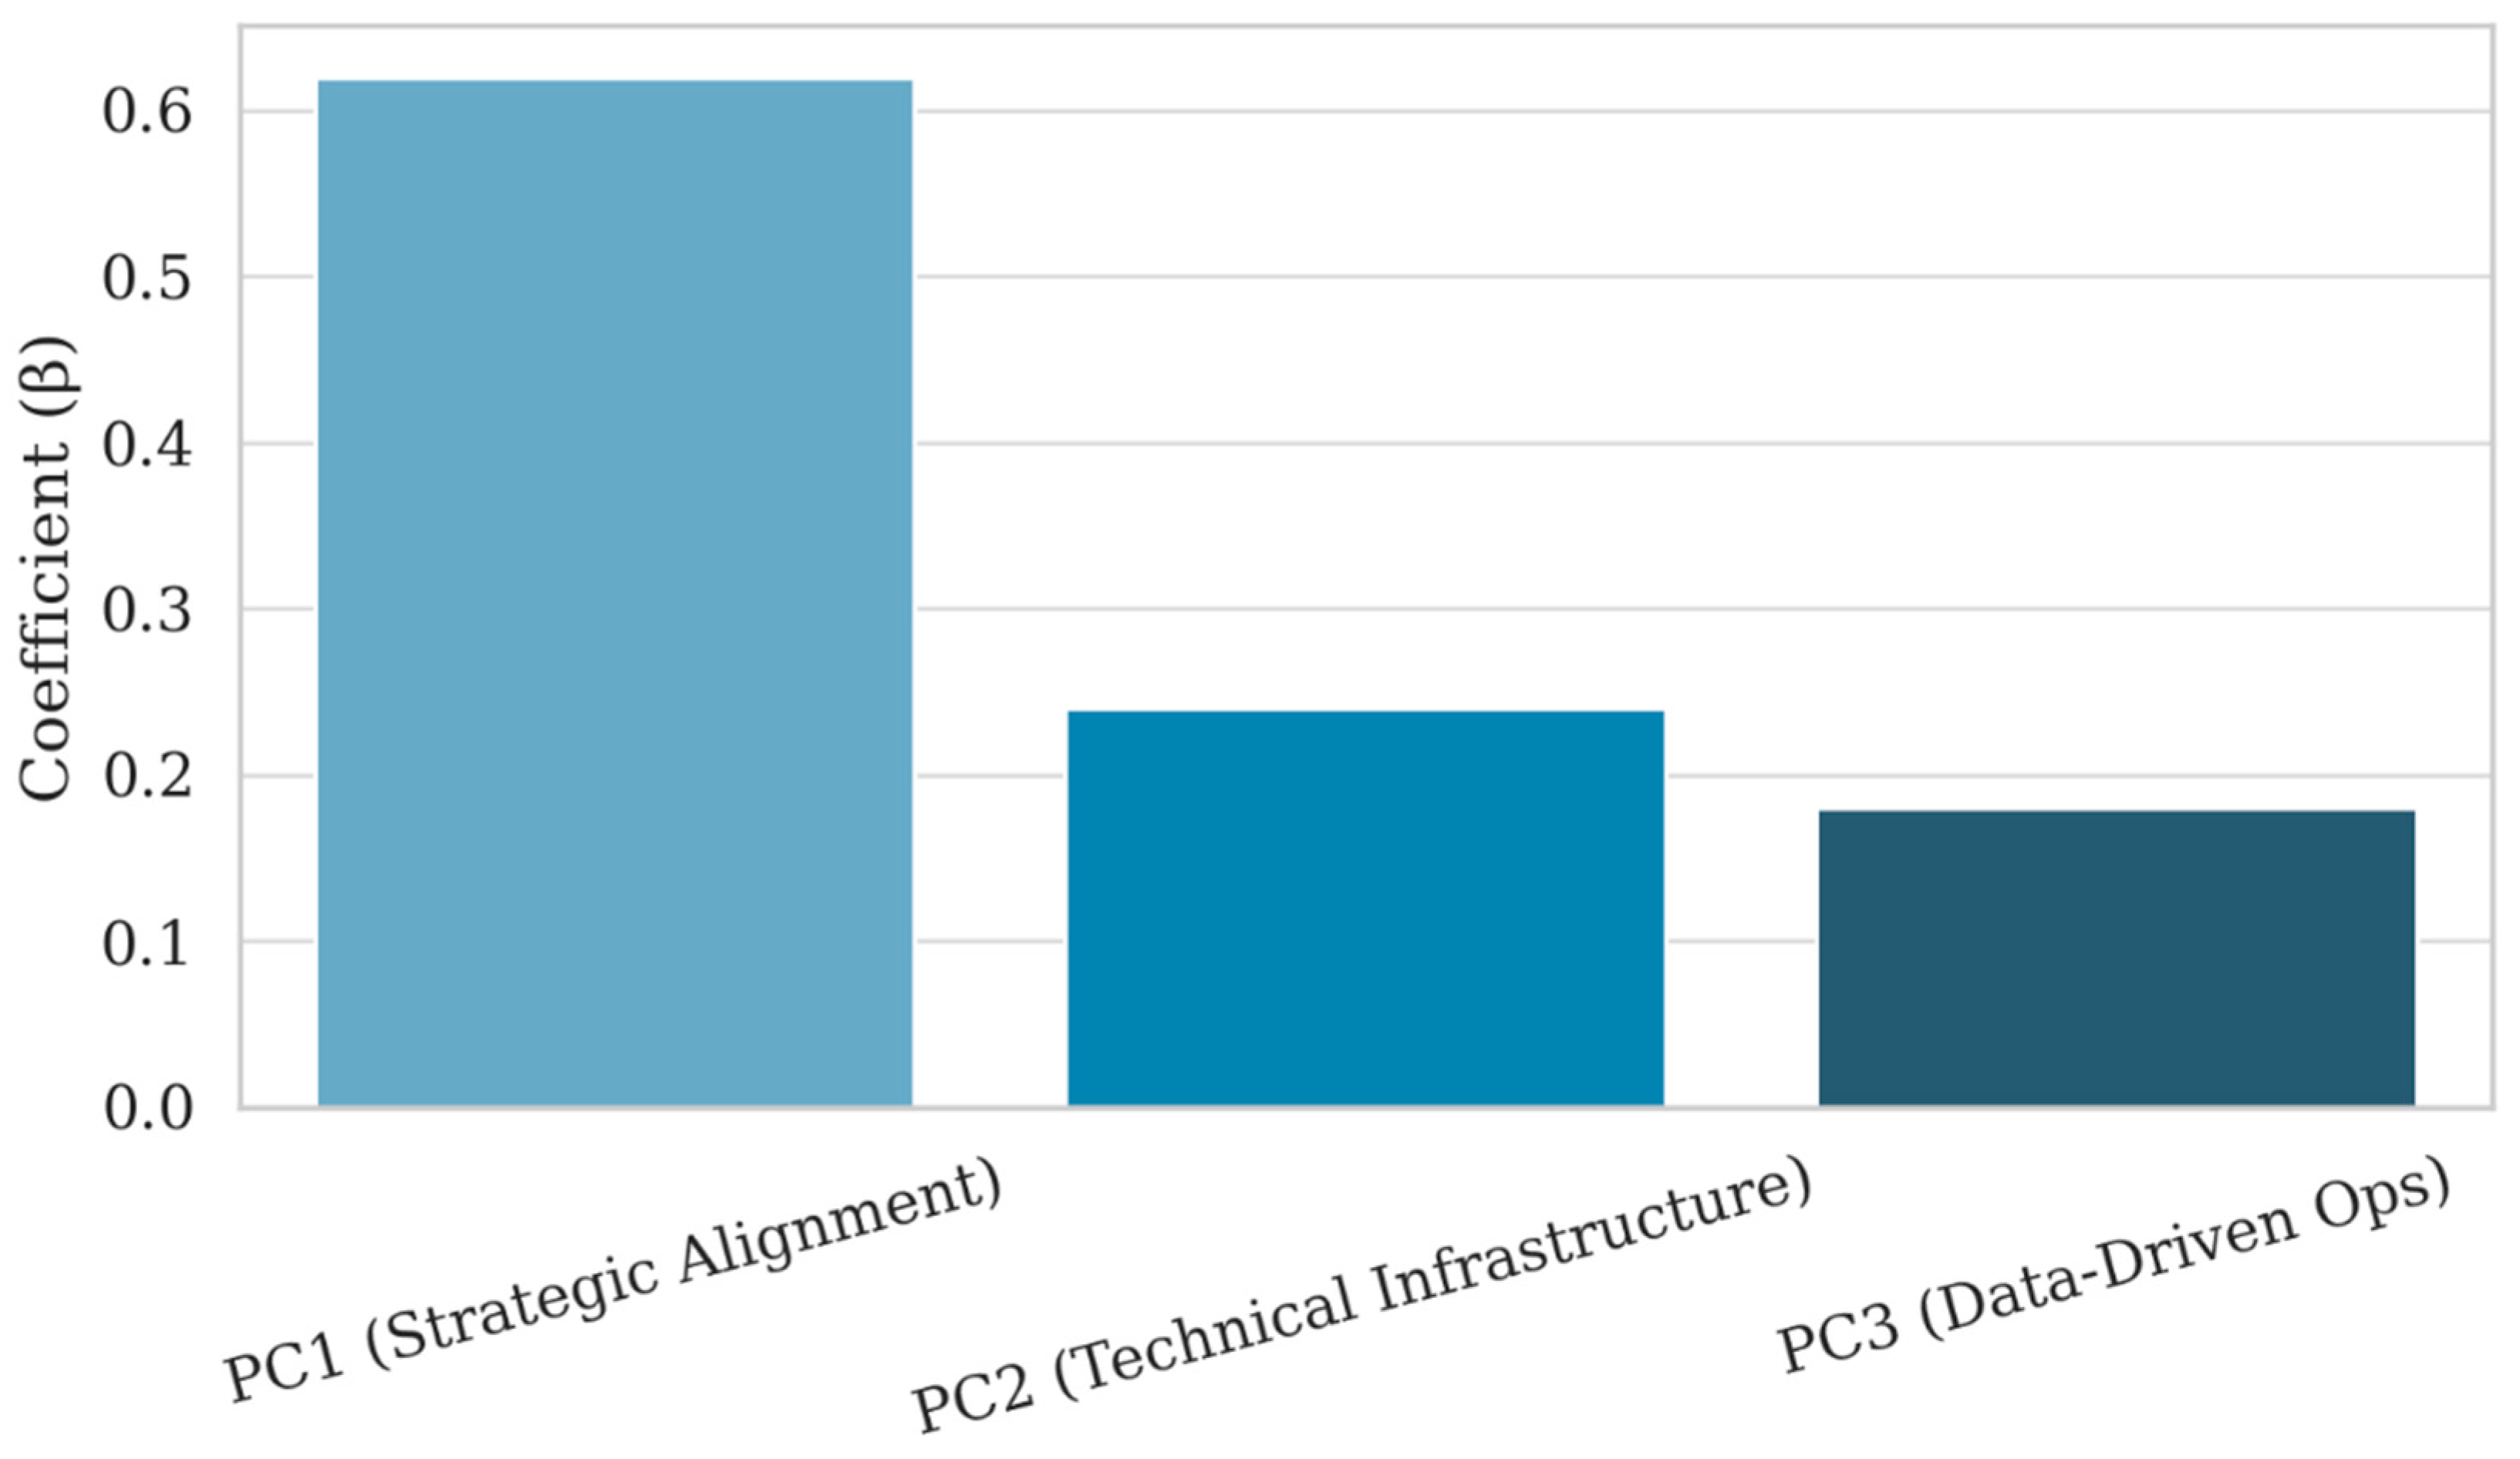
As shown in
Table 10 and visualized in
Figure 15, the Strategic Alignment component emerged as the strongest and most statistically significant predictor (β = 0.62,
p < 0.001). This finding empirically supports the hypothesis that readiness is not merely a function of technological capability, but is fundamentally driven by strategic foresight, internal alignment, and resource readiness. The coefficients for Technical Infrastructure (β = 0.24,
p = 0.075) and Data-Driven Operations (β = 0.18,
p = 0.055) were positive, but only marginally significant. These components thus function as force multipliers and they enhance readiness once the strategic groundwork is in place but lack the power to independently initiate transformation.
The residuals of the regression model followed a normal distribution and exhibited no signs of heteroscedasticity. Variance Inflation Factors (VIFs) were all below 2.0, eliminating concerns of multi-collinearity and affirming the stability of coefficient interpretations.
5.11. Model Diagnostics and Robustness Checks
To ensure the validity of the regression analysis performed on the principal components extracted via PCA, a series of diagnostic tests were conducted.
Model Fit and Explanatory Power: The multiple linear regression model, with the Readiness Gap Index (RGI) as the dependent variable and the top three principal components (PC1–PC3) as predictors, yielded an R2 value of 0.732 and an adjusted R2 of 0.698. This indicates that approximately 70% of the variance in RGI is explained by the latent structure derived from SME capabilities across the six readiness dimensions.
Multicollinearity Check: Variance Inflation Factors (VIFs) for all three PCs were well below the standard threshold of 5 (PC1: 1.82, PC2: 1.33, PC3: 1.57), confirming the absence of multicollinearity and affirming the orthogonal nature of the extracted components.
Residual Diagnostics: The residuals were examined through a normal probability plot and histogram, both of which confirmed approximate normality. A Breusch–Pagan test for heteroscedasticity yielded a p-value of 0.414, suggesting homoscedasticity of residuals. Residuals also showed no evidence of autocorrelation (Durbin–Watson = 2.03).
Robustness Check (Threshold Sensitivity): As a robustness exercise, the threshold for computing “Latent Potential” firms was varied by ±0.3 around the original RGI cutoff of 2.0. The policy target groups identified under this modified criterion showed 91.7% overlap with the original set, confirming the stability of the segmentation logic used in
Section 6.
These diagnostics provide strong evidence that the model is statistically reliable, free from critical violations, and reasonably robust to threshold shifts in key derived indices.
5.12. SWOT Analysis of Digital Readiness Patterns in Indian Automotive SMEs
To synthesize the empirical insights into a strategic diagnostic, a SWOT framework was employed using dimension-wise survey results (see
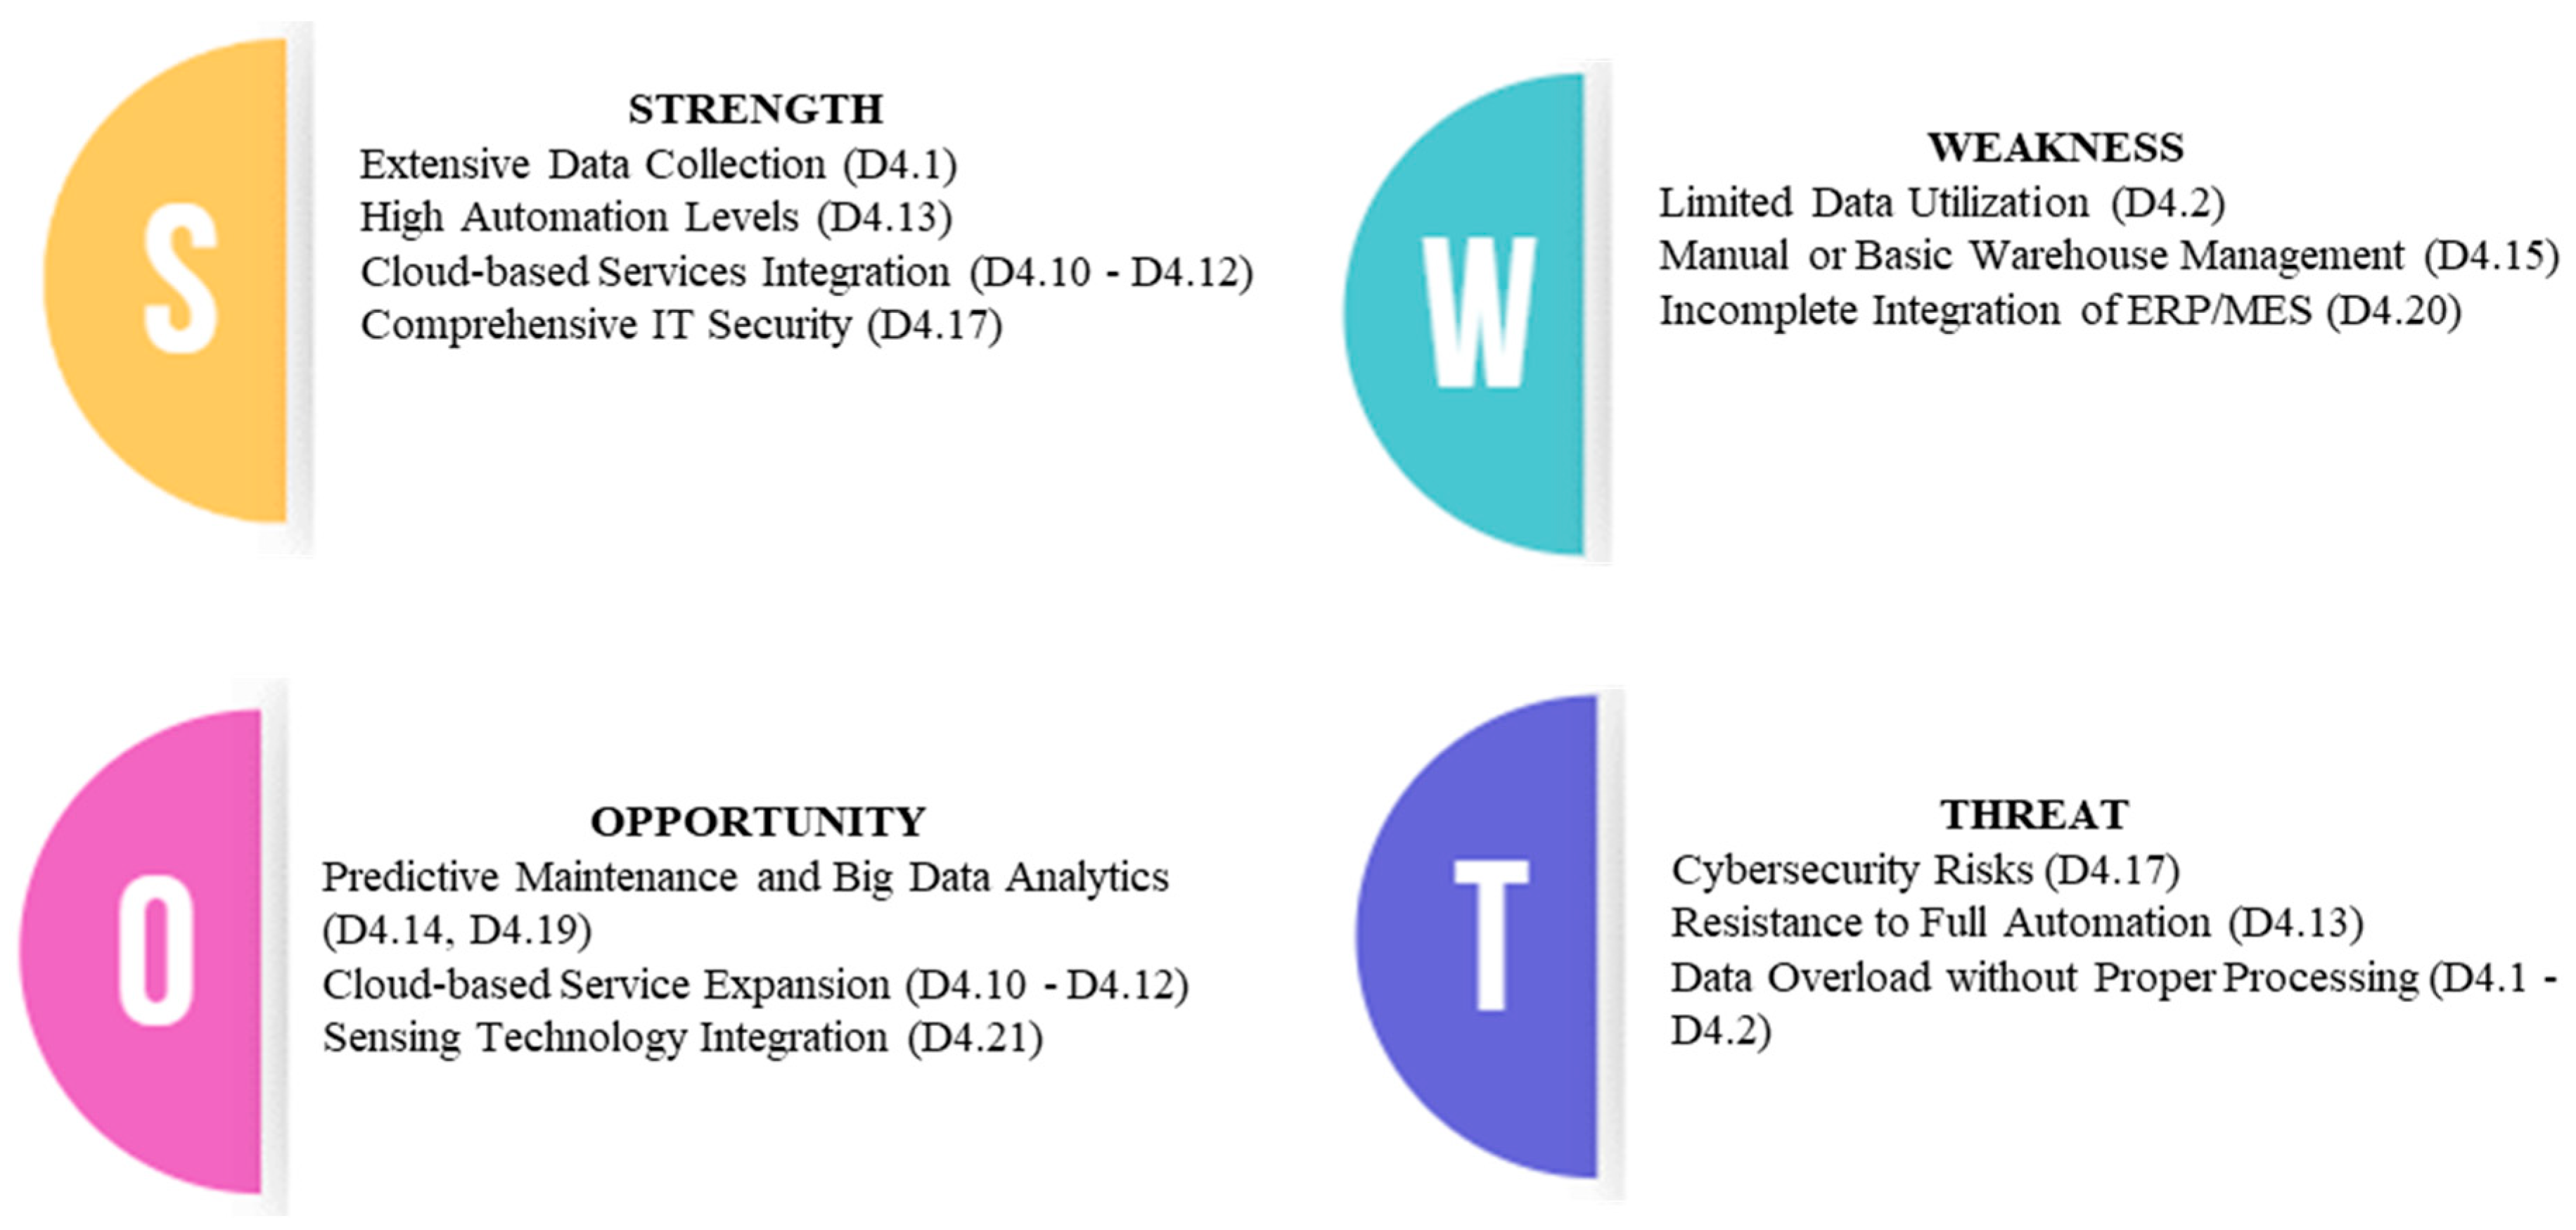
Table 11). The analysis draws on both central tendency (mean readiness scores) and variation (standard deviation) across the six IMPULS dimensions. High scores represent embedded capability (strengths), low scores reveal persistent constraints (weaknesses), high variability points to emerging leverage points or diffusion gaps (opportunities), and low-scoring yet critical dimensions in volatile environments are interpreted as structural risks (threats).
The survey depicts a sector that is mentally ready for change even if its machines, and sometimes its balance sheets, lag behind. Employee capability scores are already high, as Indian shop floor teams demonstrate a strong willingness to learn. Nearly one-third of the surveyed firms have begun channeling that enthusiasm into structured digital transformation roadmaps. Where things unravel is the “hard” end of transformation: large-scale automation, integrated shop-floor scheduling, and cyber-secure data exchanges.
Encouragingly, cost curves are bending in the right direction. Cloud-hosted MESs are no longer luxury line items, and the first generation of Indian retrofit-sensor bundles is undercutting imported hardware by a healthy margin. Government subsidies, though still patchy state-to-state, can close the remaining financing gap for firms willing to move first. Still, the window may be narrower than it looks. OEMs are quietly rewriting supply-chain contracts to demand richer machine data and product traceability, while cyber-criminal activity rises faster than insurance coverage. SMEs that postpone adoption risk facing rapid changes in technical, financial, and contractual conditions before their next strategic review.
In short, capability is present but unevenly distributed; risk is rising and unequivocally sector wide. The task is less about instilling ambition and more about orchestrating resources by aligning workforce motivation and strategic intent with affordable and secure technology pathways. The policy blueprint in the next section addresses exactly that coordination challenge.
5.13. Dimension-Wise Readiness Highlights
A detailed evaluation of each IMPULS dimension reveals specific strengths and weaknesses among Indian automotive SMEs, based on 43 indicators. The key insights for each dimension are presented below.
5.13.1. Strategic Readiness
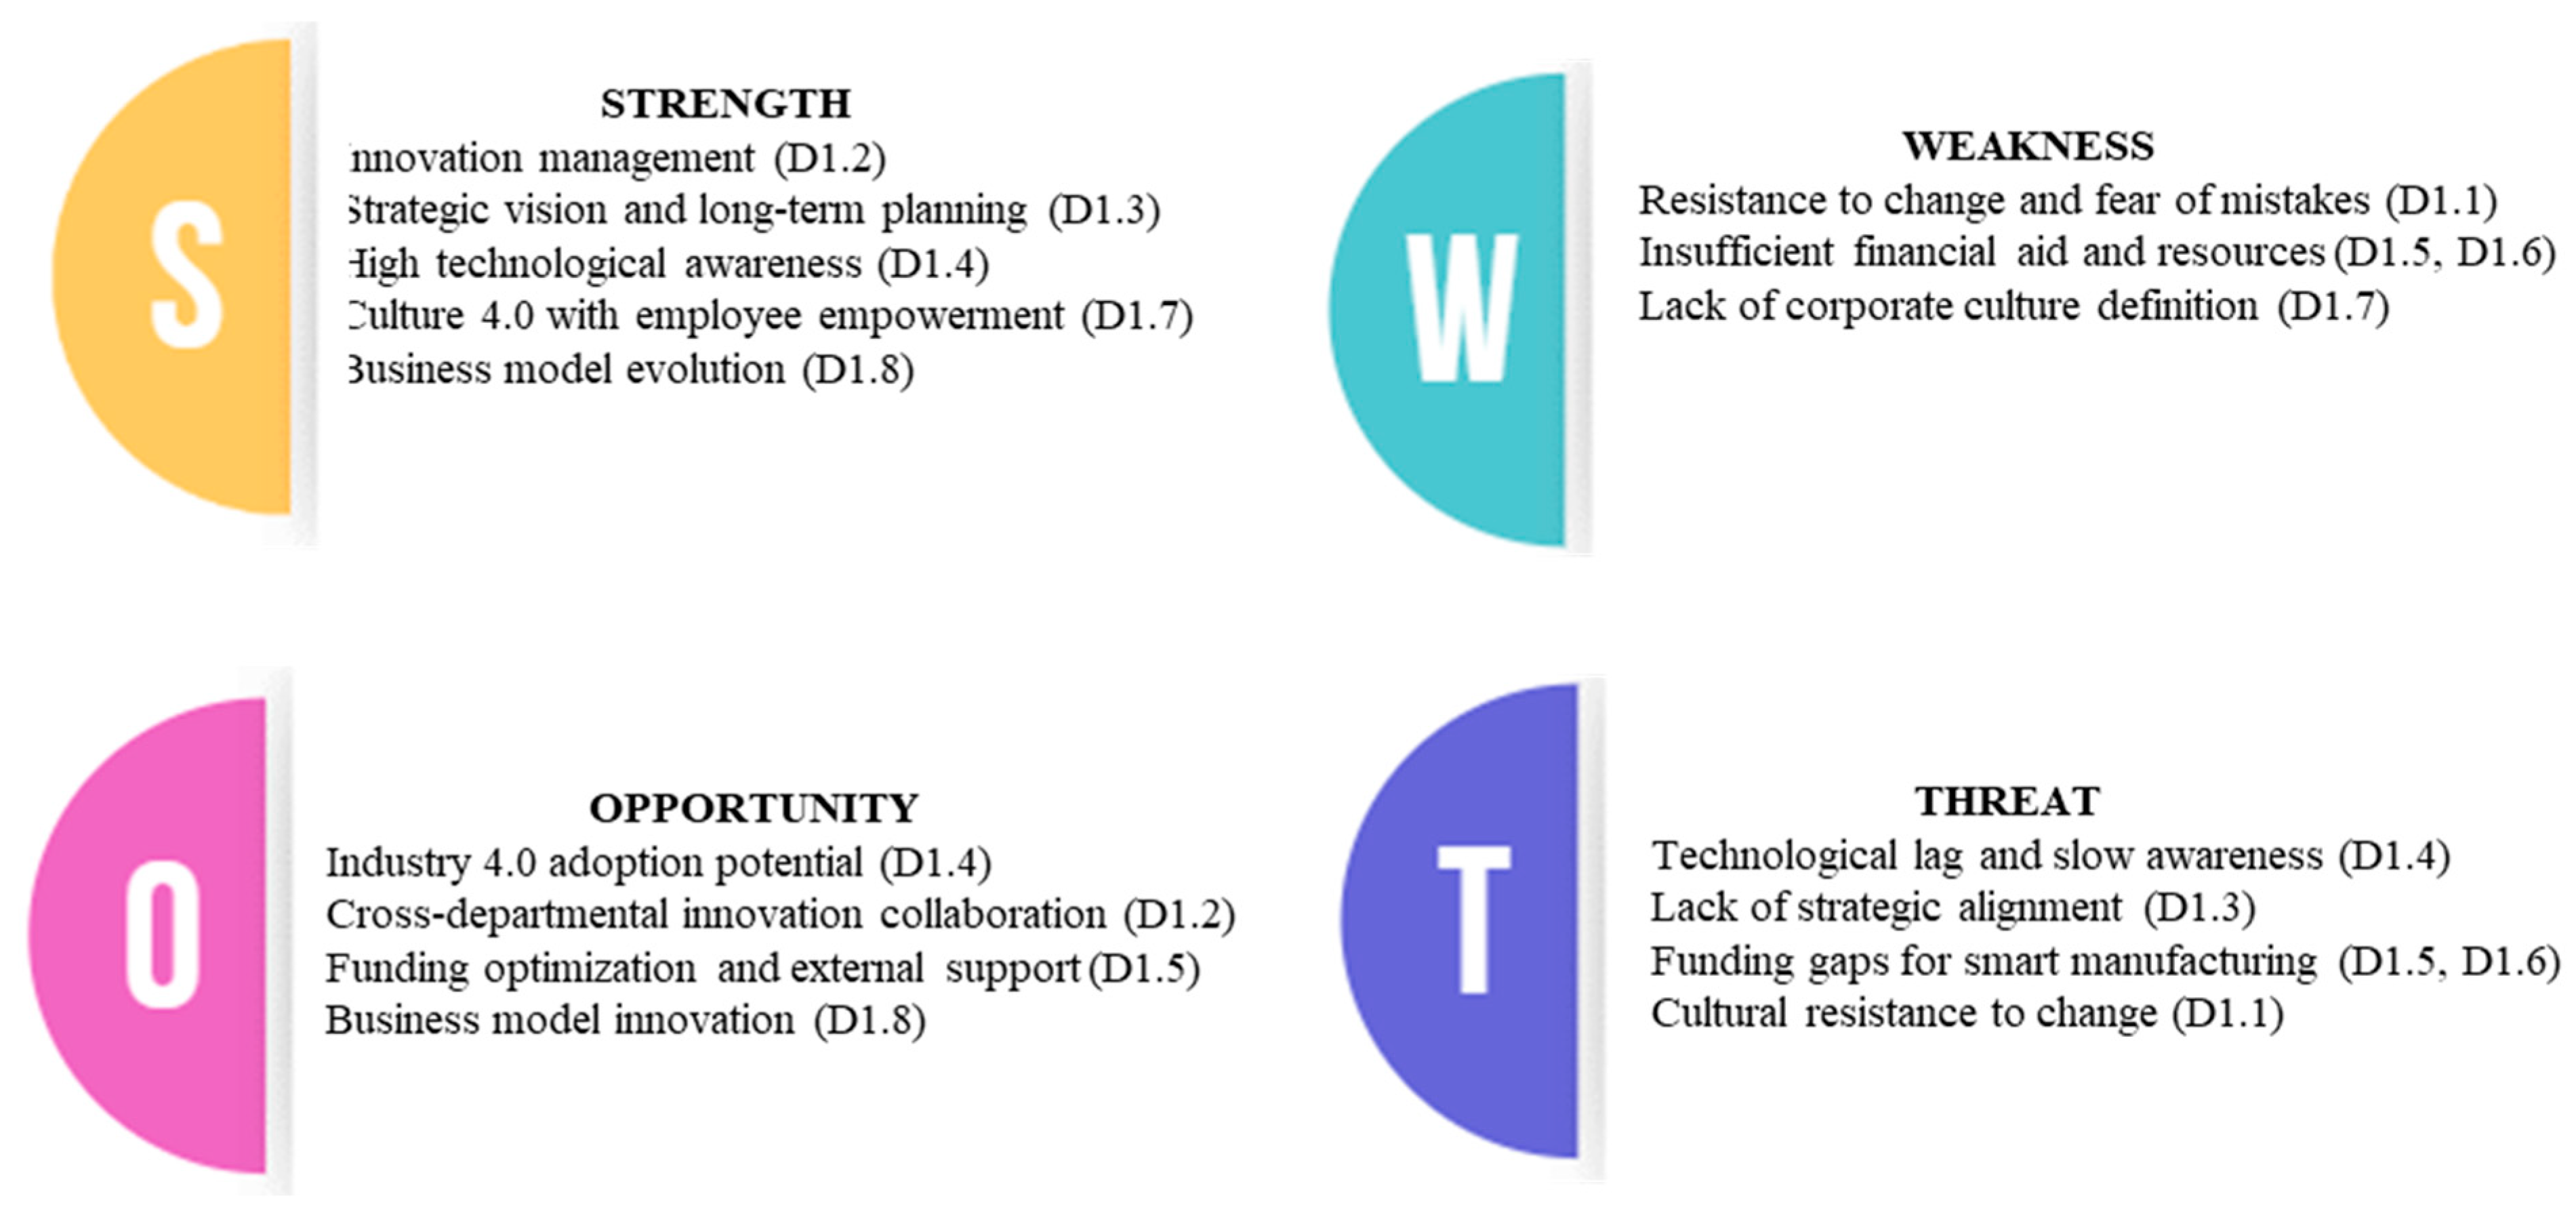
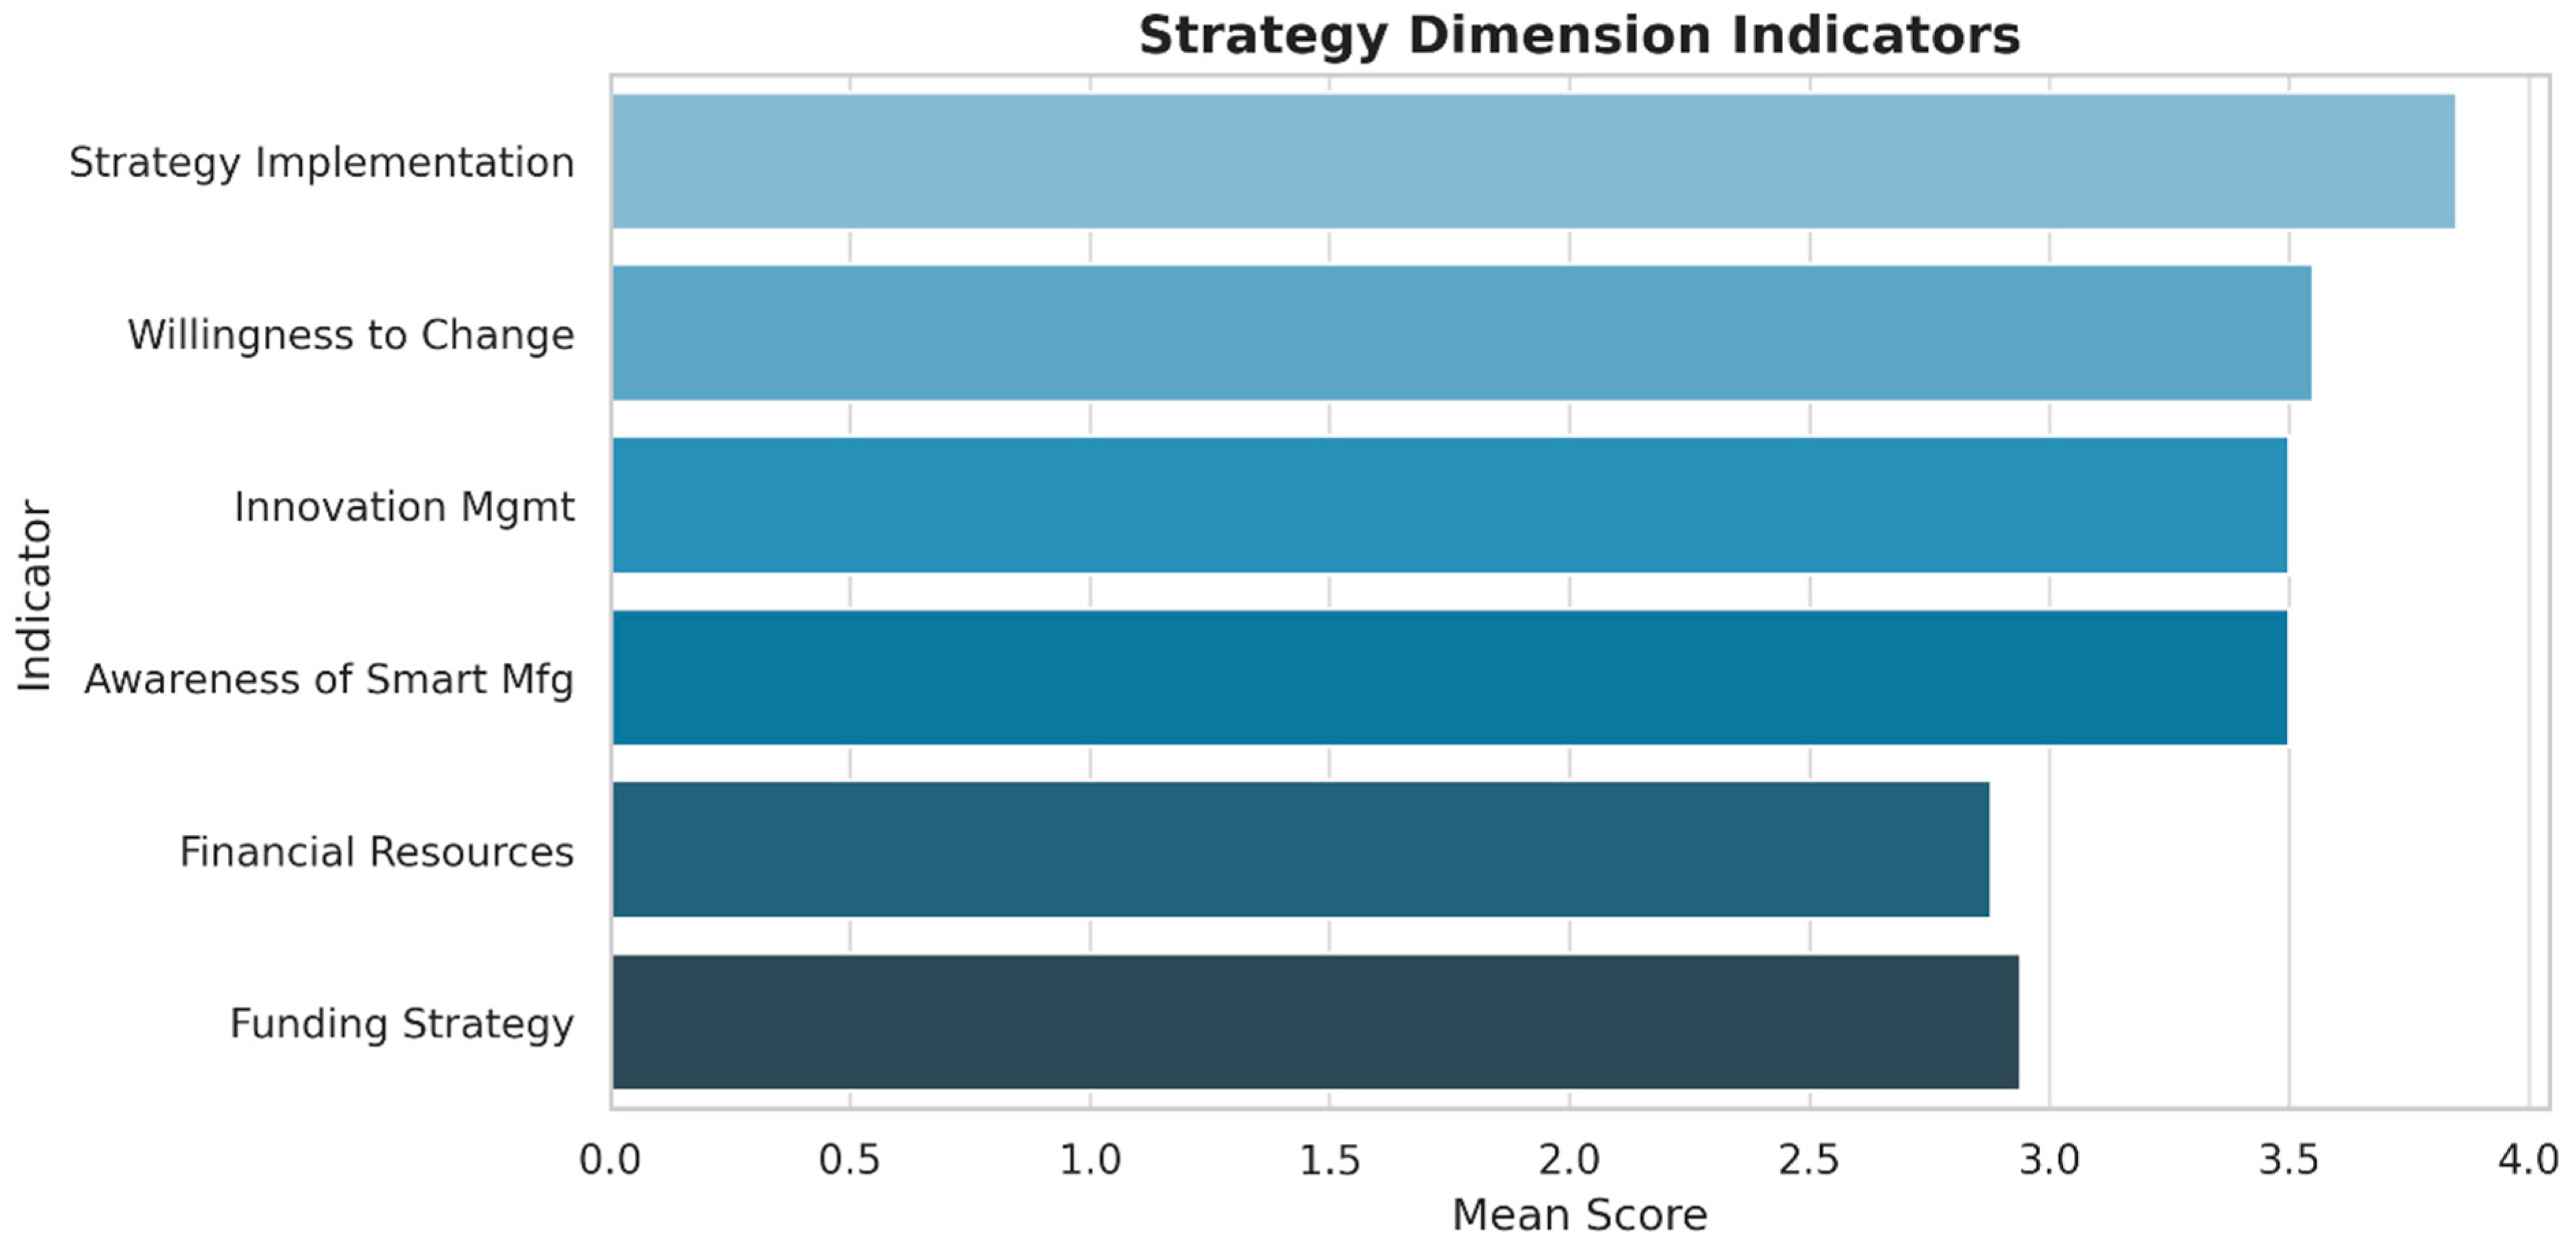
The strategic readiness of the surveyed SMEs presents a moderately advanced posture, reflected in an average score of 3.60 across relevant indicators (see
Figure 16). This suggests that most firms have acknowledged the importance of digital transformation and are actively engaging in planning processes to steer this transition. Many firms have cultivated an innovative mindset and clearly recognize the importance of Industry 4.0, indicating that the strategic basis for smart manufacturing goals is already established. Closer examination, however, uncovers a noticeable gap between this strategic intent and genuine financial preparedness. Measures covering formal investment plans, capital access, and adoption of servitization all scored below three, underscoring the distance between ambition and practical resource mobilization. Lacking scheduled funding programs or dependable external finance, companies often struggle to translate vision into tangible projects. This funding deficit also impedes progress toward flexible models that integrate digital services with core products, an ability widely considered essential for sustained success in smart manufacturing. Consequently, although awareness and intent are strong, implementation remains uneven. Closing this gap requires targeted action: easier access to low-cost loans, government-supported innovation grants, and mentoring schemes that move SMEs from planning to execution, thereby converting readiness into measurable gains. Such support can unlock latent capacity, speed technology uptake, and establish resilient supply chains in emerging manufacturing regions.
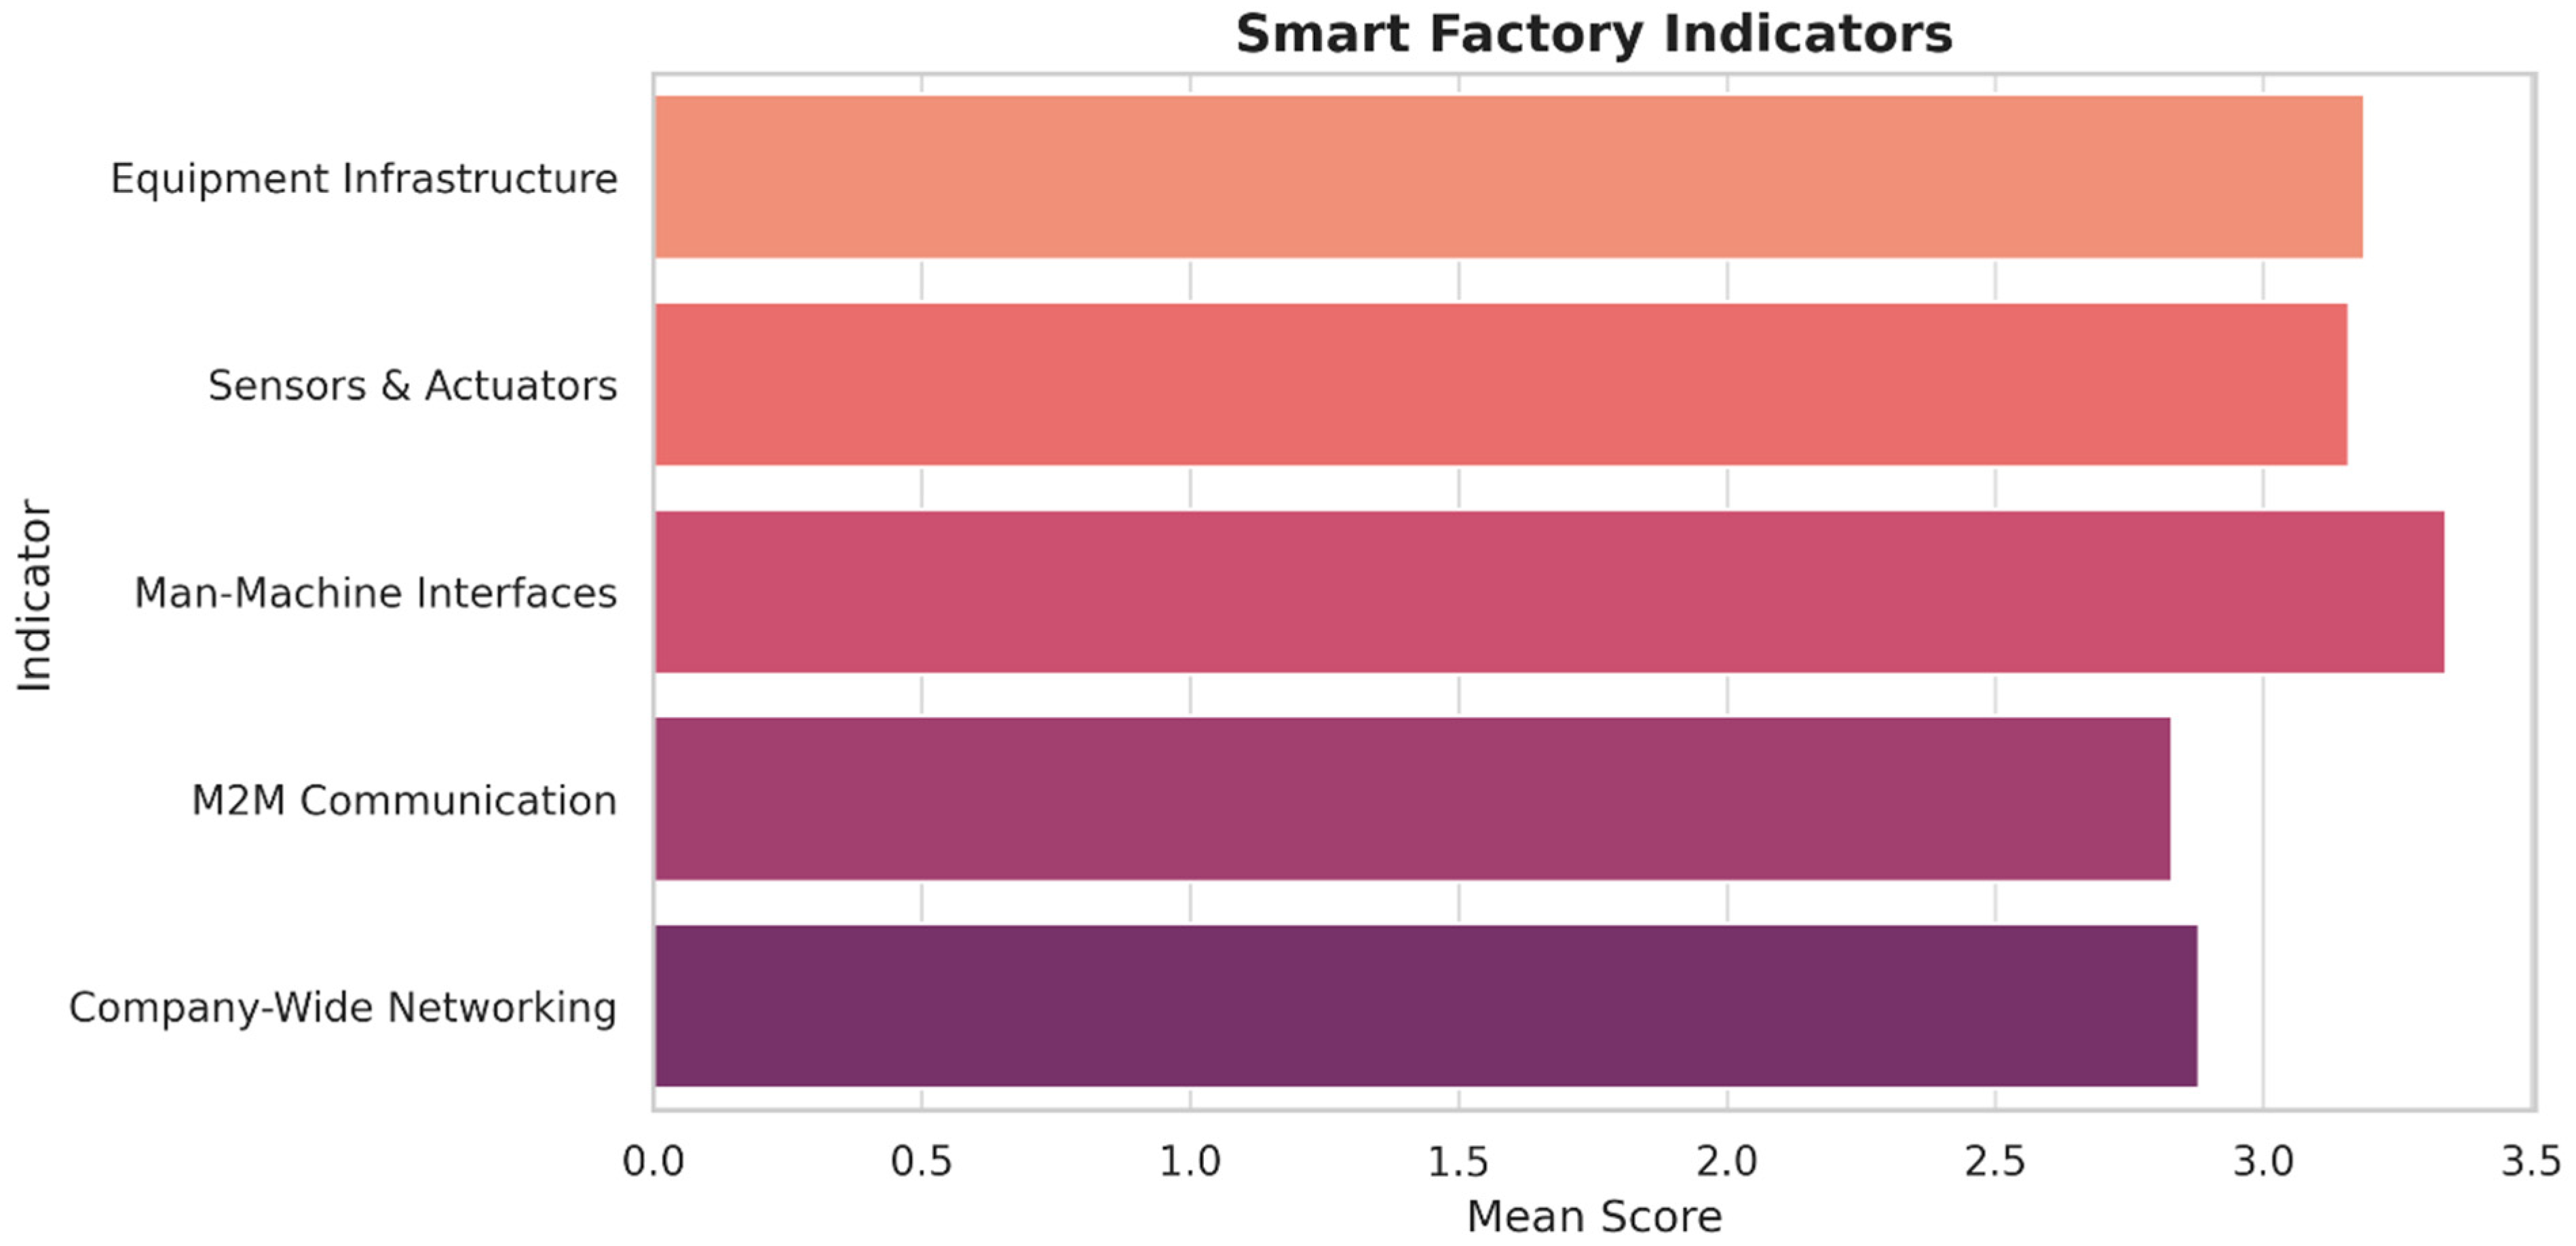
5.13.2. Smart Factory Capabilities
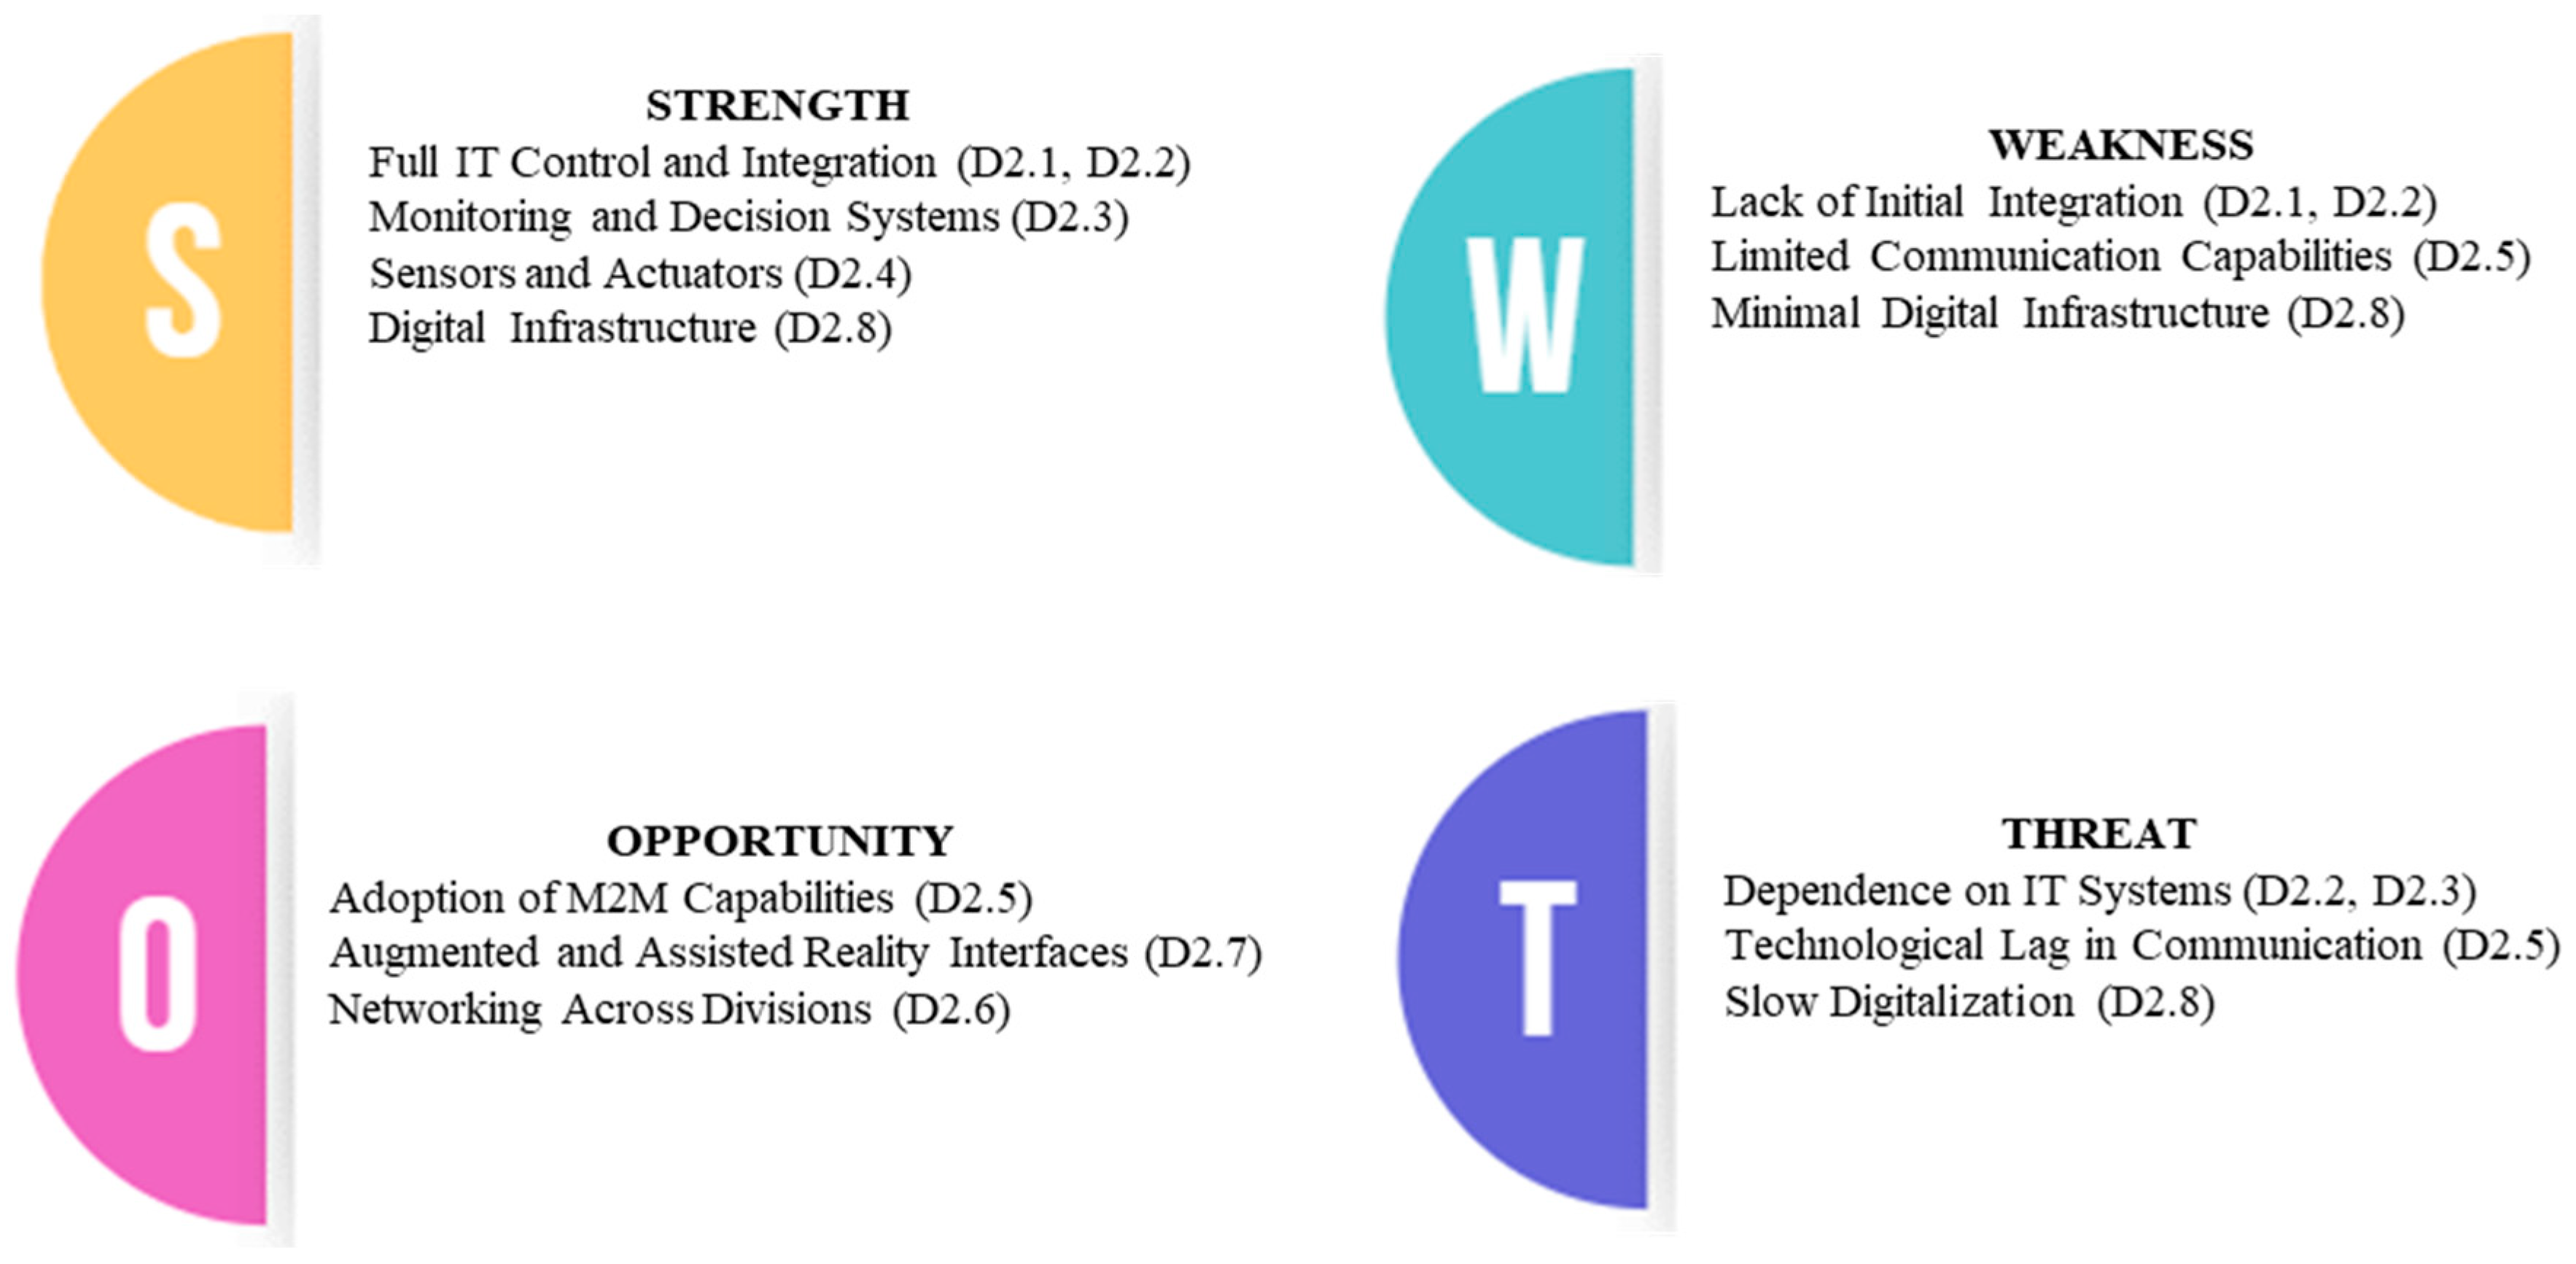
The Smart Factory dimension (see
Figure 17) achieved an average score of 3.19, indicating that most SMEs in the sample are still in the initial phases of digital integration. Although several firms have adopted technologies like basic sensors, programmable logic controllers (PLCs), and IT systems within their production lines, these tools typically function in isolation, without meaningful interconnection across departments. This lack of integration limits the broader advantages that fully developed smart manufacturing systems are designed to deliver. Firms showed some awareness of digital tools, but capabilities such as machine-to-machine communication, real-time decision systems, and the use of augmented reality for operations remain underdeveloped. These technologies are either absent or implemented in a very limited scope, which indicates that transformation is currently being approached in a fragmented, incremental way rather than as a comprehensive digital overhaul.
The data also suggests that while many SMEs are willing to invest in digital upgrades, several structural barriers slow their progress. These include reliance on legacy systems, inadequate digital infrastructure, and limited access to integration expertise. In most cases, firms have improved isolated areas of production but have yet to establish an interconnected system that links production data with decision-making at the organizational level.
Moving toward a fully functional smart factory environment will require more than just acquiring new technologies. It calls for coordinated planning, workforce training, and investments in scalable IT systems. Support from government and industry networks such as funding for pilot projects, access to plug-and-play digital solutions, and technical training could help SMEs bridge the current gaps and achieve broader, factory-wide transformation.
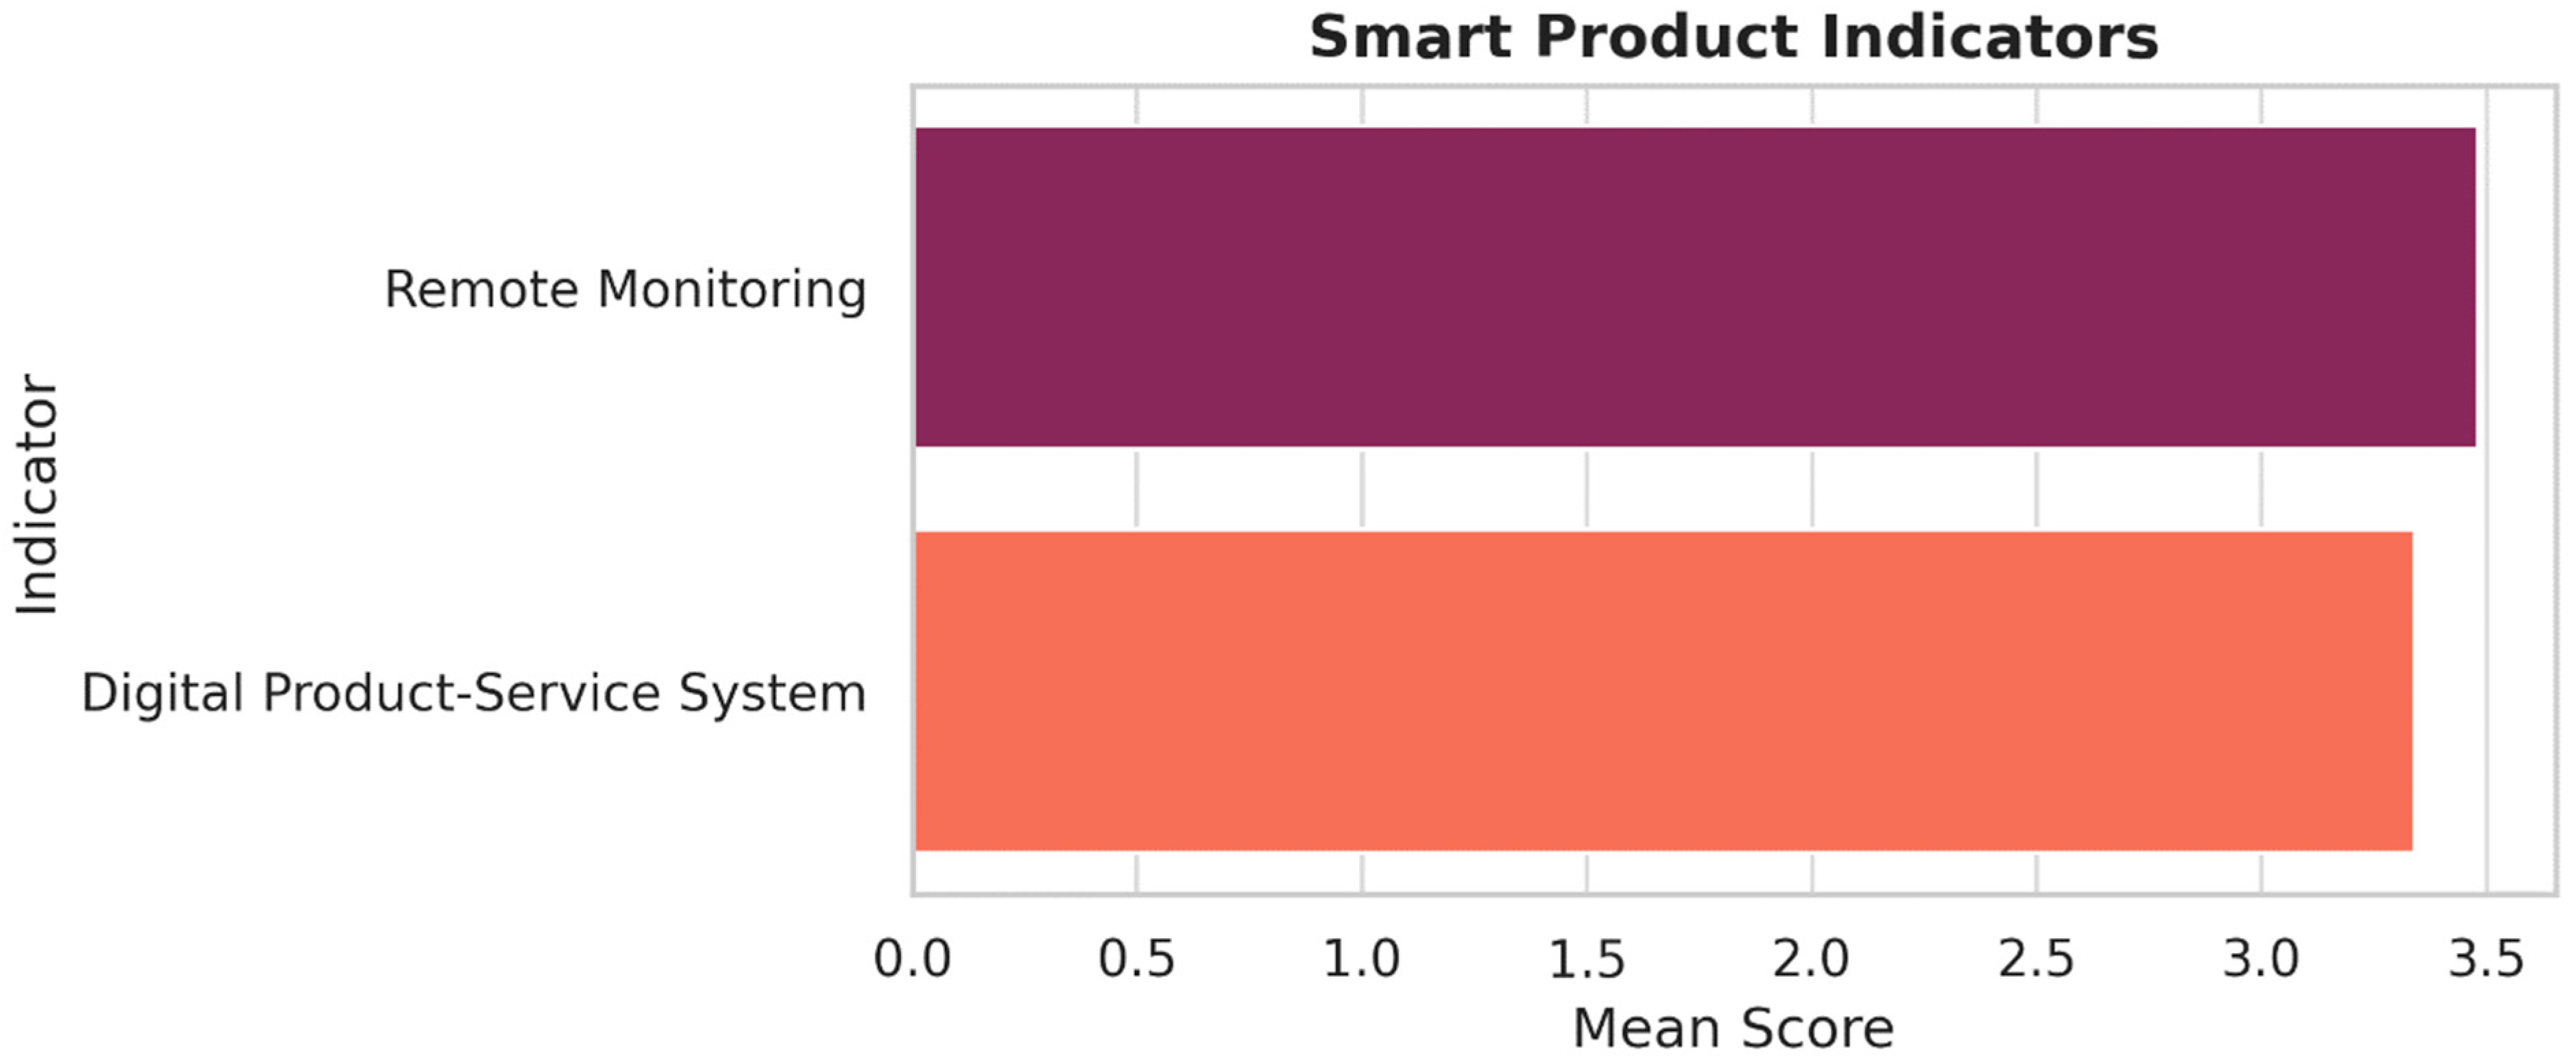
5.13.3. Smart Products
The Smart Products dimension (see
Figure 18) produced an average score of 3.41, signaling moderate progress by SMEs in adding intelligence to their offerings. A number of firms now embed sensors or connectivity units in their products, yet this capability is usually restricted to simple remote-monitoring or performance-tracking functions. More advanced features such as autonomous interaction, adaptive behavior, and seamless integration with broader digital service platforms remain relatively uncommon. Several companies report delivering digital add-ons such as maintenance alerts or usage dashboards alongside physical goods. These services, however, are often static and do not react dynamically to real-time product data. Integrating product intelligence with customer feedback loops or predictive maintenance remains in an early phase, implying that smart-product concepts are recognized but not yet fully realized because of technical limits and constrained development resources.
Findings further show that the ability to design and roll out smart products is mostly confined to firms with mature research facilities or strong partnerships with technology specialists. Smaller businesses, by contrast, wrestle with the cost and complexity of embedding ICT components, particularly when the likely return on investment is uncertain. A shortage of interoperable standards and insufficient platform readiness along the supply chain also hampers innovation at product level.
To harness the full value of smart products, SMEs require both advanced technical tools and clearer market intelligence. Collaboration with digital-design studios, structured pilot programs, and focused training in embedded systems and product–service integration could provide the momentum needed to shift from conceptual preparation to concrete, value-creating outcomes. Without such support, many SMEs risk falling into a pattern of partial digital adoption that fails to deliver competitive advantage in the long run.
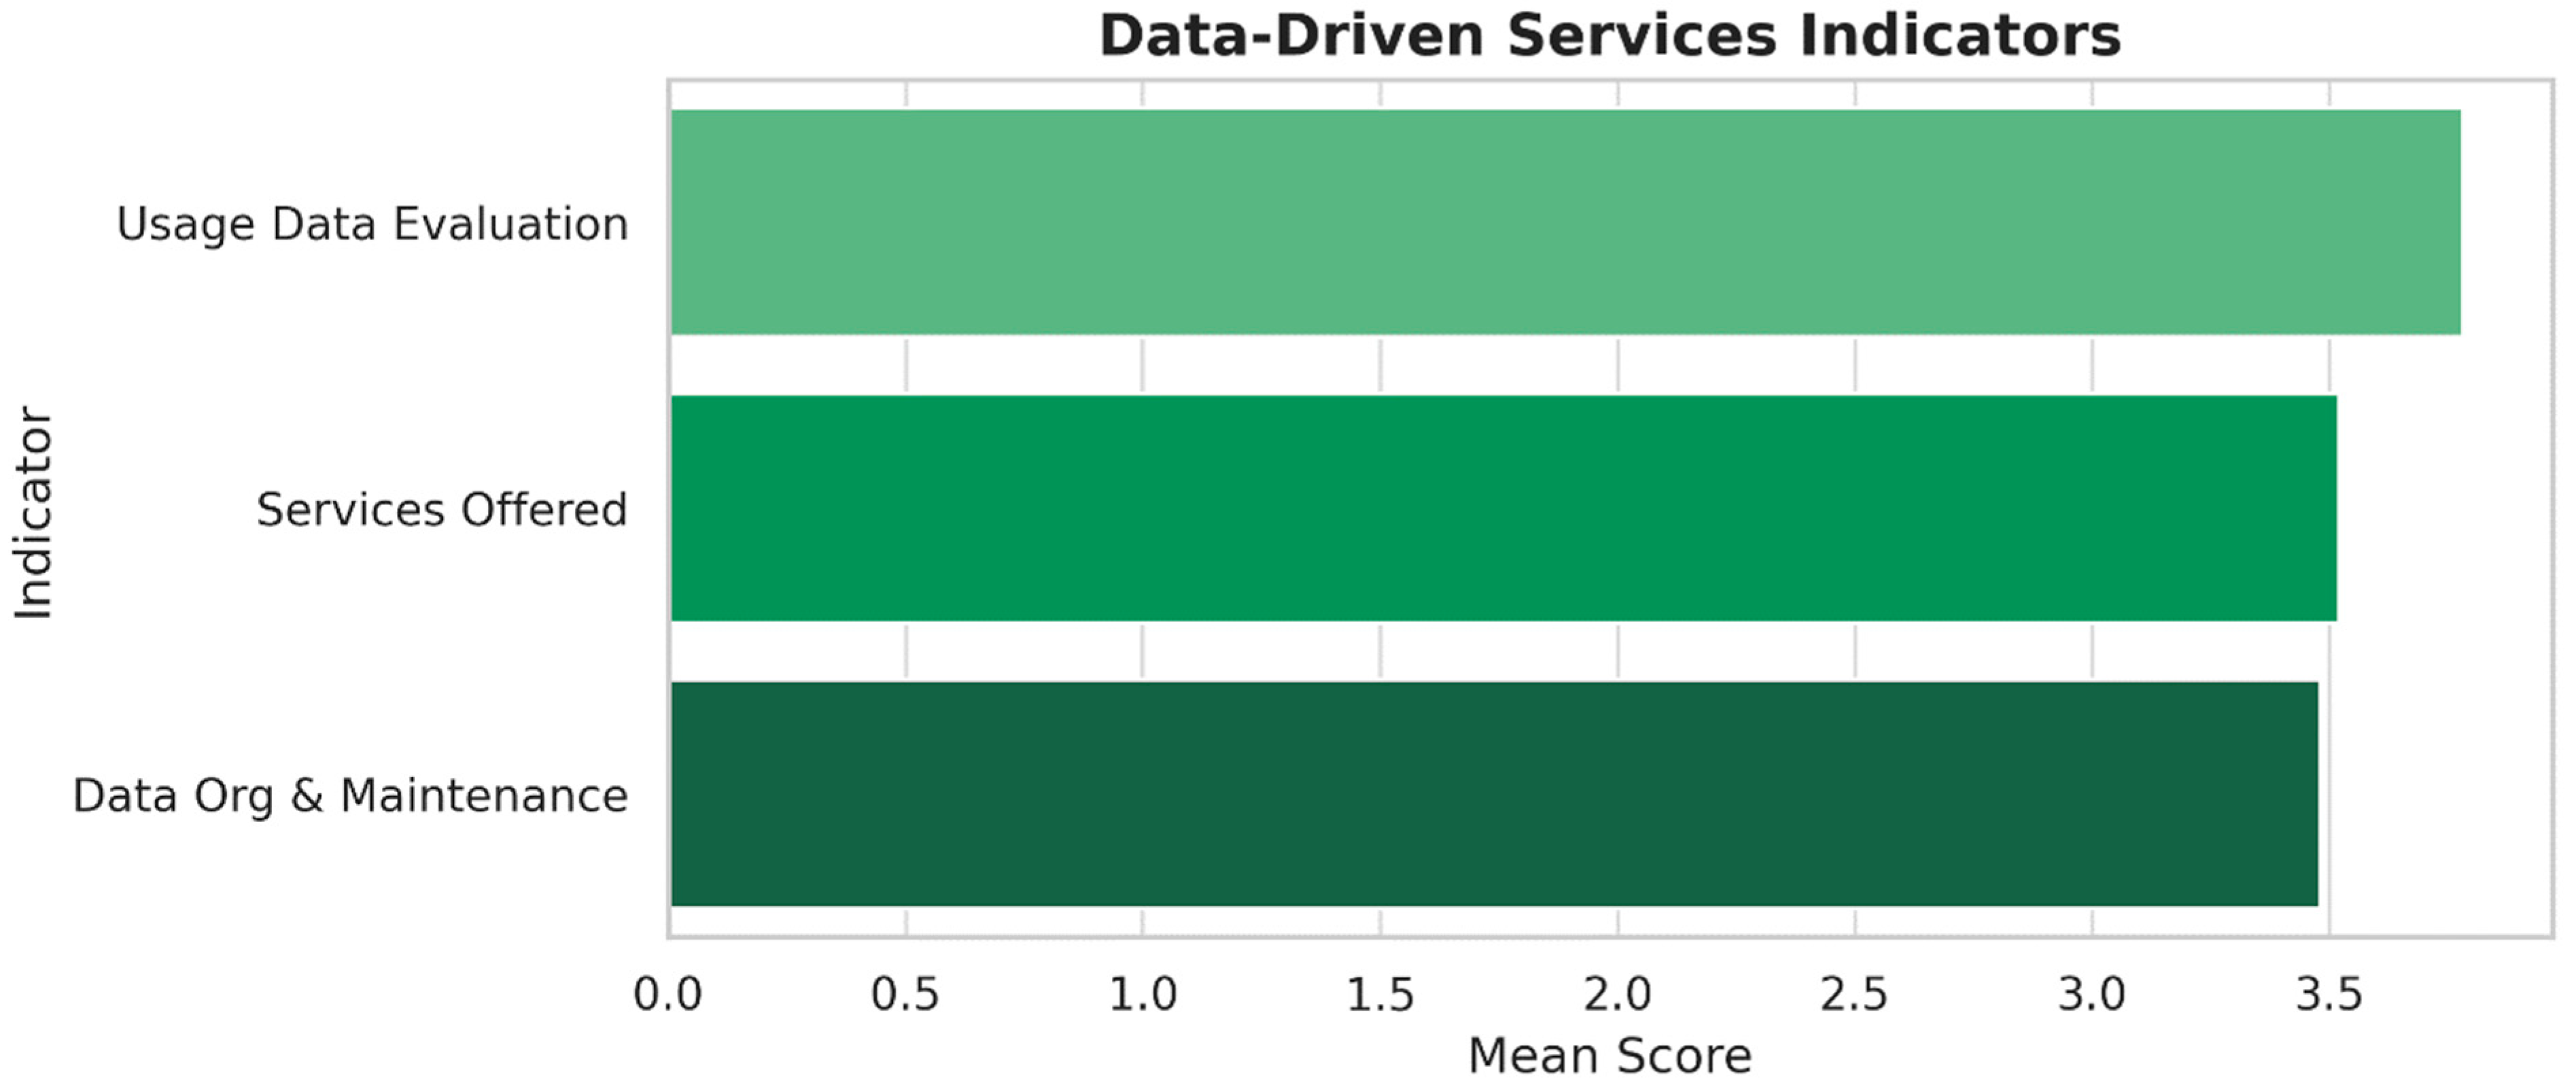
5.13.4. Data-Driven Services
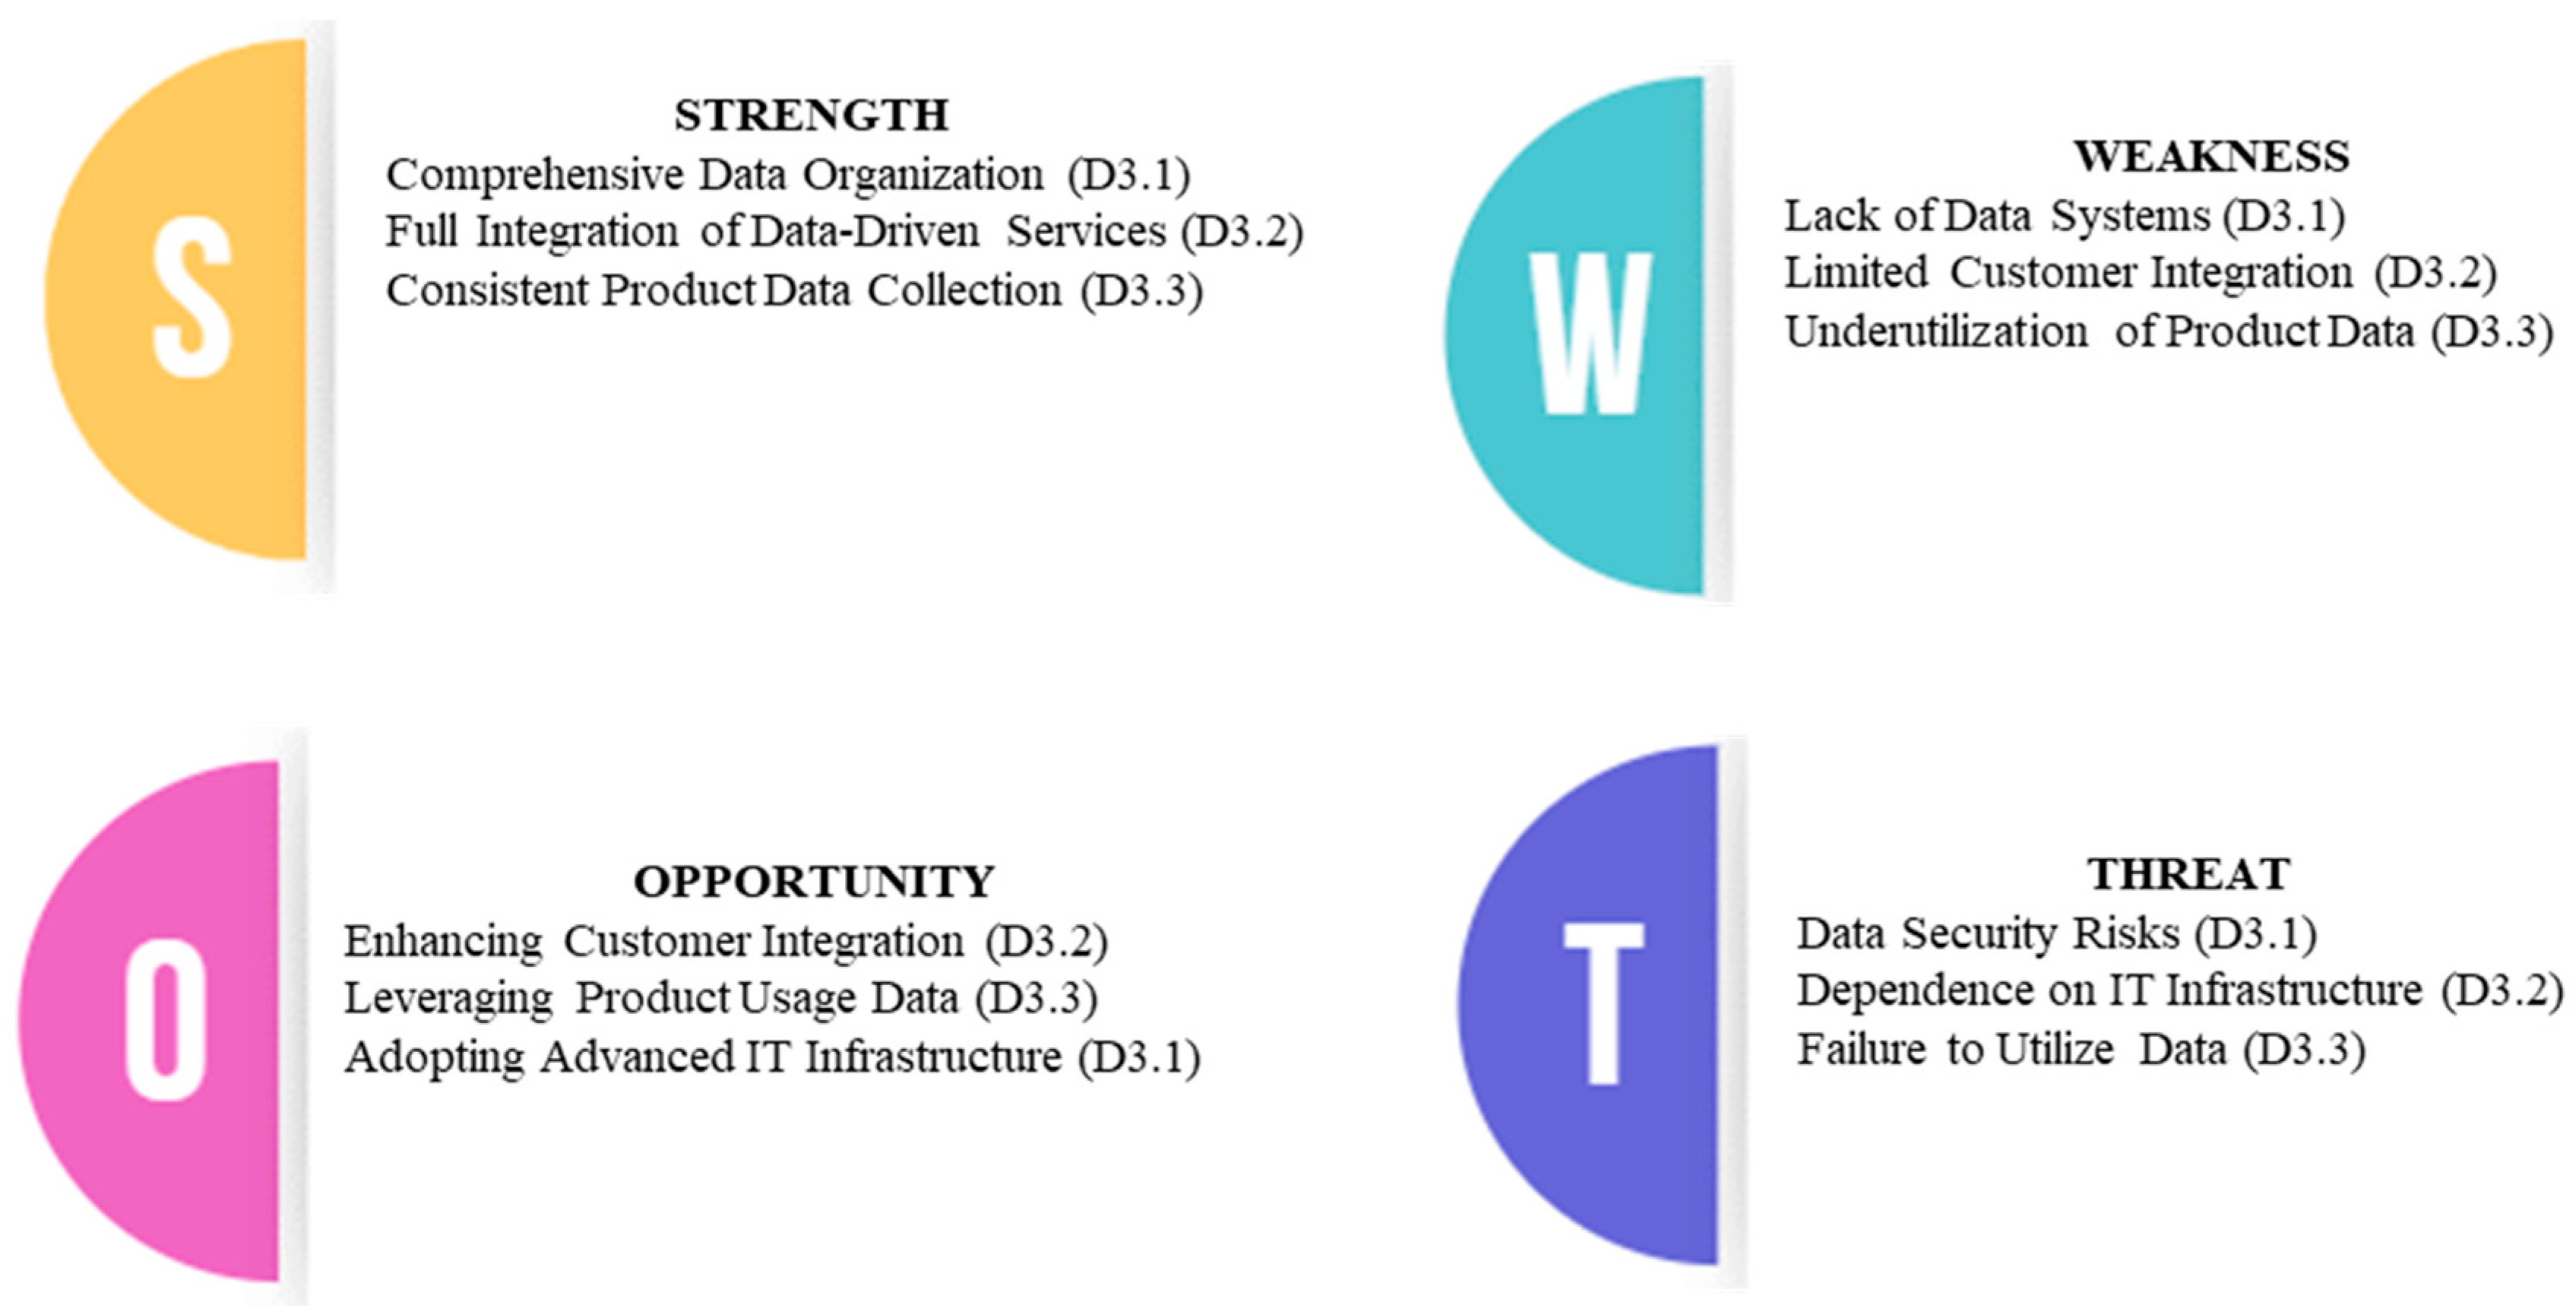
The Data-Driven Services dimension (see
Figure 19) recorded a relatively strong average score of 3.62, indicating that many SMEs have begun leveraging operational data to improve service offerings and internal decision-making. This is a promising sign, as it suggests that firms are not only collecting data but are also beginning to recognize its strategic value in shaping business outcomes. In particular, several respondents noted the use of customer-facing dashboards, digital maintenance alerts, and basic analytics tools that support service delivery. However, while data collection is becoming more widespread, its full potential remains underutilized. Many firms are still at the stage of descriptive analytics, where data is used to understand past performance rather than to predict or influence future behavior. Integration with customers’ systems is limited, and feedback mechanisms based on product usage patterns are not yet fully embedded in service processes. This gap prevents firms from offering more advanced, personalized services that can differentiate them in competitive markets.
The analysis also reveals that much of the data being gathered is not systematically organized or mined for deeper insights. In several cases, companies store large volumes of operational and usage data without clear strategies for how to monetize it or feed it back into product design and service development. Without robust data infrastructure and analytical capability, the insights remain locked within siloed systems.
To strengthen this dimension further, SMEs need support in developing scalable data architectures and acquiring skills in advanced analytics and cloud-based platforms. Partnerships with analytics firms, shared data marketplaces, and low-cost subscription tools could help firms move beyond basic reporting and begin offering intelligent, responsive services. With the right tools and frameworks in place, data-driven services can evolve from a supplementary function into a core competitive asset.
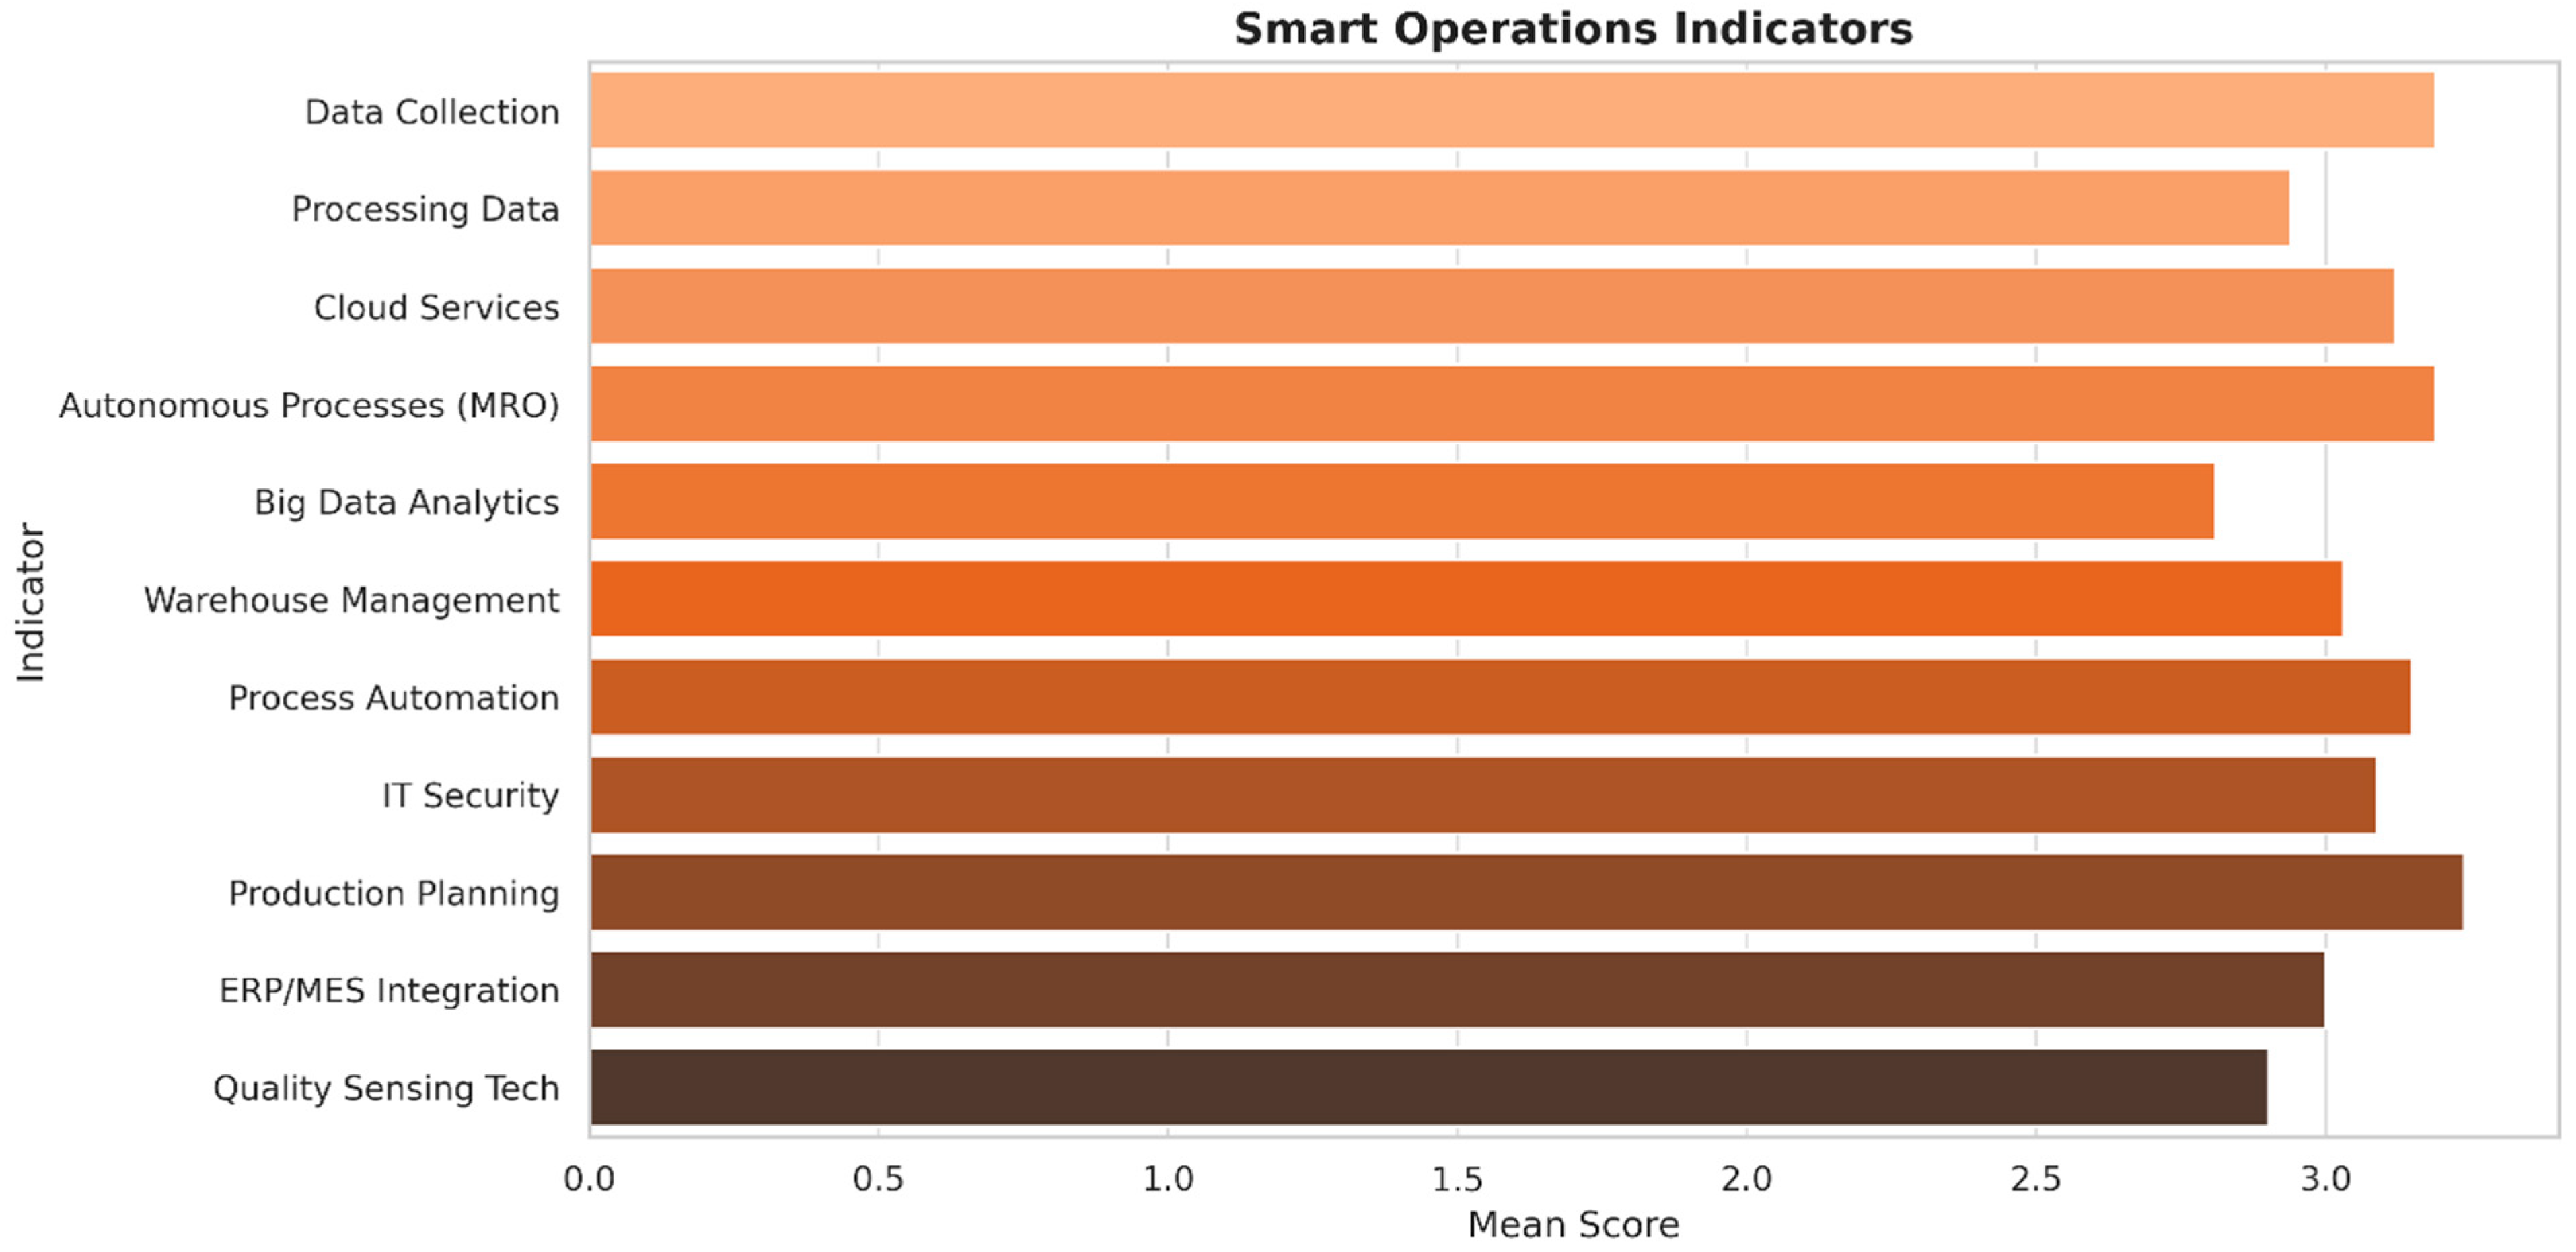
5.13.5. Smart Operations
Smart Operations emerged as the weakest dimension (see
Figure 20) in the overall readiness assessment, with an average score of 3.43. Although several firms have begun to collect production data and use basic monitoring tools, the integration of these systems into daily decision-making remains limited. Advanced features such as cloud-based process management, predictive maintenance, and autonomous control mechanisms are largely absent or in the early exploratory phase. This highlights a significant gap between awareness and practical implementation when it comes to operational intelligence. In many cases, production data is gathered but not systematically analyzed. The infrastructure required to translate this data into real-time insights such as advanced analytics platforms, integrated ERP/MES systems, and dynamic planning tools is either not yet in place or underutilized. As a result, firms struggle to automate workflows or optimize operations dynamically based on live data. Several respondents indicated that warehouse management, quality control, and production planning are still handled manually or semi-digitally, which restricts their ability to scale or respond to variability efficiently.
The analysis also suggests that cyber-security and system interoperability are ongoing concerns. The lack of secure and well-integrated digital infrastructure discourages firms from adopting higher levels of automation, especially when production data flows across multiple departments or partners. Additionally, the perceived complexity of integrating legacy systems with newer smart technologies often leads to hesitation or delayed implementation.
Improving smart operations will require a multi-pronged approach. SMEs need accessible solutions that allow for incremental automation, as well as training in how to deploy and manage data-rich systems. Public and private sector initiatives that provide plug-and-play ERP/MES platforms, cloud storage subsidies, or modular automation kits could accelerate adoption. Without such support, many SMEs risk stagnating in a semi-digital state where operations remain reactive, inefficient, and vulnerable to disruption.
5.13.6. Workforce Capability
Workforce capability (see
Figure 21) emerged as the strongest dimension in the readiness review, recording an average score of 3.91 with very little variation among firms. This outcome signals a broad commitment by SMEs to develop employee skills, particularly those tied to digital tools, process adaptation, and new technologies. Most companies described holding regular training sessions, structured skill-development programs, and seeing an overall willingness among staff to adjust even when new systems altered established routines. These observations confirm that human capital is a major asset for firms moving toward smart manufacturing. Workers appear eager and able to learn fresh digital competencies, and many businesses already harness this energy through workshops, certification courses, and informal learning, fostering a culture of innovation and continuous improvement that can support further transformation.
Even so, the analysis highlights a noticeable shortfall: although many organizations have a flexible workforce, this advantage has not yet yielded equivalent progress in technology-focused areas such as Smart Operations and Smart Factory. The evidence suggests that while talent exists, the organizational systems and financial backing needed to apply those skills remain insufficient or slow to materialize. Consequently, notable potential remains untapped. Addressing this imbalance will require targeted investment, better coordination between strategic goals and technical upgrades, and stronger management support to convert workforce readiness into measurable operational gains.
To bridge this gap, SMEs need to align their technical roadmaps with human capability strategies. Encouraging cross-functional teams, expanding training to cover advanced analytics and IoT system management, and providing employees with hands-on exposure to digital tools can help reinforce the link between human readiness and technological advancement. Additionally, policies that recognize and reward employee-led innovation could encourage greater initiative and bottom-up contributions to the smart transformation process.
5.14. Key Patterns and Practical Implications
The results of this study reveal a number of consistent and empirically grounded patterns in the smart manufacturing readiness of Indian automotive-sector SMEs. These patterns go beyond individual indicators or dimensions, pointing instead to systemic behaviors, interdependencies, and strategic blind spots that must be addressed for successful transformation.
One of the most striking findings is the disconnect between workforce capability and technical execution. With a mean score of 3.91, Workforce (D6) emerged as the most mature dimension across firms, exhibiting the lowest variance. This suggests consistent and widespread investment in skill development, adaptability, and employee training. However, this strength has not translated proportionally into higher readiness in Smart Factory (D2) or Smart Operations (D4), where average scores were significantly lower (3.19 and 3.43, respectively). This suggests that while employees are ready and willing, they are not being fully utilized in driving technological change, either because the necessary systems are not yet in place or because their roles remain functionally disconnected from digital transformation processes. Without structural and technological alignment, this human capital advantage risks being under-leveraged.
A second pattern emerges in the correlation matrix and PCA structure: namely, the fact that readiness is not distributed randomly across dimensions. Firms that score well in one technical area often score well in others, and vice versa. This interdependence is most visible between Smart Factory (D2) and Smart Operations (D4), which exhibited the highest pairwise correlation (r = 0.80). Similarly, the PCA revealed that over two-thirds of the total variance in readiness could be explained by just three components: strategic alignment, technical infrastructure, and data-driven operations. This suggests that transformation tends to unfold in cohesive clusters, not in isolated technical silos. For SMEs, this has two implications: first, that successful digital transformation requires balanced investment across complementary domains; and second, that weakness in one foundational area (such as strategic planning or IT infrastructure) can suppress readiness in others, regardless of skill availability or intent.
The firm size–readiness relationship further reinforces these insights. Larger SMEs (500+ employees) and those with higher annual revenues (INR 2500 million and above) consistently reported higher scores across all six dimensions. For instance, the average readiness score for firms with fewer than 20 employees was just 2.81, compared to 3.57 for the largest firms. This widening gap suggests a strong link between organizational maturity and transformation capacity. The smallest firms are often unable to initiate readiness-building processes not due to lack of vision or willingness, but because of constraints in capital, bandwidth, and systemic support.
The clustering results further emphasize this stratification. Cluster A firms (Leaders) have operationalized end-to-end transformation with consistent scores across all dimensions, while Cluster C firms (Laggards) struggle with foundational digitalization and remain stuck below Level 3 on average. The mid-range Cluster B firms often show signs of intent and partial implementation but lack the integration and infrastructure to scale further. This suggests that smart manufacturing adoption is not merely a matter of progressing through linear maturity stages but is shaped by path-dependent choices, resource availability, and network effects. The risk is that without targeted support, firms in Cluster C may become locked in a state of persistent underdevelopment.
Another important insight is the underperformance in advanced analytics and big data. Despite collecting data, most SMEs are only using it for basic reporting. Predictive analytics, real-time optimization, and autonomous process control remain largely aspirational. PCA Component 3 (Data-Driven Operations) and weak scores in D4 (Smart Operations) suggest that even technologically progressive firms struggle to convert raw data into value. This gap can be attributed to both technical and organizational challenges such as lack of analytics infrastructure, absence of contextualized use cases, and the dominance of legacy planning systems. Without interventions that bridge this analytical capacity gap such as simplified platforms, industry-specific dashboards, or shared analytics infrastructure, this weakness could become a systemic bottleneck.
Laggard SMEs need access to foundational enablers such as subsidized sensor kits, cloud storage, and guided digitization programs. Mid-level adopters would benefit more from interoperability frameworks, modular ERP/MES platforms, and hands-on mentoring. Leaders, meanwhile, can be engaged as ecosystem anchors offering peer-learning opportunities, open innovation collaborations, and SME-focused technology diffusion.
Up-skilling initiatives should be directly tied to ongoing digital projects, not run as stand-alone HR exercises. This would improve technology adoption rates and ensure better return on training investments. Likewise, platforms that allow operators, engineers, and data professionals to co-design smart systems would help align technical tools with shop-floor realities.
Finally, strategic readiness needs to be operationalized through access to capital and guidance. Many SMEs show clear intent but lack structured investment pathways. Incentivized loans, digital transformation vouchers, and curated toolkits can help convert strategy into execution. Without these support mechanisms, the SME segment risks fragmenting further into digital haves and have-nots.
In sum, the study highlights that readiness is multi-dimensional, interdependent, and unevenly distributed. SMEs are not just in need of technologies but they also require an orchestrated ecosystem of skills, capital, strategy, and policy alignment to truly evolve toward smart manufacturing. While this study focuses specifically on Indian SMEs in the automotive sector, the adapted indicator framework and clustering methodology possess transferable features that may be applicable to other manufacturing sectors facing similar digitalization barriers. The six-dimensional structure, grounded in the IMPULS model and refined through empirical validation, captures foundational readiness traits that are broadly relevant across SME ecosystems. However, variations in sectoral supply chains, regulatory environments, and digital infrastructure maturity may influence readiness dynamics elsewhere. As such, future studies are encouraged to replicate or adapt the framework in diverse regional and sectoral contexts to test its broader generalizability and identify industry-specific readiness archetypes.
7. Conclusions
The advancement of smart manufacturing is unfolding at an uneven pace, especially among small and medium enterprises that form the backbone of industrial development. This research set out to examine not only the current position of Indian automotive-sector SMEs on the digital readiness scale but also to explore how their existing capacities, challenges, and long-term aspirations influence their participation in the smart manufacturing transition. Insights drawn from a locally attuned framework indicate that digital maturity does not occur by chance or follow a universal pattern. Instead, it reflects a combination of deliberate strategic intent, well-aligned systems, and the level of responsiveness within the broader industrial ecosystem.
Smart manufacturing involves more than the mere installation of advanced technologies; it hinges on how well an organization is structured to absorb and support such change. Many firms do not lag because of a lack of awareness, but rather due to limitations beyond their immediate reach such as constrained investment capability, fragmented system compatibility, or the absence of enabling support from the surrounding network. What sets this model apart is its ability to surface deep-rooted structural disparities that generic assessment tools often fail to detect.
This outlook shifts the notion of readiness away from a checklist of requirements and towards a dynamic process of building institutional capability. The model draws on indicators rooted in real-world managerial choices, making it directly actionable for leaders responsible for digital transformation. It encourages SMEs to move from being passive adopters of technology to becoming proactive agents shaping their digital futures.
Equally vital is the role of collaborative networks and supportive policies. The findings emphasize the importance of accessible digital infrastructure, modular solution ecosystems, and trusted facilitation mechanisms that ease the entry for smaller firms while preserving their long-term strategic autonomy. Rather than viewing digital transition as a firm-level task alone, it should be understood as a shared industrial objective that combines public backing, ecosystem-wide alignment, and local initiative.
Another key insight of this study is the value of tailoring maturity models to the realities of SMEs. Instead of applying international frameworks without context, the modified IMPULS-based model demonstrates how assessment structures can be reconfigured to reflect how small firms in specific contexts think, operate, and invest. This localized approach respects the diversity of digital journeys while providing a practical basis for evaluation and targeted dialogue.
Ultimately, the readiness path for SMEs should be seen less as a competition and more as a sustained process of adaptation, learning, and continuous refinement. What will determine success is not the speed of adopting new technologies, but the ability to integrate them meaningfully with existing people, processes, and strategic intent. This study contributes to that journey by offering a data-informed, context-aware framework that speaks directly to those tasked with leading this transformation on the ground.
