Article

Load-Bearing Capacity Analysis on Rubber-Sand Mixture Cored Composite Block as Low-Cost Isolation Bearing for Rural Houses Based on DEM Simulations

1
College of Civil Engineering, Hunan University, Changsha 410082, China
2
School of Civil and Environment Engineering, Hunan University of Technology, Zhuzhou 412007, China
3
College of Engineering and Technology, Gongqing College of Nanchang University, Jiujiang 332020, China
*
Author to whom correspondence should be addressed.
Sustainability 2025, 17(18), 8092; https://doi.org/10.3390/su17188092
Submission received: 8 July 2025 / Revised: 4 September 2025 / Accepted: 5 September 2025 / Published: 9 September 2025

Abstract

In previous research, the group proposed a low-cost seismic isolation device, the rubber sand core composite block (RSMCB). This study builds upon newly conducted experiments to elucidate the vertical bearing capacity of the RSMCB through discrete element method (DEM) simulations. The effects of rubber content, cover plate forms, dimensions, and sidewall lengths are examined. A formula for vertical bearing capacity was derived from experimental and simulation results. The main findings are as follows: (1) The RSMCB exhibits nonlinear behavior under vertical loads. Sand and rubber particles have rough surfaces, leading to strong interparticle friction. This friction facilitates the formation of robust force chains. When the applied force is within the friction angle range, particles enter a self-locking state, ensuring stability and enabling RSMCB to withstand substantial vertical loads. (2) Higher rubber content increases pores in the RSMCB, resulting in greater vertical displacement of the cover plate. Employing a larger cover plate mitigates the vertical displacement. (3) When utilizing a square straight-cylinder cover plate for the RSMCB, its load-bearing capacity is increased by 187% compared to a square cover plate. (4) At a rubber content of 50%, minimal contact occurs between sand particles. Rubber particles control overall strength. (5) Theoretical formulas can be employed directly to ascertain the bearing capacity of the RSMCB.

1. Introduction

Earthquakes represent a significant geological hazard that continuously threatens human safety. In numerous seismic events, residential structures in rural areas sustain considerable damage due to their low construction costs and inadequate seismic performance [1,2,3]. Within structural engineering, base isolation is recognized as one of the most effective technologies for seismic protection [4,5], capable of substantially mitigating earthquake-induced damage to buildings. However, the high cost associated with base isolation systems often restricts their application to critical infrastructure [6]. Consequently, it is imperative to investigate cost-effective, environmentally sustainable, and practical seismic isolation solutions tailored for rural housing. Conventional base isolation systems, such as laminated rubber bearings [7], are typically associated with high costs, primarily due to the demands for precision manufacturing, rigorous quality control, and specialized installation procedures. The manufacturing process, which involves synthetic rubber and steel shims, contributes significantly to carbon emissions. Although these systems are highly effective and widely used in critical infrastructure, their high cost often limits their application in low-cost rural housing. This study does not aim to replace conventional systems but rather to provide a supplementary, cost-effective, and sustainable alternative tailored for the seismic protection of rural housing with limited financial and technical resources.
In recent decades, human activities have significantly exacerbated the depletion of natural resources and the challenges associated with landfill management. A novel type of artificial soil, known as rubber sand mixture (RSM), composed of recycled rubber particles and natural sand, exhibits superior resilience, strength, ductility, and damping properties compared to conventional natural soils [8,9,10,11,12,13,14]. RSM has emerged as a widely adopted method for soil enhancement [15,16,17] and has found extensive applications in civil engineering. For instance, it is utilized to reduce lateral earth pressure on retaining walls [18,19,20], serve as lightweight backfill material for foundations and lifelines [21,22,23], mitigate settlement in dams [24,25], provide a filtration layer for site drainage systems [26], and function as an effective foundation isolator for seismic protection purposes [27]. A comprehensive summary can be found in the study conducted by Wu et al. [28]. Beyond traditional approaches, Liu et al. [29] developed a random forest model that can predict the performance of low-cost isolation systems with 92% accuracy. Although machine learning (ML) is not utilized in the current study, it represents a promising complementary approach for future research, particularly in enhancing the efficiency and interpretability of DEM analyses.
Research on low-cost seismic isolation technologies has primarily concentrated on developing new materials and structural designs, shock absorbers and isolation devices, infrastructure modification and maintenance, numerical modeling, and experimental investigations [30]. However, there remains a notable paucity of research focused on utilizing RSM as a cost-effective base isolation solution. Consequently, preliminary research efforts filled the voids of hollow blocks with RSM at an optimal ratio to create an energy-absorbing core. A standard sintered brick (either half or one-third size) was employed as a cover plate to encapsulate the core, resulting in the formation of a rubber-sand core composite block (RSMCB) [31], which was subsequently positioned between the foundation and structural beam at the base of the wall (Figure 1).
Current low-cost seismic isolation technologies often fail to meet the practical requirements of rural construction due to several limitations. For example, friction-based systems [32] require surface finishing with tolerances of less than 0.5 mm, a level of precision rarely achievable in rural settings. PVC-based systems [33] exhibit insufficient vertical stiffness, commonly leading to excessive settlement, often exceeding 80 mm, in two-story buildings. Similarly, tire-derived aggregate (TDA) layers [34] are susceptible to lateral particle dispersion under seismic loading due to inadequate confinement. The RSMCB technology effectively addresses these challenges. Its flexible RSM core accommodates construction tolerances up to ±5 mm, making it well-suited for rural environments. Furthermore, the vertical stiffness can be adjusted by varying the rubber content between 30% and 50%, ensuring that settlement remains below 70 mm. The hollow block design also provides effective lateral confinement, significantly enhancing particle stability and seismic performance.
In addition to its technical advantages, the RSMCB offers notable cost and sustainability benefits over conventional isolation systems. Its primary components, recycled tire rubber and sand, are low-cost, widely available, and environmentally friendly. The construction process is straightforward and does not rely on specialized equipment or skilled labor, further supporting its applicability in resource-constrained areas. While a full life-cycle cost assessment is beyond the scope of this study, the performance data presented here provide a critical foundation for future comprehensive economic and environmental evaluations.
If the RSMCB is applied in seismic isolation, it is essential to investigate its vertical bearing capacity first. However, traditional experimental approaches fail to elucidate the underlying micro-mechanics [35,36,37]. Consequently, the discrete element method (DEM) [38,39,40] can be employed to simulate vertical bearing capacity tests of RSMCB, thereby facilitating a more profound understanding of the micro-mechanical behavior and internal mechanisms of RSM. The stress–strain characteristics obtained from DEM simulations were calibrated against experimental results from laboratory triaxial tests, effectively revealing the micro-mechanical response of the RSM under varying strain conditions [12].
In this study, the vertical bearing capacity of the RSMCB was initially evaluated. Subsequently, the effects of varying rubber contents, cover plate forms, dimensions, and sidewall lengths on the vertical bearing capacity of RSMCB were analyzed from a microscopic perspective using DEM. The findings from the microscopic analysis, including interparticle contact forces, displacement, and rotation of particles, were examined and discussed. Furthermore, a formula for calculating the vertical bearing capacity of RSMCB was derived through theoretical analysis. This research will facilitate the rational design and application of RSMCB, provide a theoretical foundation for assessing the feasibility of utilizing RSM as a lightweight filler material, and advance the application and development of DEM in the study of shock-absorbing materials.

2. DEM Procedure and Test

2.1. Model and Materials

A 300 mm × 300 mm × 300 mm model size was selected because it corresponds to the cross-sectional dimensions of a single load-bearing unit commonly found in rural masonry houses, which is consistent with on-site surveys conducted in China [41]. The ratio of the model size to the maximum particle size is sufficiently large (>10) to minimize boundary effects and effectively capture the macroscopic mechanical behavior. The boundary wall served as a constraint, and an appropriate height was incorporated to prevent the particles from spilling over. The simulations employed an explicit time integration scheme, with the timestep automatically determined as a fraction of the Rayleigh critical timestep to ensure numerical stability. All wall boundaries were modeled as rigid and frictionless surfaces. The density of the sand particles was set at 2.56 g/cm3, while that of the rubber particles was established at 1.17 g/cm3, and initial porosity was defined as 0.2, following recommendations by Valdes et al. [8], Lee et al. [12], and Perez et al. [42]. The total number of model particles is regulated through the porosity ratio e , as expressed in the following equation, to account for the modifying effects of grading.
The linear contact stiffness model describes the contact behavior between particles, employing the elastic constants Young’s modulus E and Poisson’s ratio v . This model is chosen because it reasonably approximates the mechanical behavior of the rubber-sand mixture under the studied conditions. The parameters E and v are related to the effective modulus E * and normal shear stiffness ratio k * = K n / K s at the contact. The linear contact stiffness model is suitable for simulating the elastic behavior of the particles, which is a key aspect of the RSMCB’s mechanical response. The model captures the essential contact mechanics, enabling a detailed analysis of particle interactions and their contribution to the overall behavior of the RSMCB. The normal secant stiffness K n and the tangential tangent stiffness K s are given in Table 1.
The linear model of the granular microstructure is derived from the work of Wang et al. [43] and is illustrated in Figure 2. The interaction between two granular solids can be represented by a cell in a physically simplified manner. The model comprises a solid element, a spring, a damper, and a friction slider. The spring establishes a linear elastic relationship between relative displacement and contact force, while the damper provides viscous damping in both shear and normal directions. The linear contact model was selected owing to its computational efficiency and the demonstrated ability to capture the fundamental macroscopic quasi-static response of RSM under monotonic loading in previous research [43]. However, when dealing with dynamic seismic loading, the viscoelastic behavior of rubber cannot be fully captured. In future research, more sophisticated contact models (such as Burger’s model) will be explored for seismic simulation.
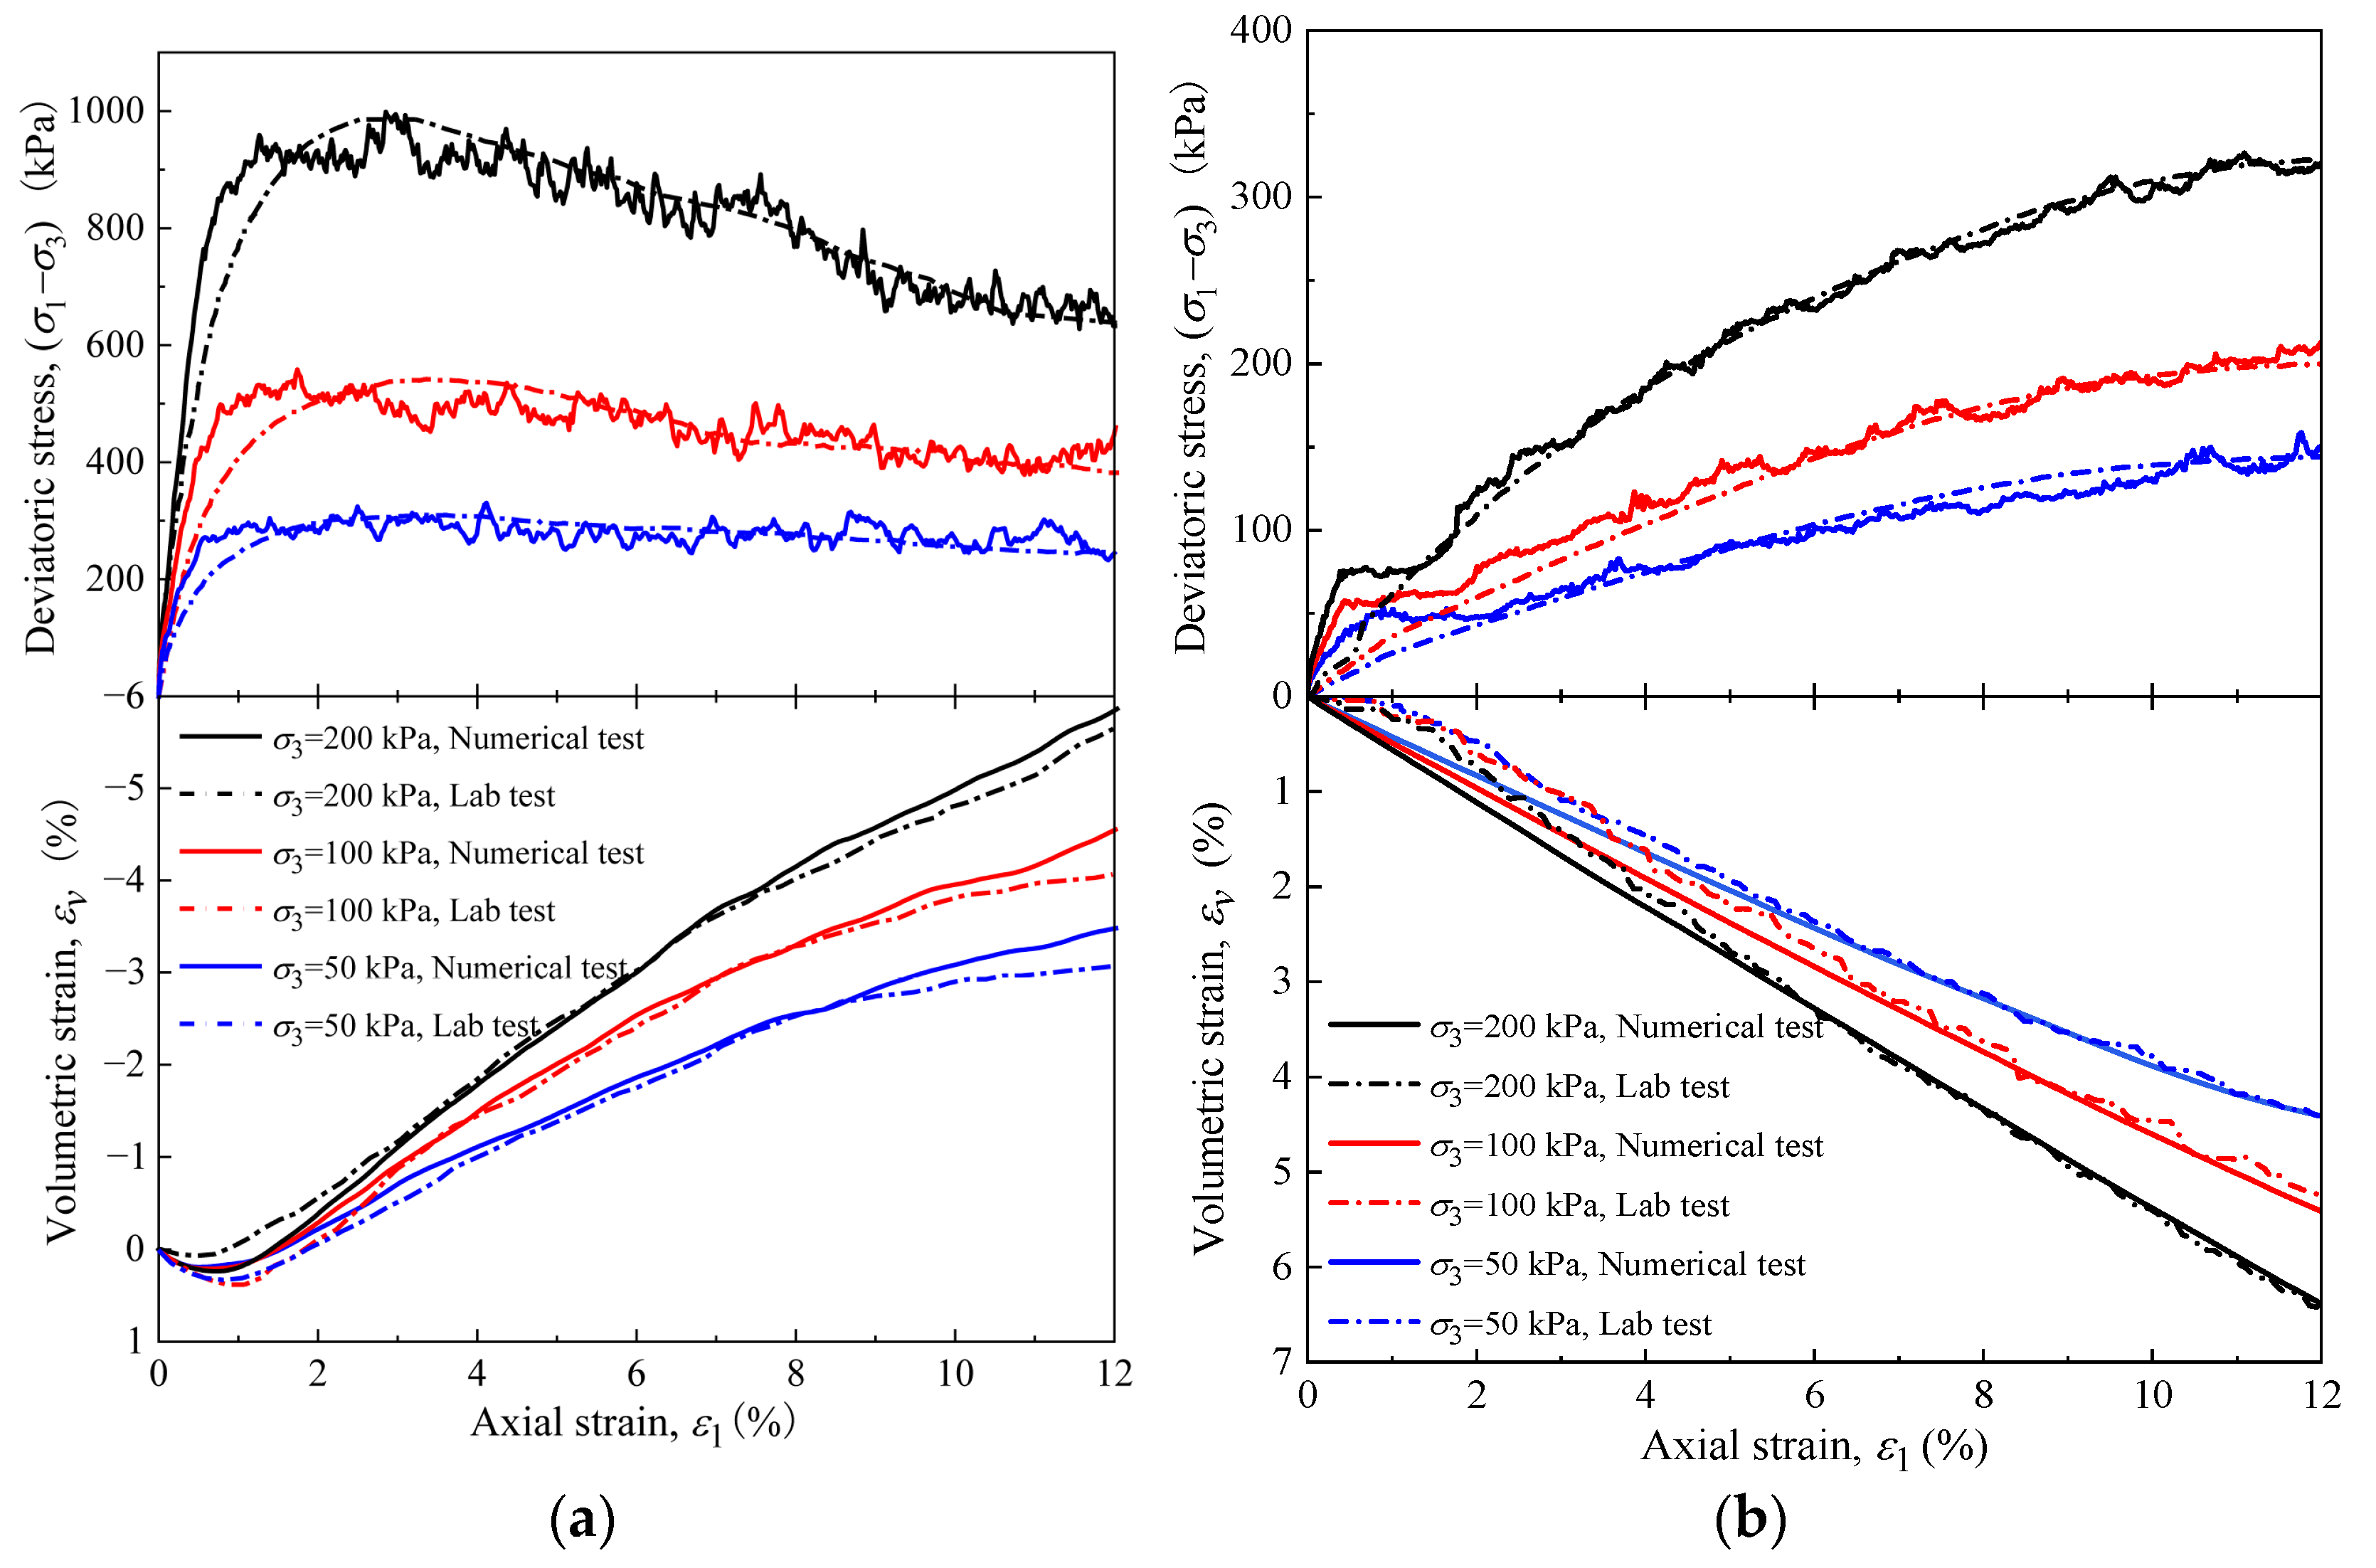
The physical parameters of sand and rubber particles selected based on the study of Wu et al. [28] are as follows. Sand particles: shear modulus G s = 33 GPa, Poisson’s ratio v s = 0.32 , and friction coefficient f s = 0.39 . Rubber particles: shear modulus G r = 0.0078 GPa, Poisson’s ratio v r = 0.5 , friction coefficient f r = 1 . Figure 3 compares the solution (volume strain is defined by the sign of compression, with compression being positive and expansion being negative) under different confining pressures. Where, σ1 is axial pressure, σ3 is confining pressure and ε1 is axial strain.
The fact that the calculated characteristic values of the deviatoric stress and volumetric strain obtained by DEM simulation match the characteristic values obtained from laboratory triaxial tests proves that the adopted mesoscopic particle parameters are reasonable [28]. These parameters are crucial for the linear contact model between the RSM particles. Pure sand exhibits strain-softening characteristics with evident dilatancy after initial contraction, while pure rubber exhibits strain-hardening characteristics with persistent shrinkage. It indicates significant differences in the mechanical properties of the two components blended into the RSM.
However, the calibration process in the present study has some limitations, including the neglect of realistic particle-scale properties, which may lead to an overestimation of contact points. Reddy et al. [44] proposed that DEM samples can be calibrated at two stages: one based on microscopic (grain-scale parameters) and the second based on elemental-size experiments. This approach could be a potential future direction, as it considers macroscopic experimental data from laboratory tests and microscopic parameters from grain-scale experiments, rationalizing the discrete-based numerical input parameters as much as possible.

2.2. Test and Validation of DEM

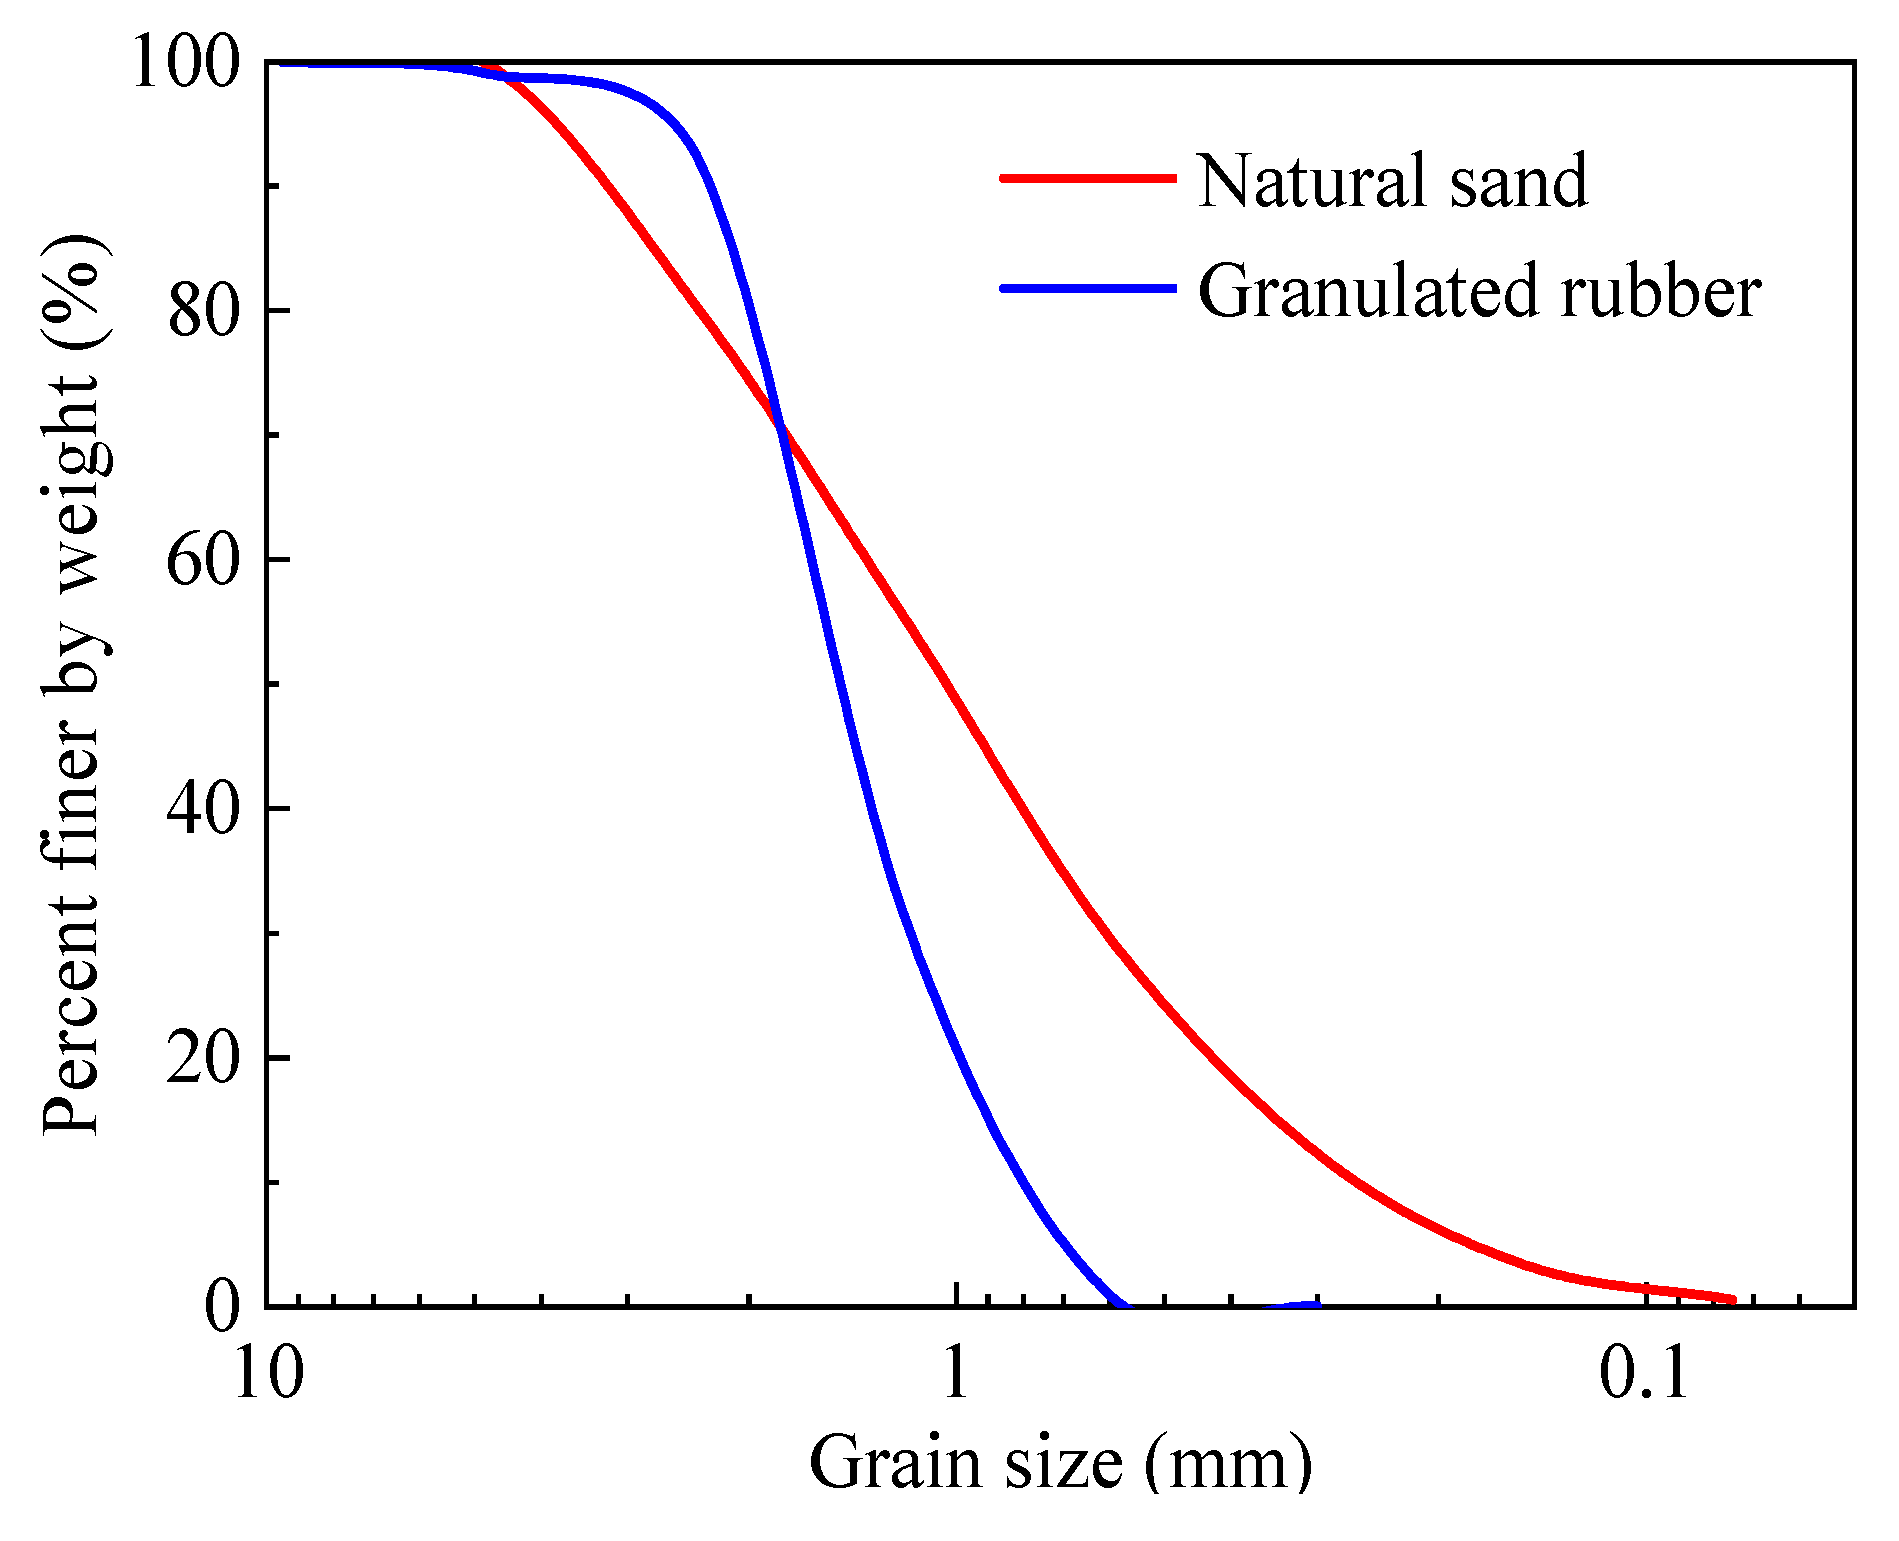
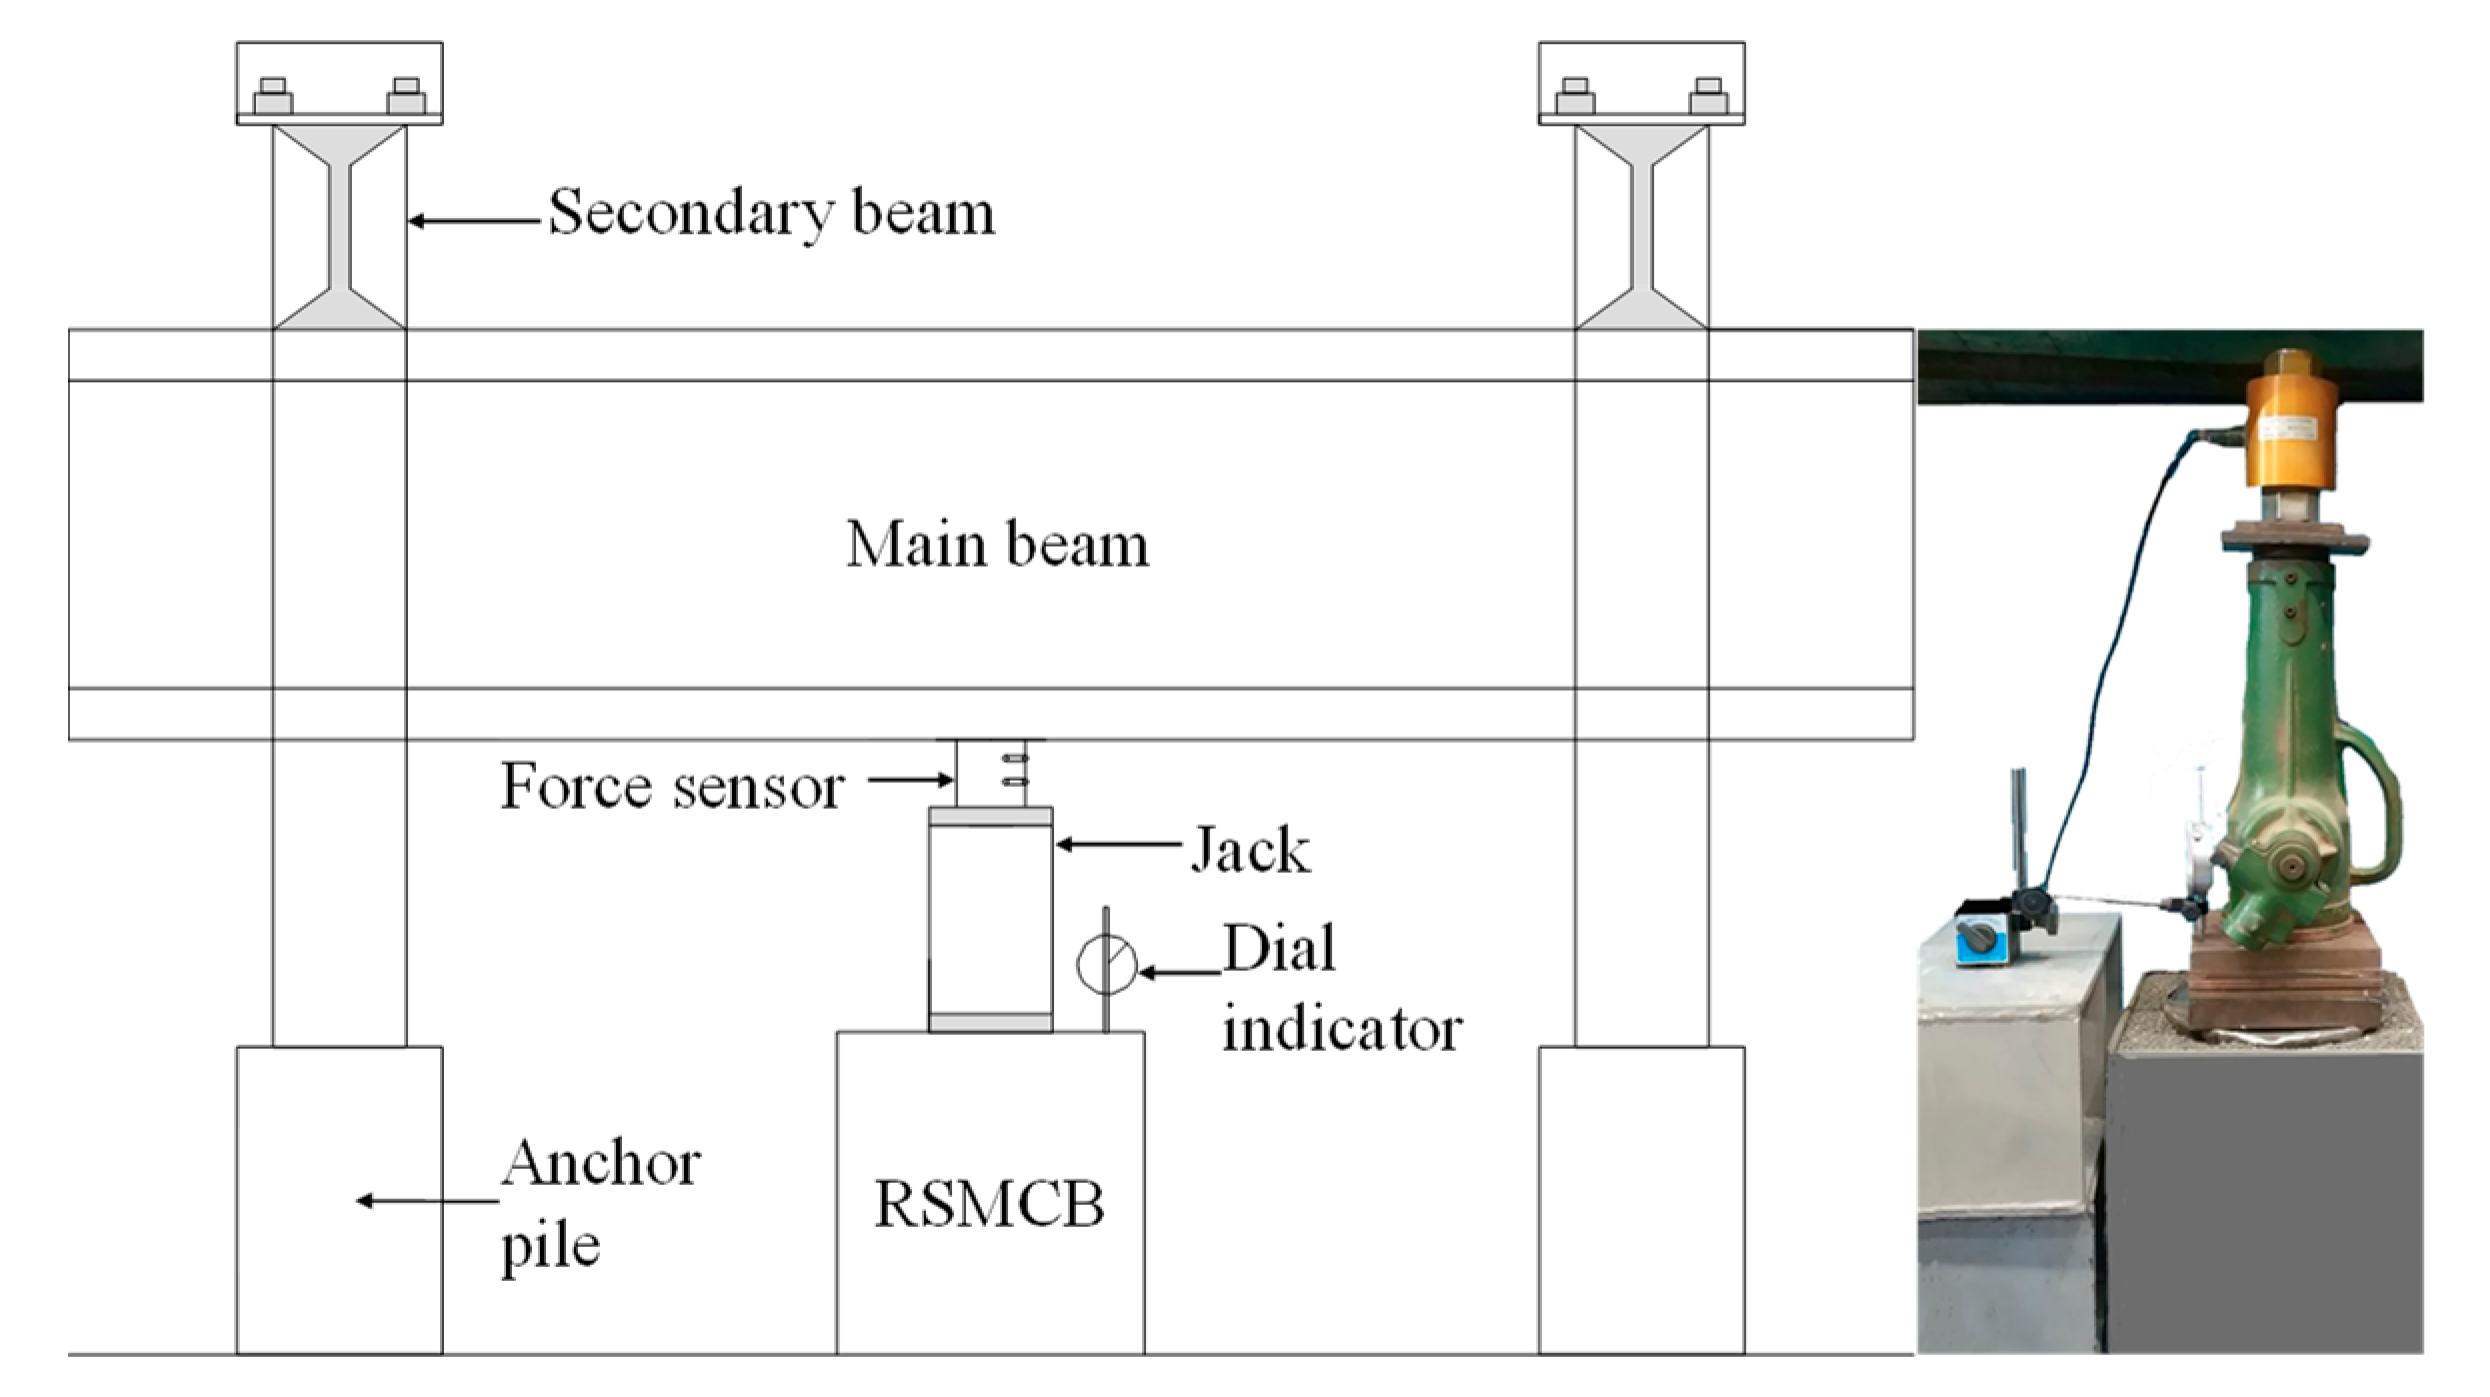
The grading curve and characteristics of the rubber and sand particles, presented in Figure 4 and Table 2, are essential for understanding the physical properties of rubber and sand. It is crucial to emphasize that the mechanical properties of recycled tire rubber can exhibit batch-to-batch variations, which are affected by the source material and processing techniques. In this research, representative average values are employed. Investigating the impact of this variability on the macroscopic response of RSMCB materials represents a significant area for future research endeavors. This study was conducted with support from Hunan University of Technology (Figure 5), utilizing a mechanical jack to apply vertical loads to the RSMCB, thereby obtaining the vertical load-bearing capacity curve of the RSMCB.
Figure 6 illustrates the DEM simulation and experimental curves of the RSMCB with varying rubber contents for a square cover plate measuring 160 mm on each side. The vertical displacement denotes the total settlement of the cover plate relative to its initial position under the applied vertical load. An increase in rubber content results in heightened internal porosity, decreasing the vertical stiffness of the RSMCB, thereby causing greater vertical displacement. The DEM model was validated through a direct comparison of the simulated load–-displacement curves with those obtained from laboratory experiments. The close agreement in initial stiffness, yield transition, and overall trend confirms the appropriateness of the selected micromechanical parameters and demonstrates the model’s ability to reproduce the macroscopic vertical bearing behavior of the RSMCB accurately.

2.3. Further Parameter Analysis

The following working conditions were established to further investigate the microscopic behavior of the RSMCB through DEM and to assess the impact of multiple parameters on its vertical bearing capacity. (1) Three different rubber contents were selected: 30%, 40%, and 50%. (2) Three cover plate forms were considered: square, cylindrical, and square straight-cylinder. (3) The selection of cover plate dimensions aimed to strike a balance between preventing puncture failure and minimizing rigid contact. Thus, cover plate dimensions were set at diameters or side lengths of 160 mm, 200 mm, and 240 mm. (4) Thirteen sidewall lengths for the cover plates were designed. For specific operating conditions, refer to Table 3. In addition, Figure 7 illustrates three cover plate configurations designed for the RSMCB: (a) a square cover plate with 30% rubber content, featuring unconstrained corners and a length of 160 mm; (b) a cylindrical cover plate with 40% rubber content, having both a diameter and a sidewall length of 160 mm, which provides uniform circumferential constraint and reduces lateral particle dispersion; and (c) a square straight-cylinder cover plate with 50% rubber content, combining a square base (160 mm length) with a sidewall constraint of equal length.

3. Particulate-Scale Results

3.1. Inter-Particle Forces

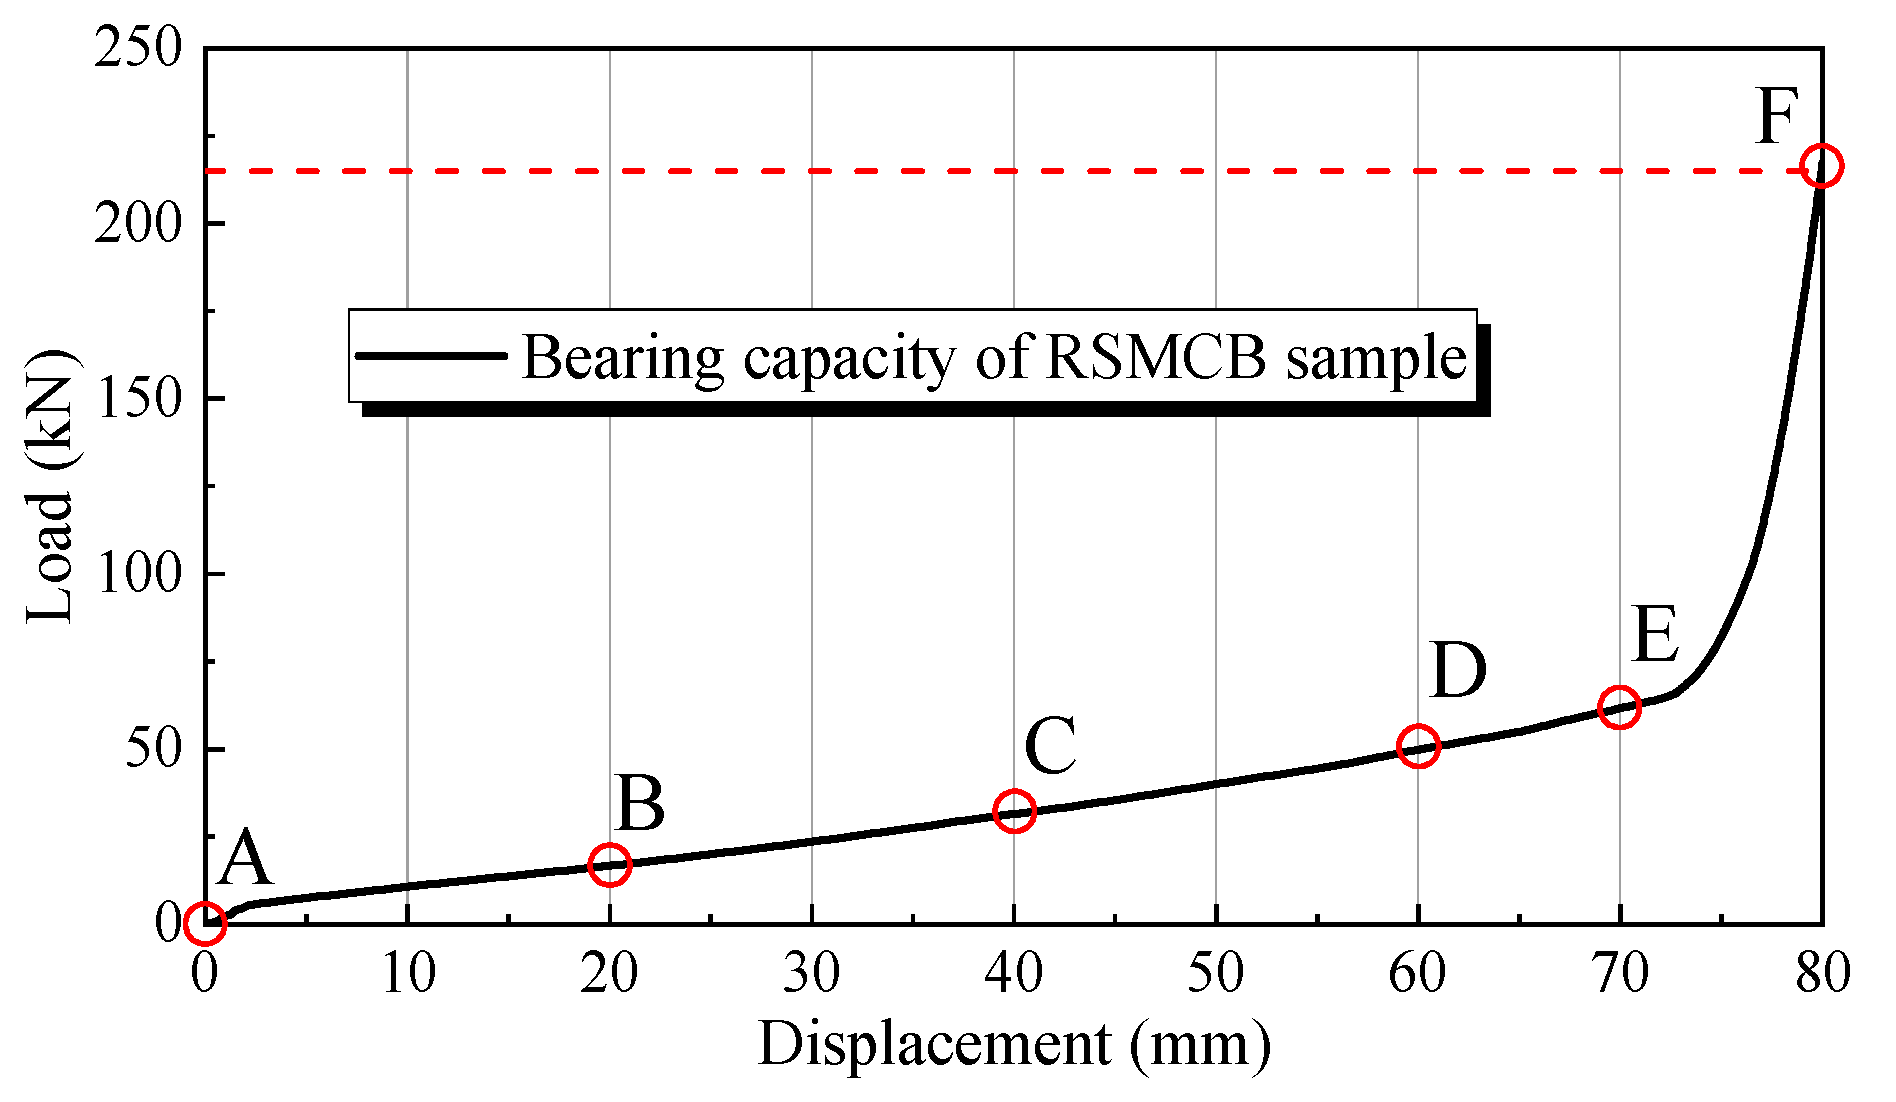
Figure 8 illustrates the vertical load-bearing capacity of the RSMCB, featuring a 160 mm diameter cylindrical cover plate with a rubber content of 30%. An analysis was conducted on the internal particle forces within the RSMCB to evaluate the progression of force development. Six points, labeled A to F, were selected along the vertical load curve, corresponding to displacement values of 0, 20, 40, 60, 70, and 80 mm. The vertical displacement of the RSMCB exhibits an approximately proportional relationship with load before the displacement reaches 70 mm. The observation indicates that rubber particles are highly compressible initially and can deform in response to increasing loads. Once displacement exceeds 70 mm, further reduction in gaps between particles occurs. The compaction effect results in an increase in the overall equivalent stiffness of the RSMCB device. Consequently, the phenomenon is represented by a significant upward slope on the simulation curve following displacements beyond 70 mm.
The mechanical properties of soil are influenced by a complex network of interparticle contact forces, with variations in the forces arising from the geometric and spatial inhomogeneities of soil particles. Normal contact forces are depicted by solid lines, where the thickness of each line is proportional to the magnitude of the force, thereby providing an intuitive representation of force distribution among particles [45]. These force chains penetrate the soil heterogeneously, significantly influencing its macroscopic mechanical behavior.
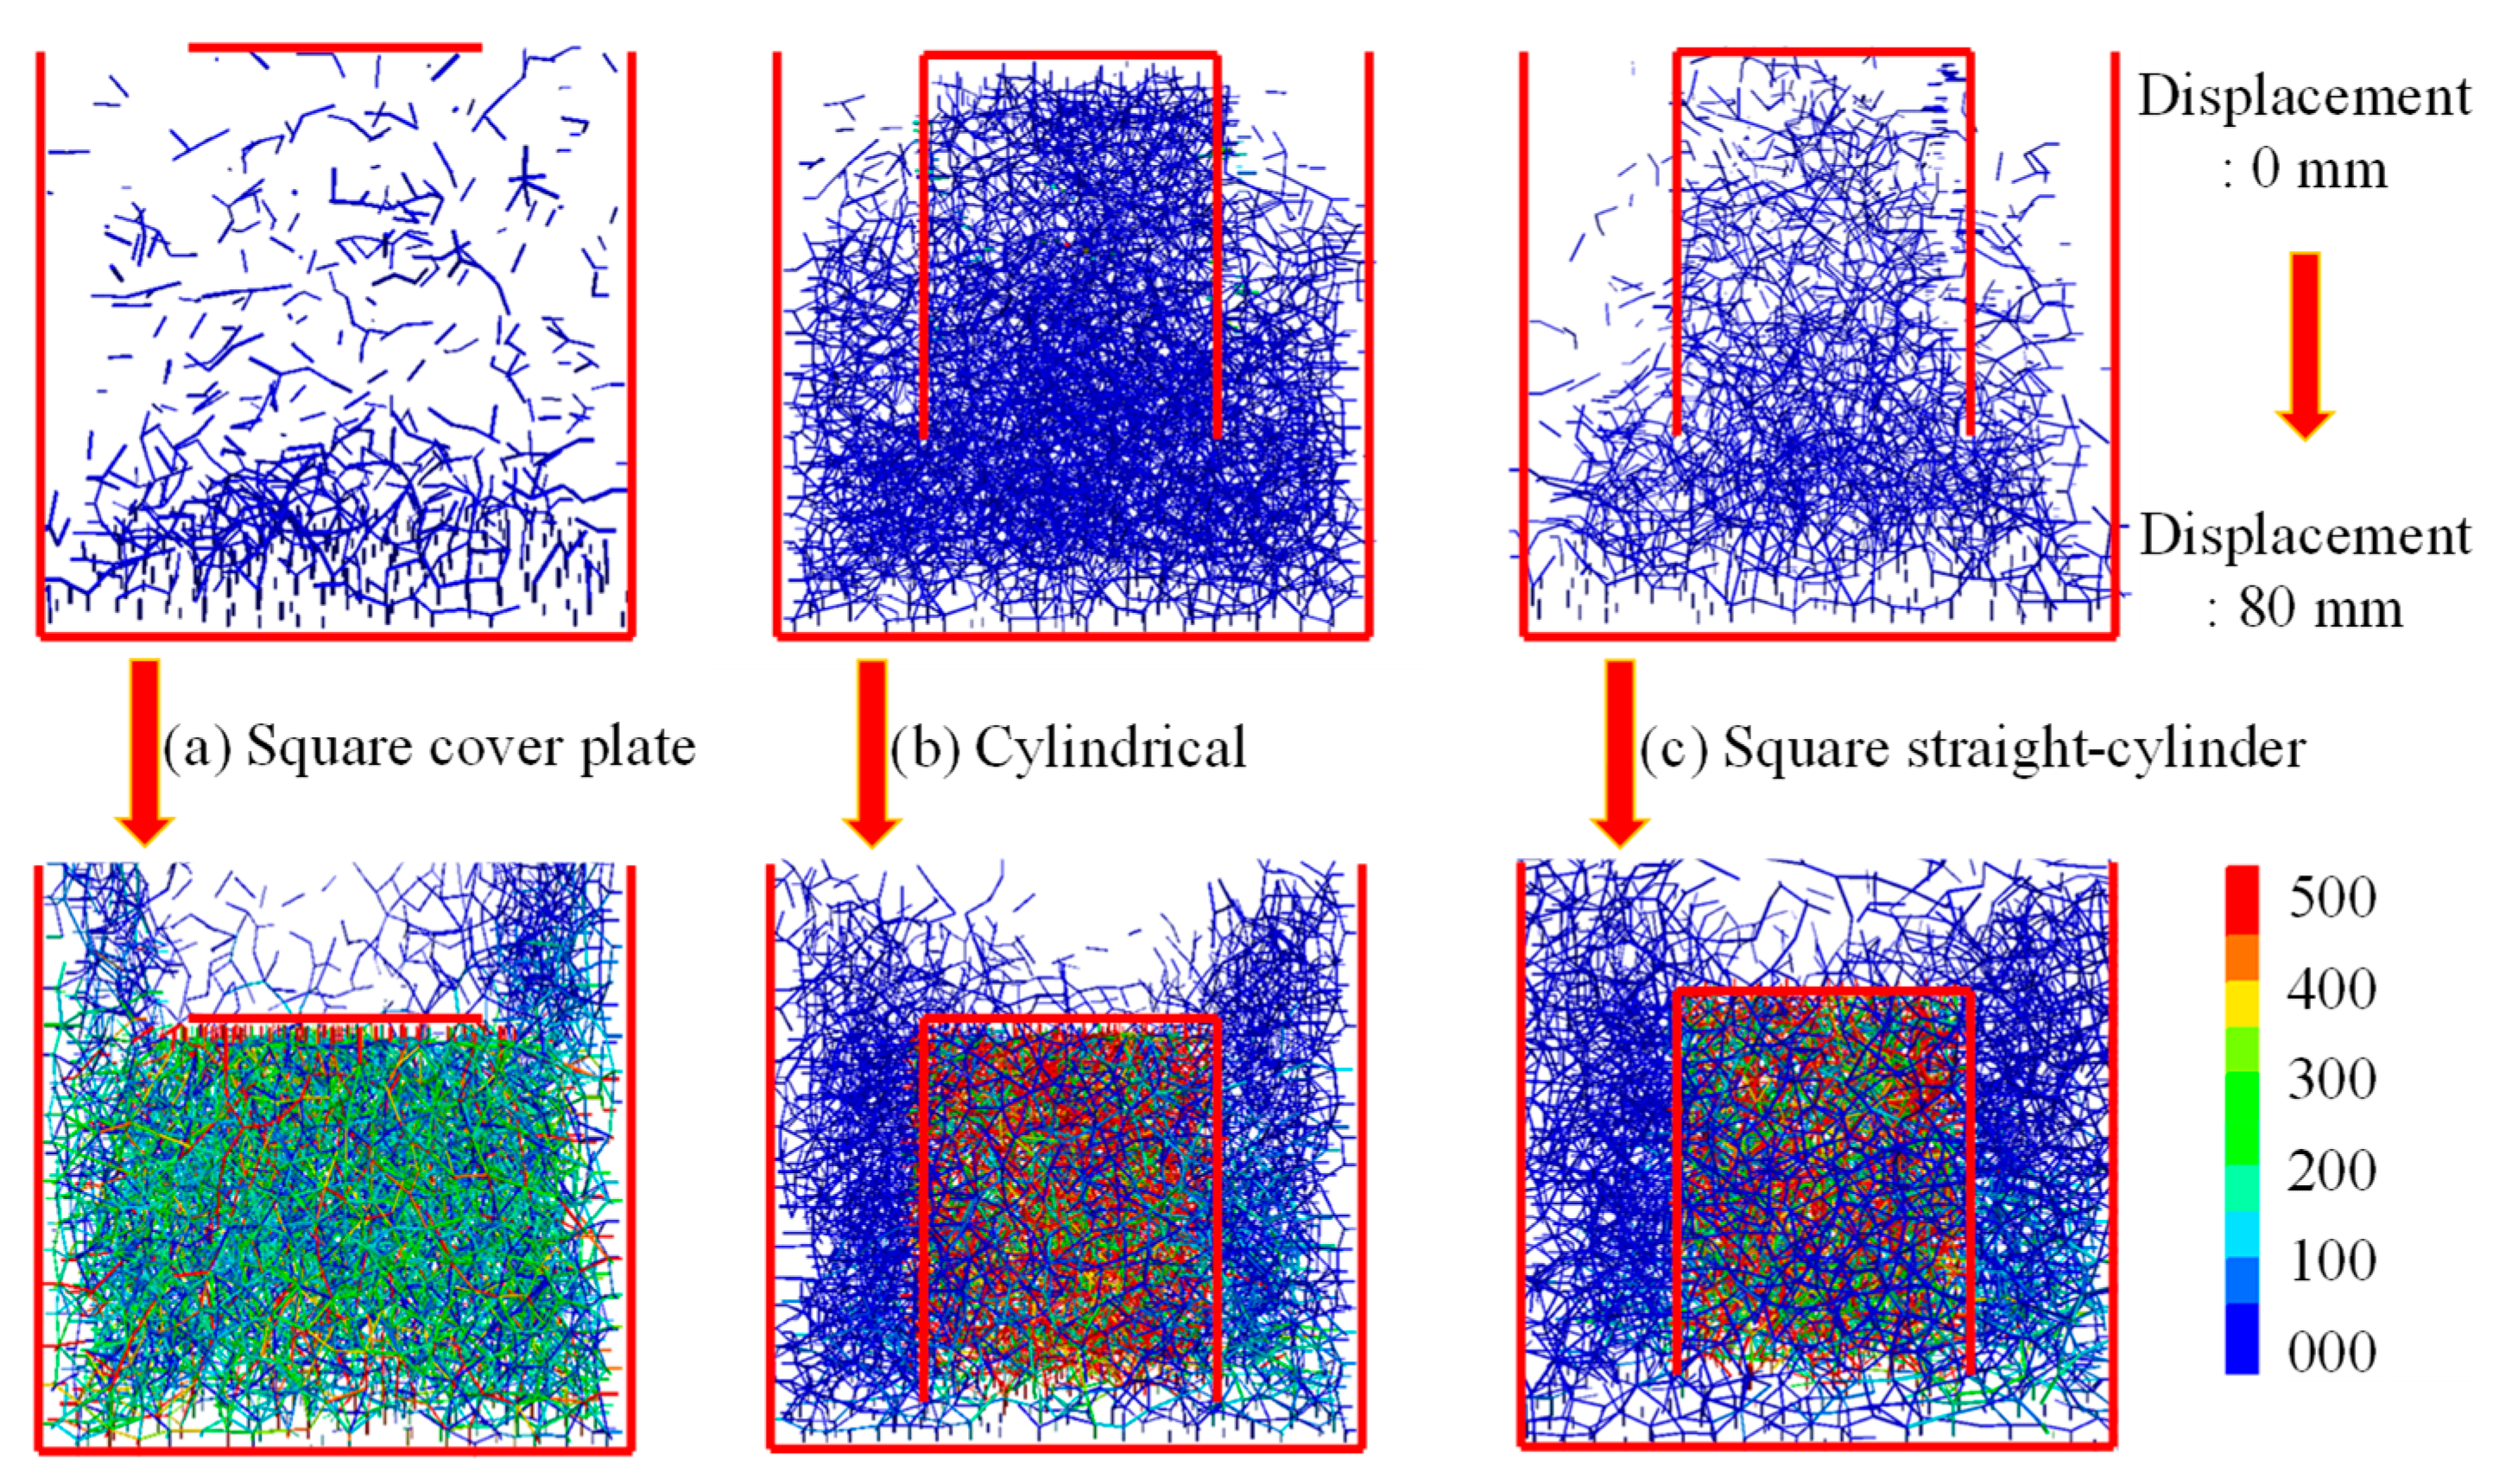
Figure 9 illustrates the normal contact force chain diagram of the RSMCB as it is compressed from the initial position (0 mm) to 80 mm under standard operating conditions. These conditions are categorized into three cases: (a) square cover plate, (b) cylindrical cover plate, and (c) square straight-cylinder cover plate. In the initial state at a displacement of 0 mm, contact forces are primarily concentrated beneath the cover due to its weight. As vertical pressure is applied to the cover, the contact forces undergo redistribution, indicating that the RSMCB possesses an inherent capacity for concentrating contact forces. The internal arrangement of particles within the RSMCB is dense and constrained by both the lid and surrounding blocks. Consequently, particle movement is limited, rendering them highly sensitive to external loads. Under vertical pressure, relative deformation occurs among these particles.
The surface roughness of the sand and rubber particles contributes to high friction, facilitating the formation of robust force chains (the contact force network that bears the main load). When an external force is applied within the limits of the friction angle, the particles within these force chains achieve a state of self-locking (particle rotation is restricted due to geometric interlocking and frictional constraints, which impede relative motion between grains), exhibiting significant stability and capacity to withstand substantial vertical forces. However, when the vertical force exceeds a certain threshold, the force chains may fail, disrupting the internal equilibrium among particles. External forces induce a redistribution of contact forces until a new stable form is established.
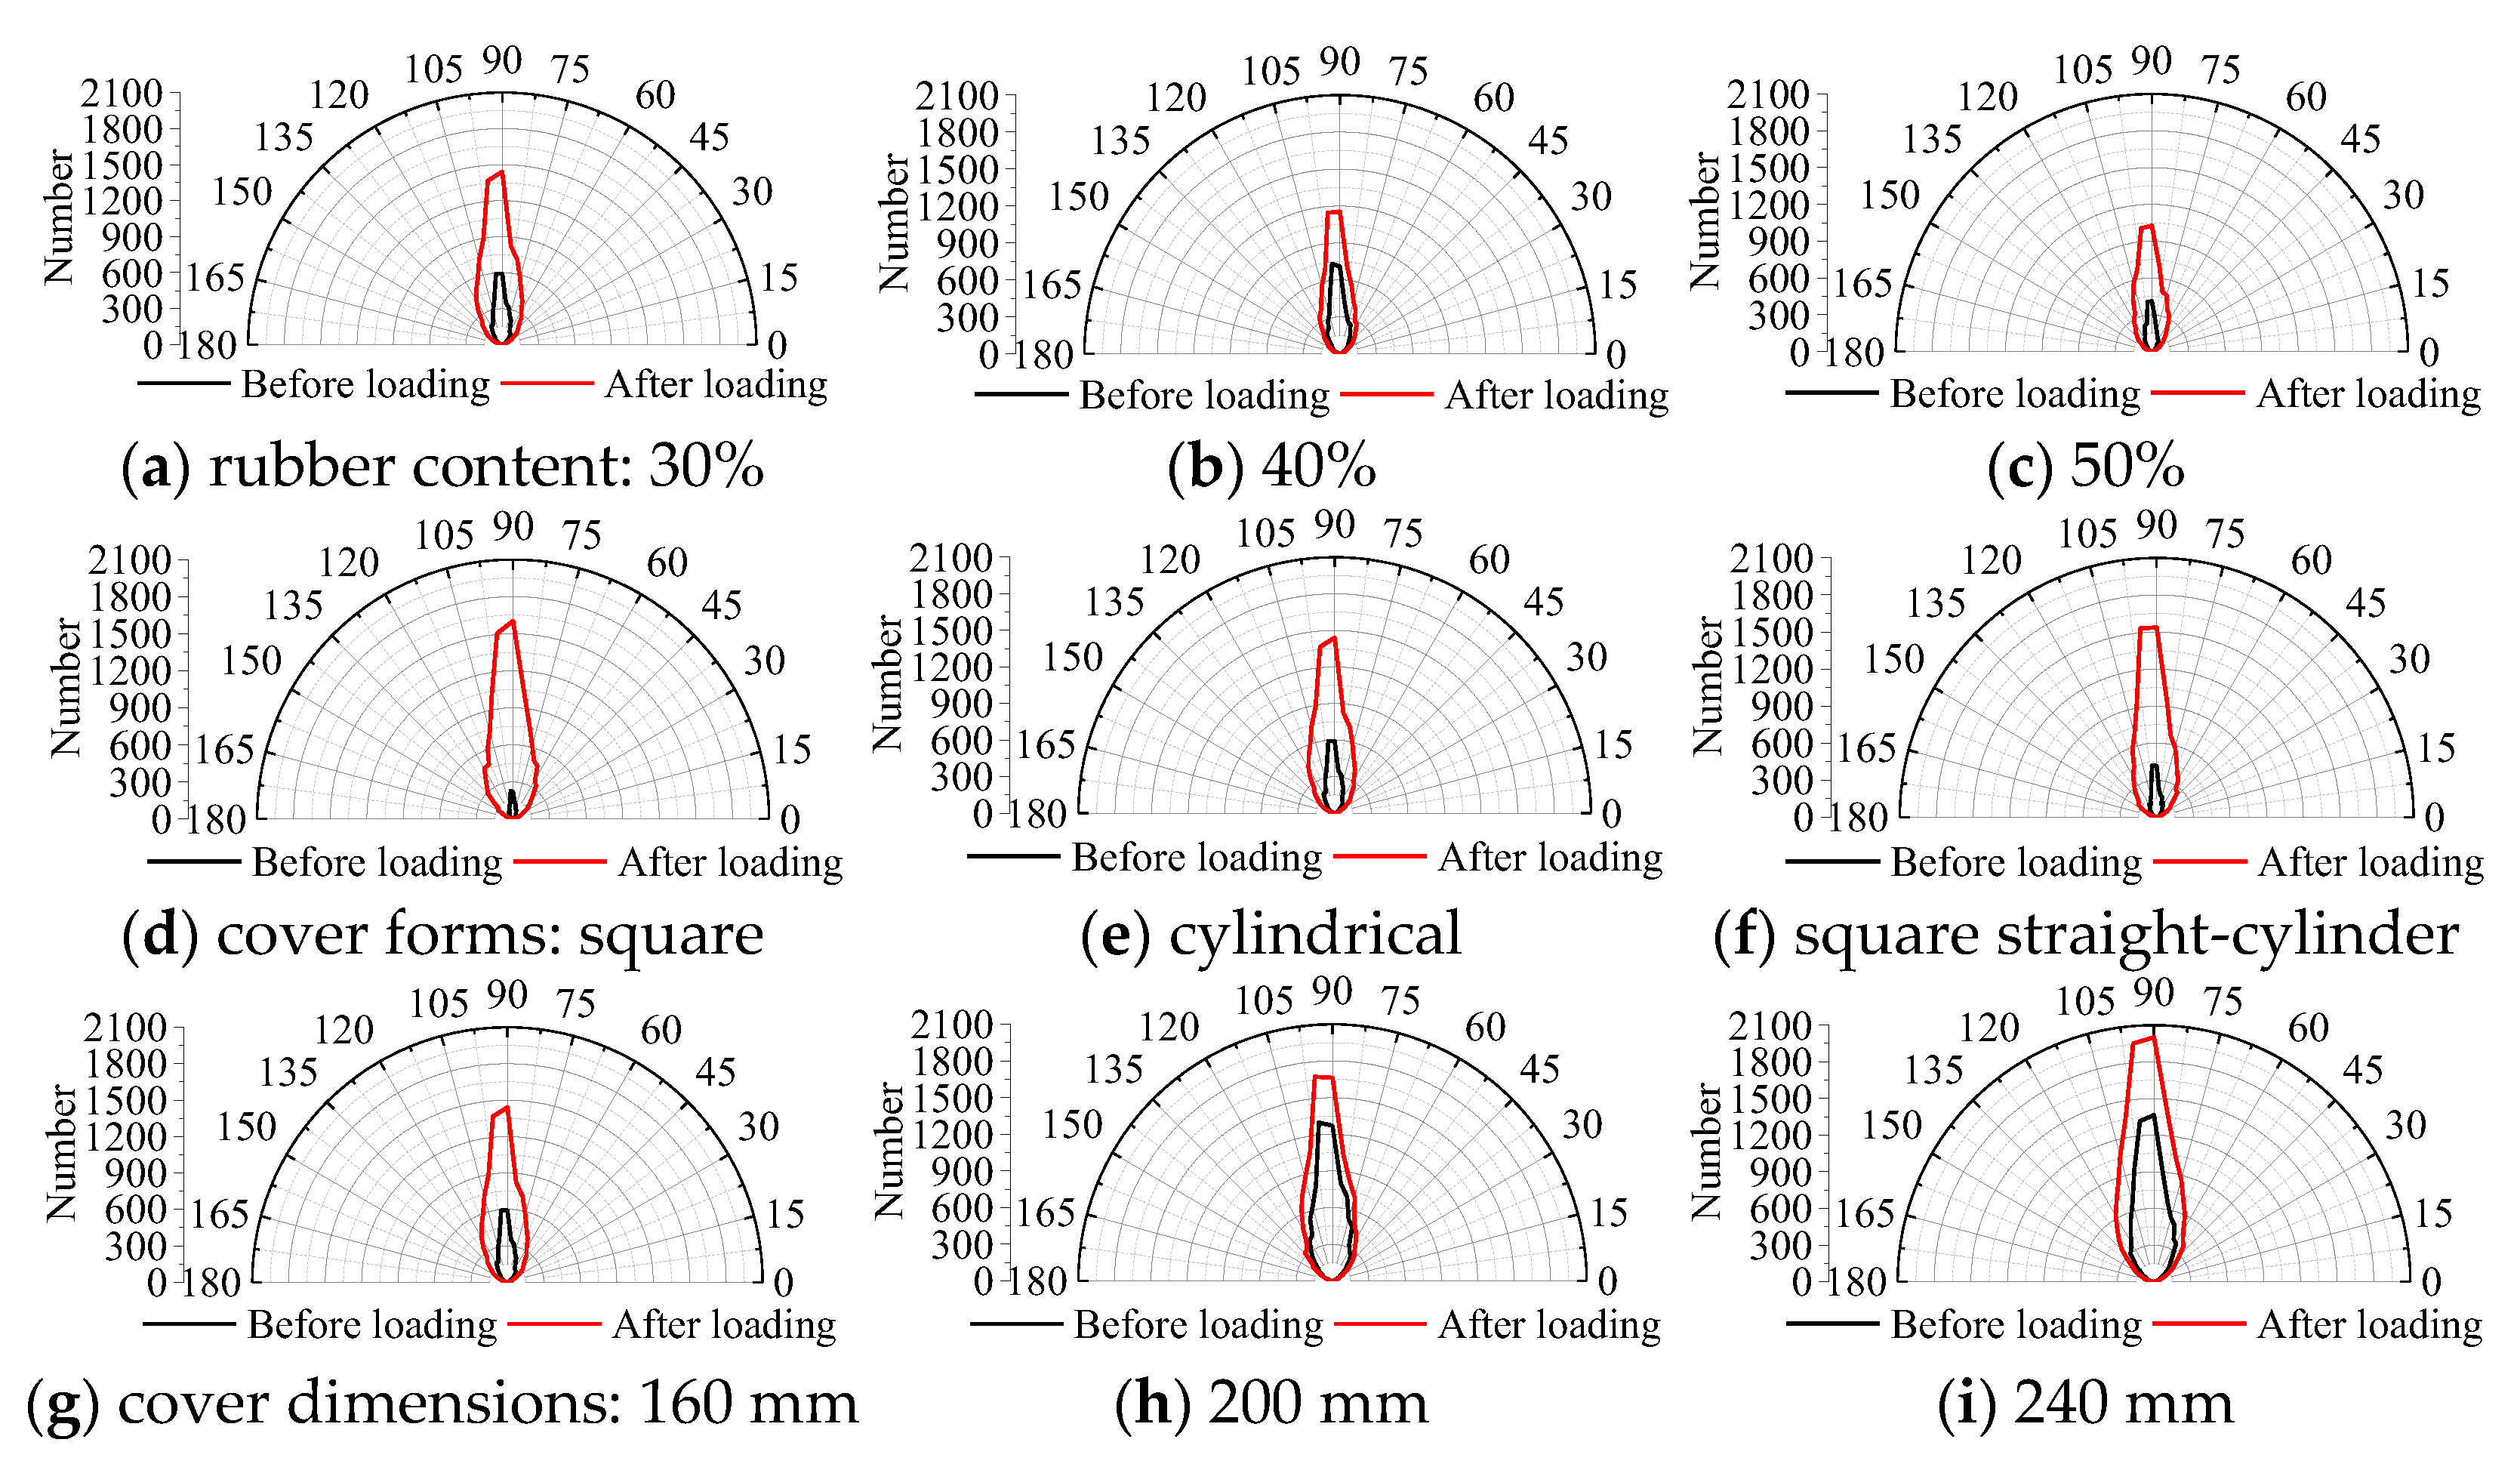
The number of contacts, structural anisotropy, and normal contact force anisotropy significantly influence the stiffness of the RSMCB. The texture orientation is employed to assess the anisotropic behavior of soil particles under loading conditions. The rose diagram in Figure 10, depicting the number of contacts, illustrates the contact anisotropy for RSMCB samples under load. The rose diagrams symmetrically represent the distribution of contact points within an angular range from 0 to 180 degrees, where the radial length corresponds directly to the number of contact points, thereby reflecting the distribution of normal contact forces.
The bearing capacity test was conducted vertically downward, which explains why the 90-degree direction consistently dominates the results. The differences in the rose diagrams before loading can be attributed to the varying cover plate shapes, dimensions, and rubber contents, which influence the initial contact distribution. As the load increases, the cover descends, gradually activating particle contacts aligned parallel to the vertical axis. It is evidenced by a significantly higher number of particle contacts after loading than before loading, which, in turn, enhances the stiffness of the RSMCB. Due to its design characteristics, the square cover plate lacks sufficient restraint on the particles, resulting in an increased number of contacts. Consequently, the difference in the number of contacts before and after loading is more pronounced.
The increase in rubber content has a significant influence on the mechanical behavior of the RSMCB. Among the three rubber content variations examined, the RSMCB with 50% rubber content demonstrates the most effective capacity for absorbing seismic energy. That is due to the significant volumetric compression of the RSM, which results in greater vertical displacement and enhanced energy dissipation. At all levels of rubber content, contacts between rubber particles exhibit strong contact forces. When the rubber content reaches 50%, there is a notable decrease in sand–sand contacts, while contacts among rubber particles increase substantially. The isotropic nature of particles facilitates force transmission in all directions, resulting in the overall strength and stiffness of the RSMCB being predominantly governed by the rubber particles. The compaction effect resulting from increased rubber content leads to an increase in the overall equivalent stiffness of the RSMCB device.
However, this increase in stiffness does not negatively impact its capacity to absorb seismic energy, as the enhanced stiffness contributes to the stability and load-bearing capacity of the RSMCB. During relative movement, the friction between particles, the rearrangement of the force chain network under load, and the energy dissipation caused by the deformation of the rubber particles themselves constitute the primary sources of energy dissipation. As a result, the observed development of robust force chains directly improves the composite block’s capacity to absorb and dissipate seismic energy.

3.2. Particle Displacement Vector

Figure 11 illustrates the particle displacement vectors under typical operating conditions. All samples exhibit a vertical compression displacement of 80 mm, resulting from the downward movement of the cover plate. Each vector represents the displacement of an individual particle, with its starting point corresponding to the initial position and its endpoint indicating the final position. The length of each vector reflects the distance traveled by the particle. The particles undergo expansion upon exiting the compression zone [46,47], resulting in a downward pushing force exerted by the particles on the bottom plate across all operational conditions.
It was observed that variations in rubber content led to significant differences in vector thrust. Zhou et al. [47] reported a similar disparity in thrust behavior. The particles tend to create more extensive strain localization areas, enhancing expansion. The particles of the cylindrical and square straight-cylinder cover plate of the RSMCB consistently moved downward, spread outward upon contacting the bottom surface, and collectively ascended through the unpressurized region outside the cover plate.
In contrast, the square cover plate RSMCB particles exhibited a more chaotic movement pattern with pronounced extrusion effects. The larger diameter of the plate allows for more particle accommodation and enables it to withstand higher vertical forces for equivalent vertical displacements. The phenomenon can be attributed to the increased number of vectors present at the base of the RSMCB.

4. Bearing Capacity Analysis of RSMCB

4.1. Effect of Rubber Content and Cover Plate Form

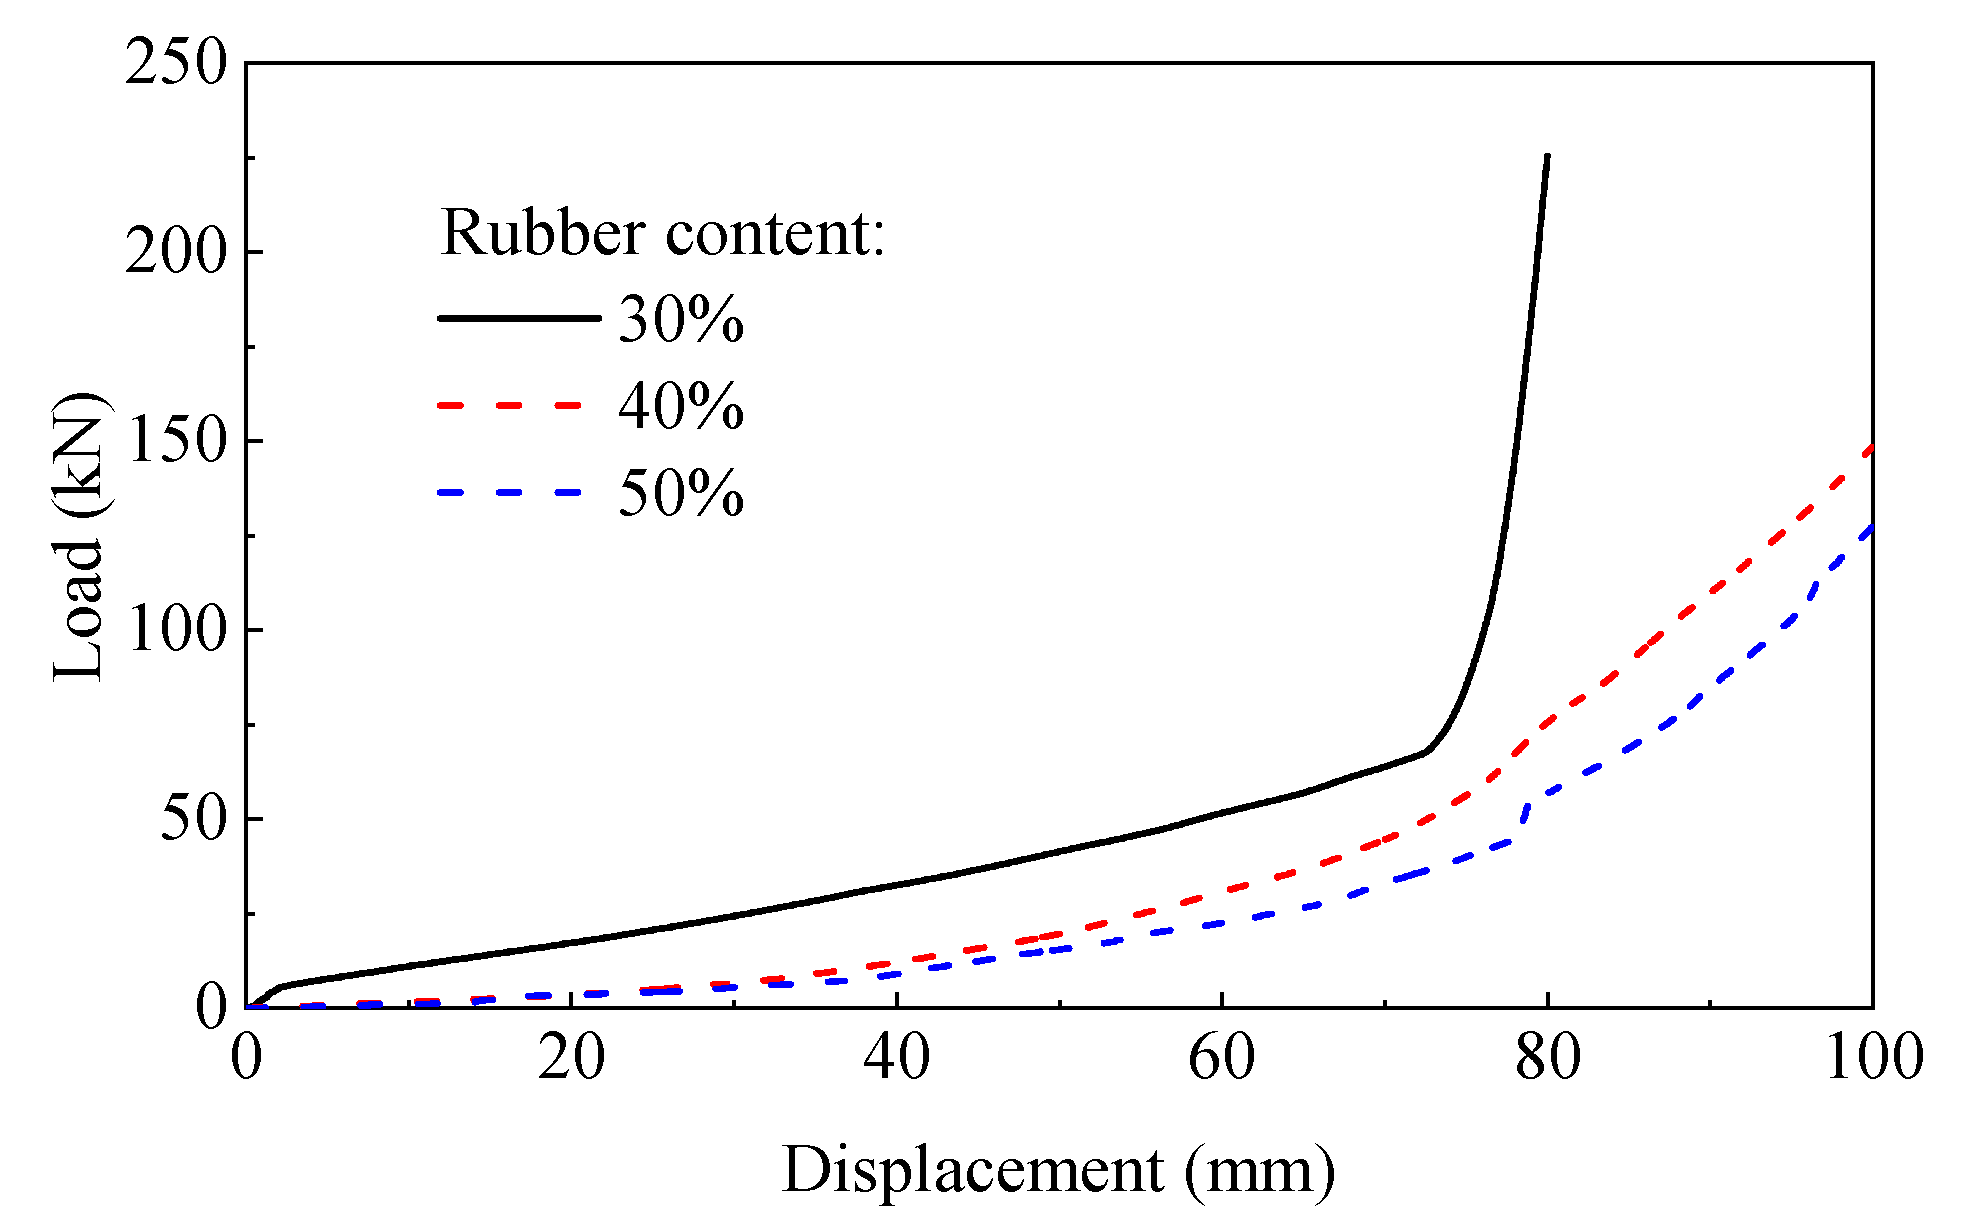
Figure 12 illustrates the vertical bearing capacity curve of the RSMCB with varying rubber contents for a cylindrical cover plate with a diameter and sidewall length of 160 mm. The rubber content range of 30–50% was selected based on previous related experiments conducted by the research group [31] and common practice in previous RSM applications [28], aiming to balance stiffness and energy absorption. While extremes (<30% or >50%) were not explored in this study, they represent a valuable direction for future optimization studies targeting specific performance objectives (e.g., maximum stiffness or maximum damping).
As the rubber content in the RSMCB increases, so does the initial porosity among the rubber particles within the RSM, resulting in increased vertical displacement of the cover plate. The specimen achieves a consistent vertical bearing capacity of 100 kN. Compared to the specimen with a rubber content of 30%, displacement for the specimen containing 40% rubber content increases by 16.9%, while that for the specimen with 50% rubber content rises by 25.6%. At a rubber content of 50%, the rubber granules are soft materials characterized by high deformation capacity. They can undergo substantial deformation when subjected to stress, further filling voids between both rubber and sand granules, resulting in significant volumetric compression of the RSM. Consequently, it leads to greater vertical displacement exhibited by the RSMCB. A higher rubber content (50%) enhances energy absorption and damping capacity by enabling larger deformations, whereas a lower rubber content (30%) yields greater stiffness and smaller displacements. Consequently, an intermediate rubber content (e.g., 40%) may provide a practical balance suitable for a wide range of applications. However, the optimal rubber content ultimately depends on the specific design requirements.
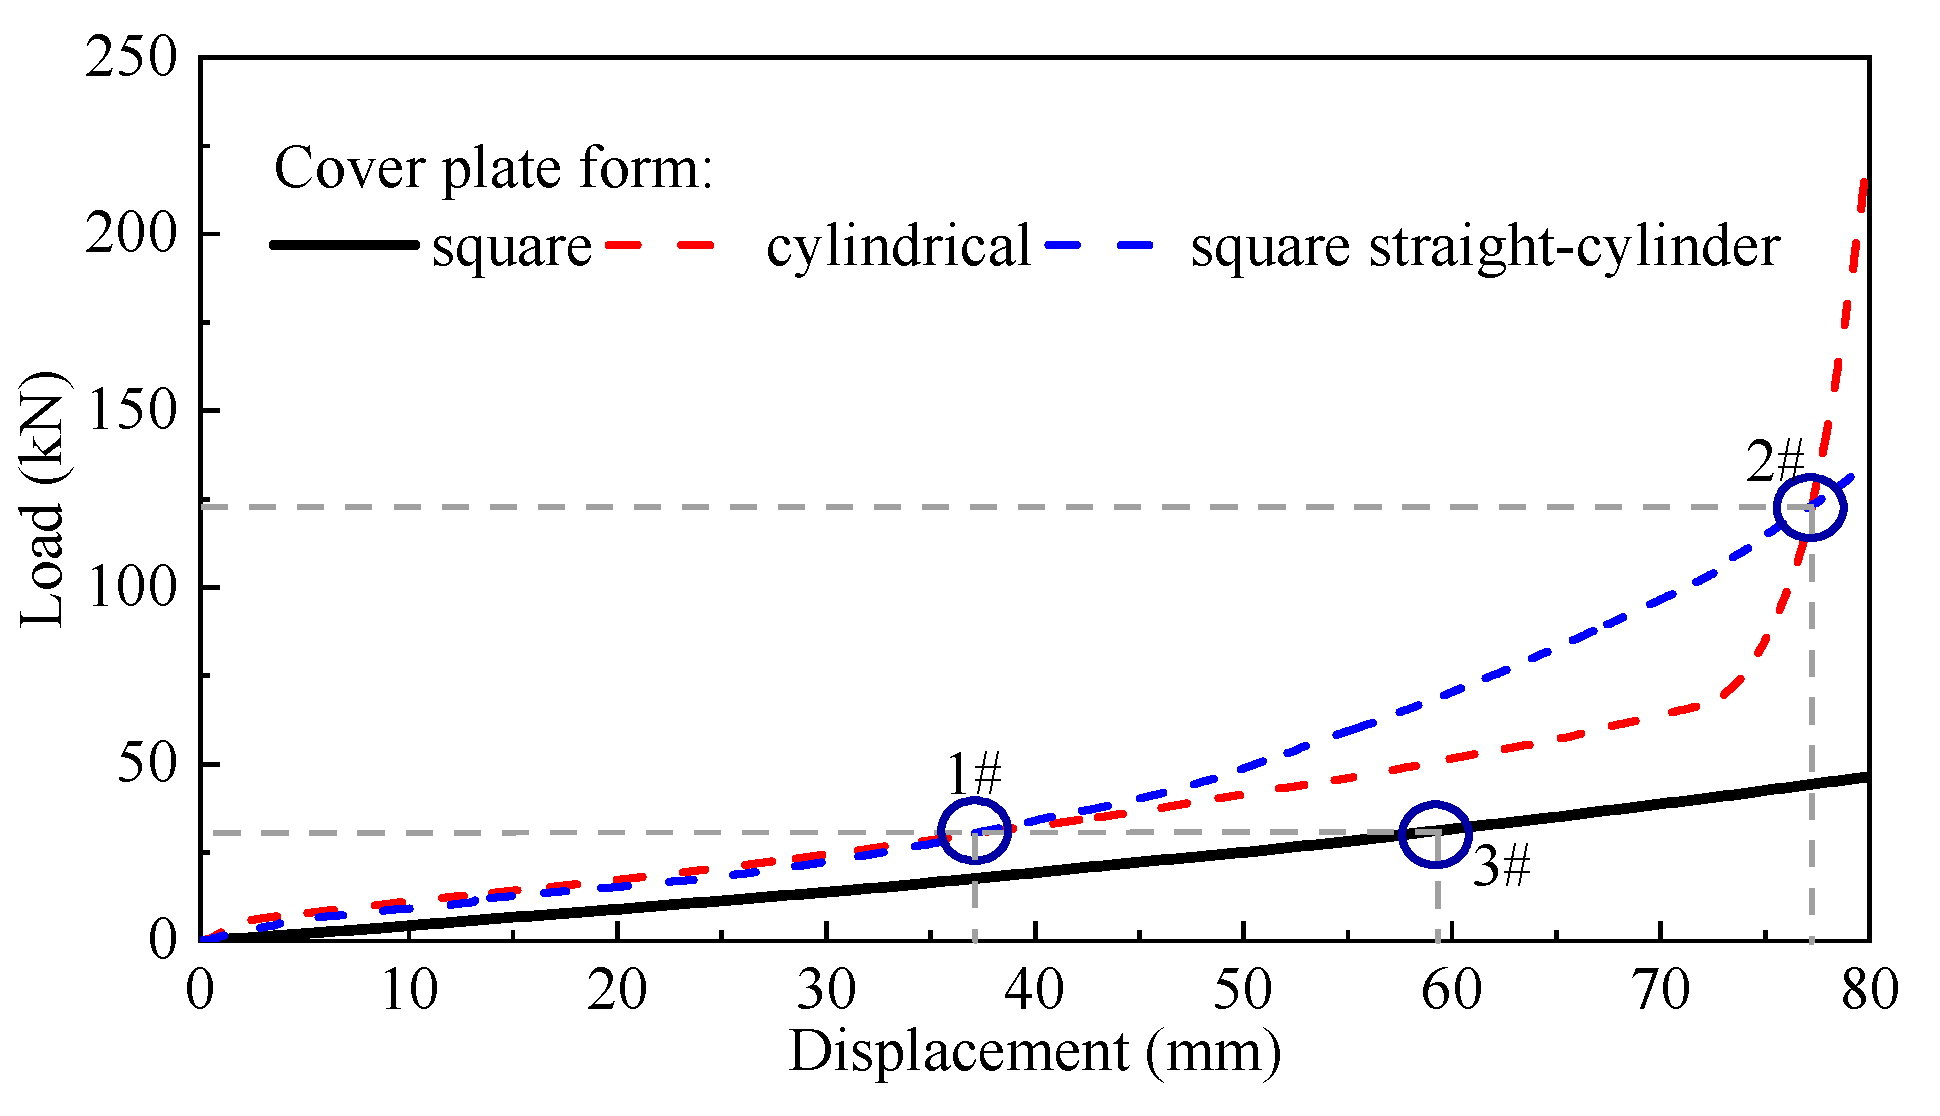
Figure 13 illustrates the impact of three different cover plate forms on the vertical bearing capacity of the RSMCB at a rubber content of 30%. The results indicate that both cylindrical and square straight-cylinder covers exhibit a bearing capacity at least 50% greater than that of the square cover, attributable to the restraining effect provided by the sidewall. It underscores the significance of the cover plate sidewall in enhancing bearing capacity. The selected nodes correspond to points 1 and 2 in Figure 13, where the bearing capacity curves for both cylindrical and square covers intersect. Within a vertical displacement range of 0–37 mm, the bearing capacity curves for these two cover types are nearly identical. However, between displacements of 37–77 mm, the square straight-cylinder cover demonstrates a more pronounced increase in bearing capacity. If design specifications necessitate controlling vertical displacement to less than 70 mm, opting for a square straight-cylinder cover plate would be advisable. Conversely, when vertical displacement exceeds 77 mm, the cylindrical cover plate is more effective at compacting the RSM due to its uniformly distributed force from the round sidewall. It reduces voids between particles and significantly enhances stiffness and load-bearing capability.

4.2. Effect of Cover Plate Dimension and Sidewall Length

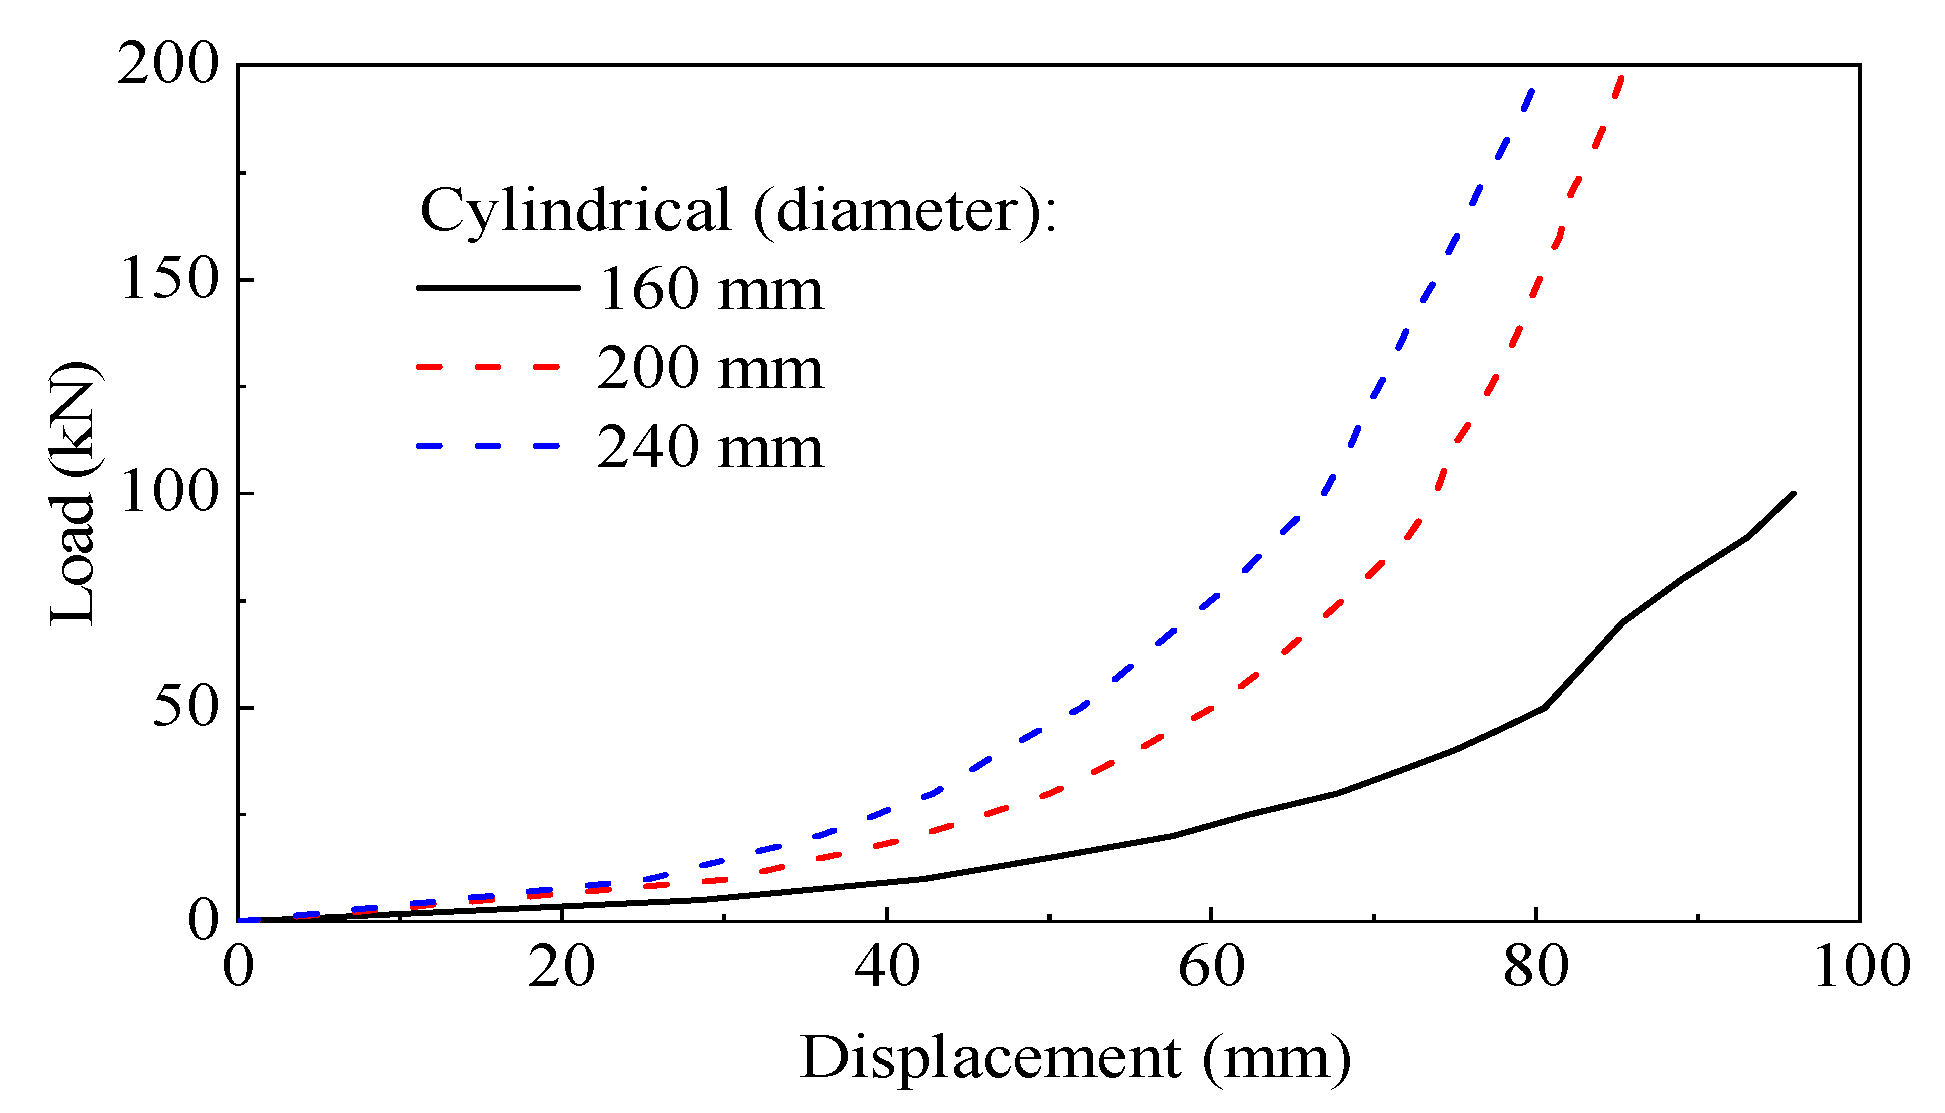
Figure 14 presents the bearing capacity curves for RSMCBs with a rubber content of 30% and various sizes of cylindrical covers (sidewall length 160 mm). It can be found that under the same vertical load, the smaller the cover plate dimensions, the greater the vertical displacement of the corresponding RSMCB. The phenomenon occurs because reduced cover plate dimensions increase RSM expulsion and lateral dispersion. Some sand particles may overflow from the sides of the block, leading to a substantial increase in vertical displacement. In contrast, the RSMCBs with 200 mm and 240 mm cover plate dimensions exhibit a more gradual increase in vertical displacement. The behavior can be attributed to the deformation of rubber granules under vertical load, which fills voids within the RSM and causes compaction, generating vertical displacement. As loading escalates, the RSM is displaced laterally and bulges outward. The RSMCB demonstrates enhanced control displacement development when utilizing 200 mm and 240 mm cover plate dimensions, thereby improving superstructure stability. The dimensions are recommended as suitable options for cover plates.
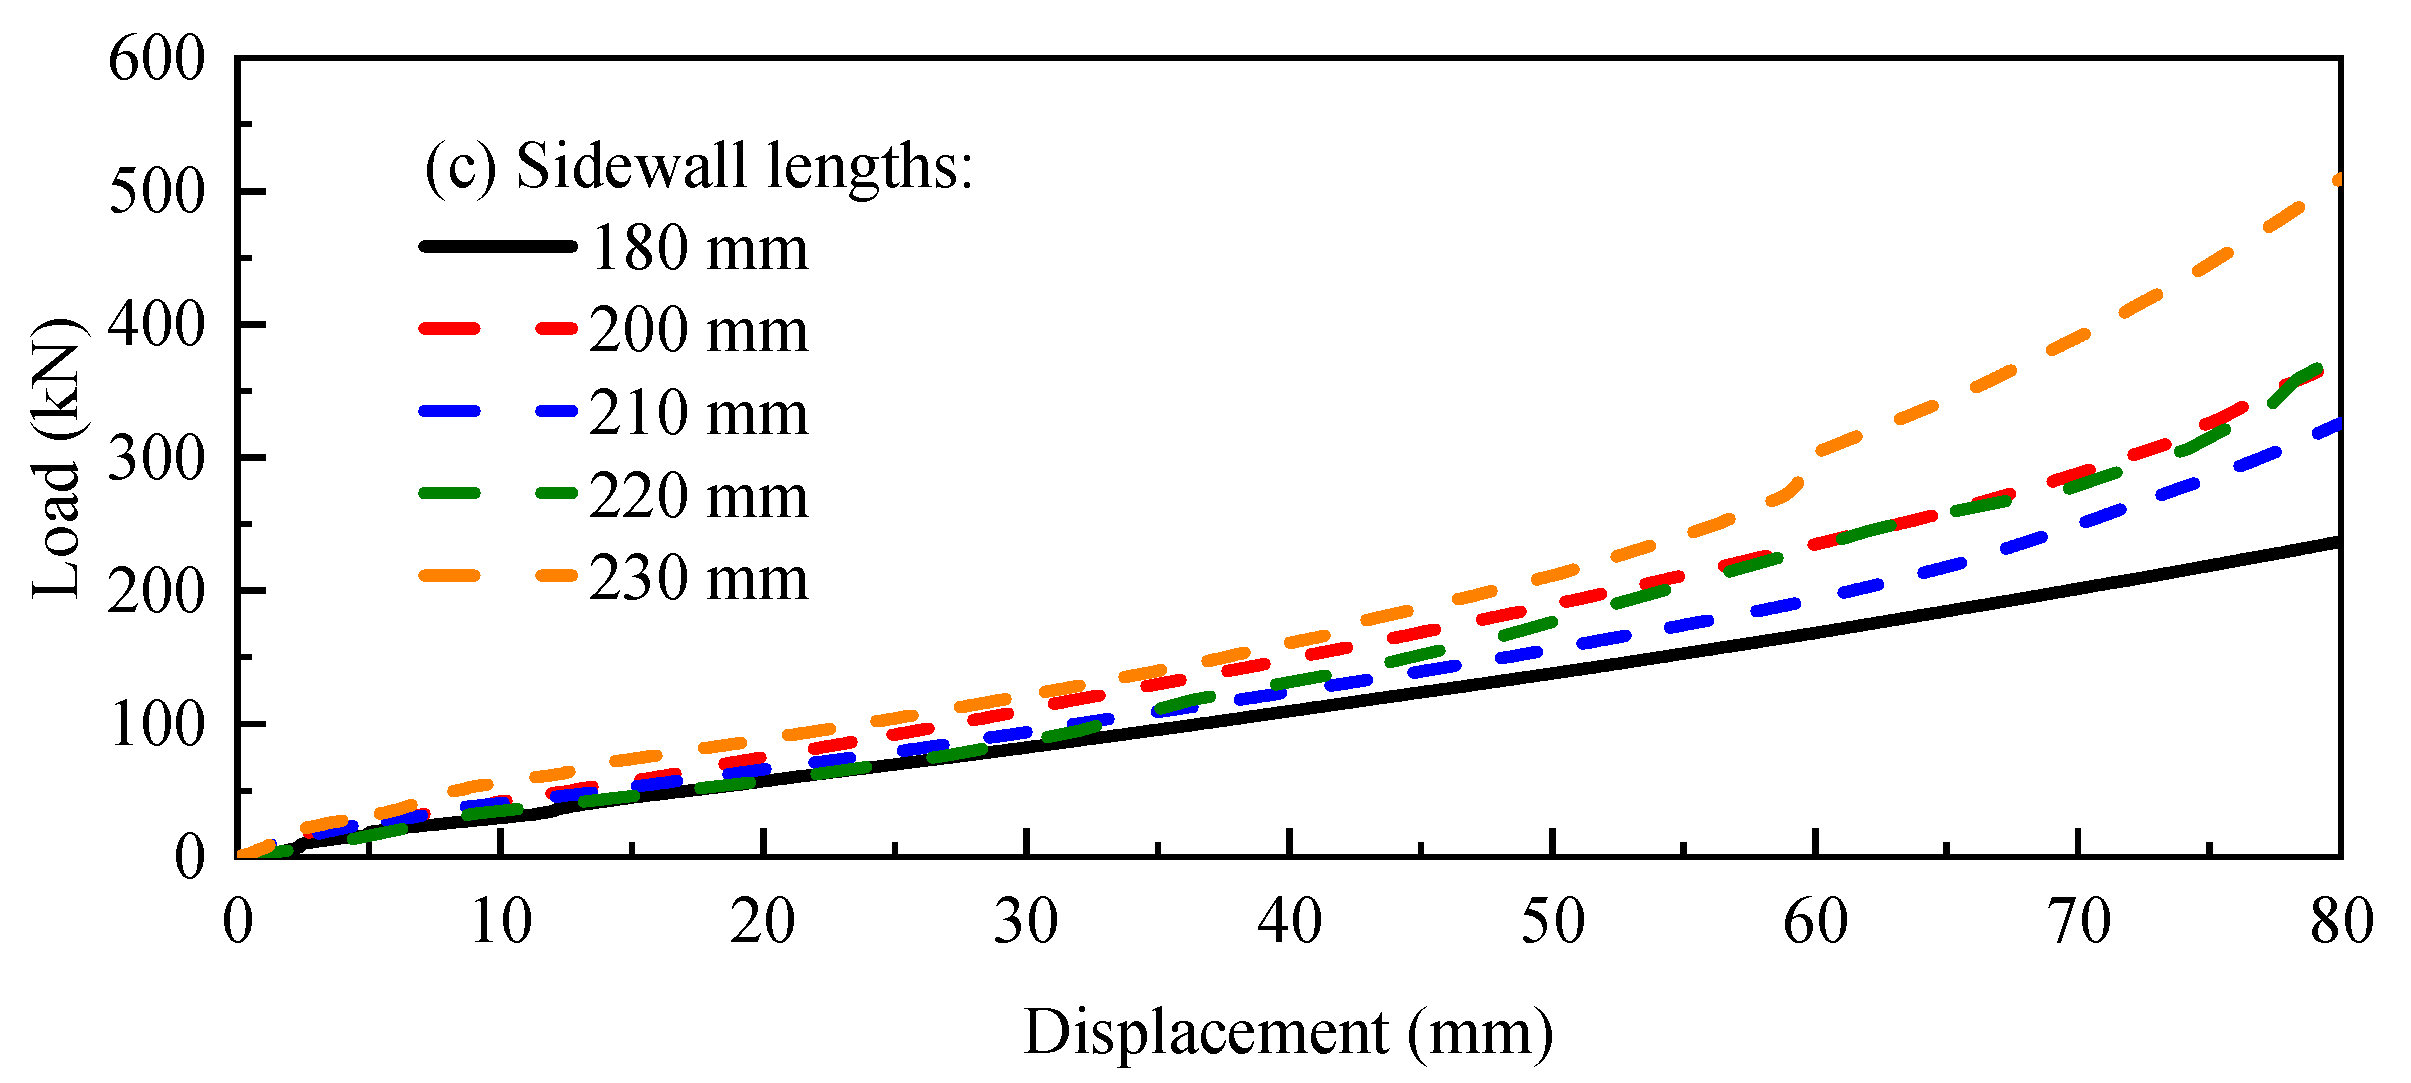
Figure 15 shows the load-bearing capacity curves for RSMCBs with 13 different cover plate sidewall lengths, a rubber content of 30%, and a cylindrical cover plate with a diameter of 200 mm. All RSMCBs exhibit good load-bearing performance due to the restraint of the sidewalls. When the length of the sidewalls varies from 20 mm to 140 mm, the change in the load-bearing capacity of the RSMCB is relatively small. When the length of the sidewalls is increased to 160 mm and 180 mm, the load-bearing capacity of the RSMCB is increased by nearly 30% compared to the 20 mm sidewall length. It shows that increasing the length of the sidewalls within a certain range can significantly improve the load-bearing capacity. In addition, within a vertical displacement of 60 mm, the RSMCBs with a sidewall length of 220 mm and 230 mm have a bearing capacity similar to that of the RSMCB with a sidewall length of 200 mm. However, after a vertical displacement of more than 60 mm, the RSMCBs exhibit a higher bearing capacity due to the increased cover plate, which can compress the RSM more effectively.

4.3. Theoretical Exploration of RSMCB

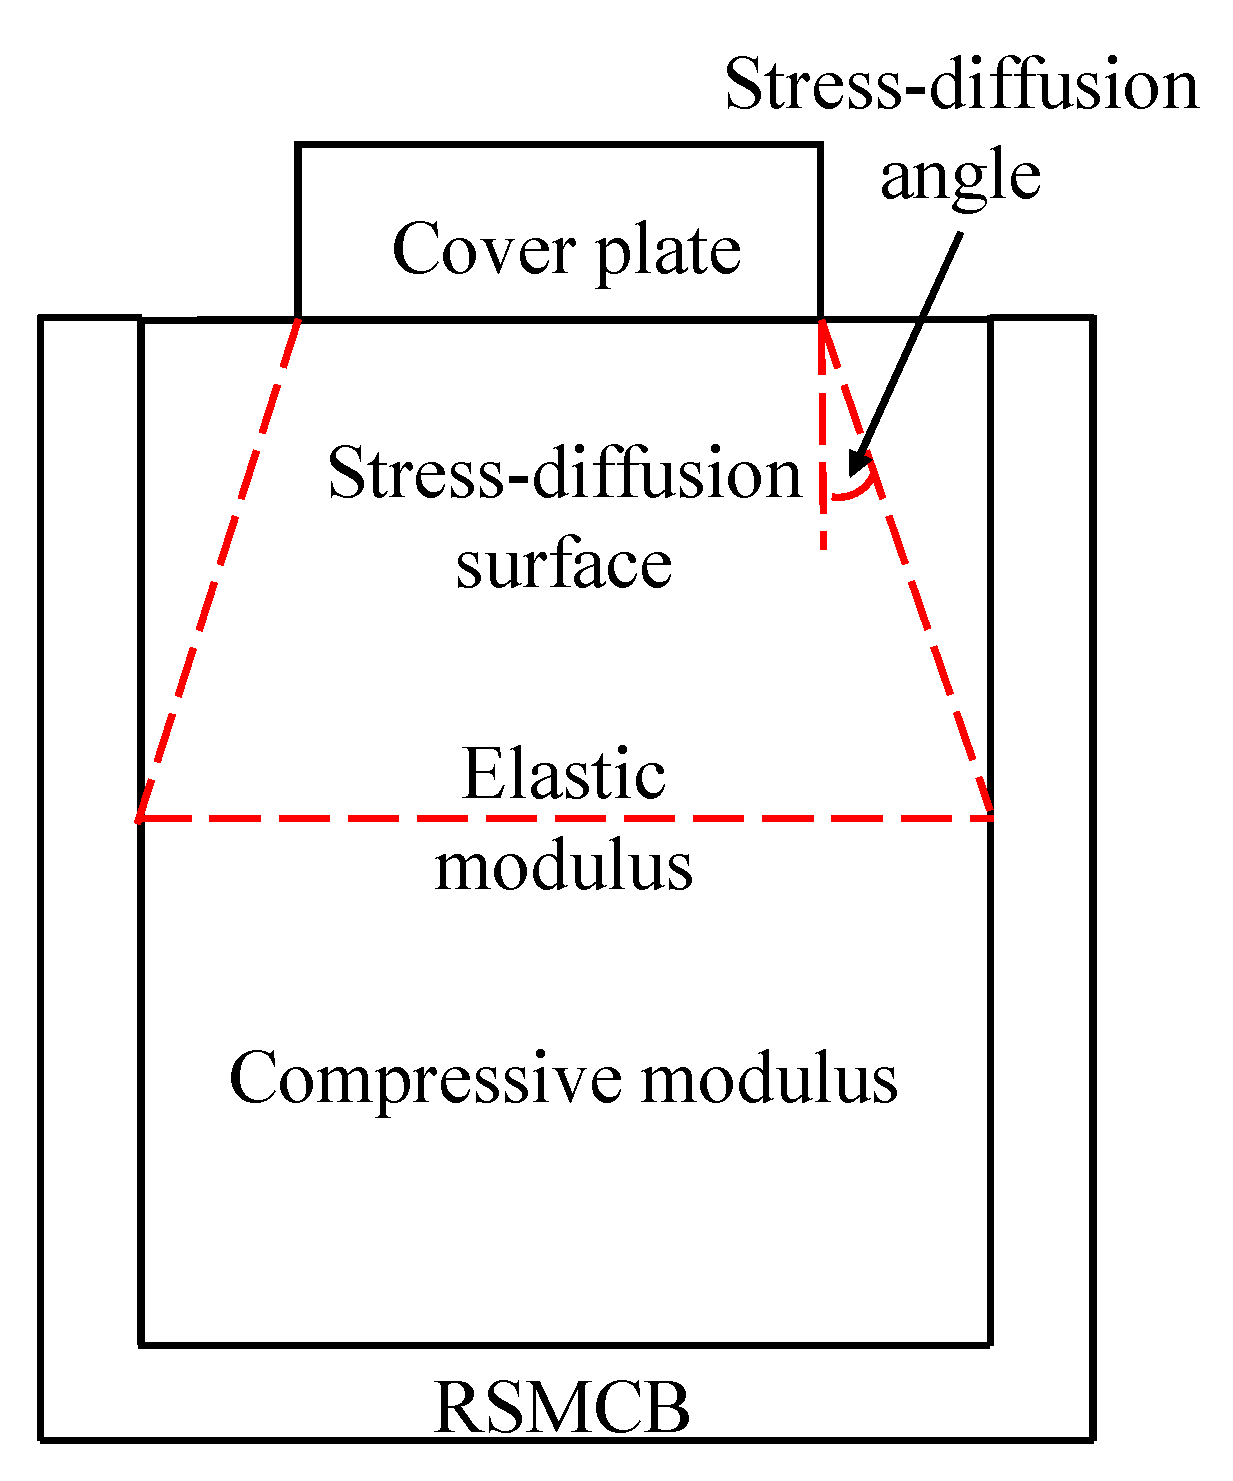
In an earthquake, the RSMCB is a buffer, providing damping and energy dissipation. It is accomplished by the deformation of rubber particles, which absorb and release energy during seismic events. Concurrently, the structural design of both blocks and cover plates effectively restrains the RSM to prevent excessive flow or displacement during stress application, thereby enhancing the vertical bearing capacity of the RSMCB. The performance of the RSMCB is validated by examining both the compression modulus Es and elastic modulus E0 of the elastomer, as illustrated in Figure 16, under conditions that ensure no failure occurs within the RSMCB. Equation (10) describes the relationship between the vertical load applied to the RSMCB and the vertical displacement of its cover plate, considering the elastic modulus as a calculation parameter. The applicability of this equation has been validated within the rubber content range of 30–50%, as well as for the specific cover plate sizes and displacement limits examined in this study.
ε = C × S / h
E s = A × exp × ( B × ε )
E 0 = ( 1 ( 2 m 2 ) / ( 1 m ) ) × E s
β = 1 ( 2 μ 2 ) / ( 1 μ )
F = E 0 × ε × b
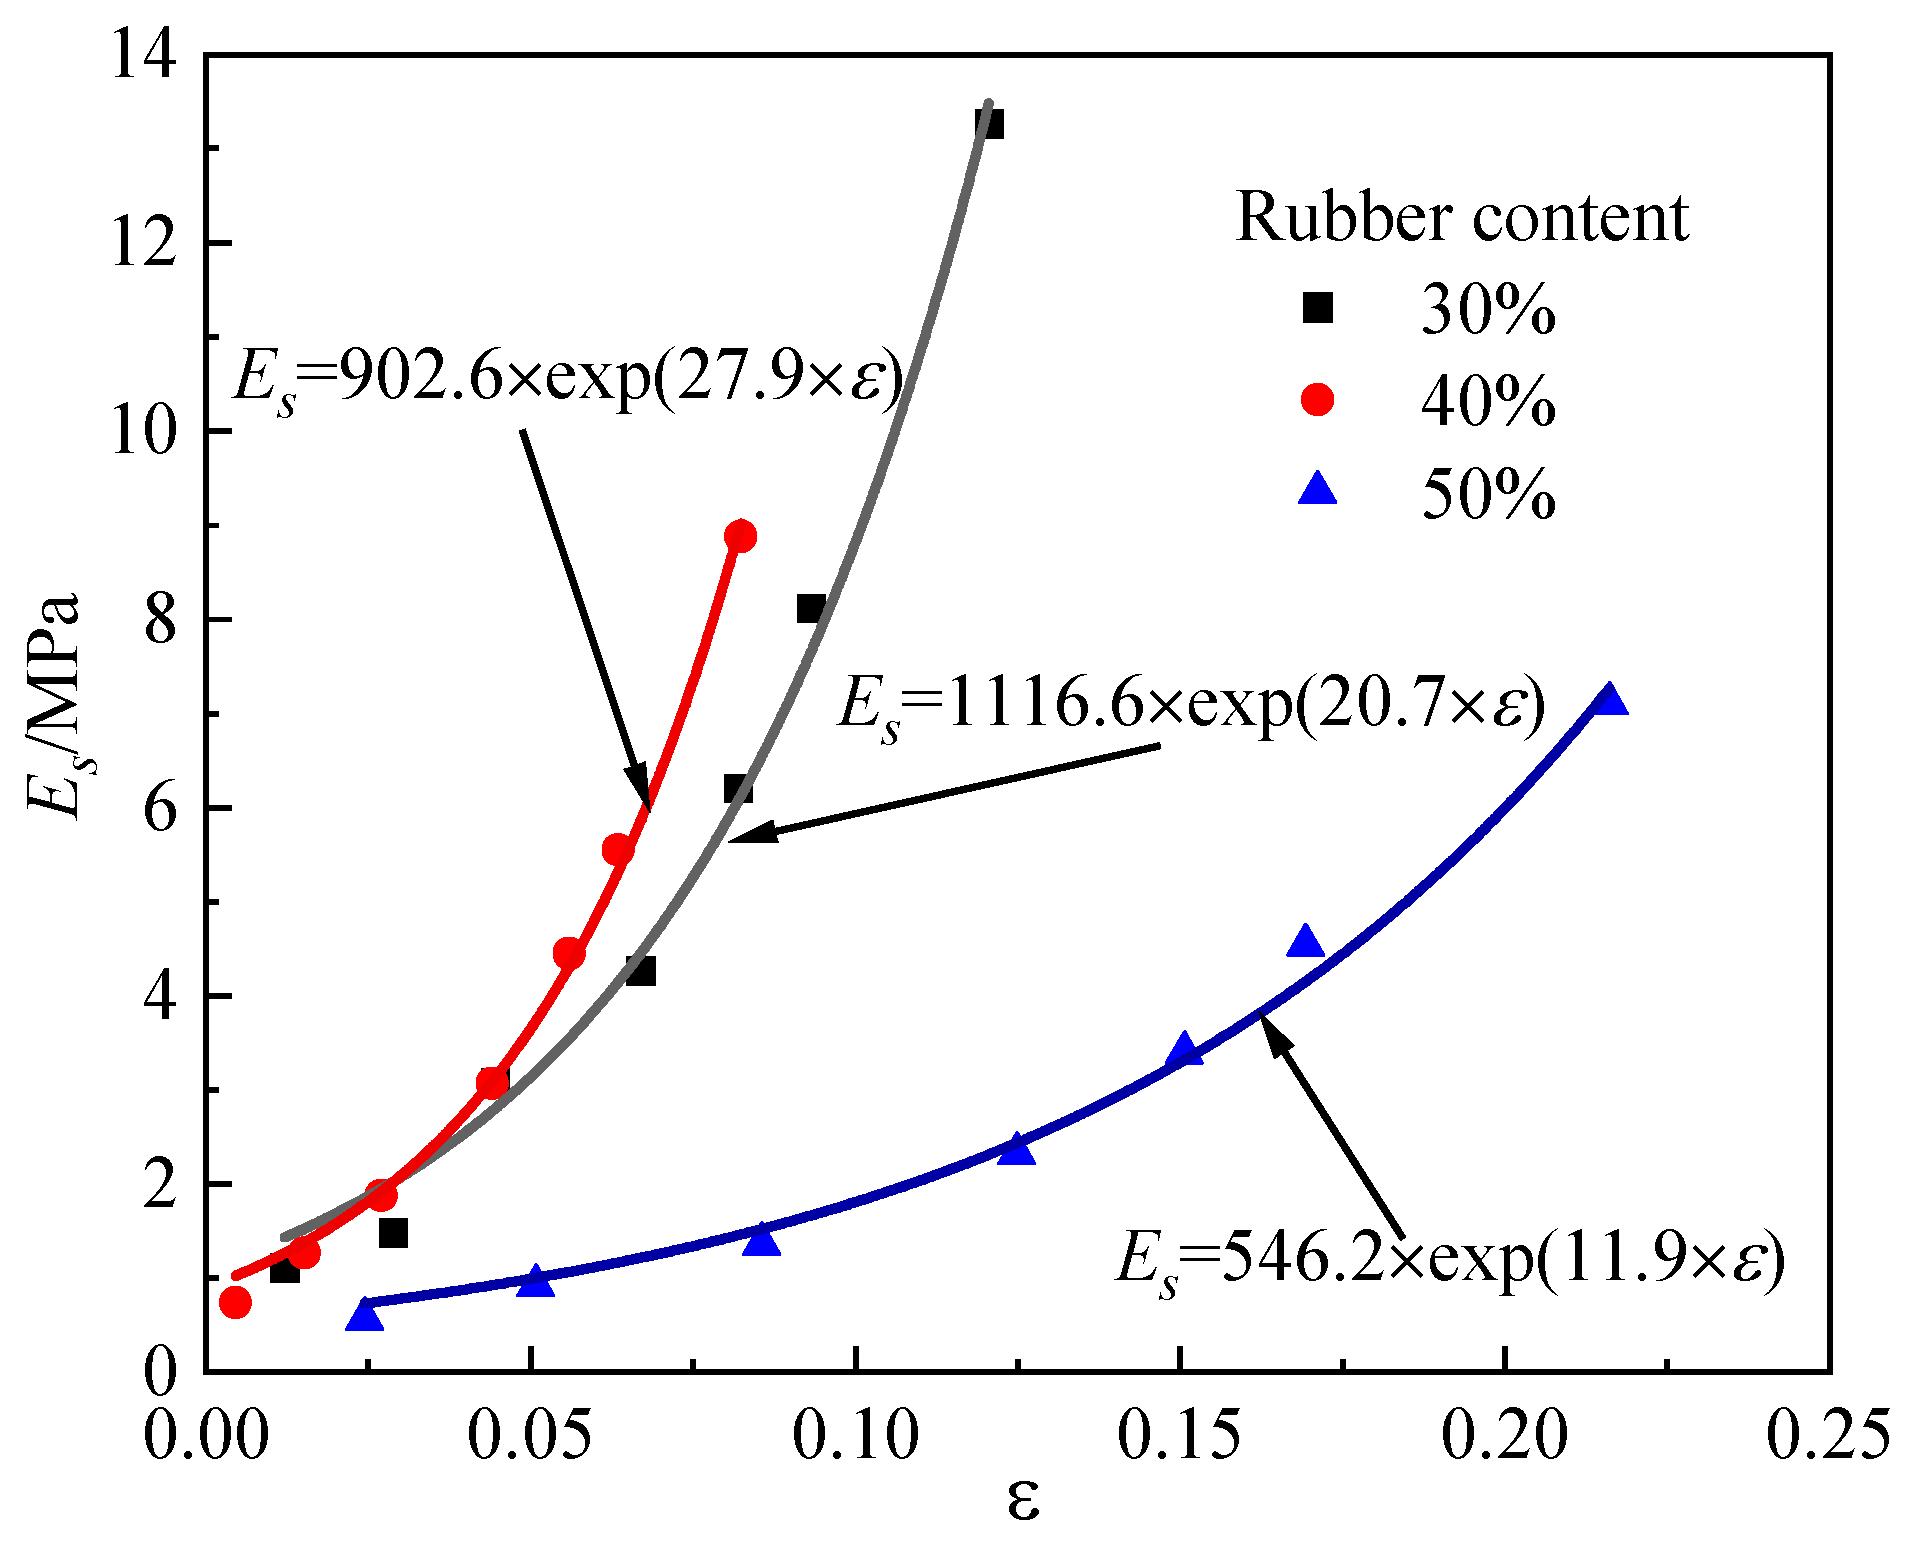
Among them, F and S refer to the force and displacement on the cover plate, h is the initial thickness of the rubber sand, ε is the compression strain, C is the correction factor, which is inversely proportional to the trend of the compression modulus of the RSM, and a smaller value appears when the rubber content is 40%. b is the sum of the area of the cover plate and the area of the sidewall, μ is the Poisson’s ratio of the rubber sand, and β is the coefficient related to the Poisson’s ratio of the rubber sand. Figure 17 shows the parameters A and B obtained by fitting the RSM stress–strain curves with different rubber contents. Table 4 lists the parameters related to RSMCB.
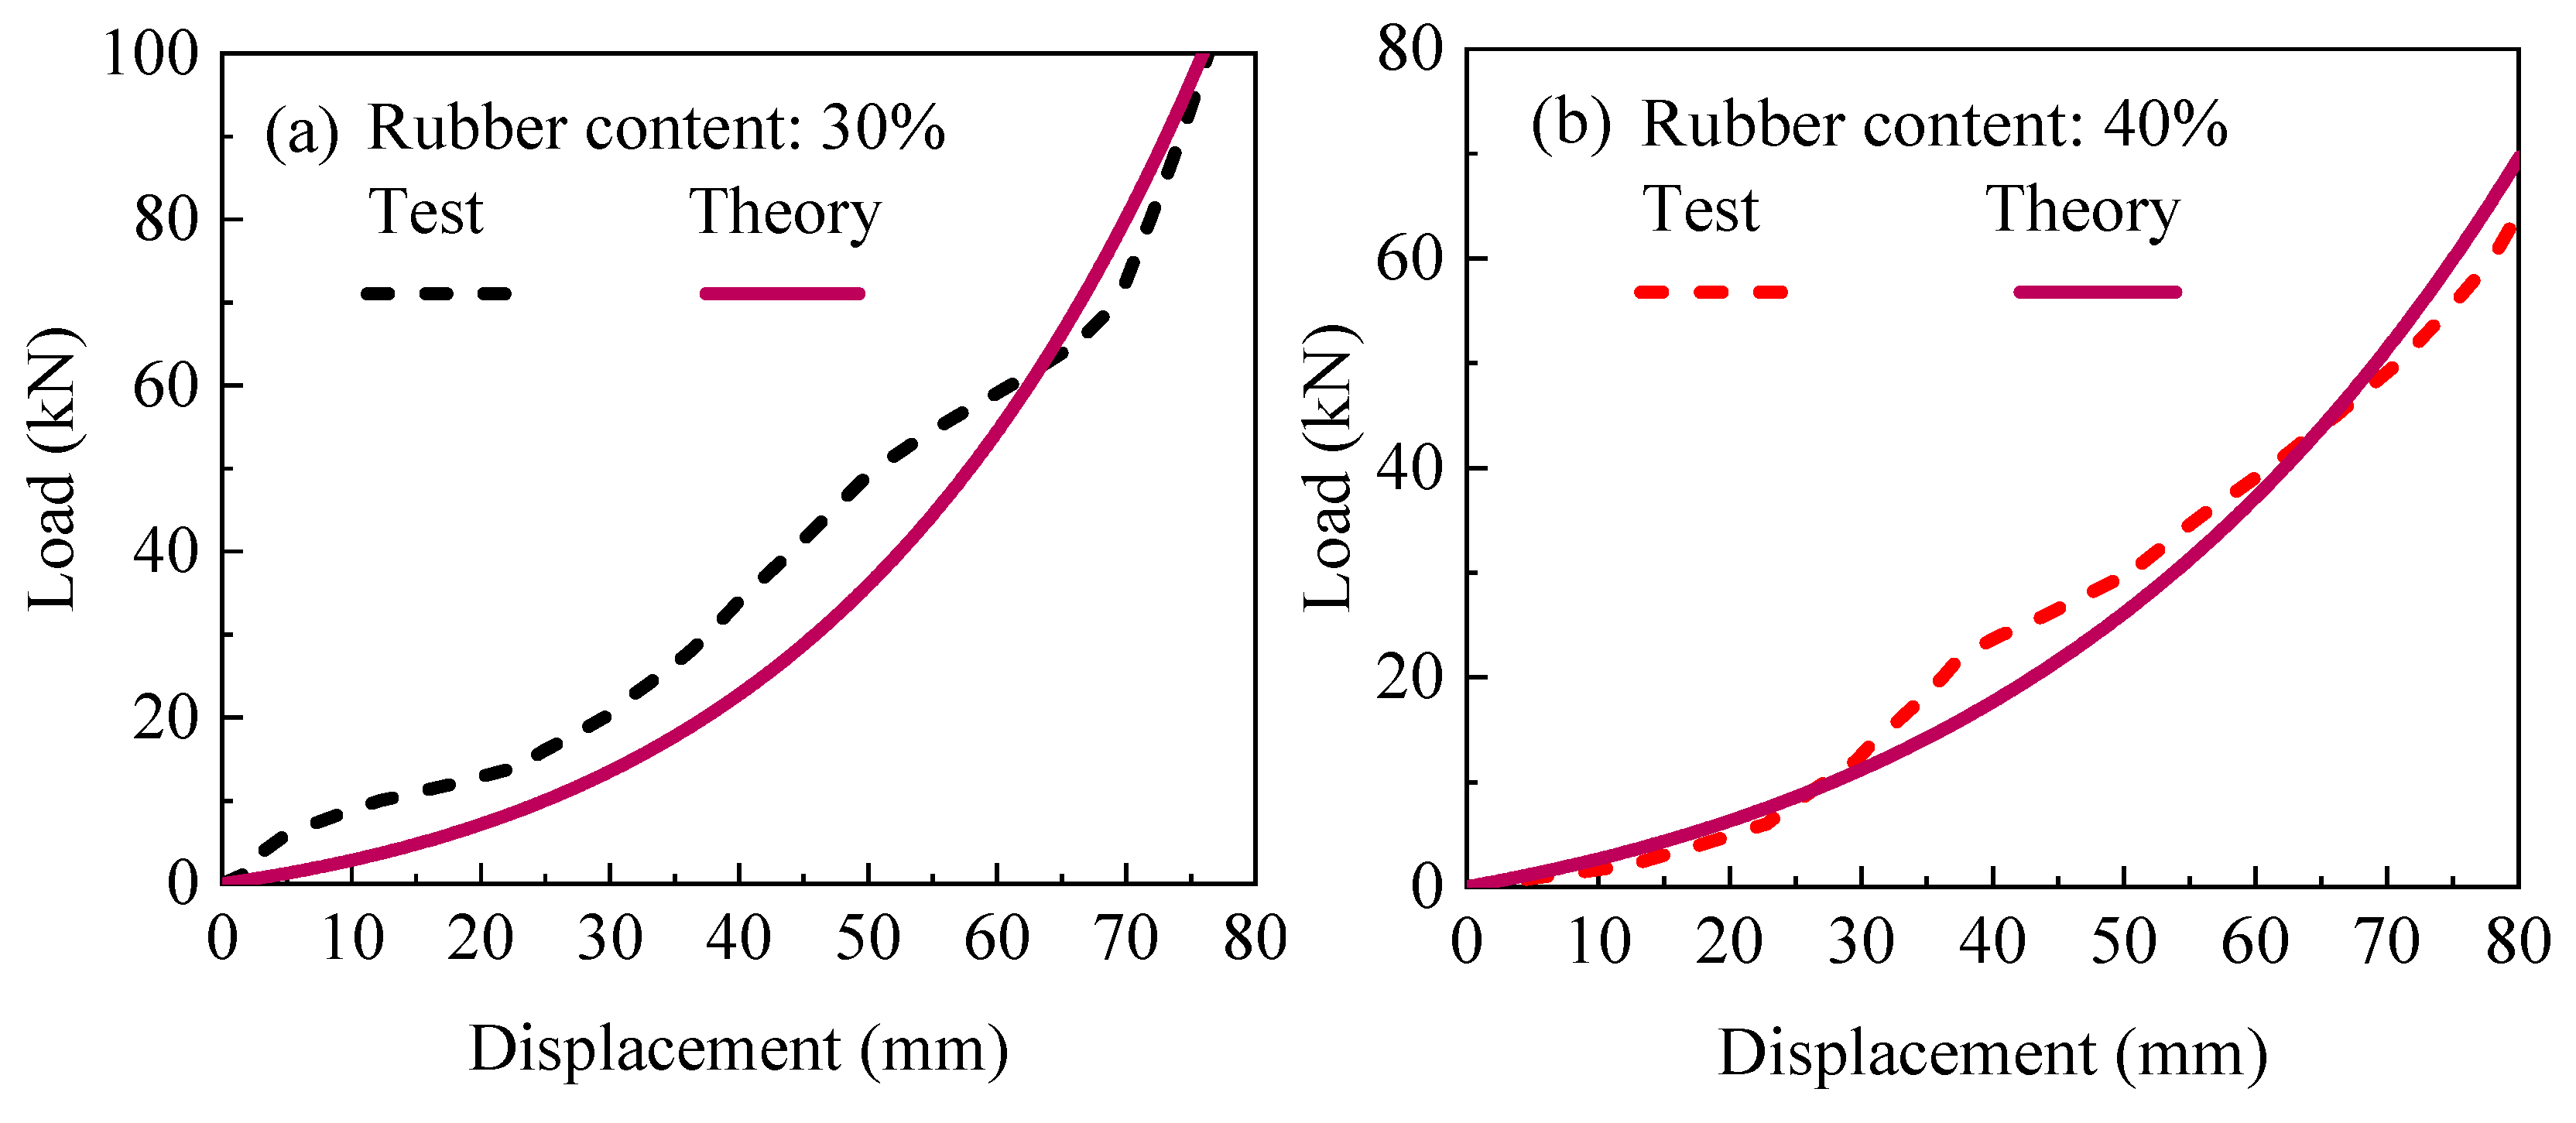
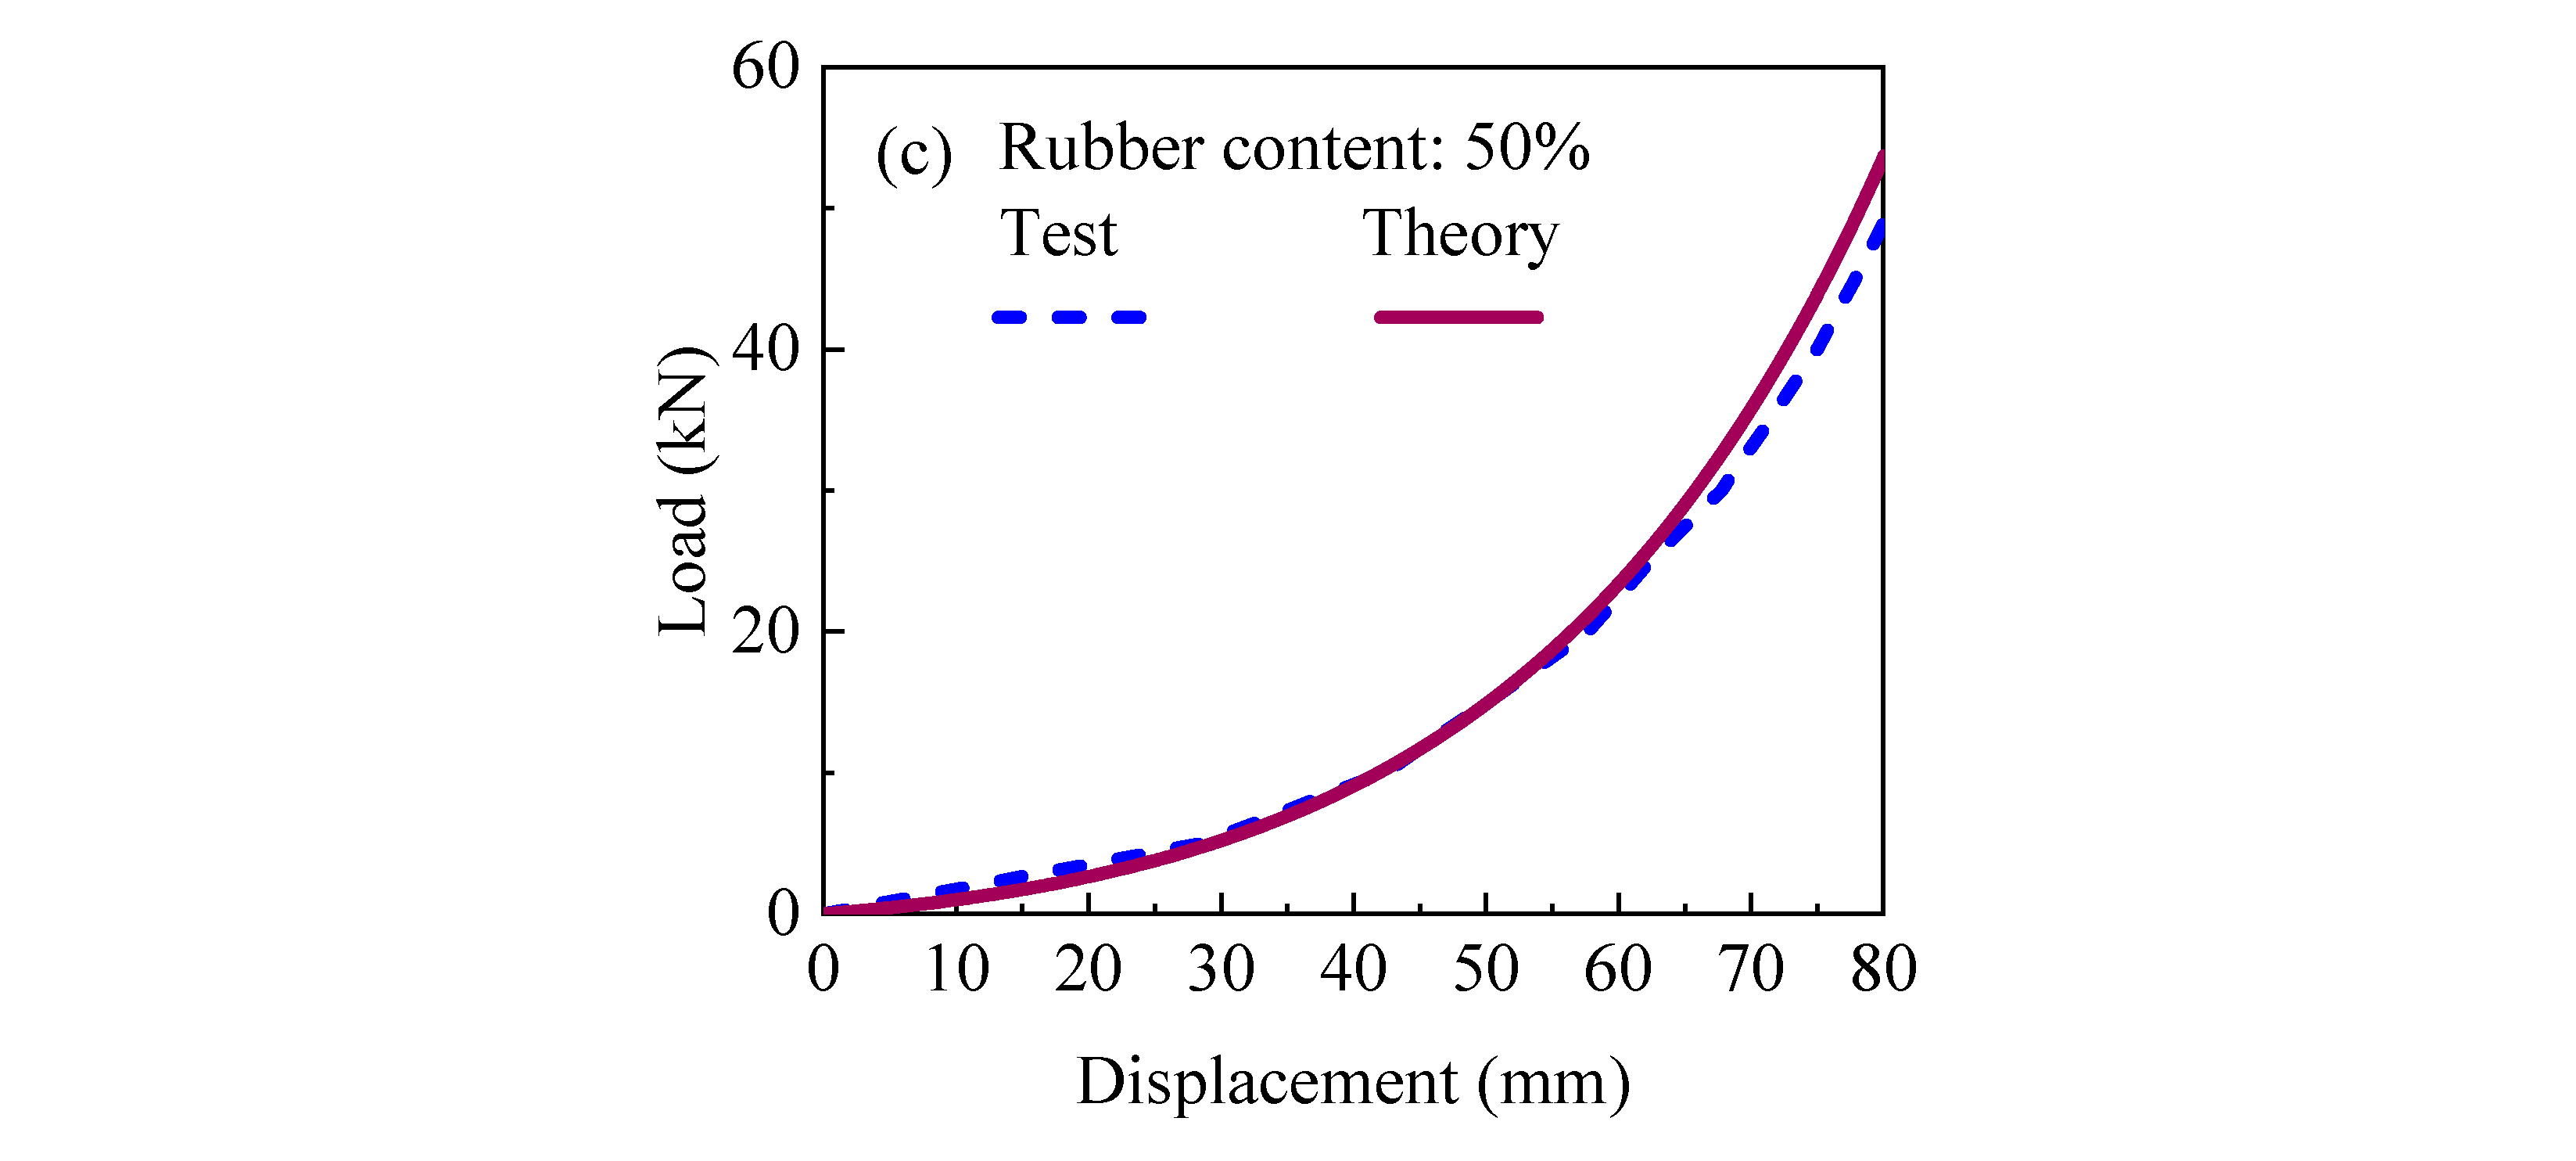
Figure 18 compares the theoretical and experimental curves for the diameter of a 160 mm cylindrical cover of the RSMCB with a sidewall length of 200 mm across various rubber contents. The close alignment between the theoretical and experimental curves substantiates the validity of the theoretical formula. In future studies, the bearing capacity of RSMCB can be directly derived from the theoretical framework.

4.4. Implementation and Challenges for RSMCB in Rural Construction

Deploying RSMCB in rural areas necessitates collaboration with local tire recycling facilities to ensure a stable supply of rubber granules, while on-site storage of natural sand minimizes transportation expenses. One-day training programs are implemented to equip workers with the skills to accurately control the RSM ratio and achieve the required compaction level. Low-cost tools such as manual compactors and visual guides are integrated into the process to facilitate basic quality inspections. The four-step construction methodology, which includes prefabrication of hollow blocks, material mixing, compaction, and installation of cover plates, minimizes reliance on heavy machinery, making it well-suited for resource-constrained environments.
Key challenges include an inconsistent supply of recycled rubber, variability in preprocessing quality, and limited technical proficiency among laborers, which may result in ratio deviations exceeding 5% and compromise seismic resilience. High initial processing costs and the absence of localized technical standards further constrain economic adoption. To address these barriers, the following mitigation strategies are proposed: (1) Establish partnerships with regional recycling centers to secure bulk supply and advocate for government subsidies to support preprocessing equipment acquisition. (2) Implement recurring training sessions combined with on-site supervision, supplemented by simplified testing tools such as cost-effective density meters. (3) Develop context-specific lightweight technical guidelines and introduce financial instruments to mitigate raw material price volatility. Priority should be given to pilot projects in counties with existing tire recycling infrastructure to evaluate long-term performance and refine regulatory frameworks.

5. Conclusions

This study systematically investigates the effects of rubber content, cover plate form, dimensions, and sidewall length on the vertical bearing capacity of rubber-sand composite blocks (RSCMB) through newly conducted experimental methods and discrete element method (DEM) simulations. The key findings are as follows:
(1) The RSMCB exhibits pronounced nonlinear characteristics under vertical loading conditions, with strong force chains formed due to the rough surfaces of sand and rubber particles.
(2) An increase in rubber content leads to higher internal porosity and greater vertical displacement, while larger cover plates mitigate vertical displacement.
(3) The theoretical formula derived in this study provides a practical tool for calculating the vertical bearing capacity of RSMCB, facilitating its application in seismic isolation for rural houses.
(4) For low-rise rural housing applications, it is recommended to adopt a rubber content of approximately 40%, a cylindrical cover plate with a diameter of at least 200 mm, and a sidewall length ranging between 160 and 200 mm to achieve an optimal balance between bearing capacity and deformability.

6. Future Work

This research focused on the basic vertical load-bearing capacity. A global sensitivity analysis, such as one employing Sobol indices or Kolmogorov–Smirnov, will be conducted to quantitatively rank the impact of micro-parameters (e.g., inter-particle friction, stiffness) on macro-scale structural responses. This analysis will identify the most critical parameters requiring precise calibration, ultimately improving the accuracy and robustness of future predictive models.
Future work will focus on multi-directional cyclic seismic performance, including energy dissipation, hysteresis, recentering, and long-term durability under various environmental conditions, such as temperature, moisture, creep, and cyclic degradation. Subsequent efforts will include developing predictive numerical models, conducting large-scale shaking table tests, and assessing practical implementation and sustainability. These steps aim to transition the RSMCB into a cost-effective seismic solution for rural infrastructure.
A promising future direction involves integrating machine learning techniques, particularly Physics-Informed Neural Networks (PINNs), to construct efficient surrogate models based on DEM simulation data. These models have the potential to capture the complex constitutive behavior of RSM, thereby enabling the rapid assessment of seismic performance for full-scale structures at a significantly reduced computational cost compared to high-fidelity simulations.

Author Contributions

Conceptualization, J.W. and F.L.; Methodology, J.W. and F.L.; Software, J.W.; Validation, J.W.; Formal analysis, J.W. and W.T.; Investigation, J.W.; Resources, F.L.; Data curation, W.T.; Writing—original draft, J.W.; Writing—review & editing, F.L. and W.T.; Supervision, F.L.; Project administration, F.L.; Funding acquisition, F.L. All authors have read and agreed to the published version of the manuscript.

Funding

This research was sponsored by the Natural Science Foundation of Hunan Province, General Program (Grant No. 2025JJ50325).

Institutional Review Board Statement

Not applicable.

Informed Consent Statement

Not applicable.

Data Availability Statement

The original contributions presented in this study are included in the article. Further inquiries can be directed to the first author.

Conflicts of Interest

The authors declare that there are no known conflicts of interest.

References

  1. Kuang, A.; Sridhar, A.; Garven, J.; Gutschmidt, S.; Rodgers, G.W.; Chase, J.G.; MacRae, G.A. Christchurch Women’s Hospital: Performance analysis of the base-isolation system during the series of canterbury earthquakes 2011–2012. J. Perform. Constr. Facil. 2016, 30, 04015096. [Google Scholar] [CrossRef]
  2. Chen, H.; Xie, Q.; Feng, B.; Liu, J.; Huang, Y.; Chen, H. Seismic performance to emergency centers, communication and hospital facilities subjected to Nepal earthquakes, 2015. J. Earthq. Eng. 2018, 22, 1537–1568. [Google Scholar] [CrossRef]
  3. Yu, Q.Q.; Wu, J.Y.; Gu, X.L.; Zhou, F.Y. Experimental study on effects of U-shape dampers on earthquake responses of a base-isolated LNG inner tank. Eng. Struct. 2022, 269, 114841. [Google Scholar] [CrossRef]
  4. Chen, P.; Wang, B.; Dai, K.; Li, T. Analytical and numerical investigations of base isolation system with negative stiffness devices. Eng. Struct. 2022, 268, 114799. [Google Scholar] [CrossRef]
  5. Chen, P.; Wang, B.; Zhang, Z.; Li, T.; Dai, K. A generalized model of lead rubber bearing considering large strain stiffening and degradation. Eng. Struct. 2023, 275, 115264. [Google Scholar] [CrossRef]
  6. Hadad, H.A.; Calabrese, A.; Strano, S.; Serino, G. A base isolation system for developing countries using discarded tyres filled with elastomeric recycled materials. J. Earthq. Eng. 2017, 21, 246–266. [Google Scholar] [CrossRef]
  7. Xiang, N.; Li, J. Experimental and numerical study on seismic sliding mechanism of laminated-rubber bearings. Eng. Struct. 2017, 141, 159–174. [Google Scholar] [CrossRef]
  8. Valdes, J.R.; Evans, T.M. Sand–rubber mixtures: Experiments and numerical simulations. Can. Geotech. J. 2008, 45, 588–595. [Google Scholar] [CrossRef]
  9. Masad, E.; Taha, R.; Ho, C.; Papagiannakis, T. Engineering properties of tire/soil mixtures as a lightweight fill material. Geotech. Test. J. 1996, 19, 297–304. [Google Scholar] [CrossRef]
  10. Ghazavi, M.; Sakhi, M.A. Influence of optimized tire shreds on shear strength parameters of sand. Int. J. Geomech. 2005, 5, 58–65. [Google Scholar] [CrossRef]
  11. Liu, F.; Zheng, K.; Jia, B.; Yang, J.; Wu, M. Shear modulus and damping ratio of granulated rubber-sand mixtures: Influence of relative particle size. Constr. Build. Mater. 2024, 427, 136205. [Google Scholar] [CrossRef]
  12. Lee, C.; Shin, H.; Lee, J.S. Behavior of sand–rubber particle mixtures: Experimental observations and numerical simulations. Int. J. Numer. Anal. Methods Geomech. 2014, 38, 1651–1663. [Google Scholar] [CrossRef]
  13. Foose, G.J.; Benson, C.H.; Bosscher, P.J. Sand reinforced with shredded waste tires. J. Geotech. Eng. 1996, 122, 760–767. [Google Scholar] [CrossRef]
  14. Balunaini, U.; Yoon, S.; Prezzi, M.; Salgado, R. Pullout response of uniaxial geogrid in tire shred–sand mixtures. Geotech. Geol. Eng. 2014, 32, 505–523. [Google Scholar] [CrossRef]
  15. Bernal, A.; Salgado, R.; Swan, R.H.; Lovell, C. Interaction between tire shreds, rubber-sand and geosynthetics. Geosynth. Int. 1997, 4, 623–643. [Google Scholar] [CrossRef]
  16. Edil, T.B. A review of mechanical and chemical properties of shredded tires and soil mixtures. In Proceedings of the Recycled Materials in Geotechnics Sessions at ASCE Civil Engineering Conference and Exposition, Baltimore, MD, USA, 19–21 October 2004; pp. 1–21. [Google Scholar] [CrossRef]
  17. Uchimura, T.; Chi, N.; Nirmalan, S.; Sato, T.; Meidani, M.; Towhata, I. Shaking table tests on effect of tire chips and sand mixture in increasing liquefaction resistance and mitigating uplift of pipe. In Proceedings of the International Workshop on scrap Tire Derived Geomaterials—Opportunities and Challenges, Yokosuka, Japan, 23–24 March 2007; pp. 179–186. [Google Scholar]
  18. Fan, K.; Yang, G.; Zou, W.; Han, Z.; Shen, Y. Lateral earth pressure of granular backfills on retaining walls with expanded polystyrene geofoam inclusions under limited surcharge loading. J. Rock Mech. Geotech. Eng. 2024, 16, 1388–1397. [Google Scholar] [CrossRef]
  19. Fan, K.; Zou, W.; Zhang, P.; Wang, X.; Shen, Y. Laboratory investigation and theoretical analysis of lateral pressure exerted by expansive soils on retaining walls with expanded polystyrene geofoam block upon water infiltration. Geotext. Geomembr. 2024, 52, 332–341. [Google Scholar] [CrossRef]
  20. Lee, J.H.; Salgado, R.; Bernal, A.; Lovell, C.W. Shredded tires and rubber-sand as lightweight backfill. J. Geotech. Geoenvironmental Eng. 1999, 125, 132–141. [Google Scholar] [CrossRef]
  21. Xiao, M.; Bowen, J.; Graham, M.; Larralde, J. Comparison of seismic responses of geosynthetically reinforced walls with tire-derived aggregates and granular backfills. J. Mater. Civ. Eng. 2012, 24, 1368–1377. [Google Scholar] [CrossRef]
  22. Tafreshi, S.M.; Mehrjardi, G.T.; Dawson, A.R. Buried pipes in rubber-soil backfilled trenches under cyclic loading. J. Geotech. Geoenvironmental Eng. 2012, 138, 1346–1356. [Google Scholar] [CrossRef]
  23. Ecemis, N.; Valizadeh, H.; Karaman, M. Sand-granulated rubber mixture to prevent liquefaction-induced uplift of buried pipes: A shaking table study. Bull. Earthq. Eng. 2021, 19, 2817–2838. [Google Scholar] [CrossRef]
  24. Bosscher, P.J.; Edil, T.B.; Kuraoka, S. Design of highway embankments using tire chips. J. Geotech. Geoenvironmental Eng. 1997, 123, 295–304. [Google Scholar] [CrossRef]
  25. Edeskar, T. Use of Tyre Shreds in Civil Engineering Applications—Technical and Environmental Properties. Ph.D. Dissertation, Lulea University of Technology, Department of Civil and Environmental Engineering, Division of Mining and Geotechnical Engineering, Luleå, Sweden, 2006. [Google Scholar]
  26. Reddy, K.R.; Saichek, R.E. Characterization and performance assessment of shredded scrap tires as leachate drainage material in landfills. In Proceedings of the 14th International Conference on Solid Waste Technology and Management, Chester, PA, USA, 1–4 November 1998. [Google Scholar]
  27. Wang, J.; Wu, M.; Liu, F.; Bin, J.; He, J. Rubber-sand infilled soilbags as seismic isolation cushions: Experimental validation. Geosynth. Int. 2025, 32, 205–218. [Google Scholar] [CrossRef]
  28. Wu, M.; Liu, F.; Li, Z.; Bu, G. Micromechanics of granulated rubber–soil mixtures as a cost-effective substitute for geotechnical fillings. Mech. Adv. Mater. Struct. 2022, 30, 2701–2717. [Google Scholar] [CrossRef]
  29. Liu, B.; Vu-Bac, N.; Zhuang, X.; Lu, W.; Fu, X.; Rabczuk, T. Al-DeMat: A web-based expert system platform for computationally expensive models in materials design. Adv. Eng. Softw. 2023, 176, 103398. [Google Scholar] [CrossRef]
  30. Tsang, H.H.; Lo, S.H.; Xu, X.; Neaz Sheikh, M. Seismic isolation for low-to-medium-rise buildings using granulated rubber–soil mixtures: Numerical study. Earthq. Eng. Struct. Dyn. 2012, 41, 2009–2024. [Google Scholar] [CrossRef]
  31. Liu, F.; Wang, J.; Zhou, B.; Wu, M.; He, J.; Bin, J. Shaking table study on rubber-sand mixture cored composite block as low-cost isolation bearing for rural houses. J. Build. Eng. 2023, 76, 107413. [Google Scholar] [CrossRef]
  32. Zhang, C.; Ali, A.; Sun, L. Investigation on low-cost friction-based isolation systems for masonry building structures: Experimental and numerical studies. Eng. Struct. 2021, 243, 112645. [Google Scholar] [CrossRef]
  33. Tsiavos, A.; Sextos, A.; Stavridis, A.; Dietz, M.; Dihoru, L.; Alexander, N.A. Large-scale experimental investigation of a low-cost PVC ’sand-wich’ (PVC-s) seismic isolation for developing countries. Earthq. Spectra 2020, 36, 1886–1911. [Google Scholar] [CrossRef]
  34. Tsang, H.H. Seismic isolation by rubber–soil mixtures for developing countries. Earthq. Eng. Struct. Dyn. 2008, 37, 283–303. [Google Scholar] [CrossRef]
  35. Fan, K.; Pei, Q.; Liu, L.; Han, Z.; Zou, W. Strength and microstructure of a lignin fiber-reinforced expansive soil in cold regions. Geosynth. Int. 2022, 29, 622–629. [Google Scholar] [CrossRef]
  36. Dondi, G.; Simone, A.; Vignali, V.; Manganelli, G. Numerical and experimental study of granular mixes for asphalts. Powder Technol. 2012, 232, 31–40. [Google Scholar] [CrossRef]
  37. Xu, W.J.; Wang, S.; Zhang, H.Y.; Zhang, Z.L. Discrete element modelling of a soil-rock mixture used in an embankment dam. Int. J. Rock Mech. Min. Sci. 2016, 86, 141–156. [Google Scholar] [CrossRef]
  38. He, H.; Zheng, J.; Li, Z. Accelerated simulations of direct shear tests by physics engine. Comput. Part. Mech. 2021, 8, 471–492. [Google Scholar] [CrossRef]
  39. Gu, X.; Huang, M.; Qian, J. DEM investigation on the evolution of microstructure in granular soils under shearing. Granul. Matter 2014, 16, 91–106. [Google Scholar] [CrossRef]
  40. Dai, B.B.; Yang, J.; Zhou, C.Y. Micromechanical origin of angle of repose in granular materials. Granul. Matter 2017, 19, 24. [Google Scholar] [CrossRef]
  41. Zhou, T.; Qian, X.; Zhang, B. Investigation and analysis of damage to rural houses in Lushan earthquake. Earthq. Eng. Eng. Vib. 2013, 33, 53–58. [Google Scholar]
  42. Perez, J.C.L.; Kwok, C.Y.; Senetakis, K. Effect of rubber size on the behaviour of sand-rubber mixtures: A numerical investigation. Comput. Geotech. 2016, 80, 199–214. [Google Scholar] [CrossRef]
  43. Wang, C.; Deng, A.; Taheri, A. Three-dimensional discrete element modeling of direct shear test for granular rubber–sand. Comput. Geotech. 2018, 97, 204–216. [Google Scholar] [CrossRef]
  44. Reddy, N.S.; He, H.; Senetakis, K. DEM analysis of small and small-to-medium strain shear modulus of sands. Comput. Geotech. 2022, 141, 104518. [Google Scholar] [CrossRef]
  45. Liu, F.-C.; Zhang, Y.-F.; Ren, D.-B. Stress-strain characteristics of rubber-sand mixtures in united triaxial shear and simple shear tests. Rock Soil Mech. 2016, 37, 2769–2779. [Google Scholar] [CrossRef]
  46. Itasca, C. PFC 3D-User Manual; Itasca Consulting Group: Minneapolis, MN, USA, 1999; p. 435. [Google Scholar]
  47. Zhou, Q.; Shen, H.H.; Helenbrook, B.T.; Zhang, H. Scale dependence of direct shear tests. Sci. Bull. 2009, 54, 4337–4348. [Google Scholar] [CrossRef]
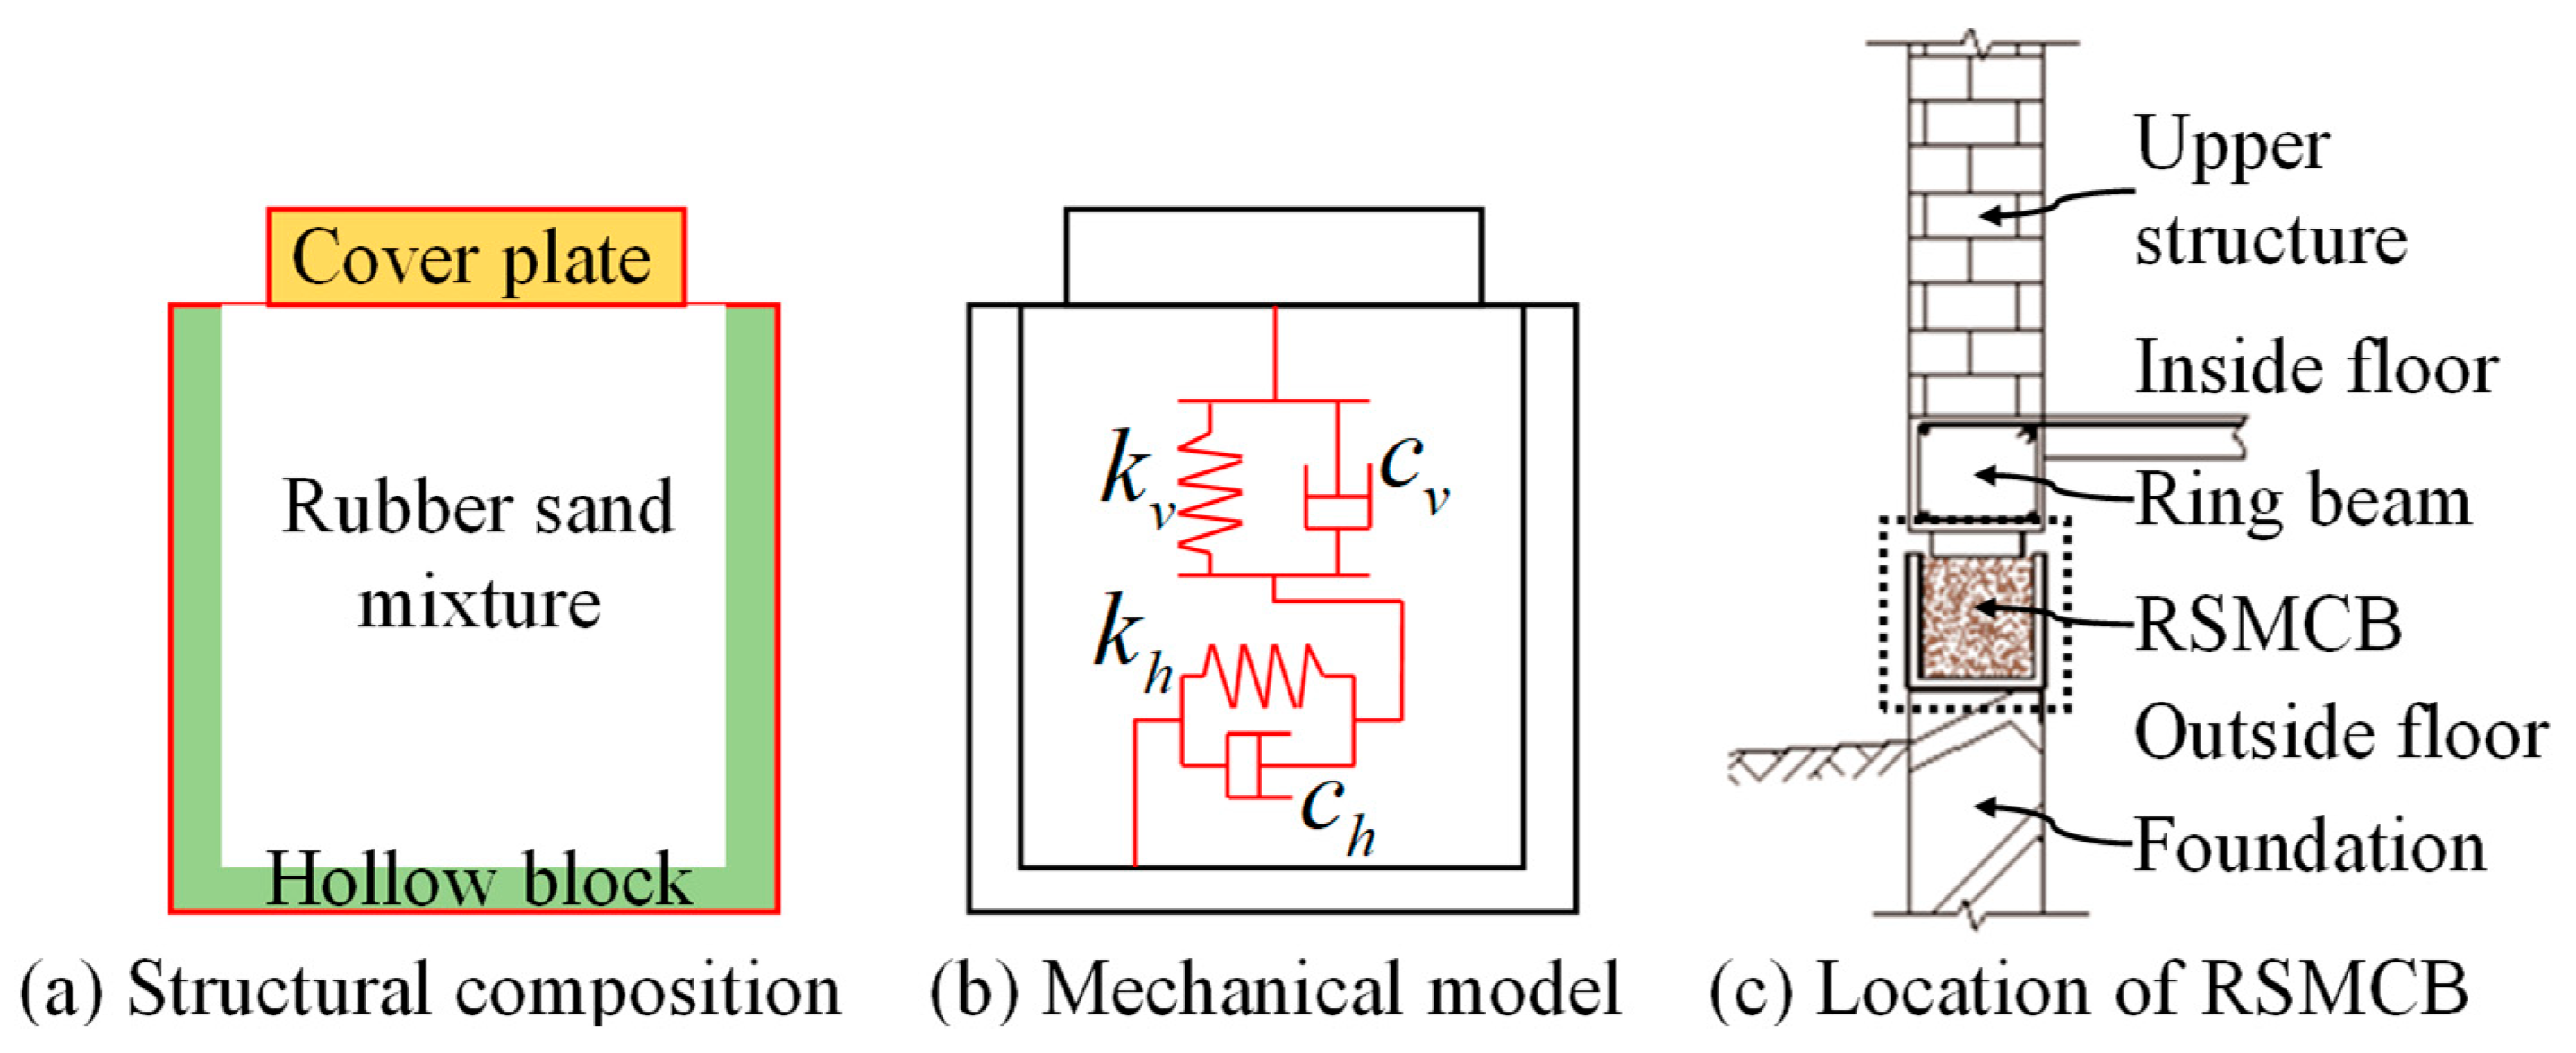
Figure 1. Geometry and layout graphic of RSMCB.
Sustainability 17 08092 g001
Figure 2. Inter-particle linear contact model.
Sustainability 17 08092 g002
Figure 3. Comparison of numerical and laboratory tests: (a) pure sand (b) pure rubber.
Sustainability 17 08092 g003
Figure 4. Grading curves of the two granular materials.
Sustainability 17 08092 g004
Figure 5. Test schematic.
Sustainability 17 08092 g005
Figure 6. Verification and comparison of the vertical bearing capacity of RSMCBs with varying percentages of rubber content.
Sustainability 17 08092 g006
Figure 7. Schematic diagram of RSMCB.
Sustainability 17 08092 g007
Figure 8. Vertical force–displacement curve.
Sustainability 17 08092 g008
Figure 9. Positive normal contact force chain and RSMCB contour.
Sustainability 17 08092 g009
Figure 10. Rose diagram of contact quantity.
Sustainability 17 08092 g010
Figure 11. Particle displacement vector diagram.
Sustainability 17 08092 g011aSustainability 17 08092 g011b
Figure 12. Comparison of the load-bearing capacity of RSMCBs with different rubber contents.
Sustainability 17 08092 g012
Figure 13. Comparison of the load-bearing capacity of RSMCBs with different cover plate forms.
Sustainability 17 08092 g013
Figure 14. Comparison of the load-bearing capacity of RSMCBs with different cover plate dimensions.
Sustainability 17 08092 g014
Figure 15. Comparison of the load-bearing capacity of RSMCBs with different sidewall lengths.
Sustainability 17 08092 g015aSustainability 17 08092 g015b
Figure 16. Schematic diagram of RSMCB modulus.
Sustainability 17 08092 g016
Figure 17. Compressive modulus stress–strain curve of RSM.
Sustainability 17 08092 g017
Figure 18. Theoretical verification of RSMCB bearing capacity.
Sustainability 17 08092 g018aSustainability 17 08092 g018b
Table 1. Key parameter equation of DEM.
Equation ContentApplication ScenarioNo.
e = 2 b h r ¯ 1 M 4 3 π r j 3 / 1 N 4 3 π r j 3 Determining the total particle number to control initial porosity ratio(1)
K n = A E * / L Calculating normal contact stiffness between particles to simulate elastic deformation of RSM(2)
K s = K n / k * Matching tangential deformation characteristics of rubber-sand particles(3)
K s   &   K n   i n h e r i t a n c e = f a l s e Additional conditions of stiffness(4)
A = { π r 2 , 3 D 2 r t , 2 D ( t   =   1 ) R = { R ( 1 ) , b a l l f a c e t min ( R ( 1 ) , R ( 2 ) ) , b a l l b a l l L = { R ( 1 ) , b a l l f a c e t R ( 1 ) + R ( 2 ) , b a l l b a l l A represents the initial cross-sectional area, R denotes the radius of a single particle, and L refers to the spacing between particles.(5)
Where, e is the target porosity ratio, b is the model width, h is the model height, r ¯ is the average radius of all particle elements, and N is the total number of particle elements.
Table 2. Properties of rubber and sand particles.
Experiment
Material
Specific Gravity (Gs)Grain Size (mm)Average Particle Size (D50)Coefficient of Nonuniformity (Cu)
Granulated rubber1.170.6~2.51.521.42
Natural sand2.560~4.80.311.32
Table 3. Discrete element simulation condition.
Rubber
Content (%)
Cover FormCover Dimension (Diameter or Side Length (mm))Cover Sidewall Length (mm)
30, 40, 50Square, Cylindrical, Square straight-cylinder160, 200, 24020, 40, 60, 80, 100, 120, 140, 160, 180, 200, 210, 220, 230
Table 4. Fitting parameters.
Rubber ContentμβABC
30%0.380.501116.620.70.34
40%0.410.43902.627.90.25
50%0.430.35546.211.90.68
Disclaimer/Publisher’s Note: The statements, opinions and data contained in all publications are solely those of the individual author(s) and contributor(s) and not of MDPI and/or the editor(s). MDPI and/or the editor(s) disclaim responsibility for any injury to people or property resulting from any ideas, methods, instructions or products referred to in the content.