Article

Optically Active, Chlorophyll-Based Fluorescent Dye from Calabrian Opuntia ficus-indica Cladodes for Sustainable Applications

1
Consiglio Nazionale delle Ricerche—Istituto di Nanotecnologia (CNR—Nanotec), 87036 Rende, CS, Italy
2
Department of Physics, University of Calabria, 87036 Rende, CS, Italy
*
Author to whom correspondence should be addressed.
Sustainability 2025, 17(16), 7504; https://doi.org/10.3390/su17167504
Submission received: 3 June 2025 / Revised: 18 July 2025 / Accepted: 15 August 2025 / Published: 20 August 2025
(This article belongs to the Special Issue Resource Sustainability: Sustainable Materials and Green Engineering)

Abstract

Using ultrasound-assisted extraction, we obtained a chlorophyll-rich extract from Opuntia ficus-indica cladodes (OFI) characterized through thin-layer chromatography (TLC), Fourier-transform infrared spectroscopy (FTIR), and spectrophotometric absorption analysis. The dye exhibited a strong fluorescence response in the visible range (400–800 nm) with a pronounced red emission when excited with a UV source. Antioxidant ability was evaluated via DPPH assay, showing an IC50 of 185 µg/mL, highlighting its potential for reactive oxygen species scavenging. The extract was incorporated into polymethyl methacrylate (PMMA), polyvinylpyrrolidone (PVP), and polyvinyl alcohol (PVA), leading to fluorescence intensity enhancements of up to 40 times compared to the dye alone depending on matrix polarity, consistent with aggregation and polarity effects. Stability tests confirmed the dye’s resistance to CO2 exposure, pH variations, and prolonged storage, positioning it as a viable alternative to synthetic fluorophores. These findings suggest that the OFI extract provides a functionally relevant, bio-derived dye platform promoting the valorization of agricultural by-products in high-value technological applications, highlighting a circular and scalable approach to developing ecofriendly fluorescent materials, aligning with sustainability and green technology goals.

1. Introduction

The exploitation of crops and agri-food by-products represents a promising strategy to produce advanced materials based on renewable resources and implement a circular economic model. From plant pruning waste or parts of the plant with no intrinsic value, it is possible to separate a variety of molecules such as pigments showing optical characteristics useful in other fields such as sensing [1], biochemical [2], dye-sensitized solar cells [3] or imaging studies [4]. Synthetic fluorescent dyes often raise environmental and health concerns due to their petrochemical origins, toxicity, and limited biodegradability, motivating the exploration of bio-derived alternatives [5,6]. In nature, fruits, flowers, and leaves of plants show various colors from red to purple and contain various natural organic dyes which simple procedures can extract. Organic molecules like Chlorophylls (Chls) and anthocyanin [7], but also indicaxanthin and betacyanins [1], β, β-carotene [2], bixin, and norbixin dyes [3] are examples of natural dyes effectively used as dye sensitizers in solar cells since they play a key role in harvesting sunlight and converting solar energy into electric energy. Natural dyes are well employed in pH-sensitive smart packaging films to monitor food quality [8], in antimicrobial textiles [9], and as organic and non-toxic dyes in the cosmetic industry [10]. Bougainvillea flowers, red turnip, prickly pear fruit juice, black rice, capsicum, rosa xanthina, and kelp are examples of sources from which these remarkable natural dyes can be extracted. From this perspective, plant fluorophores constitute a new material with peculiar spectral properties complementing and overcoming some of the limitations in fluorescent proteins and dyes commonly used in bio-medical and optical application [5,6,11]. Natural dyes such as anthocyanins, betalains, carotenoids, and flavonoids have been extensively explored for their vivid coloration and bioactivity. However, many of these compounds suffer from limited photostability, strong pH-dependent color shifts [11,12,13], and low compatibility with polymeric matrices [9,14,15], which restrict their applications in optoelectronics or anti-counterfeiting materials. In our recent work, we focused on the realization of anticounterfeiting tags using a fluorescent dye extracted from the cladodes of the Opuntia Ficus-indica (OFI) cactus [16]. For its ability to prosper under stressful environmental conditions, OFI is gaining interest across the world. The plant is native to Mexico and has subsequently spread in many world areas [17] including Calabria, where it has established itself as a wild plant and covers an area of more than 50 hectares. OFI is characterized by three components which are flowers, prickly pear fruits and leaves (botanically called cladodes) and it is considered the Cactaceae plant with the greatest economic, social, agronomic, and ecological benefits in the world [18]. This is mostly due to the profitable production of its delicious fruits with color varying from white to green, yellow, orange, red, pink, and purple due to the presence of various pigments that include polyphenols, Chls, carotenoids, and betalains [14,15,18]. Other cactus parts, such as cladodes, have been so far undervalued, being considered as pruning waste to exploit at most for feeding livestock. However, cladodes represent an attractive source for valuable color pigments, like Chls. OFI extracts are distinguished by their complex pigment composition—mostly Chls, carotenoids, and trace betalains—that exhibit synergistic optical responses with extended stability. While betalain-rich extracts typically degrade under heat or light exposure, and anthocyanins are prone to spectral changes under mildly acidic or alkaline conditions, OFI-derived dyes show persistent fluorescence and red emission across a range of pH and storage conditions, particularly when incorporated in polymeric matrices. The literature available on extraction of green color from agri-food waste is limited. Common strategies include solvent-based methods using ethanol, methanol, or acetone, often assisted by ultrasound or mild heating to enhance yield while preserving fluorescence activity [19,20,21]. Recent studies have also explored green extraction techniques [22,23], such as the use of deep eutectic solvents or aqueous micellar systems, to improve sustainability and reduce solvent toxicity [19,21,24,25]. Some works focused on extraction of Chls from spinach leaves [19,21,24], one of the richest and most well-known natural sources [25], and a few have considered agri-food by-products, such as pea pod waste [26] or wormwood [7]. However, traditional sources of Chls, such as spinach leaves and peas, are materials with a certain cost, requiring a significant agricultural input and processing, including high water consumption (in the case of spinach, 150–250 L/kg of fresh leaves) and fertilizer use, making them economically and environmentally unsustainable [27]. These considerations emphasize the importance of identifying novel dye sources that combine strong and stable fluorescence, matrix compatibility, and low-impact extraction protocols, as addressed in the present work [22,23]. The desert-adaptive nature of OFI makes it a low-impact, cost-effective biomass, especially when utilizing underused by-products such as cladodes [17,18]. Compared to other sources like spinach leaves, pea pods, or beetroot juice, OFI cladodes also offer a superior yield of functional pigments per gram of dried biomass, alongside the benefit of waste valorization. The interesting features of OFI—including intrinsic antioxidant activity, high Chl a/b ratio, and structural compatibility—as a natural dye platform merge sustainability, stability, and functional performance. Its application as a functional additive in polymeric matrices for advanced optical technologies remains underexplored. Fluorescent materials are attractive for their potential application in many fields, such as in optical devices and brighteners, photo-oxidants, coatings, chemical and biochemical analyses, solar traps, anti-counterfeiting labels [16], drug tracers, information storage [28], sensing and imaging [11]. Considering our research in the design of advanced materials and the valorization of agri-food waste products, this study aims to establish an efficient protocol from Opuntia ficus-indica cladodes to obtain a natural dye with interesting optical features. A preliminary part of the study consisted of developing a satisfactory qualitative and quantitative characterization of OFI dye. Green spots are observed in the thin layer chromatography (TLC) experiment and UV–Vis analysis is employed to quantify Chls; FTIR is used to detect the typical absorbance of characteristic functional groups, and the antioxidant capacity of the dye is evaluated. Absorbance and fluorescence spectroscopy are used to characterize the strong red emission upon UV excitation. The last part of the study is devoted to exploring the potential application of the OFI dye by addition to polymethylmethacrylate (PMMA), polyvinylpyrrolidone (PVP) and polyvinyl alcohol (PVA) solution. The stability of such OFI–polymeric mixtures is also assessed over time to prove the resistance of fluorescent materials under environmental stressors, and optical parameters of the OFI dye are tested. The results obtained for OFI dye were attractive and reliable over a long period. The extraction of fluorescent dye from OFI cladodes represents a sustainable approach, utilizing agricultural by-products that would otherwise be discarded. This process aligns with principles of circular economy by valorizing waste materials into value-added products. This presents an opportunity to explore the potential of low-cost products with intriguing optical properties, offering promises for various technological applications.

2. Materials and Methods

2.1. OFI Samples and Reagents

Cladodes from autochthonous cultivars of Opuntia ficus-indica (L.) Mill., 2–3 years old, were recovered from wild plantations located in the northern Tyrrhenian area of Calabria, in the period from May to June (see Figure 1a).
Polymer solutions were employed to demonstrate the wide applicability of the fluorescent extract: polymethyl methacrylate (PMMA) (MW ~350,000), poly(vinylpyrrolidone) (PVP) (MW ~340,000) and polyvinyl alcohol (PVA) (MW 85,000–124,000). All polymers used were purchased from Sigma-Aldrich (Milan, Italy). Analytical standards of chlorophyll a and chlorophyll b were purchased from Sigma-Aldrich (Milan, Italy) and a working solution of 20 µg/mL in acetone was prepared. Using standard Chls has only the scope to confirm the qualitative characterization of OFI dye.
All solvents used were of analytical grade, purchased from Sigma-Aldrich (Milan, Italy) and handled under standard laboratory safety protocols.

2.2. Extraction and Preparation of OFI Extract from Cladodes

After collecting, all samples were washed with deionized water and thorns were removed; the green outer part of the cladodes (parenchyma) was peeled off and separated from the inner part (medulla), which was cut in small pieces and homogenized, see Figure 1b. A portion of 50 g was taken and freeze-dried using a Freezone 2.5 model 76530 lyophilizer (Labconco Corp., Kansas City, MO, USA) for 48 h to obtain powder. Firstly, three grams of sample powder were extracted with cold Acetone/Ethanol/H2O 80:10:10 (v/v) mixture until discoloration of the residue. Each extraction was performed using an ultrasonic bath (LBS1 Falc Instruments, Treviglio, BG, Italy) at a 50 KHz constant operating frequency for 15 min, followed by filtration through a Whatman No.1 filter paper. The filtrates were combined and added to petroleum ether in a separatory funnel. After shaking and standing, the ether phase was collected. The washing procedure was repeated until no separation between phases was visible. The phases were combined and evaporated under vacuum at 40 °C. All extractions were performed in triplicate.

2.3. Thin Layer Chromatography (TLC) Separation

Qualitative characterization was performed using the thin layer chromatography (TLC) method. TLC plates were cut from commercially pre-coated TLC sheets (ALUGRAM® Xtra SIL G/UV254, Macherey-Nagel, Duren, Germany). The OFI residue was recovered with 5 mL acetone, transferred in the standard manner, and the plates were eluted in a closed chamber with an eluent phase constituted by 70% hexane/30% acetone. After the run was completed, compounds appeared as spots separated vertically. Each spot has a retention factor (Rf) which is equal to the distance migrated over the total distance covered by the solvent.
The Rf formula is given by the following equation:
R f = d i s t a n c e   t r a v e l e d   b y   s a m p l e d i s t a n c e   t r a v e l e d   b y   s o l v e n t
The Rf value is a parameter to identify a specific compound. Chls standard was used as control.

2.4. Chlorophyll Profiling Through UV–Vis Measurements

Chlorophyll identification was performed by UV–Vis spectrophotometry, following the protocol established by Lichtenthaler and Buschmann [27]. The spectral features were compared with those reported in the literature and further validated using a chlorophyll standard [20,29]. Since the absorbance of the extract is measured in the red region at the wavelengths of both Chl a and b, it is not necessary to separate these two pigments prior to the spectrophotometric measurements. The residue was recovered with 5 mL of pure acetone and absorption spectra of the samples were evaluated using UV-VIS Scanning Spectrophotometer (Shimadzu UV-1800, Shimadzu Corporation, Kyoto, Japan) in a range from 300 to 850 nm. Total Chl content was calculated by using the following equation, considering pure acetone as solvent and the result expressed as µg of total Chl per g of dried matter:
C h l   a = 11.24   A 662 2.04   A 645 C h l   b   = 20.13   A 645 4.19   A 662 T o t a l   c h l o r o p h y l l   ( µ g g o f   d r y   m a t t e r ) = C h l   a + C h l   b × v o l   m a d e   u p w t   o f   s a m p l e × 100
All measurements were performed three times and results were averaged.

2.5. FTIR Analysis

Characterization of functional groups in the OFI dye was evaluated by FTIR analysis. The spectra were collected at room temperature from 4000 to 500 cm−1 with a resolution of 4 cm−1 using a Tensor II FTIR spectrometer (Bruker Optics, Ettlingen, Germany) equipped with a DTGS detector. Each spectrum was averaged over 16 scans and up to three replicates were recorded on independent samples to assess reproducibility. As comparison, FTIR analysis on standard Chls was also performed. Acquisition and analysis were performed with Opus 7.5 software. Spectral data were plotted as Absorbance Vs Wavenumber (cm−1).

2.6. Assay of DPPH Radical Scavenging Activity

Free radical scavenging ability of the extract was tested by DPPH (2,2-Diphenyl-1-picrylhydrazyl) radical scavenging assay, as previously described [13,30]. DPPH produces violet color in ethanol solution and fades to shades of light brown/yellow color in the presence of antioxidants.
Different aliquots of the extract were diluted from a stock solution (12.76 mg/mL) to a fixed volume of ethanol (2 mL). Then, a fixed amount (0.8 mL) of freshly prepared DPPH solution (0.13 mg/mL) was added to the extract solution and stored in the dark for 30 min before UV–Vis experiments. The final concentration of DPPH was 7.5 × 10⁻⁵ M. The spectra were recorded at room temperature with a Cary 100 Biomelt (Agilent, Santa Clara, CA, USA) spectrophotometer. The percentage of inhibition was calculated as follows:
%   inhibition =   A 0 A s A 0 A 1
where A0 is the absorbance at 515 nm of the control, DPPH without antioxidant, As is the absorbance of DPPH + extract and finally A1 corresponds to the absorbance of the sample when 100% of DPPH is reduced (DPPH110). The signals are mediated over 3 independent experiments.

2.7. Optical Characterization of OFI Dye

Absorption measurements were performed using a quartz cuvette and white light source equipped with deuterium and halogen lamp (DH2000, Ocean Optics, Orlando, FL, USA) and integration time of 25 ms.
For all fluorescence measurements, the laser excitation wavelength was fixed at 405 nm with a beam diameter of 3 mm (model LDM405.120.CWA, Omicron-Laserage Laserprodukte GmbH, Rodgau-Dudenhofen, Germany) with a fixed power of 25 mW and integration time of 250 ms.
For both absorption and fluorescence, the spectra are recorded using an optical spectrometer (FLAME, Ocean Optics).
Fluorescence measurements were also performed for both the OFI dye and polymeric solutions enriched with it. With this aim, polymeric solutions of PMMA, PVP and PVA were prepared by dissolving 1 g of polymer in toluene, ethanol, and water, respectively, to a final concentration of 10% w/w. An aliquot of OFI dye in toluene was mixed with the polymer solution to a final concentration of 15% (w/w) of dye in polymer.
The lifetime of the extract was investigated using time/wavelength-resolved spectroscopy with a single pulsed diode laser from Edinburgh Instruments (λex = 405 nm, pulse period = 50 ns) combined with a streak camera setup (C10910-01 + Slow Single Sweep module M10913-01 + CCD ORCA-R, Hamamatsu Photonics, Hamamatsu City, Japan). The wavelength and time ranges were 541–819 nm and 50 ns, with corresponding resolutions of 0.414 nm and 0.0978 ns, respectively.
The streak image provides a 2D representation of the fluorescence decay over time which is analyzed using a script implemented into the commercial software MATLAB R2023a (The MathWorks Inc., Natick, MA, USA). We first found the wavelength at which the maximum emission occurs, then performed an exponential decay fitting.
A pH meter (Multi Meter MM41, Crison Instruments, Barcelona, Spain), calibrated with pH 4.01, 7.00 and 9.21 buffer solutions, was used to control pH values during stability studies of fluorescent materials.

2.8. Characterization by Scanning Electron Microscopy

The morphology properties of the OFI powder were analyzed using a Scanning Electron Microscope (Quanta FEG 400F, Fei Company, Hillesboro, OR, USA). Before the analysis, the samples were fixed on an aluminum specimen holder with carbon tape and then sputter-coated with graphite. Views of the OFI section samples were taken to obtain micrographs.
The conditions of the analysis were high vacuum, 15 KV electron acceleration voltage, and secondary electron mode.

3. Results and Discussion

3.1. Extraction and Preparation of OFI Dye from Cladodes

Agri-food materials are complex matrices comprising a variety of molecules, metabolites as well as several other co-extracted compounds that could interfere in qualitative analysis [31,32]. In case of cladodes, water, carbohydrates, and proteins are the main chemical components. For our study, we have chosen more mature leaves (see Figure 1a) to ensure reduced interference deriving from protein content, which is higher in young cladodes due to their greater metabolic activity. The carbohydrates, with structural and storing functions, were removed by cutting out the internal part of the cladodes, the medulla, also allowing elimination of fibers contribution; water was eliminated through lyophilization. The lyophilization reduced the weight of the sample to 13.4 ± 0.5% with respect to the fresh weight. The powder obtained after the lyophilization process (Figure 1b) was observed using a scanning electron microscope (SEM) which evidenced the modifications that the treated sample had undergone: the effectiveness of the extraction process was confirmed by the residue being completely colorless, as shown in Figure 1d. The inner tissue, called chlorenchyma, consists of green plastids—containing fluorescent molecules—observable before the extraction and when exhaustively removed at the end, as shown in Figure 1c,e, respectively.
The separation step with petroleum ether allowed us to obtain the most apolar portion in the overlying phase, rich in green Chls, as shown in Figure 1f. The residue obtained from the extraction of OFI cladodes was 5.3 ± 0.3% per gram of dried matter. Chls content in OFI dye was quantified by UV absorption. Chl exists in two forms, a and b, but biological and functional properties are usually referred to Chls without distinction between a and b because they are generally present at the same time acting synergistically; on this basis, there is no need to separate the two forms for the purpose of the present study. In the text, we will refer generically to Chls.

3.2. Qualitative Characterization of OFI Dye

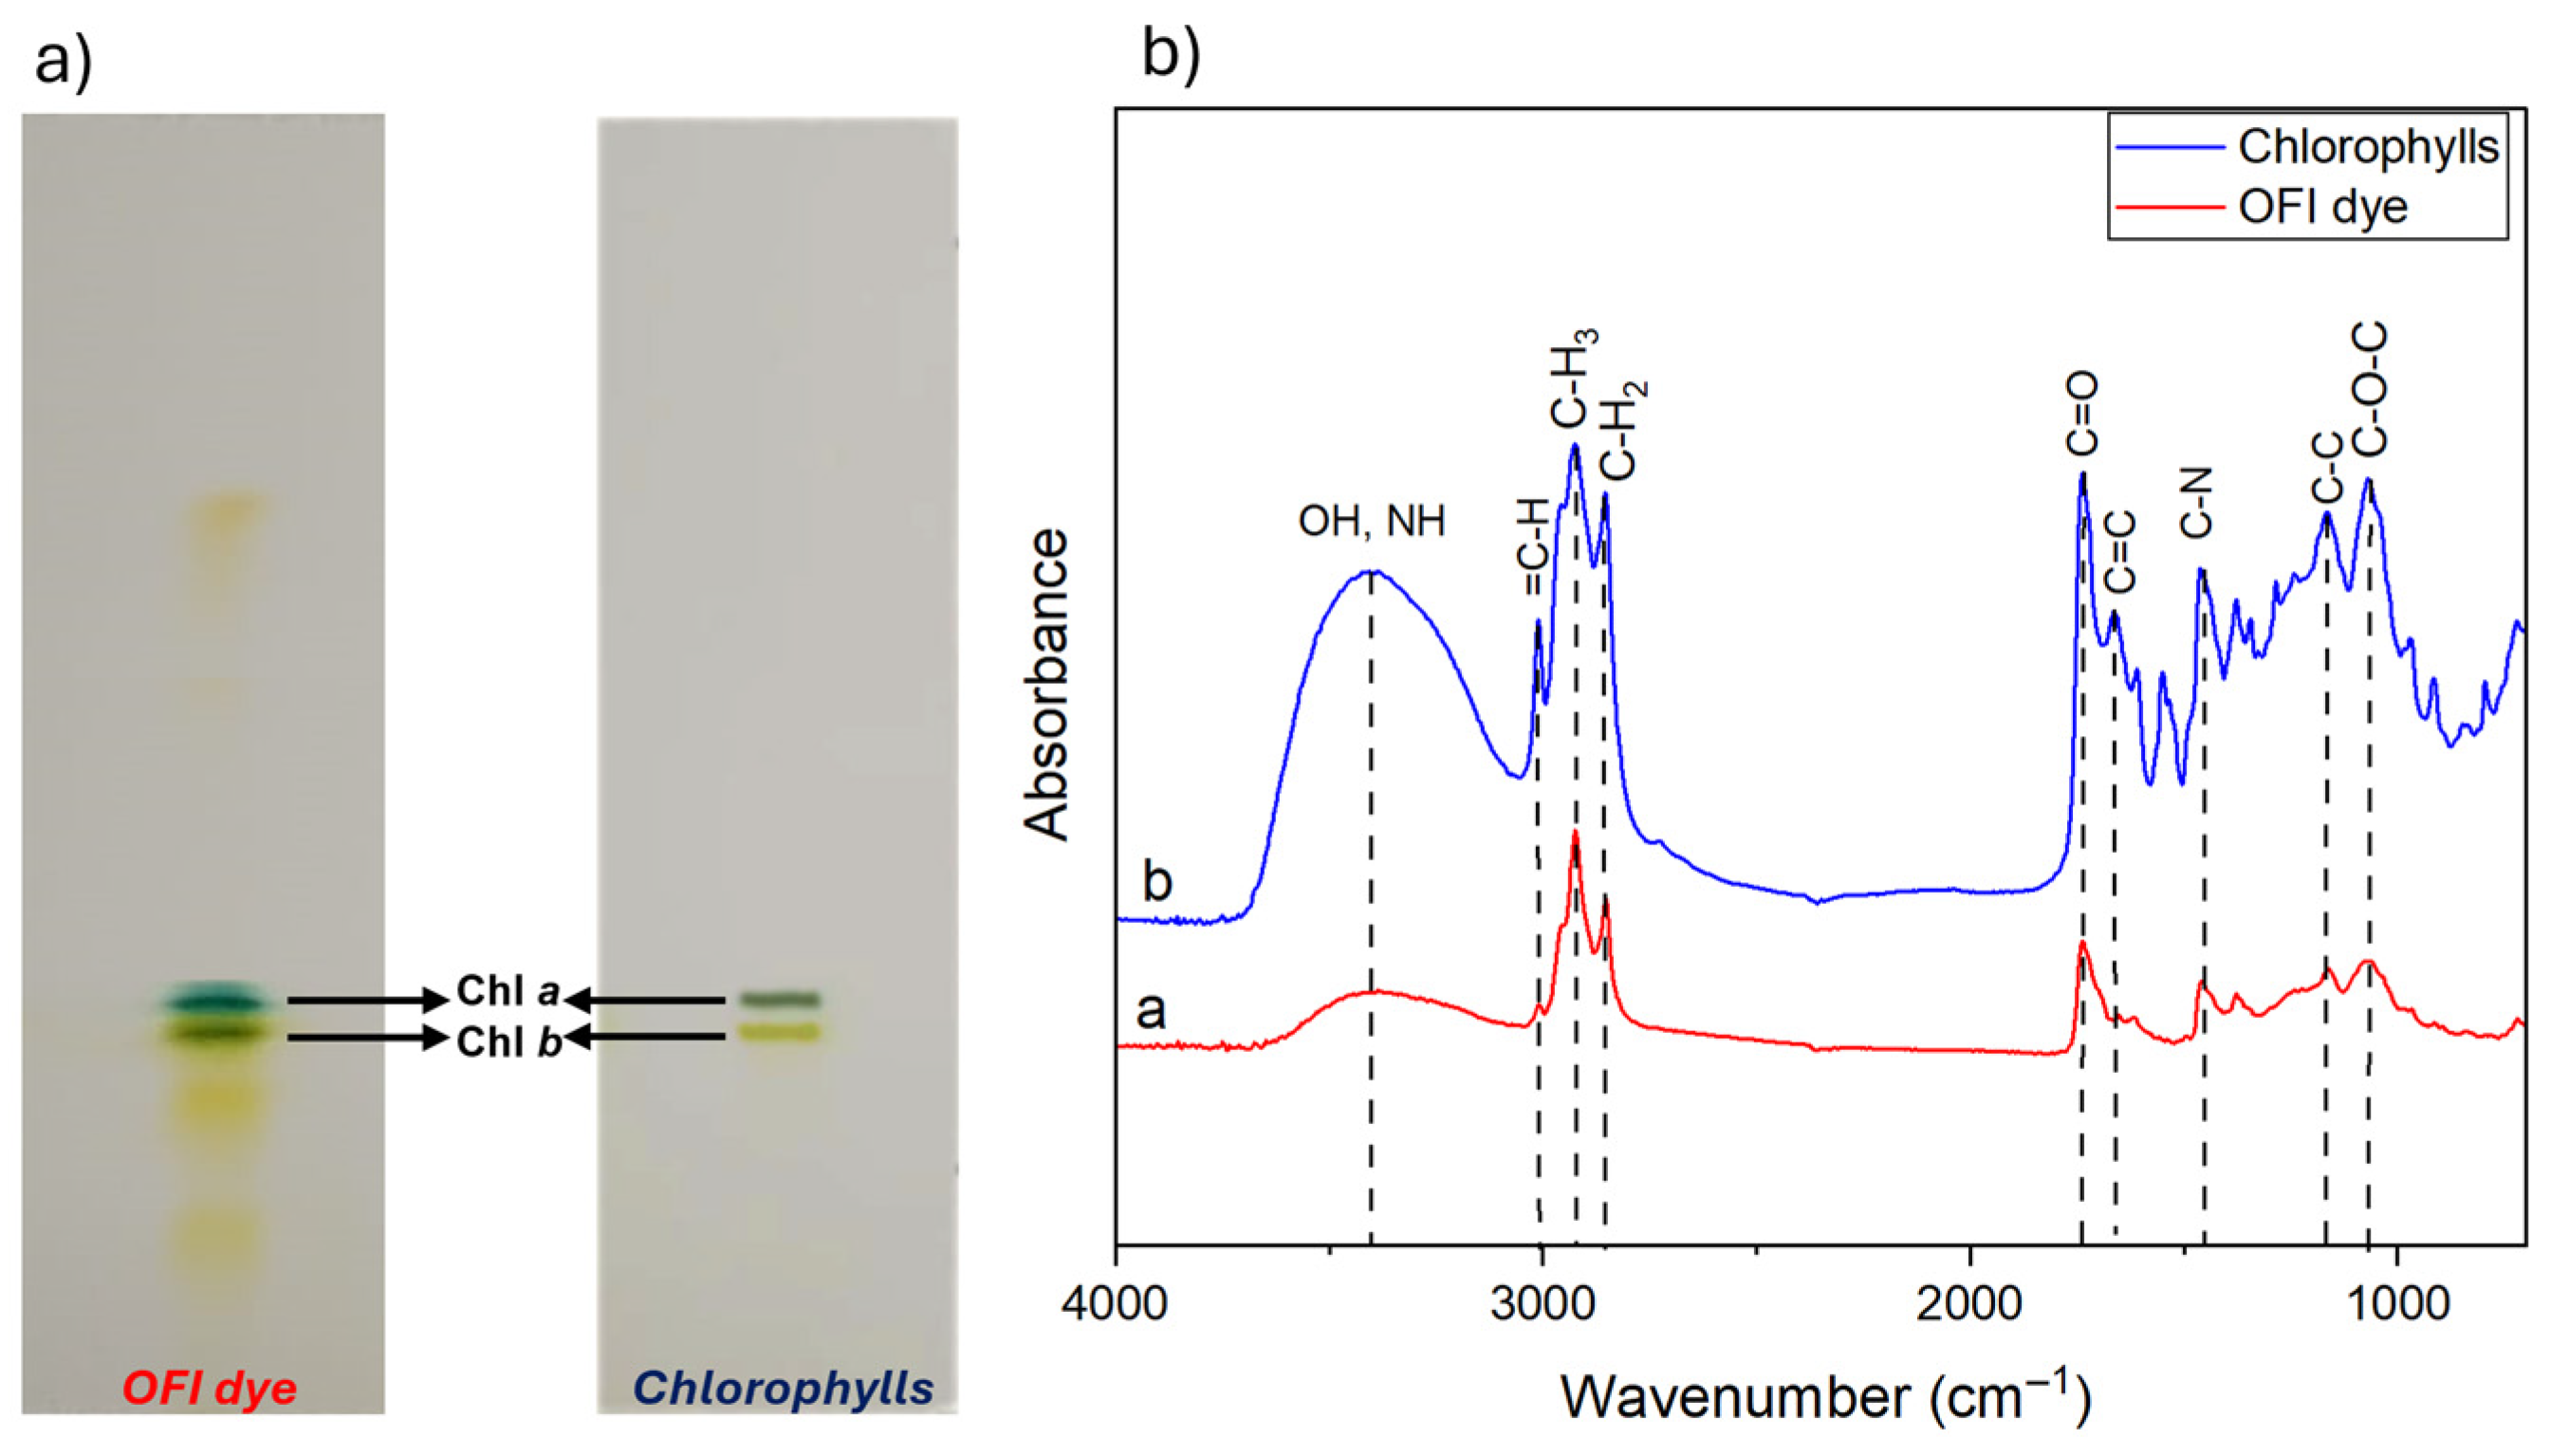
The OFI extract was evaluated using the TLC technique which allowed us to discriminate its components (see Materials and Methods for more details). Figure 2a reports the results for OFI dye and standard Chls which were used as reference. The green spots with retention factor (Rf) values of 0.37 and 0.45, using n-hexane/acetone (7:3) as an eluent phase, indicate the proper Rf for Chl b and a [24,27], respectively.
It is worth noting that the elution solvent system that we used allows a good resolution between Chl a and b, and no degradation products of Chls were visible after the extraction procedure. In addition to the characteristic green bands of Chl a and b, a less intense yellow band with lower Rf was detected. Based on its retention behavior and chromatic profile under the applied eluent system, this spot is consistent with xanthophylls, as similarly reported by Quach et al., who observed a comparable band with Rf ≈ 0.16, preceding both Chls during TLC of spinach pigments using analogous mobile phases [24].
The OFI extract was also evaluated by FTIR analysis to investigate the functional groups and further confirms the TLC data; the spectra of OFI extract and standard Chls are compared in Figure 2b. The structural characterization was performed in the spectral range between 4000 and 500 cm−1. Different functional groups were detected for OFI dye and identified based on the peaks obtained for standard Chls, as shown in Figure 2b. The broad peak at 3500 cm−1 indicates the presence of single bond stretching of OH, NH, CH groups while peaks around 3000 cm−1 correspond to symmetric and asymmetric stretching vibration of methylene (CH2) and methyl (CH3) groups. Other molecular interactions are identified as C=O stretching vibration at 1733 cm−1, C=C stretching vibration at 1660 cm−1, C-N stretching vibration of porphyrin ring at 1450 cm−1, a C-C stretching vibration at 1160 cm−1 and C-O-C stretching vibration at 1070 cm−1. The presence of these functional groups—methyl, aldehyde, and hydroxyl—is typical of Chls, as is well described in the literature [26,33].

3.3. Chlorophyll Profiling Through UV–Vis Measurements

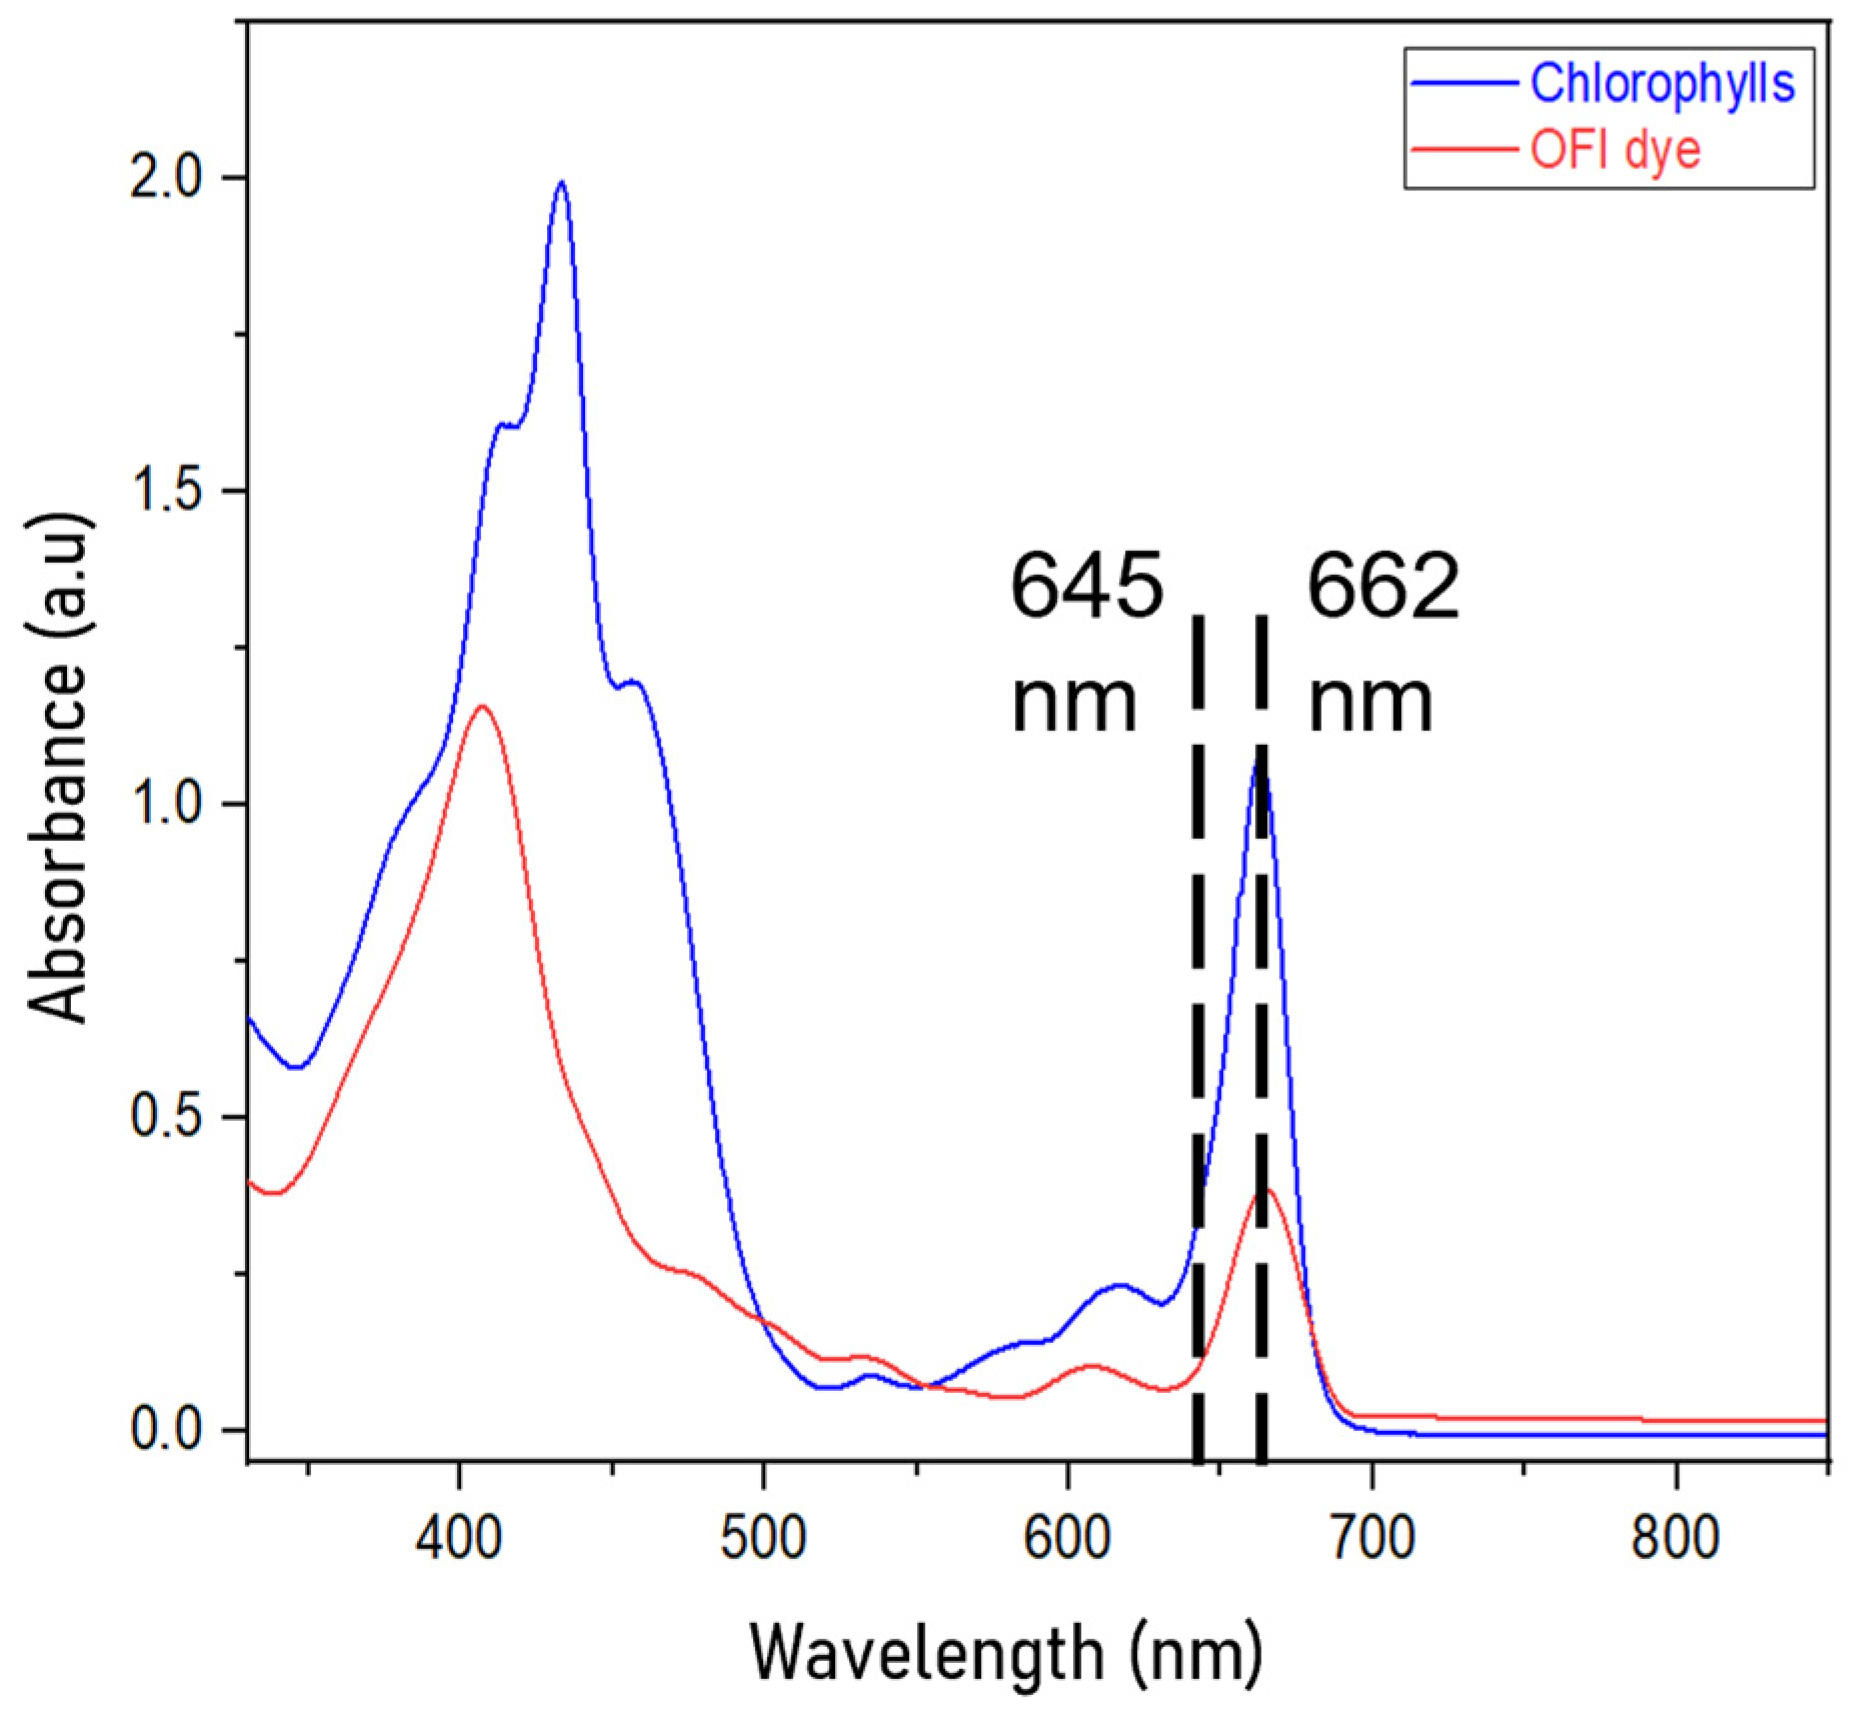
Figure 3 shows the absorption spectra of OFI dye and standard Chls in acetone, obtained by UV-VIS spectroscopy.
The UV–Vis absorption spectra of OFI extract exhibit characteristic bands attributable to Chl a and b, including Qy and Soret bands. Though not explicitly identified, TLC results further support the compositional complexity as the presence of co-extracted pigments such as carotenoids. Using Equation (2) (see Materials and Methods section), the total Chls content of OFI extract was determined to be 596.5 ± 1.2 µg/g of dried matter, with Chl a contributing 468.9 µg/g and Chl b contributing 128.2 µg/g. To enable a direct comparison, the same extraction procedure was performed on dried spinach leaves, which yielded a total chlorophyll content of 999.73 µg/g of dry matter, with 750.29 µg/g of Chl a and 249.44 µg/g of Chl b. A key distinction between the two sources lies in their chlorophyll a/b ratio. The OFI extract exhibited a significantly higher a/b ratio of 3.7, compared to 2.9 in spinach, indicating a greater concentration of Chl a in OFI dye [34]. This characteristic is particularly advantageous for optical applications, as Chl a is more efficient in photonic processes due to its broader absorption range and higher fluorescence quantum yield.
Beyond its photophysical advantages, OFI cladodes offer significant sustainability and economic benefits. Unlike spinach, which requires intensive agricultural inputs, including 150–250 L of water per kilogram of fresh leaves, fertilization, and controlled growing conditions, OFI thrives in semi-arid environments with minimal cultivation requirements. Furthermore, OFI cladodes are agricultural by-products of cactus farming, as the cactus is primarily cultivated for fruit production and animal fodder. This valorization of agricultural waste presents an economically viable and environmentally sustainable alternative to traditional chlorophyll sources.
To ensure consistency in the extraction process and accurate comparison of Chl a and Chl b levels, values reported in the literature for other plant sources were considered. Pea pod waste (Pisum sativum) contains total chlorophyll levels ranging from 220 to 626 µg/g of dried matter, while fresh spinach leaves (Spinacia oleracea) typically yield 242.8 to 257.6 µg/g. Similar chlorophyll contents (244.6–303.0 µg/g) have been observed in Brassica campestris, Brassica rapa, Brassica juncea, and Malva neglecta [26]. The total chlorophyll yield from OFI dye aligns with these plant-based sources, although its higher Chl a/b ratio (3.7) and cost-free availability make it particularly promising for fluorescence-based optical applications.

3.4. In Vitro Antioxidant Activity of OFI Extract

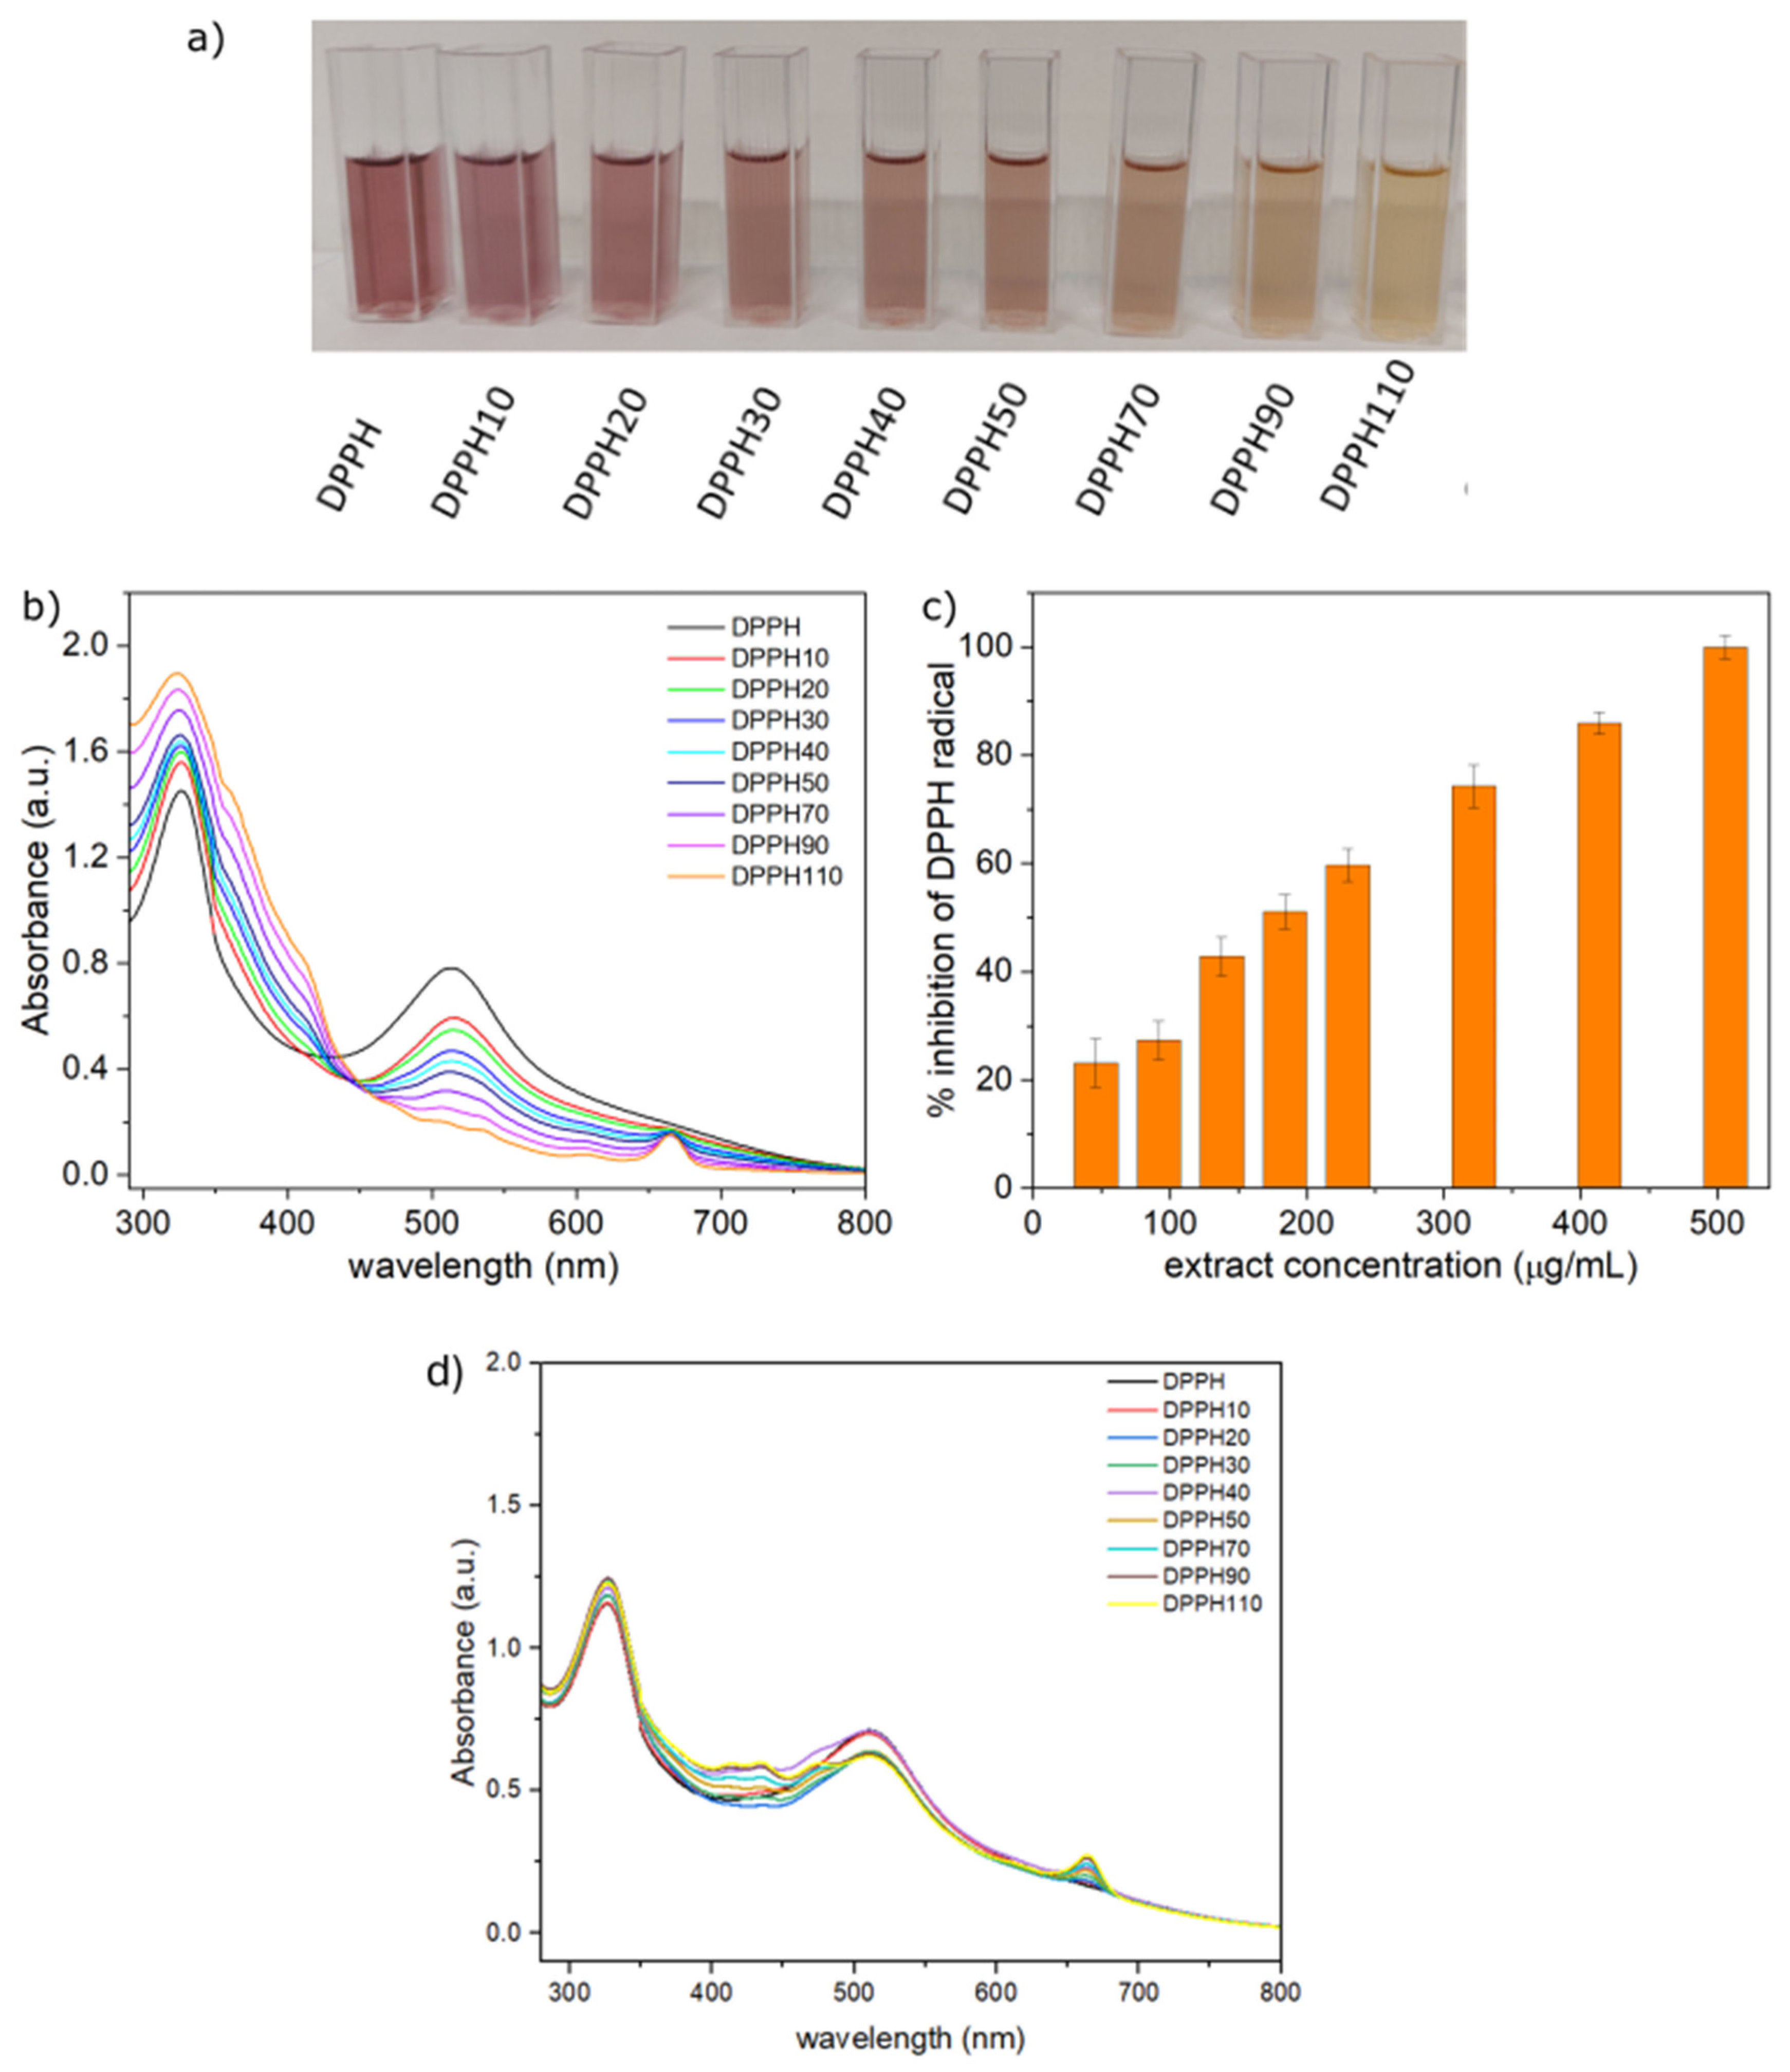
The antioxidant activity of a molecular compound indicates its ability to mitigate oxidative deterioration, which is crucial for enhancing material stability and potential technological applications. The results obtained for OFI dye are presented in Figure 4a–c while Figure 4d reports the results for spinach, for comparison.
The radical scavenging ability of OFI dye was evaluated using the DPPH assay, a widely used method for assessing antioxidant activity. Figure 4a visually illustrates the progressive decolorization of DPPH solution with increasing concentrations of OFI dye (from 46 to 506 µg/mL in ethanol). This fading from deep violet to light brown indicates the reduction of DPPH radicals upon interaction with hydrogen-donor compounds present in the extract. The UV–Vis spectra (Figure 4b) confirm this trend, showing two bands at 515 and at 306 nm corresponding to π → π* electronic transitions, with a major contribution from the unpaired electron at 515 nm [35]. Upon increasing concentrations of OFI dye, the absorbance at 515 nm progressively decreases, indicating radical quenching, while a narrow band at 675 nm appears at concentrations ≥ 92 µg/mL (DPPH20) due to Chls absorption. The DPPH radical scavenging activity was quantified in terms of % inhibition, calculated as reported in the Materials and Methods section (Equation (3)), from absorbance measurements at 515 nm, and plotted against extract concentration (Figure 4c). The results reveal a dose-dependent antioxidant activity, with an IC50 of approximately 185 µg/mL, indicating the dye concentration required to reduce 50% of the DPPH radical.
Although the antioxidant activity of OFI dye is lower compared to polyphenols, this could be attributed to both chemical instability [30] and a different antioxidative mechanism. Unlike polyphenols, which act as direct hydrogen donors, Chls are believed to function by preventing hydroperoxide [21] decomposition rather than directly neutralizing free radicals. The intact porphyrin ring structure appears to be essential for its antioxidative properties. A key factor contributing to the antioxidant potential of OFI dye is its high Chls a/b ratio (3.7), which is significantly greater than that of spinach extract (2.9). Chl a has been reported to exhibit stronger antioxidant potential than Chl b due to its greater electron delocalization and efficiency in quenching reactive oxygen species. The higher Chl a/b ratio in OFI (3.7) compared to spinach (2.93) suggests a greater contribution of Chl a to antioxidant activity, potentially enhancing its radical scavenging ability [21]. For comparative purposes, Figure 4d presents DPPH radical scavenging data obtained for spinach extract, highlighting differences in antioxidant performance. Spinach extract shows only limited DPPH scavenging ability, suggesting that it is less effective in neutralizing free radicals compared to OFI dye. The difference in chlorophyll composition (Chl a/b ratio) may play a role, but other chemical constituents in OFI dye could also be contributing to its superior antioxidant potential. The extract exhibited notable DPPH radical scavenging activity, confirming its antioxidant potential.
Although only the DPPH assay was performed in this study, this method was selected for its robustness and sensitivity in detecting radical scavenging activity of dye-rich extracts.

3.5. Optical Properties of OFI Dye

Optical properties of OFI dye were studied at three different concentrations: 0.01 mg/mL, 0.05 mg/mL, and 0.1 mg/mL of dye in toluene, and results were compared with standard Chls at the same concentrations.
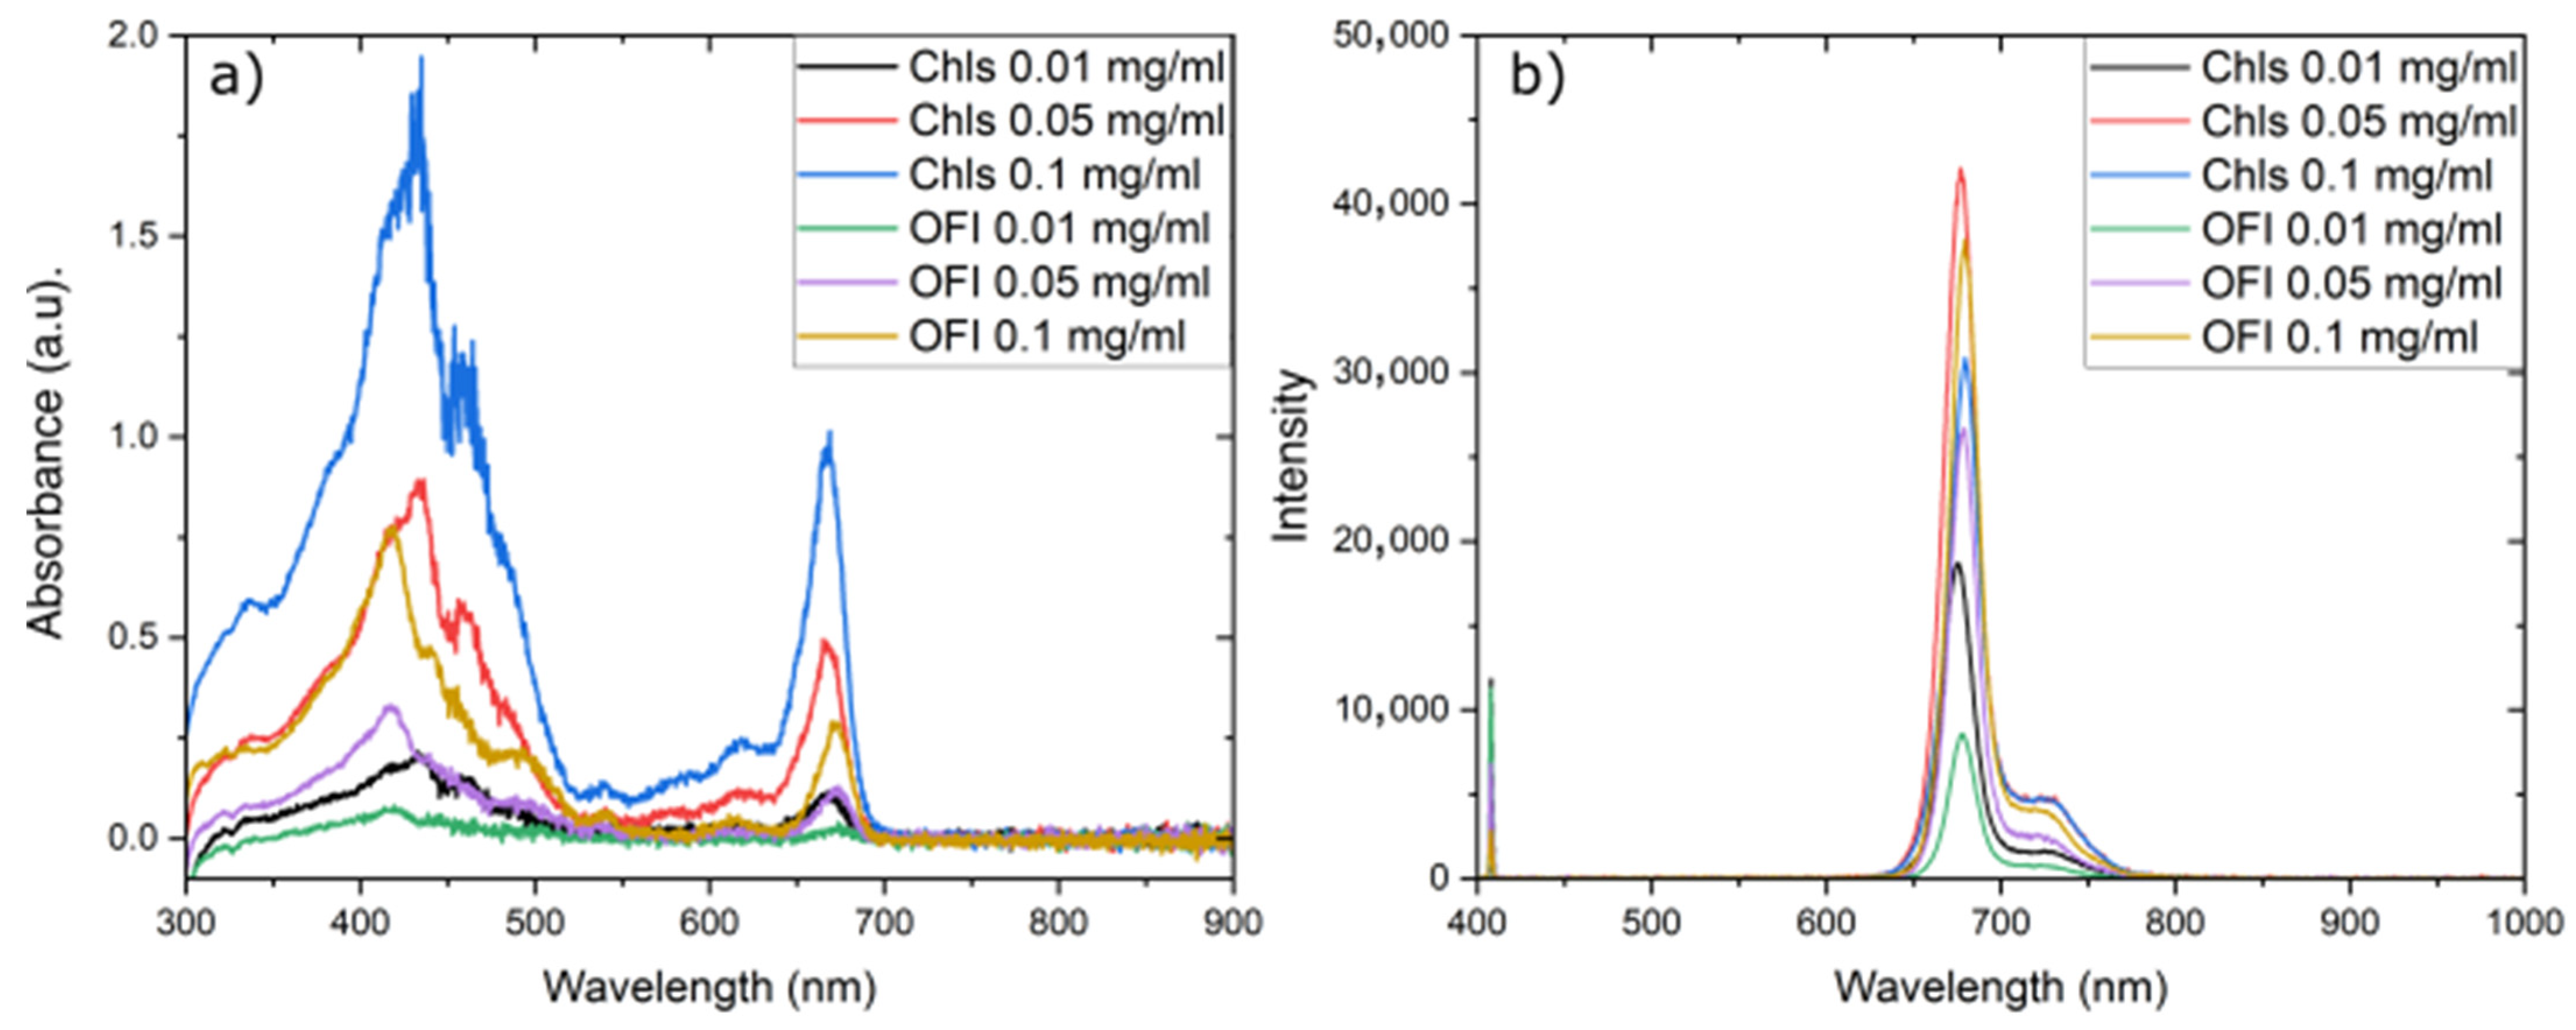
The absorption and fluorescence emission spectra are presented in Figure 5. Please refer to the Materials and Methods Section for experimental conditions. The absorption spectrum confirms the presence of two main peaks centered at 420 nm and 670 nm for both Chls and OFI extract, which increase with concentration, as shown in Figure 5a.
Regarding the emission spectra for Chls and OFI dye solutions, upon excitation at 405 nm, the fluorescence was strongly observed in the red spectral region with a distinct bimodal emission with maxima at 675–685 nm, corresponding to the monomeric form, and 720–730 nm, assigned to the first vibronic (0–1) replica of the Qy transition in monomeric Chls [13,31,36] (see Figure 5b).
For Chl a at a concentration of 0.1 mg/mL (blue line) the emission is lower than that at 0.05 mg/mL due to inner filter effects at high concentration rather than to pigment aggregation, as the spectral shape remains unaltered. This phenomenon is not observed in the OFI dye, where the emission increases with the concentration used, as depicted in Figure 5b.
The quantum yield (QY) of OFI dye is calculated by using the following equation:
Q Y O F I = A b s @ 405 n m O F I A b s @ 405 n m C h l s × E m i s s i o n   I n t e g r a l O F I E m i s s i o n   I n t e g r a l C h l s × Q Y C h l s
To minimize self-absorption and inner-filter effects, emission intensity comparisons were primarily conducted at 0.01 mg/mL and 0.05 mg/mL, where absorbance remained below 0.3 at excitation wavelength. The latter provides a representative QY value for the OFI extract by considering multiple measurements at different concentrations, ensuring reproducibility, and reducing variability due to environmental factors. To determine the emission integral, we integrated each emission spectrum in the interval 600–800 nm for OFI and Chls solutions. The QY of Chls depend on the presence of type a and b, and are 0.25 and 0.1, respectively [37]. Given that the OFI extract contains a mixture of Chl a and b, we adopted a practical approach by considering their respective QY values and taking a weighted estimation; therefore, we used as QYChls their average, namely 0.175. By taking in consideration the mentioned value, the QY calculated for OFI extraction is 0.022. To further increase the scientific rigor, we calculated the QY of OFI also by considering the presence of only Chls a or b. In the case of QYChls = 0.1, namely presence of only Chls a, the QYOFI is equal to 0.013 while for QYChls = 0.25, presence of only Chls b, the QYOFI is equal to 0.032.
To further investigate the emission properties, the lifetime of OFI dye was investigated by time/wavelength resolved spectroscopy by using a streak camera setup (see Materials and Methods for details). The streak image, shown in Figure 6a, gives information on the dependence of the decay time with the wavelength. It is clearly visible that the decay time resembles the emission spectra according to the energy gap law. The observed correlation between maximum emission wavelength and maximum decay time is primarily due to the optimized balance between radiative and non-radiative decay processes at this wavelength.
For retrieving the lifetime, we used a single exponential decay with a function that can be defined as follows:
I ( t ) = I 0   e x p ( t / τ )
where I0 is the initial intensity, t is the time from excitation and τ is the time it takes the intensity to decrease to 1/e (=0.368) of its initial value. The lifetime (τ) is retrieved at the wavelength where the maximum emission occurs (λmax = 685 nm) and it is equal to 6.0174 ns with an R2 value of 0.99899 (see Figure 6b). By using the same procedure, we retrieved the lifetime at the maximum wavelength of the secondary peak, namely at 725 nm. The retrieved lifetime (τ) is 6.396749 ns with an R-squared value of 0.996206, see Figure 6c. While the TLC data indicate the presence of both Chls a and b, our fluorescence lifetime decay analysis primarily reflects the dominant emissive species under our experimental conditions.
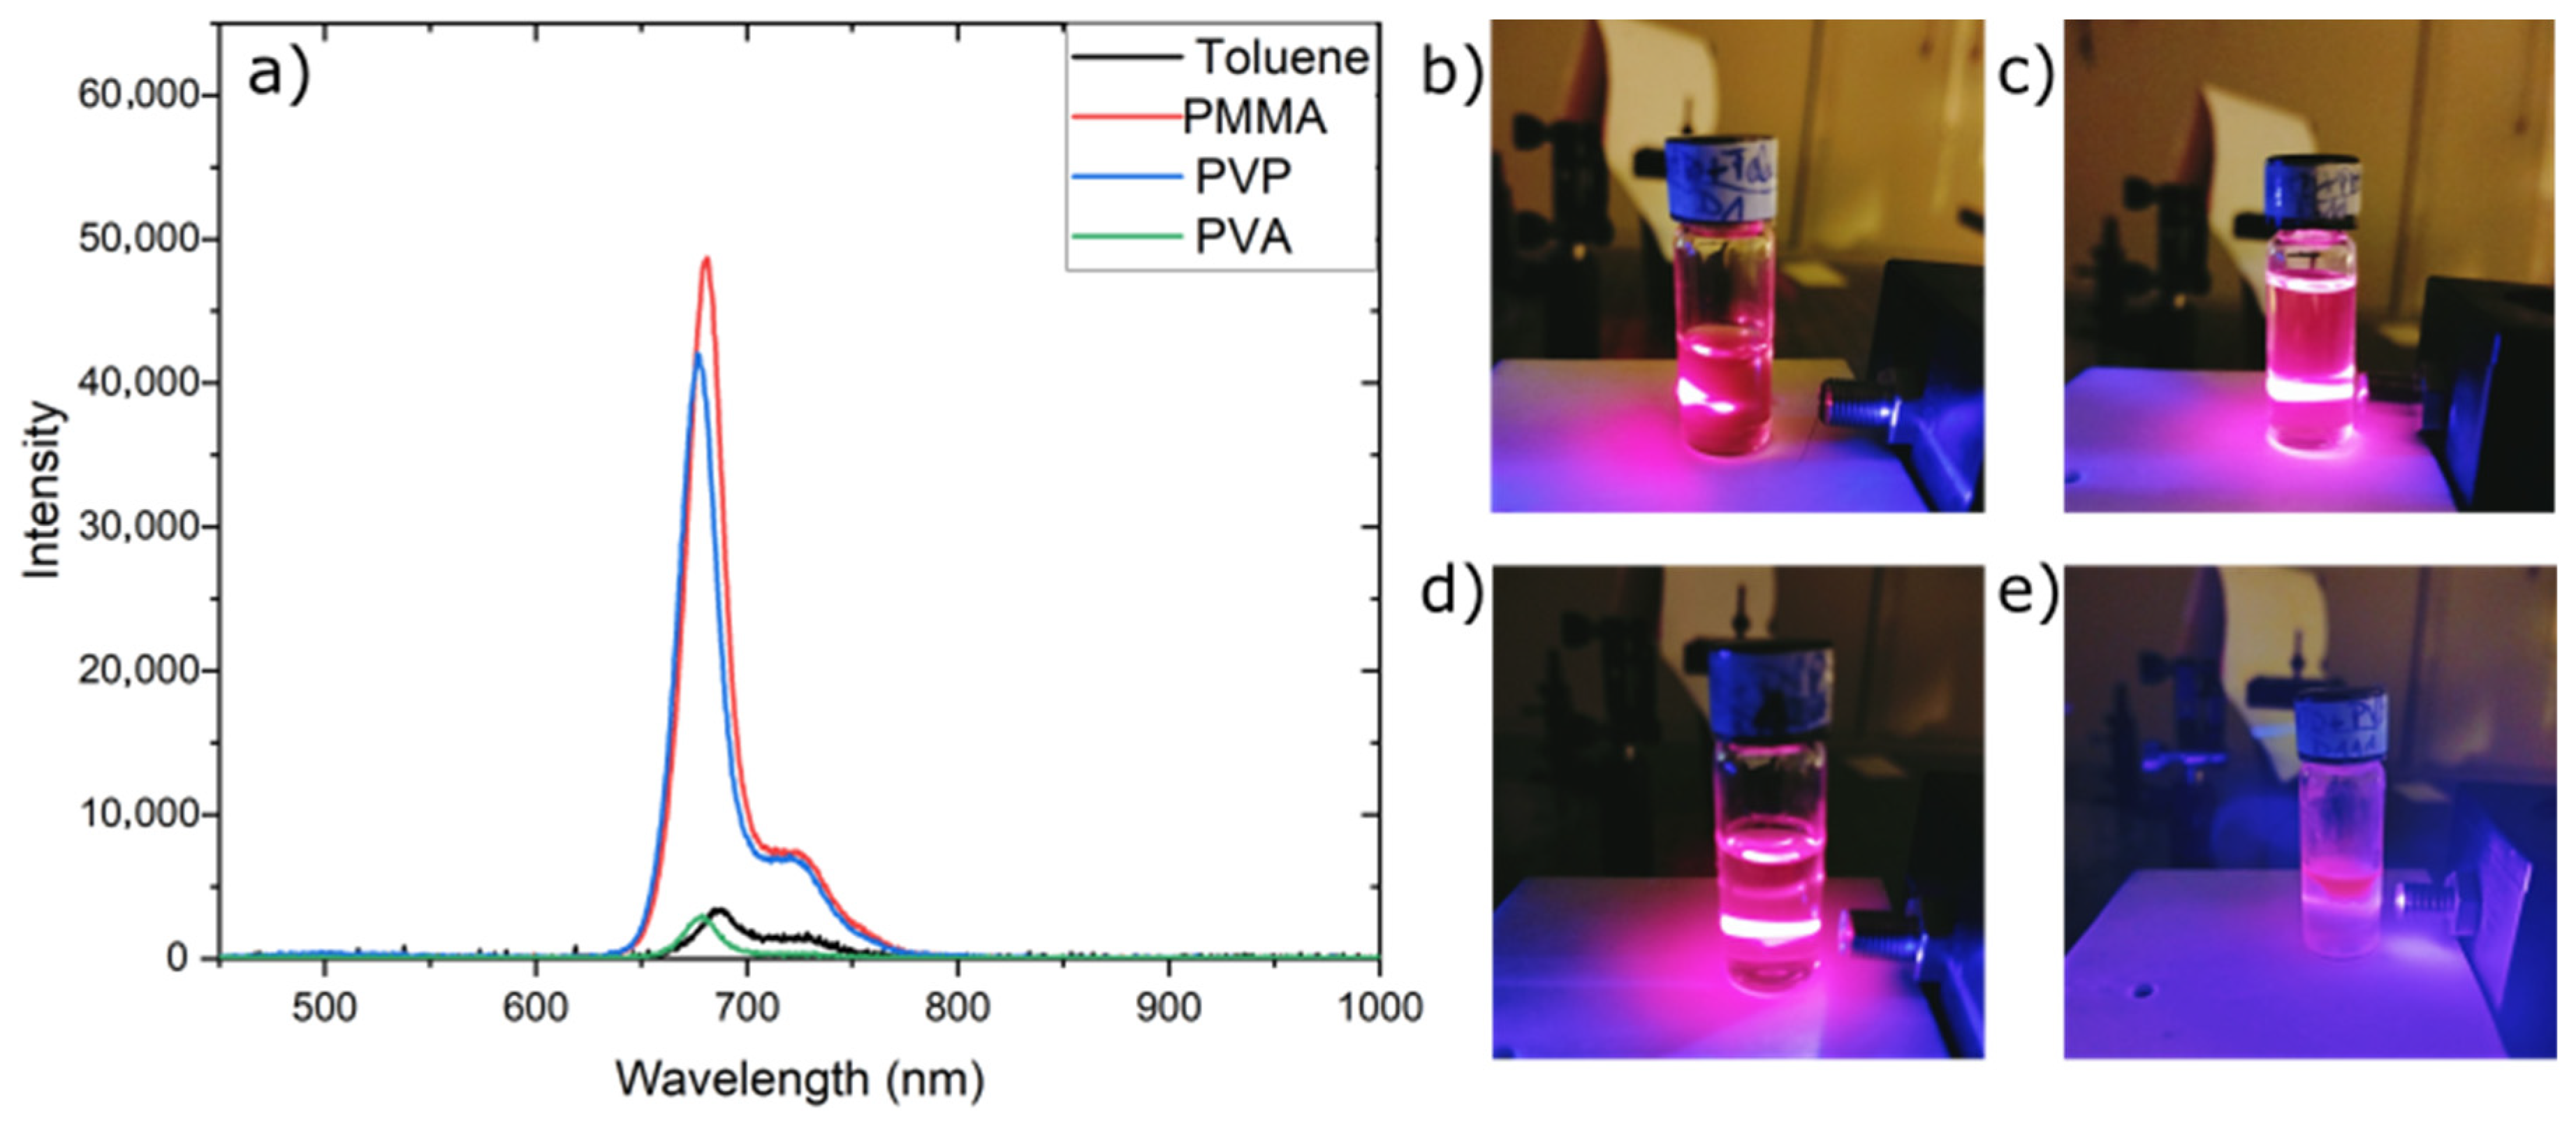
The reliability and the multipurpose capability of the OFI dye were demonstrated by mixing it with toluene and with different polymers, such as PMMA, PVP, and PVA to a final concentration of 15% w/w (see Materials and Methods Section for further details). The solutions were excited at a wavelength of 405 nm and the resulting fluorescent emission was recorded.
Fluorescence intensity was significantly affected by the solvation environment, which included solvent polarity, dispersion forces, and hydrogen bonding capacity [38]. The Hildebrand parameter provided a measure of solvent cohesive energy, which influenced solute–solvent interactions and dye photophysical properties [39]. The fluorescence intensity of the OFI dye varied significantly based on the polarity, hydrogen bonding, Hildebrand parameter, and dielectric constants of the solvents and polymer matrices used [38,40,41]. Toluene, a nonpolar solvent with a low Hildebrand parameter [42], showed low intensity due to dye aggregation in a nonpolar environment. Among the polymers, PMMA shows moderate polarity with a balanced Hildebrand parameter [42] that contributed to the stabilization of the dye’s excited state, thereby enhancing radiative decay processes, and resulting in increased fluorescence intensity [43]; its low cohesive energy density disfavors excitonic coupling between Chl macrocycles, thereby limiting concentration-induced quenching. PVP, with a higher Hildebrand parameter and stronger hydrogen bonding, showed slightly lower intensity due to moderate aggregation. The polymer was characterized by a slightly higher polarity relative to PMMA, which may lead to a less favorable stabilization of the OFI dye’s excited state. Consequently, this resulted in a reduction of emission intensity when compared to dye in PMMA. PVA, the most polar matrix with the highest Hildebrand parameter [42] and strong hydrogen bonding, promoted dye aggregation, leading to significant fluorescence quenching. These characteristics may facilitate the quenching of fluorescence by promoting non-radiative decay pathways, where energy was lost through vibrational or rotational modes rather than emitted as light [12]. The fluorescence emission spectra of the OFI dye mixed with PMMA, PVP, and PVA exhibit markedly distinct intensity profiles, as illustrated in Figure 7a.
The primary peak, at approximately 670 nm, corresponded to Chl a while the secondary peak around 720 nm was associated with Chl b, and likely corresponded to aggregated states of the dye [44]. As shown in Figure 7a, at 670 nm, PMMA (red line) showed the highest intensity, indicating effective stabilization of the dye in its monomeric form, PVP (blue line) exhibited slightly lower intensity due to moderate fluorescence quenching, while PVA (green line) showed the lowest intensity, attributed to stronger interactions leading to aggregation [38]. Monomeric states were recognized for exhibiting higher fluorescence intensity than their aggregated counterparts, which often experience enhanced intermolecular interactions that inhibit effective light emission. Conversely, the hydrophilic properties coupled with hydrogen bonding in both PVP and PVA may contribute to increased aggregation of the dye molecules within these matrices. Such aggregation was likely to lead to fluorescence quenching or a redshift in emission wavelength, which ultimately diminished overall fluorescence brightness. The visual data presented in Figure 7b–e corroborated these spectral observations, showing that the brightness of each solution, under λex at 405 nm, is consistent with the recorded intensity measurements.
Similar studies on Chls–polymer hybrids have demonstrated fluorescence enhancements ranging from 5 to 20 in PVP films and up to 10 in PMMA matrices [45]. These findings align with our results, where the integration of OFI dye into PMMA, PVP, and PVA led to fluorescence intensity improvements of up to 40, highlighting the role of polymer–dye interactions in modulating optical properties.
These findings underscored the significant role of the surrounding polymeric matrix in determining the fluorescence properties of dyes, emphasizing implications for the optimization of materials intended for advanced applications in optical sensors and photonic devices.

3.6. Stability of Fluorescent Materials

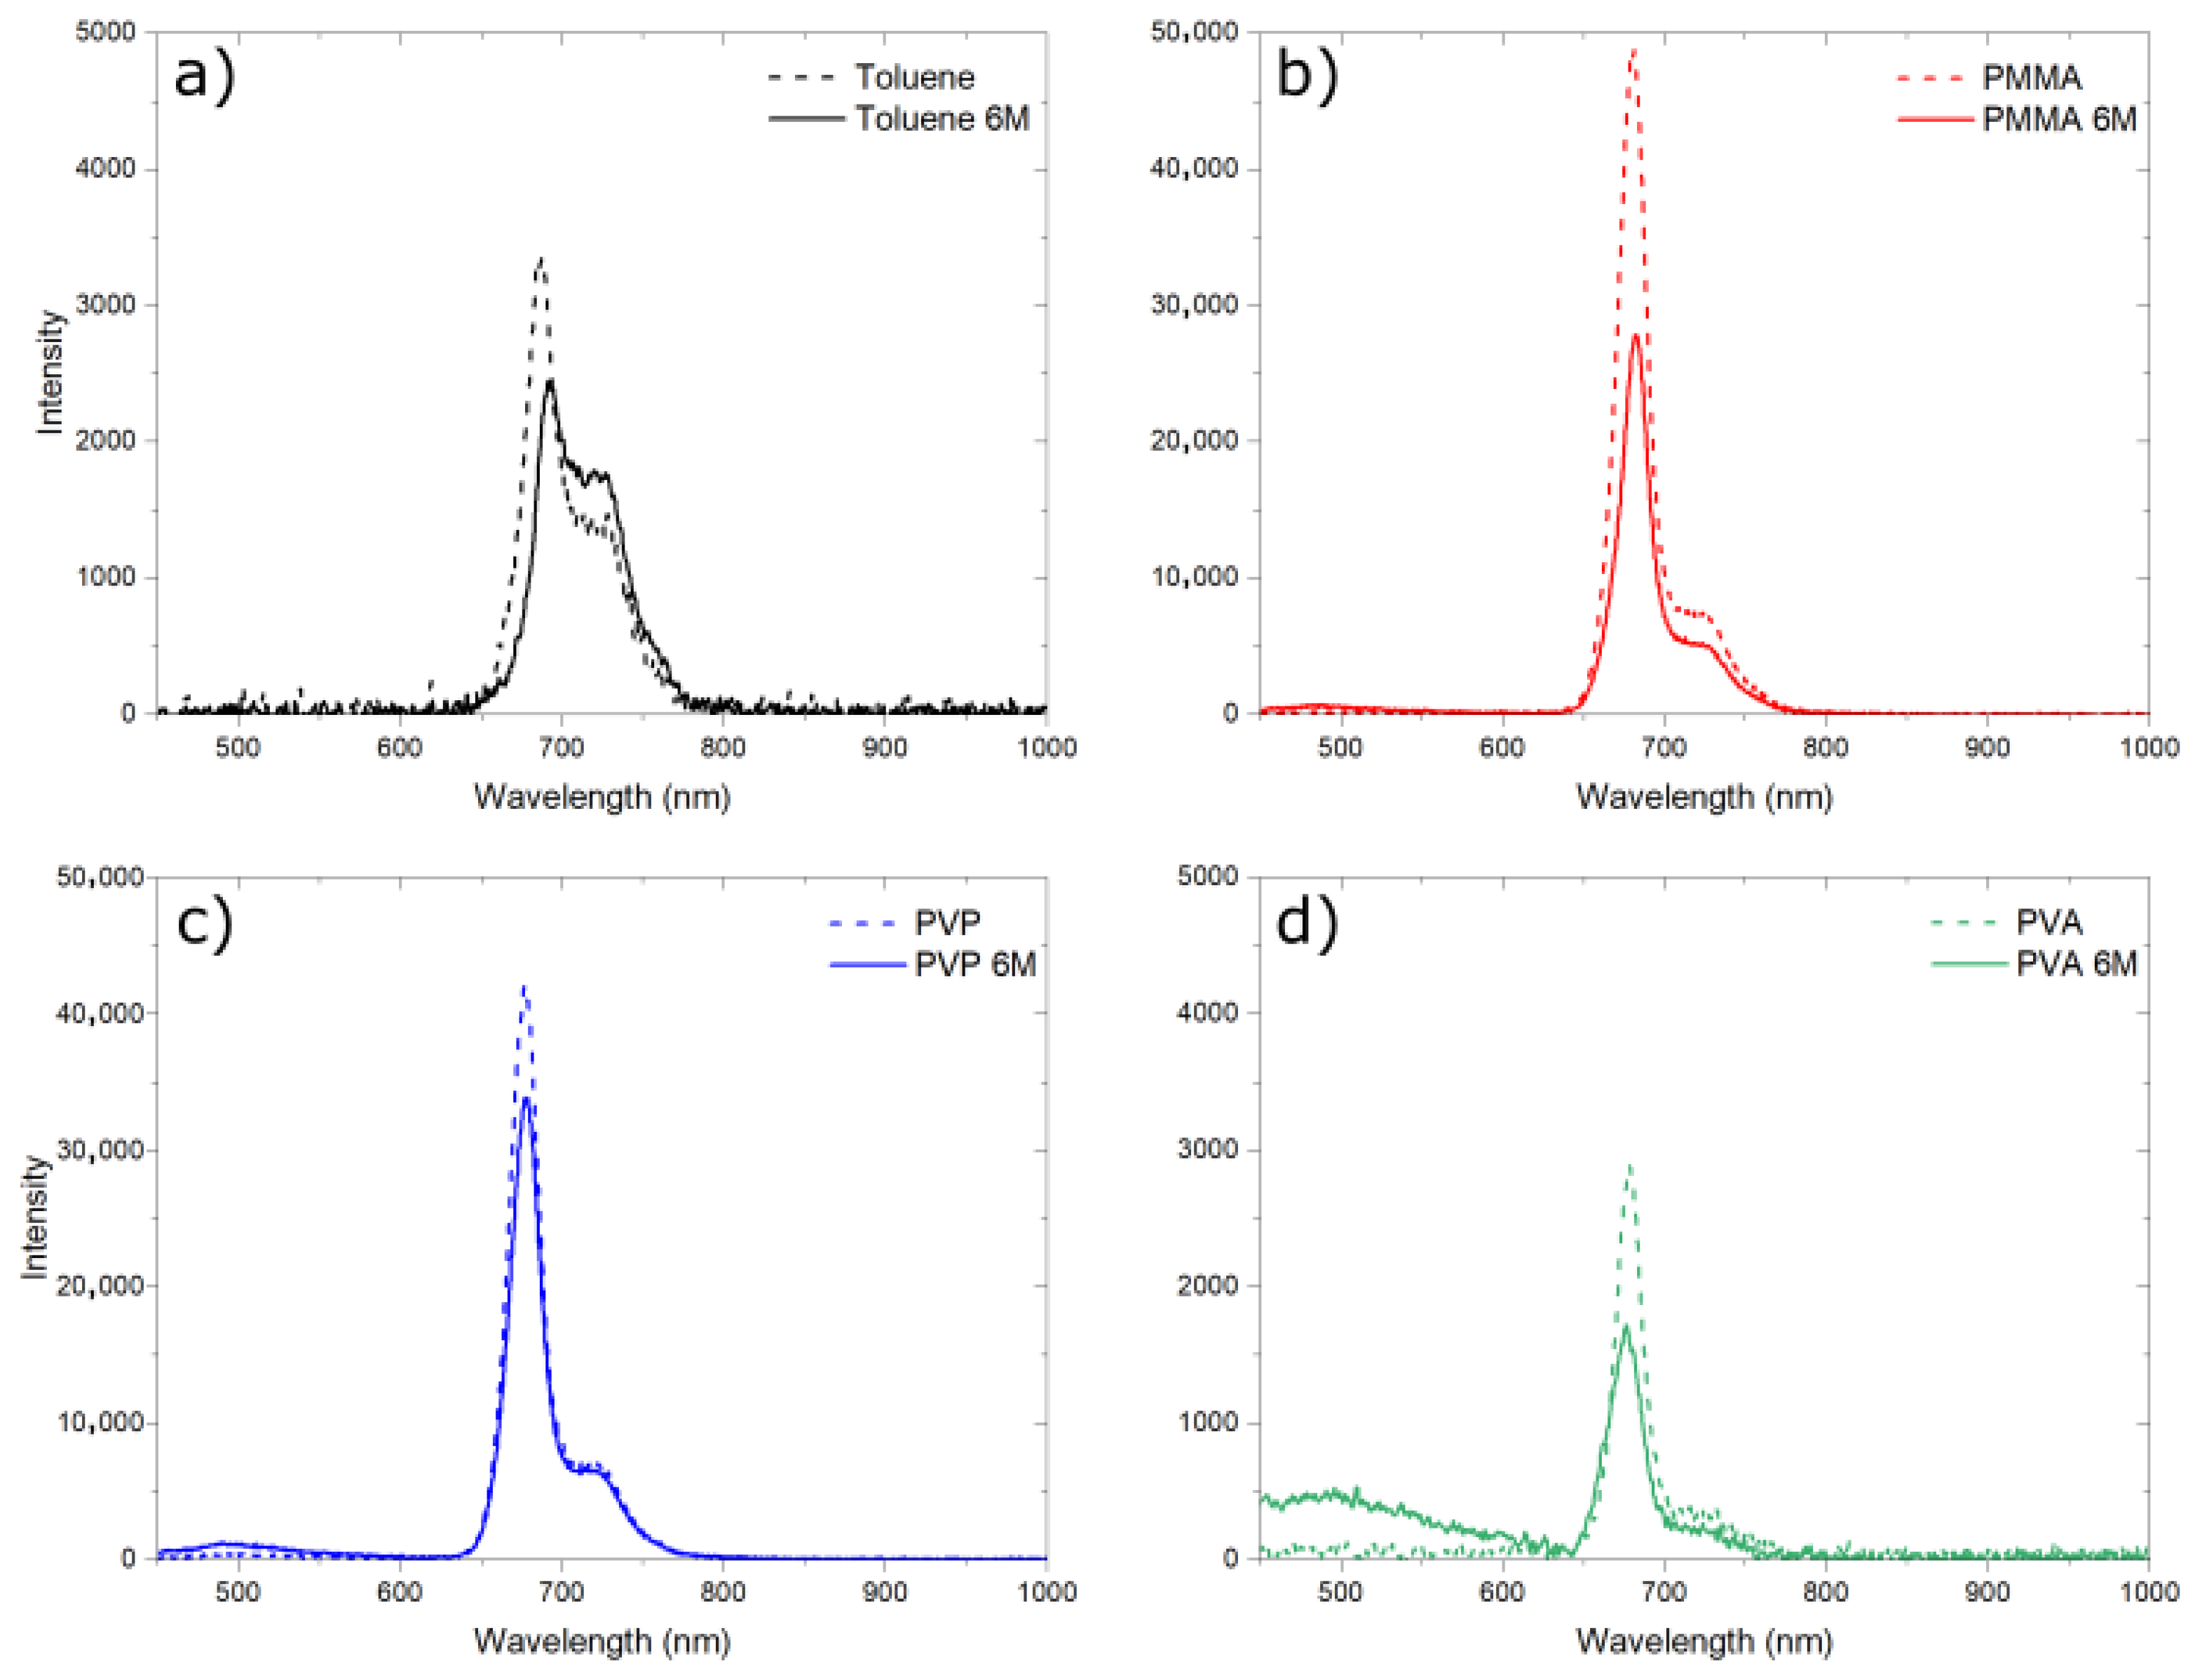
The stability of Chls poses a significant challenge for application since the molecule easily degrades into several metabolites under normal conditions [29]. The stability of OFI dye, both pure and combined with polymeric materials, was tested through fluorescence experiments. In particular, the fluorescence signal was measured on samples six months after their preparation and compared with the results obtained from the freshly prepared samples (see Figure 8a–d), which revealed distinct changes in the characteristic emission peaks at 670 nm and 720 nm. It is worth noting that for a better visualization of the fluorescent profiles, a different Y axis scale is used between Figure 8a,d and Figure 8b,c. Samples were stored in sealed amber vials, at 22 ± 2 °C, under ambient air and darkness unless stated otherwise. These conditions were selected to mimic typical room storage while protecting the dye from photodegradation. A reduction of 27% was obtained for the OFI extract in toluene (Figure 8a), indicating a substantial degradation or transformation of the Chls in the dye. After 6 months, the primary peak decreased significantly, with a slight increase of the 720 nm peak. This suggested degradation of the monomeric Chls, and some degree of aggregation over time. Toluene provided little stabilization to the dye, leaving the Chls susceptible to degradation and partial aggregation. A reduction of 43% was determined in the case of OFI dye in PMMA (Figure 8b). There was a slight reduction in the intensity of the peak at 670 nm after 6 months, as compared to its initial intensity (dashed line). However, the overall peak shape remained consistent, indicating that the monomeric form of the dye was largely preserved over time. PMMA was highly effective to stabilize the OFI dye and to prevent significant aggregation or structural changes of Chl a, which was evidenced by the absence of a marked increase in the peak at 720 nm.
The fluorescence spectrum of the OFI dye in PVP (Figure 8c) showed the highest stability over 6 months, as evidenced by the minimal change in the peak intensity and shape at 670 nm (a reduction of 20%); there was also no evident growth of the peak at 720 nm. While some aggregation may occur, as evidenced by a minor enhancement of the 720 nm peak, the PVP matrix overall maintained a good balance between monomer stabilization and protection from aggregation. This could be attributed to the specific interactions between PVP and the dye, such as hydrogen bonding or steric stabilization, which mitigated degradation processes and aggregation [43]. Compared to the other polymers, the OFI dye in PVA (Figure 8d) exhibited significant changes over time, indicating the least stability. The peak intensity at 670 nm decreased to 43% after 6 months. This suggested significant degradation or loss of fluorescent capability over time. After 6 months, an enhancement in the region around 720 nm was related to aggregated states of the dye forming over time. The hydrophilic nature of PVA appears to promote Chl–Chl interactions, leading to greater aggregation compared to the other matrices.
These observations underscored the critical role of the surrounding matrix in determining the balance between monomeric and aggregated Chl states over time. The stability provided by PMMA was attributed to its hydrophobicity, which minimizes interaction with destabilizing agents, while PVP offers moderate stabilization through specific molecular interactions. In contrast, PVA’s hydrophilic properties promote aggregation, leading to reduced fluorescence and altered dye behavior over time.
PMMA (Figure 8b) was the most effective matrix for maintaining the monomeric state, while PVA (Figure 8d) exhibited the highest tendency for aggregation. PVP (Figure 8c) emerged as the most effective polymer matrix for preserving the fluorescence properties of the OFI dye.
This trend suggests a relevant functional trade-off between the matrices: PMMA provides the highest initial fluorescence intensity, making it suitable for high-contrast, short-term uses, such as disposable optical markers, event-specific authentication tags, or rapid sensors. In contrast, PVP ensures superior photostability over time (only 20% degradation in six months), which makes it more appropriate for long-term applications, such as durable packaging, archival labelling, or stable security elements. The matrix should therefore be selected based on the temporal and functional requirements of the intended application, balancing brightness versus persistence of the fluorescence signal.
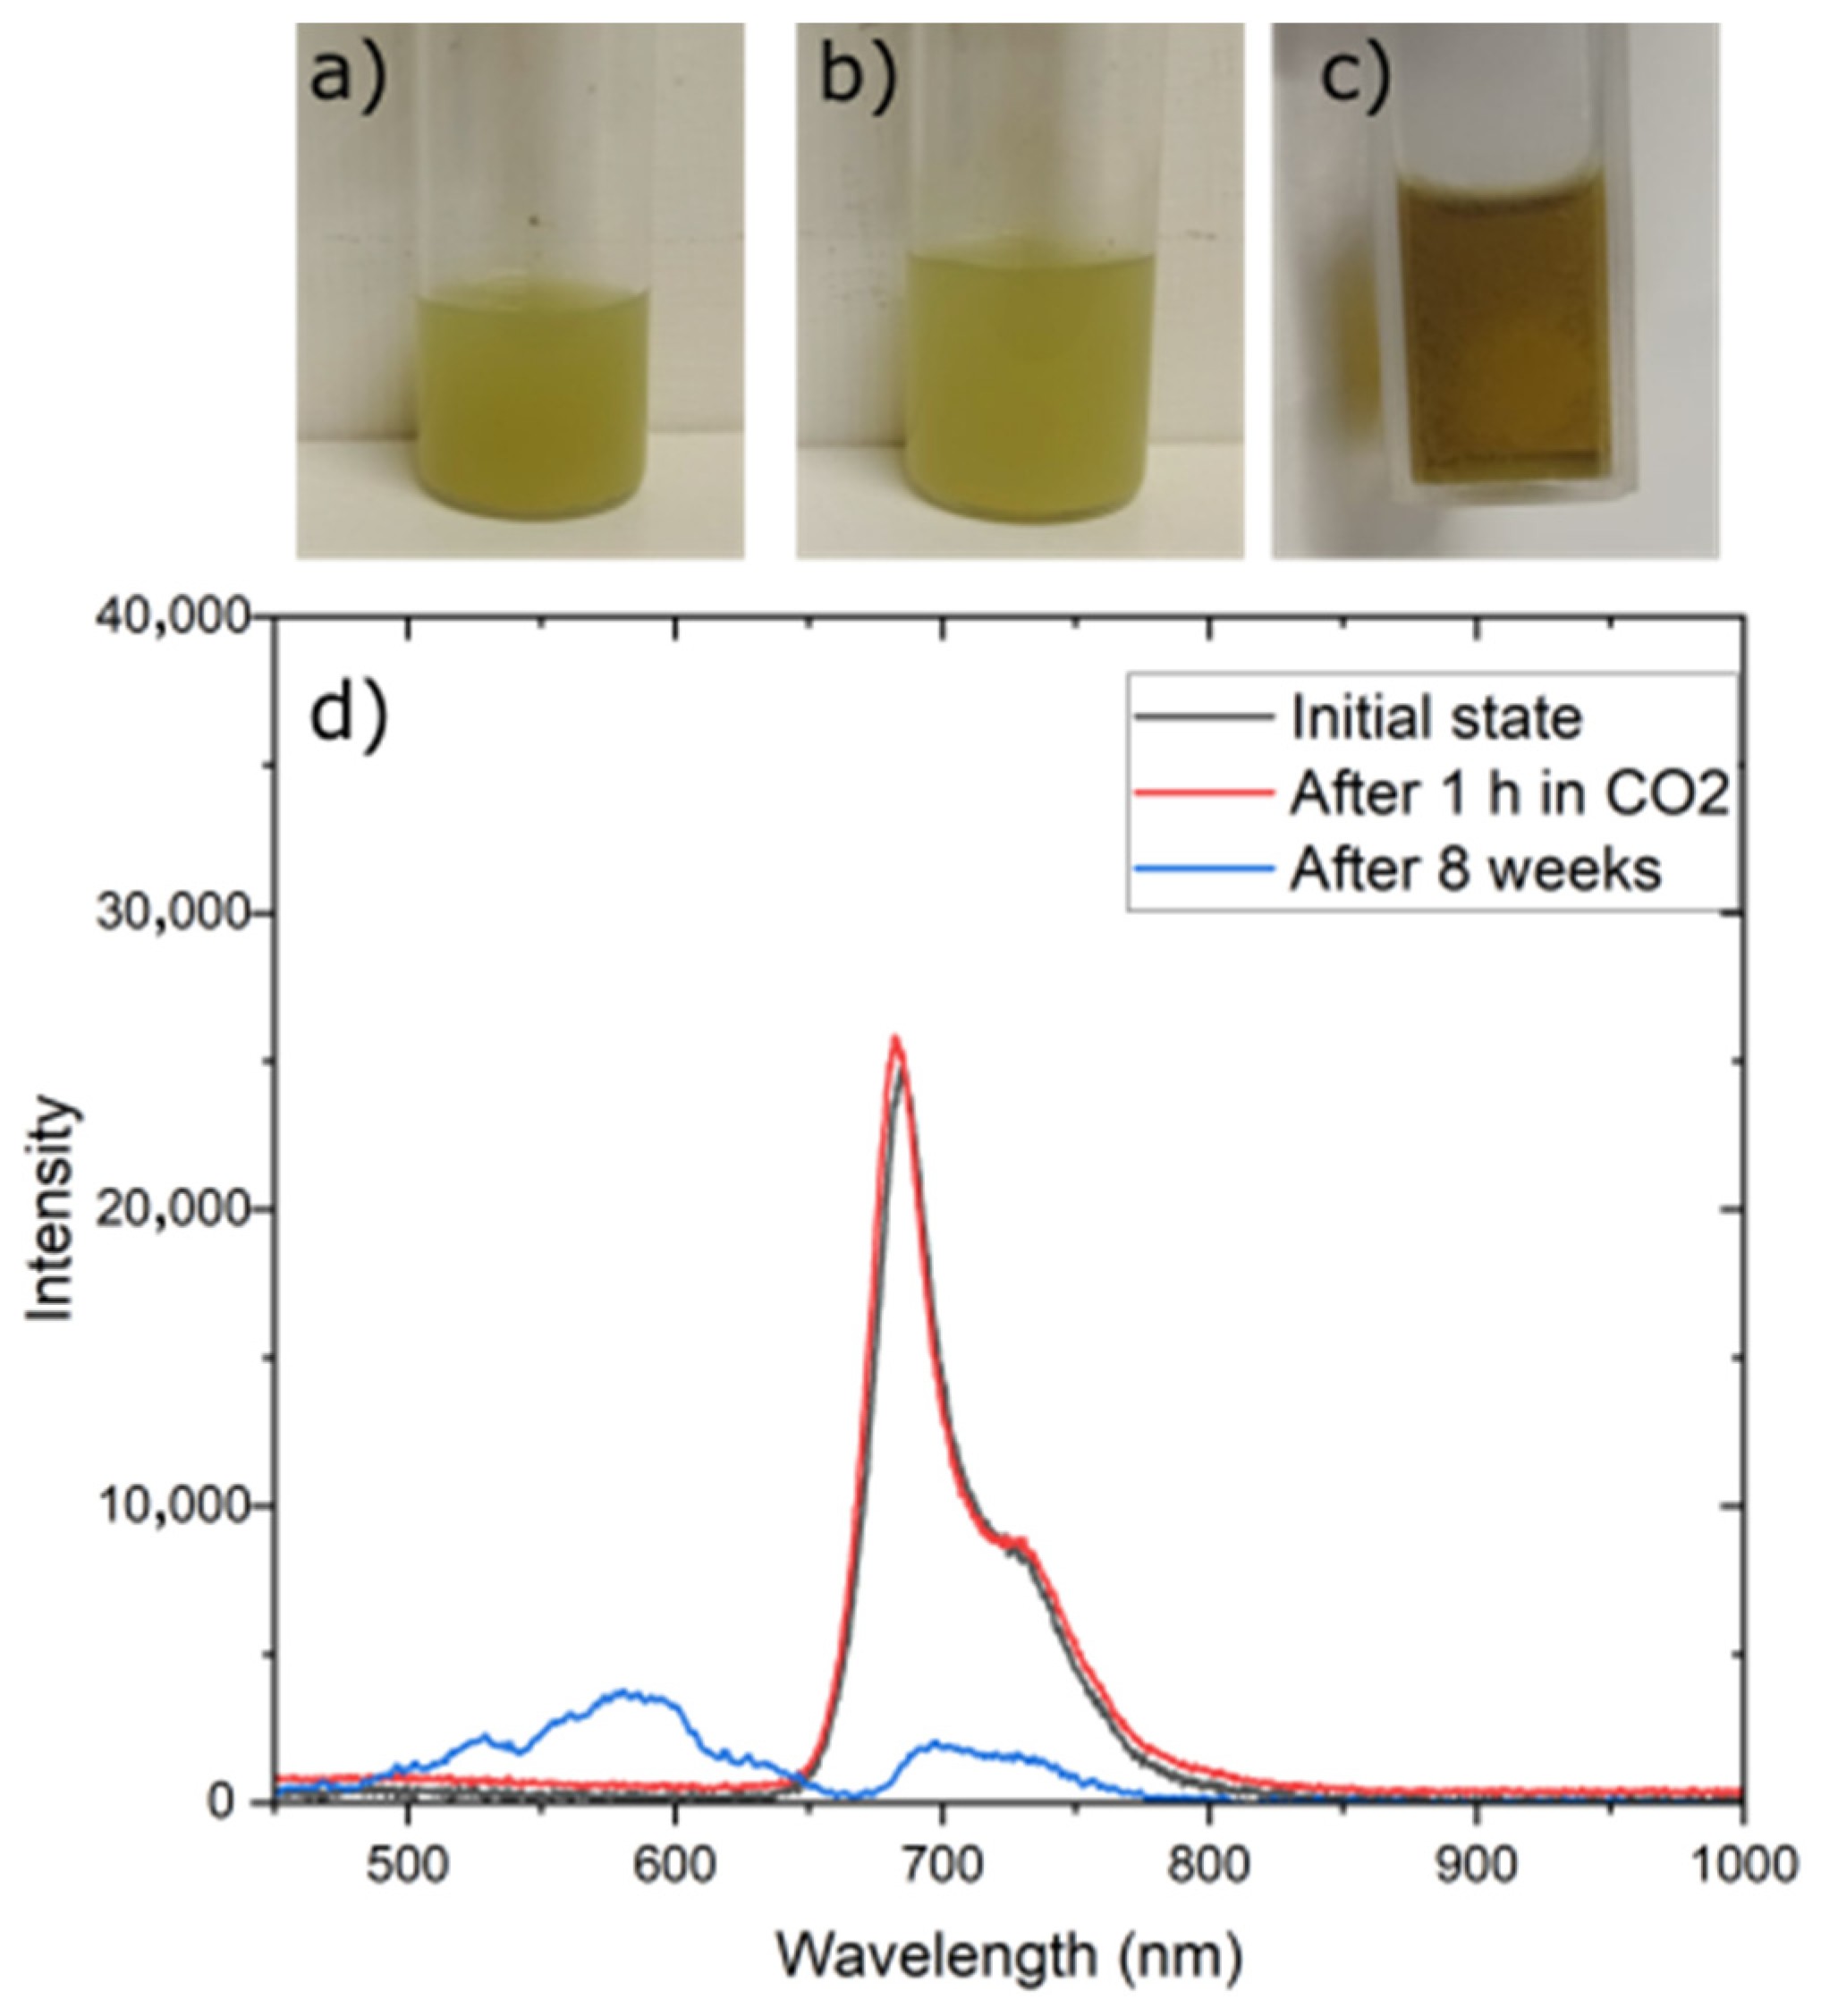
The fluorescence response of OFI dye was also studied, testing the stability and degradation behavior under conditions of CO2 saturation and prolonged aging. OFI dye in toluene was saturated with carbon dioxide, CO2, at a flow rate of 0.15 mL/min and the fluorescence spectrum was acquired after 1 h. The OFI dye dissolved in toluene showed no significant changes in its fluorescence spectrum after 1 h of CO2 saturation. This lack of change was due to the ineffectiveness of CO2 in altering the pH of nonpolar solvents like toluene, as carbonic acid formation occurs only in aqueous environments. In contrast, when the dye was transferred to water—a protic solvent—CO2 slightly reduced the pH from 4.30 to 4.08, indicating limited acidification. However, this minimal change did not significantly affect the fluorescence spectrum [36], which retained its characteristic Chls peaks (see Figure 9d, red line).
Over a period of 8 weeks, natural degradation of Chls occurred, evidenced by changes in color (from green to olive-yellow, see Figure 9a–c) and the fluorescence spectrum (Figure 9d, blue line). This degradation resulted in an 84.5% reduction in fluorescence intensity at 680 nm, attributed to the conversion of Chls into pheophytins, as indicated by new fluorescence features in the 500–650 nm range. Pheophytins form by a demethallization of Chls, typically under acidic conditions, oxidative stress, or prolonged storage [46]. Additionally, the observed flattening of the fluorescence peak, along with the inability to resolve distinct primary and secondary peaks [47], indicates increased aggregation [48] or degradation of Chl derivatives [13,27,49].
Chls were sensitive to pH changes which could alter their electronic states and aggregation behavior [20,48,49,50,51]. Therefore, we studied the spectral behavior of OFI dye in different living environments to understand how the pH change enabled variation in the emission spectra and influenced the state of Chls. At acidic pH (4.30), the observed fluorescence spectrum suggested a predominant contribution from aggregated Chls forms. This was because acidic conditions promoted protonation of functional groups and often enhanced hydrogen bonding and reduced electrostatic repulsion between molecules, leading to the formation of dye aggregates, which typically reduce fluorescence intensity and shift the emission peaks (Figure 10a). Adding NH4OH increased the pH to 11.60, which impacted Chls by dissociating aggregates into monomers. The dissociation into monomers is evident from the increased fluorescence intensity at 680 nm in both spectra after alkalinization (Figure 10b,d). At higher pH, the deprotonation of acidic groups on Chls might lead to less aggregation, as the molecular solubility and stability in the water increased, enhancing the monomer fluorescence. Lowering the pH back to acidic values with CH3COOH leads to re-aggregation of Chls, as indicated by the reduced peak intensity and the hypochromic shift in fluorescence (Figure 10c). This re-aggregation could be due to increased hydrogen bonding and less solubility of Chl in an acidic medium. The pH change induced a gradual decrease of the fluorescent emission; a hypochromic effect at 680 and 720 nm has been clearly observed in Figure 10c,d, resulting in a degradation of Chls peak with a simultaneous appearance of new fluorescent derivatives.
The OFI dye exhibited significant pH-responsive behavior, transitioning between monomeric and aggregated states depending on the pH condition. The gradual decrease in overall fluorescence intensity across the spectrum during pH cycling indicates a degradation or transformation of the OFI dye. The appearance of new emission features suggests the formation of fluorescent derivatives, possibly due to hydrolysis or oxidation under prolonged exposure to alkaline or acidic environments.
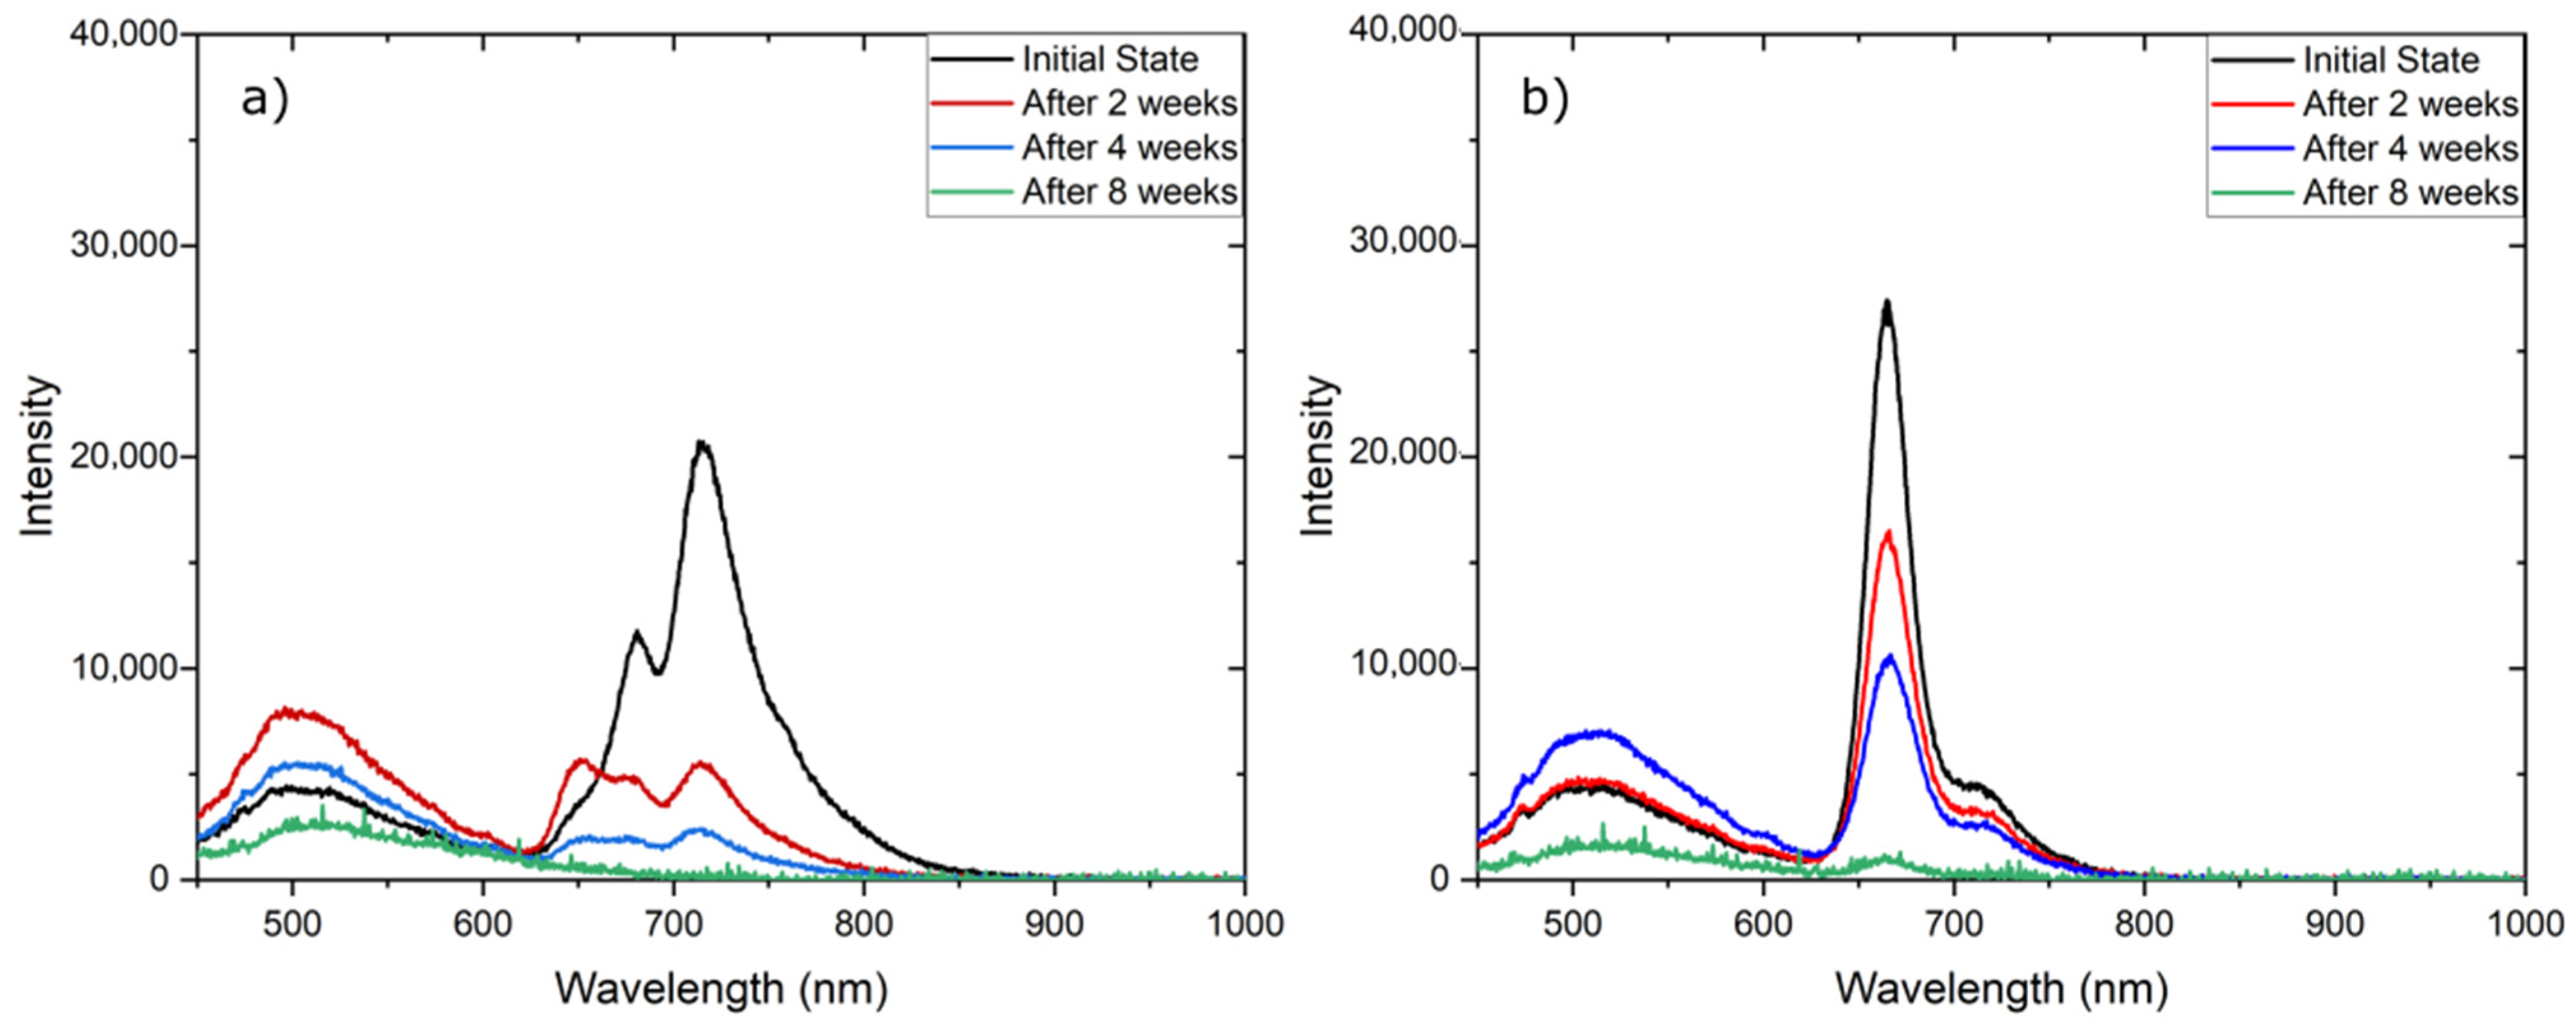
OFI dye fluorescence at pH 4.30 and 11.60 was monitored over 8 weeks (Figure 10c,d and Figure 11a,b). A clear reduction in the intensity of the Chls fluorescence peaks, at 680 nm and 720 nm, over time emerged, and was considered clear evidence of the emission of other metabolites in the range between 450–600 nm [6], as a result of structural damage caused by environmental stressors [13].
In acidic conditions (Figure 11a), the appearance of fluorescence in the 450–600 nm range indicated the formation of intermediate degradation products likely resulting from oxidative and hydrolytic processes under acidic stress. Protonation of Chls molecules led to the formation of pheophytins (demetallated Chls) through the removal of magnesium from the porphyrin ring.
In alkaline environments (Figure 11b), the deprotonation of Chls led to destabilization and susceptibility to hydrolysis and oxidative degradation, and reduction in the Chls peaks at 680 nm and 720 nm was observed over time. New emission peaks also appeared in the 450–600 nm range, but their profile was slightly different compared to the acidic condition. In addition to pheophytins, alkaline conditions might also involve the formation of chlorophyllides (Chls molecules lacking the phytol tail), both of which have altered fluorescence properties. Both acidic and alkaline conditions led to degradation, but the specific pathways and the resulting fluorescence profiles differed (Figure 11a,b). This implied that the environmental stressors acted on Chls via pH-dependent mechanisms.
The profiling of degradants in the emission range 450–600 nm is the subject of further investigation by our research group to define the nature of the compounds generated by Chls metabolism.
The experiment was repeated at least three times, and the results were highly reproducible. These results allow us to distinguish between two phenomena: on the one hand, the rapid, reversible aggregation/disaggregation process observed under short-term pH switching (Figure 10a–d), and on the other, the irreversible degradation of the dye observed after prolonged exposure to extreme pH environments (Figure 11a,b). Therefore, the fluorescence loss is not the result of cumulative cycling damage but rather a time-dependent chemical degradation that becomes significant under sustained acidic or alkaline conditions. This distinction is particularly relevant when considering the dye’s application in stimuli-responsive materials, where short-term, reversible environmental changes can be tolerated, but long-term exposure to severe pH should be avoided.
The fluorescence response of OFI dye was also studied by testing the stability and degradation behavior under conditions of O2 saturation. Oxygen is well-known to quench excited states and promote degradation pathways, reducing the number of intact, fluorescent dye molecules over time [32].
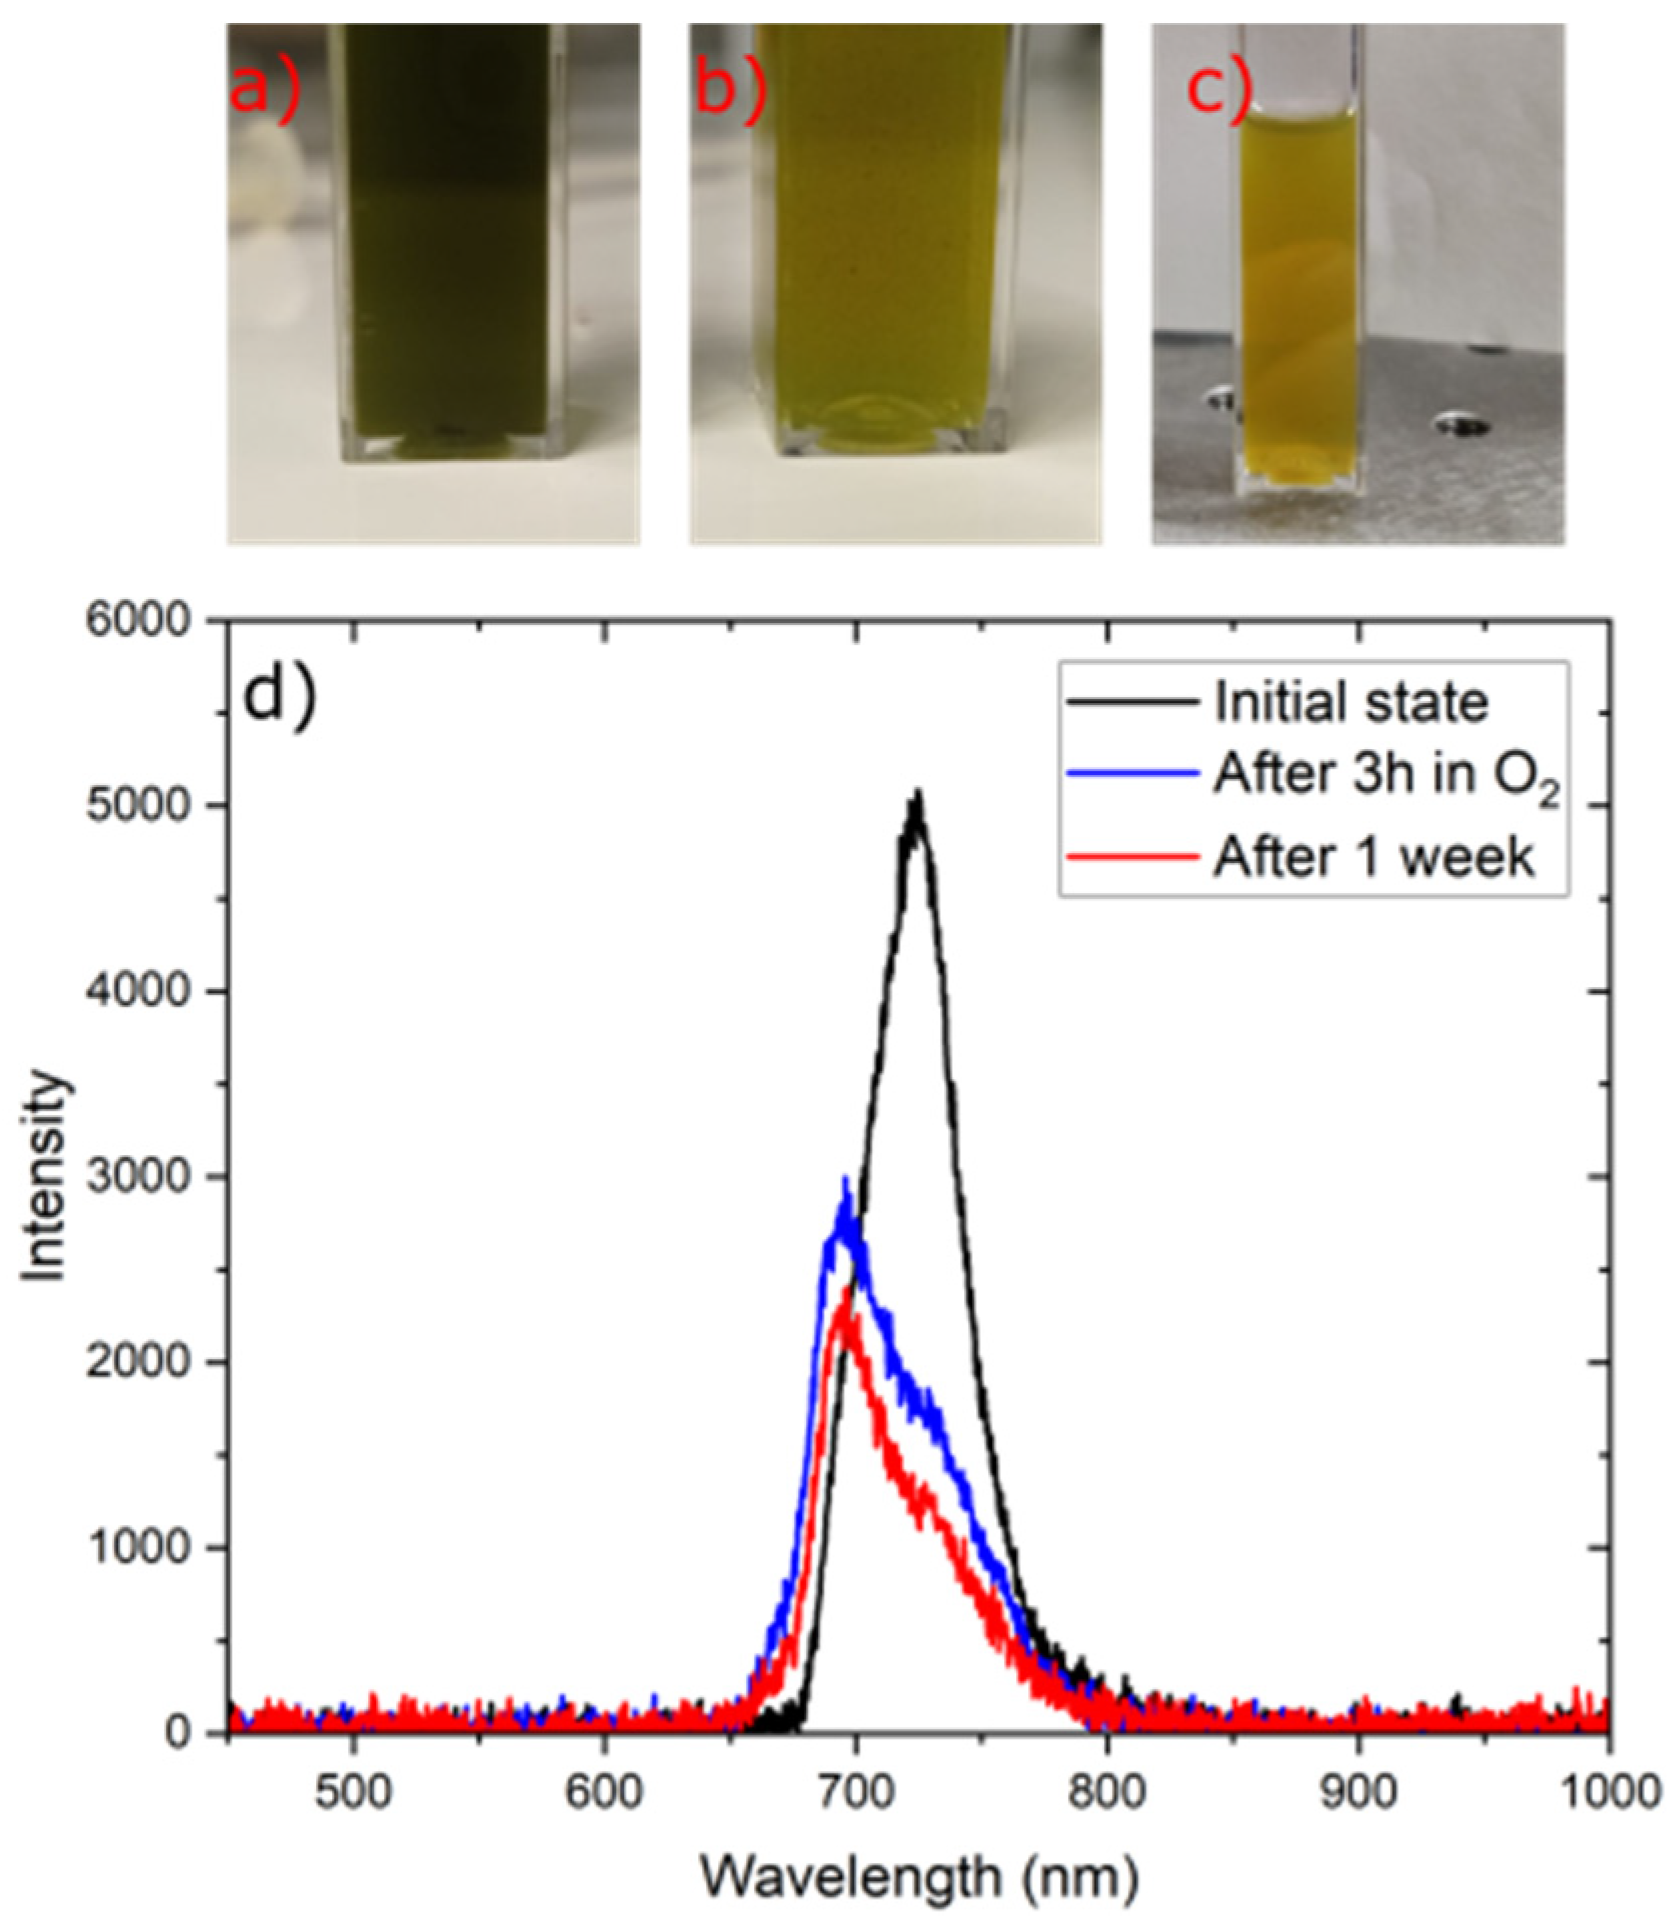
The OFI dye, in a water/ethanol mixture (1:1 v/v) was saturated with oxygen, O2, at a flow rate of 0.15 mL/min and fluorescence spectrum was acquired after 3 h, and 1 week. Figure 12a–c reports the photographs of the OFI extract while Figure 12d reports the related fluorescence spectra. The fluorescence intensity indicated whether the OFI dye was in good condition and in a monomeric state (black line). In a water/ethanol solution, ethanol lowered the overall polarity compared to pure water but still maintained enough polar character to disrupt strong intermolecular interactions among Chl molecules. The net effect was that each Chl remained largely individually solvated, and this prevented the dye from forming aggregates, so the characteristic shoulder of aggregated Chl was absent. As the sample was exposed to an oxygen-rich environment, oxidative processes began to degrade or chemically modify the Chl. The fluorescence intensity decreases—as shown by the progressively lower peaks after 3 h (blue line) and then after 1 week (red line). The reactive oxygen species promoted a 44.4% reduction in fluorescence peak after 3 h (blue line) and of 55.3% after 1 week (red line). The overall fluorescence band appeared broader or less symmetrical and this was due to the chemical modification of the OFI dye, promoted by oxygen, which could create a slightly different distribution of emissive states. The oxidation altered the electronic environment of the chromophore, producing small shifts (to lower wavelengths) in the fluorescence peak [32]. These observations suggested that while the water/ethanol solvent was effective at maintaining the dye in a monomeric (and thus single emission) state, long-term exposure to oxygen could degrade the dye. Such information is crucial for optimizing storage conditions, formulation strategies, and practical uses where oxygen exposure is inevitable.

4. Conclusions

This study demonstrates the viability of OFI cladodes as a sustainable and potent source of chlorophyll-based fluorescent dye. The optimized extraction process yielded a chlorophyll-rich extract, with concentrations of Chl a and Chl b of 468.9 and 128.2 µg/g, respectively, and a Chl a/b ratio of 3.7. This composition supports its strong red fluorescence and antioxidant activity, with an IC50 of approximately 185 µg/mL in the DPPH assay. The extract showed a notable quantum yield (~0.03), and its integration into PMMA and PVP matrices resulted in an increase of up to 40% in fluorescence intensity. PVP provided long-term stability, preserving over 80% of the original emission after 6 months. These features make the OFI-derived dye suitable for photonic applications, where photostability and intensity modulation are key points.
The dye also demonstrated high resilience under chemical and environmental stressors, including pH variation, oxidation, and gas exposure, confirming its versatility and suitability for packaging materials, optical sensors, and security features. Compared to conventional sources such as spinach, OFI offers distinct ecological advantages due to its drought tolerance and use of agricultural waste.
Its practical applicability has already been demonstrated in a related study [16], where the dye was successfully integrated into anti-counterfeiting photonic structures. Taken together, these findings support the use of OFI-derived dyes as green, scalable alternatives for high-performance optical and industrial applications, contributing to the development of sustainable functional materials.

Author Contributions

O.G. conceived the idea, designed the experiments, and prepared the manuscript. A.F., S.K.S. and G.N. performed the fluorescence experiments. A.F. analyzed the fluorescence data and contributed to the preparation of the paper. F.C. contributed to extraction experiments. G.D. performed SEM analysis. R.G. performed FTIR analysis and DPPH assay. R.C. contributed to the revision of the paper. All authors have read and agreed to the published version of the manuscript.

Funding

O.G. and A.F. acknowledge financial support from the project “Tech4You—Technologies for climate change adaptation and quality of life improvement”—ECS00000009, in the framework of PIANO NAZIONALE DI RIPRESA E RESILIENZA (PNRR). S.K.S. acknowledges the financial support from project “D.M. 10 agosto 2021 n. 1061—PON 2014–2020 Dottorati di Ricerca su tematiche Green e dell’Innovazione” financed by “Ministero dell’Università e della Ricerca”.

Institutional Review Board Statement

Not applicable.

Informed Consent Statement

Not applicable.

Acknowledgments

All authors acknowledge A. Bozzarello for his administrative support and management of the projects.

Conflicts of Interest

The authors declare that they have no conflicts of interest that could have appeared to influence the work reported in this paper.

References

  1. Calogero, G.; Di Marco, G.; Cazzanti, S.; Caramori, S.; Argazzi, R.; Di Carlo, A.; Bignozzi, C.A. Efficient Dye-Sensitized Solar Cells Using Red Turnip and Purple Wild Sicilian Prickly Pear Fruits. Int. J. Mol. Sci. 2010, 11, 254–267. [Google Scholar] [CrossRef]
  2. Hao, S.; Wu, J.; Huang, Y.; Lin, J. Natural Dyes as Photosensitizers for Dye-Sensitized Solar Cell. Sol. Energy 2006, 80, 209–214. [Google Scholar] [CrossRef]
  3. Gómez-Ortíz, N.M.; Vázquez-Maldonado, I.A.; Pérez-Espadas, A.R.; Mena-Rejón, G.J.; Azamar-Barrios, J.A.; Oskam, G. Dye-Sensitized Solar Cells with Natural Dyes Extracted from Achiote Seeds. Sol. Energy Mater. Sol. Cells 2010, 94, 40–44. [Google Scholar] [CrossRef]
  4. Donaldson, L. Autofluorescence in Plants. Molecules 2020, 25, 2393. [Google Scholar] [CrossRef]
  5. Lacatusu, I.; Badea, N.; Nita, R.; Murariu, A.; Miculescu, F.; Iosub, I.; Meghea, A. Encapsulation of Fluorescence Vegetable Extracts within a Templated Sol–Gel Matrix. Opt. Mater. 2010, 32, 711–718. [Google Scholar] [CrossRef]
  6. Giampaoli, P.; Fernandes, F.F.; Tavares, A.R.; Domingos, M.; Cardoso-Gustavson, P. Fluorescence Emission Spectra of Target Chloroplast Metabolites (Flavonoids, Carotenoids, Lipofuscins, Pheophytins) as Biomarkers of Air Pollutants and Seasonal Tropical Climate. Environ. Sci. Pollut. Res. 2020, 27, 25363–25373. [Google Scholar] [CrossRef]
  7. Chang, H.; Kao, M.-J.; Chen, T.-L.; Chen, C.-H.; Cho, K.-C.; Lai, X.-R. Characterization of Natural Dye Extracted from Wormwood and Purple Cabbage for Dye-Sensitized Solar Cells. Int. J. Photoenergy 2013, 2013, 159502. [Google Scholar] [CrossRef]
  8. Azman, N.H.; Khairul, W.M.; Sarbon, N.M. A Comprehensive Review on Biocompatible Film Sensor Containing Natural Extract: Active/Intelligent Food Packaging. Food Control 2022, 141, 109189. [Google Scholar] [CrossRef]
  9. Das, S.; Roy Maulik, S. Recent Approaches and Advancements in Natural Dyes. In Natural Dyes and Sustainability; Muthu, S.S., Ed.; Springer Nature: Cham, Switzerland, 2023; pp. 63–78. ISBN 978-3-031-47471-2. [Google Scholar]
  10. Bin-Jumah, M.; Alwakeel, S.S.; Moga, M.; Buvnariu, L.; Bigiu, N.; Zia-Ul-Haq, M. Application of Carotenoids in Cosmetics. In Carotenoids: Structure and Function in the Human Body; Zia-Ul-Haq, M., Dewanjee, S., Riaz, M., Eds.; Springer International Publishing: Cham, Switzerland, 2021; pp. 747–756. ISBN 978-3-030-46459-2. [Google Scholar]
  11. García-Plazaola, J.I.; Fernández-Marín, B.; Duke, S.O.; Hernández, A.; López-Arbeloa, F.; Becerril, J.M. Autofluorescence: Biological Functions and Technical Applications. Plant Sci. 2015, 236, 136–145. [Google Scholar] [CrossRef] [PubMed]
  12. Reisch, A.; Trofymchuk, K.; Runser, A.; Fleith, G.; Rawiso, M.; Klymchenko, A.S. Tailoring Fluorescence Brightness and Switching of Nanoparticles through Dye Organization in the Polymer Matrix. ACS Appl. Mater. Interfaces 2017, 9, 43030–43042. [Google Scholar] [CrossRef] [PubMed]
  13. Petrović, S.; Zvezdanović, J.; Marković, D. Chlorophyll Degradation in Aqueous Mediums Induced by Light and UV-B Irradiation: An UHPLC-ESI-MS Study. Radiat. Phys. Chem. 2017, 141, 8–16. [Google Scholar] [CrossRef]
  14. Galati, E.M.; Tripodo, M.M.; Trovato, A.; d’Aquino, A.; Monforte, M.T. Biological Activity of Opuntia Ficus Indica Cladodes II: Effect on Experimental Hypercholesterolemia in Rats. Pharm. Biol. 2003, 41, 175–179. [Google Scholar] [CrossRef]
  15. Iacopetta, D.; Baldino, N.; Caruso, A.; Perri, V.; Lupi, F.R.; de Cindio, B.; Gabriele, D.; Sinicropi, M.S. Nutraceuticals Obtained by SFE-CO2 from Cladodes of Two Opuntia ficus-indica (L.) Mill Wild in Calabria. Appl. Sci. 2021, 11, 477. [Google Scholar] [CrossRef]
  16. Kamwe Sighano, S.; Ritacco, T.; Bruno, M.D.L.; Gennari, O.; Fuscaldo, W.; Zografopoulos, D.C.; Marae-Djouda, J.; Maurer, T.; Beccherelli, R.; Caputo, R.; et al. Optical and Terahertz Anticounterfeiting Tags Via Non-Deterministic Deposition of Fluorescent Opuntia ficus-indica Extract. Adv. Funct. Mater. 2024, 34, 2406632. [Google Scholar] [CrossRef]
  17. Scaffaro, R.; Maio, A.; Gulino, E.F.; Megna, B. Structure-Property Relationship of PLA-Opuntia Ficus Indica Biocomposites. Compos. Part B Eng. 2019, 167, 199–206. [Google Scholar] [CrossRef]
  18. Abbas, E.Y.; Ezzat, M.I.; El Hefnawy, H.M.; Abdel-Sattar, E. An Overview and Update on the Chemical Composition and Potential Health Benefits of Opuntia ficus-indica (L.) Miller. J. Food Biochem. 2022, 46, e14310. [Google Scholar] [CrossRef]
  19. Leite, A.C.; Ferreira, A.M.; Morais, E.S.; Khan, I.; Freire, M.G.; Coutinho, J.A.P. Cloud Point Extraction of Chlorophylls from Spinach Leaves Using Aqueous Solutions of Nonionic Surfactants. ACS Sustain. Chem. Eng. 2018, 6, 590–599. [Google Scholar] [CrossRef]
  20. Zeb, A. A Simple, Sensitive HPLC-DAD Method for Simultaneous Determination of Carotenoids, Chlorophylls and α-Tocopherol in Leafy Vegetables. Food Meas. 2017, 11, 979–986. [Google Scholar] [CrossRef]
  21. Lanfer-Marquez, U.M.; Barros, R.M.C.; Sinnecker, P. Antioxidant Activity of Chlorophylls and Their Derivatives. Food Res. Int. 2005, 38, 885–891. [Google Scholar] [CrossRef]
  22. Yadav, S.; Tiwari, K.S.; Gupta, C.; Tiwari, M.K.; Khan, A.; Sonkar, S.P. A Brief Review on Natural Dyes, Pigments: Recent Advances and Future Perspectives. Results Chem. 2023, 5, 100733. [Google Scholar] [CrossRef]
  23. Pizzicato, B.; Pacifico, S.; Cayuela, D.; Mijas, G.; Riba-Moliner, M. Advancements in Sustainable Natural Dyes for Textile Applications: A Review. Molecules 2023, 28, 5954. [Google Scholar] [CrossRef]
  24. Quach, H.T.; Steeper, R.L.; Griffin, G.W. An Improved Method for the Extraction and Thin-Layer Chromatography of Chlorophyll a and b from Spinach. J. Chem. Educ. 2004, 81, 385. [Google Scholar] [CrossRef]
  25. Cazón, P.; Sanches Silva, A. Natural Pigments from Food Wastes: New Approaches for the Extraction and Encapsulation. Curr. Opin. Green Sustain. Chem. 2024, 47, 100929. [Google Scholar] [CrossRef]
  26. Pooja, B.K.; Sethi, S.; Joshi, A.; Varghese, E.; Kaur, C.; Kumar, R. Shridhar Ultrasound-Assisted Extraction of Chlorophyll from Pea Pod Waste: Optimization, Kinetics, and Stability Study. Food Anal. Methods 2023, 16, 1358–1369. [Google Scholar] [CrossRef]
  27. Lichtenthaler, H.K.; Buschmann, C. Chlorophylls and Carotenoids: Measurement and Characterization by UV-VIS Spectroscopy. Curr. Protoc. Food Anal. Chem. 2001, 1, F4.3.1–F4.3.8. [Google Scholar] [CrossRef]
  28. Wang, H.; Ji, X.; Page, Z.A.; Sessler, J.L. Fluorescent Materials-Based Information Storage. Mater. Chem. Front. 2020, 4, 1024–1039. [Google Scholar] [CrossRef]
  29. Mandal, B.K.; Ling, Y.-C. Analysis of Chlorophylls/Chlorophyllins in Food Products Using HPLC and HPLC-MS Methods. Molecules 2023, 28, 4012. [Google Scholar] [CrossRef]
  30. Hu, Y.; Sun, H.; Mu, T. Effects of Different pH, Temperature, and Pressurisation Time on the Stability of Chlorophylls Treated with Zn2+ and High Hydrostatic Pressure. Int. J. Food Sci. Technol. 2023, 58, 4715–4725. [Google Scholar] [CrossRef]
  31. Vladkova, R. Chlorophyll a Self-Assembly in Polar Solvent–Water Mixtures †. Photochem. Photobiol. 2000, 71, 71–83. [Google Scholar] [CrossRef]
  32. Lakowicz, J.R. Fluorophores. In Principles of Fluorescence Spectroscopy; Springer: Boston, MA, USA, 2006; pp. 63–95. ISBN 978-0-387-46312-4. [Google Scholar]
  33. Munawaroh, H.S.H.; Fathur, R.M.; Gumilar, G.; Aisyah, S.; Yuliani, G.; Mudzakir, A.; Wulandari, A.P. Characterization and Physicochemical Properties of Chlorophyll Extract from Spirulina sp. J. Phys. Conf. Ser. 2019, 1280, 022013. [Google Scholar] [CrossRef]
  34. Barani, H.; Rahmani, F. Dyeing of Wool Yarn with Aqueous Extract of Opuntia ficus-indica Fruit Containing Betalain Colorant Employing Ascorbic Acid as a Bio-Mordant Under Varied Circumstances of Dyeing. Fibers Polym. 2023, 24, 2785–2797. [Google Scholar] [CrossRef]
  35. Gulcin, İ.; Alwasel, S.H. DPPH Radical Scavenging Assay. Processes 2023, 11, 2248. [Google Scholar] [CrossRef]
  36. Reimers, J.R.; Cai, Z.-L.; Kobayashi, R.; Rätsep, M.; Freiberg, A.; Krausz, E. Assignment of the Q-Bands of the Chlorophylls: Coherence Loss via Qx − Qy Mixing. Sci. Rep. 2013, 3, 2761. [Google Scholar] [CrossRef]
  37. Forster, L.S.; Livingston, R. The Absolute Quantum Yields of the Fluorescence of Chlorophyll Solutions. J. Chem. Phys. 1952, 20, 1315–1320. [Google Scholar] [CrossRef]
  38. Lakowicz, J.R. Effects of Solvents on Fluorescence Emission Spectra. In Principles of Fluorescence Spectroscopy; Springer: Boston, MA, USA, 1983; pp. 187–215. ISBN 978-1-4615-7658-7. [Google Scholar]
  39. Rodríguez, A.; Graciani, M.d.M.; Moyá, M.L. Effects of Addition of Polar Organic Solvents on Micellization. Langmuir 2008, 24, 12785–12792. [Google Scholar] [CrossRef]
  40. Rega, R.; Gennari, O.; Mecozzi, L.; Grilli, S.; Pagliarulo, V.; Ferraro, P. Bipolar Patterning of Polymer Membranes by Pyroelectrification. Adv. Mater. 2016, 28, 454–459. [Google Scholar] [CrossRef]
  41. Ghoshal, S.K.; Sarkar, S.K.; Kastha, G.S. Effects of Intermolecular Hydrogen-Bonding on the Luminescence Properties of Acetophenone, Characterization of Emission States. Bull. Chem. Soc. Jpn. 1981, 54, 3556–3561. [Google Scholar] [CrossRef]
  42. Miranda-Quintana, R.A.; Chen, L.; Smiatek, J. Insights into Hildebrand Solubility Parameters – Contributions from Cohesive Energies or Electrophilicity Densities? ChemPhysChem 2024, 25, e202300566. [Google Scholar] [CrossRef] [PubMed]
  43. Tran, T.; Pham Van, B.; Dang Van, T.; Nguyen Thi, H. The Optical Properties and Energy Transition Process in Nanocomposite of Polyvinyl-Pyrrolidone Polymer and Mn-Doped ZnS. Opt. Quant. Electron. 2013, 45, 147–159. [Google Scholar] [CrossRef]
  44. Agostiano, A.; Catucci, L.; Colafemmina, G.; Scheer, H. Role of Functional Groups and Surfactant Charge in Regulating Chlorophyll Aggregation in Micellar Solutions. J. Phys. Chem. B 2002, 106, 1446–1454. [Google Scholar] [CrossRef]
  45. Plouzeau, M.; Piogé, S.; Peilleron, F.; Fontaine, L.; Pascual, S. Polymer/Dye Blends: Preparation and Optical Performance: A Short Review. J. Appl. Polym. Sci. 2022, 139, e52861. [Google Scholar] [CrossRef]
  46. Cichelli, A.; Pertesana, G.P. High-Performance Liquid Chromatographic Analysis of Chlorophylls, Pheophytins and Carotenoids in Virgin Olive Oils: Chemometric Approach to Variety Classification. J. Chromatogr. A 2004, 1046, 141–146. [Google Scholar] [CrossRef]
  47. Pedrós, R.; Moya, I.; Goulas, Y.; Jacquemoud, S. Chlorophyll Fluorescence Emission Spectrum inside a Leaf. Photochem. Photobiol. Sci. 2008, 7, 498–502. [Google Scholar] [CrossRef] [PubMed]
  48. Qu, F.; Gong, N.; Wang, S.; Gao, Y.; Sun, C.; Fang, W.; Men, Z. Effect of pH on Fluorescence and Absorption of Aggregates of Chlorophyll a and Carotenoids. Dyes Pigments 2020, 173, 107975. [Google Scholar] [CrossRef]
  49. Nishimura, N.; Nakayama, S.; Horiuchi, A.; Kumoda, M.; Miyatake, T. Reversible Aggregation of Chlorophyll Derivative Induced by Phase Transition of Lipid. Langmuir 2019, 35, 7242–7248. [Google Scholar] [CrossRef]
  50. Rocchetti, G.; Pellizzoni, M.; Montesano, D.; Lucini, L. Italian Opuntia ficus-indica Cladodes as Rich Source of Bioactive Compounds with Health-Promoting Properties. Foods 2018, 7, 24. [Google Scholar] [CrossRef]
  51. Lucini, L.; Pellizzoni, M.; Pellegrino, R.; Molinari, G.P.; Colla, G. Phytochemical Constituents and in Vitro Radical Scavenging Activity of Different Aloe Species. Food Chem. 2015, 170, 501–507. [Google Scholar] [CrossRef] [PubMed]
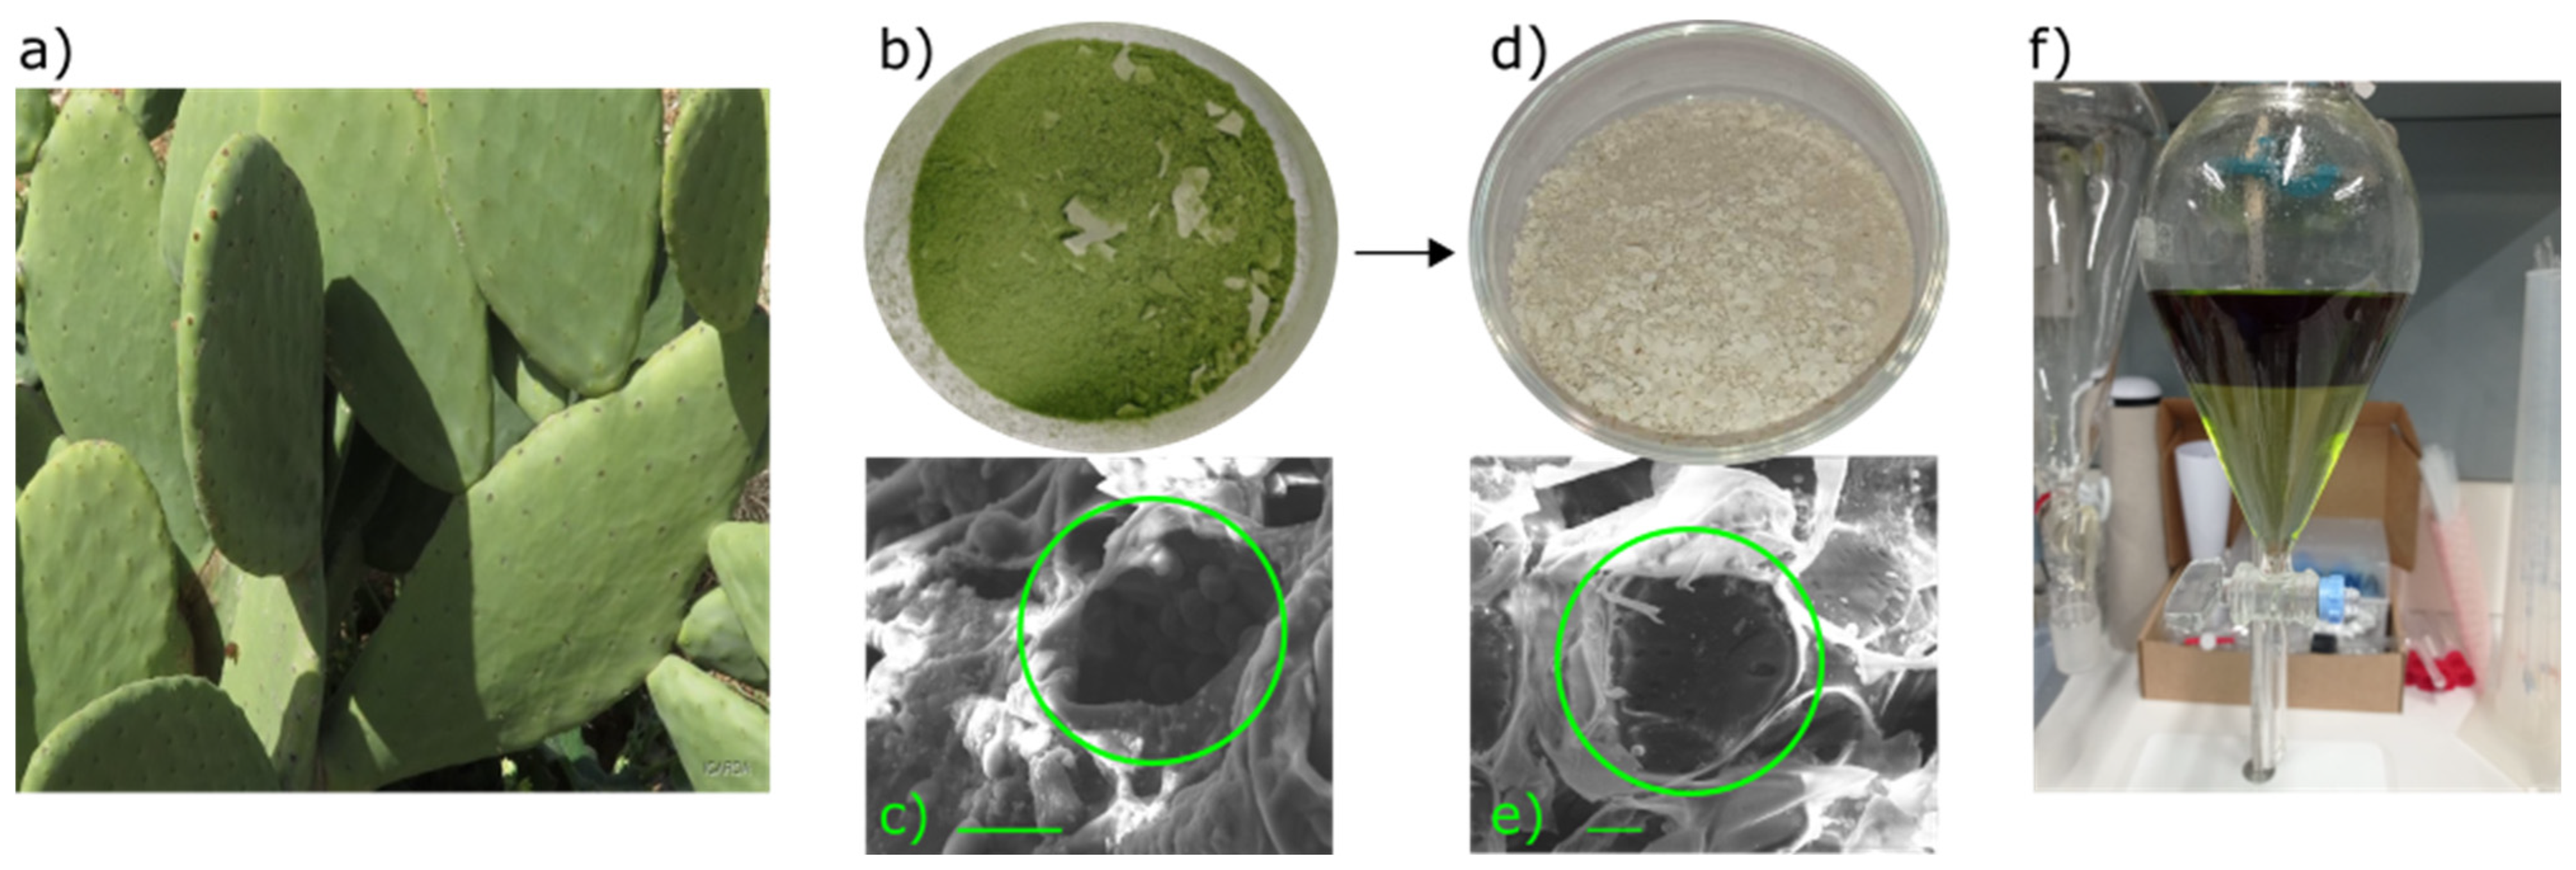
Figure 1. (a) Photograph of OFI cladodes. OFI powder before (b) and after (d) extraction procedure with related SEM images of the two distinct phases: (c) before and (e) after extraction procedure with and without plastids, respectively (inner circle zone), scale bar: 20 µm in panels (c,e); (f) liquid–liquid extraction of OFI extract.
Sustainability 17 07504 g001
Figure 2. (a) Qualitative characterization of OFI dye using TLC plates; Chls standard was used as reference. (b) FTIR absorbance of OFI dye (red line) and Chls as comparison (blue line), recorded at room temperature. Samples were diluted in ethanol, deposited on a ZnSe window, and left to dry in air.
Sustainability 17 07504 g002
Figure 3. Characteristic absorption peaks of OFI dye and standard Chls in acetone recorded from 350 to 850 nm. The specific wavelengths 662 nm and 645 nm (dashed black lines) were chosen for the quantification of Chl a and Chl b, respectively, because they correspond to the absorption maxima of these pigments in acetone.
Sustainability 17 07504 g003
Figure 4. (a) From left to right: DPPH alone and with increasing amounts of OFI dye (from 46 to 506 µg/mL) in ethanol. (b) Representative UV–Vis spectra of DPPH alone (7 × 10⁻⁵ M) in ethanol and with increasing amounts of OFI dye from 46 to 506 µg/mL. (c) Concentration dependence inhibition of DPPH radicals by the OFI dye. The parameter is calculated from the UV–Vis absorbance at 515 nm (see text). (d) Representative UV–Vis absorbance spectra of DPPH alone in ethanol (DPPH) and with increasing concentrations of spinach extract (from 46 to 506 μg/mL), recorded at room temperature.
Sustainability 17 07504 g004
Figure 5. (a) Absorption and (b) fluorescence spectra of Chls and OFI dye solutions in toluene at different concentrations. Excitation wavelength of 405 nm and power of 25 mW; integration time of 250 ms.
Sustainability 17 07504 g005
Figure 6. (a) Streak camera image for OFI dye solution with concentration of 0.1 mg/mL in toluene. (b) Fluorescence intensity (black circles) as a function of decay time at 685 nm (wavelength where maximum emission occurs) and related fitting curve (red line), and (c) at maximum secondary peak emission at 725 nm. The mono-exponential decay across the 675–730 nm window confirms that both emission features arise from the same monomeric species.
Sustainability 17 07504 g006
Figure 7. (a) Fluorescence spectra of the Opuntia ficus-indica (OFI) dye dissolved in toluene (black line) and of polymers (PMMA, PVP, and PVA) enriched with OFI dye. Excitation wavelength of 405 nm and power of 5 mW; integration time of 1 s. Photographs of emitted fluorescence of the analyzed samples: (b) OFI dye in toluene; (c) OFI dye in PMMA; (d) OFI dye in PVP; and (e) OFI dye in PVA.
Sustainability 17 07504 g007
Figure 8. Fluorescence spectra of the OFI extract dissolved in toluene (a) and enriched with PMMA (b), PVP (c) and PVA (d) at time 0 (dashed line) and after 6 months (continuous line). The Y-axis scale is different between (a,d) and (b,c).
Sustainability 17 07504 g008
Figure 9. Photographs of OFI extract in water: (a) initial solution, (b) after 1 h of CO2 insufflation, (c) after 8 weeks. (d) Fluorescence spectra of initial solution (black line), after 1 h of insufflation with CO2 (red line) and after 8 weeks (blue line). Laser power: 35 mW; integration time of 1 s for black and red line; integration time of 5 s for blue line due to low signal.
Sustainability 17 07504 g009
Figure 10. pH influences on Chls fluorescence. (a) Initial pH 4.30 increased to (b) pH 11.60; decreased to (c) pH 4.30 and increased again to (d) pH 11.60.
Sustainability 17 07504 g010
Figure 11. pH-induced degradation of Chl in the aqueous medium: the changes in the fluorescence spectra followed by pH change for 8 weeks. Excitation power of 35 mW and integration time of 5 s. (a) pH 4.30, (b) pH 11.60.
Sustainability 17 07504 g011
Figure 12. Photographs of OFI extract in water: (a) initial solution, (b) after 3 h of O2 insufflation, (c) after 1 week. (d) Fluorescence spectra of initial solution of OFI dye in water/ethanol mixture (black line), after 3 h of insufflation with O2 (blue line) and after 1 week (red line). Laser power of 15 mW and integration time of 5 s.
Sustainability 17 07504 g012
Disclaimer/Publisher’s Note: The statements, opinions and data contained in all publications are solely those of the individual author(s) and contributor(s) and not of MDPI and/or the editor(s). MDPI and/or the editor(s) disclaim responsibility for any injury to people or property resulting from any ideas, methods, instructions or products referred to in the content.