Article

Smartphone-Based Assessment of Bicycle Pavement Conditions Using the Bicycle Road Roughness Index and Faulting Impact Index for Sustainable Urban Mobility

1
Department of Road Transport, Korea Transport Institute, Sejong-si 30147, Republic of Korea
2
Research Institute, RoadKorea Inc., Yongin-si 18471, Republic of Korea
3
Department of PPP Infrastructure Management, Korea Transport Institute, Sejong-si 30147, Republic of Korea
*
Author to whom correspondence should be addressed.
Sustainability 2025, 17(16), 7488; https://doi.org/10.3390/su17167488
Submission received: 2 June 2025 / Revised: 1 August 2025 / Accepted: 6 August 2025 / Published: 19 August 2025

Abstract

This study presents a smartphone-based dual-index framework for evaluating bicycle pavement conditions, aimed at supporting sustainable urban mobility and cyclist safety. Conventional assessment methods, such as the International Roughness Index (IRI), often overlook short-range discontinuities and are impractical for micromobility-scale infrastructure monitoring. To address these limitations, two perception-aligned indices were developed: the Bicycle Road Roughness Index (BRI), reflecting sustained surface discomfort, and the Faulting Impact Index (FII), quantifying acute vertical shocks. Both indices were calibrated through structured panel surveys involving 40 experienced cyclists and validated using high-frequency tri-axial acceleration data collected in both experimental and field settings. Regression analysis confirmed strong alignment between sensor signals and user perception (R2 = 0.74 for BRI; R2 = 0.76 for FII). A five-grade classification system was proposed, with critical FII thresholds at 87.3 m/s2 for “risky” and 119.4 m/s2 for “not rideable” conditions. Field validation across four diverse sites revealed over 380 hazard segments requiring attention, demonstrating the framework’s ability to identify localized risks that may be masked by traditional metrics. By leveraging off-the-shelf smartphones and open-source sensing tools, the proposed approach enables scalable, low-cost, and cyclist-centered diagnostics. The dual-index system not only enhances rideability evaluation but also supports targeted maintenance planning, real-time hazard detection, and broader efforts toward data-driven, sustainable micromobility management.

1. Introduction

As concerns over climate change, public health, and urban livability intensify, many cities are turning to active transportation to promote sustainable mobility. Among these modes, cycling is widely recognized for its environmental efficiency, spatial economy, and positive health effects. Governments have responded by expanding dedicated cycling networks and investing in bicycle-friendly infrastructure [1]. In Korea, the national bicycle road system now extends over 3600 km, linking urban cores with scenic and ecological corridors [2]. Cycling also contributes to modal integration by bridging first- and last-mile gaps and offering a low-cost alternative for underserved populations. Research has confirmed that active mobility reduces chronic disease risks, enhances mental health, and lowers all-cause mortality [3], while shared-use systems further support travel behavior shifts toward greener options [4].
In response to growing demand for better cycling infrastructure, many recent studies have focused on developing quantitative methods to evaluate surface comfort and safety. A scoping review analyzing 55 international studies classified existing evaluation methods into four categories: vibration-based indices, Bicycle Level of Service (BLOS), Bikeability Index (BI), and Bicycle Safety Index (BSI). It emphasized that objective vibration measurements are often validated using cyclist perception data and called for methods suited to field applicability with minimal hardware [5].
Several perception-aligned approaches have emerged. For instance, one study developed a portable sensor-based bicycle light system that assessed vibration intensity to identify discomfort zones, showing strong alignment with user feedback [6]. Another modeled vibration perception using tri-axial acceleration data to assess continuous comfort levels on urban cycling paths [7]. However, these methods primarily address general discomfort rather than acute hazard perception. While the International Roughness Index (IRI) is a widely recognized metric for evaluating longitudinal pavement roughness, its applicability to cycling infrastructure is limited. Prior studies have indicated that the IRI lacks sufficient sensitivity to short-range surface discontinuities—such as uplifted joints, potholes, and step faults—which are particularly critical for cyclists at low to moderate speeds [8]. Moreover, IRI-based assessments often rely on high-precision instruments or multi-sensor configurations, making them less feasible for low-cost, field-level deployment.
Although Reference [8] demonstrated that smartphone-based IRI adaptations can effectively measure general longitudinal roughness, we considered that additional analysis would be necessary to specifically evaluate the impact severity of discrete, localized hazards such as joint separations or abrupt vertical irregularities. To address these limitations, the present study proposes a smartphone-based dual-index framework capable of capturing both continuous surface degradation and abrupt shock-inducing hazards using minimal hardware.
While the referenced study successfully demonstrated detection of potholes and humps using smartphone-based sensors [9], its primary focus remained on measuring general longitudinal roughness rather than explicitly distinguishing between the types or severities of short-range discontinuities such as uplifted joints or root-induced faults. Moreover, many IRI-based methods require additional hardware, such as laser profilometers or inertial measurement units (IMUs), making them less suitable for municipal use due to cost and complexity [5]. From a practical perspective—especially for field practitioners managing urban cycling infrastructure—there remains a critical need for scalable, low-cost methods that can differentiate between sustained surface degradation and abrupt impact hazards without relying on complex instrumentation or calibration.
To address this gap, the present study proposes a smartphone-based dual-index evaluation framework that operates solely with a standard smartphone and bicycle mount, without requiring any external sensors or high-end instrumentation. The Bicycle Road Roughness Index (BRI) captures sustained ride discomfort by measuring average vertical acceleration, while the Faulting Impact Index (FII) quantifies short-term vertical shocks using signal vector magnitude from tri-axial acceleration data. Both indices were calibrated through structured panel surveys and validated across real-world sites. Unlike previous models that either require precision equipment such as laser profilometers or focus exclusively on either roughness or hazards, this study presents an integrated, cost-effective, and perception-aligned approach. By jointly evaluating surface degradation and localized impact severity, the proposed framework enables practical, scalable assessments for maintenance planning, real-time hazard identification, and post-construction quality checks—advancing cyclist safety and sustainable urban mobility.

2. Methodology

2.1. Study Area

The empirical investigation was conducted along selected corridors of the Republic of Korea’s national bicycle road network, following a dual-site selection strategy designed to fulfill two complementary objectives: experimental control and real-world variability. Site A, located along the Four Major Rivers cycling route in Sejong-si (Geumgang River), was intentionally chosen as the primary experimental site due to its geometric consistency, stable pavement conditions, and minimal environmental interference, specifically referring to the consistently low volumes of cyclist and pedestrian traffic, the absence of nearby vehicular roads, and the ability to schedule data collection during periods with stable weather conditions and minimal external disturbances. These factors ensured that the experimental measurements were not affected by sudden changes in traffic patterns, unexpected pedestrian crossings, or adverse weather events such as rain or strong winds. The test site is illustrated in Figure 1.
These characteristics allowed for controlled measurement of vibration responses solely attributable to pavement texture and aligned with domestic infrastructure assessment criteria. This site also provided a safe and repeatable environment for conducting the structured panel survey. In contrast, Sites B (Sejong, Geumgang River), C (Gwangju, Yeongsangang River), and D (Daejeon, urban area) were selected to capture the diversity of real-world pavement conditions, usage environments, and maintenance levels. These sites included both aging infrastructure and shared-use paths, thereby enabling validation of the proposed evaluation framework under operational conditions while maintaining accessibility and safety for repeated sensor-based measurements. The left panel shows the geographic distribution of all four study sites, and the right panel offers a detailed view of ten designated panel survey segments within Site A. These segments were selected to include both smooth and discontinuous surfaces, ensuring that user perception could be tested across a range of surface conditions within a controlled field environment. This area served as the empirical foundation for developing perception-driven classification models for BRI and FII, based on cyclist feedback gathered from ten designated segments collectively. These segments were selected to represent diverse pavement conditions and usage patterns, including variation in surface type, construction age, and visible distress levels. While maintaining cross-sectional consistency to minimize external variability, the segment selection was designed to ensure meaningful contrasts in ride quality and impact severity.
To estimate bicycle traffic volumes, embedded sensor counter data were combined with GPS-based activity logs from the STRAVA platform (San Fransico, CA, USA) [10]. These data were calibrated using sensor-derived adjustment factors, enabling consistent annual average daily traffic (AADT) estimations across all segments. The resulting dataset provided a solid empirical basis for deriving user-informed thresholds for both ride comfort and perceived risk, supporting the development of a robust five-level classification system [11]. To evaluate the generalizability of the proposed classification system, three additional sites—Sites B, C, and D—were incorporated into the study, as summarized in Table 1. These locations offered distinct combinations of pavement conditions, usage environments, and construction histories, allowing for a robust validation of the BRI and FII thresholds beyond the controlled setting of Site A. Site B, spanning 38.2 km, included a mix of bicycle-only lanes, pedestrian-shared paths, and segments with vehicular interaction. It also encompassed the original ten segments from Site A, ensuring consistency between model development and field validation [12].
Site C extended over 50.2 km along a riverside corridor that traversed both urban and rural zones. The route featured levee-top paths that served as low-volume car–bicycle shared facilities and exhibited significant variation in pavement material and maintenance status. These features made Site C well-suited for testing FII sensitivity under mixed operational conditions [13]. In contrast, Site D, located in a dense urban setting, covered 14.7 km of infrastructure integrated within pedestrian-dominant environments. Originally constructed through sidewalk conversions in the early 1990s, many segments of Site D showed signs of aging and inconsistent upkeep. The frequent presence of pedestrians, intersections, and degraded surfaces provided a demanding context for assessing the responsiveness of BRI and FII to both rideability and perceived safety risks [14].

2.2. Experimental Setup and Data Collection

All validation trials were conducted under a standardized experimental protocol to ensure consistency and reproducibility across test environments. The instrumentation setup comprised a 700C urban commuter bicycle with 25 mm-wide clincher tires inflated to 90 psi and mounted on an aluminum alloy frame and fork—chosen to reflect typical real-world cycling configurations. Tire pressure was verified before each run using a digital gauge to maintain uniform rolling resistance and vertical stiffness throughout the tests.
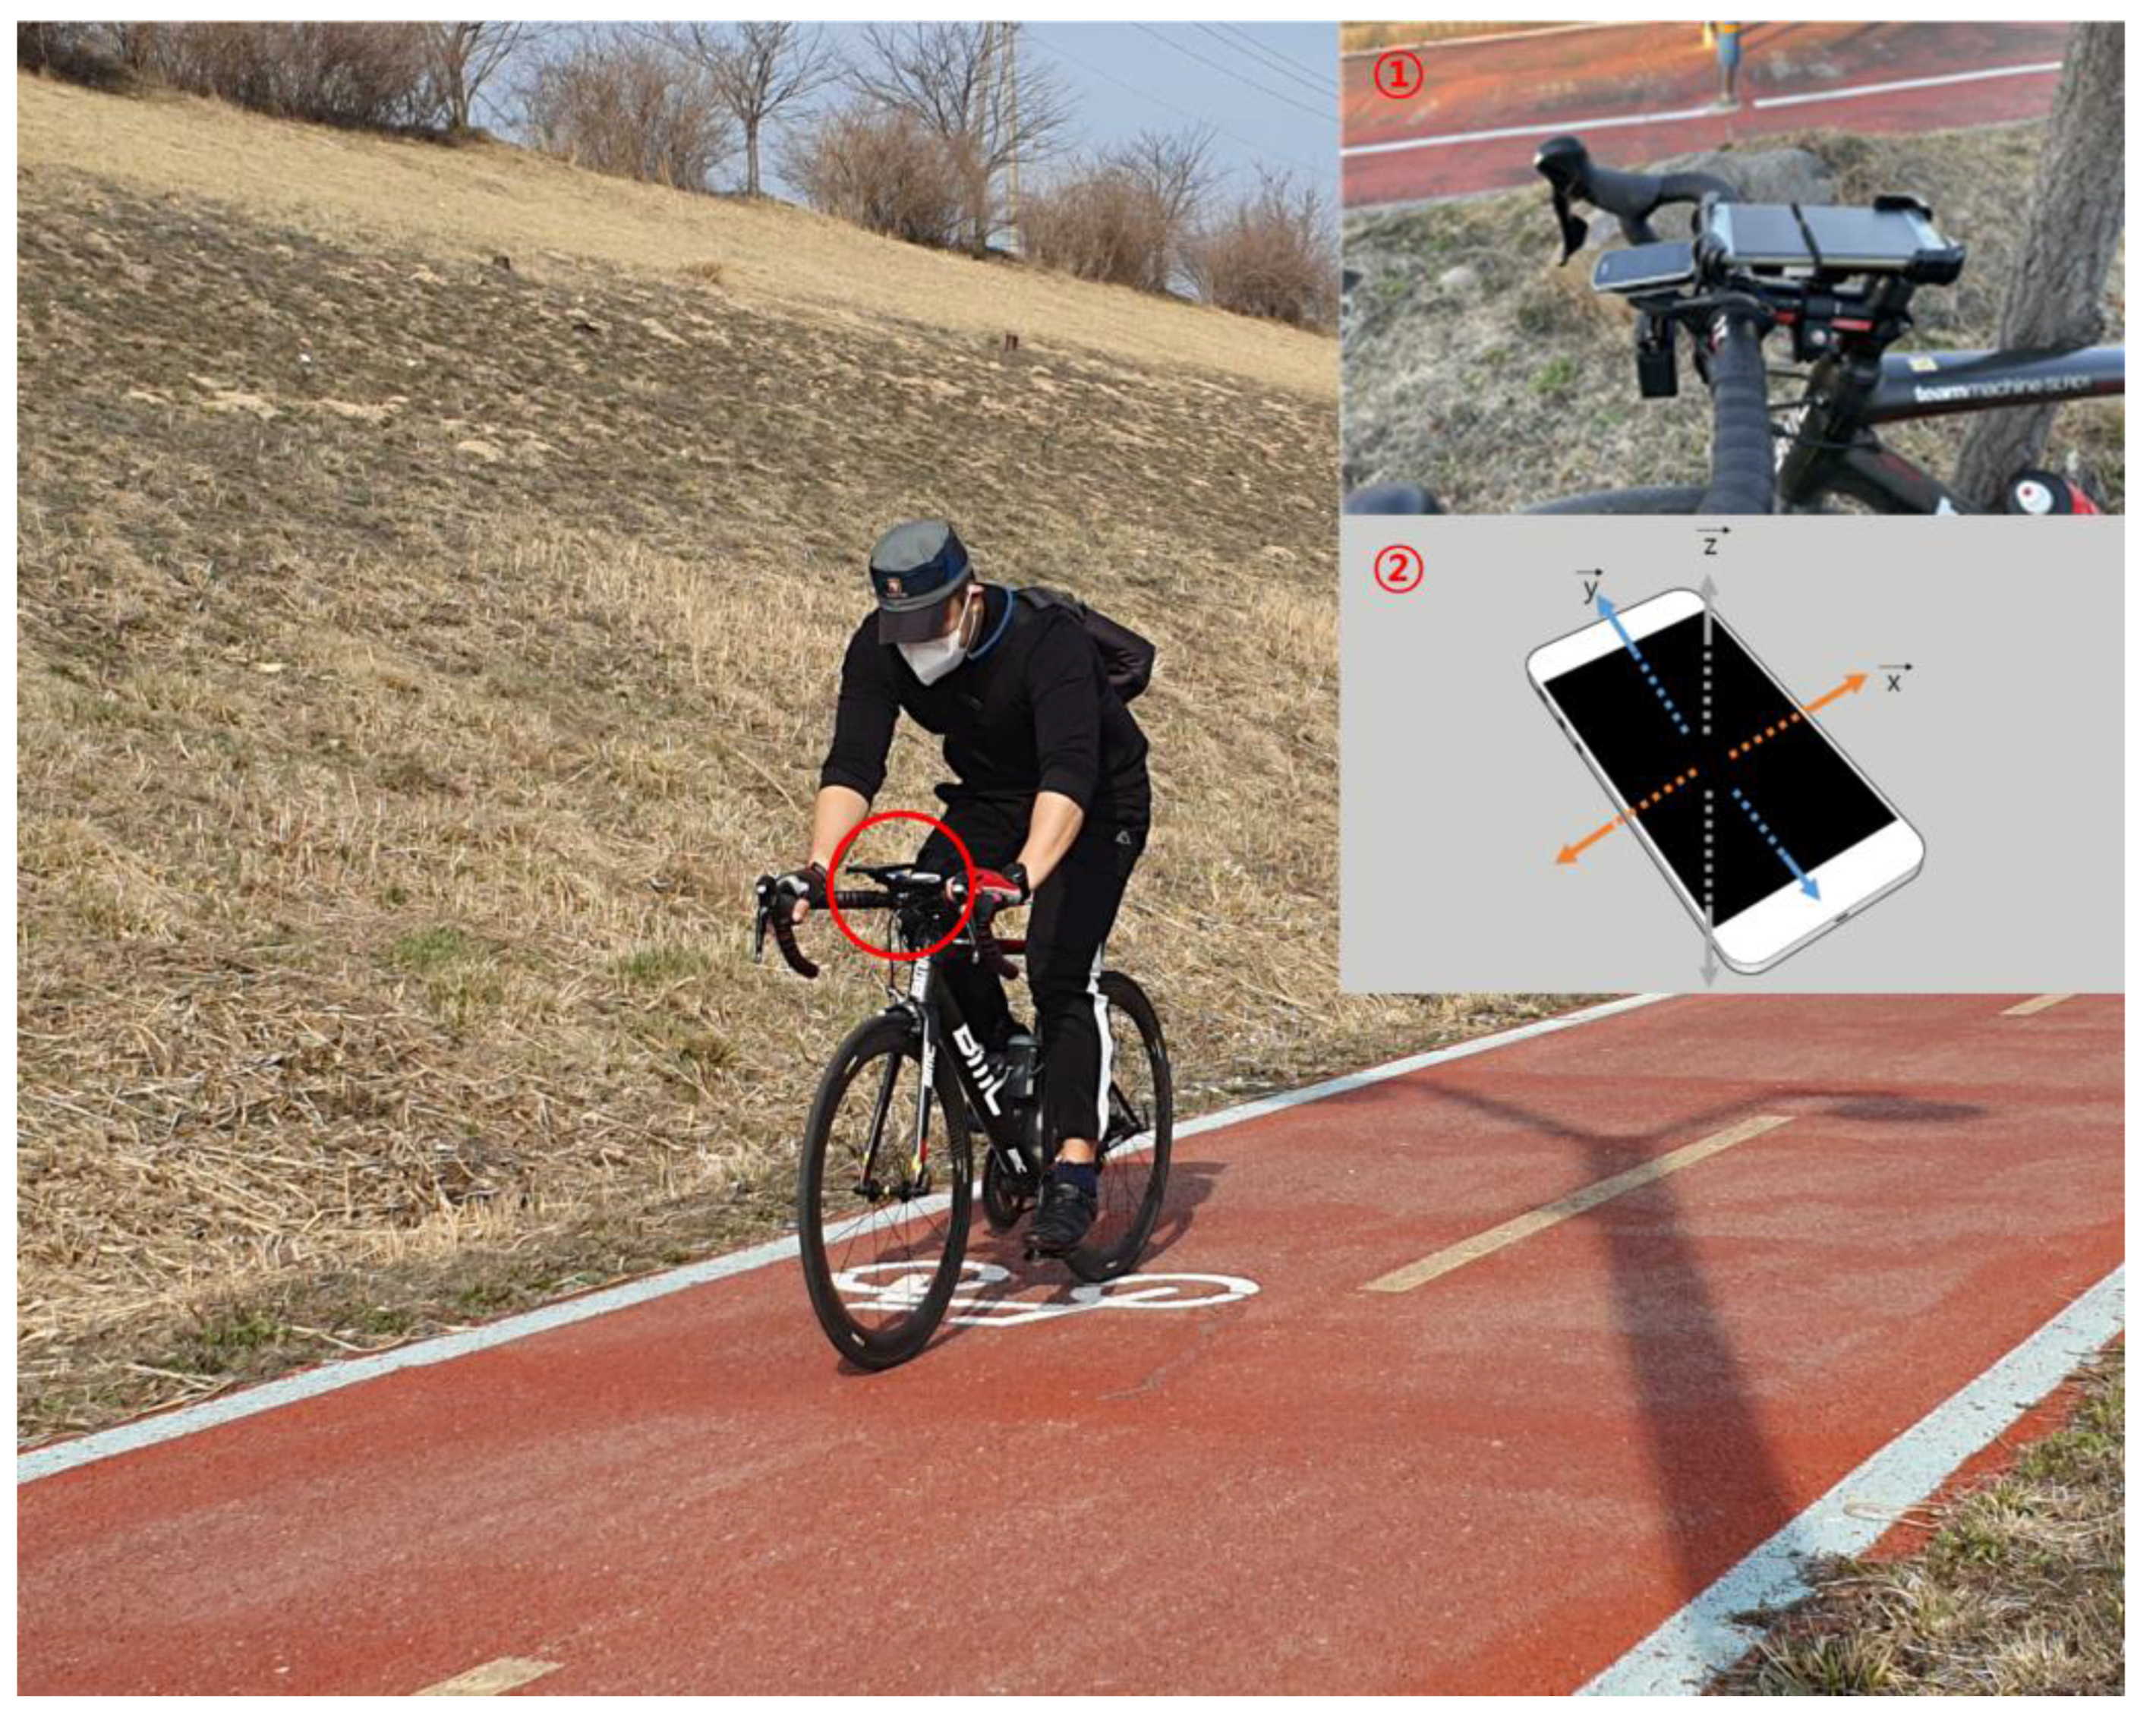
The smartphone-based sensing system consisted of a Samsung Galaxy S22 smartphone (Samsung, Suwon, Republic of Korea) securely mounted on the bicycle stem using a rubber-cushioned, vibration-isolating holder to ensure stable data acquisition. The device’s built-in tri-axial accelerometer recorded acceleration data along the lateral (X), longitudinal (Y), and vertical (Z) axes, with the Z-axis oriented vertically to enhance sensitivity to pavement-induced shocks [10]. A digital speedometer and a rear-facing action camera (GoPro, Inc., San Mateo, CA, USA) were also installed to support real-time speed monitoring and post-trial video verification.
Acceleration and GPS data were collected at a sampling rate of 100 Hz using a custom-developed mobile sensing application designed specifically for this study. While the general concept of commercially available apps, such as Physics Toolbox Sensor Suite and similar modular sensing toolkits, has been utilized in previous research [10,15], those studies often relied on custom-developed hardware or software systems inspired by the integrated “toolbox” approach, rather than direct use of the app itself. In our study, Physics Toolbox Sensor Suite was reviewed during the preliminary stage for benchmarking, and we recognized that it essentially transforms a mobile device into a suite of scientific instruments, enabling users to conduct a variety of physics experiments. However, previous toolkits or apps were found to be unsuitable for our application due to limitations in controlling sampling intervals, exporting GPS data formats, and compatibility with Korean base maps. In contrast, our custom app was developed to enable synchronized GPS logging, high-frequency (100 Hz) data acquisition, and seamless integration with Korean GIS systems. The application’s user interface allowed researchers to monitor sensor status and manage recording sessions in the field. Location information was obtained solely through the smartphone’s GPS sensor (Wi-Fi was not used). The app collects sensor data at specified intervals, saves the results as CSV files in a measurement result list, and allows data sharing via the smartphone’s sharing function [13]. To ensure precise speed control (15, 20, and 25 km/h), riders were guided by the digital speedometer and monitored by field assistants. Trials deviating by more than ±1.0 km/h from the target were repeated. These speeds were determined through pilot testing as representative of actual urban cycling behavior. The experimental track consisted of a 500-m closed loop with three zones: a 200-m acceleration segment, a 100-m test zone with engineered surface faults, and a 200-m deceleration segment. Fault types included upward discontinuities (constructed with raised wooden platforms of 10, 20, and 30 mm) and downward faults (recessed edges simulating real-world hazards such as joint gaps or root heaves) [16]. Each speed–fault combination was tested 50 times, and tri-axial acceleration data were extracted within a 1-s analysis window (0.5 s before and after impact). Video footage from the action camera supported manual verification of each fault encounter. To supplement controlled testing, field validation was conducted at Sites B, C, and D, using the same instrumentation under real-world conditions to assess generalizability. These sites represented diverse pavement types and maintenance histories. Lastly, inter-device reliability was verified through comparative testing with multiple smartphone models. Given the 0.1-s sampling resolution, inter-device variability was minimal and deemed acceptable for roughness classification purposes rather than high-precision shock quantification. This concept is described in Figure 2.

2.3. Development and Calculation of Surface BRI and FII
To evaluate both overall ride quality and localized surface hazards, this study employed two previously established indices—BRI and FII—which were revalidated under controlled field conditions. Both indices are derived from tri-axial acceleration data collected via a smartphone rigidly mounted to the bicycle’s stem [17]. BRI quantifies sustained vertical vibration over a segment by calculating the mean of absolute Z-axis acceleration values, a method chosen to minimize interference from lateral movements such as steering. These raw values were averaged over the segment and adjusted by cycling speed to account for differences in segment traversal time. The resulting BRI computation reflects the average intensity of vertical motion experienced by the cyclist, normalized for velocity, and is expressed in Equation (1). Calibration of the formula was performed using cyclist perception data gathered through the panel survey, ensuring that the index meaningfully corresponds to panel rating.
B R I = ( Z 1 + Z 2 + + Z n 1 + Z n ) T = ( ( Z 1 + Z 2 + + Z n 1 + Z n ) ) × V T
T: driving speed(s) = sampling interval is per 0.01 s
L: driving distance
V: driving speed (km/h)
To account for variability in cycling speed, a correction factor derived from a non-linear regression model was applied to normalize BRI values within the 15 to 25 km/h range. This adjustment ensures that roughness estimates remain consistent and comparable across different riding velocities during field trials. In contrast to BRI, which reflects sustained ride discomfort, FII was designed to detect abrupt, high-intensity shock events caused by vertical surface irregularities such as step difference, potholes, and joint misalignments. A step difference is a sudden vertical height change between two adjacent pavement surfaces, such as at the edge of misaligned concrete slabs, manhole covers, or root-lifted sections of asphalt, which can cause jarring shocks or loss of control for cyclists. Moreover, FII was computed using signal vector magnitude (SVM), which represents the Euclidean norm of the tri-axial acceleration components (X, Y, Z). Initially developed for motion detection in human biomechanics, the SVM method was adapted in this context to capture transient impact events that pose safety risks to cyclists [18].
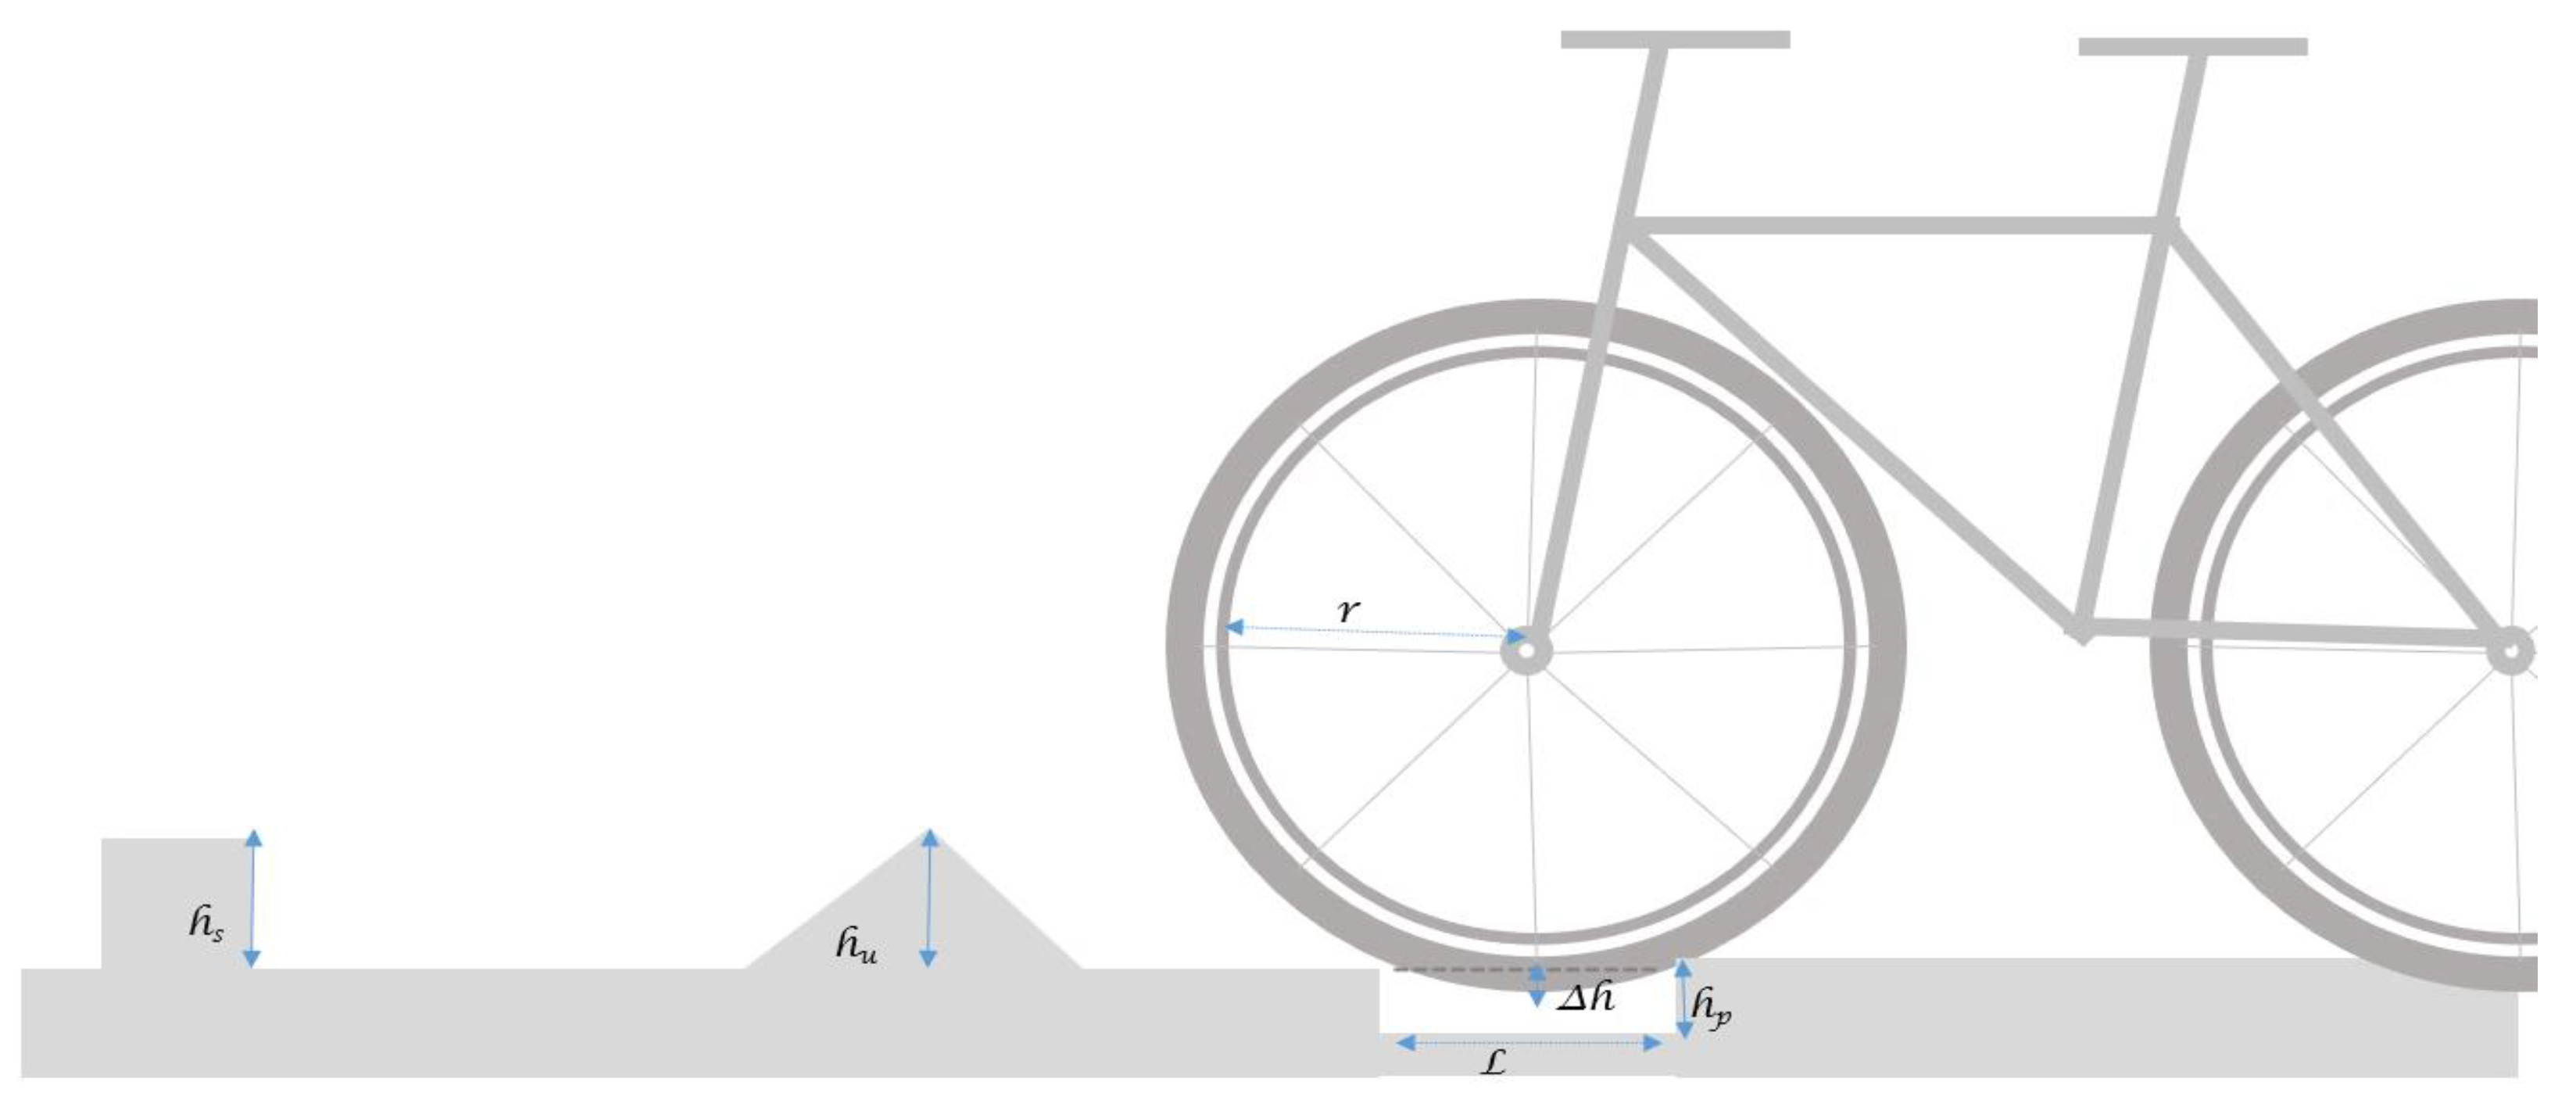
h = r r 2   L 2 2 < h p   T h a t .   L 2 r
h p = h   ( That. L > 2r)
h = maximum height of pothole step difference
r = wheel radius
L = pothole diameter
h p = p o t h o l e ( o r   s i n k h o l e   d e p t h , downward step differences)
Figure 3 and Equation (2) illustrate the geometric derivation of vertical displacement (∆h) as a bicycle wheel traverses a discontinuity, based on the fault width (L) and wheel radius (r). When the fault is narrower than the wheel diameter (L ≤ 2r), ∆h is calculated using the chord height formula. For wider faults, ∆h corresponds directly to the vertical depth of the discontinuity ( h p ). This distinction is critical because, even at the same depth, step-type faults generate greater impact forces than rounded depressions like potholes [19]. As represented in Equation (3), step difference led to more abrupt elevation changes, producing higher acceleration spikes and thus greater FII values than equivalently deep potholes or mounded defects.
a h s a h p a h M
∆ahs = 3-axis linear acceleration change of the step (m/s2)
a h p = 3-axis linear acceleration change of the pothole (m/s2)
∆ahM = 3-axis linear acceleration change of the road surface bulge (m/s2)
Figure 3. Concept diagram and simulation experiment to find acceleration changes at hazardous points using bicycle.
Sustainability 17 07488 g003
To replicate realistic fault conditions, modular step discontinuities were installed along the test course. Upward faults were created using 30 mm wooden blocks fixed on the pavement surface, while downward faults of equivalent height were formed by embedding wooden plates flush with the ground. Structural integrity and dimensional precision were confirmed through preliminary testing. Acceleration signals were collected within a 1-s window centered on the point of traversal (0.5 s before and after) at a sampling rate of 100 Hz, ensuring high-resolution capture of impact events. These data enabled consistent detection of transient shock responses along the vertical axis. The FII at each time point (FIIᵢ) was computed using signal vector magnitude (SVM), representing the Euclidean norm of tri-axial acceleration changes, as shown in Equation (4). To ensure statistical robustness and account for variability in rider response and measurement noise, each test configuration—defined by a specific fault height and cycling speed—was repeated 50 times with each vehicle speed under controlled conditions.
F I I S V M I = x i 2 + y i 2 + z i 2
FII(SVMI) = Step impact index, sum of the magnitudes of the 3-axis acceleration vectors
xi2 = Change in x-axis acceleration at point i
yi2 = Change in y-axis acceleration at point i
zi2 = Change in z-axis acceleration at point i

2.4. User Evaluation of Rideability Using Surface Roughness and Risk Assessment

To validate the proposed indices against real-world user perception, a structured panel survey was conducted involving 40 experienced cyclists residing in Sejong City. The panel size of 40 was chosen to ensure a statistically robust sample, balancing practical feasibility with sufficient diversity to capture a range of user experiences and perceptions. All participants were regular road bike users—either for commuting or recreation—and were familiar with the study area. The panel was predominantly male (82%), with a high representation of riders in their 30s and 40s (30% each), reflecting the demographic profile of typical urban cyclists. Each participant completed a rideability assessment across ten designated field segments, enabling comprehensive evaluation and reliable calibration of the indices.
For evaluating surface comfort using BRI, cyclists conducted test runs at controlled speeds of 15, 20, and 25 km/h. After each run, they rated the perceived surface smoothness using a five-point panel rating ranging from “Very Good” to “Very Uncomfortable.” (5 = Very Good, 4 = Good, 3 = Fair, 2 = Slightly Uncomfortable, 1 = Very Uncomfortable). To ensure consistency, all participants received a protocol briefing and were equipped with safety gear. Riders were instructed to maintain a stable posture and steady speed, minimizing steering or braking to isolate vibration-related feedback.
For the FII evaluation, the same panel performed fault traversal experiments using artificial step differences of 10 mm, 20 mm, 30 mm, and 40 mm. The 10–30 mm faults were physically traversed at the same controlled speeds used in the BRI trials. After each run, participants rated the perceived impact severity using a five-level verbal scale: Safe, Slightly unsafe, Risky, Very risky, and Not rideable. Owing to safety concerns, the 40 mm fault was not traversed during physical testing [11]. Instead, participants evaluated its perceived severity using video footage and standardized verbal descriptions. This protocol ensured participant safety while preserving consistency across all hazard assessments. Hazard panel testing derived from both physical trials and video-assisted evaluations were then matched to their corresponding FII values, enabling an empirical investigation into the relationship between perceived severity and objectively measured impact intensity. The resulting perception-informed thresholds formed the foundation of the five-level hazard classification system described in the subsequent sections. A summary of the panel evaluation criteria is provided in Table 2.

2.5. Pilot Test Assessment Using Measurement Equipment

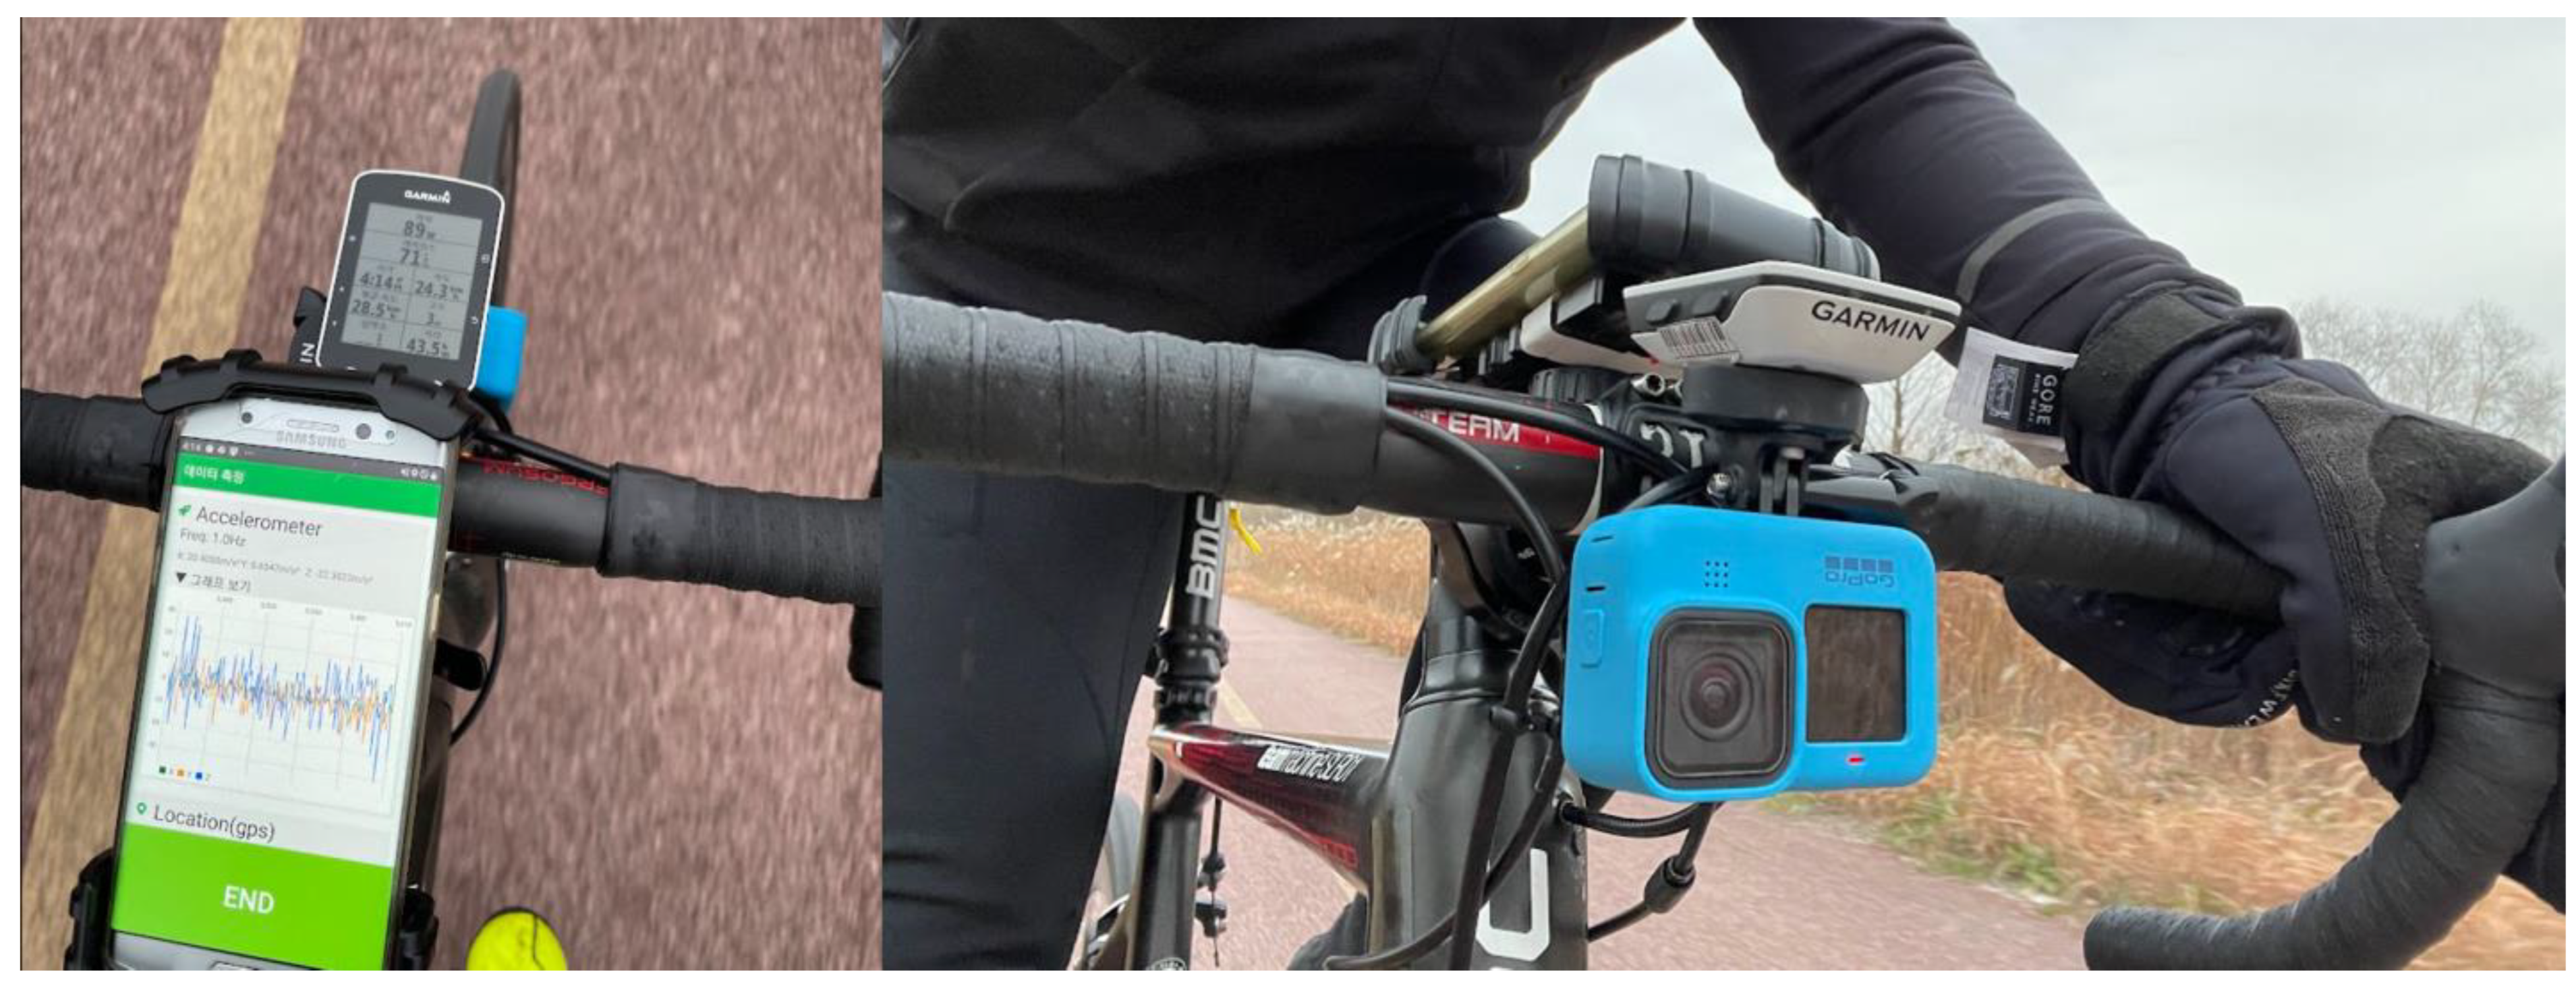
The primary objective of the field assessment was to evaluate pavement surface conditions and identify hazard-prone segments using the BRI and FII grading systems derived from the panel survey. During each site inspection, a smartphone Samsung Galaxy S22 smartphone (Samsung, Suwon, Republic of Korea) equipped with a tri-axial accelerometer was securely mounted to the bicycle stem to record real-time vibration data. Supporting devices, including a digital speedometer and an onboard action camera, were also installed to log riding speed and visually document surface conditions. Acceleration and GPS data were collected via a dedicated mobile application and spatially aggregated in 100-m intervals to capture localized variations in pavement performance. Each 100-m segment was assigned a corresponding BRI grade and FII risk level, which were visualized using a GIS-based platform. In the resulting maps, darker red markers indicate zones with poor rideability or high perceived hazard, enabling quick identification of segments requiring intervention (Figure 4). This spatial visualization approach significantly improves operational efficiency by allowing maintenance personnel to prioritize areas based on objective, high-resolution data.
Importantly, trials showed that aggregating data at broader 1-km intervals masked critical localized defects that were clearly identifiable at the 100-m resolution. Therefore, the 100-m unit was adopted as the optimal analysis scale for condition monitoring and maintenance planning. The proposed evaluation framework not only facilitates detailed field-level diagnostics but also supports strategic, data-driven decision-making for bicycle infrastructure management.

3. Results

3.1. Panel-Based Surface Roughness Assessment Results

To evaluate cyclist-perceived surface quality under realistic riding conditions, a structured rideability survey was conducted across ten designated segments within Site A, following the protocol outlined in Section 2.4. All 40 panelists completed test runs at controlled speeds of 15, 20, and 25 km/h, rating surface comfort immediately after each run using a five-point panel rating ranging from “Very Good” (5) to “Very Uncomfortable” (1). Field assistants were present throughout the process to ensure procedural consistency and assist with segment transitions.
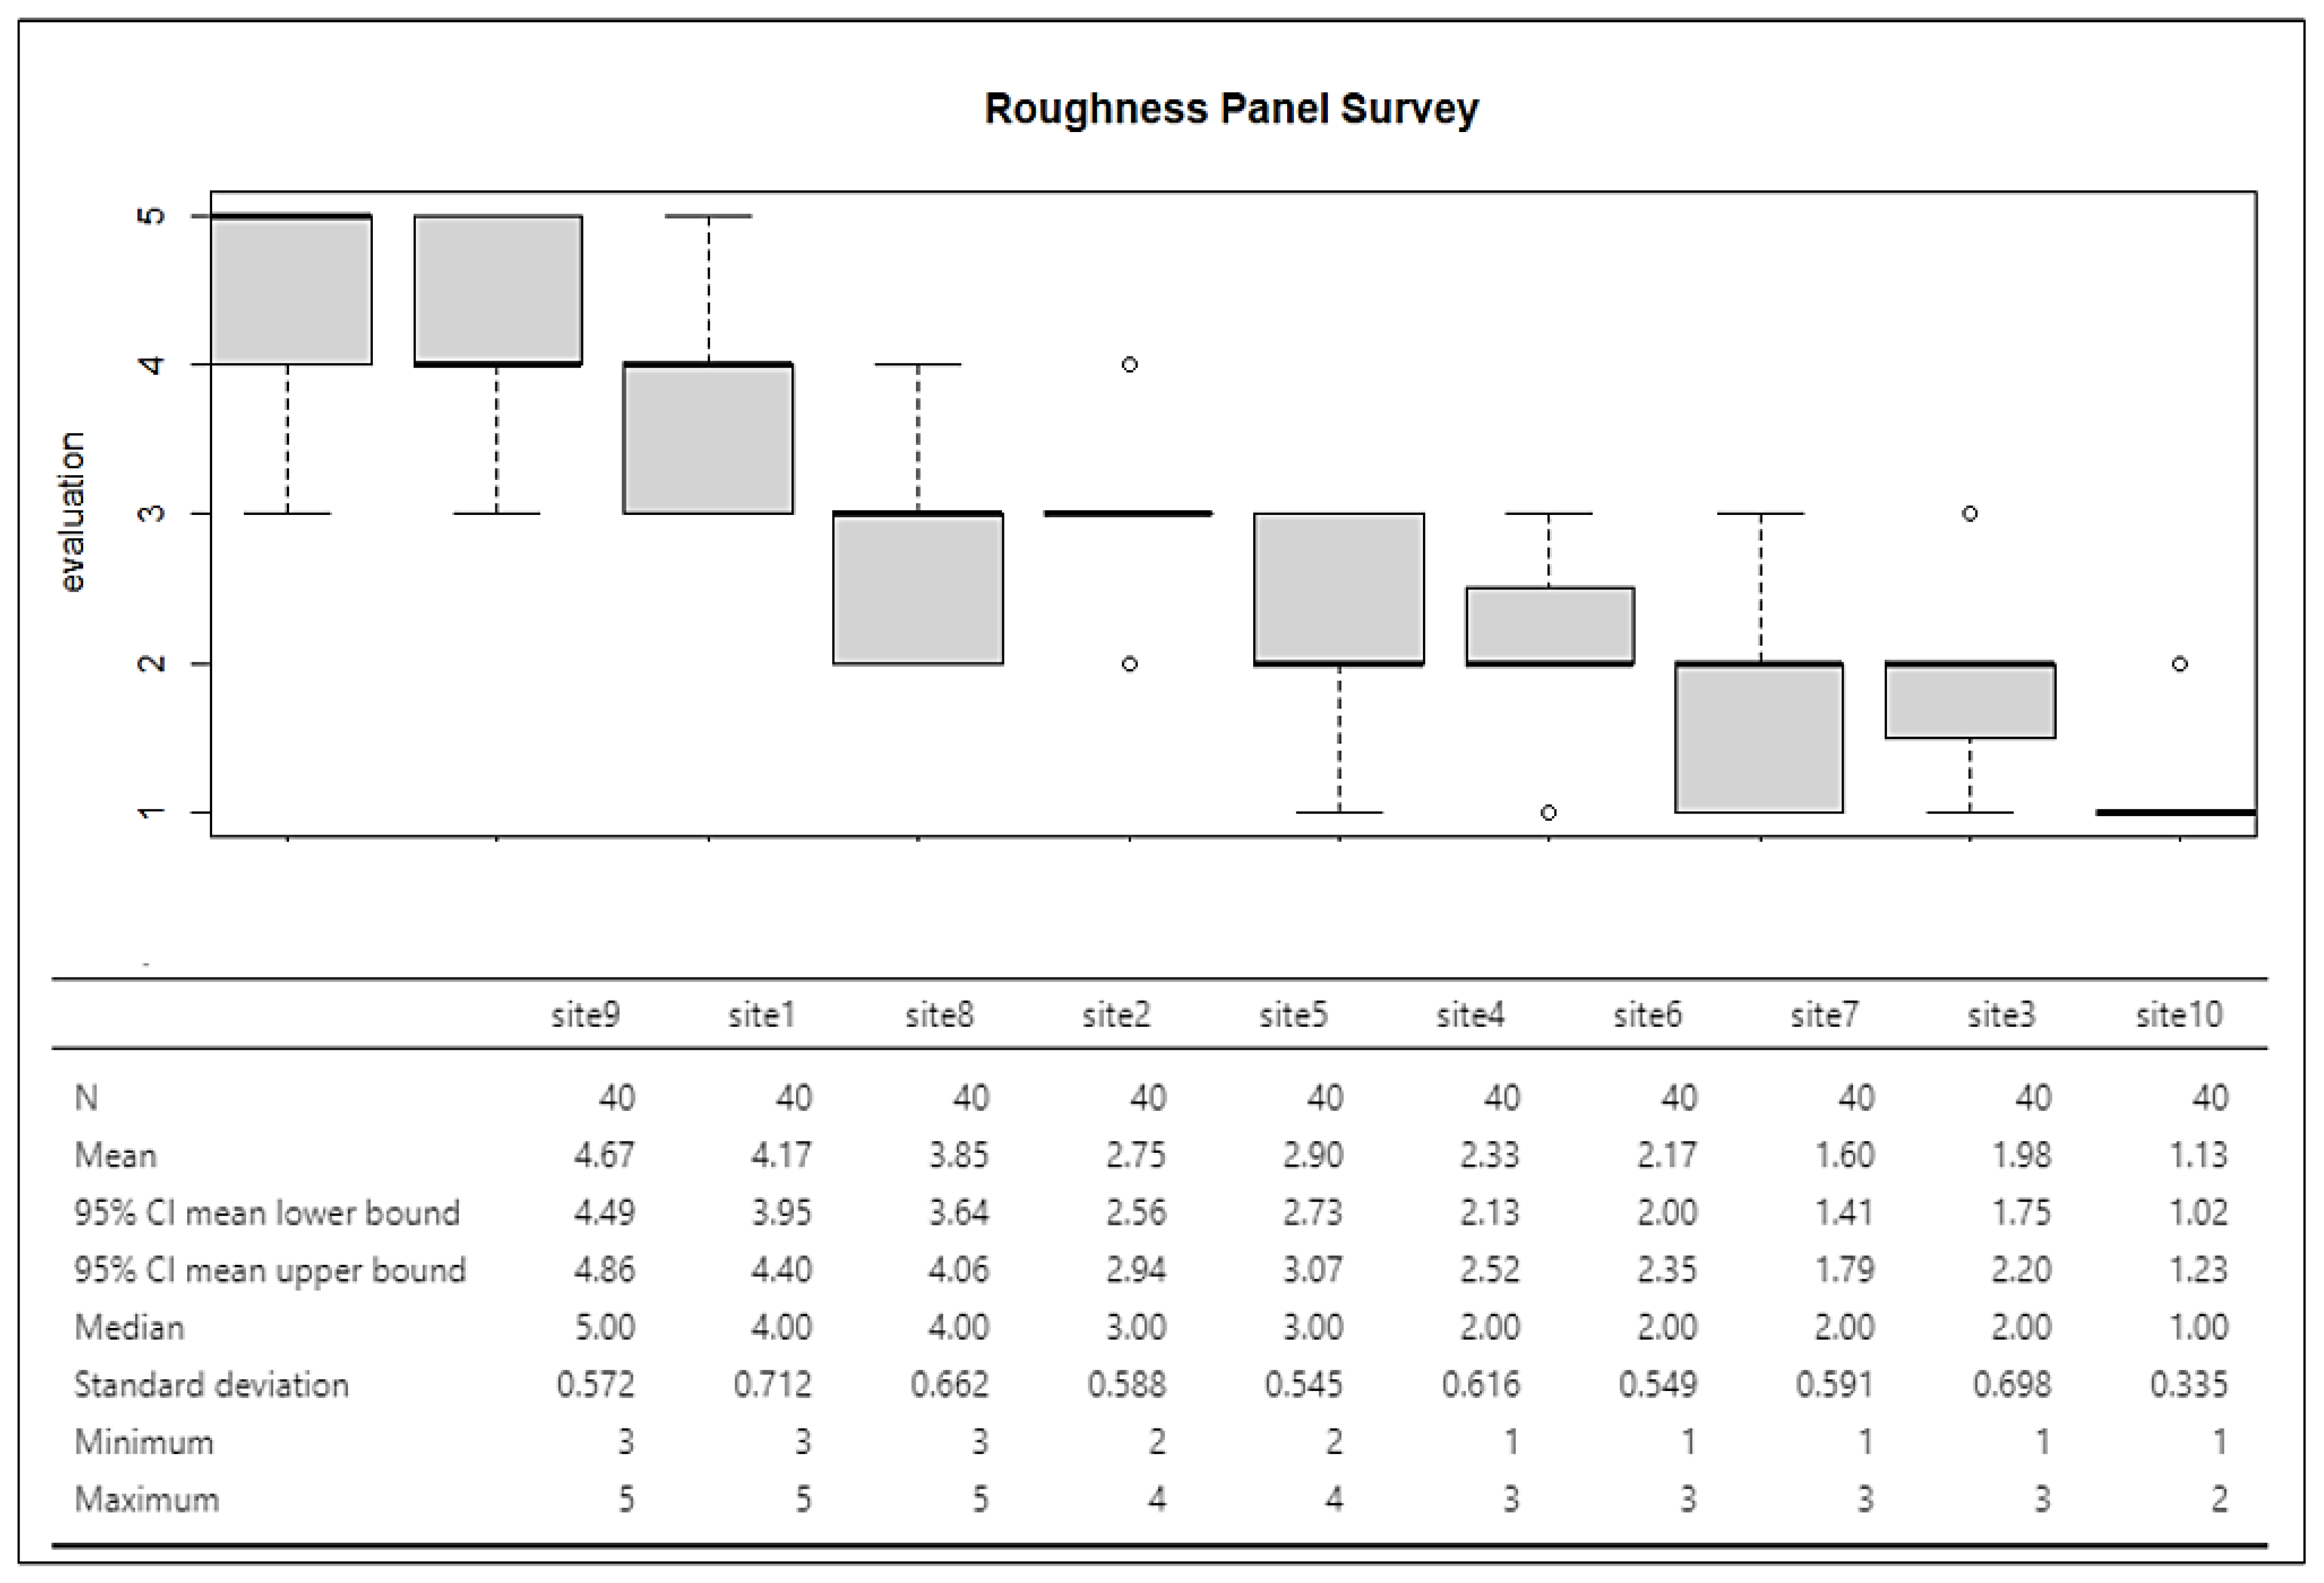
The results revealed clear variation in perceived ride quality across segments. Segment 9, a newly resurfaced asphalt section, received the highest average score of 4.67, indicating excellent comfort. It was followed by Segment 1 (4.17), Segment 8 (3.85), and Segment 5 (2.90), which were also rated favorably. In contrast, Segment 10—classified in Table 1 as a deteriorated segment exhibiting notable surface distress—received the lowest mean rating of 1.13, indicating pronounced rider discomfort. The relatively low standard deviation observed for this segment suggests a high level of agreement among panelists regarding its compromised condition. These results reinforce the validity of the panel-based assessment methodology and demonstrate the sensitivity of subjective ride comfort ratings to actual pavement deficiencies. A comprehensive distribution of rider evaluations across segments is provided in Figure 5.
A comparison by pavement type indicated that asphalt segments were generally perceived as smoother than concrete ones. However, Segment 8—constructed with concrete—received a relatively high comfort panel rate, suggesting that the quality of maintenance can outweigh material type in influencing rideability. Additionally, segments situated in mixed-traffic environments, including Segments 3, 4, and 10, consistently received lower ratings compared to bicycle-only paths.
This pattern underscores the negative impact of vehicular interaction and poor spatial design on rider comfort. Overall, the findings highlight that perceived ride quality is shaped not only by surface material and maintenance but also by the surrounding operational context. A detailed summary of segment-level comfort panel rate is presented in Table 3.
To quantify the relationship between perceived ride comfort and objectively measured pavement conditions, BRI values were calculated for each segment based on tri-axial acceleration data collected via smartphone sensors, as detailed in Section 2.3. The analysis revealed a strong negative correlation between BRI and user satisfaction. In other words, as BRI increases—indicating greater surface roughness—cyclists tend to perceive the ride as less comfortable. For instance, Segment 9, which received the highest comfort rating, recorded the lowest BRI value (2.00), while Segment 10 had the highest BRI (20.15), consistent with its lowest perceived rideability. Notably, Segment 1—despite being newly constructed—showed a higher BRI of 3.04 compared to Segment 9, indicating that new construction does not necessarily guarantee smoothness. Factors such as uneven compaction or surface segregation may contribute to this discrepancy.
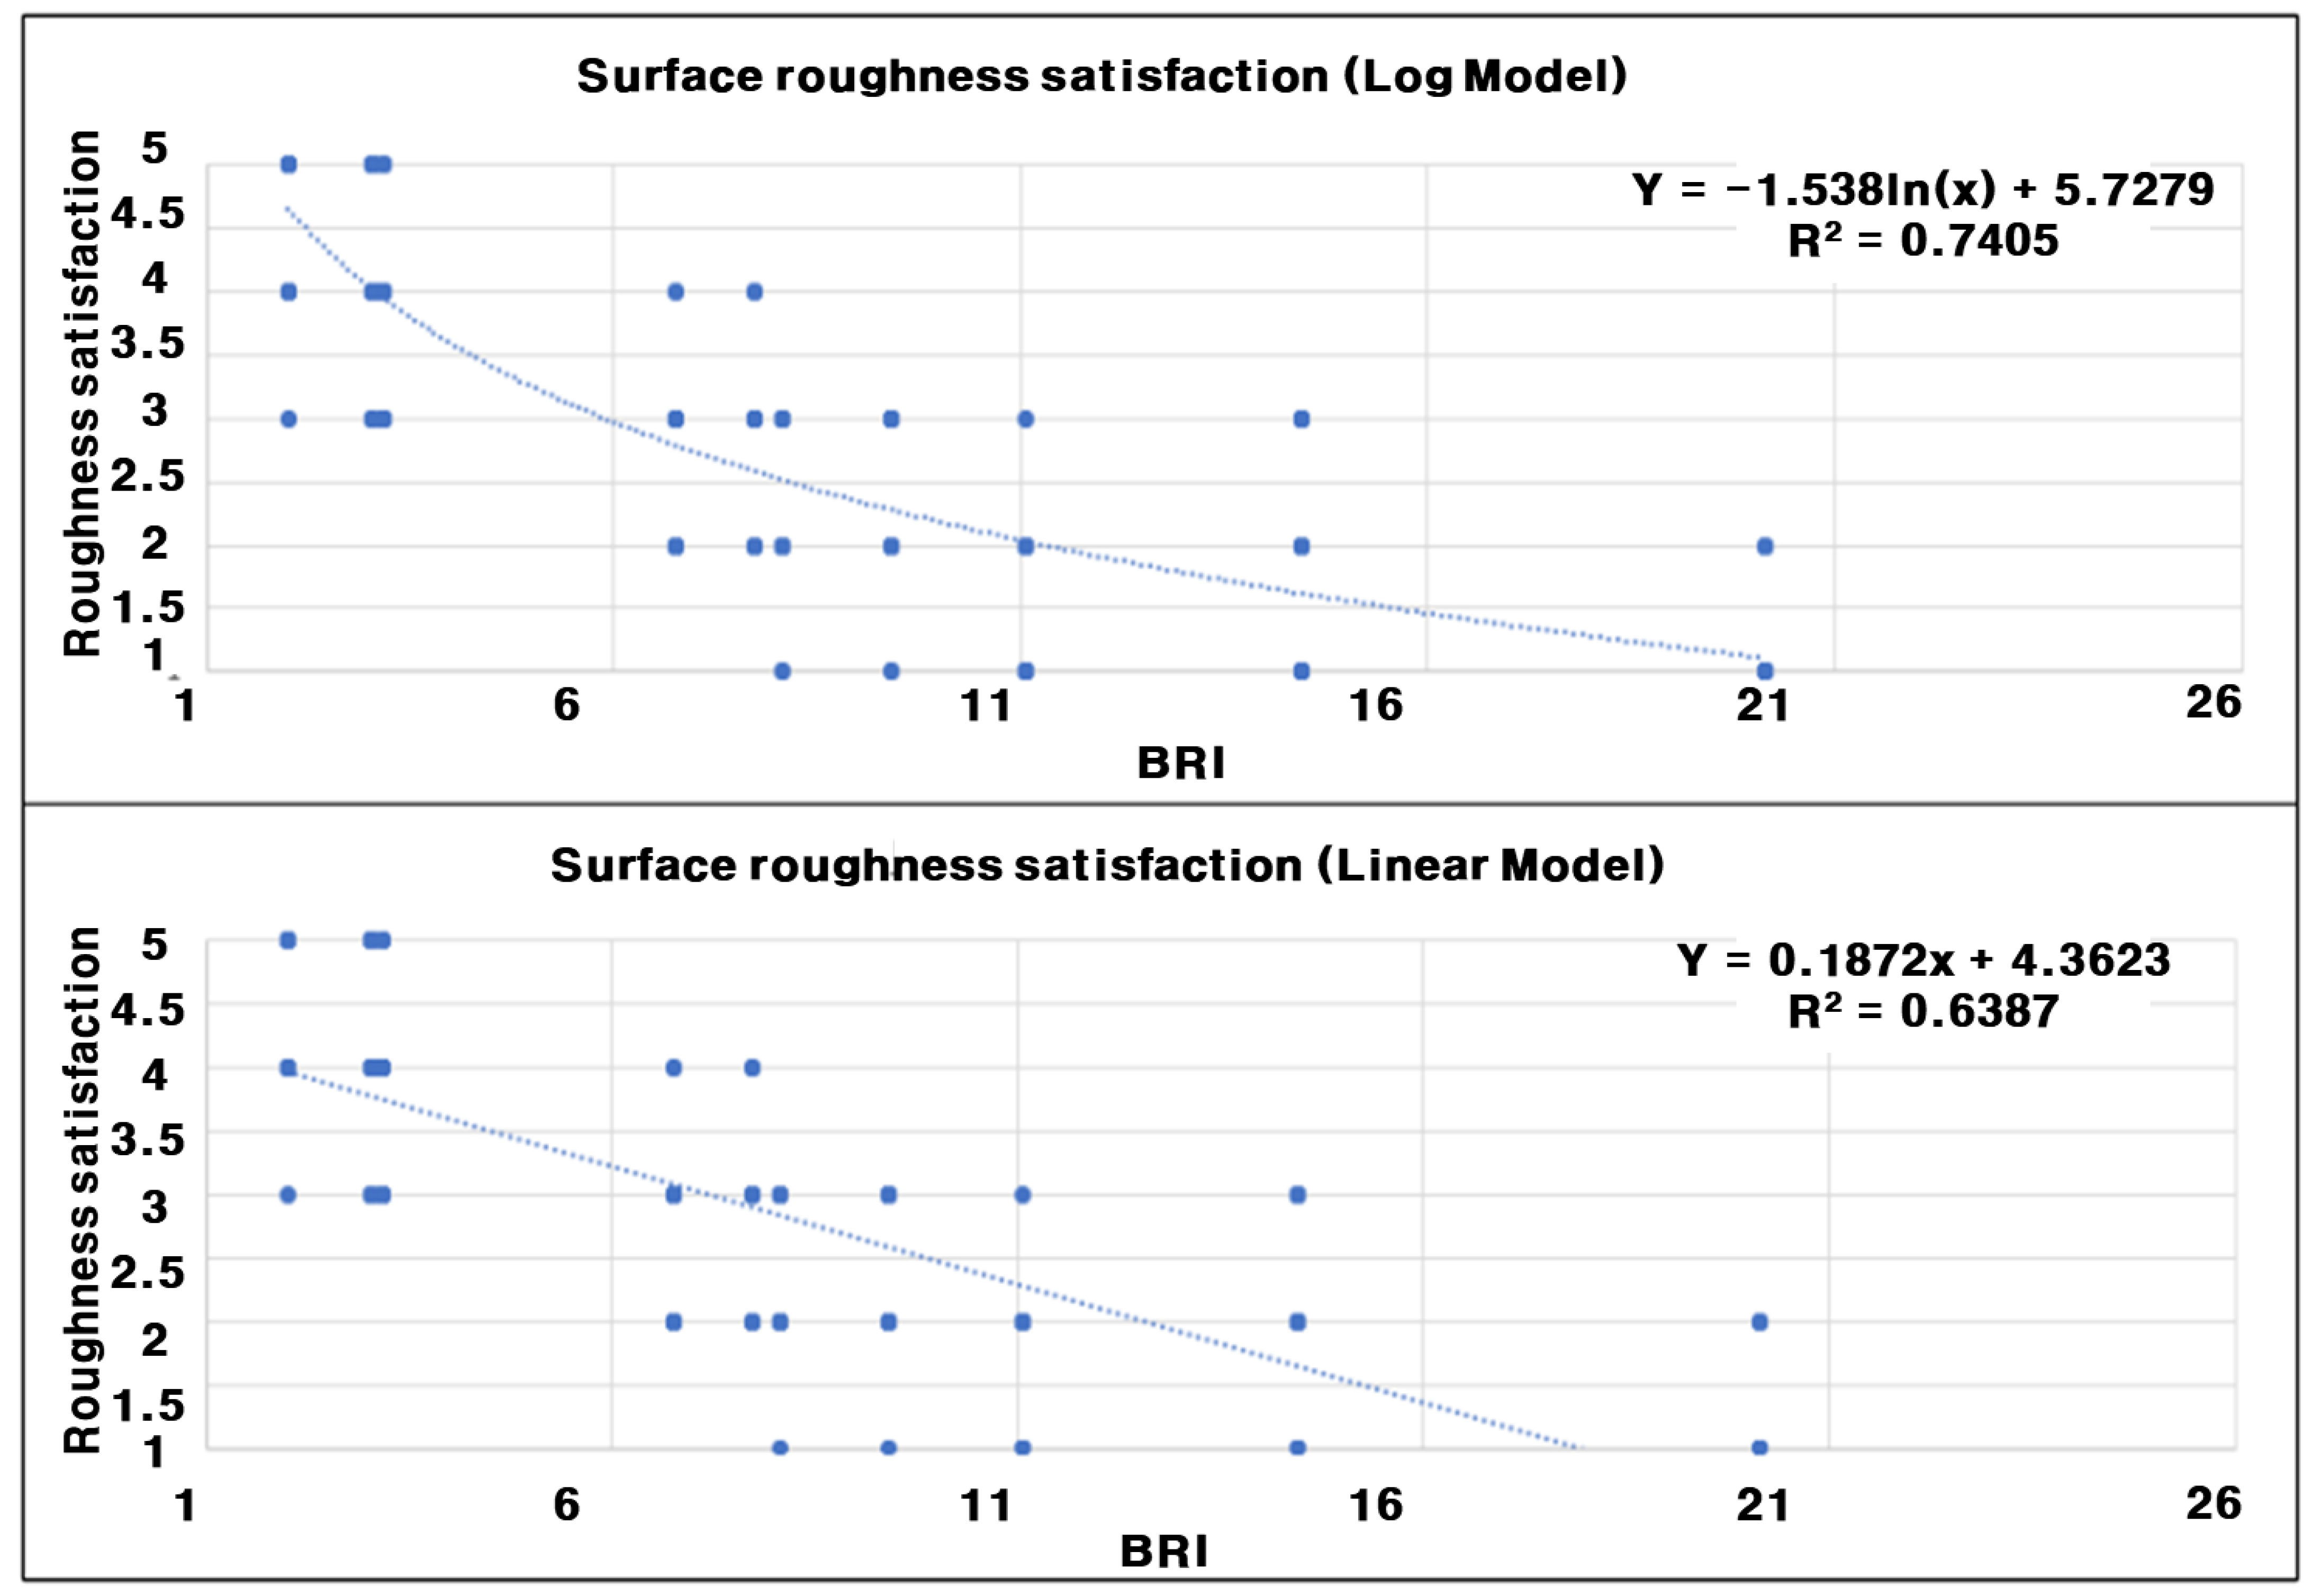
To model the relationship between BRI and comfort ratings, both linear and logarithmic regression analyses were performed. The linear model yielded a weaker fit and produced unrealistic outcomes, including negative BRI values at high satisfaction levels. In contrast, the logarithmic model showed superior performance and alignment with expected behavior, achieving an R2 of 0.74 compared to 0.63 for the linear model. This result supports the use of a logarithmic approach for capturing the non-linear relationship between surface roughness and user comfort [20]. The regression comparison is illustrated in Figure 6.
The superior fit of the logarithmic model supports its use in representing the predictive relationship between perceived ride comfort and measured surface roughness, consistent with established approaches in ride quality assessment. Based on this model, Equation (5) was developed to estimate user satisfaction as a function of BRI:
User Satisfaction = −1.538 × ln(BRI) + 5.7279
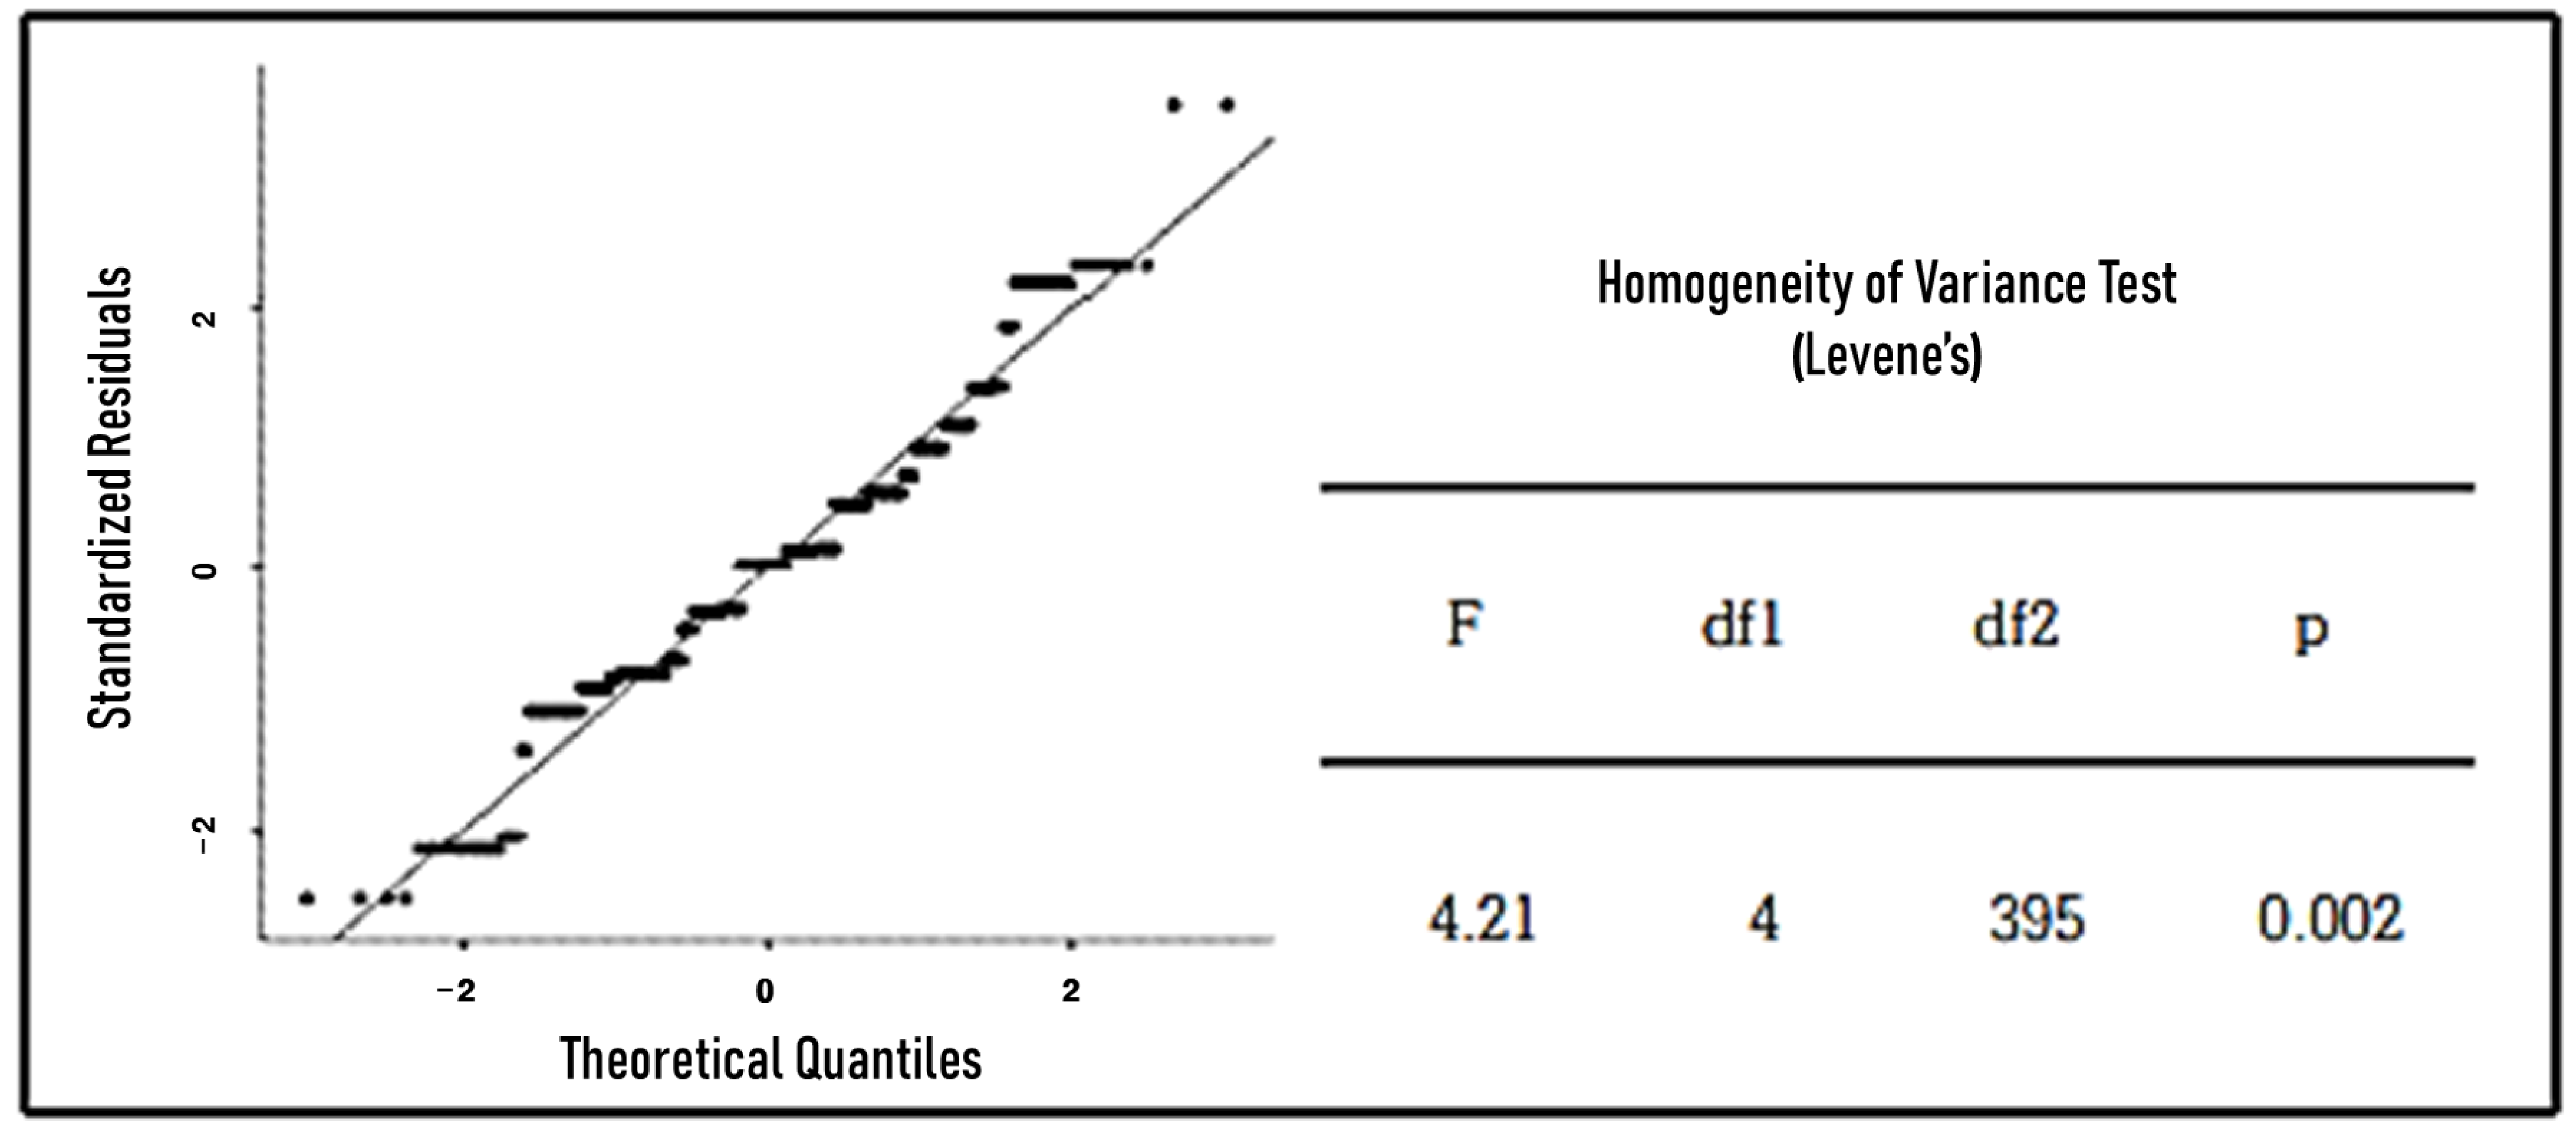
To assess the statistical robustness of the BRI-based classification system, Levene’s test for homogeneity of variances was performed across the five defined surface quality grades. The results illustrated in Figure 7 (F = 4.21, df1 = 4, df2 = 395, p < 0.002) indicated significant variance differences among the groups. Nonetheless, the overall variance structure remained sufficiently stable to ensure the internal consistency and external validity of the classification model. These findings confirm that the proposed BRI grading framework is reliable and suitable for practical application in diverse cycling infrastructure contexts.
From a policy and infrastructure management perspective, the proposed BRI-based grading system offers actionable thresholds for both design standards and maintenance prioritization. As shown in Table 4, a BRI value of 2.2 or less corresponds to Grade A, indicating very smooth pavement conditions typically found in newly constructed sections. For new bicycle roads, meeting this threshold is recommended to ensure optimal ride comfort. For existing infrastructure, periodic maintenance should aim to sustain conditions at or above Grade C (BRI ≤ 8.2) to preserve acceptable rideability. Segments falling into Grades D and E (BRI > 8.2) indicate substantial deterioration and should be prioritized for resurfacing, localized repairs, or reconstruction. This classification system provides a clear, perception-based basis for allocating maintenance resources and enhancing rider experience in both urban and interurban settings.

3.2. Risk Classification Based on Panel Perception of Risk Assessment

Survey results revealed that cyclists began to perceive discomfort at vertical discontinuities of approximately 10 mm or greater. As fault height increased, both the calculated FII values and user-reported risk levels showed a consistent upward trend across all riding speeds. At 20 mm, the average perceived risk level approached 2.8, aligning with the “Risky” category. Faults at 30 mm consistently received “Very risky” ratings, with mean scores ranging from 3.7 to 4.2 depending on speed. Although the 40 mm fault was not physically traversed for safety reasons, participants evaluated it as “Not rideable” (average score: 4.3–5.0) based on video demonstrations and guided interpretation.
Corresponding FII values also increased substantially with both fault height and riding speed. At 25 km/h, FII rose from 79.9 for a 10 mm fault to 128.2 for a 40 mm fault, underscoring the amplifying effect of higher speeds on impact magnitude. Regardless of speed, the relationship between fault severity and perceived hazard remained strongly aligned. This convergence between objective acceleration data and subjective risk perception validates FII as a meaningful indicator of cyclist safety risk. The observed consistency supports the empirical threshold derived from perception data for hazard classification in bicycle infrastructure, as detailed in Table 5.
As shown in Figure 8, As fault height increased, both mean and median risk ratings rose steadily across all riding speeds, confirming that cyclists perceived larger vertical discontinuities as more hazardous. At 15 km/h, the median rating increased from 1.0 for 10 mm faults to 5.0 for 40 mm faults, with standard deviations ranging from 0.50 to 0.65—indicating strong agreement among participants. A similar pattern was observed at 20 km/h, where average ratings rose from 1.7 to 4.8 across the same fault range. The highest consistency occurred at 25 km/h, where median ratings for both 30 mm and 40 mm faults reached the maximum value of 5.0. At this speed, standard deviations fell below 0.58, highlighting a strong consensus among riders. These results suggest that higher speeds increase rider sensitivity to vertical irregularities while reducing variability in perceived risk. The narrow dispersion and high agreement—particularly at 40 mm—strengthen the empirical basis for the perception-based experiments. The convergence of ratings around the “Very risky” and “Not rideable” categories at these fault heights supports their use as critical cutoff points in the FII-based hazard classification system.
FII values were calculated using tri-axial acceleration data collected via smartphone sensors and showed a consistent increase with both fault height and riding speed. At 15 km/h, FII rose from 54.8 m/s2 for a 10 mm fault to 118.5 m/s2 for a 40 mm fault. At 25 km/h, the FII value reached its peak at 128.2 m/s2 for the same 40 mm fault, highlighting the amplifying effect of speed on impact intensity.
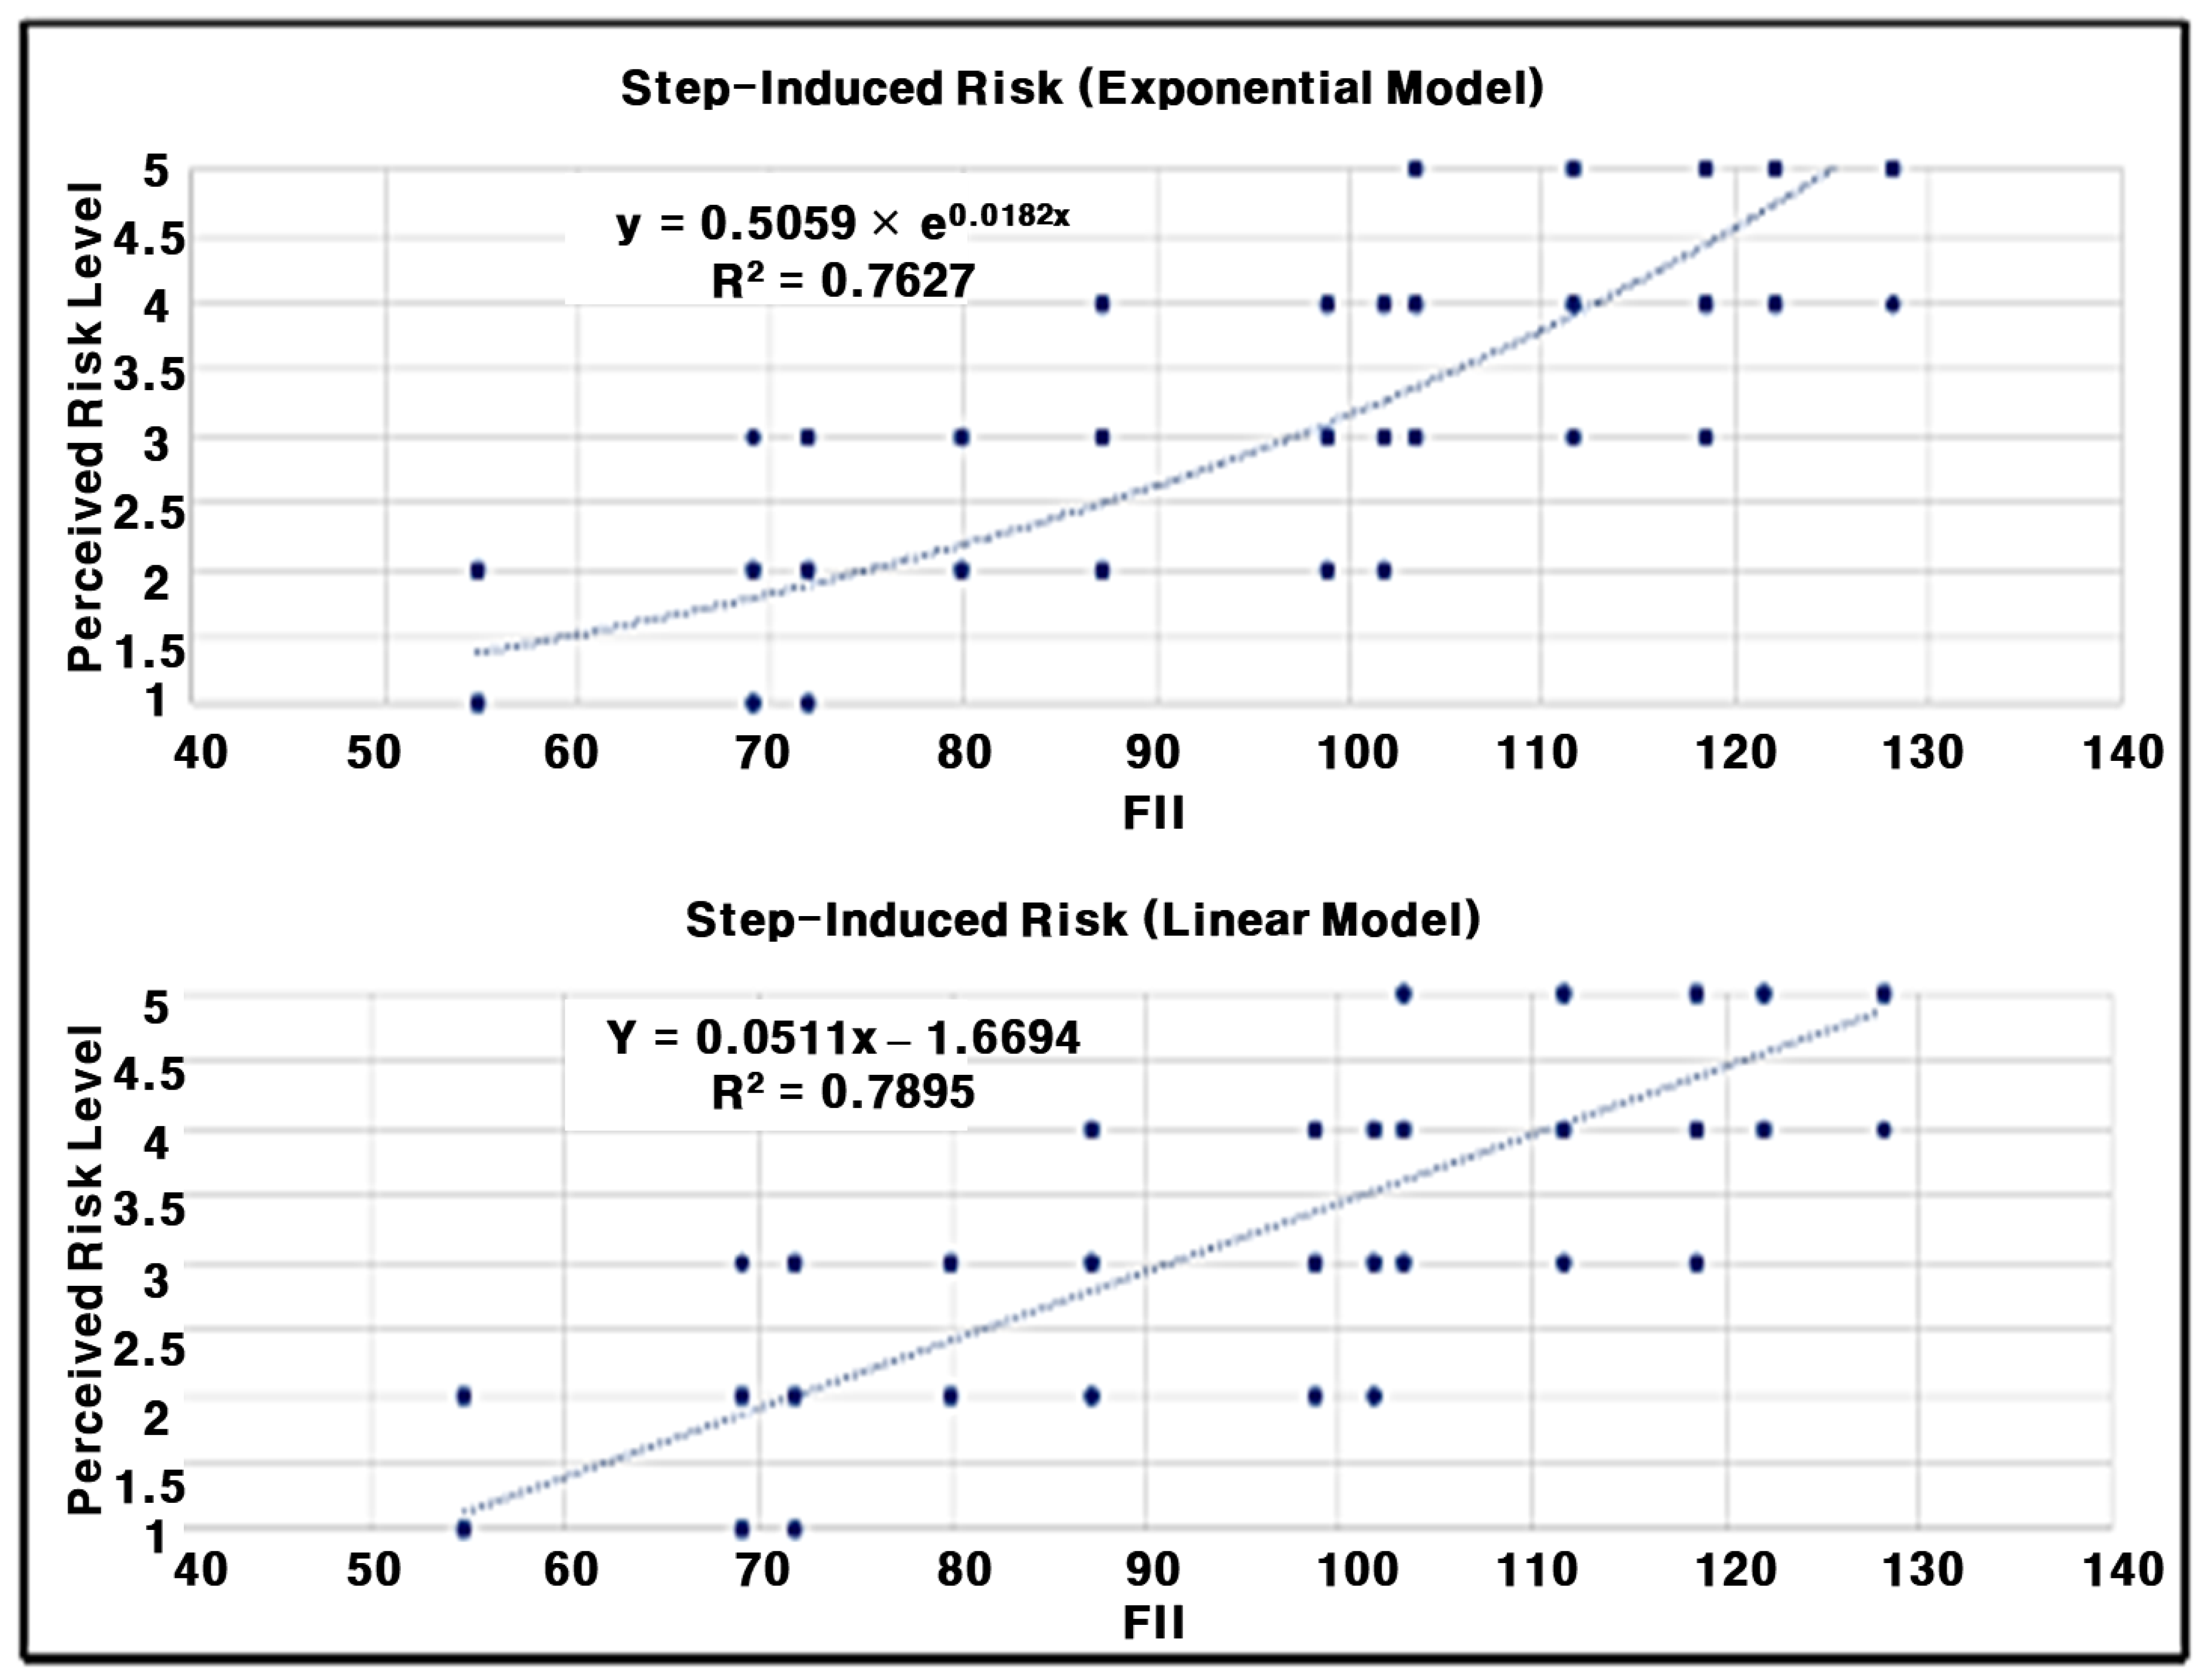
To quantify the relationship between measured impact severity and perceived hazard, correlation analyses were conducted between FII values and panel-based risk assessments. As illustrated in Figure 9, both linear and exponential regression models were evaluated. While the linear model achieved a marginally higher coefficient of determination (R2 = 0.7898), the exponential model (R2 = 0.7627) was found to more accurately represent the observed perceptual pattern—particularly the rapid increase in perceived hazard beyond specific FII values. This non-linear escalation reflects a perceptual breakpoint, defined as the threshold at which riders’ subjective judgment shifts from “uncomfortable but manageable” to “risky” or “very risky” conditions.
These findings confirm that FII is not only a statistically robust indicator but also a perceptually grounded metric capable of capturing rider discomfort triggered by abrupt vertical shocks. The identification of such perceptual thresholds supports the use of non-linear modeling in hazard classification and underscores the potential of FII as a practical tool for informing safety-oriented infrastructure interventions and maintenance prioritization within cyclist networks [21].
To model the relationship between FII and perceived hazard, and to establish a predictive relationship between FII and perceived hazard, both linear and exponential regression models were evaluated. The linear model was ultimately rejected due to its inability to produce valid outputs at low FII values—such as negative hazard scores—which are neither physically nor perceptually meaningful. Instead, an exponential regression model was adopted, effectively capturing the non-linear escalation of perceived hazard in response to increasing impact severity. This model, shown in Equation (6), forms the basis for FII-based hazard classification:
Hazard Score = 0.0509 × e(0.0186 × FII)
Based on the empirical analysis of panel perception data, the Faulting Impact Index (FII) values were stratified into five discrete hazard severity levels. Based on empirical panel data, FII values were categorized into five distinct risk levels based on a data-informed segmentation procedure grounded in panel perception analysis. Rather than applying arbitrary cutoffs, we identified natural inflection points in the user-reported hazard ratings to define meaningful thresholds for classification. These inflection points were determined by analyzing the cumulative distribution of perceived risk scores from the structured panel survey, allowing each threshold to reflect a statistically significant shift in rider perception. Specifically, the boundary marking the transition into “Risky” territory (Grade C) was set at 87.3 m/s2, corresponding to a noticeable increase in reported discomfort and perceived danger. Values above 119.4 m/s2 were associated with “Not rideable” conditions (Grade E), where panel participants frequently reported loss of control or a heightened risk of crash. This empirical, perception-driven approach ensures that the classification system is directly aligned with real-world rider safety concerns. These cutoff values demonstrated strong alignment with the empirical distribution of subjective risk scores gathered during structured fault impact testing [22].
The final classification ranges are summarized in Table 6. Grade A (FII ≤ 59.4 m/s2) represents conditions perceived as Safe, while Grades B through E reflect increasing levels of risk—from Mild discomfort to Severe hazard. These threshold values were empirically derived from the cumulative distribution of panel-assessed hazard ratings, ensuring that each grade boundary directly corresponds to significant changes in user perception. This data-driven approach grounds the classification system in actual rider experience, rather than arbitrary cutoffs. The model demonstrated strong alignment between predicted hazard scores and panel perception, further confirming its validity and practical applicability.
Together with BRI, which captures sustained ride comfort across an entire segment, FII provides a localized safety indicator focused on acute vertical shocks. The complementary use of BRI and FII enables a multidimensional evaluation of pavement quality, addressing both comfort and safety. Validation results showed strong correlations between BRI and perceived comfort, and between FII and perceived hazard, reinforcing the indices’ reliability as user-informed tools.
This integrated classification system offers a practical, evidence-based framework for maintenance prioritization and infrastructure planning. The intervention thresholds—such as 87.3 m/s2 for Grade C and higher—were established based on statistically significant inflection points in panel-perceived risk ratings, ensuring that maintenance recommendations reflect meaningful shifts in user comfort and safety. Segments exceeding 87.3 m/s2 (Grade C or higher) should be targeted for maintenance, while those classified as Grade D or E require urgent intervention. For Grade E segments, physical access restrictions—such as fencing or temporary closures—are recommended until repairs are completed. By directly linking sensor-based measurements to empirically validated rider perception, the proposed model enables data-driven, user-centric decision-making for safer and more resilient bicycle infrastructure.

3.3. Bicycle Road Pilot Test for Verification

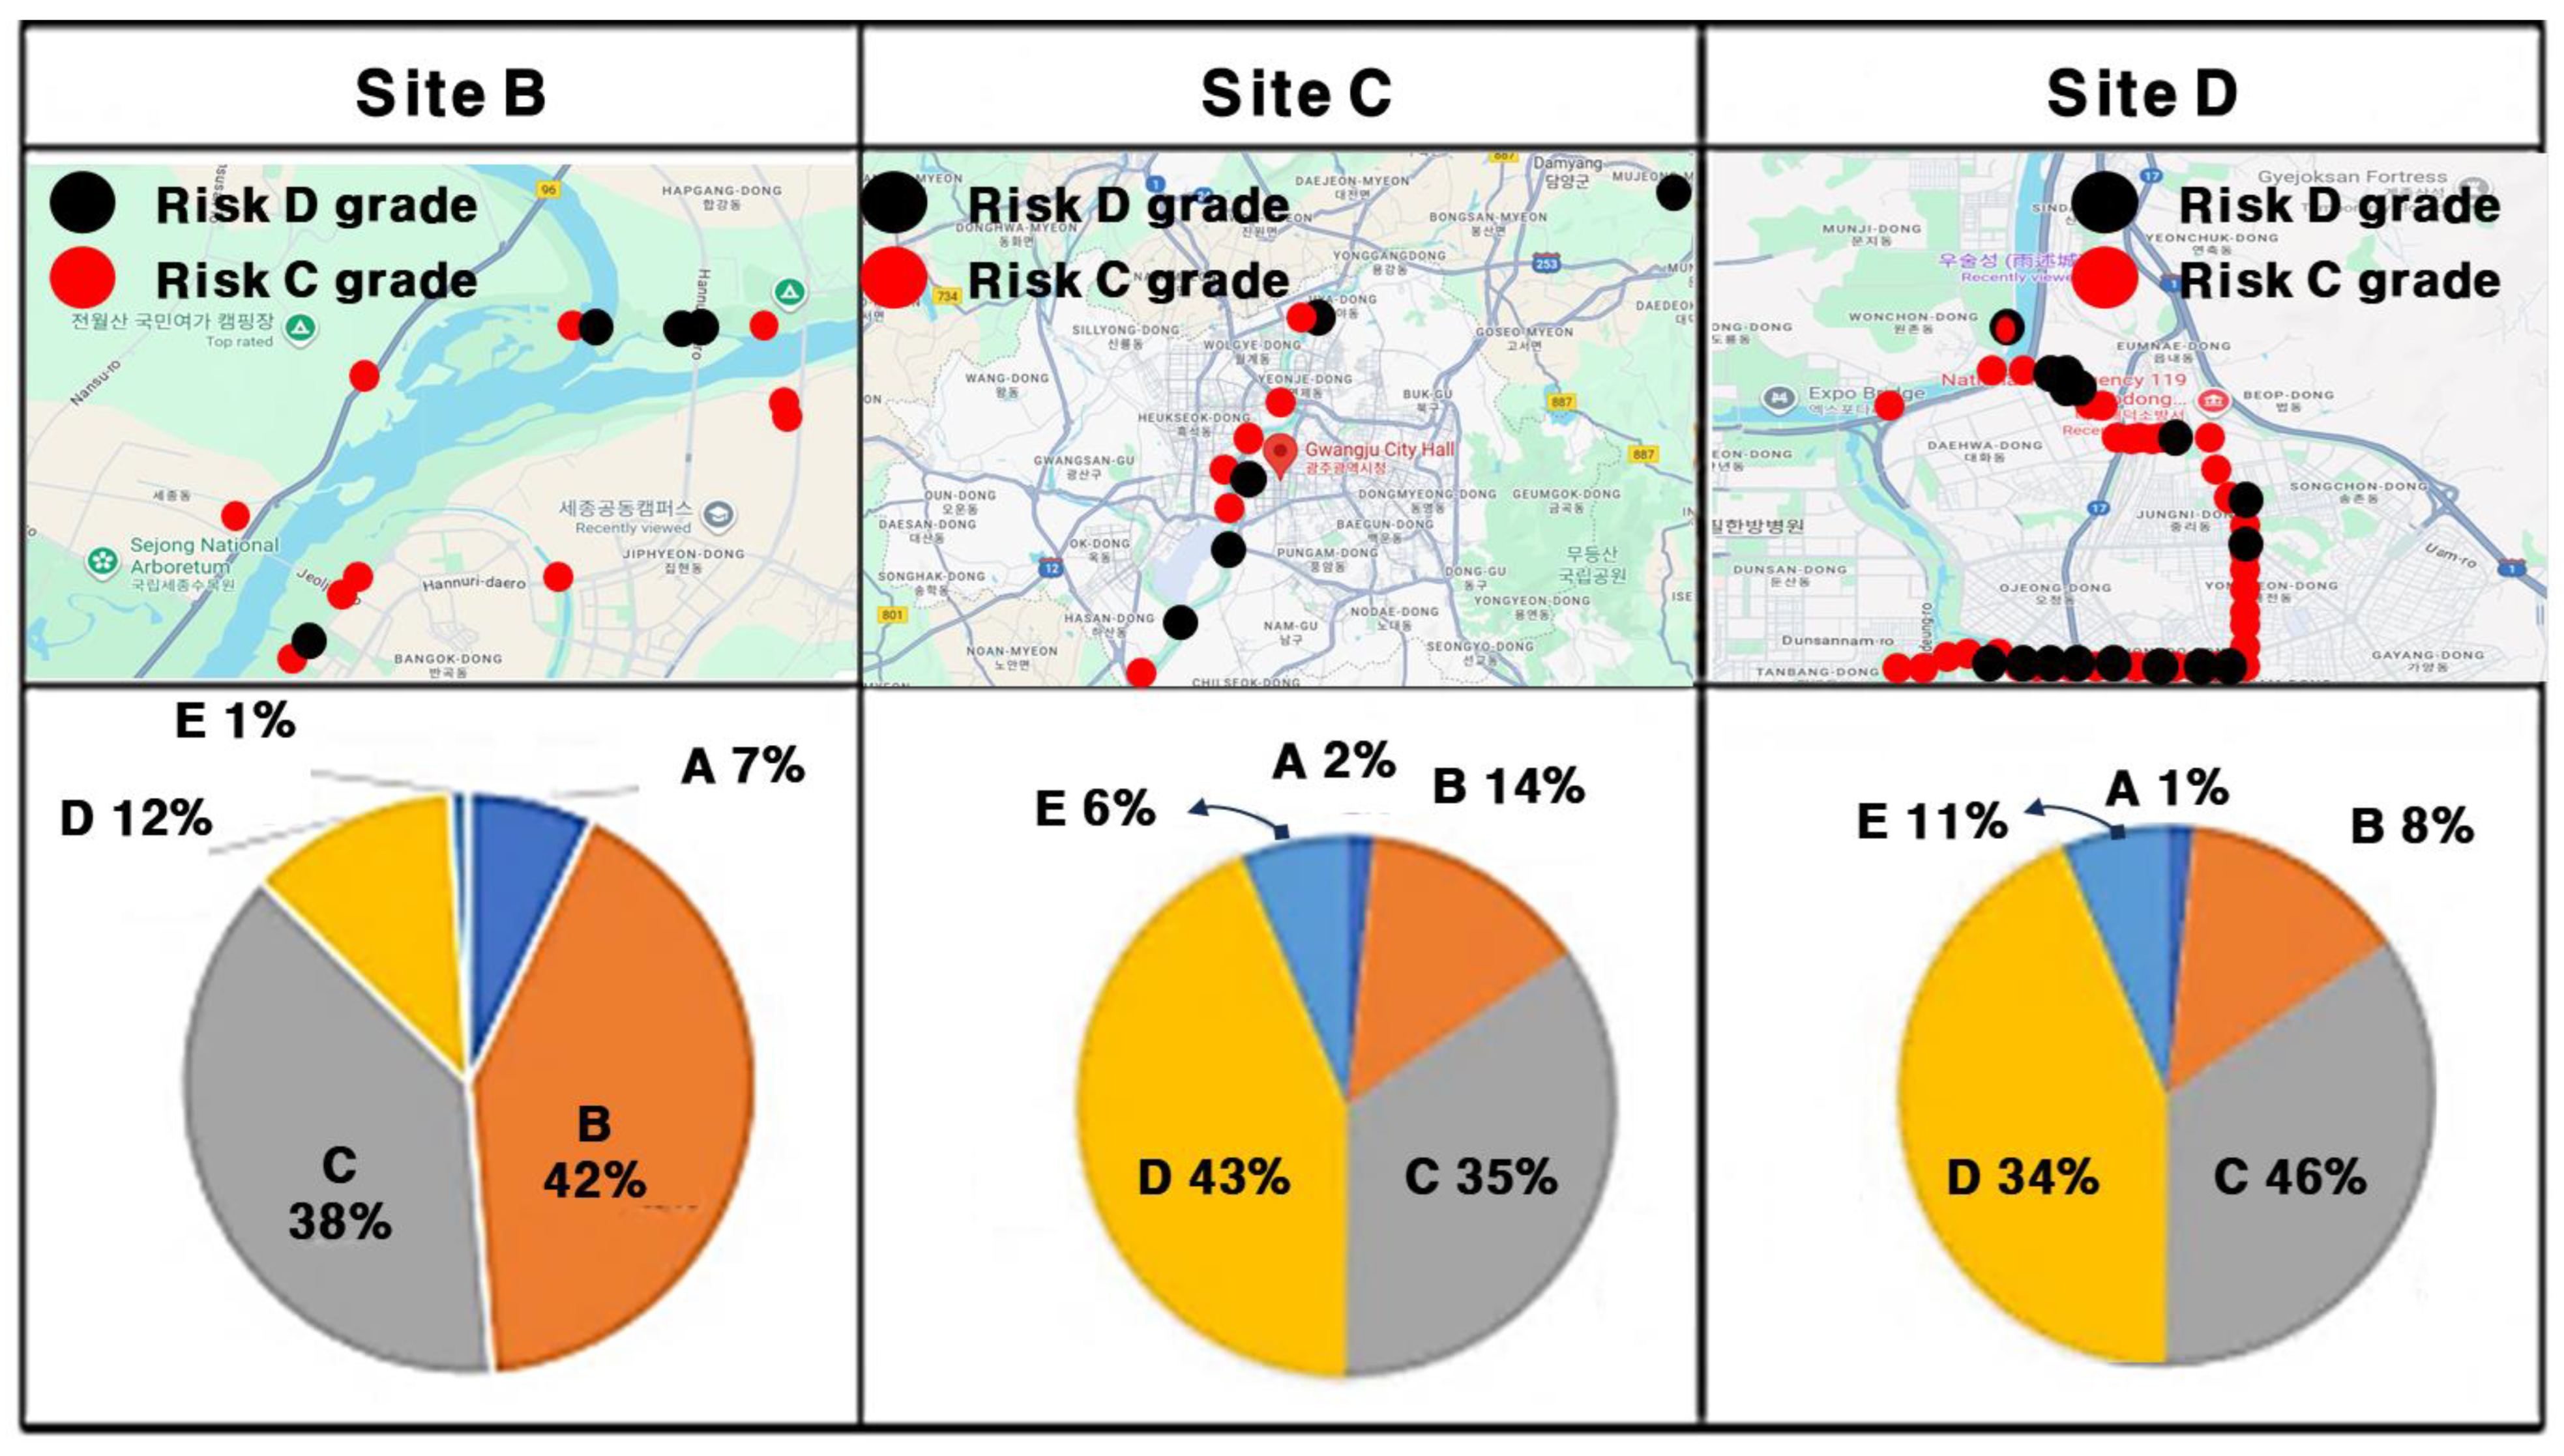
Pilot test results from the ten segments of Site A confirmed that cyclists begin to perceive pavement as hazardous when FII exceeds 87.3 m/s2 (Grade C). Faults producing FII values above 105.7 m/s2 (Grade D) were considered highly dangerous, with the potential to compromise rider control. Once FII values surpass 119.4 m/s2 (Grade E), the pavement was consistently rated as not rideable. To verify the applicability of this classification system under diverse real-world conditions, additional field validation was conducted at three representative bicycle routes: the Geumgang River Path (Site B), the Yeongsangang River Path (Site C), and urban cycling corridors in Daejeon City (Site D). During these validations, tri-axial acceleration and GPS data were collected using smartphones mounted on the bicycle stem. Supplementary equipment—including digital speedometers and action cameras—ensured measurement accuracy and contextual documentation. Data were segmented into 100-m intervals and visualized using GIS software (QGIS 3.12), enabling spatial mapping of BRI and FII values. In these maps, darker red markers denote segments with poor surface quality or elevated safety risks. Spatial distribution results for all three sites are shown in Figure 10. To localize high-risk segments, GPS-tagged acceleration data were spatially mapped using GIS software. FII-based hazard detection identified discrete “Risky” (Grade C) and “Very risky” (Grade D) points across Sites B, C, and D. These risk locations were visualized as red and black markers, respectively, and were geographically concentrated in specific contexts such as tunnel entrances, intersection transitions, and backfilled culvert zones. The spatial pattern confirms that FII effectively isolates localized impact events, which are often not reflected in average rideability panel rate. These GPS-based mappings demonstrate the practical advantage of integrating sensor-derived hazard indices with real-time geolocation, enabling road managers to precisely identify and address critical pavement defects at a sub-segment level.
The use of 100-m intervals allowed for the detection of localized surface defects that would otherwise be masked in coarser 1-km aggregations. This finer resolution proved critical in identifying high-risk segments and informing targeted maintenance decisions. The variation in pavement condition across Sites B, C, and D illustrates the utility of the proposed BRI–FII classification system for evaluating bicycle infrastructure in a wide range of operational settings.
The assessment of pavement conditions across the three pilot sites—Site B (Geumgang River), Site C (Yeongsangang River), and Site D (Daejeon City)—demonstrated the applicability of the proposed BRI–FII classification system in identifying both surface quality and safety-related hazards under diverse operational environments. Site B, spanning 38.2 km, exhibited the most favorable overall conditions, with 87% of segments rated as Grade C or better based on BRI. Specifically, 7% were classified as Grade A, 42% as Grade B, and 38% as Grade C, while only 12% and 1% fell into Grades D and E, respectively. FII-based hazard analysis further identified 115 segments as Grade B (Slightly unsafe), 28 as Grade C (Risky), and 6 as Grade D (Very risky), with most hazardous locations linked to abrupt elevation changes at expansion joints, tunnel entrances, and settlement zones. Spatial distribution results for Site B are shown in Figure 10. Importantly, when BRI and FII data were aggregated at 1-km intervals, the resolution of localized defects was diminished—particularly with all Grade A segments disappearing—emphasizing the importance of high-resolution (100-m) analysis for effective maintenance prioritization. A summary of the condition and hazard assessment results for Site C is presented in Table 7.
In contrast, Site C, which spans 50.2 km and passes through the cities of Damyang, Gwangju, and Naju, showed the most extensive pavement deterioration. The route, composed of alternating asphalt and concrete surfaces and often shared with motor vehicles, recorded only 2% of segments as Grade A, while 44% were rated as Grade D and 6% as Grade E. Overall, more than 50% of the segments fell into Grades D and E, increasing to 67% under 1-km aggregation. Spatial distribution results for Site C are shown in Figure 10. FII-based analysis showed sixty-three segments as Grade B, seven as Grade C, and six as Grade D. The most severe deterioration was concentrated in concrete-paved, shared-use corridors, where common hazards included root-induced heaving, potholes, gravel buildup, insufficient backfill, and patching failures—frequently exacerbated by unauthorized vehicular access. A summary of the condition and hazard assessment results for Site C is presented in Table 8.
Site D, covering 14.7 km in Daejeon City, presented a mixed condition profile. While riverside segments maintained moderate service levels, downtown pedestrian–bicycle shared corridors were characterized by substantial surface degradation, particularly in infrastructure constructed during the 1990s. BRI analysis revealed that only 1% of segments were Grade A and 8% Grade B, with 46% classified as Grade C and a combined 45% falling into Grades D and E. FII evaluation identified 918 segments as Grade B, 342 as Grade C, and 39 as Grade D, with over 380 segments categorized as either Grade C or D. Spatial distribution results for Site D are shown in Figure 10. High-risk zones were frequently located near driveways, intersections, manhole covers, and building entrances, reflecting the effects of geometric discontinuities, repeated patching, and surface aging. A detailed summary of BRI and FII results for Site D is presented in Table 9.
Overall, the cross-site analysis confirmed that the BRI–FII framework is effective in diagnosing both sustained surface roughness and localized impact hazards across different urban and interurban contexts. Site B demonstrated relatively well-maintained infrastructure, while Site C revealed widespread deterioration linked to shared-use and mixed-material conditions. Site D highlighted the long-term consequences of aging infrastructure and the critical role of detailed monitoring in urban cores. The results emphasized that shared-use corridors and older pedestrian-integrated designs are particularly vulnerable to degradation. Continuous high-resolution monitoring, combined with GIS-based visualization and multi-source data integration—including sensor analytics, user perception, and visual inspection—is essential to support evidence-based pavement management strategies. Such an approach enables transportation agencies to proactively prioritize maintenance, allocate resources efficiently, and improve safety across diverse bicycle infrastructure networks. This approach would support evidence-based prioritization of pavement rehabilitation and hazard mitigation across both urban and interurban cycling networks [23].

3.4. Criteria for Risk Assessment in Bicycle Roads

This study established a dual-index framework to assess bicycle pavement performance by combining rider perception with smartphone-based sensing. The Bicycle Road Roughness Index (BRI) captures overall surface comfort, while the Faulting Impact Index (FII) identifies acute vertical hazards. Using field data and panel surveys, we derived five-grade classification systems for both indices. Segments exceeding defined BRI or FII thresholds were consistently associated with lower user satisfaction and observable physical defects such as potholes and uplifted joints. The proposed grading system was applied to Sites B, C, and D to evaluate practical utility. Well-maintained areas (e.g., Site B) had most segments rated at Grade C or above, while older or shared-use paths (Sites C and D) showed a higher concentration of critical faults (Grades D and E).
As summarized in Table 10, this system provides actionable thresholds for identifying and prioritizing high-risk locations using low-cost smartphone data and GIS-based visualization [24]. This approach supports data-informed maintenance and infrastructure safety management.
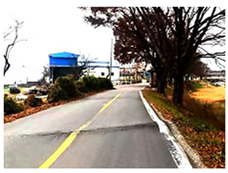
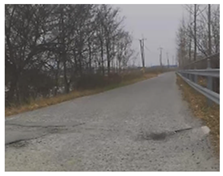
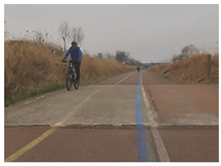
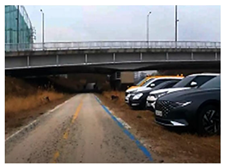
Furthermore, visual references corresponding to each BRI service grade were compiled using representative photographs taken at the pilot study sites (Figure 11). These images depict the progression of surface quality from newly paved, smooth pavements classified as Grade A to severely deteriorated segments rated as Grade E, which exhibit longitudinal and transverse cracking, water pooling, and structural deformation [25].
This visual mapping enhances the practical application of the BRI classification system by offering intuitive, observable criteria that can be verified directly in the field. It allows road managers and inspectors to conduct on-site assessments more consistently and transparently, linking visual cues with quantifiable surface roughness grades for improved evaluation and maintenance decision-making.

4. Discussion

This study proposed and validated a smartphone-based dual-index framework for evaluating bicycle pavement conditions, incorporating both the Bicycle Road Roughness Index (BRI) and the Faulting Impact Index (FII) to distinguish between sustained ride discomfort and acute vertical hazards. By calibrating both indices with structured cyclist perception ratings, the proposed approach enables a user-centered and objective evaluation of rideability and risk. In comparison to traditional metrics, such as the International Roughness Index (IRI) or generalized RMS-based vibration measures, our results demonstrate several notable improvements. Prior studies have shown that the International Roughness Index (IRI) and single-axis vibration indices can effectively quantify general surface roughness, and that smartphone-based measurements are capable of detecting potholes and evaluating user discomfort [8,13,14,16]. However, although these approaches often incorporated perception-based thresholds, they did not provide a structured classification framework capable of distinguishing between continuous vibration patterns and acute shock events—such as uplifted joints or localized faulting—which are particularly critical for cyclists at low to moderate speeds. Previous smartphone-based methods typically reported moderate explanatory power for modeling cyclist perception, with R2 values ranging from 0.53 to 0.63 for linear models based on cyclist satisfaction [13,16] and R2 = 0.61 between vertical vibration and perceived road condition [14]. In contrast, the dual-index system presented in this study was calibrated directly with structured panel survey data and field measurements, enabling more robust perception-based classification of both comfort and hazard.
These results highlight the limitations of prior approaches lacking perception-calibrated structures, which our dual-index system aims to address. Our dual-index system addresses these shortcomings by differentiating between long-term surface degradation (BRI) and localized hazards (FII), both calibrated against direct user perception. The achieved R2 values of 0.74 (BRI) and 0.76 (FII) indicate a stronger correlation than a moderate value of 0.6 and more nuanced alignment with actual cyclist experience than previous models. This improvement is attributable to the integration of perception-calibrated thresholds, a structured five-grade classification, and a dual-scale approach that jointly assesses both comfort and safety. Notably, by leveraging signal vector magnitude for FII, our system quantitatively captures the impact severity of abrupt discontinuities—such as uplifted joints, potholes, and pavement gaps—which had previously required further analysis for objective classification. A further distinguishing feature of our approach is the exclusive reliance on off-the-shelf smartphone sensors. Unlike many existing systems that require expensive or complex configurations—such as laser profilometers for high-precision pavement profiling [24], wearable biomechanical sensor arrays for real-time motion and fatigue analysis [22], or instrumented bicycles with IMUs for vibration monitoring and infrastructure evaluation [23]—our method enables scalable, low-cost deployment using a single smartphone, without sacrificing diagnostic accuracy. This directly addresses hardware and data-processing barriers noted in the literature and supports practical field application by municipalities and infrastructure managers. An additional advancement lies in the spatial resolution of data aggregation. While prior research often utilized kilometer-scale data intervals—potentially obscuring critical localized hazards—our study demonstrates that 100-m aggregation is essential for identifying and prioritizing segment-specific risks [19]. This finding reinforces the importance of spatial granularity in maintenance planning, as highlighted in recent comparative studies. Despite these improvements, several limitations should be acknowledged. First, certain pavement types—such as permeable pavements, rubberized surfaces, or interlocking block designs—were not present in our study areas, which may limit the generalizability of the indices to these materials. Second, rider-specific behaviors (e.g., posture adjustments) could influence acceleration readings and lead to underestimation of hazard severity. Third, although preliminary inter-device testing showed minimal variance at a 0.1 s sampling rate, broader application would require sensor normalization across different devices. Finally, as all empirical tests were conducted in Korea, future research should validate the proposed thresholds and classification schemes in other geographical and infrastructural contexts. Further improvements may also be achieved by incorporating lateral dynamics, cross-slope geometry, and integrating multimodal sensing (e.g., video or imagery) to enhance classification robustness. In summary, this study advances the state-of-the-art in bicycle pavement assessment by bridging objective sensor-based analytics with user perception, providing a robust, scalable, and practical framework for cyclist-centered infrastructure evaluation [26,27]. By critically addressing and overcoming the shortcomings of prior approaches—and demonstrating strong empirical validation—our system offers actionable insights for maintenance prioritization, enhances cyclist safety, and contributes to the broader goals of sustainable urban mobility.

5. Conclusions

This study developed and validated a smartphone-based dual-index framework to evaluate bicycle pavement conditions by integrating objective sensor data with cyclist perception. The Bicycle Rideability Index (BRI) captured sustained surface roughness, while the Faulting Impact Index (FII) detected acute vertical hazards such as step faults and joint discontinuities. Both indices were calibrated through structured panel surveys (n = 40) and regression modeling, resulting in five-grade classification systems directly aligned with user perception. The key thresholds—such as BRI ≤ 2.2 (Grade A: Very good), BRI > 15.6 (Grade E: Very poor), FII > 87.3 m/s2 (Grade C: Risky), and FII > 119.4 m/s2 (Grade E: Not rideable)—were empirically derived from the distribution of panel-based comfort and hazard ratings, and validated through real-world field measurements. Field validation across four Korean cities demonstrated the framework’s diagnostic accuracy and operational scalability. Notably, Site A showed 90% of segments in high-quality BRI grades (A or B), while Sites C and D revealed widespread deterioration—over 50% of segments rated as BRI Grade D or E and 381 FII hazard points identified, including 39 critical segments requiring urgent repair. These findings underscore the necessity of maintaining high-resolution (100 m) diagnostics, as coarse aggregations tend to obscure localized risks. This dual-index approach offers three key advantages: (1) it enables low-cost, scalable monitoring using smartphones alone; (2) it supports differentiated maintenance planning—with actionable thresholds for both surface renewal (BRI) and urgent hazard intervention (FII); and (3) it reflects cyclist perception, ensuring user-centric infrastructure decisions. By linking every classification threshold to empirically validated user ratings, the system directly supports evidence-based resource allocation for both periodic maintenance and emergency repair. Looking ahead, the framework can be extended through machine learning-based fault classification, crowdsourced mobile sensing, and multimodal diagnostics that combine acceleration and imagery. Integration with public reporting systems may further enable real-time alerts and enhance civic engagement. Ultimately, this method lays the foundation for nationwide bicycle infrastructure monitoring—bridging physical metrics and human experience to support safer, smarter, and more sustainable micromobility networks. Future extensions of this research should include the deployment of machine learning algorithms for automatic fault recognition, as well as the integration of crowdsourced data via mobile platforms to enable continuous, real-time monitoring. Additionally, coupling image-based surface diagnostics with acceleration-based indices could further refine risk prediction. For practical integration, the proposed sensing and classification system could be linked with existing citizen-reporting platforms, enabling bi-directional communication between road users and maintenance agencies. Such linkage would support prompt interventions and enhance public trust in infrastructure management. Ultimately, this framework lays the groundwork for national-scale bicycle infrastructure monitoring, linking physical metrics to real-world cyclist experiences. By enabling responsive, data-driven management, it contributes to the development of safer, smoother, and more sustainable active mobility networks. In future studies, the use of electric bicycles (e-bikes) equipped with cruise control or speed-assist features could offer a more stable platform for maintaining constant speeds during data collection. This may enhance the precision of acceleration-based measurements and further reduce variability caused by human pedaling behavior.

Author Contributions

Conceptualization, D.L. and J.L.; methodology, D.L. and G.J.; investigation, D.L.; data curation, D.L. and H.Y.; writing—original draft preparation, H.Y.; writing—review and editing, G.J. and J.L.; visualization, H.Y.; supervision, D.L.; funding acquisition, J.L. All authors have read and agreed to the published version of the manuscript.

Funding

This work was conducted as part of an independent research project by the Korea Transport Institute (KOTI). The task number was not assigned separately because it was a task performed internally.

Institutional Review Board Statement

This study was exempt from IRB review in accordance with Article 15(2) of the Bioethics and Safety Act and Article 13(1)(1)(b) of its Enforcement Rule—referring specifically to research using non-invasive observational measurement devices that do not cause physical changes, with no collection of personally identifiable information.

Informed Consent Statement

Verbal informed consent was obtained from all participants prior to their involvement in the study, after being clearly informed of the purpose and scope of the research. No written consent was required, as no sensitive or personally identifiable information was collected.

Data Availability Statement

The bicycle traffic volume and speed data from the tracking of cycling were provided by Strava application and are available online: https://www.strava.com and detailed value of roughness is measured based on self-developed applications (accessed on 20 October 2022).

Acknowledgments

The authors would like to thank the members of the research team for their guidance and support throughout this project.

Conflicts of Interest

Author Hojun Yoo was employed by the company RoadKorea Inc. The remaining authors declare that the research was conducted in the absence of any commercial or financial relationships that could be construed as a potential conflict of interest. The authors declare no conflicts of interest.

References

  1. Smith, K.; Ram, P. Measures and Specifying Pavement Smoothness; FHWA: Washington, DC, USA, 2016. [Google Scholar]
  2. Lah, T.J.; Lee, H.; Cho, Y. The Four Major Rivers Restoration Project of South Korea: An Assessment of Its Process, Program, and Political Dimensions. J. Environ. Dev. 2015, 24, 375–394. [Google Scholar] [CrossRef]
  3. Fishman, E.; Washington, S.; Haworth, N. Bike Share: A Synthesis of the Literature. Transp. Rev. 2013, 33, 148–165. [Google Scholar] [CrossRef]
  4. Chang, C.L.; He, S.; Qian, J.Z.; Mao, L.J. Pavement flatness test technology summary. J. Highw. Transp. Res. Dev. 2006, 4, 7. [Google Scholar]
  5. Ahmed, T.; Pirdavani, A.; Sitohang, I.F.; Wets, G.; Janssens, D. Assessment methods for bicycle environment safety and comfort: A scoping review. Saf. Future Transp. Res. 2025, 5, 100457. [Google Scholar] [CrossRef]
  6. Ahmed, T.; Pirdavani, A.; Janssens, D.; Wets, G. Utilizing Intelligent Portable Bicycle Lights to Assess Urban Bicycle Infrastructure Surfaces. Sustainability 2023, 15, 4495. [Google Scholar] [CrossRef]
  7. Gao, J.; Sha, A.; Huang, Y.; Hu, L.; Tong, Z.; Jiang, W. Evaluating the Cycling Comfort on Urban Roads Based on Cyclists’ Perception of Vibration. J. Clean. Prod. 2018, 199, 103–113. [Google Scholar] [CrossRef]
  8. Zang, K.; Shen, J.; Huang, H.; Wan, M.; Shi, J. Assessing and Mapping of Road Surface Roughness Based on GPS and Accelerometer Sensors on Bicycle-Mounted Smartphones. Sensors 2018, 18, 914. [Google Scholar] [CrossRef] [PubMed]
  9. Kim, K.; Jo, S.H.; Ahn, J.; Kim, N. A Study on the Evaluation Criteria of Pavement Condition Using Investigation Equipment of Bicycle Road. KSCE J. Civ. Environ. Eng. Res. 2016, 36, 1125–1131. [Google Scholar] [CrossRef]
  10. Acerra, E.M.; Shoman, M.; Imine, H.; Brasile, C.; Lantieri, C.; Vignali, V. The Visual Behaviour of the Cyclist: Comparison between Simulated and Real Scenarios. Infrastructures 2023, 8, 92. [Google Scholar] [CrossRef]
  11. Setiawan, E.; Nurdin, H. Road Quality Assessment Using International Roughness Index Method and Accelerometer on Android. J. Inf. Technol. Intell. Syst. 2019, 10, 62–73. [Google Scholar] [CrossRef]
  12. Aranda Britez, D.A.; Tapia Córdoba, A.; Johnson, P.; Pacheco Viana, E.E.; Millán Gata, P. Improving the Calibration of Low-Cost Sensors Using Data Assimilation. Sensors 2024, 24, 7846. [Google Scholar] [CrossRef] [PubMed]
  13. Lee, J. A Study on the Development of a Bicycle Road Surface Roughness Evaluation Using Smartphone Sensors. Ph.D. Thesis, Hongik University, Seoul, Republic of Korea, 2023. [Google Scholar] [CrossRef]
  14. Douangphachanh, V.; Oneyama, H. Using smartphones to estimate road pavement condition. In Proceedings of the International Symposium for Next Generation Infrastructure, Wollongong, Australia, 1–4 October 2013. [Google Scholar]
  15. Karantonis, D.M.; Narayanan, M.R.; Mathie, M.; Lovell, N.H.; Celler, B.G. Implementation of a Real-Time Human Movement Classifier Using a Triaxial Accelerometer for Ambulatory Monitoring. IEEE Trans. Inf. Technol. Biomed. 2006, 10, 156–167. [Google Scholar] [CrossRef] [PubMed]
  16. Jeong, K.; Lee, J.; Lee, D. Construction and Utilization of Big Data for Personal Mobility Using Smart Devices; Korea Transport Institute: Sejong, Republic of Korea, 2021; pp. 83–139. [Google Scholar]
  17. Tamagusko, T.; Gomes Correia, M.; Rita, L.; Bostan, T.-C.; Peliteiro, M.; Martins, R.; Santos, L.; Ferreira, A. Data-Driven Approach for Urban Micromobility Enhancement through Safety Mapping and Intelligent Route Planning. Smart Cities 2023, 6, 2035–2056. [Google Scholar] [CrossRef]
  18. Ministry of the Interior and Safety; Ministry of Land, Infrastructure and Transport. Guidelines for Installation and Management of Bicycle Facilities; Ministry of the Interior and Safety: Sejong, Republic of Korea, 2022; Available online: https://www.scribd.com/document/686733214 (accessed on 31 May 2025). (In Korean)
  19. Lee, S.; Bae, Y.; Kwon, Y.-C.; Kim, J.-H. A Study for Pavement Smoothness Index Reflecting Urban Road Characteristics. Seoul Stud. 2015, 16, 129–145. [Google Scholar]
  20. Siddiqui, O.; DiBiase, S.; Hoang, R.; Nguyen, B.; Khan, O.; Famiglietti, N. Evaluating the Accuracy and Reliability of Bicycle GPS Devices. SAE Int. J. Adv. Curr. Prac. Mobil. 2021, 3, 3093–3114. [Google Scholar] [CrossRef]
  21. Macdermid, P.W.; Fink, P.W.; Stannard, R. Transference of 3D Accelerations During Cross Country Mountain Biking. J. Biomech. 2014, 47, 1829–1837. [Google Scholar] [CrossRef]
  22. Liu, T.; Inoue, Y.; Shibata, K. Development of a Wearable Acceleration Sensor System for Human–Bicycle Interaction Analysis. Sensors 2010, 10, 9797–9814. [Google Scholar]
  23. Argyros, D.; Fjendbo Jensen, A.; Rich, J.; Dalyot, S. Riding Smooth: A Cost-Benefit Assessment of Surface Quality on Copenhagen’s Bicycle Network. Sustain. Cities Soc. 2024, 108, 105473. [Google Scholar] [CrossRef]
  24. Plati, C.; Gkyrtis, K.; Loizos, A. A Practice-Based Approach to Diagnose Pavement Roughness Problems. Int. J. Civ. Eng. 2024, 22, 453–465. [Google Scholar] [CrossRef]
  25. Ji, Y.; Liu, Y.; Yao, F.; He, M.; Tao, S.; Zhao, X.; Chang, S.; Yang, X.; Meng, W.; Xie, Y.; et al. Adapting Large Language Models to Log Analysis with Interpretable Domain Knowledge. arXiv 2024. [Google Scholar] [CrossRef]
  26. Macdermid, P.M.; Stannard, S. Mechanical Work and Physiological Responses to Simulated Cross Country Mountain Bike Racing. J. Sports Sci. 2012, 30, 1491–1501. [Google Scholar] [CrossRef] [PubMed]
  27. Elamin, A.; El-Rabbany, A. UAV-Based Image and LiDAR Fusion for Pavement Crack Segmentation. Sensors 2023, 23, 9315. [Google Scholar] [CrossRef] [PubMed]
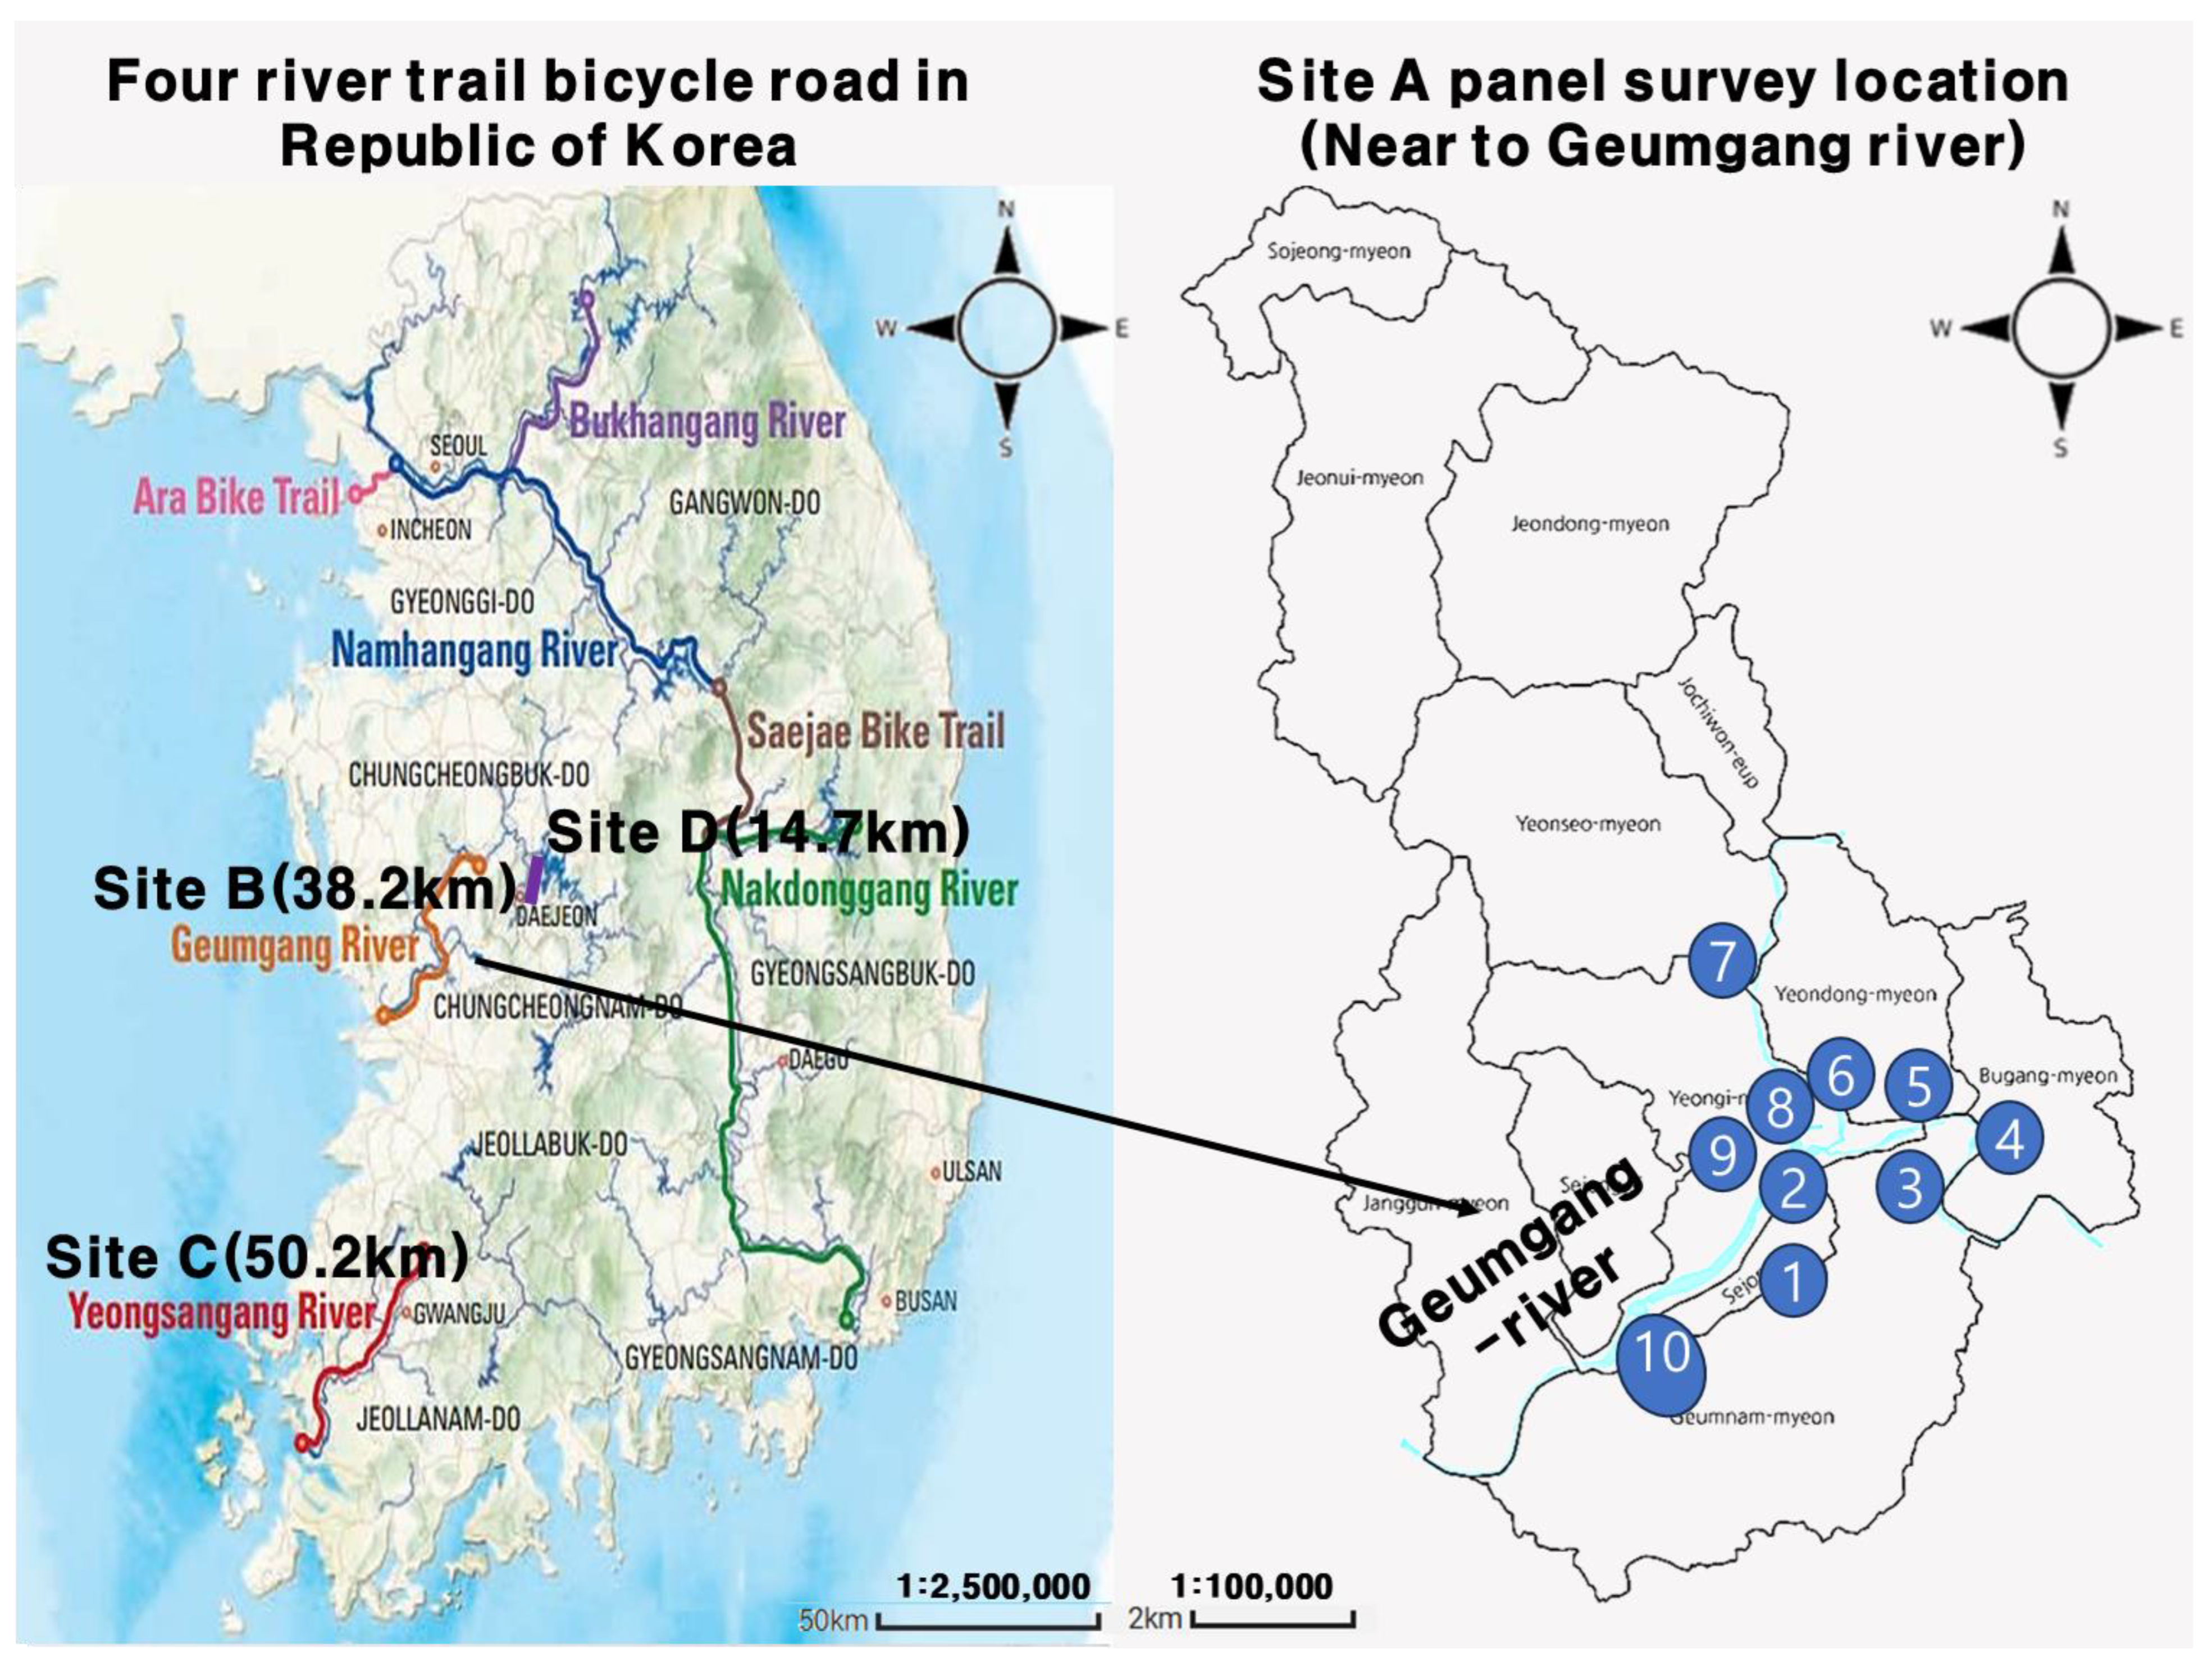
Figure 1. Study area for risk assessment of bicycle road roughness (Site A: Panel survey, Site B, C, D: Verification of FII and BRI).
Sustainability 17 07488 g001
Figure 2. Experimental setup for smartphone-based vibration measurement during bicycle ride.
Sustainability 17 07488 g002
Figure 4. Equipment setup, including smartphone sensor mount, speedometer, and onboard action camera, used during pilot test.
Sustainability 17 07488 g004
Figure 5. Statistical results for roughness panel survey for each site.
Sustainability 17 07488 g005
Figure 6. User satisfaction model using surface roughness.
Sustainability 17 07488 g006
Figure 7. Normality and homogeneity of variance test results.
Sustainability 17 07488 g007
Figure 8. Distribution of panel-perceived risk by step height and bicycle speed.
Sustainability 17 07488 g008
Figure 9. Relationship between FII and panel-perceived riding risk on bicycle road.
Sustainability 17 07488 g009
Figure 10. Spatial distribution and proportion of risk grades at Site B, C and D.
Sustainability 17 07488 g010
Figure 11. Representative Surface Conditions of Bicycle Roads by BRI-Based Service Grades (A–E).
Sustainability 17 07488 g011
Table 1. Summary of measurement sites for panel and pilot test surveys, including pavement type, traffic volume, and survey rationale.
MethodsMeasurement SitePavement TypeBuilt YearAADT
(Vehicle)
Surface
Damage
Location
Panel SurveySite A-1AP20219554NoneSejong-si,
Republic of Korea
Site A-2CP201114,704None
Site A-3CP201113,958Yes
Site A-4CP201113,525Yes
Site A-5CP201160,573Yes
Site A-6CP201148,203Yes
Site A-7CP201147,890Yes
Site A-8CP201174,603None
Site A-9AP201176,745None
Site A-10CP20113201Yes
MethodsMeasurement SitePavement TypeBuilt YearReason to choose
Pilot test
survey
Site B
(38.2 km)
AP, CP2011An evaluation of the entire section of the Geumgang Bicycle Road in Sejong City, which has the characteristics of various bicycle roads and includes a panel survey.
Site C
(14.7 km)
AP, CP1993It was installed in 1993 and partially repaired, but it can be reviewed whether it is an appropriate evaluation criterion for the evaluation of both bicycle pedestrians and the management of bicycle paths in the Gwangju City.
Site D
(50.2 km)
AP, CP2012It is a bicycle road over 10 years old installed in the waterfront space and includes non-urban sections in Daejeon City, so that the management status of the section can be reviewed.
AP (Asphalt Pavement) refers to road surfaces made of asphalt concrete, a mixture of aggregates and asphalt binder. CP (Concrete Pavement) refers to road surfaces made of Portland Cement Concrete (PCC), a mix of cement, aggregates, and water.
Table 2. Risk level criteria for step difference based on panel survey responses.
Risk LevelPanel Survey Description
SafePerceived as safe while riding on generally flat pavement with only minor surface irregularities.
Slightly unsafeMinor shocks cause slight difficulty in maintaining speed, but riding remains stable and manageable.
RiskyShocks and impacts interfere with handlebar control, making balance difficult though still rideable—even if the discontinuity is not immediately visible.
Very riskySevere impacts significantly disrupt handlebar control, posing a high risk of falling—even when the fault is not visually detected.
Not rideableSudden loss of balance from strong impacts may damage the bicycle or make it too dangerous to proceed.
Table 3. Comparison of BRI and average panel satisfaction by segment on bicycle road.
CategorySegment 1Segment 2 Segment 3 Segment 4Segment 5Segment 6Segment 7 Segment 8Segment 9Segment 10
BRI3.046.7714.459.417.728.0711.063.182.0020.15
Panel rating4.172.751.982.332.902.171.603.854.671.13
Table 4. BRI-based rideability classification criteria for bicycle road.
Risk GradeBRI RangeRoughness Description
A≤2.2Very Good—smooth pavement with no visible cracks or patching; excellent ride comfort
B2.2 < BRI ≤ 4.3Good—minor unevenness in sections, but overall high ride quality
C4.3 < BRI ≤ 8.2Fair—some discomfort but generally rideable at desired speeds
D8.2 < BRI ≤ 15.6Poor—surface impacts reduce comfort and make consistent riding difficult
E>15.6Not rideable—severe degradation poses safety risks; major intervention required
Table 5. Comparison of FII and average panel-perceived risk by step height and bicycle speed.
Speed15 km/h20 km/h25 km/h
Step Height102030401020304010203040
FII54.871.998.8188.569.187.2103.4122.079.0101.8111.6128.2
Panel Risk
Rating
1.42.13.14.31.72.83.74.82.33.24.25.0
Table 6. FII based criteria for identifying hazardous sections on bicycle roads.
Risk GradeFII RangeRisk Description
A≤59.4Safe
B59.4 < FII ≤ 87.3Slightly unsafe
C87.3 < FII ≤ 105.7Risky
D105.7 < FII ≤ 119.4Very risky
E>119.4Not rideable (Severely risky)
Table 7. Evaluation results of hazardous sections in Site B.
Risk GradeNumber of Sections in Site BRisk Description
AAll remaining sectionsSafe
B115Slightly unsafe
C28Risky
D6Very risky
E0Not rideable (Severely risky)
Risk grade DRepresentative picture using video cameraReason
Segment 1Sustainability 17 07488 i001Concrete raveling: disintegration of concrete where aggregates (small rocks and pebbles) are loosened and detach from the surface, leaving the concrete surface rough and potentially causing further deterioration.
Table 8. Evaluation results of hazardous sections in Site C.
Risk GradeNumber of Sections in Site CRisk Description
AAll remaining sectionsSafe
B63Slightly unsafe
C7Risky
D6Very risky
E0Not rideable (Severely risky)
Risk grade DRepresentative picture using video cameraReason
Segment 1Sustainability 17 07488 i002Root-induced upheavals
Segment 2Sustainability 17 07488 i003Potholes
Segment 3Sustainability 17 07488 i004Insufficient backfill near culverts
Segment 4Sustainability 17 07488 i005Pavement rehabilitation section with step difference
Segment 5Sustainability 17 07488 i006Gravel accumulation
Table 9. Evaluation results of hazardous sections in Site D.
Risk GradeNumber of Sections in Site DRisk Description
AAll remaining sectionsSafe
B918Slightly unsafe
C342Risky
D39Very risky
E0Not rideable (Severely risky)
Risk grade DRepresentative picture using video cameraReason
Segment 1Sustainability 17 07488 i007Entry and exit section
Segment 2Sustainability 17 07488 i008Road raising due to root intrusion
Segment 3Sustainability 17 07488 i009Missing bicycle ramp
Segment 4Sustainability 17 07488 i010Elevation differences caused by road facilities
Segment 5Sustainability 17 07488 i011Pothole
Table 10. Classification criteria for rideability and risk on bicycle roads based on BRI and FII.
Risk GradeBRI RangeSurface Condition
A≤2.2Very Good
B2.2 < BRI ≤ 4.3Good
C4.3 < BRI ≤ 8.2Fair
D8.2 < BRI ≤ 15.6Poor
E>15.6Very poor
Risk GradeFII RangeRisk Description
A≤59.4Safe
B59.4 < FII ≤ 87.3Slightly unsafe
C87.3 < FII ≤ 105.7Risky
D105.7 < FII ≤ 119.4Very risky
E>119.4Not rideable (Severely risky)
Disclaimer/Publisher’s Note: The statements, opinions and data contained in all publications are solely those of the individual author(s) and contributor(s) and not of MDPI and/or the editor(s). MDPI and/or the editor(s) disclaim responsibility for any injury to people or property resulting from any ideas, methods, instructions or products referred to in the content.