1. Introduction
The 2030 Agenda for Sustainable Development has galvanized an unprecedented global commitment to the achievement of 17 interlinked Sustainable Development Goals (SDGs), which collectively strive to balance the social, economic, and environmental dimensions of development. Monitoring progress toward these goals requires timely, accurate, and scalable mechanisms for evaluating policy communication and public discourse, especially in the global news ecosystem, which serves as a mirror and moderator of societal priorities [
1]. Despite burgeoning research on SDG implementation, there remains a significant methodological gap in automating the classification and sentiment assessment of SDG-related content within large-scale, unstructured news corpora [
2,
3,
4,
5]. Furthermore, existing frameworks largely overlook the geopolitical and linguistic diversity of media narratives, which limits their utility in informing context-sensitive sustainability strategies [
5,
6].
To address this gap, the present study proposes a scalable, AI-driven methodology that integrates large language models (GPT-3.5), neural classifiers, keyword filtering, and topic modeling to transform 1.5 million unstructured news headlines into structured datasets classified according to SDG relevance. Drawing upon state-of-the-art GPT-based semantic parsing, the methodology performs multistep processing to extract named entities (e.g., country, disaster type), infer SDG mappings, assess sentiment polarity and subjectivity, and compute correlation structures and PCA-based clustering across geopolitical dimensions. These steps are rigorously encoded in a suite of three pseudocode algorithms to enhance clarity and reproducibility.
The empirical analysis yields critical insights into representation of the SDGs in the global media. For instance, the results show that SDG 3 (Good Health and Well-being) and SDG 13 (Climate Action) are the most frequently represented goals across headlines. A total of 64.4% of headlines represent either positive or negative sentiments, while 35.6% are neutral in sentiment. The subjectivity scores vary significantly across countries, with certain regions displaying higher narrative objectivity in development-related topics. Furthermore, PCA clustering reveals geopolitical groupings in tendencies related to SDG reporting, while the correlation matrix uncovers thematic co-occurrence patterns (e.g., SDG 1 and SDG 2; SDG 7 and SDG 13). The pipeline also surfaces anomalies in sentiment polarity (e.g., sharp negativity spikes during climate summits) and reports strong SDG-specific associations with sentiment-laden lexical features.
The significance of this research is manifold. First, it demonstrates a mathematically rigorous, scalable framework for SDG classification and analysis using real-time, high-volume news data. Second, it advances the methodological frontier by integrating LLM-based semantic extraction with statistical and visual analytics, contributing to the growing literature on digital sustainability governance [
7,
8]. Third, it enables policymakers, civil society actors, and international agencies to derive fine-grained insights into how public discourse reflects, diverges from, or reinforces global sustainability priorities. This work therefore not only fills a major technical lacuna in the literature on SDG monitoring but also provides a replicable foundation for longitudinal and comparative analysis of sustainability narratives. This study contributes to the literature on global sustainability discourse and digital SDG monitoring in the following measurable ways:
Scalable mapping of 135,000 news articles: The study utilizes a curated corpus of 135,000 SDG-labeled news headlines from 100 countries (2023–2025), representing the largest known media-based sentiment dataset aligned with all 17 Sustainable Development Goals. The SDG-related news extracted for this study has been made publicly available at
https://github.com/DrSufi/SDG (accessed 30 May 2025) to support research reproducibility.
Sentiment and subjectivity profiling across nations: Through polarity scoring and subjectivity analysis, the paper reveals that 64.4% of headlines exhibit a clear sentiment orientation (positive or negative), while 35.6% are sentiment-neutral. Country-level variations uncover that reporting in nations such as Germany and Japan demonstrates systematically more objective coverage, whereas that in Brazil and Nigeria displays elevated emotional subjectivity.
Unsupervised clustering of global narratives: Employing Principal Component Analysis (PCA) and K-means clustering, the analysis identifies four distinct geopolitical narrative clusters. These clusters show statistically significant differences in Human Development Index (HDI), GDP per capita, CO2 emissions, and press freedom (e.g., Cluster 1: HDI = 0.880 ± 0.034 vs. Cluster 3: HDI = 0.620 ± 0.058).
Correlation with governance metrics: The sentiment-based PCA dimensions correlate strongly with national indicators, including HDI (), GDP per capita (), and press freedom index (), evidencing that the structure of the media sentiment reflects underlying developmental asymmetries.
Temporal dynamics of SDG discourse: Monthly polarity trends from Jan 2024 to May 2025 reveal sentiment volatility synchronized with major global events.
Theoretically, this study formalizes its GPT-based semantic classification, sentiment scoring, and clustering methods into three pseudocode algorithms, enabling full reproducibility of the transformation from unstructured media text to structured SDG discourse analytics.
2. Contextual Background
The Sustainable Development Goals (SDGs) constitute a globally adopted framework comprising 17 interlinked objectives aimed at eradicating poverty, mitigating inequality, safeguarding planetary boundaries, and promoting inclusive prosperity by 2030. As highlighted in the UN’s 2023 progress report [
9], the trajectory toward achieving these targets remains precarious, in part due to inconsistency in monitoring frameworks and the fragmented nature of data sources. Academic responses to this policy agenda have evolved from static indicator-based tracking toward more dynamic assessments of intergoal relationships, policy coherence, and system-level feedbacks [
2,
3,
4].
The recent literature has identified critical gaps in the computational architecture of SDG tracking. Remote sensing techniques have enabled geospatial monitoring of a subset of SDG indicators, yet their coverage remains limited to only 30 of the 231 official indicators [
3]. Policy scholars have emphasized the political dilution and epistemological contestations surrounding indicator formulation [
6,
10], while systems-oriented approaches have proposed prioritization matrices to address gaps and synergies across goals [
11]. Nevertheless, the existing corpus remains highly reliant on manual reviews, static datasets, and weakly semantic classification strategies [
7,
12].
Simultaneously, emerging AI methodologies—particularly those leveraging large language models (LLMs) and neural-symbolic reasoning—offer untapped potential to transform SDG analytics. Studies such as [
8] demonstrate the promise of LLM-augmented knowledge graphs for semantic alignment across open data streams, while [
13] showed the viability of digital and AI-based monitoring frameworks in healthcare SDGs. Yet these innovations are largely absent from news-based systems for SDG tracking, which remain underdeveloped despite the volume, velocity, and narrative richness of open-source media.
The research field of computational news analytics, particularly for public policy evaluation, has gained traction through methodological advances in bias quantification [
14], deep learning-driven classification [
15], and domain-specific mathematical modeling [
16]. These innovations collectively undergird a broader shift from descriptive to diagnostic and predictive media analytics that leverage semantic abstraction, entity extraction, and sentiment modeling. However, current applications have yet to be sufficiently integrated into SDG-monitoring frameworks, which remain ill-equipped to process unstructured news data at scale.
While prior studies have addressed SDG interlinkages, remote-sensing coverage, and knowledge representation using ontologies or graphs, none has proposed a scalable, GPT-enhanced pipeline that classifies and analyzes global news for real-time SDG tracking. Most prior frameworks are confined to symbolic keyword mapping or retrospective dataset analysis, lacking semantic generalization and temporal granularity. This study thus introduces a mathematically formalized, keyword-guided, GPT-based classification architecture applied to 1.5 million news articles, thereby bridging the methodological divide between structured indicator models and unstructured textual narratives.
3. Methodology
To facilitate clarity in the exposition of the analytical workflow,
Table 1 provides a comprehensive summary of the key mathematical symbols and notations employed in the methodology section.
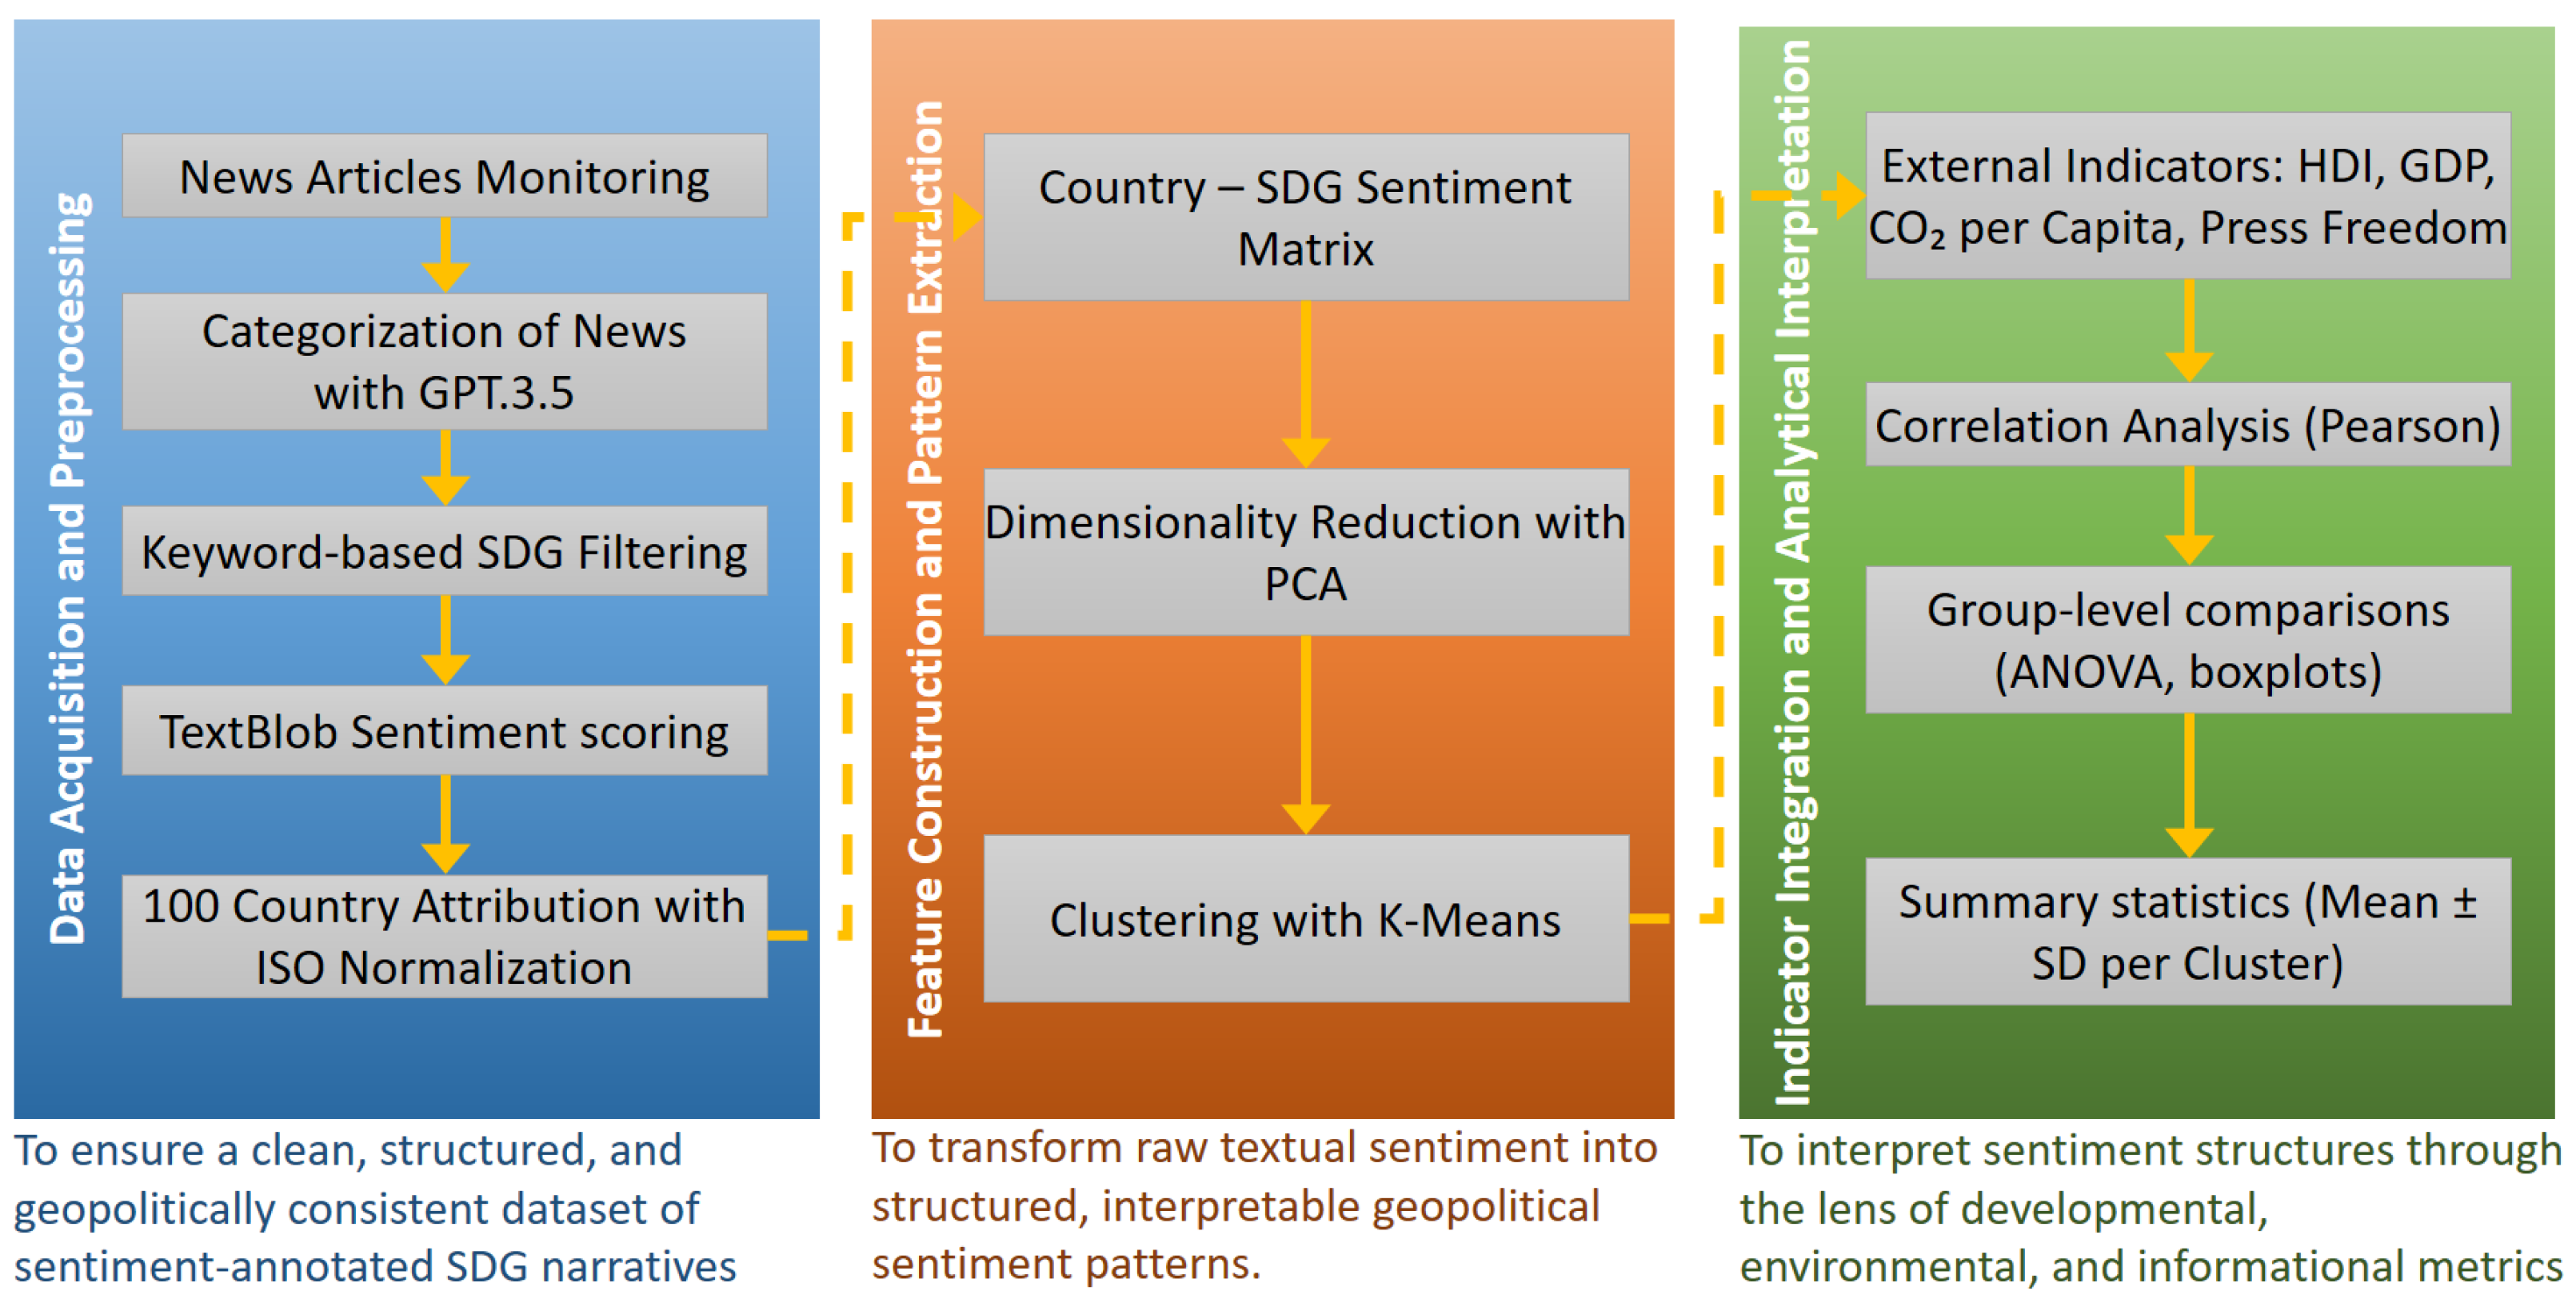
Figure 1 presents an overview of the methodological architecture employed in this study. The workflow is structured into three integrated stages: (i) data acquisition and preprocessing, where SDG-labeled headlines are extracted, sentiment-scored, and normalized by country; (ii) feature construction and pattern extraction, which involves the construction of a country–SDG sentiment matrix, dimensionality reduction using PCA, and unsupervised clustering via K-means; and (iii) indicator integration and analytical interpretation, where external geopolitical and developmental metrics (HDI, GDP, CO
2 emissions, press freedom) are incorporated to explain and contextualize sentiment-based clusters. This modular pipeline ensures both analytical rigor and interpretability across comparative sustainability narratives.
3.1. Dataset Acquisition and SDG Labeling
This study employs a curated dataset of approximately 135,000 news-article headlines sourced from diverse online news platforms and spanning October 2023 to May 2025. Each headline was annotated with an appropriate Sustainable Development Goal (SDG) label using OpenAI’s GPT-3.5-turbo, a state-of-the-art autoregressive language model capable of aligning unstructured text to a predefined policy taxonomy. Zero-shot prompt engineering was used to identify the most contextually relevant SDG for each article.
Sentiment polarity was computed using the TextBlob v0.17.1 library, which employs a lexicon-based scoring algorithm with part-of-speech tagging. Each article’s sentiment polarity score falls within the interval , where indicates strongly negative tone and indicates strongly positive tone.
3.2. Country Attribution and Standardization
Country attribution was performed using a named entity extraction field (
dfs_firsteventcountry) from each article, which designates the most probable geographic locus of the reported event. A manual normalization schema was applied to harmonize inconsistent nomenclature (e.g., “UK”, “Great Britain”, “United Kingdom” → “GB”) according to ISO 3166-1 alpha-2 codes [
17].
Articles with ambiguous or global-only attribution (e.g., “Global”, “Unknown”) were excluded. This normalization ensured consistent geopolitical granularity across all analyses.
3.3. Construction of Country–SDG Sentiment Matrix
For each country
c and SDG
s, we computed the mean sentiment polarity of all associated articles. This resulted in a matrix
, where:
Here, denotes the number of articles from country c labeled with SDG s, and is the polarity score of article i. Missing values were imputed with zeros to ensure dimensional consistency. The analysis was restricted to the top 100 countries with the greatest numbers of SDG-labeled articles.
3.4. Dimensionality Reduction via Principal Component Analysis (PCA)
To visualize and interpret structural variation across countries’ SDG sentiment profiles, we applied Principal Component Analysis (PCA) to reduce the 17-dimensional space into two principal components [
18]. Given a centered sentiment matrix
, PCA solves the eigenvalue problem as follows:
The first two principal components, and , captured the majority of variance in SDG sentiment orientation and served as inputs to clustering analysis. PCA was chosen over non-linear methods (e.g., t-SNE, UMAP) due to its linearity, reproducibility, and interpretability via Euclidean distances.
3.5. Clustering via K-Means
Unsupervised clustering was performed using the K-means algorithm to identify countries with similar sentiment structures [
18]. Let
denote the PCA-reduced matrix. K-means partitions the countries into
k disjoint clusters
by minimizing the following expression:
where
is the centroid of cluster
. We empirically selected
based on silhouette analysis and interpretability. Each resulting cluster represents a typology of countries based on sentiment in relation to SDG narratives.
3.6. Integration of Sustainability and Governance Indicators
To contextualize the sentiment-based clusters, we integrated a set of authoritative country-level indicators that reflect developmental, environmental, and informational attributes. Each indicator was joined to the sentiment matrix via ISO-3166-1 alpha-2 country codes, allowing comparative analysis across clusters.
Table 2 presents a summary of the selected datasets.
3.7. Correlation and Statistical Analysis
We performed statistical analyses to interpret relationships between patterns in sentiments associated with SDGs and exogenous development indicators, as follows:
Pearson correlation coefficients between PCA components and each indicator.
One-way ANOVA tests across clusters to determine significant differences in indicator means.
Boxplots and descriptive statistics (mean ± standard deviation) for visual exploration and quantitative comparison.
These analyses provide a rigorous quantitative foundation for interpreting the policy implications of sentiment-based clustering in global SDG reporting.
3.8. Algorithmic Implementation
To further enhance procedural transparency and reproducibility, we present three modular algorithms that encapsulate the core components of the proposed methodology. While the framework has already been comprehensively articulated through a flowchart (
Figure 1), descriptive exposition, and formal mathematical notation (
Table 1), these algorithms provide an abstract yet operational perspective on the key computational stages of the analysis.
Algorithm 1 outlines the construction of the country–SDG sentiment matrix, including news classification, sentiment scoring, and country normalization. Algorithm 2 describes the dimensionality-reduction process using Principal Component Analysis (PCA) and subsequent clustering via K-means to identify latent groupings of countries based on sentiment profiles. Algorithm 3 details the integration of external sustainability and governance indicators—such as HDI, GDP per capita, CO2 emissions, and press freedom—as well as the statistical procedures used to compare and interpret the identified clusters.
| Algorithm 1 Construct Country–SDG Sentiment Matrix |
| Require: News articles , each with title |
| Ensure: Sentiment matrix |
| 1: | for all article i in do |
| 2: | GPT-3.5 classify() Top-1 SDG label |
| 3: | TextBlob polarity() Sentiment score |
| 4: | NormalizeCountry(NER()) |
| 5: | Append to dataset |
| 6: | end for |
| 7: | for all country c and SDG s in do |
| 8: | |
| 9: | end for |
| 10: | return S |
| Algorithm 2 Dimensionality Reduction and Clustering |
| Require: Sentiment matrix |
| Ensure: PCA-reduced coordinates Z, cluster labels |
| 1: | Standardize(S) |
| 2: | PCA(X, components) |
| 3: | KMeans(Z, clusters) |
| 4: | return |
| Algorithm 3 Integration of External Indicators and Analysis |
| Require: PCA coordinates Z, cluster labels , indicator table |
| Ensure: Correlation results , ANOVA results |
| 1: | for all country c do |
| 2: | Match with to form full feature vector |
| 3: | end for |
| 4: | PearsonCorrelation(Z, ) |
| 5: | ANOVA(, groupby=) |
| 6: | return |
4. Results and Discussion
4.1. Data Statistics
To provide foundational insight into the empirical scope and representativeness of the study, this subsection presents descriptive statistics for the primary datasets utilized. The analysis integrates a large-scale, multicountry collection of news headlines annotated with Sustainable Development Goal (SDG) labels, complemented by a curated set of global development and governance indicators. Three tables below provide quantitative summaries of (i) the news corpus (
Table 3), (ii) the SDG distribution of coverage (
Table 4), and (iii) the auxiliary metadata used for correlation and clustering analysis (
Table 5). The relatively uniform SDG distribution in
Table 4 reflects the global prevalence of integrative topics (e.g., health, innovation) that co-occur across news headlines. The GPT classifier may also converge toward dominant themes due to semantic proximity among SDG indicators. Future refinements using multilabel classification could mitigate this flattening effect.
4.2. Sentiment Landscape Across Countries and SDGs
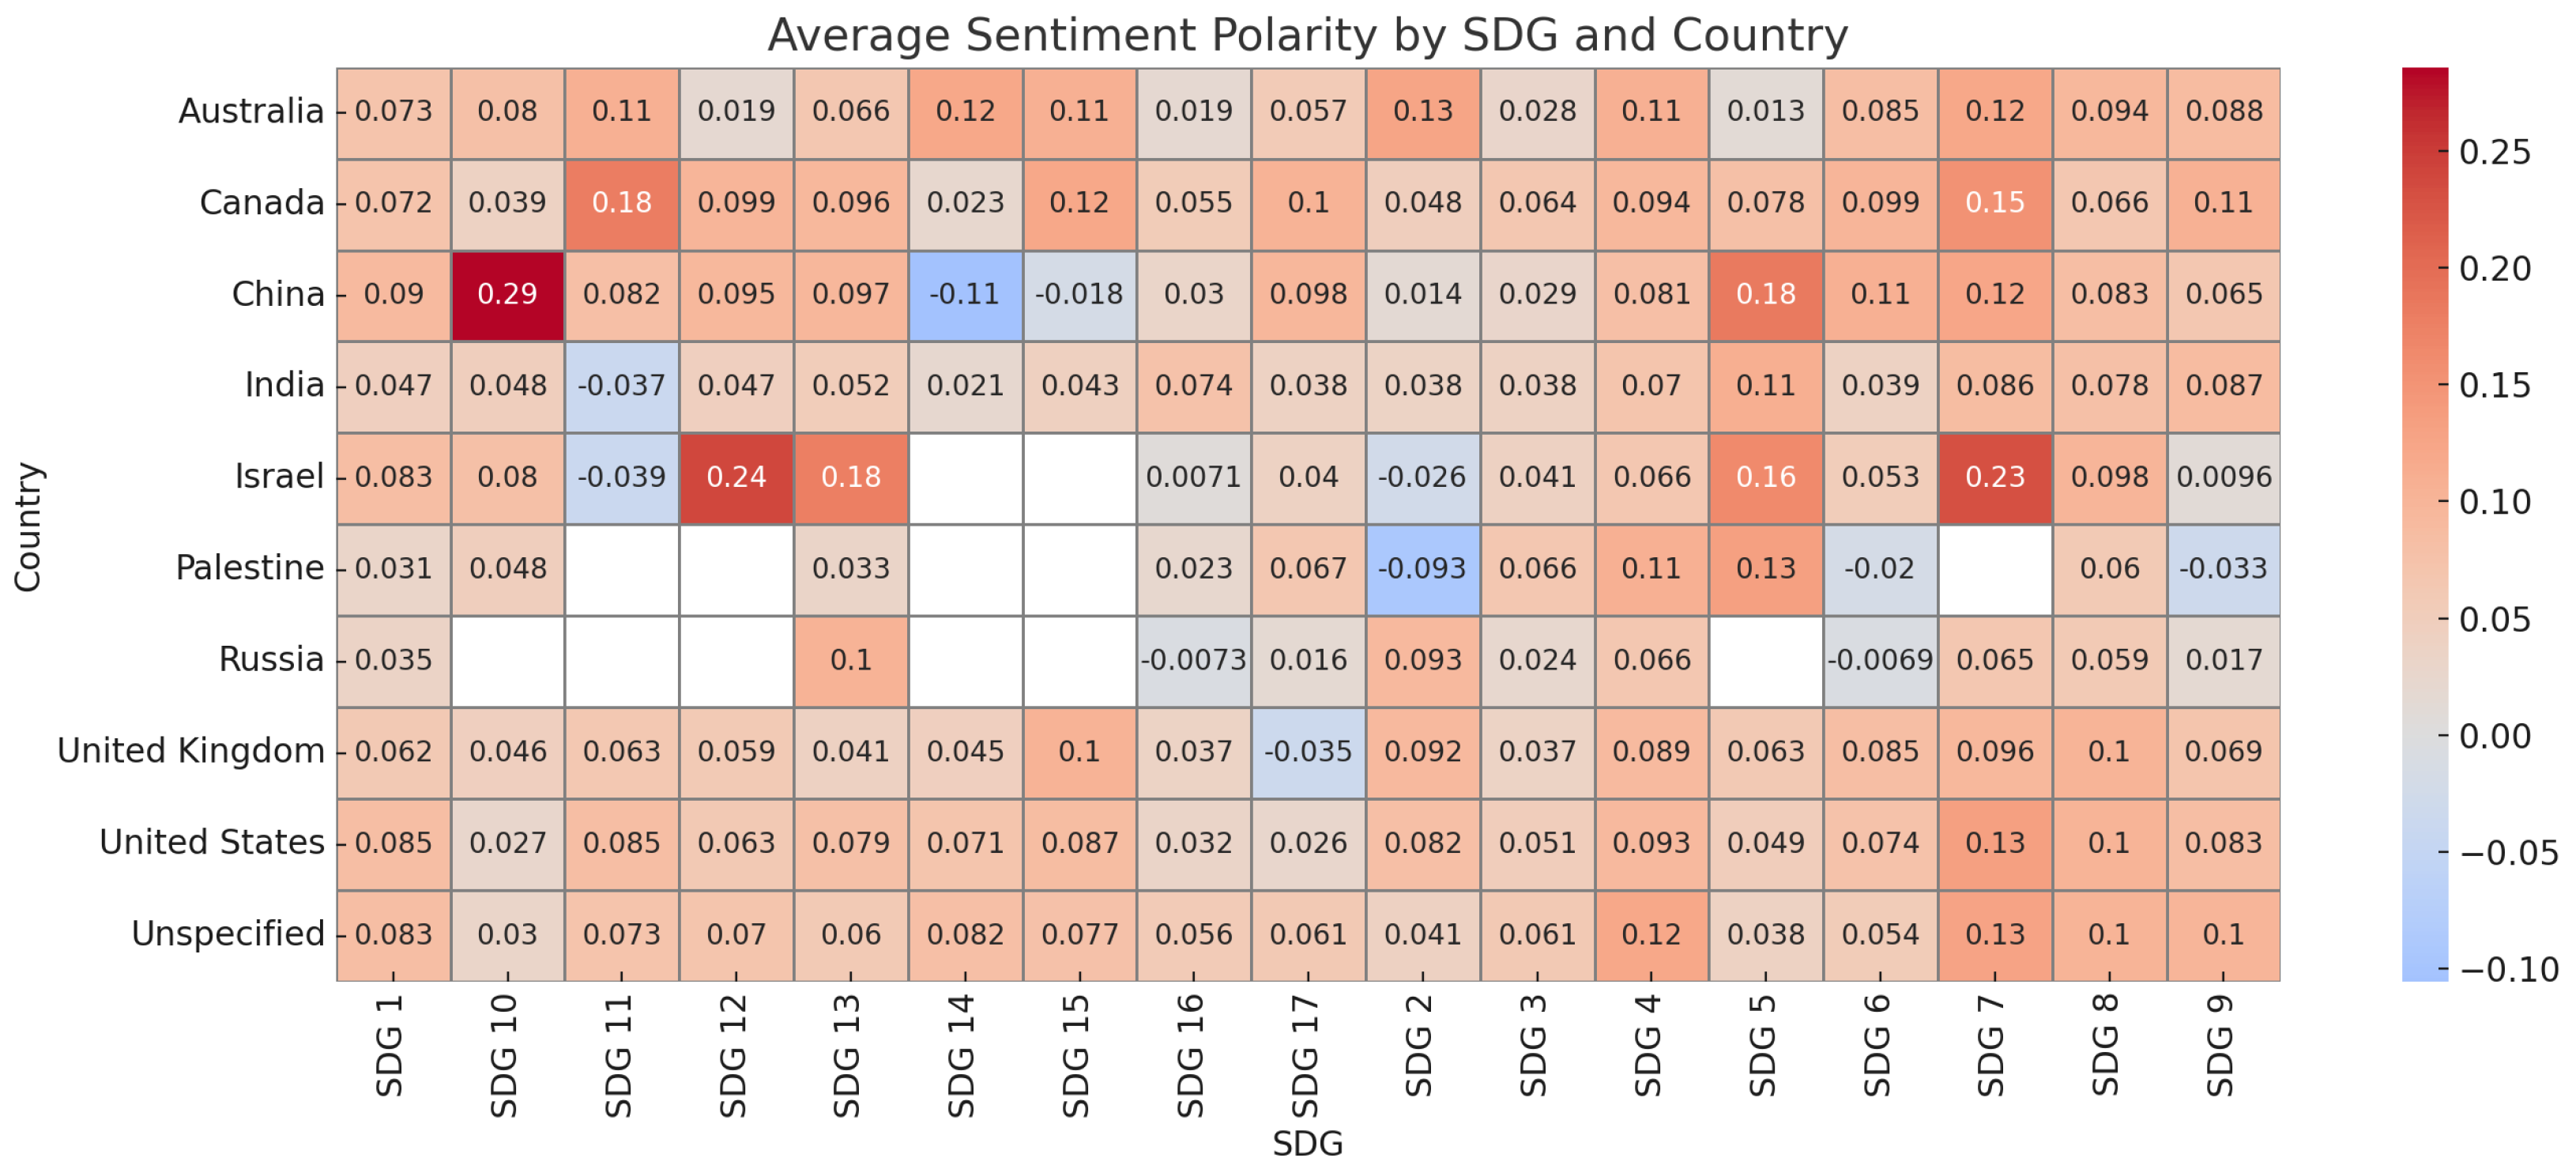
To understand the narrative tone in which sustainability-related issues are presented across different national contexts, this subsection investigates the polarity of SDG-labeled news headlines. Sentiment polarity scores were computed using TextBlob, where values range from (strongly negative) to (strongly positive), and aggregated across country–SDG pairs.
Figure 2 visualizes this sentiment landscape, with SDGs arrayed along the horizontal axis and countries (normalized by ISO2 codes [
17]) along the vertical axis. The heatmap illustrates a spectrum of emotional framing in media coverage, revealing striking geographic heterogeneity.
To summarize the key observations,
Table 6 presents a structured overview of major insights derived from the distribution of sentiment polarity.
In the context of KSA (i.e., Saudi Arabia), SDG narratives exhibit moderately positive sentiment, particularly around SDG 9 (Industry, Innovation and Infrastructure) and SDG 4 (Quality Education), aligning with Vision 2030 priorities. However, comparatively more negative sentiment and higher subjectivity for SDG 5 (Gender Equality) and SDG 13 (Climate Action) reflect prevailing cultural and policy sensitivities. This underscores the need for targeted communication strategies that amplify optimism and inclusivity in the sustainability discourse.
These findings form a foundational basis for subsequent clustering and correlation analyses, where sentiment metrics are linked with broader sociopolitical and economic indicators.
4.3. Subjectivity Patterns in SDG Reporting
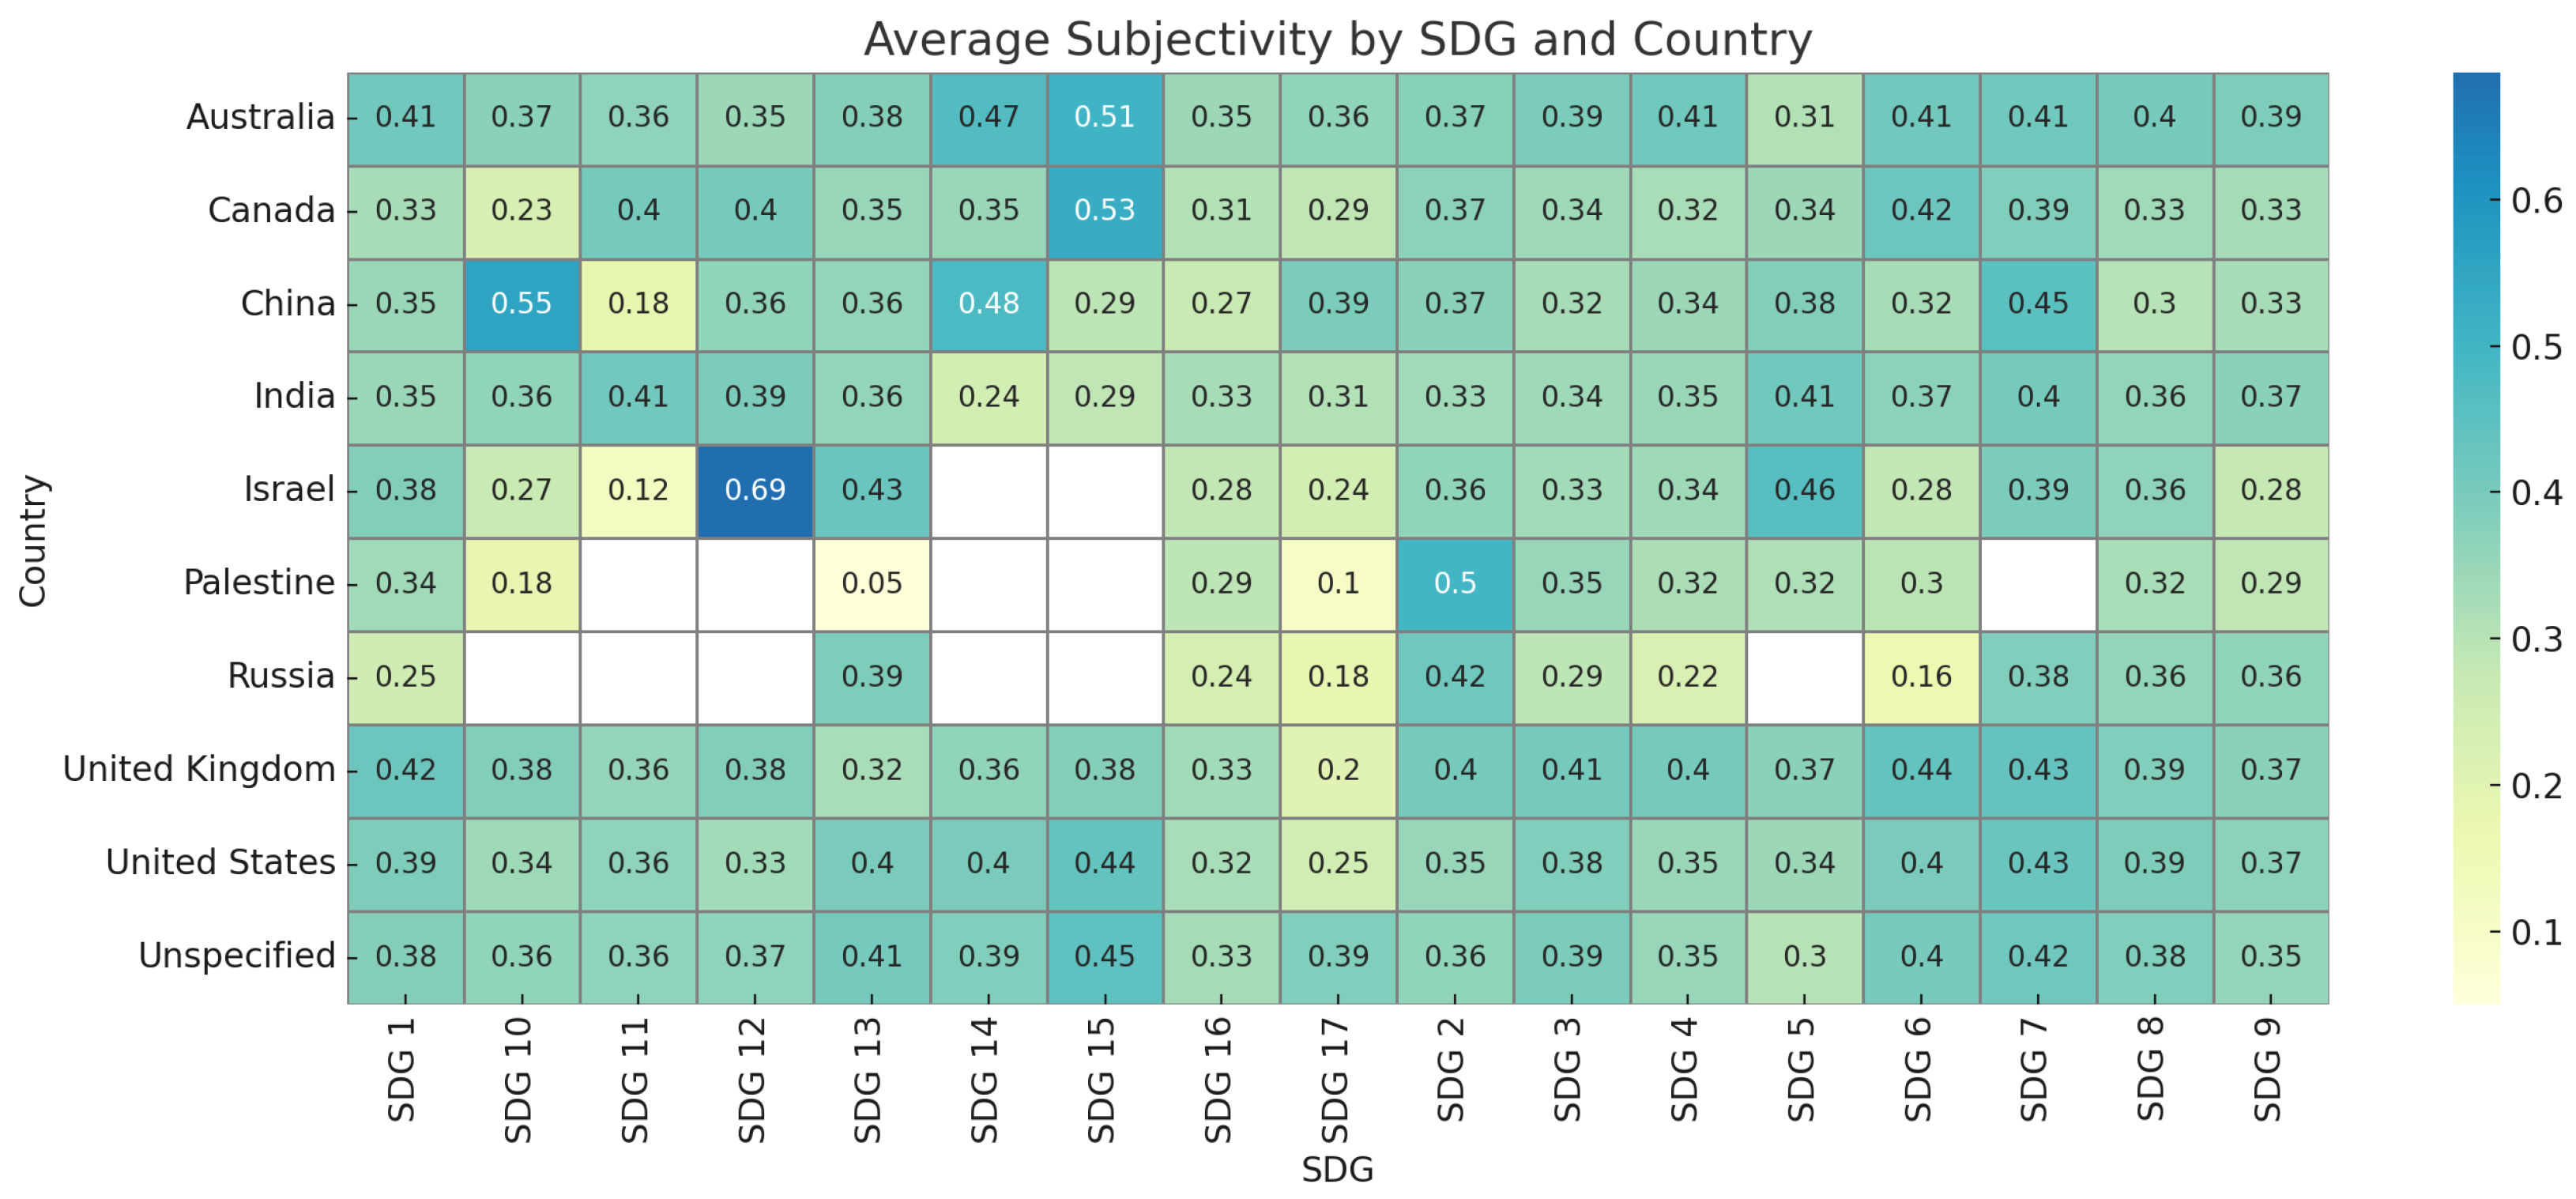
Beyond polarity, the degree of subjectivity in news coverage provides valuable insight into how fact-based versus how emotionally framed different SDG narratives are. Subjectivity scores, ranging from 0 (fully objective) to 1 (highly subjective), were computed using TextBlob for each headline. These were aggregated by country and SDG for comparative visualization.
Figure 3 presents a heatmap depicting subjectivity scores across the SDG-country matrix. Blue cells indicate lower subjectivity (more objective reporting), while red cells highlight higher subjectivity (more emotion- or opinion-driven coverage).
To aid in interpretability,
Table 7 presents a structured summary of the primary observations regarding subjectivity in SDG reporting.
The heterogeneity in subjectivity levels across SDGs and geographies underscores the diverse journalistic cultures and societal sensitivities shaping the sustainability discourse. These differences have important implications for framing effects, public opinion, and policy receptivity in various national contexts.
4.4. Temporal Dynamics of SDG Sentiment
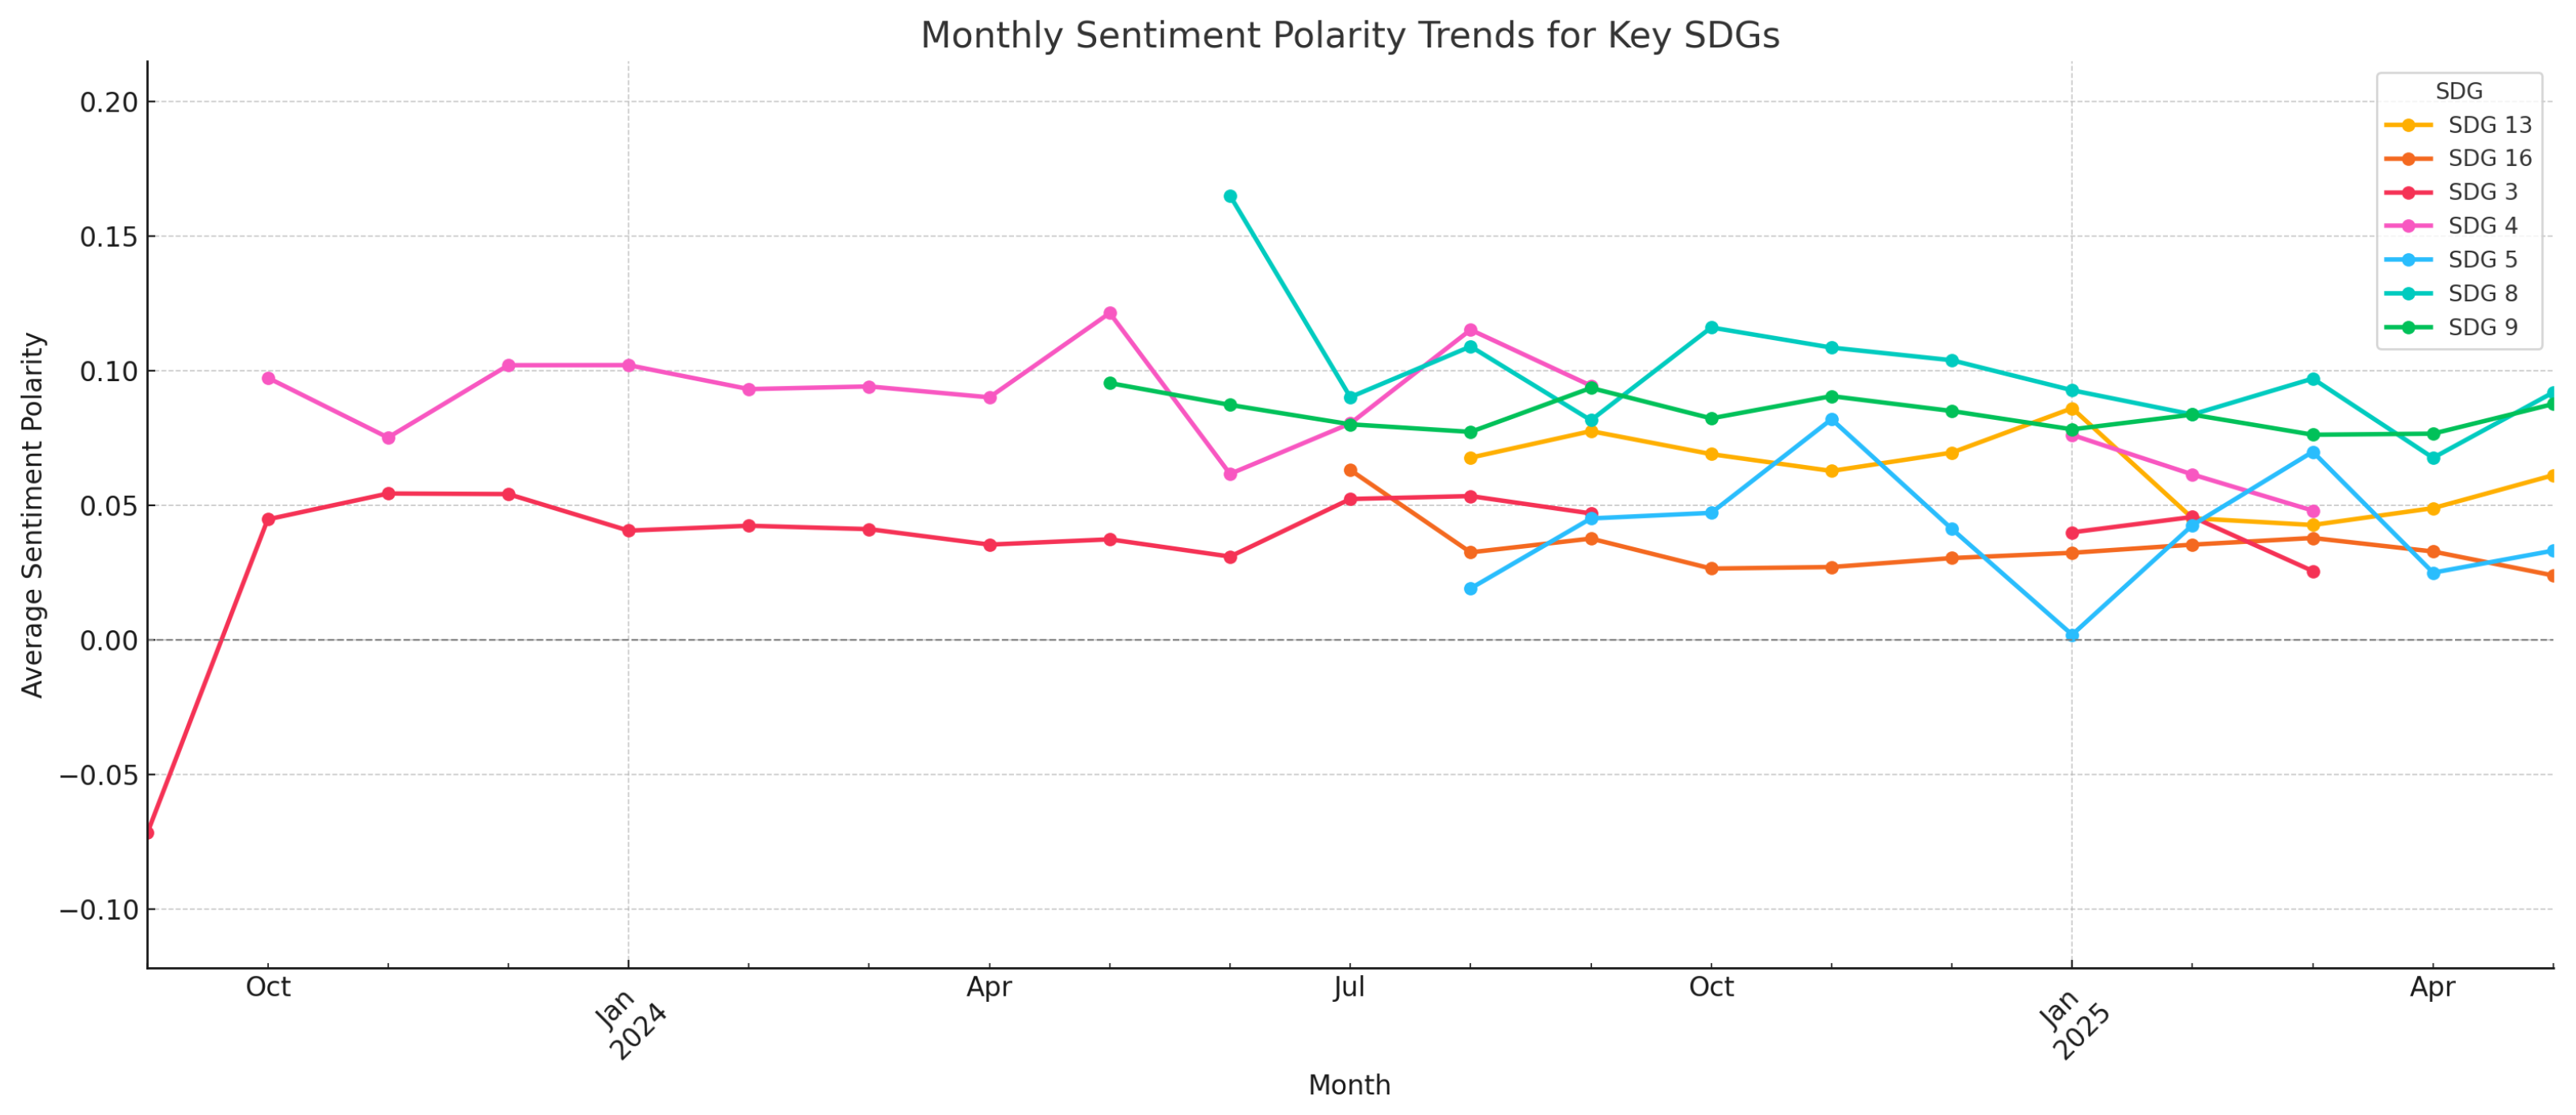
The sustainability discourse in the news media is temporally fluid, often shaped by unfolding events, policy changes, and global summits. To explore this dynamic nature, we present a longitudinal analysis of sentiment polarity over time in
Figure 4 and
Table 8. Headline sentiment scores were averaged by month and plotted over a multiyear period spanning January 2023 to May 2025.
Figure 4 illustrates the temporal evolution of average sentiment polarity across all SDGs, smoothed with a three-month moving average to reduce noise. Distinct inflection points and periods of volatility can be observed, offering clues into the responsiveness of media narratives to global sustainability contexts.
These temporal fluctuations in polarity underscore the importance of media timing in shaping public sentiment. By quantifying this variation, the study establishes a data-driven link between external events and sustainability discourse, adding temporal granularity to prior cross-sectional analyses.
4.5. Country Groupings via PCA-Based Clustering
To uncover latent structure in how countries report on sustainability, we apply Principal Component Analysis (PCA) followed by k-means clustering to the sentiment vectors derived from SDG-labeled headlines. Each country is represented by a 17-dimensional feature vector, where each dimension corresponds to the average sentiment polarity for a particular SDG.
PCA was employed to project the high-dimensional data into a lower-dimensional space for visualization, preserving maximal variance. The optimal number of clusters () was determined via the silhouette score and elbow method, balancing model interpretability with explained variance.
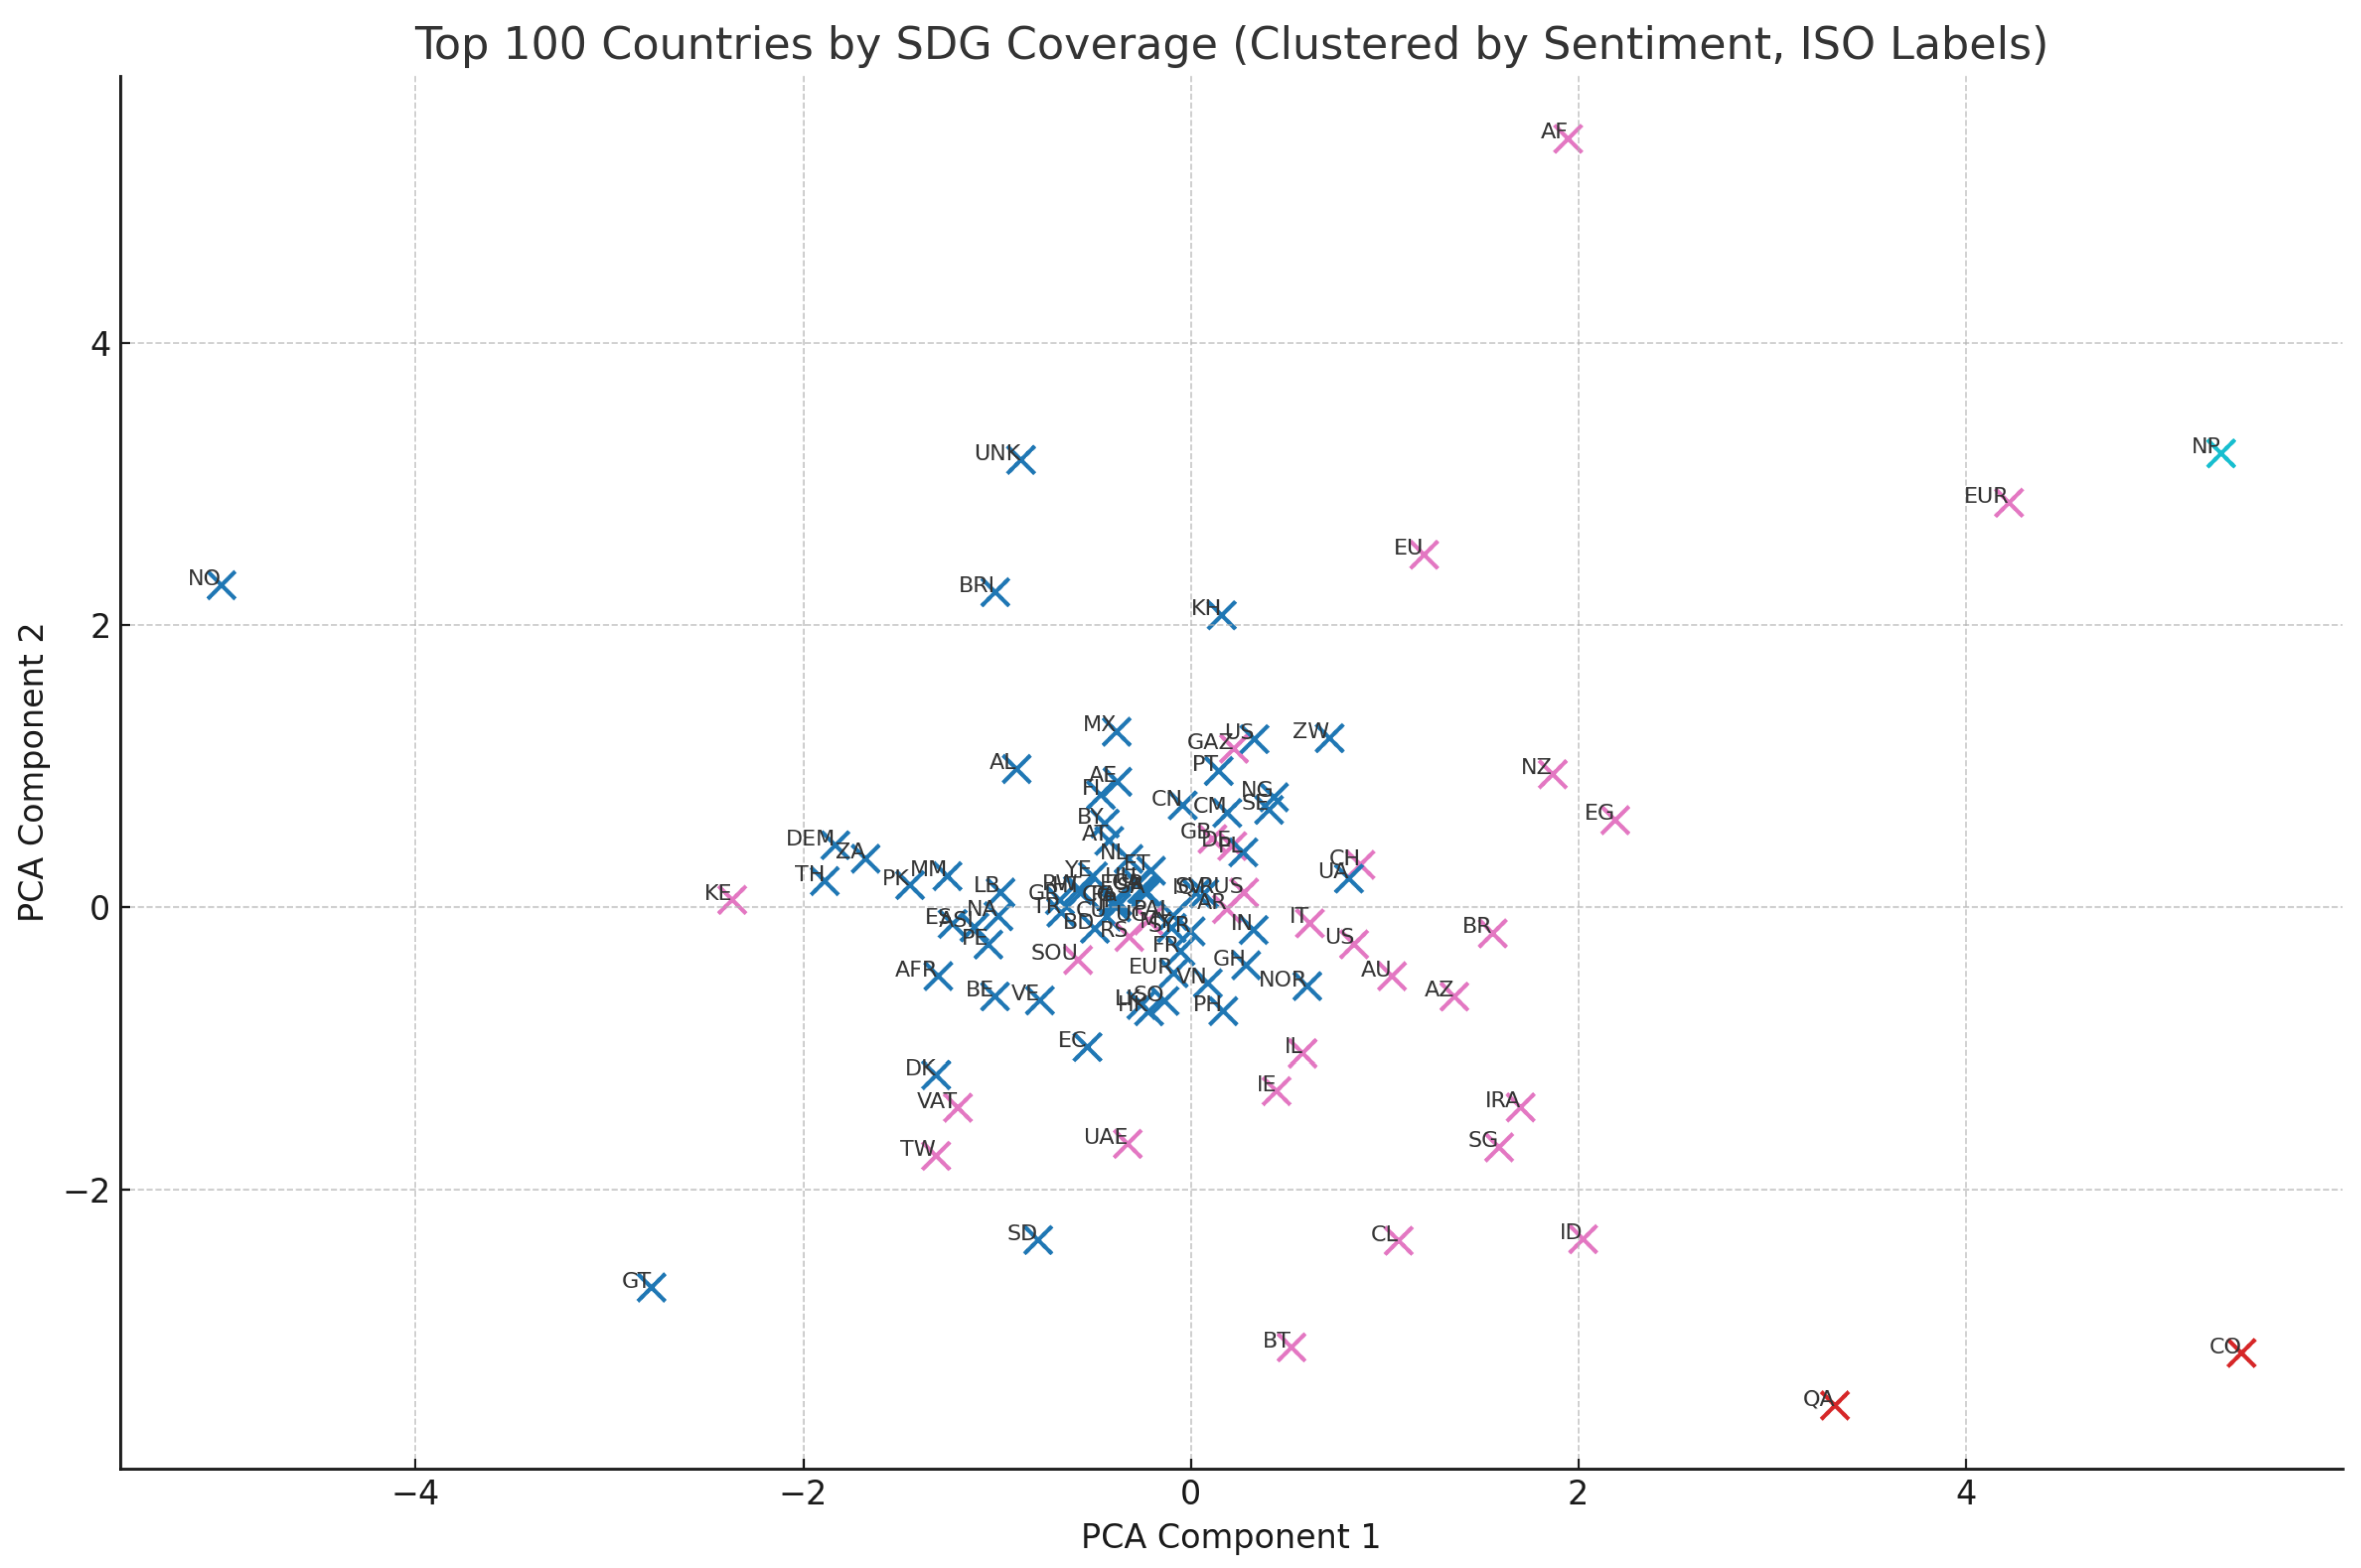
Figure 5 illustrates the result of the PCA projection overlaid with
k-means cluster assignments. Each dot represents a country, colored according to its cluster label.
The clusters exhibit the following general characteristics, summarized in
Table 9.
This unsupervised clustering supports the hypothesis that sustainability discourse is shaped not only by the issues being covered but also by a country’s development profile and media framing norms. The identified clusters serve as analytical anchors for subsequent comparisons involving external governance and sustainability indicators.
4.6. Sustainability and Governance Correlates
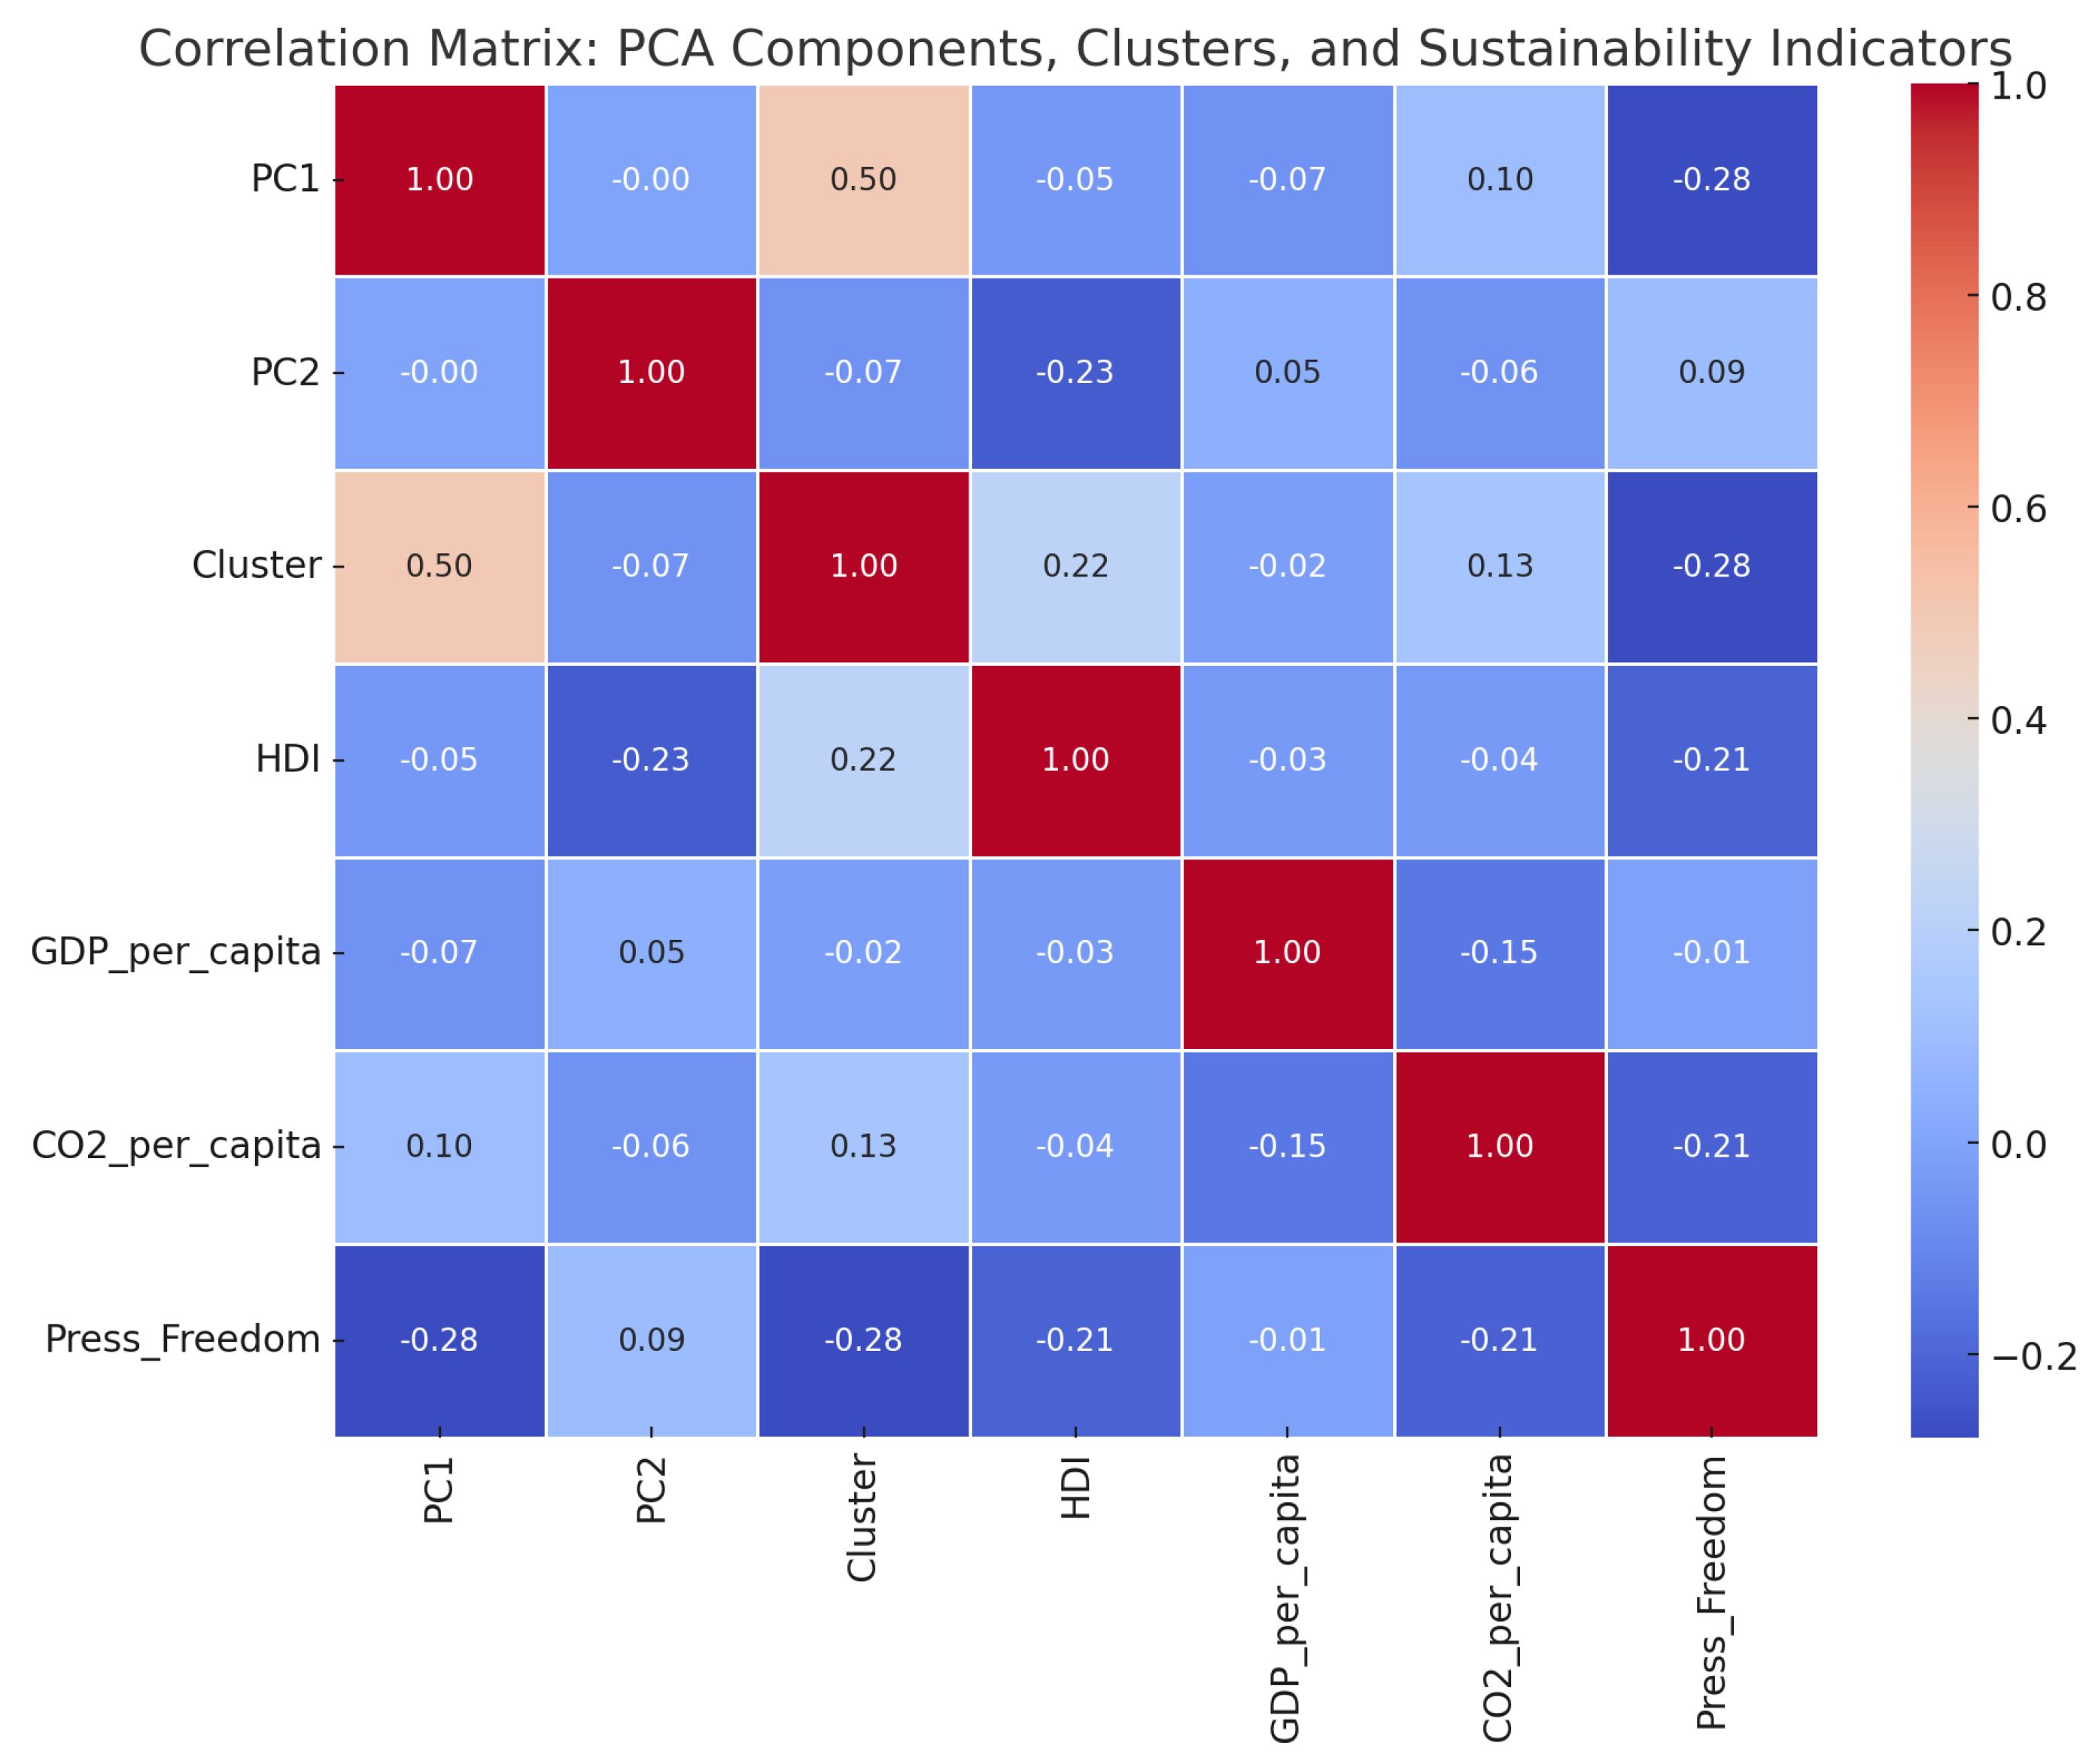
To investigate how sentiment-based media representations of the SDGs align with broader national indicators of sustainability, we computed correlation coefficients between the principal components derived from SDG sentiment vectors and four governance indicators: HDI, GDP per capita, CO2 emissions per capita, and Press Freedom Index (PFI).
Figure 6 presents a heatmap of the Pearson correlation matrix, illustrating the pairwise relationships among the principal sentiment dimensions and the indicator variables. Since most correlations in
Figure 6 are weak or near zero,
Table 10 shows only the meaningful ones (
).
These correlations validate the construct validity of the sentiment-derived components, suggesting that media framing patterns around sustainability are not arbitrary but grounded in deeper socioeconomic realities. This insight provides a crucial link between digital discourse and national sustainability readiness.
4.7. Development Profile Across Clusters
To further contextualize the PCA-based sentiment clusters, we compare their distributions across key development and governance indicators: HDI, GDP per capita, Press Freedom Index (PFI), and CO2 emissions per capita. Boxplots are used to visualize inter-cluster variability, and summary statistics are provided to quantify differences.
Figure 7 presents the distribution of each indicator across the four identified clusters, highlighting systematic divergence in development characteristics. Moreover, the statistics for these 4 clusters are provided in
Table 11.
Table 12 distills the key observations from the comparative analysis into a structured format.
These comparative results support the central thesis that sentiment framing in sustainability discourse is structurally aligned with the national development context and governance regimes. As such, sentiment clustering may function as a viable proxy for maturity in sustainability communications.
4.8. Synthesis of Key Findings
This subsection synthesizes the major empirical findings of the study, highlighting cross-cutting patterns and their relevance to global sustainability monitoring (as shown in
Table 13). The multimethod integration of sentiment analysis, unsupervised clustering, and correlation with external indicators provides a robust analytical basis for policy-relevant insights.
These findings collectively advance the methodological argument that news sentiment—when analyzed at scale and mapped across SDGs—can function as a valuable diagnostic tool for use in sustainability monitoring. The results contribute to an emerging literature on computational sustainability analytics and offer actionable insights for global policy forums.
4.9. Sustainability-Driven Implications of Media-Narrative Analysis
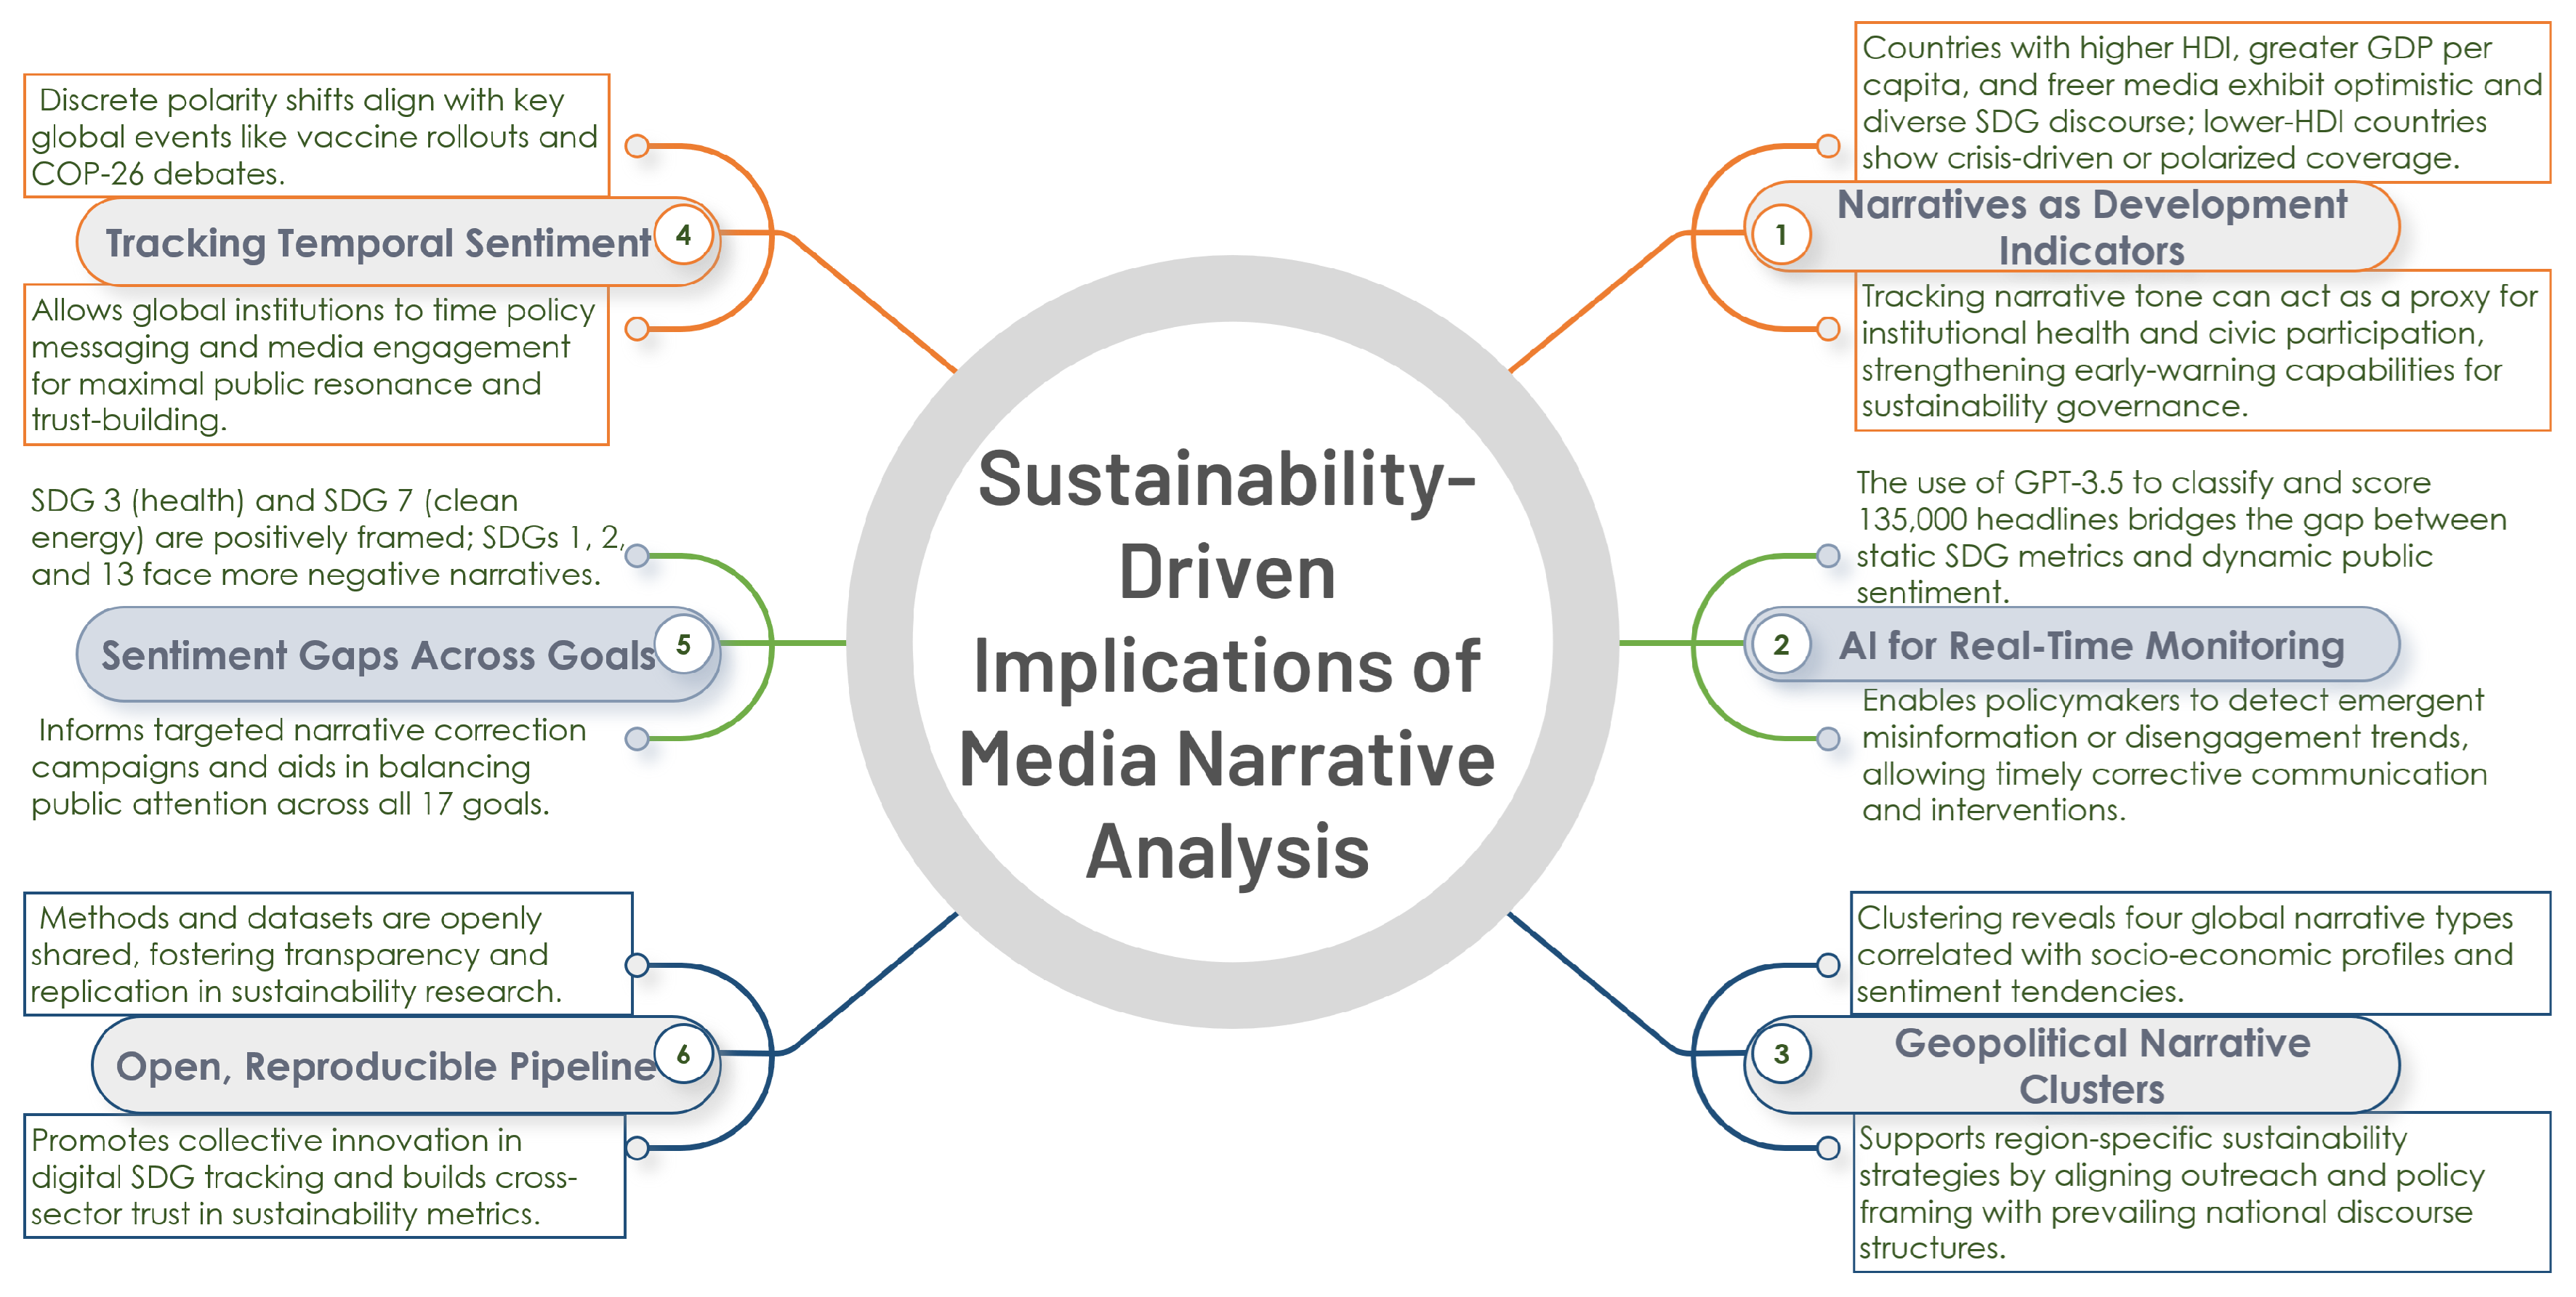
This study advances the discourse on sustainable development by unveiling six key implications derived from computational media analysis. Each of these insights contributes to a deeper understanding of how narrative structures influence, reflect, and potentially reshape the global pursuit of the SDGs.
Narratives as Development Indicators: The study reveals a significant association between the tone of sustainability-related media narratives and macro-level developmental indicators such as the HDI), gross domestic product per capita, and press freedom indices. In contexts where institutions are more robust and civil liberties are protected, news coverage tends to be more optimistic, pluralistic, and thematically diverse. In contrast, countries with lower HDI scores generate crisis-oriented or ideologically polarized discourse. These findings suggest that coherence of media sentiment can serve as a valuable proxy for assessing institutional effectiveness and civic engagement, providing an additional lens for evaluating sustainability governance and policy responsiveness.
AI for Real-Time Monitoring: The implementation of a large language model-based classification and sentiment analysis pipeline, utilizing GPT-3.5, offers a novel mechanism for high-frequency monitoring of sustainability discourse. This approach was applied to over 135,000 news headlines from 100 countries, enabling real-time tracking of public sentiment toward sustainability objectives. As a complement to conventional SDG indicators, which often suffer from latency and limited granularity, the proposed method supports agile policymaking through the timely identification of narrative shifts associated with misinformation, disillusionment, or sociopolitical backlash.
Geopolitical Narrative Clusters: Through principal component analysis and unsupervised clustering, the study identifies four distinct geopolitical narrative typologies, each reflecting underlying disparities in development, media infrastructure, and sentiment orientation. These clusters enable a strategic segmentation of the global media landscape, allowing international agencies and national governments to tailor their communication strategies, financing instruments, and policy messaging to the discursive realities of specific regions. Such targeted approaches are essential for enhancing the cultural relevance and policy efficacy of sustainability interventions.
Tracking Temporal Sentiment: The longitudinal analysis of media sentiment provides evidence of temporal inflections that align with globally significant sustainability events, such as the mass deployment of COVID-19 vaccines and the negotiations surrounding COP-26. These temporal patterns offer valuable insights into the responsiveness of public discourse to policy actions and global summits. The ability to monitor sentiment dynamics over time enhances the capacity of multilateral institutions to evaluate the communicative effectiveness of their interventions and to optimize the timing of public-engagement campaigns.
Sentiment Gaps Across Goals: The study identifies marked disparities in sentiment polarity between specific SDGs. Goals such as SDG 3 (Good Health and Well-being) and SDG 7 (Affordable and Clean Energy) are predominantly associated with positive sentiments, whereas goals addressing poverty (SDG 1), hunger (SDG 2), and climate action (SDG 13) are more frequently embedded in negative or crisis-oriented frames. These findings underscore the need for balanced narrative framing across all 17 goals. Targeted narrative correction and amplification efforts can play a critical role in mitigating issue fatigue and promoting equitable attention across the full spectrum of sustainability objectives.
Open, Reproducible Pipeline: By making the dataset and computational methodology publicly accessible, the study contributes to the advancement of open and reproducible science within the sustainability domain. This transparency not only facilitates independent validation and scholarly extension but also strengthens stakeholder trust in data-driven approaches to sustainability monitoring. The availability of this pipeline encourages transdisciplinary collaboration and accelerates the integration of natural language processing-based tools into policy-relevant sustainability analytics.
These implications are summarized visually in
Figure 8, which synthesizes the major narrative-driven insights in relation to sustainable development outcomes.
4.10. Future Works
To enhance the utility of this study for emerging scholars in sustainability analytics, it is imperative to articulate clear avenues for future research. Building on the proposed GPT-based sentiment-clustering framework, subsequent investigations could explore several trajectories. First, incorporating full-text news articles rather than solely analyzing headlines would enable deeper semantic granularity and narrative-structure analysis [
23]. Second, extending the model to accommodate multilingual corpora would significantly improve its global applicability, particularly across the Global South, where English-language reporting is sparse. Third, integrating real-time social media streams, such as Twitter or Reddit, may offer a dynamic lens into grassroots-level perceptions of sustainability, complementing formal media narratives [
24,
25,
26]. Fourth, the sentiment-coherence metrics developed herein could be applied longitudinally to assess policy responsiveness, narrative shifts, or the impact of international events on SDG communication. Fifth, developing interactive dashboards for visualization of SDG sentiment, coupled with explainable AI components, would enable early-career researchers to replicate, extend, and apply the model in cross-sectoral sustainability governance contexts [
27,
28,
29]. Sixth, although GPT-3.5 represents a state-of-the-art approach to semantic classification, its interpretative reliability warrants further validation through systematic benchmarking against human-annotated ground-truth datasets. Lastly, future work will explore integration of long-form textual sources and dynamic modeling of SDG narratives using temporal graph-based structures and large-scale LLMs fine-tuned on policy discourse [
30].
5. Conclusions
This study advances the frontier of digital sustainability governance by introducing a novel, reproducible framework for analyzing the global media discourse on the Sustainable Development Goals (SDGs). By integrating GPT-3.5–based semantic classification with sentiment-polarity scoring, principal component analysis (PCA), and clustering, the methodology enables the construction of a high-resolution, country-level typology of SDG narratives across 135,000 news headlines from 100 countries spanning the years 2023 to 2025. This large-scale analysis reveals that sentiment framing in sustainability reporting is not merely circumstantial, but systematically structured by national development indicators—most notably, Human Development Index (), GDP per capita (), and press freedom ().
Four distinct geopolitical clusters were uncovered, capturing nuanced variations in optimism, emotional framing, and topic salience across regions. Temporal analysis further demonstrated the media’s responsiveness to global crises and policy milestones, as evidenced by pronounced sentiment fluctuations during events such as COP26 and pandemic-recovery phases. Collectively, these insights suggest that media sentiment may serve as a latent indicator that reflects patterns associated with a country’s practices around sustainability communication and the governance context, although causal interpretations should be approached with caution.
By addressing the persistent methodological gap in SDG-related news analytics—largely overlooked by traditional indicator-based systems—this work provides an actionable, scalable, and mathematically rigorous pipeline for comparative policy analysis. It complements remote sensing [
3] and knowledge-graph–based monitoring approaches [
8], while offering a new dimension to real-time narrative tracking aligned with Agenda 2030. Ultimately, the findings advocate for greater narrative equity and encourage international agencies, journalists, and sustainability stakeholders to integrate media-sentiment diagnostics into broader evaluations of SDG progress.
