Article

Carbon Dioxide Emission-Reduction Efficiency in China’s New Energy Vehicle Sector Toward Sustainable Development: Evidence from a Three-Stage Super-Slacks Based-Measure Data Envelopment Analysis Model

1
Business School, Hohai University, Nanjing 211100, China
2
College of Economics and Management, Nanjing Forestry University, Nanjing 210037, China
*
Authors to whom correspondence should be addressed.
Sustainability 2025, 17(16), 7440; https://doi.org/10.3390/su17167440 (registering DOI)
Submission received: 6 July 2025 / Revised: 29 July 2025 / Accepted: 12 August 2025 / Published: 17 August 2025

Abstract

This research evaluates the carbon dioxide emission-reduction efficiency of new energy vehicles (NEVs) in China from 2018 to 2023 by applying a three-stage super-SBM data envelopment analysis (DEA) model that incorporates undesirable outputs. This model offers significant advantages over traditional DEA models, as it effectively disentangles the influences of external environmental factors and stochastic noise, thereby providing a more accurate and robust assessment of true efficiency. Its super-efficiency characteristic also allows for effective ranking of all decision-making units (DMUs) on the efficiency frontier. The empirical findings reveal several key insights. (1) The NEV industry’s carbon-reduction efficiency in China between 2018 and 2023 displayed an upward trend accompanied by pronounced fluctuations. Its mean super-efficiency score was 0.353, indicating substantial scope for improvements in scale efficiency. (2) Significant interprovincial disparities in efficiency appear. Unbalanced coordination between production and consumption in provinces such as Shaanxi, Beijing, and Liaoning has produced correspondingly high or low efficiency values. (3) Although accelerated urbanization has reduced the capital and labor inputs required by the NEV industry and has raised energy consumption, the net effect enhances carbon-reduction efficiency. Household consumption levels and technological advancement exerts divergent effects on efficiency. The former negatively relates to efficiency, whereas the latter is positively associated.

1. Introduction

The global community is positioned at a critical juncture in the transition toward sustainable energy systems and climate change mitigation. As a primary source of global greenhouse gas (GHG) emissions, the transportation sector has substantial potential for emission reductions that are crucial to achieving Sustainable Development Goals. According to the United Nations Environment Programme (UNEP) Emissions Gap Report 2024, global GHS emissions hit a record high of 57.1 billion metric tons of carbon dioxide equivalent (CO2-eq) in 2023, or 1.3% over 2022 [1]. Emissions from the transportation sector were 8.4 billion metric tons CO2-eq, underscoring the urgency of reductions in this area [1]. To achieve the ambitious goal of limiting global warming to 1.5 Celsius under the Paris Agreement, annual global GHG emissions by 2035 must be cut 42% by 2030 and 57% by 2035 [1]. Within this context, NEVs, which serve as low-carbon alternatives to conventional fuel vehicles, are expected to play an increasingly vital role in energy conservation and emission reduction [2].
As the world’s largest carbon emitter, China’s transportation sector is responsible for approximately 11% of national emissions, making it a key domain for decarbonization [3]. China has pledged that its carbon emissions will peak before 2030 and that carbon neutrality will be achieved by 2060, rendering electrification of the automotive industry an inevitable trajectory [3]. Explosive growth has been observed in China’s NEV market in recent years. From data of the China Association of Automobile Manufacturers (CAAM) and TrendForce, domestic NEV sales hit 9.495 million units in 2023, or a 31.6% market share [4]. In 2024, NEV production and sales in China surpassed 12 million units for a market share of 40.9% [5]. TrendForce noted that China made up 67% of global NEV sales in 2024, solidifying its dominant international position [6]. NEV sales are projected by CAAM to reach 16 million units in 2025 [6]. These datapoints demonstrate the rapid transition of China’s NEV industry from policy-driven to market-driven dynamics. Its vast market size and sustained growth momentum render an in-depth analysis of NEV carbon emission-reduction efficiency both pertinent and urgent. Rapid industry development may nonetheless conceal internal inefficiencies. Accordingly, a refined efficiency assessment is crucial to ensure the industry’s healthy and sustainable development.
Despite the rapid development of China’s NEV market, there are persistent challenges with respect to the sector’s carbon emission profile that closely relate to its distinctive energy structure. The literature generally agrees that NEVs contribute to global carbon reduction. However, their actual emission-reduction effect may be constrained in regions whose electricity supply heavily depends on high-carbon thermal power generation [7].
The carbon intensity of electricity generation, which varies greatly by country, is a key factor in NEVs’ overall emissions from “well-to-wheel.” For example, in Norway, a global leader in EV adoption, nearly 98% of its electricity comes from renewable sources, mainly hydropower [8]. France also has a low-carbon electricity profile, with nuclear power making up 65–70% of its generation mix in 2023 and thus greatly reducing its EV fleet’s carbon footprint [9]. Other major auto markets show a more complicated situation. Natural gas and coal in the U.S. together made up roughly 59% of utility-scale electricity generation in 2023 [10]. Similarly, Japan depends heavily on fossil fuels, with LNG and coal accounting for over 60% of its electricity each year [11]. This variation around the world highlights that NEVs’ environmental benefits depend on the context. This makes China’s situation particularly noteworthy.
According to a 2025 report by the energy think tank Ember, coal-fired power was 54.8% of China’s total electricity output in 2024 [12]. This implies that a significant share of NEVs’ electricity consumption is sourced from high-carbon coal-fired generation. This unique combination of high sales volume and a high share of coal-based power complicates the direct application of universal conclusions drawn from international studies to the Chinese context, thereby necessitating urgent localized empirical analysis [13]. It is worth noting that the nation’s energy structure remains dynamic. In 2024, it attained a historical high clean-energy generation (including solar PV and wind power), and this achievement was followed by stabilization, or even a decline, in power-sector carbon emissions after March 2024 [14]. Moreover, the share of coal in primary energy consumption fell to 55.3% in 2023 [15].
The accelerating shift toward renewables means that the carbon abatement potential of NEVs will grow markedly as China’s power grid decarbonizes. Accordingly, our research highlights the current challenges posed by a coal-centric electricity mix. It also incorporates China’s recent progress in clean energy expansion and the additional mitigation benefits expected from future grid decarbonization. This dual perspective renders the analysis both forward-looking and highly policy-relevant.
This paper presents an evaluation of the carbon dioxide emission-reduction efficiency of China’s NEVs, shifting the analytical focus from the traditional concept of emission-reduction effect to that of emission-reduction efficiency. The emission-reduction effect targets whether absolute emissions decline, where emission-reduction efficiency denotes the ability to achieve abatement in the most economical manner—that is, to maximize reductions while minimizing inputs (e.g., energy, capital, and labor) [16]. By focusing on efficiency, bottlenecks in the low-carbon transition of China’s NEV industry can be diagnosed more precisely, and targeted policy recommendations for global emission mitigation can be formulated [16].
This study makes two primary contributions to the existing literature. First, we introduce a robust methodological framework by applying a three-stage DEA model to evaluate the carbon-reduction efficiency of the NEV sector. This approach, which is designed to separate managerial inefficiencies from the effects of external environmental factors and statistical noise [16], allows for a more precise assessment of provincial-level performance. While this methodology has proven effective in other areas of environmental efficiency analysis in China [17], its application to the NEV sector remains a notable gap. Our research bridges this methodological gap by providing the first such application. Second, we address a critical limitation in many existing NEV assessments by developing a carbon emission calculation method that explicitly incorporates the heterogeneity of China’s regional power-grid characteristics. The environmental benefits of NEVs are highly dependent on the carbon intensity of the electricity used for charging, which varies significantly across provinces [7,12] but is often overlooked in broader analyses. By integrating these local power-mix variables, our model offers a more accurate and context-specific measure of the real-world operational carbon footprint of NEVs in China.

2. Literature Review

2.1. Assessing the Environmental Impact of NEVs

Academic discussion about NEVs’ environmental benefits has shifted from basic lifecycle assessments to more advanced evaluations of efficiency. Influential studies have used life-cycle assessments (LCAs) to measure NEV’ total environmental impact in comparison to internal combustion engine vehicles (ICEVs). Findings consistently show that, although the manufacturing process of NEVs (especially battery production) is more energy-intensive, the operational phase results in significant emission reductions. This leads to a lower overall carbon footprint across an EV’s lifespan [18,19]. However, LCA studies’ results are highly affected by context, particularly the carbon intensity of the electricity grid used for charging [20]. This demonstrates that simply increasing the number of NEVs on the road does not automatically lead to proportional reductions in carbon emissions. As a result, research has increasingly focused on how efficiently the NEV sector translates economic and energy inputs into environmental benefits, such as emission reductions, offering a more detailed understanding of its role in sustainable development [21].

2.2. Methodological Evolution in Environmental Efficiency Measurement

As a non-parametric linear programming method, DEA has become a fundamental tool for assessing the relative efficiency of a set of DMUs with multiple inputs and outputs [22]. Its broad use in energy and environmental research arises from its capacity to handle complex production relationships without needing to specify a functional form in advance [23]. However, traditional DEA models, such as the CCR and BCC models, have notable limitations when used for environmental performance assessment. These radial models often overlook non-radial slacks in inputs and outputs, which can lead to an overestimation of efficiency. More importantly, they have difficulty properly incorporating undesirable outputs, like CO2 emissions [24].
To address these challenges, the SBM model was developed by Tone [25]. As a non-radial and non-oriented model, it directly incorporates input and output slacks into the objective function, which results in a more precise and stringent measure of inefficiency [25]. Its main advantage is its ability to treat undesirable outputs as outputs to be minimized, making it particularly suitable for environmental efficiency studies [26]. Numerous papers have presented how SBM models can evaluate the carbon and environmental efficiency of China’s industrial and transport sectors [27,28].
When multiple DMUs are evaluated as being fully efficient (with a score of 1), the standard SBM model faces its own limitations in ranking them. To overcome this, the super-SBM model was proposed by Tone [29], allowing efficiency scores to exceed 1. This enables the differentiation and ranking of top-performing DMUs, which is essential for our comparative provincial-level analysis.
External environmental factors, such as regional economic development and urbanization, and random statistical noise can distort efficiency evaluations, as they are beyond the control of the evaluated units. To obtain a measure of true managerial efficiency, these confounding effects must be isolated [16]. The three-stage DEA framework, introduced by Fried et al. [16], offers a robust solution. In the second stage, this framework uses SFA to statistically decompose input slacks, separating the influences of managerial inefficiency, environmental factors, and random noise. Recent studies on China’s energy and environmental efficiency have adopted this three-stage approach to produce more accurate policy insights [17,30]. By adjusting input variables based on this decomposition, the third stage derives a pure efficiency score that reflects actual operational performance.
Considering the need to handle undesirable CO2 emissions, to accurately measure slack-based inefficiency, to rank fully efficient provinces, and to account for external environmental influences and random errors, the three-stage super-SBM DEA model is identified as the most appropriate and rigorous method for this study’s static assessment [31]. Many studies focus solely on static models, neglecting the important dynamic evolution of productivity over time [32]. To fill such a gap, this study applies the Malmquist productivity index, proposed by Färe et al. [33]. This index decomposes productivity changes into technical efficiency improvements (catching up to the frontier) and technological progress (shifts in the frontier itself), providing valuable insights into the drivers of performance dynamics. The Malmquist index is now widely used for dynamic environmental performance evaluation [34]. By combining a robust static model with a dynamic productivity measure, this research aims to provide a comprehensive, two-dimensional understanding of the carbon reduction efficiency of China’s NEV sector [35].

3. Research Methods

This study employs an extended DEA model to assess the dynamic CO2 emissions of NEVs in China. It focuses on 21 provinces in China that place a relatively strong emphasis on the promotion of NEVs. Given the challenges in obtaining CO2 emissions data, it is essential to first estimate the CO2 emissions of NEVs. Section 3.1 lists the detailed calculation method. Section 3.2 introduces the super-SBM model to assess the CO2 emission efficiency of NEVs. Section 3.3 presents the formula for calculating the Malmquist productivity index. Section 3.4 outlines the index system and data sources utilized to construct the super-efficient SBM model. Figure 1 illustrates the flowchart of the three-stage super-SBM DEA model.

3.1. Emissions’ Evaluation Model

To accurately assess the carbon footprint of NEVs at a regional level, this study adopts a “grid-to-wheel” perspective, emphasizing the indirect emissions generated during the vehicle’s operational (use) phase [36]. This approach is intentionally chosen over a comprehensive LCA for several key reasons aligned with the research objectives. Primarily, the goal is to evaluate the efficiency of carbon reduction concerning the interaction between NEV electricity consumption and China’s highly heterogeneous provincial power grids [37]. The “grid-to-wheel” method (expressed in Equation (1)) directly captures this dynamic by linking vehicle energy use to the specific carbon intensity of local electricity generation, which varies significantly across the country. This provides a targeted and policy-relevant measure of operational efficiency. It also enables a more precise analysis of how ongoing grid decarbonization efforts influence the real-world emissions of China’s current and expanding NEV fleet [38]. While this method does not consider emissions from manufacturing, battery production, or end-of-life processes, it is deemed appropriate given the focus on evaluating the effectiveness of NEV deployment within different regional energy systems. Findings reveal the operational phase as the most direct and variable source of emissions, making it the most critical element for this particular efficiency analysis.
This study focuses on two types of NEVs: pure electric vehicles (BEVs) and hybrid electric vehicles (HEVs). NEVs are considered exhaust-free during operation, but their battery-charging process generates indirect CO2 emissions. Between 2018 and 2023, despite the increasing share of clean energy in China’s energy mix, thermal power generation remained dominant. The CO2 emissions of NEVs are calculated by multiplying the carbon emissions per hundred kilometers of NEVs by their annual average mileage. Thus, the CO2 emission formula per hundred kilometers of NEVs developed herein is:
M N E V C = h E Q C k T e L 100,000 ( 1 θ 1 ) ( 1 θ 2 )
The variable M N E V C is total annual indirect CO2 emissions from the NEV fleet. The right side of the formula constructs an effective emission factor based on China’s power structure. The variables, their precise definitions, and corresponding units are specified as follows.
M N E V C : Total annual indirect CO2 emissions from the NEV fleet in kilograms (kgCO2).
h E : Average energy consumption rate of an NEV in kilowatt-hours per 100 km (kWh/100 km).
Q : Proportion of thermal power in the national electricity generation mix (dimensionless).
C : Coal consumption rate for thermal power generation in grams of standard coal equivalent per kilowatt-hour (gce/kWh).
k : CO2 emission coefficient of standard coal, representing the mass of CO2 emitted per unit of standard coal burned in kilograms of CO2 per kilogram of standard coal equivalent (kgCO2/kgce).
T E : Total number of NEVs in the fleet (unitless).
L : Average annual mileage per NEV in kilometers (km).
θ 1 : Power loss rate during the charging process (dimensionless). Iosifidou et al. [39] found this loss to be 6.92% for NEVs in Asia at conventional charging rates.
θ 2 : Power loss rate during grid transmission (dimensionless).
The constant 100,000 in the denominator is a composite conversion factor. It accounts for the basis of h E and converts the units of the numerator’s components into kilograms of CO2.

3.2. Efficiency Evaluation Model (Three-Stage Super-SBM DEA)

3.2.1. Stage 1: Non-Oriented and Super-Efficient SBM Model with Unexpected Output

DEA methods are primarily employed to evaluate multiple DMUs and are categorized into two types: one includes the CCR and BBC models based on radial metrics, while the other is the SBM model, which uses non-radial metrics [40]. The super-efficient SBM model provides a more precise calculation of efficiency values along the efficiency frontier, facilitating more effective comparison and analysis. The specific performance is:
m i n σ = 1 + 1 m i = 1 m V i X i u 1 1 a   +   b r = 1 a S r + Y r u g + k = 1 b S k Y k u h s . t . X i u t t = 1 T j = 1 , j 0 n λ j t X i j t V i i = 1 , 2 , , m Y r u t t = 1 T j = 1 , j 0 n λ j t Y r j t + S r + r = 1 , 2 , , a Y k u t t = 1 T j = 1 , j 0 n λ j t Y k j t S k k = 1 , 2 , , b λ j t 0 , V i 0 , S r + 0 , S k 0
In Formula (2), the quantity of DMUs to be evaluated is n , and the number of input indicators of each DMU is equal—all of which are m. This study uses a to represent expected output, b to represent unexpected output, and j to represent a DMU, whose input is X i j . The expected output is Y r j g . The unexpected output is Y k j h . The last line, V i , refers to the redundancy of input indicators, and S r + and S k , respectively, are the expected shortage and the unexpected output excess. These values are non-negative, and the objective function value σ can be greater than 1.

3.2.2. Stage 2: Constructing the SFA Model to Adjust the Original Input Variables

The second stage utilizes the SFA model, originally proposed by Aigner et al. [41] and Meeusen and van den Broeck [42], to regress the input slack variables on the environmental variables. The SFA method is preferred over alternatives such as the Tobit model, because of its ability to distinguish between two components of the composite error term: random statistical noise, denoted as V _ n k , which is assumed to follow a symmetric normal distribution, and technical inefficiency, represented as U _ n k , which is assumed to follow a one-sided distribution such as a half-normal. This decomposition enables a more accurate adjustment of the input variables. SFA effectively eliminates the influence of external environmental factors and random errors [43]. Thus, this study uses the slack variables of input indicators from the previous stage as the dependent variables, while the environmental variables serve as the independent variables.
The SFA model is constructed and refined based on the regression results to ensure accuracy of the third-stage calculations. The formulation of the SFA model is:
S n k = F Z k , β n + V n k + U n k n = 1 , 2 , , N k = 1 , 2 , , K
In Formula (3), this study selects n input indicators and k provinces as DMUs. Here, S n k represents the slack variable of a DMU for an input, Z k represents the environmental variable, β n represents its coefficient, and V n k + U n k represents the mixed error term. The adjusted formula is:
X n k * = X n k + m a x F Z k , β n F Z k , β n + m a x V n k V n k n = 1 , 2 , , N k = 1 , 2 , , K
The adjusted input value represents the original input, while the latter two components indicate that all DMUs are subjected to the same environmental conditions and random error effects.

3.2.3. Stage 3: Calculation and Comparison of the Adjusted Super-Efficiency Value

The adjusted input variables are brought into the super-SBM model, and the efficiency values are recalculated and compared with the first stage. Due to the elimination of the influences of the external environment and random errors, the adjusted efficiency value is usually lower than that before the adjustment.

3.3. Dynamic Efficiency Change Analysis: Malmquist Productivity Index

While the three-stage DEA model provides a robust assessment of efficiency at specific points in time, it is inherently a static analysis. It reveals which provinces are efficient but does not explain how their productivity evolves over time [16]. To overcome this limitation and analyze the dynamic trajectory of carbon reduction efficiency, this study employs the Malmquist productivity index [33]. It is a powerful complementary tool that measures the change in total factor productivity (TFP) between two periods. Crucially, it allows for the decomposition of TFP change into two key components: technical efficiency change, which reflects a province’s catch-up effect toward the production frontier, and technological change, which represents the frontier-shift effect due to technological innovation across the industry [33]. By calculating this index based on the results from our SBM model, we gain deeper insights into whether productivity gains are driven by provinces improving their own practices or by the overall technological advancement of the sector. Therefore, this study employs the Malmquist index to analyze the dynamic changes in NEVs’ CO2 emission-reduction efficiency across 21 provinces in China. The calculation model, considering undesirable output, is:
M q s , q s + 1 , p s , p s + 1 , p u s , p u s + 1 = β s ( q s + 1 , p s + 1 , p u s + 1 ) β s ( q s , p s , p u s ) × β s + 1 ( q s + 1 , p s + 1 , p u s + 1 ) β s + 1 ( q s , p s , p u s ) 1 / 2
In Formula (5), S and S + 1 , respectively, represent the two consecutive periods; q s and q s + 1 represent the input of these two periods; p s and p s + 1 represent the output; p u s and p u s + 1 represent the undesirable output in period S period and period S + 1 ; β s ( q s , p s , p u s ) represents the overall level of efficiency in period S through the indicators of period S ; and β s + 1 ( q s , p s , p u s ) indicates that the efficiency level of the later period is judged by the index of the previous period.
The Malmquist index can be decomposed into the comprehensive technical efficiency change index ( E C ) and technical progress index ( T C ). E C can be decomposed into pure technical efficiency ( P E C ) and scale efficiency change ( S E C ) as shown by:
M = E C × T C = P E C × S E C × T C

3.4. Data, Variables, and Sources

3.4.1. Study Sample and Period

This study constructs a balanced panel dataset covering 21 provinces, autonomous regions, and municipalities in China for the period 2018–2023. From 2011 to 2017, China’s NEVs remained in the initial development stages, primarily driven by policy interventions. However, by 2018, the production and sales of NEVs in China exceeded 1\one million units, signaling a transition to market-driven development for its electric vehicles. In 2021, the production and sales of NEVs in China surpassed 3.5 million units, marking China’s entry into a stage of green development. The period from 2018 to 2023 includes two distinct stages in the development of NEVs in China. Analyzing data from this period provides insights into the effectiveness of NEVs in China at different stages of development. Due to the unavailability of statistical and yearbook data on NEVs for some specific provinces, this study is limited to 21 provinces.

3.4.2. Model Variables and Definitions

Following established production theory and the conventions of environmental efficiency assessment, we develop a framework including input, desirable output, and undesirable output variables. To control for external influences, environmental variables are incorporated in the second-stage SFA model. The definitions, units, and metrics for all variables appear in Table 1.
(1)
Input Variables:
Labor Input: number of employed persons in the automotive manufacturing industry at the provincial level.
Capital Input: fixed asset investment in the automotive manufacturing industry at the provincial level.
Energy Input: total energy consumption by the automotive manufacturing industry at the provincial level.
A critical data limitation is the lack of publicly available, disaggregated statistics specifically for the NEV sub-sector (e.g., NEV-only labor, capital, energy) at the provincial level in official Chinese statistical publications. Consequently, this study utilizes data for the broader automotive manufacturing industry as the best available proxy for these three input variables. This approach is justified on the grounds that during the study period, NEV production became a progressively significant and strategic component of the overall automotive industry in the sampled provinces. We acknowledge this as a limitation, as it may introduce measurement errors, particularly in provinces where the NEV share of the automotive industry is still nascent. This limitation is further addressed in the discussion section.
(2)
Output Variables:
Desirable Output (NEV Production): measured as the annual production volume of NEVs at the provincial level. The data directly reflect the primary output of the industry under investigation.
Undesirable Output (CO2 Emissions): calculated by indirect CO2 emissions resulting from the operational phase of NEVs. The calculation methodology, which considers provincial electricity consumption and the specific carbon intensity of the regional power grid, is detailed in Section 3.1. This variable represents the primary environmental pressure this study aims to evaluate.
(3)
Environmental Variables for SFA Analysis:
To isolate true managerial efficiency by controlling for external contextual factors, the second-stage SFA model incorporates three environmental variables. The selection of environmental variables is based on there being external factors that DMUs (provinces) cannot directly control in the short term, yet they significantly influence the operating environment and consequently the observed efficiency [16]:
Urbanization Level: proportion of the urban population to the total year-end population. It reflects the degree of urban development. Urbanization impacts energy consumption and economic activity, which, in turn, influence carbon emissions and industrial development [44]. High urbanization can lead to increased traffic and energy demand but may also foster infrastructure development that supports NEVs, creating a complex, non-linear effect on overall efficiency [45].
Consumption Level: per capita disposable income of urban households. This reflects the local population’s purchasing power and potential demand for NEVs, influencing production scale and resource allocation. Consumer behavior and purchasing power directly impact the adoption rate of NEVs and overall economic activity, which then affect industrial inputs and outputs. High consumption can stimulate production but may also increase the carbon footprint, as consumption activities are major drivers of economy-wide emissions [46].
Technology Level: number of invention patents granted in each province. It serves as a proxy for regional innovation capacity and technological environment. Technological innovation is a key driver for improving efficiency and reducing emissions in industrial sectors [47]. A higher technological level, measured by the number of patents, implies better production processes, more efficient resource utilization, and cleaner technologies in the NEV industry. The use of patent statistics as a robust indicator for technological innovation is a well-established practice in economic research [48].
By eliminating the influence of these external factors, this study aims to reveal the true managerial efficiency [16].

3.4.3. Data Sources and Processing

The primary data for this study are from various authoritative sources. Data on labor, capital, energy, urbanization, consumption levels, NEV production, and technological levels for the period 2018–2023 were compiled from the relevant annual editions of the China Energy Statistical Yearbook [49,50,51,52,53,54], China Statistical Yearbook [55,56,57,58,59,60], and Statistical Bulletin on the National Economic and Social Development of Chinese Cities [61,62,63,64,65,66]. Information necessary to calculate the carbon intensity of electricity, such as coal consumption for power generation, is sourced with a temporal distinction. Data for the period 2018–2021 are from the China Electric Power Yearbook [67,68,69,70]. As this yearbook ceased publication after 2022, data for 2022–2023 were sourced from the China Electric Power Statistics Yearbook [71,72] to ensure the integrity and consistency of the data series. Additionally, estimates of CO2 emissions from NEV operations are derived using regional annual mileage data from Ou et al. [73], as shown in Table 2. The average annual mileage of new energy passenger vehicles is highest in South China’s central region at 13,124.91 km, while North China has the lowest at 12,090.07 km. Despite this, the maximum difference between regions is approximately 1000 km, indicating that regional factors are not the sole determinants of NEV mileage. For the few missing datapoints in the dataset, linear interpolation is used to maintain data integrity. This method is practical, avoids unnecessary complexity, and preserves any underlying trends in the panel data.

3.4.4. Descriptive Statistics

Table 3 presents descriptive statistics for the data in the evaluation index. This study computes the maximum, minimum, average, and standard deviation for each index across the 21 provinces from 2018 to 2023. The extreme values for each index originate from different provinces. Guangdong has the largest supply of automobile manufacturing labor resources. Jiangsu recorded the highest capital investment in NEVs in 2022, while Shandong ranked first in industrial energy consumption in 2018. The production of NEVs in Guangdong hit 2.5318 million units in 2023. In 2018, Tianjin produced only 1500 NEVs. These results were calculated according to the standard deviation, regional differences appear in labor forces, NEV production, CO2 emissions from NEVs, and number of effective invention patents across provinces.

4. Empirical Results and Analysis

4.1. Phase I: Analysis of Super-SBM Model

By incorporating non-radial analysis with undesirable output, we calculate the carbon-reduction efficiency of NEVs in 21 provinces and cities in China from 2018 to 2023 using MaxDEA Ultra 8. Table 4 presents the results of Phase I. These results do not account for the influence of environmental variables and random errors.
According to the data in Table 4, the average efficiency value in China from 2018 to 2023 is 0.381, indicating that the overall carbon-reduction effect of domestic NEVs is suboptimal and has significant potential for improvement. The significant efficiency disparities between provinces partly reflect the imbalance in NEV development across China. Upon comparison of efficiency values across provinces, we see that Shanghai and Shaanxi have surpassed the average carbon-reduction efficiency of NEVs, achieving efficient levels, primarily due to their advanced vehicle manufacturing capabilities and strong brand presence. The data show that Shanghai has consistently maintained an exceptional efficiency value greater than 1 since 2018. From a socio-economic perspective, Tesla’s establishment of a super-factory in Shanghai in 2018 accelerated the localization process. With the completion of this factory, Shanghai’s NEVI hit a pivotal milestone in its development. Shaanxi led in average efficiency from 2018 to 2023. Under the guidance of leading global electric vehicle manufacturers, Shaanxi, as the primary production base for BYD, produced 1,015,200 NEVs in 2022, with BYD contributing 98.01%.
The efficiency values of 14 provinces and cities fall below the average level, with Tianjin showing the lowest at an average efficiency value of less than 0.1. The provinces with the lowest average efficiency are Tianjin, Sichuan, and Hebei. Compared to other provinces, these ones face input–output imbalances due to factors such as weak industrial foundations, geographical location, and a shortage of technical talent. For example, Tianjin’s new energy projects, such as Guoneng Automobile and Bojun Automobile, introduced between 2018 and 2020, have failed, while Sichuan faces significant shortcomings in its industrial supply chain and lacks advantages in core components. Therefore, these provinces and cities must increase their focus on the production and promotion of NEVs.
From a policy deployment perspective, in 2018, most provinces were in the early stages of NEV development, while several provinces with a broad government vision, a strong foundation in the automotive industry, and substantial support for NEVs were in a favorable position. For instance, the People’s Government of Shaanxi Province proposed the establishment of a major NEVI base as early as 2016. In 2017, the Anhui Provincial Government vigorously subsidized NEV enterprises, expanded charging infrastructure, and set NEV promotion goals for cities. However, with the introduction of the Development Plan for China’s NEV Industry (2021–2035) at the end of 2020, each province began focusing on NEV development, and other provinces with established industrial chains also began to rise.
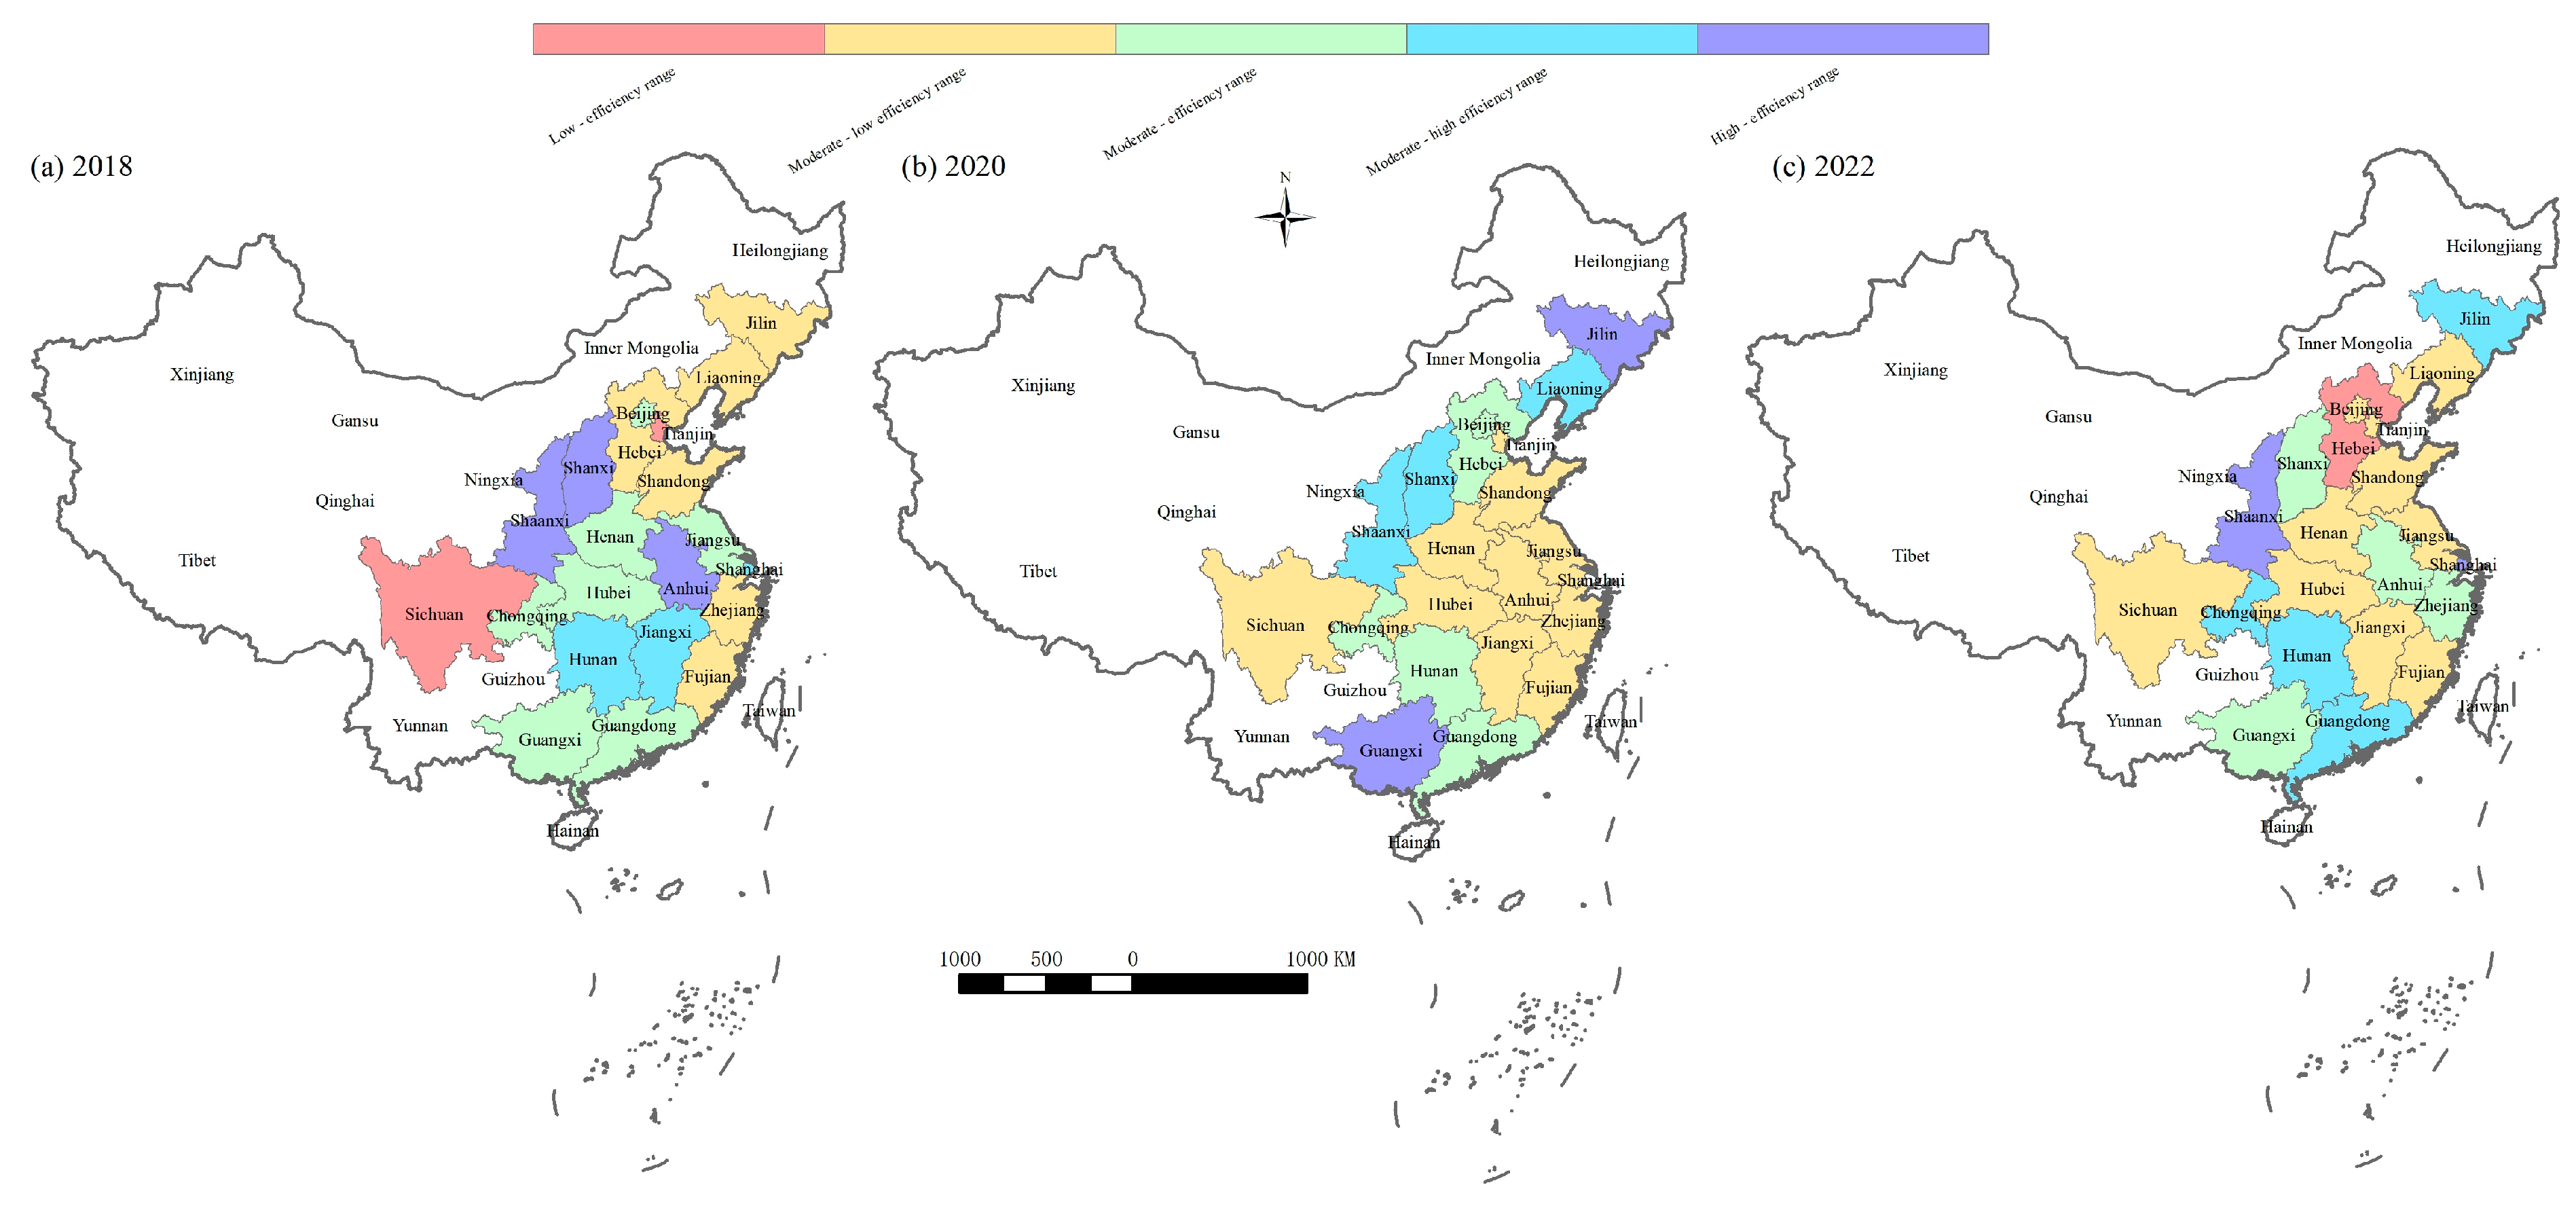
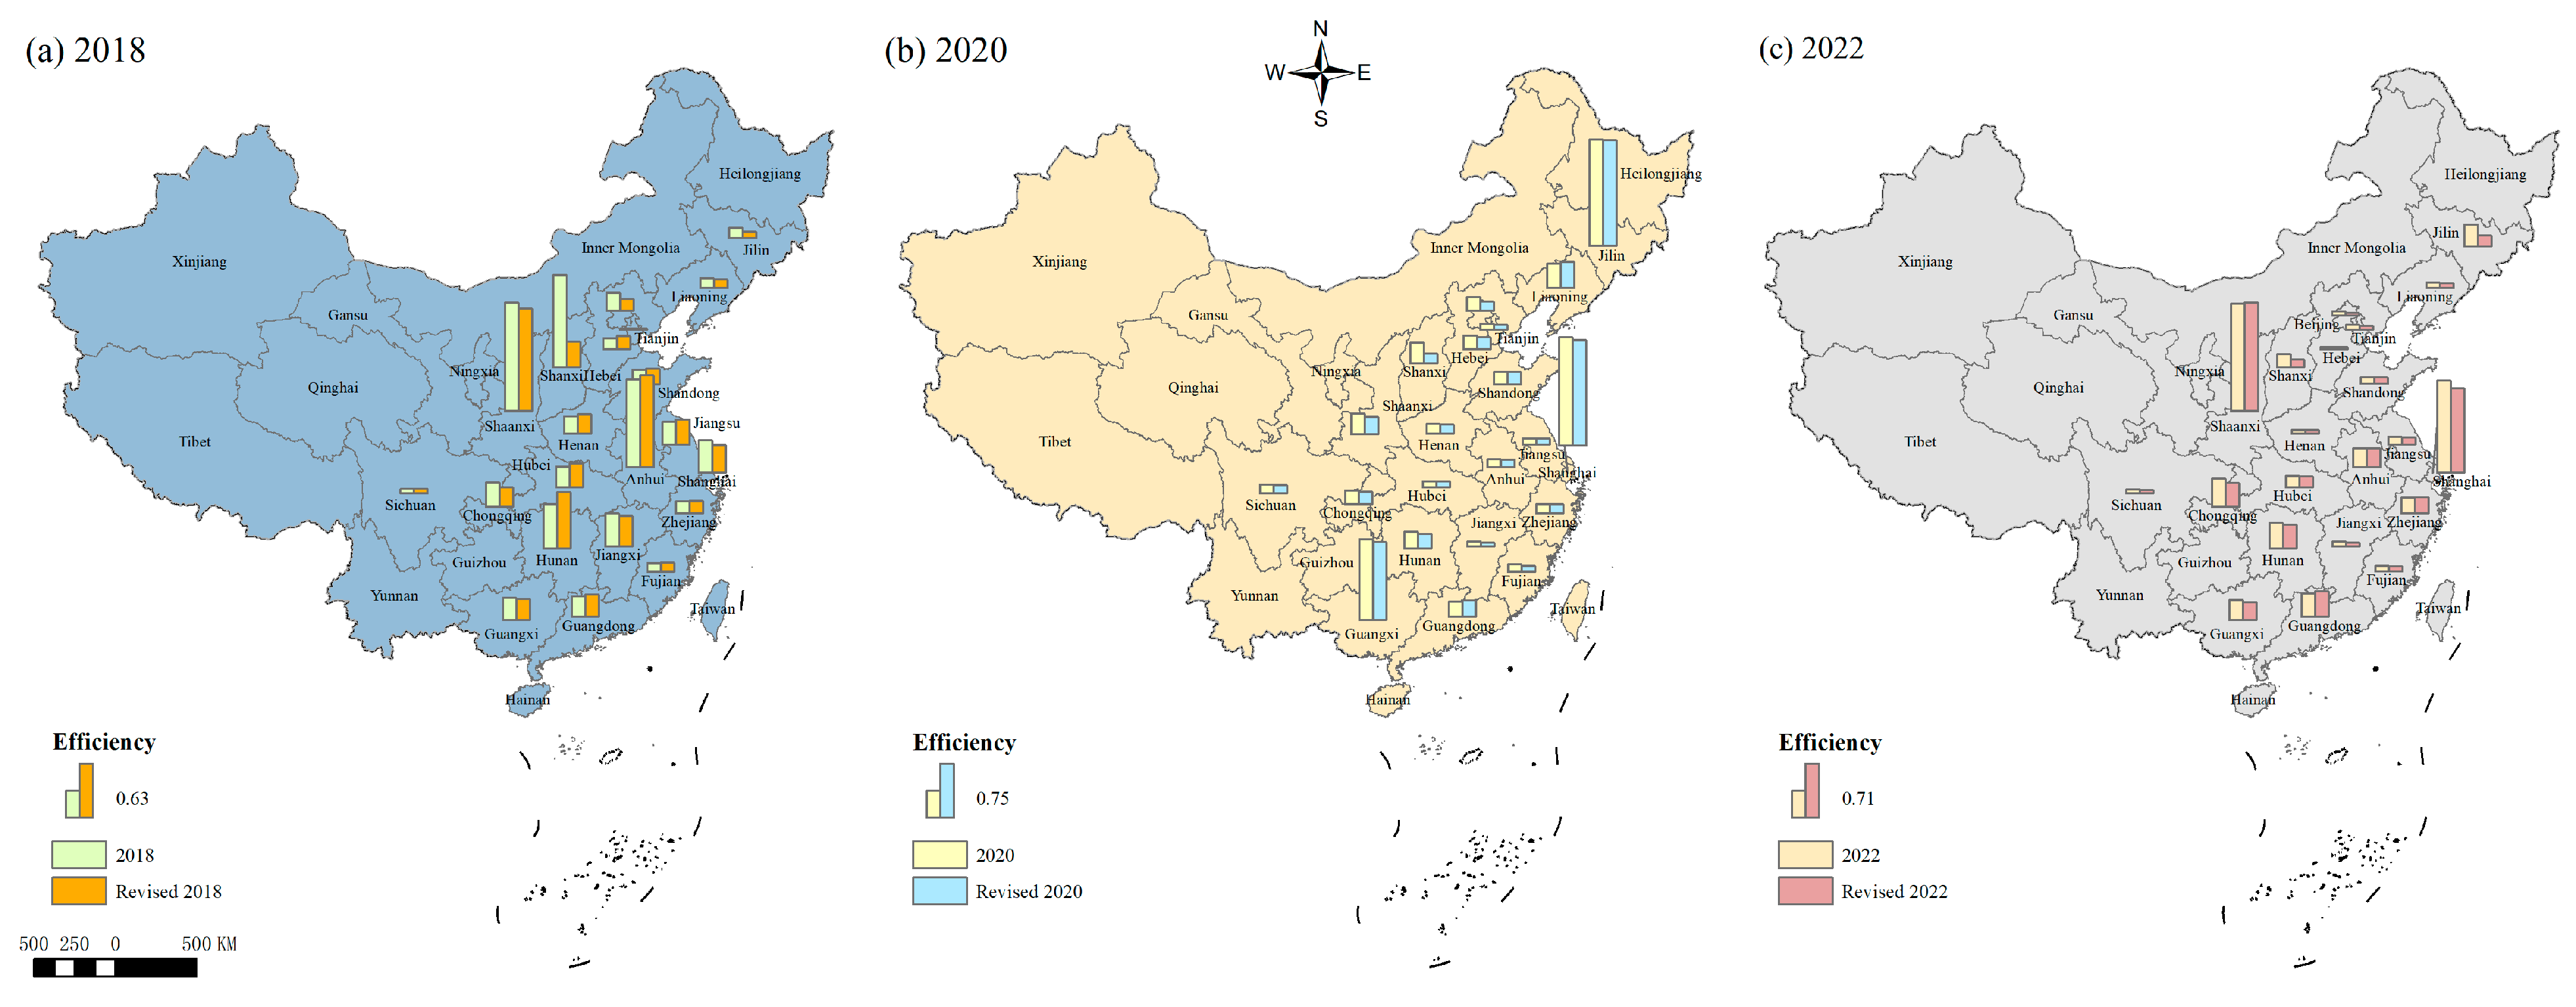
From a time-based perspective, the average efficiency value from 2018 to 2023 exhibits a fluctuating trend, peaking at 0.553 in 2019. The average efficiency values for each year exhibit slight fluctuations. Indeed, some provinces and cities, such as Shanxi, Jilin, and Guangxi, experience sharp fluctuations in the carbon-reduction efficiency of NEVs within 5 years, yet the rankings of these provinces have not changed significantly. Only Jilin saw a significant increase from 2018 to 2019, suggesting that the overall efficiency fluctuation is largely influenced by these provinces. Figure 2 illustrates the spatial distribution of first-stage efficiency values across provinces in 2018, 2020, and 2022. The figure visualizes regional disparities, highlighting areas of concentration of efficient and inefficient provinces.
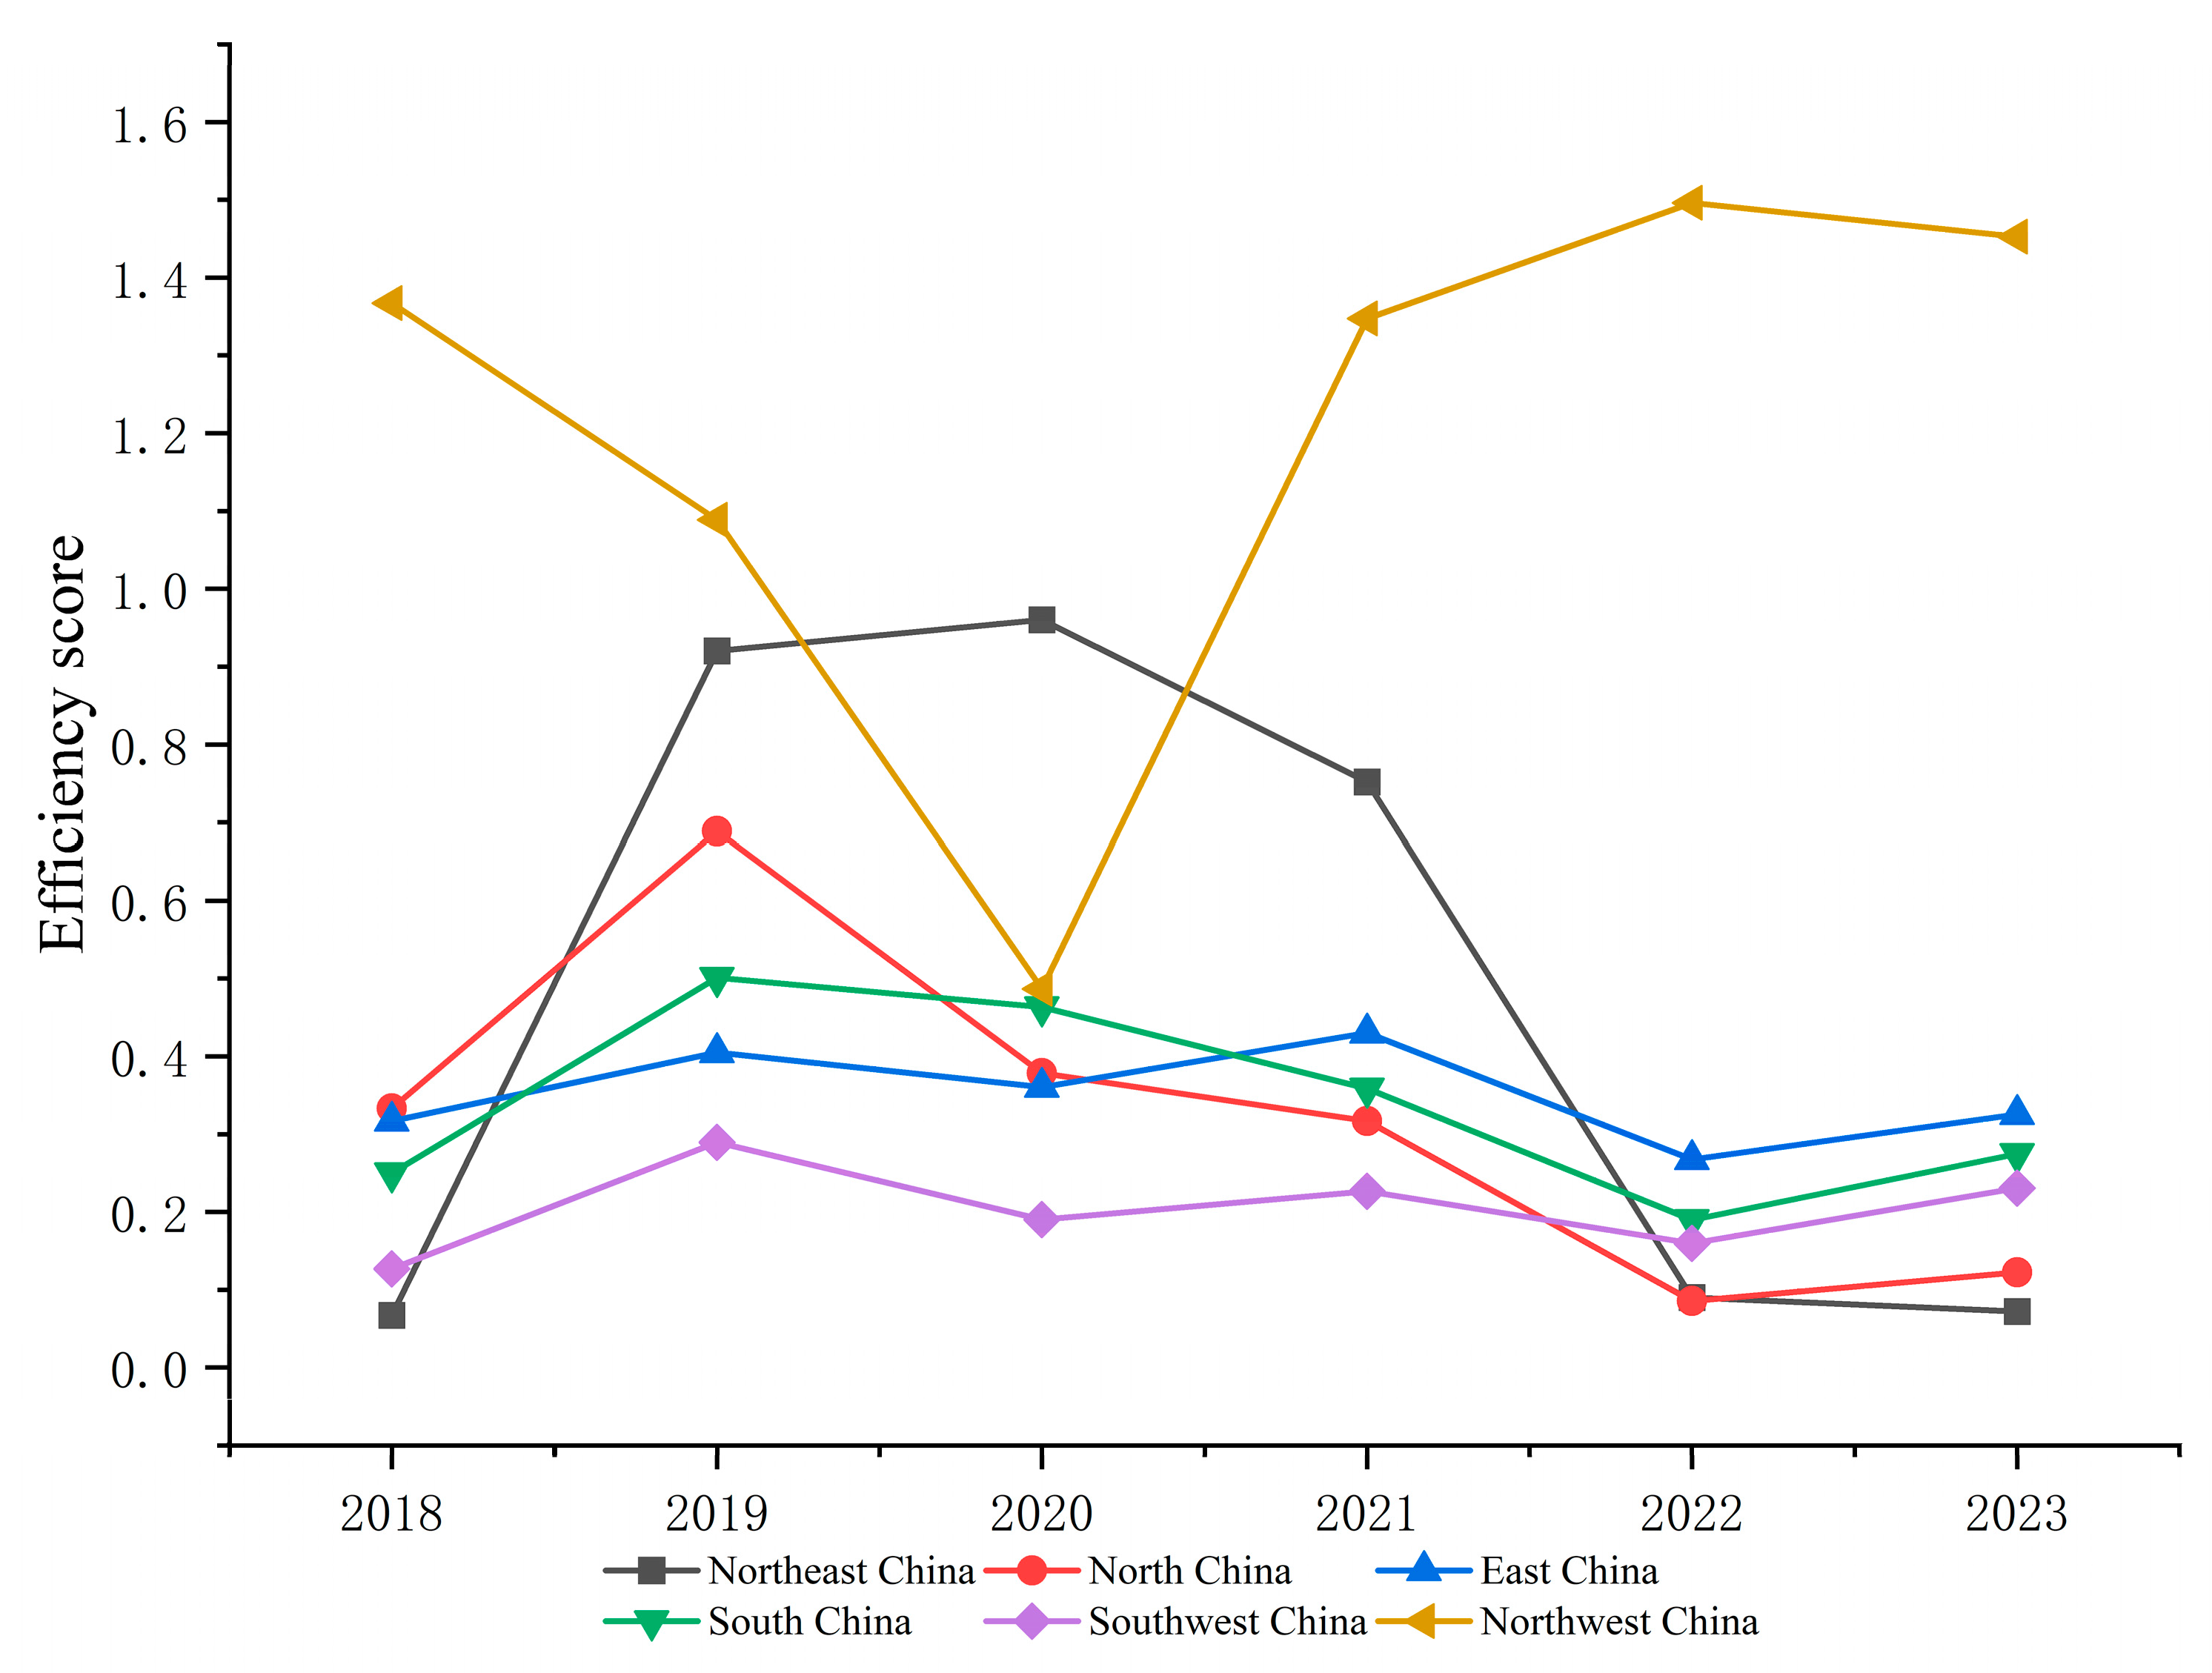
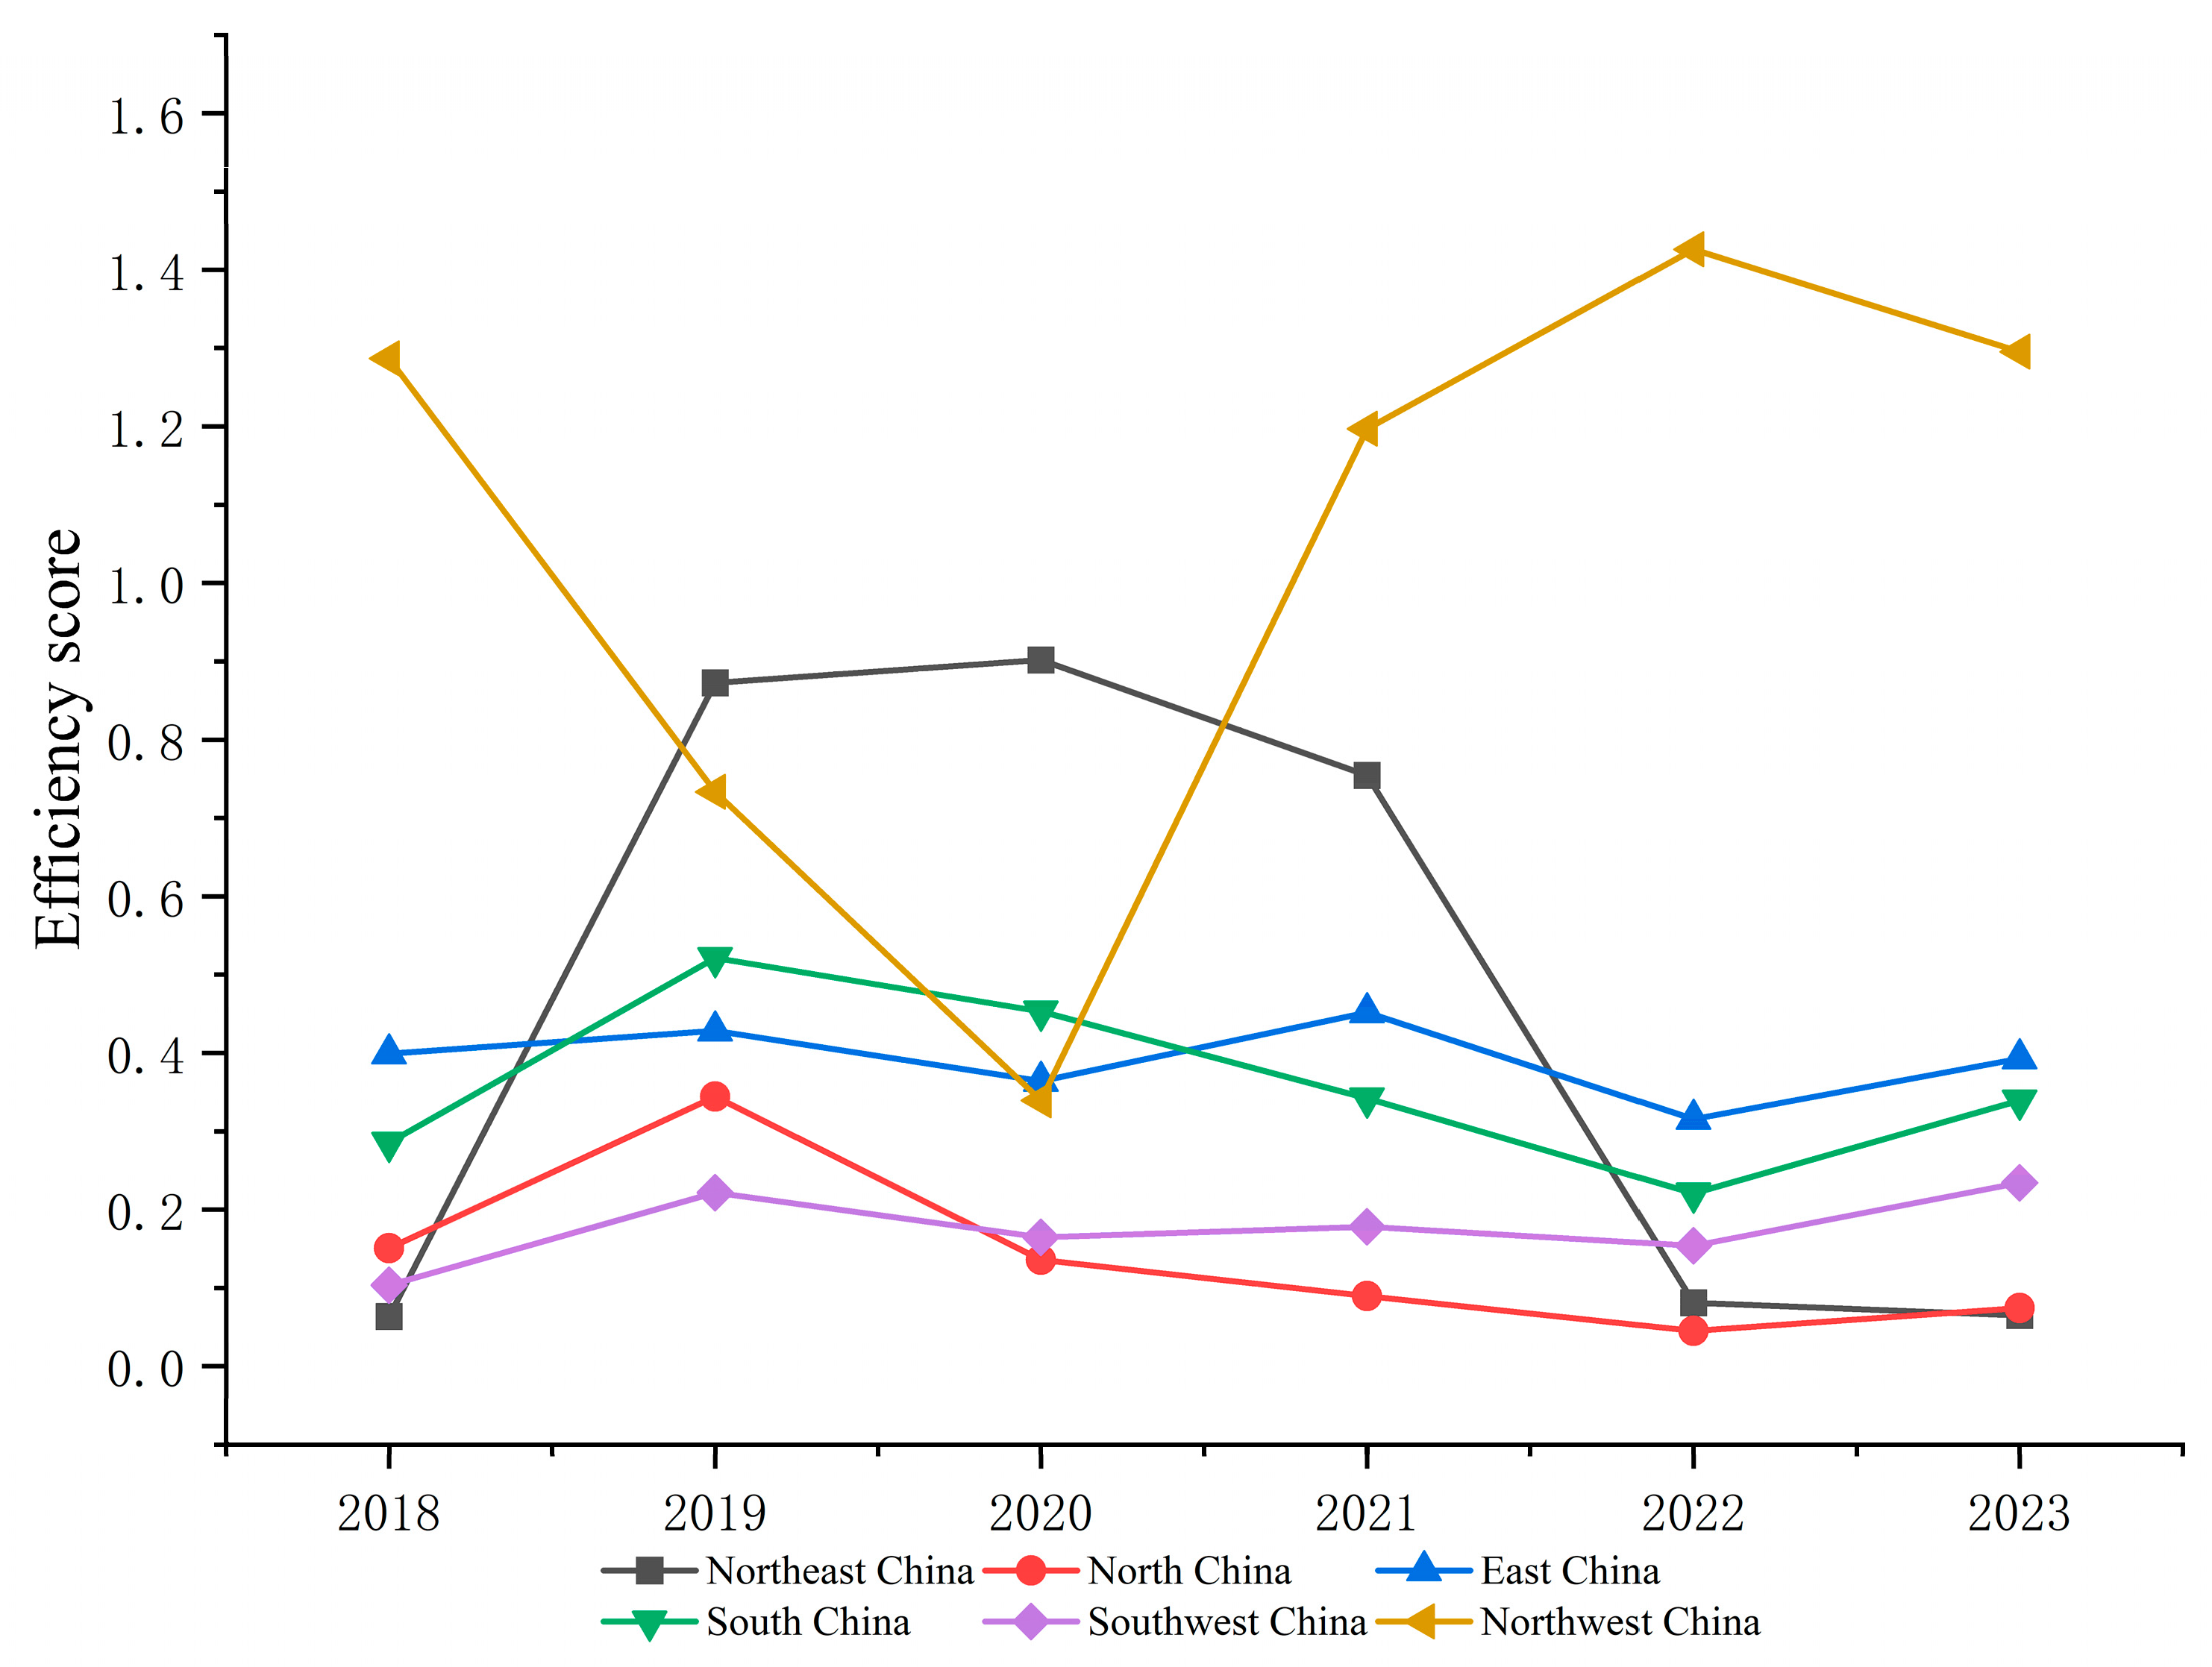
Figure 3 presents a line graph based on the average efficiency values of each region. Overall, the carbon-reduction efficiency of NEVs across the six regions does not exhibit a significant one-way growth or decline over time but rather demonstrates a fluctuating trend. A deeper analysis reveals these fluctuations reflect distinct regional development models and underlying structural challenges. For instance, the northwest region exhibits the most dramatic volatility. It began the study period with a high efficiency score of 1.367 in 2018, which then declined to 1.088 in 2019 and fell further to a low of 0.487 in 2020. It subsequently rebounded strongly, peaking at 1.496 in 2022 before settling at a high of 1.453 in 2023. This instability, largely driven by the production cycles of single powerhouse firms like BYD in Shaanxi [74]. This highlights a key regional disadvantage: while such firms can create high efficiency peaks, this over-reliance makes the region’s performance unstable and vulnerable to specific corporate strategies. In contrast, the East China region, despite its high NEV output, shows relatively stable but suboptimal efficiency, with values hovering between 0.267 (2022) and 0.430 (2021). This stability at a low level points to a systemic inefficiency; disproportionately large inputs of capital and energy depress its overall performance, indicating a pressing need to shift from a resource-intensive to a quality-focused development model. Meanwhile, except for the northwest and northeast regions, the efficiency values of the other four regions exhibit similar fluctuations, each phase having distinct underlying causes and implications: an upward trend from 2018 to 2019, reflecting the market’s rapid expansionary phase before the pandemic; a sharp drop in efficiency from 2019 to 2020, a direct consequence of the COVID-19 pandemic disrupting supply chains and production; a strong rebound from 2020 to 2021(excluding the central region of South China), spurred by economic recovery and the strategic guidance of national policies like the Development Plan for China’s NEV Industry (2021–2035) [75]; followed by a period of decline and rebound from 2021 to 2023, suggesting a phase of market adjustment and intensified regional competition. In summary, the regional efficiency trends are not merely numerical shifts; they are reflections of deep-seated structural realities. They highlight a significant regional imbalance, where some areas benefit from powerhouse firms while others struggle with foundational weaknesses or inefficient resource allocation. Discussing these dynamics provides the more meaningful insight that is crucial for developing targeted and effective policies.

4.2. Phase II: SFA Analysis

Three environmental variables, urbanization level, household consumption level, and technical level, are introduced as independent variables. The slack variables for each input, obtained from the super-SBM model in Phase I, are subsequently used as dependent variables to construct the SFA regression model. Frontier 4.1 is employed to analyze the redundancy of each input, and the parameters and t-test values of the variables are calculated.
The SFA results in Table 5 show that both σ2 and γ pass the 1% significance test, indicating that the environmental variables exert a significant influence on the efficiency values. Accordingly, the SFA model is deemed effective, and the environmental variables must be removed to obtain more accurate efficiency estimates. A detailed interpretation of the SFA results is provided below.
(1)
Urbanization level
The regression results indicate a significantly negative association between the level of urbanization and both labor slack and capital slack, whereas urbanization is positively associated with energy slack. Accordingly, it is inferred that accelerated urbanization reduces the required inputs of labor and capital. However, the concomitant growth in urban population elevates regional energy demand [76], thereby diminishing the carbon emission efficiency of NEVs. Zheng [13] demonstrated that urbanization exerts a significantly adverse effect on CO2 emissions, and Li et al. [77] likewise contended that the advancement of urbanization increases the carbon footprint. In general, energy consumption positively correlates with CO2 emissions. Consequently, accelerated urbanization is expected to raise CO2 output, yet it exerts a positive influence on NEV production.
(2)
Consumption level of residents
The three environmental variables positively correlate with household consumption levels. An increase in household consumption spurs greater resource wastage. Rising household consumption stimulates economic growth, and economic growth correlates positively with carbon emissions. This finding is consistent with that of Liu et al. [7], who reported that a 1% increase in household consumption is associated with a 0.31–0.46% rise in CO2 emissions. Although higher income and consumption capacity can encourage the adoption of energy-efficient lifestyles, they simultaneously intensify the pressure to reduce CO2 emissions. Overall, increasing household consumption capacity hinders improvements in the carbon-reduction efficiency of NEVs.
(3)
Technical level
An increase in patent counts exerts a negative effect on all three input variables. Yang et al. [78] demonstrated that research and development activities drive carbon emission reductions in the industrial sector, and technological innovation likewise assists NEV firms in mitigating emissions. Advances in information and communication technology have reduced private-car mileage and consequently emissions [79]. These findings are consistent with the prevailing scholarly consensus. Accordingly, a larger patent stock reflects scientific and technological progress. Higher technological capability, in turn, promotes more efficient resource utilization and positively influences the carbon-reduction efficiency of NEVs.
Taken together, pronounced inter-provincial differences in environmental factors may cause first-stage efficiency estimates to deviate from actual performance. Therefore, removing the influence of environmental variables is a prerequisite for an accurate subsequent efficiency analysis.

4.3. Phase III: Analysis of the Adjusted Empirical Results

4.3.1. Comparative Analysis Before and After Adjustment

In accordance with Equation (5), this study adjusts the three input indicators and reports the results in Table 6. After removing environmental influences and stochastic error, the adjusted mean efficiency is 0.353–7.35% lower than in the first stage. This indicates that environmental variables hinder a precise comparison of NEV carbon-reduction efficiency across provinces and cities. Consequently, China’s NEV carbon-reduction efficiency is overestimated, yet the fundamental efficiency pattern remains unchanged, as summarized as follows. (a) Overall efficiency declines, but the identity of the high-efficiency provinces is unchanged. The efficiency scores of 71.43% of provinces change negligibly. (b) Efficiency values exhibit an identical temporal trend.
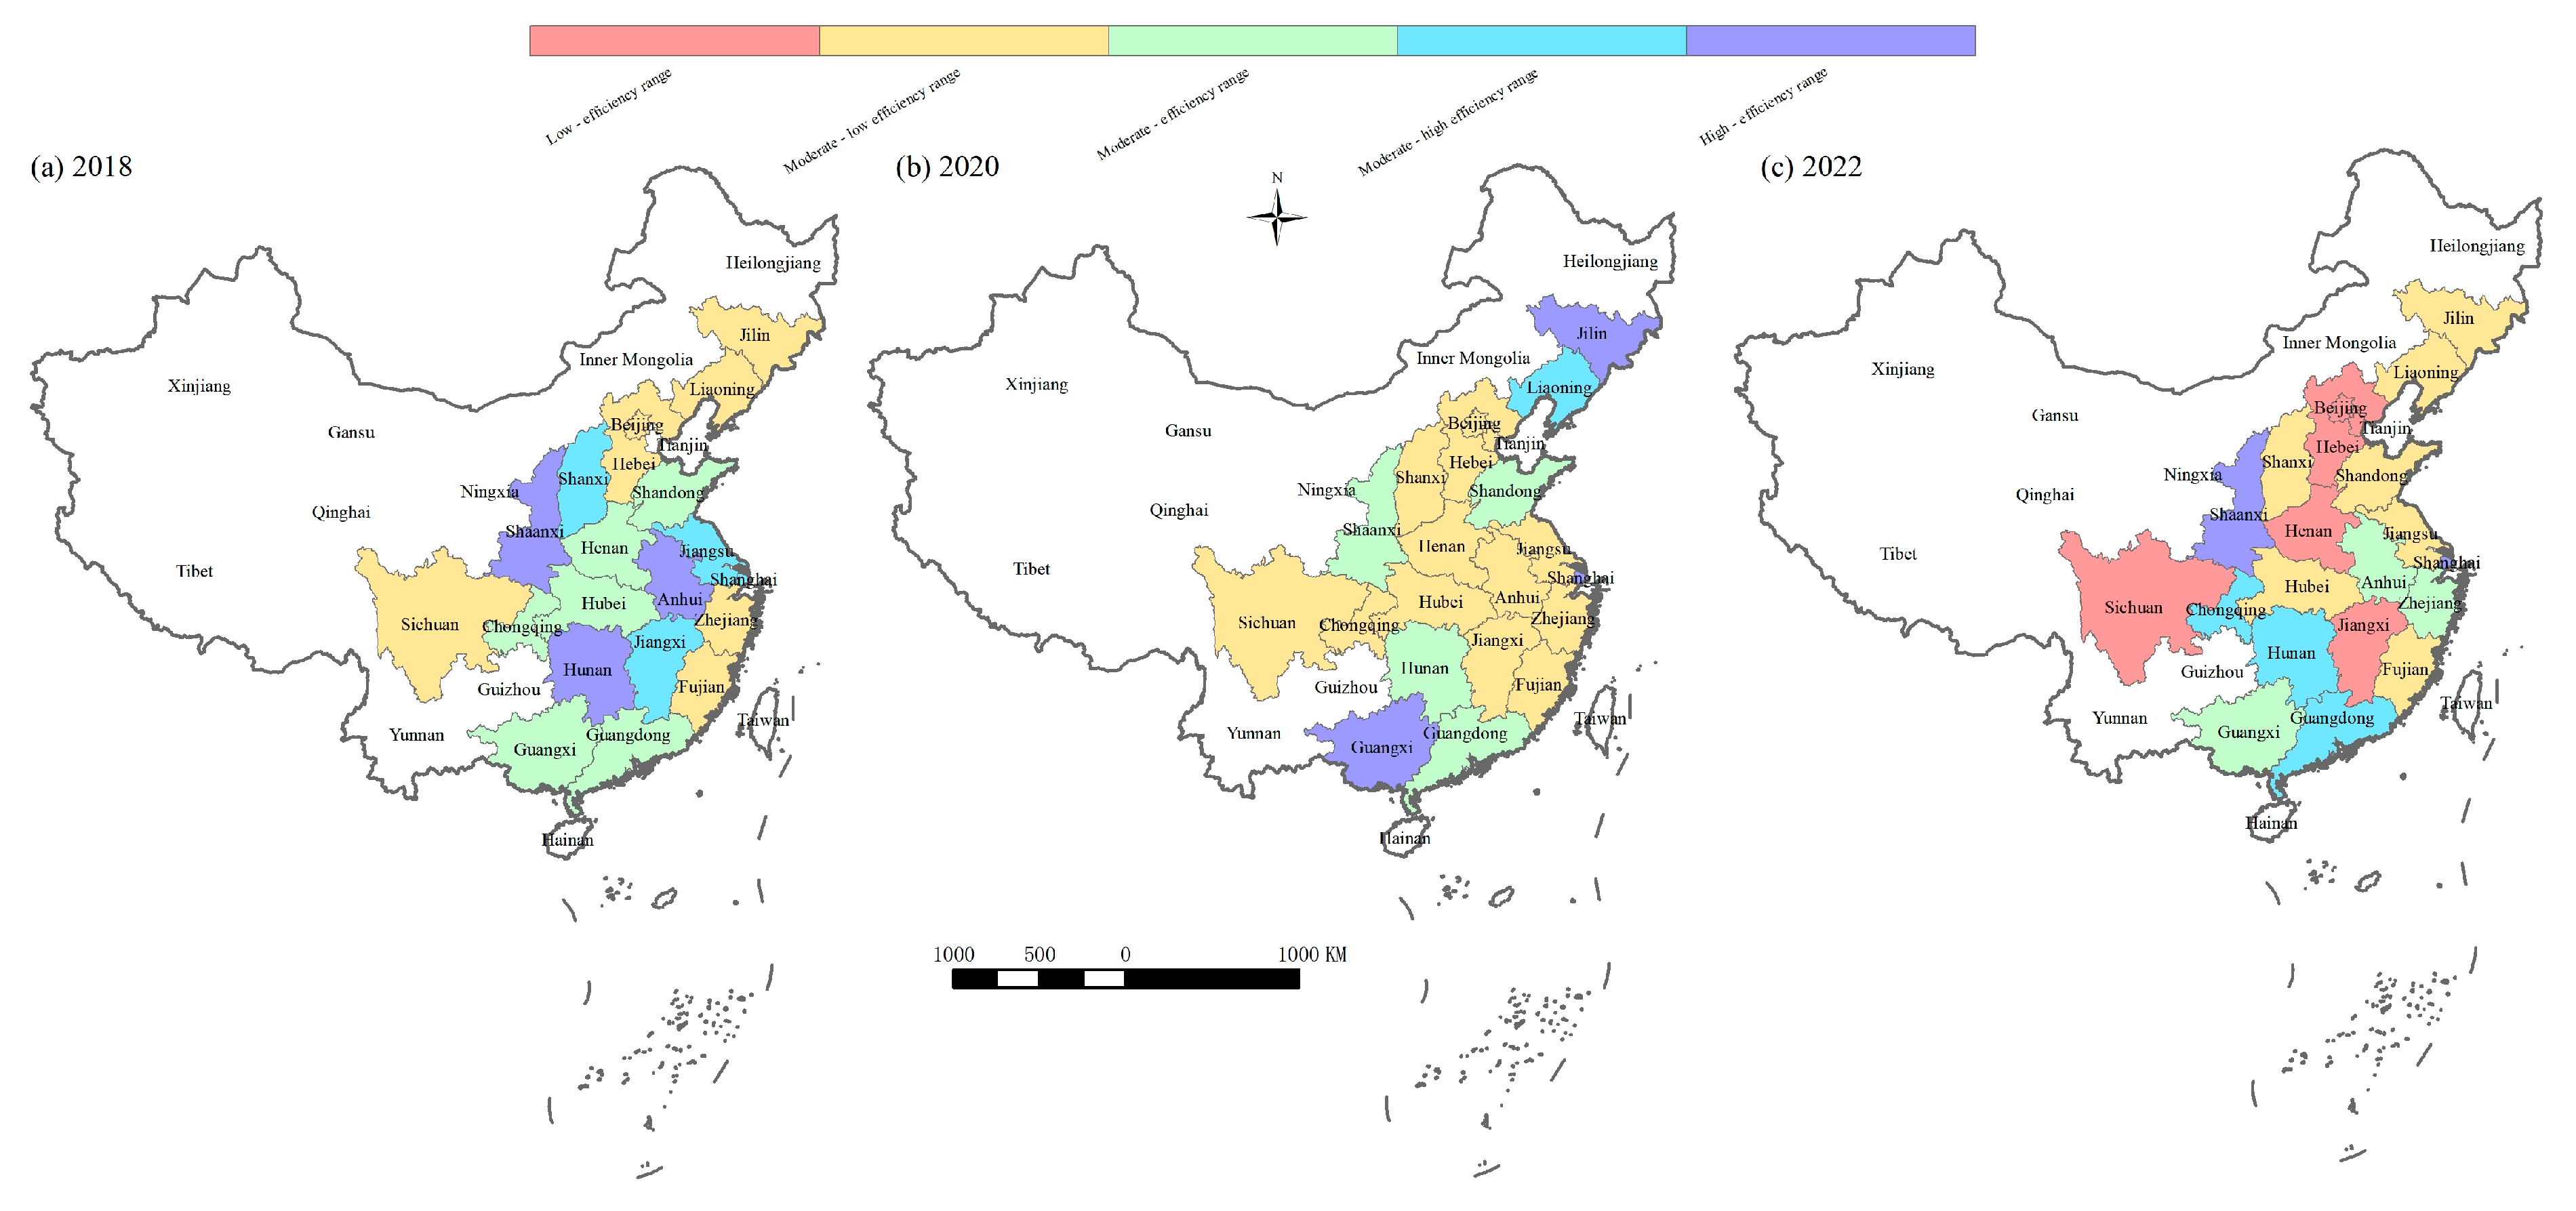
Figure 4 illustrates the spatial distribution of NEV carbon-reduction efficiencies across the provinces in 2018, 2020, and 2022 after adjustment for environmental and stochastic factors. The figure provides a clearer depiction of the efficiency landscape, highlighting provinces that genuinely exhibit high or low performance.
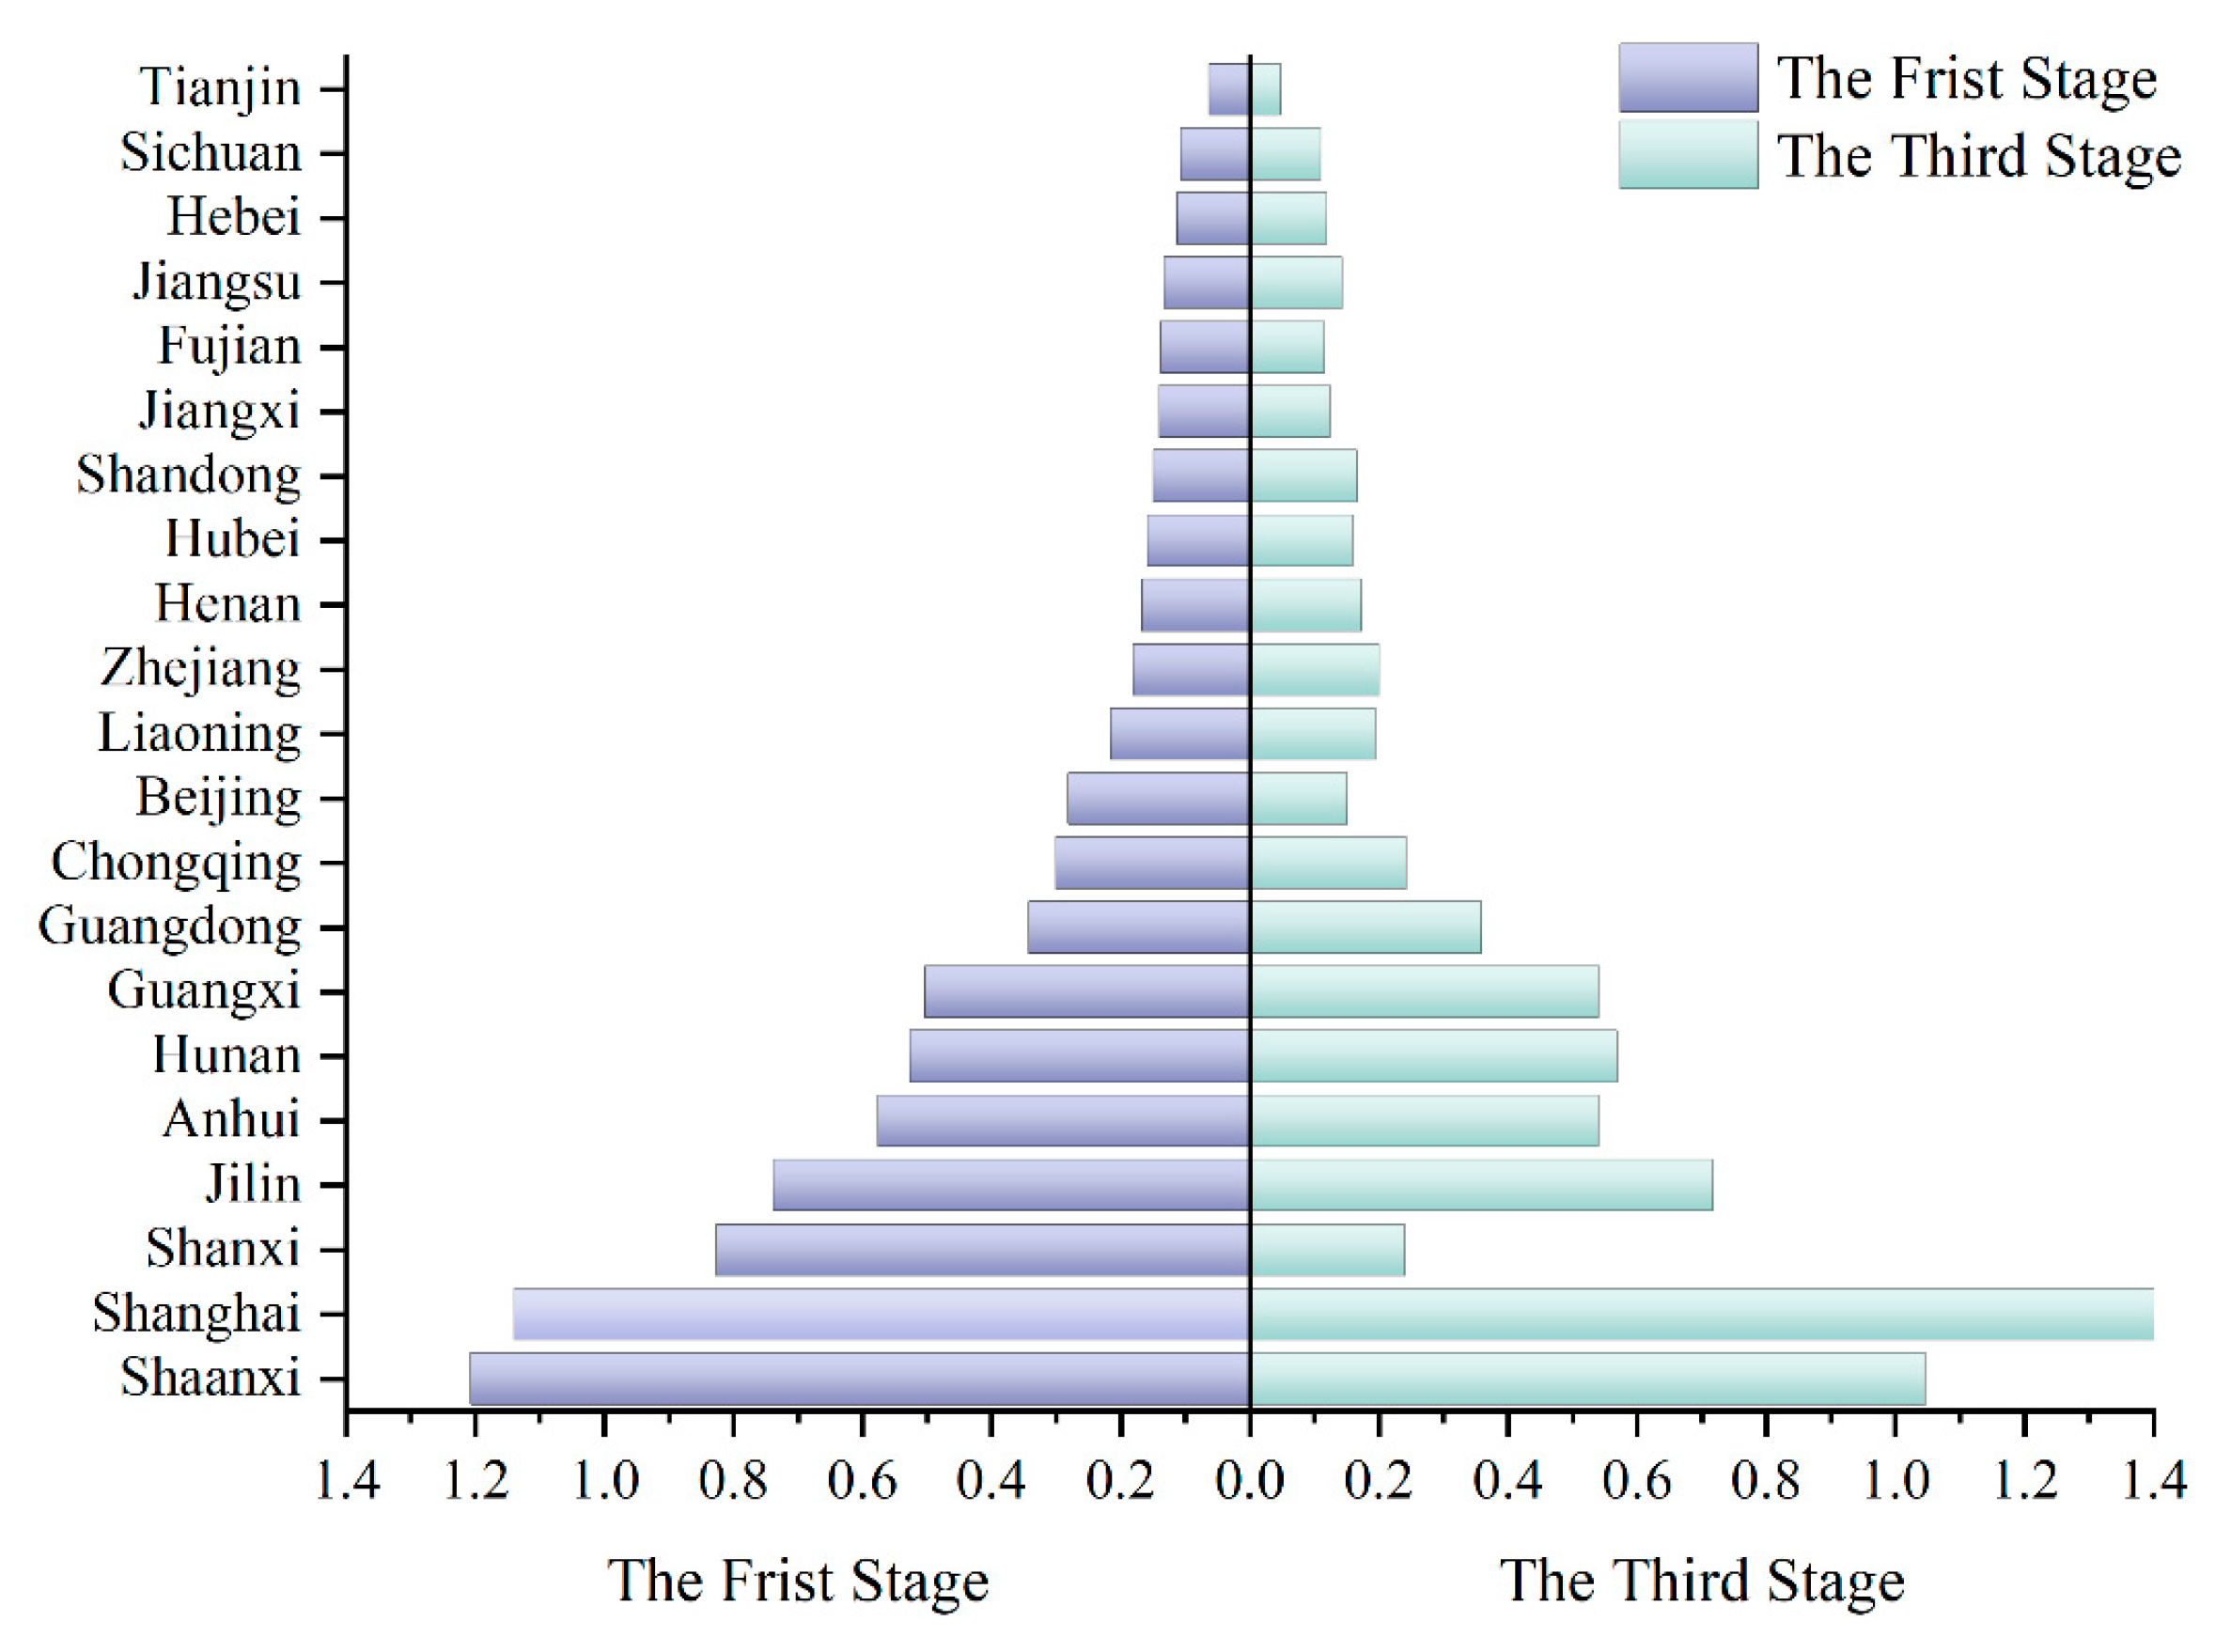
From a provincial perspective, Figure 5 shows that the average efficiency values of Shanxi, Beijing, Tianjin, and Chongqing declined by 70.94%, 46.05%, 23.06%, and 19.36%, respectively. Shanxi’s efficiency score fell from 0.826 in the first stage to 0.240 after adjustment, representing the largest decrease. However, Shanxi does not benefit from favorable environmental conditions, and it ranks low in both per-capita household consumption expenditure and number of invention patents. This outcome may indicate that Shanxi is strongly influenced by stochastic factors.
To visualize provincial efficiency differences before and after adjustment, Figure 6 is presented. The figure depicts efficiency changes across provinces, highlighting those most affected by the removal of environmental and stochastic influences. These visual findings further underscore the value of the three-stage DEA approach for producing more accurate efficiency assessments.
Figure 7 shows that after the adjustment, efficiency values in all six regions decline relative to their pre-adjustment levels, yet their temporal trajectories remain broadly consistent. This consistency is a critical finding in itself, as it implies that the observed regional disparities are not merely artifacts of external conditions but reflect genuine, persistent differences in operational and managerial capabilities. While its Stage 1 score showed a dramatic peak of 0.960 in 2020, this surge is significantly moderated to 0.902 in the adjusted results. This reveals that the initial high score was likely inflated by favorable environmental factors or statistical noise rather than true efficiency. The policy implication is crucial: relying on unadjusted data could lead to a misinterpretation of the region’s success, whereas the adjusted scores provide a more sober basis for future planning. Furthermore, deep-seated issues in other regions become clearer after the adjustment. For example, the efficiency score for East China fluctuates between 0.316 (2022) and 0.452 (2021), consistently failing to reach the efficiency frontier. This confirms that the powerhouse region’s suboptimal performance stems from systemic inefficiencies, such as excessive input redundancy of capital and energy relative to its output. Meanwhile, the adjusted efficiency score for the northwest region remains high (e.g.,1.426 in 2022 and 1.295 in 2023), but its significant volatility from 2019 (0.733) to 2022 (1.426) persists. This demonstrates that even after controlling for macroeconomic environmental factors, its inherent instability, driven by a reliance on a single dominant firm, remains a prominent issue. In essence, the Stage 3 analysis provides more than just a “smoothed” efficiency series; it offers a clearer, more reliable foundation for diagnosing these deep-seated regional issues and formulating targeted development strategies.

4.3.2. Analysis of Carbon Reduction Efficiency of NEVs

China’s NEV carbon-reduction efficiency fluctuates markedly, as the overall score is 0.353, which indicates substantial room for improvement. Statistics indicate a mismatch between NEV production and consumption capacities in many provinces. For instance, Shaanxi records high NEV output but low ownership, which partly explains the elevated efficiency scores observed in certain provinces. Conversely, Beijing and Liaoning exhibit low output yet high consumption, resulting in low efficiency scores.
By regional evaluation, the carbon-reduction performance of heavily motorized provinces in East China, such as Zhejiang, Jiangsu, and Shandong, is sub-optimal. One plausible explanation is that these provinces devote disproportionately higher inputs of labor, energy, and capital than others. Although output is high, resource-use efficiency remains low, leading to substantial wastage. Model-derived slack variables suggest that better management could markedly reduce resource inputs in these provinces.
NEV carbon-reduction efficiency in Shaanxi fluctuated most sharply between 2019 and 2021. Within this period, NEV output fell by 36.33% in 2020 owing to the COVID-19 pandemic, yet in 2021, output rose to third nationally, driven by leading firms such as BYD, and reached 1.02 million units in 2022, ranking second. Between 2020 and 2022, Shanghai maintained a leading efficiency score but still shows potential for further improvement. By contrast, efficiency scores in Tianjin and Sichuan remain markedly low, and local governments therefore need to strengthen investment in NEVs to address inadequate production capacity.

4.4. Dynamic Analysis Using the Malmquist Index

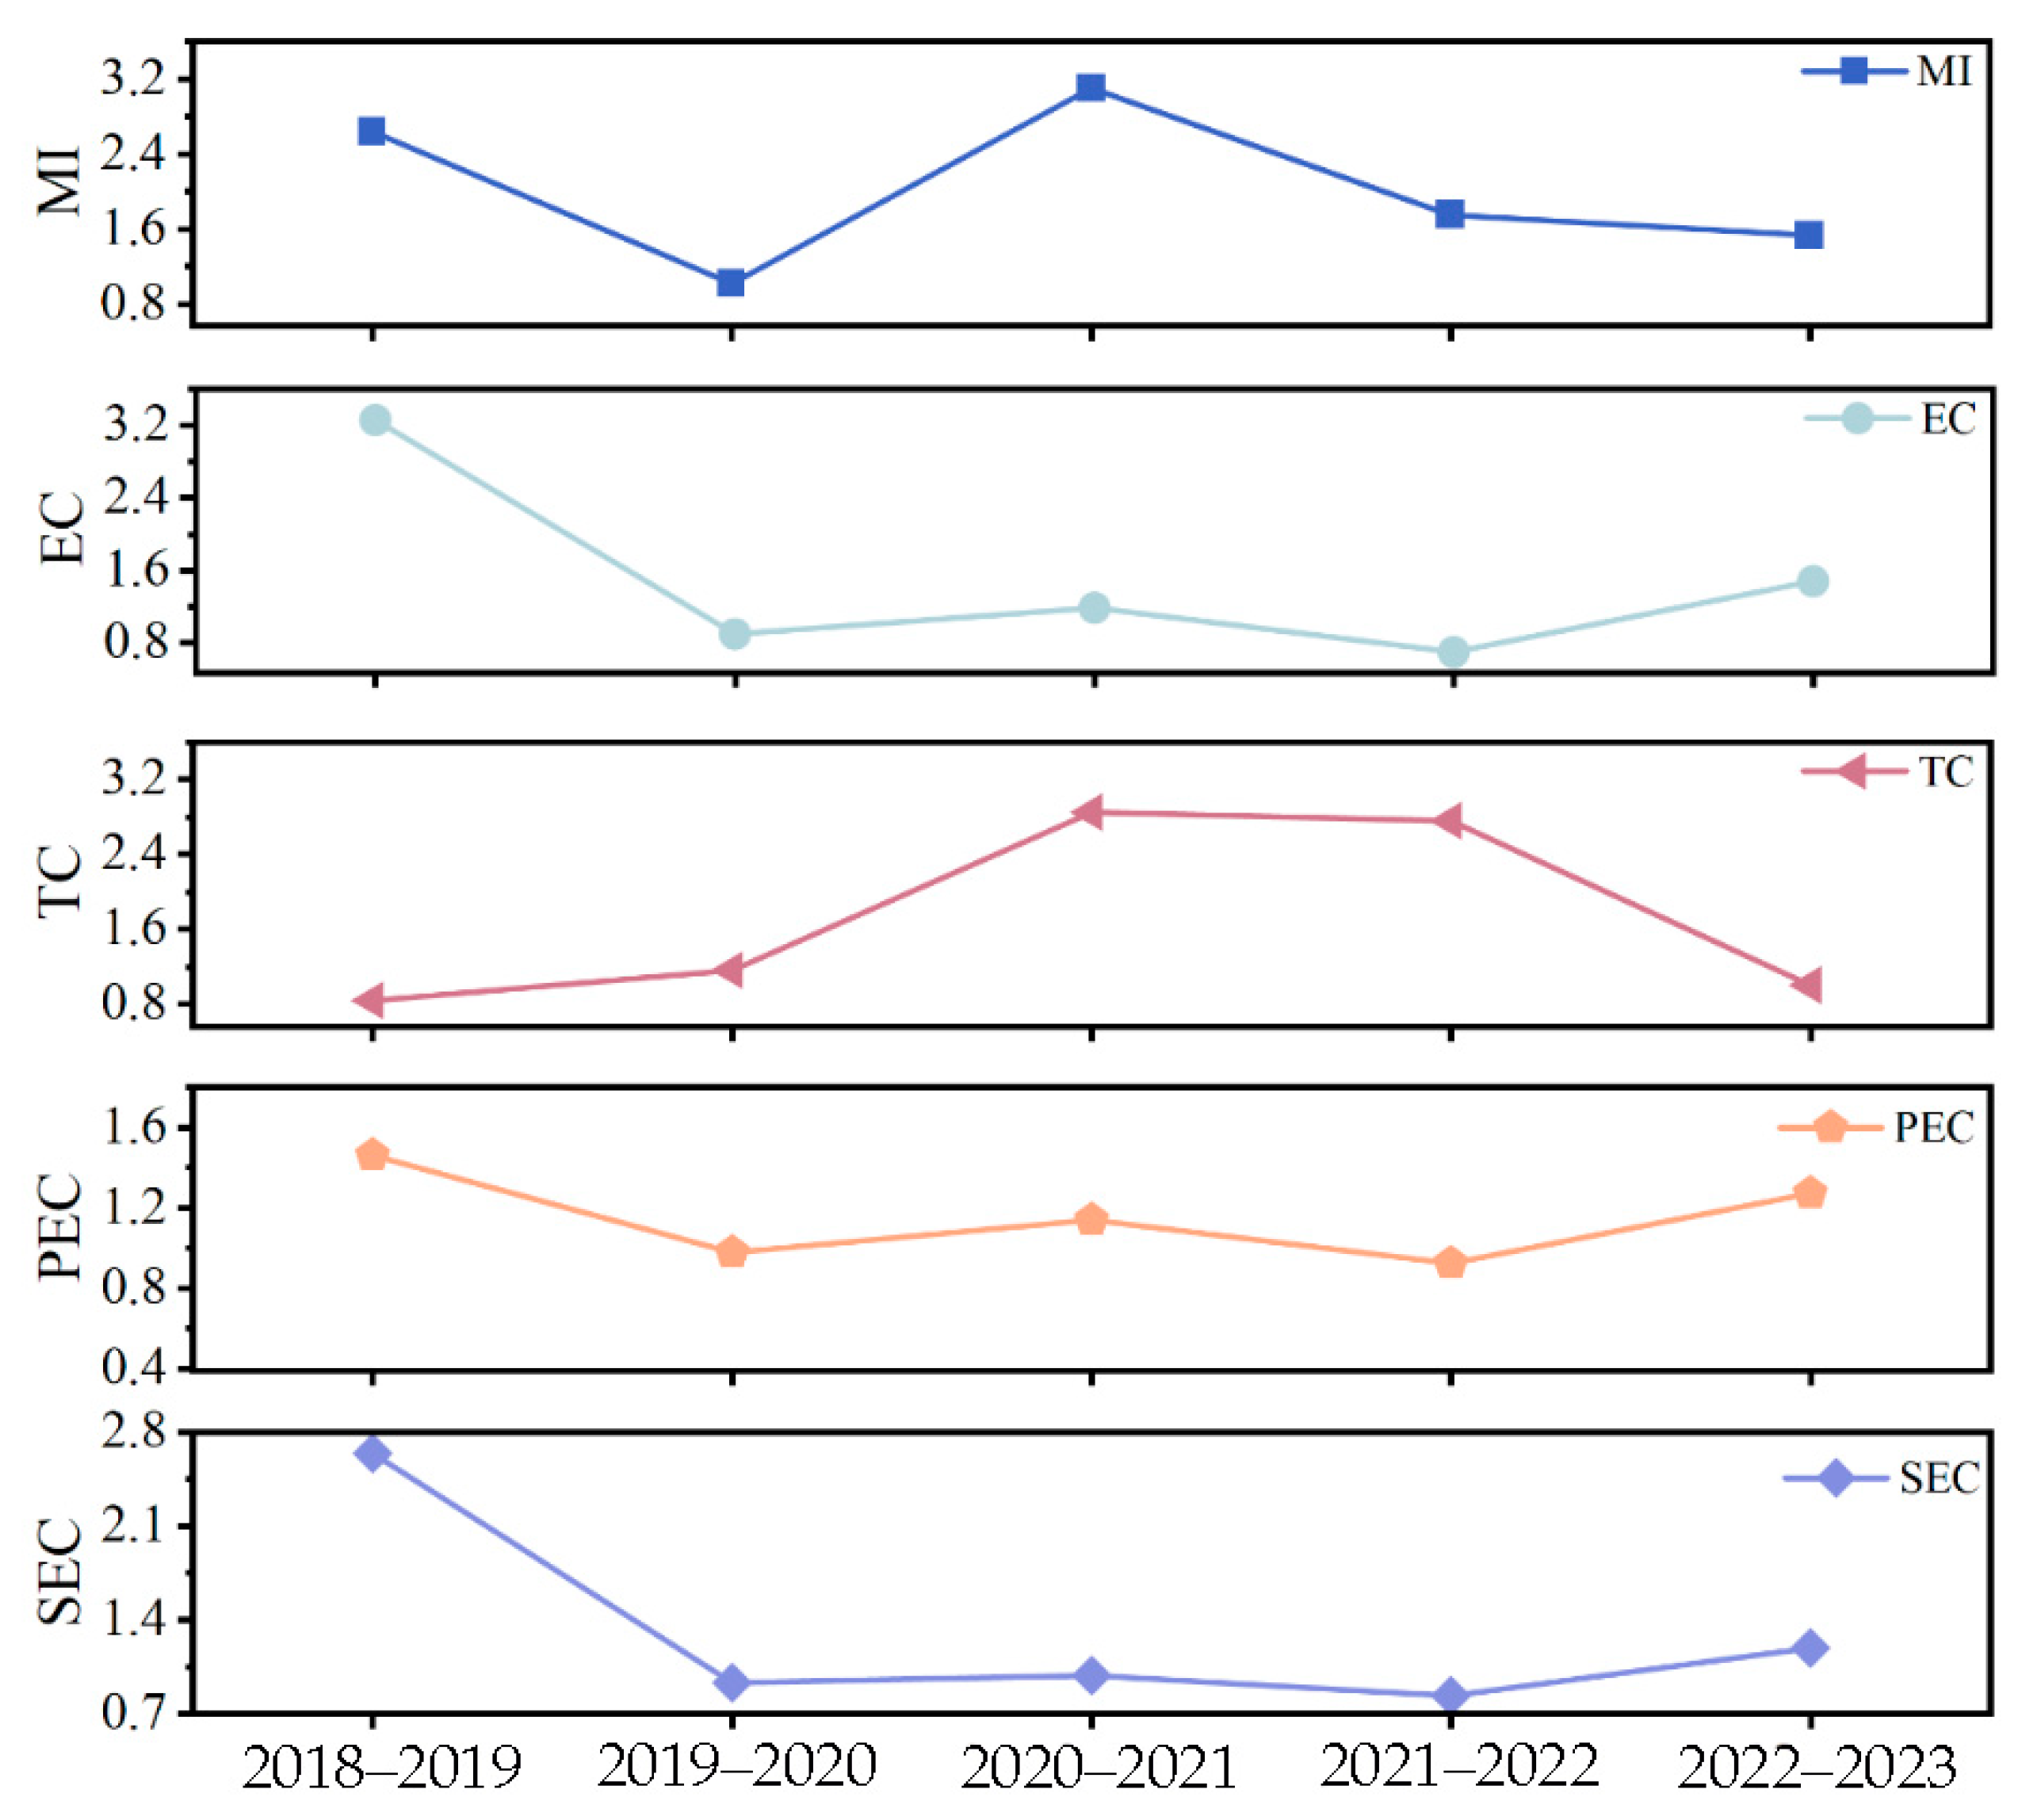
Having established the static efficiency levels and their adjusted values in the preceding sections, we now turn to dynamic analysis. By employing the Malmquist index, we investigate the evolution of carbon reduction productivity from 2018 to 2023, decomposing the changes to understand their underlying drivers. A dynamic analysis of the Malmquist index in Figure 8 reveals a contradictory and unstable evolutionary path behind the productivity growth of China’s NEV industry. Overall, while total factor productivity (MI) has generally grown, the drivers, quality, and sustainability of this growth expose significant variations and profound challenges across different phases.
The first phase (2018–2019) was characterized by a “catch-up” boom and its inherent fragility. In this year, productivity saw spectacular growth of 2.64. However, a deeper look at its components reveals that the underlying cause was a massive improvement in technical efficiency at 3.255, driven particularly by a sharp increase in scale efficiency at 2.641. The advantage of this was the industry’s ability to rapidly close the gap with the efficiency frontier through scale and management optimization in its initial stage. But the disadvantage was equally stark: this growth model was not reliant on true innovation, as the technical progress index was actually negative at 0.841. This leads to a key conclusion: such growth, dependent on “low-hanging fruit,” is unsustainable and masks a deficit in core innovative capacity.
The second phase (2019–2022) exposed an “innovation-adoption gap.” In 2019–2020, productivity growth nearly stagnated (MI = 1.02) due to the shock of the pandemic. The direct cause was a comprehensive collapse in technical efficiency (EC = 0.898), with both managerial (PEC = 0.977) and scale (SEC = 0.928) efficiencies declining. However, the growth model then inverted. The strong productivity gains from 2020 to 2022 (MI of 3.106 and 1.749, respectively) were instead driven by a massive leap in technological progress (TC of 2.849 and 2.758). The advantage of this shift is that national R&D policies successfully pushed the industry’s technological frontier [56], creating a higher ceiling for future development. But the disadvantage and challenge followed suit: the pace of technical efficiency improvement could not keep up with innovation, even falling sharply to 0.70073 in 2021–2022. From this, we draw a more profound conclusion: the industry’s core bottleneck has shifted from a “lack of innovation” to a “lack of absorptive capacity.” Provinces have encountered significant difficulties in effectively adopting, managing, and scaling new technologies, creating a major gap between innovation and application.
The third phase (2022–2023) entered a “digestion and absorption period.” In this year, productivity growth was solid (MI = 1.534), and its drivers inverted once again: technological progress stabilized (TC = 1.006), while growth came entirely from a strong rebound in technical efficiency (EC = 1.478), thanks to improvements in both managerial (PEC = 1.272) and scale (SEC = 1.189) efficiencies. This final trend leads to our ultimate conclusion: the industry appears to move in an “innovation-absorption” cycle. After a period of explosive technological change, it naturally enters a phase of digesting and catching up to the new frontier. This demonstrates that achieving long-term sustainable development requires a dynamic policy balance between “encouraging innovation” and “enhancing absorptive capacity”—a strategic challenge that demands continuous attention.

4.5. Discussion on External Influencing Factors

Beyond the environmental variables considered in the SFA analysis, additional external factors influence the carbon-reduction efficiency of NEVs. First, since the IMF’s 2018 warning about escalating trade tensions, trade protectionism has intensified even greater, exacerbating environmental degradation [80]. Inter-regional trade frictions have hindered NEV exports, creating overcapacity in affected areas and narrowing both the promotion scope and carbon-reduction efficiency of NEVs. Several countries have tightened control over the NEV supply and value chains, and carbon-centered green trade barriers are gradually emerging.
Second, government policy is the principal external determinant of NEV development [81]. Insufficient public investment in infrastructure, such as charging stations and transmission networks, together with reduced subsidies for NEV promotion [82], restrict widespread adoption, suppress demand-side output, and undermine carbon-reduction efficiency.
Third, COVID-19 restrictions from 2019 to 2022 curtailed economic activity and personal travel, potentially leading to overestimation of NEV carbon emissions during this period. For example, Shanghai’s April 2022 lockdown shuttered more than 1000 vehicle and component firms, including SAIC, Tesla, and NIO. This cut Shanghai NEV output by roughly 20%.

5. Discussion

(1)
The study now constructs a three-stage, super-efficient SBM model with undesirable CO2 emissions as the output to evaluate NEV carbon-reduction efficiency in 21 provinces during 2018–2023. The analysis reveals an overall efficiency score of 0.353 and pronounced regional variation, which are findings consistent with Kucukvar et al. [83]. They evaluated electric vehicles in 27 European countries with a restricted-weight DEA model and reported efficiency scores below 0.380 in 19 nations. Despite the differing study areas, both results underscore imbalances in NEV industry development in China and Europe.
(2)
SFA results first indicate that higher urbanization enhances labor and capital utilization yet increases energy slack. This matches Zheng et al. [13], who contended that urbanization drives higher CO2 emissions. Second, rising household consumption elevates labor, capital, and energy slack and hinders NEV emission reduction. This observation is consistent with Liu et al. [7], who linked higher consumption to greater CO2 output. Third, technological advancement promotes more efficient resource use. Wang et al. [84] likewise demonstrated that technological innovation significantly benefits NEV supply.
(3)
Several limitations should be acknowledged. First, imperfections persist in both the sample and the indicator system. Because industrial development lags in certain provinces and EV market share are uneven, the analysis is restricted to 21 provinces. The research scope should be widened once hydrogen fuel-cell NEVs gain market share. Second, technological innovation is proxied solely by patent counts, but trends in intelligent NEVs and breakthroughs in key components (e.g., batteries) are not examined. Low battery energy density and high manufacturing costs currently constrain NEV deployment, while recycling faces low metal-recovery rates, lengthy processes, high costs, and safety concerns that require urgent resolution.
(4)
The empirical focus and policy recommendations center on China. While cross-national differences limit direct policy transfer, the findings still inform efforts to address regional imbalances elsewhere. Globally, the NEV industry remains in its infancy. Although NEVs have grown rapidly in China, their widespread adoption has increased pressure on the power grid. The Malmquist results show efficiency declined only in 2019–2020, while efficiency-growth rates tapered between 2021 and 2023. These trends imply that large-scale NEV deployment necessitates concurrent energy-sector transformation—an insight relevant to other nations pursuing low-carbon transitions, where market-oriented reform of the energy industry should accompany NEV expansion.

6. Conclusions and Policy Recommendations

6.1. Conclusions

The global development of NEVs remains uneven. Although China’s NEV industry occupies a leading position, substantial inter-provincial disparities persist. Accordingly, panel data for 21 provinces in China (2018–2023) are analyzed to evaluate NEV carbon dioxide emission-reduction efficiency. The following conclusions are drawn.
Temporal and regional patterns: NEV carbon-reduction efficiency displays a generally upward yet volatile trajectory between 2018 and 2023, declining only in 2020. Regional efficiency differentials likewise have widened over time, contracting in 2019, but expanding thereafter, peaking at 1.637 in Shanghai and bottoming at 0.007 in Tianjin (both in 2023). These figures underscore pronounced imbalances in China’s NEV carbon-reduction efficiency.
Mismatch between production and consumption: In most provinces, NEV production and consumption are misaligned. For example, Shaanxi records high output yet a low in-use stock of NEVs, inflating its efficiency score, whereas Beijing and Liaoning exhibit low production yet high consumption, yielding depressed scores. Shanghai remains the most efficient province, with scale efficiency continuing to rise and scope for further gains through additional output. By contrast, Tianjin’s efficiency score falls below 0.1, reflecting inadequate production capacity. Targeted policy investment is therefore urgent.
Influence of urbanization, consumption, and technology: Higher urbanization reduces labor and capital inputs, yet rising urban population and energy demand diminish NEV carbon-reduction efficiency. Rising household consumption impedes the contribution of NEVs to lowering transport sector emissions, whereas technological advancement enhances resource-use efficiency and positively influences provincial carbon emission reduction.

6.2. Policy Recommendations

According to the Malmquist index trajectory, China’s NEV carbon dioxide emission-reduction efficiency has increased annually, except for a temporary decline during the initial phase of the COVID-19 pandemic. This pattern suggests that NEV promotion has not materially been impeded by subsidy-policy reforms, in part because intense price competition has sustained market demand. The results indicate that North China records the lowest efficiency score. Consequently, a realignment of policy is required to accelerate NEV development in the region. Low-efficiency cities, such as Beijing and Tianjin, should have their local NEV supply chains strengthened in light of prevailing conditions. Beijing’s existing NEV production lines are considered outdated and vulnerable to low-end industrial relocation, thereby necessitating the attraction of high-end manufacturers. Tianjin was designated a national NEV demonstration city in 2013 and has performed strongly on the demand side. However, local production remains weak and lacks anchor firms capable of driving sectoral growth.
Efficiency in Southwest China, particularly Sichuan, is sub-optimal, and this province’s comparative advantages should be leveraged to develop a robust NEV industry. Although Sichuan possesses abundant lithium reserves and strong upstream capabilities, the provincial industrial chain remains incomplete. The construction of advantageous NEV clusters should be accelerated, and manufacturing, service, and R&D supply chains should be reinforced. Moreover, Sichuan leads the nation in hydropower output, affording considerable potential to expand a hydrogen energy subsector.
Efficiency scores in the east and northwest regions are relatively high, yet scope for further improvement remains. In efficient provinces such as Shanghai and Shaanxi, charging-and-swapping infrastructure should be further optimized, and fast-charging-centric highway and public networks should be rolled out, with slow charging serving as a complement. Simultaneously, grid load-management capacity must be reinforced to accommodate large-scale NEV charging. To stimulate demand, joint government–enterprise initiatives like NEV exhibitions should be deployed in Shanghai, Shaanxi, and other provinces to raise low-carbon awareness, boost consumption, and relieve overcapacity. Subsidy programs should align with fiscal capacity through tiered incentives or targeted eligibility criteria to maximize promotional efficiency.

Author Contributions

Conceptualization, L.Z. and F.Z.; methodology, F.R. and F.Z.; software, F.Z.; validation, L.Z., F.R. and F.Z.; formal analysis, L.Z., F.R. and F.Z.; investigation, F.Z.; resources, F.R.; data curation, F.R. and F.Z.; writing—original draft preparation, F.R. and F.Z.; writing—review and editing, L.Z. and F.R.; visualization, L.Z. and F.Z.; supervision, F.R.; project administration, F.R.; funding acquisition, L.Z., F.R. and F.Z. All authors have read and agreed to the published version of the manuscript.

Funding

This research was funded by the National Social Science Foundation Post-funding Project, grant number 21FJYBX047 and the Central University Scientific Research Project, grant number B2402-07110. The APC was funded by Liying Zheng.

Institutional Review Board Statement

Not applicable.

Informed Consent Statement

Not applicable.

Data Availability Statement

All data in this study are obtained from publicly available statistics. The dataset is available from the authors upon reasonable request.

Conflicts of Interest

The authors declare no conflict of interest.

Nomenclature and Abbreviations

The following nomenclature and abbreviations are used in this manuscript.
AbbreviationFull TermConcise Definition
BEVBattery electric vehicle Vehicle powered solely by electricity stored in onboard batteries.
DEAData envelopment analysis Non-parametric linear-programming method to assess the relative efficiency of DMUs with multiple inputs and outputs.
DMUDecision-making unitEntity whose efficiency is evaluated; in this study, each of the 21 Chinese provinces.
ECEfficiency changeCatch-up component of the Malmquist index.
HEVHybrid electric vehicleVehicle combining an internal combustion engine with an electric propulsion system.
ICEVInternal combustion engine vehicleConventional fuel vehicle used as baseline for comparison.
LCALife-cycle assessmentMethod to measure total environmental impact from manufacture through end-of-life.
MIMalmquist indexIndex that decomposes total factor productivity change into EC and TC between two periods.
NEVNew energy vehicle Low-carbon alternative to ICEVs, including BEVs and HEVs.
PECPure technical efficiency change Sub-component of EC assuming constant returns to scale.
SBMSlack-based measure Non-radial DEA model that incorporates input–output slacks, suitable for undesirable outputs.
SECScale efficiency change Sub-component of EC reflecting efficiency changes due to scale of operations.
SFAStochastic frontier analysis Parametric method that separates managerial inefficiency, environmental factors and random noise.
TCTechnical changeShift of the production frontier due to technological innovation across the entire industry.
TFPTotal factor productivityComposite measure of productivity that considers all inputs used in a production process.

References

  1. United Nations Environment Programme. Emissions Gap Report 2024: A Climate of Distrust. 2024. Available online: https://www.unep.org/resources/emissions-gap-report-2024 (accessed on 29 July 2025).
  2. International Energy Agency. Global EV Outlook 2023. 2023. Available online: https://www.iea.org/reports/global-ev-outlook-2023 (accessed on 29 July 2025).
  3. National Bureau of Statistics of China. Statistical Communiqué of the People’s Republic of China on the 2024 National Economic and Social Development. 28 February 2025. Available online: https://www.stats.gov.cn/english/PressRelease/202502/t20250228_1958822.html (accessed on 29 July 2025).
  4. China Association of Automobile Manufacturers. Analysis of NEV Production and Sales in 2023. 2023. Available online: http://en.caam.org.cn/ (accessed on 23 July 2025).
  5. China Association of Automobile Manufacturers. Analysis of NEV Production and Sales in 2024. 2024. Available online: http://en.caam.org.cn/ (accessed on 23 July 2025).
  6. TrendForce. Global NEV Sales Expected to Grow 18% in 2025, with US Market Facing Uncertainty. 20 February 2025. Available online: https://www.trendforce.com/presscenter/news/20250220-12478.html (accessed on 29 July 2025).
  7. Liu, J.; Murshed, M.; Chen, F.; Shahbaz, M.; Kirikkaleli, D.; Khan, Z. An empirical analysis of the household consumption-induced carbon emissions in China. Sustain. Prod. Consum. 2021, 26, 943–957. [Google Scholar] [CrossRef]
  8. International Energy Agency. Norway. Available online: https://www.iea.org/countries/norway (accessed on 23 July 2025).
  9. Ember. European Electricity Review 2024. 7 February 2024. Available online: https://ember-energy.org/latest-insights/european-electricity-review-2024/ (accessed on 29 July 2025).
  10. U.S. Energy Information Administration. Electricity Explained, Electricity in the United States. Available online: https://www.eia.gov/energyexplained/electricity/electricity-in-the-us.php (accessed on 23 July 2025).
  11. International Energy Agency. Japan. Available online: https://www.iea.org/countries/japan (accessed on 23 July 2025).
  12. Ember. Powering China’s New Era of Green Electrification. 13 May 2025. Available online: https://ember-energy.org/latest-insights/powering-chinas-new-era-of-green-electrification/ (accessed on 29 July 2025).
  13. Zheng, S.; Wang, R.; Mak, T.M.; Hsu, S.-C.; Tsang, D.C. How energy service companies moderate the impact of industrialization and urbanization on carbon emissions in China? Sci. Total. Environ. 2021, 751, 141610. [Google Scholar] [CrossRef] [PubMed]
  14. Myllyvirta, L. Analysis: Record Surge of Clean Energy in 2024 Halts China’s CO2 Rise. Carbon Brief. 27 January 2025. Available online: https://www.carbonbrief.org/analysis-record-surge-of-clean-energy-in-2024-halts-chinas-co2-rise/ (accessed on 29 July 2025).
  15. China Renewable Energy Engineering Institute. China Energy Transformation Outlook 2024 (CETO 2024). 12 February 2025. Available online: https://www.cet.energy/2025/02/12/china-energy-transformation-outlook-2024-%e4%b8%ad%e5%9b%bd%e8%83%bd%e6%ba%90%e8%bd%ac%e5%9e%8b%e5%b1%95%e6%9c%9b2024-ceto24/ (accessed on 29 July 2025).
  16. Fried, H.O.; Lovell, C.A.K.; Schmidt, S.S.; Yaisawarng, S. Accounting for environmental effects and statistical noise in data envelopment analysis. J. Prod. Anal. 2002, 17, 157–174. [Google Scholar] [CrossRef]
  17. Yang, X.; Wen, S. Spatial Correlation Network of Construction and Demolition Waste Management Efficiency: A Study Based on an Improved Three-Stage SBM-DEA Model in China. Buildings 2025, 15, 51. [Google Scholar] [CrossRef]
  18. Hawkins, T.R.; Singh, B.; Majeau-Bettez, G.; Strømman, A.H. Comparative environmental life cycle assessment of conventional and electric vehicles. J. Ind. Ecol. 2013, 17, 53–64. [Google Scholar] [CrossRef]
  19. Qiao, Q.; Zhao, F.; Liu, Z.; He, X.; Hao, H. Life cycle greenhouse gas emissions of Electric Vehicles in China: Combining the vehicle cycle and fuel cycle. Energy 2019, 177, 222–233. [Google Scholar] [CrossRef]
  20. Huo, H.; Zhang, Q.; Wang, M.Q.; Streets, D.G.; He, K. Environmental implication of electric vehicles in China. Environ. Sci. Technol. 2010, 44, 4856–4861. [Google Scholar] [CrossRef] [PubMed]
  21. Jamil, K.; Liu, D.; Gul, R.F.; Hussain, Z.; Mohsin, M.; Qin, G.; Khan, F.U. Do remittance and renewable energy affect CO2 emissions? An empirical evidence from selected G-20 countries. Energy Environ. 2022, 33, 916–932. [Google Scholar] [CrossRef]
  22. Cooper, W.W.; Seiford, L.M.; Tone, K. Data Envelopment Analysis: A Comprehensive Text with Models, Applications, References and DEA-Solver Software, 2nd ed.; Springer: New York, NY, USA, 2007. [Google Scholar] [CrossRef]
  23. Sueyoshi, T.; Yuan, Y.; Goto, M. A literature study for DEA applied to energy and environment. Energy Econ. 2017, 62, 104–124. [Google Scholar] [CrossRef]
  24. Zhou, P.; Ang, B.; Poh, K. A survey of data envelopment analysis in energy and environmental studies. Eur. J. Oper. Res. 2008, 189, 1–18. [Google Scholar] [CrossRef]
  25. Tone, K. A slacks-based measure of efficiency in data envelopment analysis. Eur. J. Oper. Res. 2001, 130, 498–509. [Google Scholar] [CrossRef]
  26. Tone, K. Dealing with Undesirable Outputs in DEA: A Slacks-Based Measure (SBM) Approach. In Proceedings of the North American Productivity Workshop 2004, Toronto, ON, Canada, 23–25 June 2004; pp. 44–45. [Google Scholar]
  27. Zhang, N.; Zhou, P.; Kung, C.-C. Total-factor carbon emission performance of the Chinese transportation industry: A bootstrapped non-radial Malmquist index analysis. Renew. Sustain. Energy Rev. 2015, 41, 584–593. [Google Scholar] [CrossRef]
  28. Li, R.; Li, L.; Wang, Q. The impact of energy efficiency on carbon emissions: Evidence from the transportation sector in Chinese 30 provinces. Sustain. Cities Soc. 2022, 82, 103880. [Google Scholar] [CrossRef]
  29. Tone, K. A slacks-based measure of super-efficiency in data envelopment analysis. Eur. J. Oper. Res. 2002, 143, 32–41. [Google Scholar] [CrossRef]
  30. Jiang, G.; Jin, R.; Lu, C.; Gao, M.; Li, J. Provincial Coal Flow Efficiency of China Quantified by Three-Stage Data-Envelopment Analysis. Sustainability 2024, 16, 4414. [Google Scholar] [CrossRef]
  31. Tang, Y.; Ding, H.; Shan, X.; Wang, X. Application of the novel three-stage DEA model to evaluate total-factor energy efficiency: A case study based on 30 provinces and 8 comprehensive economic zones of China. Results Eng. 2023, 20, 101417. [Google Scholar] [CrossRef]
  32. Ye, F.-F.; Han, S.-R.; Lu, H.-T. Carbon emissions management efficiency evaluation based on indicator information integration and DEA-Malmquist index. Front. Environ. Sci. 2023, 11, 1301091. [Google Scholar] [CrossRef]
  33. Färe, R.; Grosskopf, S.; Norris, M.; Zhang, Z. Productivity Growth, Technical Progress, and Efficiency Change in Industrialized Countries. Am. Econ. Rev. 1994, 84, 66–83. [Google Scholar]
  34. Emrouznejad, A.; Yang, G.-L. A survey and analysis of the first 40 years of scholarly literature in DEA: 1978–2016. Socio-Econ. Plan. Sci. 2018, 61, 4–8. [Google Scholar] [CrossRef]
  35. Han, Y.; Zhou, B.; Deng, H.; Qin, J. Unraveling the Estimation Bias of Carbon Emission Efficiency in China’s Power Industry by Carbon Transfer from Inter-Provincial Power Transmission. Sustainability 2025, 17, 2312. [Google Scholar] [CrossRef]
  36. Challa, R.; Kamath, D.; Anctil, A. Well-to-wheel greenhouse gas emissions of electric versus combustion vehicles from 2018 to 2030 in the US. J. Environ. Manag. 2022, 308, 114592. [Google Scholar] [CrossRef]
  37. Liu, X.; Niu, Q.; Dong, S.; Zhong, S. How does renewable energy consumption affect carbon emission intensity? Temporal-spatial impact analysis in China. Energy 2023, 284, 128690. [Google Scholar] [CrossRef]
  38. Sun, X.; Lian, W.; Gao, T.; Chen, Z.; Duan, H. Spatial-temporal characteristics of carbon emission intensity in electricity generation and spatial spillover effects of driving factors across China’s provinces. J. Clean. Prod. 2023, 405, 136908. [Google Scholar] [CrossRef]
  39. Apostolaki-Iosifidou, E.; Codani, P.; Kempton, W. Measurement of power loss during electric vehicle charging and discharging. Energy 2017, 127, 730–742. [Google Scholar] [CrossRef]
  40. Wu, P.; Wang, Y.; Chiu, Y.-H.; Li, Y.; Lin, T.-Y. Production efficiency and geographical location of Chinese coal enterprises—Undesirable EBM DEA. Resour. Policy 2019, 64, 101527. [Google Scholar] [CrossRef]
  41. Aigner, D.; Lovell, C.A.K.; Schmidt, P. Formulation and estimation of stochastic frontier production function models. J. Econom. 1977, 6, 21–37. [Google Scholar] [CrossRef]
  42. Meeusen, W.; van den Broeck, J. Efficiency estimation from Cobb-Douglas production functions with composed error. Int. Econ. Rev. 1977, 18, 435–444. [Google Scholar] [CrossRef]
  43. Yan, Z.; Zhou, W.; Wang, Y.; Chen, X. Comprehensive Analysis of Grain Production Based on Three-Stage Super-SBM DEA and Machine Learning in Hexi Corridor, China. Sustainability 2022, 14, 8881. [Google Scholar] [CrossRef]
  44. Zhao, Z.; Ren, J.; Liu, Z. How Does Urbanization Affect Carbon Emission Performance? Evidence from 282 Cities in China. Sustainability 2023, 15, 15498. [Google Scholar] [CrossRef]
  45. Chen, C.; Qin, Y.; Gao, Y. Does new urbanization affect CO2 emissions in China:A spatial econometric analysis. Sustain. Cities Soc. 2023, 96, 104687. [Google Scholar] [CrossRef]
  46. Yang, B.; Ali, M.; Hashmi, S.H.; Shabir, M. Income Inequality and CO2 Emissions in Developing Countries: The Moderating Role of Financial Instability. Sustainability 2020, 12, 6810. [Google Scholar] [CrossRef]
  47. Chen, H.; Yi, J.; Chen, A.; Peng, D.; Yang, J. Green technology innovation and CO2 emission in China: Evidence from a spatial-temporal analysis and a nonlinear spatial durbin model. Energy Policy 2023, 172, 113338. [Google Scholar] [CrossRef]
  48. Cheng, C.C.; Yang, C.-L.; Sheu, C. The link between eco-innovation and business performance: A Taiwanese industry context. J. Clean. Prod. 2014, 64, 81–90. [Google Scholar] [CrossRef]
  49. National Bureau of Statistics, Department of Energy Statistics. China Energy Statistical Yearbook 2018; China Statistics Press: Beijing, China, 2019.
  50. National Bureau of Statistics, Department of Energy Statistics. China Energy Statistical Yearbook 2019; China Statistics Press: Beijing, China, 2020.
  51. National Bureau of Statistics, Department of Energy Statistics. China Energy Statistical Yearbook 2020; China Statistics Press: Beijing, China, 2021.
  52. National Bureau of Statistics, Department of Energy Statistics. China Energy Statistical Yearbook 2021; China Statistics Press: Beijing, China, 2022.
  53. National Bureau of Statistics, Department of Energy Statistics. China Energy Statistical Yearbook 2022; China Statistics Press: Beijing, China, 2023.
  54. National Bureau of Statistics, Department of Energy Statistics. China Energy Statistical Yearbook 2023; China Statistics Press: Beijing, China, 2024.
  55. National Bureau of Statistics of China. China Statistical Yearbook 2018; China Statistics Press: Beijing, China, 2019.
  56. National Bureau of Statistics of China. China Statistical Yearbook 2019; China Statistics Press: Beijing, China, 2020.
  57. National Bureau of Statistics of China. China Statistical Yearbook 2020; China Statistics Press: Beijing, China, 2021.
  58. National Bureau of Statistics of China. China Statistical Yearbook 2021; China Statistics Press: Beijing, China, 2022.
  59. National Bureau of Statistics of China. China Statistical Yearbook 2022; China Statistics Press: Beijing, China, 2023.
  60. National Bureau of Statistics of China. China Statistical Yearbook 2023; China Statistics Press: Beijing, China, 2024.
  61. National Bureau of Statistics of China. Statistical Communiqué of the People’s Republic of China on the 2018 National Economic and Social Development. 2019. Available online: https://www.stats.gov.cn/english/PressRelease/201902/t20190228_1651335.html (accessed on 29 July 2025).
  62. National Bureau of Statistics of China. Statistical Communiqué of the People’s Republic of China on the 2019 National Economic and Social Development. 2020. Available online: https://www.stats.gov.cn/english/PressRelease/202002/t20200228_1728917.html (accessed on 29 July 2025).
  63. National Bureau of Statistics of China. Statistical Communiqué of the People’s Republic of China on the 2020 National Economic and Social Development. 2021. Available online: https://www.stats.gov.cn/english/PressRelease/202102/t20210228_1814177.html (accessed on 29 July 2025).
  64. National Bureau of Statistics of China. Statistical Communiqué of the People’s Republic of China on the 2021 National Economic and Social Development. 2022. Available online: https://www.stats.gov.cn/english/PressRelease/202202/t20220227_1827963.html (accessed on 29 July 2025).
  65. National Bureau of Statistics of China. Statistical Communiqué of the People’s Republic of China on the 2022 National Economic and Social Development. 2023. Available online: https://www.stats.gov.cn/english/PressRelease/202302/t20230227_1918979.html (accessed on 29 July 2025).
  66. National Bureau of Statistics of China. Statistical Communiqué of the People’s Republic of China on the 2023 National Economic and Social Development. 2024. Available online: https://www.stats.gov.cn/english/PressRelease/202402/t20240228_1947918.html (accessed on 29 July 2025).
  67. China Electric Power Yearbook Editorial Board. China Electric Power Yearbook 2018; China Electric Power Press: Beijing, China, 2019. [Google Scholar]
  68. China Electric Power Yearbook Editorial Board. China Electric Power Yearbook 2019; China Electric Power Press: Beijing, China, 2020. [Google Scholar]
  69. China Electric Power Yearbook Editorial Board. China Electric Power Yearbook 2020; China Electric Power Press: Beijing, China, 2021. [Google Scholar]
  70. China Electric Power Yearbook Editorial Board. China Electric Power Yearbook 2021; China Electric Power Press: Beijing, China, 2022. [Google Scholar]
  71. China Electricity Council. China Electric Power Statistics Yearbook 2022; China Statistics Press: Beijing, China, 2023. [Google Scholar]
  72. China Electricity Council. China Electric Power Statistics Yearbook 2023; China Statistics Press: Beijing, China, 2024. [Google Scholar]
  73. Ou, S.; Yu, R.; Lin, Z.; Ren, H.; He, X.; Przesmitzki, S.; Bouchard, J. Intensity and daily pattern of passenger vehicle use by region and class in China: Estimation and implications for energy use and electrification. Mitig. Adapt. Strat. Glob. Chang. 2020, 25, 307–327. [Google Scholar] [CrossRef]
  74. Gasgoo Auto News. BYD Completes Construction of New Energy Vehicle Parts Industrial Park in Xi’an City. Gasgoo. 11 July 2023. Available online: https://autonews.gasgoo.com/new_energy/70023761.html (accessed on 29 July 2025).
  75. General Office of the State Council of the People’s Republic of China. Development Plan for the New Energy Vehicle Industry (2021–2035) (Guo Ban Fa [2020] No. 39). 2020. Available online: http://www.gov.cn/zhengce/content/2020-11/02/content_5556716.htm (accessed on 29 July 2025).
  76. Zhang, M.; Song, Y.; Li, P.; Li, H. Study on affecting factors of residential energy consumption in urban and rural Jiangsu. Renew. Sustain. Energy Rev. 2016, 53, 330–337. [Google Scholar] [CrossRef]
  77. Li, R.; Wang, Q.; Li, L.; Hu, S. Do natural resource rent and corruption governance reshape the environmental Kuznets curve for ecological footprint? Evidence from 158 countries. Resour. Policy 2023, 85, 103890. [Google Scholar] [CrossRef]
  78. Yang, X.; Jia, Z.; Yang, Z.; Yuan, X. The effects of technological factors on carbon emissions from various sectors in China—A spatial perspective. J. Clean. Prod. 2021, 301, 126949. [Google Scholar] [CrossRef]
  79. Wang, Q.; Hu, S.; Li, R. Could information and communication technology (ICT) reduce carbon emissions? The role of trade openness and financial development. Telecommun. Policy 2024, 48, 102699. [Google Scholar] [CrossRef]
  80. Wang, Q.; Wang, X.; Li, R.; Jiang, X. Reinvestigating the environmental Kuznets curve (EKC) of carbon emissions and ecological footprint in 147 countries: A matter of trade protectionism. Humanit. Soc. Sci. Commun. 2024, 11, 160. [Google Scholar] [CrossRef]
  81. Jiang, Y.; Wu, Q.; Li, M.; Gu, Y.; Yang, J. What Is Affecting the Popularity of New Energy Vehicles? A Systematic Review Based on the Public Perspective. Sustainability 2023, 15, 13471. [Google Scholar] [CrossRef]
  82. Li, H.; Qi, H.; Cao, H.; Yuan, L. Industrial policy and technological innovation of new energy vehicle industry in China. Energies 2022, 15, 9264. [Google Scholar] [CrossRef]
  83. Kucukvar, M.; Onat, N.C.; Kutty, A.A.; Abdella, G.M.; Bulak, M.E.; Ansari, F.; Kumbaroglu, G. Environmental efficiency of electric vehicles in Europe under various electricity production mix scenarios. J. Clean. Prod. 2022, 335, 130291. [Google Scholar] [CrossRef]
  84. Wang, D.; Li, Y. Measuring the policy effectiveness of China’s new-energy vehicle industry and its differential impact on supply and demand markets. Sustainability 2022, 14, 8215. [Google Scholar] [CrossRef]
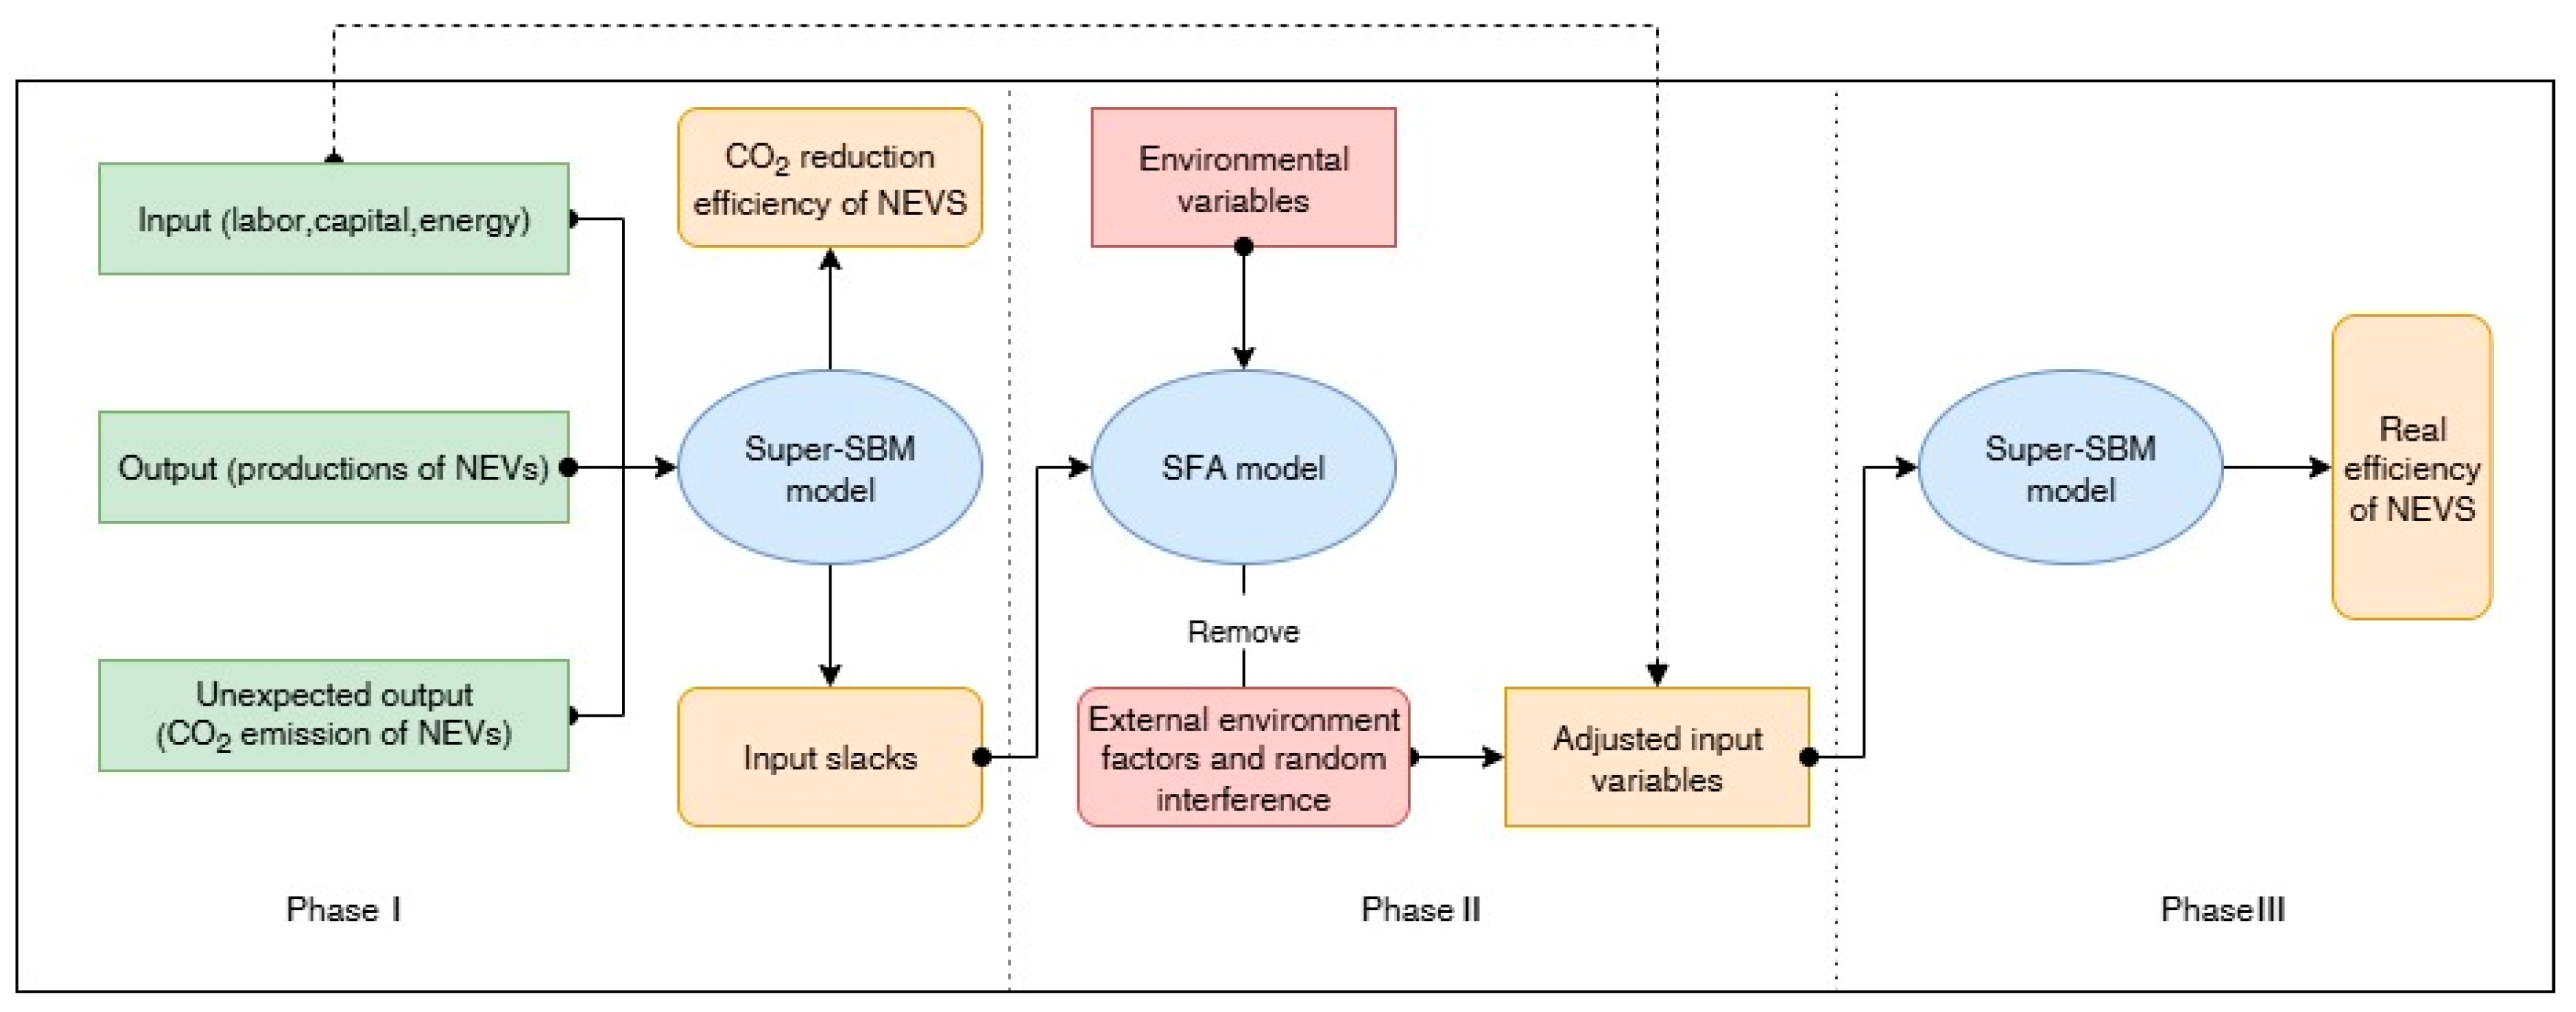
Figure 1. Three-stage super-SBM DEA model.
Sustainability 17 07440 g001
Figure 2. Distribution of Phase I efficiencies (2018, 2020, 2022).
Sustainability 17 07440 g002
Figure 3. Change chart of regional efficiency value in the first stage.
Sustainability 17 07440 g003
Figure 4. Stage-3 efficiency distribution map (2018, 2020, 2022).
Sustainability 17 07440 g004
Figure 5. Comparison of efficiency values before and after provincial adjustment.
Sustainability 17 07440 g005
Figure 6. Comparison of efficiency values before and after inter-provincial adjustment.
Sustainability 17 07440 g006
Figure 7. Change chart of regional efficiency value in the third stage.
Sustainability 17 07440 g007
Figure 8. Dynamic analysis of the Malmquist index.
Sustainability 17 07440 g008
Table 1. Evaluation index system.
ItemNormFactor LayerUnit
Input indicatorsLabor inputNumber of laborers in the automotive manufacturing industryPersons
Capital inputFixed capital stock of the automotive industryRMB million
Energy consumption inputTotal energy consumption in the automotive industryMillion tons of standard coal
Output indicatorNEV productionNEV productionUnit
Non-expected output
indicator
CO2CO2 emissions during the operation of NEVsTons
Environment variablesUrbanization levelUrbanization rate%
Social consuming levelConsumption expenditure per inhabitantRMB
Technical levelNumber of active patentsPieces
Table 2. Annual mileage of new energy passenger cars in various regions.
RegionAverage Annual Distance Traveled (km)
Northeast China12,404.47
North China12,090.07
East China12,222.88
Central South China13,124.91
Southwest China12,261.78
Northwest China13,058.17
Table 3. Descriptive statistics.
ItemNormMaxMinAverageS.D.
InputsNumber of laborers in the automotive manufacturing industry435,600.0012,818.00143,869.2495,762.02
Fixed capital stock of the automotive industry4819.92110.271556.851051.29
Total energy consumption in the automotive industry37,306.351608.7112,334.087646.90
Desirable outputNEV production2,531,800.001500.00200,908.94328,761.95
Undesirable outputCO2 emissions during the operation of NEVs3,425,558.3813,390.53421,860.60501,227.34
Environment variablesUrbanization rate89.3050.2266.8510.15
Consumption expenditure per inhabitant52,508.0014,810.0025,052.468500.32
Number of active patents665,600.004612.00109,356.15134,767.44
Table 4. Efficiency value of the first stage.
DMU2018Rank2019Rank2020Rank2021Rank2022Rank2023Rank
Guangdong0.21480.330110.38970.38180.26550.4773
Zhejiang0.118150.249130.199130.185120.17090.1669
Shanghai0.27261.00471.50411.54811.19421.3122
Jiangsu0.22470.089200.124180.151150.084120.12213
Shandong0.139140.160170.23490.194110.073140.09515
Henan0.191100.320120.219110.163140.052160.05720
Beijing0.163131.11640.193140.030210.051170.13411
Sichuan0.045200.145180.171170.140170.050180.09614
Hebei0.093170.175150.226100.109180.026210.05121
Guangxi0.190110.48391.26630.56450.19980.3177
Anhui1.01731.06060.181150.56460.21170.4244
Hubei0.181120.226140.109190.180130.109110.14510
Tianjin0.008210.056210.093210.055200.041200.12612
Hunan0.47441.14630.33480.50570.32530.3765
Fujian0.111160.106190.179160.274100.079130.07818
Shaanxi1.36711.08850.48751.34731.49611.4531
Chongqing0.20990.434100.209120.31390.26940.3656
Shanxi1.07021.40711.00341.07340.22560.1788
Jiangxi0.33650.167160.103200.092190.060150.08316
Liaoning0.070180.51680.44560.148160.050190.06519
Jilin0.064191.32421.47621.35520.130100.07917
Mean0.3120.5530.4350.4460.2460.295
Note: For years 2019–2023, the symbols ↓ and ↑ represent a decrease or increase in the mean efficiency score compared to the previous year, respectively. The symbol for 2018 (—) indicates that a trend comparison is not applicable as it is the baseline year.
Table 5. SFA analysis.
Environmental VariablesDependent Variables
Slack of Labor(t)Slack of Capital(t)Slack of Energy(t)
Constant−71,144.15−6745.10 ***−1116.74−4.2 ***−25,783.44−19.41 ***
Urbanization−3150.93−4.33 ***−1745.66−5.33 ***934.733.28 ***
Consumption level3.941.86 **736.981.98 **11,408.6216.66 ***
technical level−0.18−3.73 ***−2622.15−5.54 ***−7909.93−4.63 ***
σ29.49 × 1099.49 × 109 ***1.29 × 1063.36 × 105 ***1.21 × 1081.19 × 108 **
γ0.8436.51 ***0.8231.74 ***0.93131.23 ***
Log-likelihood function−1547.74−1067.01−1239.40
LR71.83119.63121.94
Note: *** and ** represent significant level tests of 1% and 5%, respectively.
Table 6. Efficiency value of the third stage.
DMU2018Rank2019Rank2020Rank2021Rank2022Rank2023Rank
Guangdong0.24680.345100.34350.30270.31840.6033
Zhejiang0.148140.290130.186110.166120.21080.2038
Shanghai1.09521.18731.61211.74711.44211.6371
Jiangsu0.27670.094190.120170.128160.098110.14210
Shandong0.176120.175160.24680.208100.083130.10712
Henan0.23290.332110.208100.144150.058150.06419
Beijing0.133150.56570.115180.016210.025210.05621
Sichuan0.052190.149170.165130.124170.054170.11511
Hebei0.115160.185150.21690.111180.030200.06020
Guangxi0.212100.49881.31930.61350.22570.3736
Anhui0.66831.02240.168120.64240.24160.5034
Hubei0.193110.223140.094190.151140.12490.1689
Tianjin0.007210.047210.061210.035200.036190.10613
Hunan0.54341.20820.30170.49960.37830.4875
Fujian0.106170.089200.135160.21090.078140.07715
Shaanxi1.28710.73350.33961.19731.42621.2952
Chongqing0.155130.295120.164140.23280.25350.3547
Shanxi0.34850.58060.152150.195110.089120.07616
Jiangxi0.32360.140180.081200.062190.056160.08114
Liaoning0.079180.44790.37140.154130.051180.06517
Jilin0.048201.29811.43221.35520.111100.06518
Mean0.3070.4720.3730.3950.2570.316
Note: For years 2019–2023, the symbols ↓ and ↑ represent a decrease or increase in the mean efficiency score compared to the previous year, respectively. The symbol for 2018 (—) indicates that a trend comparison is not applicable as it is the baseline year.
Disclaimer/Publisher’s Note: The statements, opinions and data contained in all publications are solely those of the individual author(s) and contributor(s) and not of MDPI and/or the editor(s). MDPI and/or the editor(s) disclaim responsibility for any injury to people or property resulting from any ideas, methods, instructions or products referred to in the content.