Article

Robustness Evaluation and Optimization of China’s Multilayer Coupled Integrated Transportation System from a Complex Network Perspective

1
Key Laboratory of Hydraulic and Waterway Engineering of the Ministry of Education, Chongqing Jiaotong University, Chongqing 400074, China
2
Engineering Research Center of Diagnosis Technology and Instruments of Hydro-Construction, Chongqing Jiaotong University, Chongqing 400074, China
3
School of Highway, Chang’an University, Xi’an 710064, China
*
Authors to whom correspondence should be addressed.
Sustainability 2025, 17(16), 7398; https://doi.org/10.3390/su17167398
Submission received: 18 June 2025 / Revised: 11 August 2025 / Accepted: 13 August 2025 / Published: 15 August 2025

Abstract

With increasing exposure to natural hazards and anthropogenic risks, the robustness of transportation networks must be enhanced to ensure national security and long-term sustainability. However, robustness-optimization research has mainly focused on single-layer networks, while the systematic exploration of multilayer networks that better reflect real-world transportation system characteristics remains insufficient. This study establishes a multilayer integrated transportation network for China, encompassing road, railway, and waterway systems, based on complex network theory. The robustness of single-layer, integrated networks and the integrated transportation networks of the seven major regions is evaluated under various attack strategies. The results indicate that the integrated network exhibits superior robustness to single-layer networks, with the road sub-network proving pivotal for maintaining structural stability. Under the same edge addition ratio, the robustness improvement achieved by the low-importance node enhancement strategy is, on average, about 80% higher than that of the high-importance node strategy, with the effect becoming more significant as the edge addition ratio increases. These findings provide theoretical support for the vulnerability identification and structural optimization of transportation networks, offering practical guidance for constructing efficient, safe, and sustainable transportation systems.

1. Introduction

Transportation networks are key infrastructures that support urban growth and economic development [1]. China’s national transportation strategy and the 14th Five-Year Plan for Modern Integrated Transportation Systems emphasize the development of an integrated transportation network with improved efficiency and resilience. However, increasing natural hazards and anthropogenic risks, such as urban flooding, earthquakes, wars, and terrorist attacks, pose growing threats to transportation networks and, in turn, hinder socioeconomic development [2,3]. National reports and empirical evidence indicate a marked increase in both the frequency and severity of transportation disruptions driven by extreme weather and natural disasters. According to the Ministry of Emergency Management of the People’s Republic of China, over 140 major flood events occurred nationwide between 2015 and 2022. In 2021 alone, extreme rainfall in Henan Province disrupted more than 200 road segments and caused direct economic losses exceeding 120 billion RMB. Similarly, the catastrophic flood in 1998 caused the widespread submergence of highways and the destruction of bridges in the Yangtze and Songhua River basins, disrupting major railway lines and Yangtze River shipping and resulting in direct economic losses of approximately 150 to 170 billion RMB [4]. In July 2023, extreme heavy rainfall in North China triggered a cascading disaster chain that severely damaged power, communication, water conservancy, and transportation infrastructure [5]. Additionally, geopolitical risks have also affected transportation systems; the Russia–Ukraine conflict has led to the disruption or rerouting of certain China–Europe freight train routes, significantly increasing transportation costs and uncertainty in delivery times [6]. It is, therefore, essential to systematically analyze the topology and functional vulnerability of integrated transport networks and develop effective strategies to enhance their robustness. This is critical to ensure the sustainable development of transport systems [7].
Complex network theory has become vital for analyzing the structural and functional vulnerabilities of transportation systems [8]. Abstracting a complex system into a network of nodes (system components) and edges (interactions) provides a general framework for assessing the importance of network nodes and edges [9]. Nevertheless, previous studies have focused mainly on single-layer transportation networks. Complex network theory has been applied to evaluate the topology and vulnerability of various systems, such as railway networks [10], urban transportation networks [11,12,13,14], and airline networks [15]. With the advances in integrated transportation systems and multimodal transportation in recent years, multilayer transportation networks have attracted growing attention. Compared to single-layer networks, the structural characteristics and operational mechanisms of multilayer transportation networks are more aligned with the organization and operation of real-world transportation systems. Multilayer transportation networks also facilitate improvements in network efficiency and resilience to disturbances, supporting transportation planning and decision-making. For example, the robustness of a bilayer railway–aviation network under a discrete cross-layer traffic flow assignment was analyzed, suggesting that multilayer networks are more vulnerable to targeted attacks and node removal than single-layer networks [16]. Compared with single-layer networks, multilayer ones capture the complementarities and importance of different transportation modes with greater efficiency, thus improving the accuracy and relevance of robustness assessments and strategic planning [17]. Various studies have demonstrated that a double-layered network can significantly enhance system stability through structural coupling and dynamic load balancing [18,19]. Based on the above research, we find that multilayer networks better reveal the complementarity between transportation modes, enhancing the accuracy of robustness assessments and the effectiveness of optimization strategies. However, current research on transportation networks mainly focuses on single-layer networks. There is an urgent need to explore the coupling mechanisms among multiple transportation modes and their impact on overall robustness, in order to provide theoretical support for the scientific planning and resilience enhancement of integrated transportation networks.
Identifying key nodes is crucial for network robustness assessments. Node importance has been evaluated based on network topology, using centrality measures such as degree centrality (DC) [20], betweenness centrality (BC) [21], eigenvector centrality (EC) [22], and closeness centrality (CC) [23]. Other approaches assessed node importance based on path structures and influence propagation, e.g., the K-shell decomposition method [24] and the improved PageRank algorithm for identifying critical nodes [25]. However, most of these approaches focused on local structural features and failed to capture the network’s global topological characteristics. To address this limitation, an improved information entropy method, Penalty-based Local Entropy with Adjustment (PLEA) [26], was proposed, which combined local and global information to more accurately identify key nodes in highly aggregated networks. PLEA offers advantages in both identification accuracy and computational efficiency, showing strong potential for applications in complex transportation network analysis. Nonetheless, current applications of PLEA remain limited to single-layer networks and have not been extended to multilayer systems. Thus, this study adapts PLEA to integrated transportation networks by incorporating structural and functional coupling across multiple transportation modes, enabling more precise identification of critical nodes. The findings provide theoretical support for the robustness evaluation and structural optimization of multilayer transportation systems.
Transportation network robustness evaluation is important for ensuring stable transportation system operations, but traditional evaluations often rely on single metrics. For example, network efficiency was used to quantify the loss of functional transfer capacity, with the relative size of the largest connected subgraph reflecting the extent of structural damage [27,28]. However, these indicators primarily capture topological changes instead of fully reflecting the structural robustness and functional integrity of transportation systems. Thus, multidimensional and integrated assessment frameworks are being explored in recent research [29]. Researchers have integrated topological metrics and service characteristics into multi-metric assessment frameworks [30,31]. Meanwhile, dynamic network resilience models have been built upon physical dynamics to evaluate a network’s ability to cope with supply and demand perturbations without external intervention [32], reflecting the dynamic elasticity of network functionality over time. A comprehensive robustness metric allows the evaluation of both network vulnerability and system robustness. Robustness evaluation has informed many optimization strategies for improving network performance [33]. New links have been added to enhance robustness, guided by node-based measures such as mediator centrality, degree centrality, and base-sequence centrality [34,35,36,37]. Meanwhile, existing links have been rearranged to improve network stability [38,39,40]. In recent years, scholars have employed Data Envelopment Analysis (DEA) to assess the relative efficiency of decision-making units (DMUs) based on specified input and output criteria. DEA has been widely applied in the evaluation and optimization of public transportation systems. Notably, interpretable DEA models have been utilized to evaluate the efficiency of origin–destination pairs within transportation networks, thereby enhancing analytical transparency and supporting informed decision-making [41]. The iterative DEA (iDEA) model dynamically optimizes transfer efficiency, providing an effective tool for enhancing transportation resilience [42]. Additionally, multi-criteria decision-making methods such as the Analytic Hierarchy Process (AHP) [43], the VlseKriterijuska Optimizacija I Komoromisno Resenje (VIKOR) method [44], and the Decision-Making Trial and Evaluation Laboratory (DEMATEL) [45] have played important roles in resilience indicator weighting, optimization scheme ranking, and causal relationship identification. Overall, existing studies suggested that appropriately adding or rearranging links can significantly improve network robustness and resilience against disruptions. Therefore, this study aims to systematically analyze the structural characteristics and functional vulnerabilities of China’s integrated transportation network, reveal its robustness evolution under various risk scenarios, and propose actionable optimization strategies. To this end, the main contributions of this work are as follows: a multilayer coupled transportation network is constructed at the prefecture-level scale by integrating national road, rail, and waterway infrastructure, offering a realistic representation of China’s multimodal freight system. The PLEA model is extended to this multilayer context to identify critical nodes, and comparative analyses are conducted across sub-networks, the integrated network, and regional subsystems. Robustness is comprehensively evaluated under random attacks, targeted attacks, and simulated disasters. In addition to network-level assessment, we systematically examine robustness differences among the three transportation modes and across China’s seven major regions, revealing both structural and spatial vulnerabilities. Furthermore, a distance-constrained, node-importance-guided edge addition strategy is proposed and validated, demonstrating practical value for enhancing network robustness under real-world constraints. The remainder of this paper is organized as follows: Section 2 outlines the data and methodological framework; Section 3 presents and discusses the key findings; Section 4 concludes the study with final remarks and future research directions.

2. Data and Methodology

2.1. Data Sources and Processing

The proposed multilayer integrated transportation network modeling framework represents the spatial organization of three freight transportation modes in China: road, railway, waterway, and their intermodal coupling relationships. The Space-L approach from complex network theory is employed to construct three distinct sub-networks, which are then interconnected via cross-layer links to form a comprehensive multilayer integrated transportation network.
The model considers all prefecture-level administrative regions in China as nodes. An edge is added to the corresponding transportation layer if there is a direct freight transportation route (e.g., a road, railway, or waterway) between neighboring prefecture-level administrative regions. If the route must pass through a third prefecture, no edge will be added. In addition, if multiple transportation modes exist within the same prefecture, cross-layer edges are added. Thus, a multilayer integrated transportation network is formed. This modeling approach is consistent with existing studies, as numerous works have adopted prefecture-level administrative regions as network nodes to capture the structural characteristics of China’s integrated transportation system [46,47,48]. Accordingly, the following undirected and unweighted transportation complex networks are constructed: the road sub-network is represented as G r o a d = V r o a d , L r o a d , where V r o a d denotes the set of nodes and L r o a d denotes the set of edges connecting nodes; the railway sub-network is represented as G r a i l = V r a i l , L r a i l , where V r a i l denotes the set of nodes and L r a i l denotes the set of edges connecting nodes; the waterway sub-network is represented as G w a t e r = V w a t e r , L w a t e r , where V w a t e r denotes the set of nodes and L w a t e r denotes the set of edges connecting nodes.
By identifying and connecting cross-layer nodes, a multilayer integrated transportation complex network is constructed. The integrated transportation complex network is defined as G = V , L , where V = V r o a d V r a i l V w a t e r ; L = L r o a d L r a i l L w a t e r L c r o s s , L c r o s s denotes interlayer edges established between nodes representing different transportation modes, as illustrated in Figure 1.
Freight routing data for road, railway, and waterway transportation systems within China were acquired from the Geographic Information System (GIS) database compiled by Steven Davis et al. [49], with comprehensive coverage of China’s surface transportation infrastructure. Specifically, the China Surface Transport System Database (2020) includes data on motorways, highways, regular railways, and waterways (https://papers.ssrn.com/sol3/papers.cfm?abstract_id=5141849 (accessed on 2 February 2025)). Hong Kong, Macau, and Taiwan are excluded from this study, and the study area encompasses 293 prefecture-level cities, 7 municipality districts, 30 autonomous prefectures, and 3 leagues.

2.2. Network Topological Properties

(1)
Degree and degree distribution
The degree reflects the importance of a node within the network, representing the number of nodes directly connected to it. A prefecture with a higher degree has denser transportation links. The degree distribution p k is defined as the ratio of nodes with degree k to the total number of nodes in the network.
k i = j = 1 i l i j
where k i denotes the degree of node v i ; l i j is the connecting edge between v i and v j ; if v i is concatenated with v j , l i j = 1; otherwise, l i j = 0.
(2)
Average path length
The average path length reflects the overall connectivity and transmission efficiency of the network. In this study, the average path length is represented by the average number of prefectures on the routes from the origin to the destination prefecture. A shorter average path length indicates higher transportation accessibility between prefecture-level administrative regions. The average path length is defined as
d i = 1 N 1 j = 1 , i j N d i j , i = 1 , 2 , , N
where d i denotes the average shortest path length of node v i ; d i j denotes the shortest path length from v i to v j .
(3)
Network diameter
The network diameter measures the size of the network in terms of connectivity. It is defined as the length of the longest shortest path between any two prefecture-level regions, thus reflecting the maximum transportation distance within the network. The network diameter is defined as
D = d max
where D denotes the network diameter; d max denotes the maximum path length between prefectures.
(4)
Clustering coefficient
The clustering coefficient reflects the local cohesiveness of the network, indicating the closeness of a prefecture-level administrative region to its neighbors. The clustering coefficient is defined as
C i = 2 E i V i V i 1 , i = 1 , 2 , , N
where C i denotes the clustering coefficient of node v i ; V i denotes the set of neighboring prefectures of v i ; E i denotes the set of existing direct connections among these neighboring regions.

2.3. Key Node Identification

The PLEA model is used to identify key nodes in the network and assess their significance. This model integrates the complexity of a node’s local structure and the aggregation characteristics of its neighborhood, thus improving the accuracy of key node detection.
Initially, the Local Entropy (LE) of a node is constructed based on Shannon’s information entropy theory to quantify the information contributions of the node and its neighborhood within the network. The local structure entropy of node i in the network is defined as
L E i = j N i p j log p j
where N ( i ) is the set of neighboring nodes of node i; p j = d j k N i d k denotes the normalized degree of neighboring node j in the local network; d j is the degree of node j. This metric captures the uncertainty in the connectivity structure of a node’s neighborhood, with a higher value indicating greater structural complexity and a more critical local topology.
However, LE has limitations in highly clustered networks, particularly when nodes and their neighbors form triadic closures. Specifically, if node i is connected to both node j and node k, it is more likely that an edge also exists between j and k. In such closed triadic structures, the computation of local entropy may redundantly account for these edges, leading to an overestimation of the node’s importance.
To reduce the influence of locally dense structures (e.g., triadic closures) on node importance evaluation, the PLEA model incorporates the clustering coefficient (CC) as a penalty term based on LE, quantifying the degree of interconnectivity among a node’s neighbors. The clustering coefficient of node i is defined as
C C i = 2 e i d i d i 1
where e i denotes the number of actual edges among the neighbors of node i, and d i is its degree. A larger value of C C ( i ) indicates a greater presence of triadic closure structures among the node and its neighbors, reflecting stronger local redundancy; thus, the node’s importance score should be appropriately reduced. The PLE model is defined as follows:
P L E i = L E i C C ( i )
Directly using C C ( i ) as a penalty term may excessively penalize critical nodes within closed-loop structures. Therefore, this study introduces a control coefficient λ to formulate the final PLEA model:
P L E A i = L E ( i ) C C ( i ) , C C ( i ) 1 L E ( i ) λ C C ( i ) , C C ( i ) = 1
The control coefficient λ is defined as λ = 1 d i , where d i is the node degree. This design reduces the penalty on nodes with higher degrees involved in triadic closures, preventing the misclassification of critical nodes. For isolated nodes ( d i = 0 ), P L E A ( i ) = 0 , reflecting the intuitive notion that such nodes have no impact on overall connectivity.

2.4. Network Robustness Analysis

The structural robustness of the transportation network was evaluated under typical random attack (RA) and targeted attack (TA) scenarios. In each scenario, 5% of the nodes are removed at each step until the maximum removal ratio of 100% is reached. Random attacks are simulated by randomly removing a proportion of nodes. Targeted attacks are simulated by sequentially removing a proportion of nodes according to their importance ranking in the network, as determined by the PLEA model. Then, three core network robustness metrics are calculated:
(1)
The largest connected component ratio
The largest connected component ratio is a key indicator of network connectivity. It describes the proportion of nodes in the largest connected subgraph to the total number of nodes in the original network after removing certain proportions of nodes. Its definition is expressed as
S = N N
where N represents the number of nodes in the largest connected component of the network after disruption; N denotes the total number of nodes in the original network.
(2)
Relative network efficiency
Network efficiency measures the global transmission efficiency of a network. It considers both the path lengths and the number of paths between all pairs of nodes, and a higher network efficiency indicates faster and more effective information transmission between nodes. In this study, relative network efficiency is used to characterize the changes in overall network performance following disruptions or structural adjustments, which is defined as
E = 1 N N 1 i j 1 d i j
R E = E E
where E represents the global efficiency of the network after disruption, E denotes the initial global efficiency of the undisturbed network, and N is the number of nodes in the network; d i j represents the shortest path length between node i and node j.
(3)
Comprehensive robustness
A comprehensive robustness metric (R) is introduced to assess transportation network performance under disruptions. By integrating connectivity with efficiency, it combines structural integrity and functional efficiency to reflect a network’s overall resilience following attacks or failures. With a higher R, the network maintains strong connectivity and high operational efficiency following perturbations. The formula of R is as follows:
R = S × R E
where S is he size of the largest connected component, reflecting the structural integrity of the network; RE denotes the relative network efficiency. R measures the network’s ability to maintain efficient information or freight flow while sustaining partial damage, reflecting its functional performance.

2.5. Network Robustness Optimization

To enhance the connectivity and resilience of the integrated transportation network under various disturbance scenarios, this study proposes an edge-addition optimization strategy based on complex network theory. By simulating the network growth process and incorporating node importance and geographical constraints, structural optimization is achieved. The detailed procedure is as follows:
  • Using all prefecture-level administrative regions nationwide as nodes, a candidate edge set covering the entire network was generated, excluding edges that already exist in the original network.
  • Node importance values are calculated based on the PLEA model. High-importance nodes are defined as those ranking within the top 30% of importance scores across the entire network; these nodes typically correspond to transportation hubs or nodes connecting core regions, characterized by high degree and strong connectivity. Low-importance nodes are defined as those in the bottom 30% of importance scores, usually located at the network periphery with fewer connections, lower redundancy, and weaker structural embedding.
  • The importance of candidate edges is evaluated by the sum of the PLEA values of the node pairs, combined with the geographical distance between nodes to construct a priority score. A weighted ranking principle is applied: “higher importance and shorter distance correspond to higher priority,” ensuring that added edges balance structural benefits with real-world constraints.
  • Based on the priority rankings, edges are selected from the candidate set at varying proportions (5%, 10%, and 15%) to conduct two types of edge addition experiments. In the high mode, all added edges connect pairs of high-importance nodes, thereby strengthening the interconnectivity among hubs. In the low mode, added edges connect pairs of low-importance nodes, aiming to improve the connectivity and redundancy of peripheral nodes.
  • The effectiveness of different edge addition proportions and strategies in enhancing network robustness under various disturbance scenarios is comparatively analyzed based on three categories of indicators: S, RE, and R.

3. Results and Discussion

3.1. Network Topology Analysis

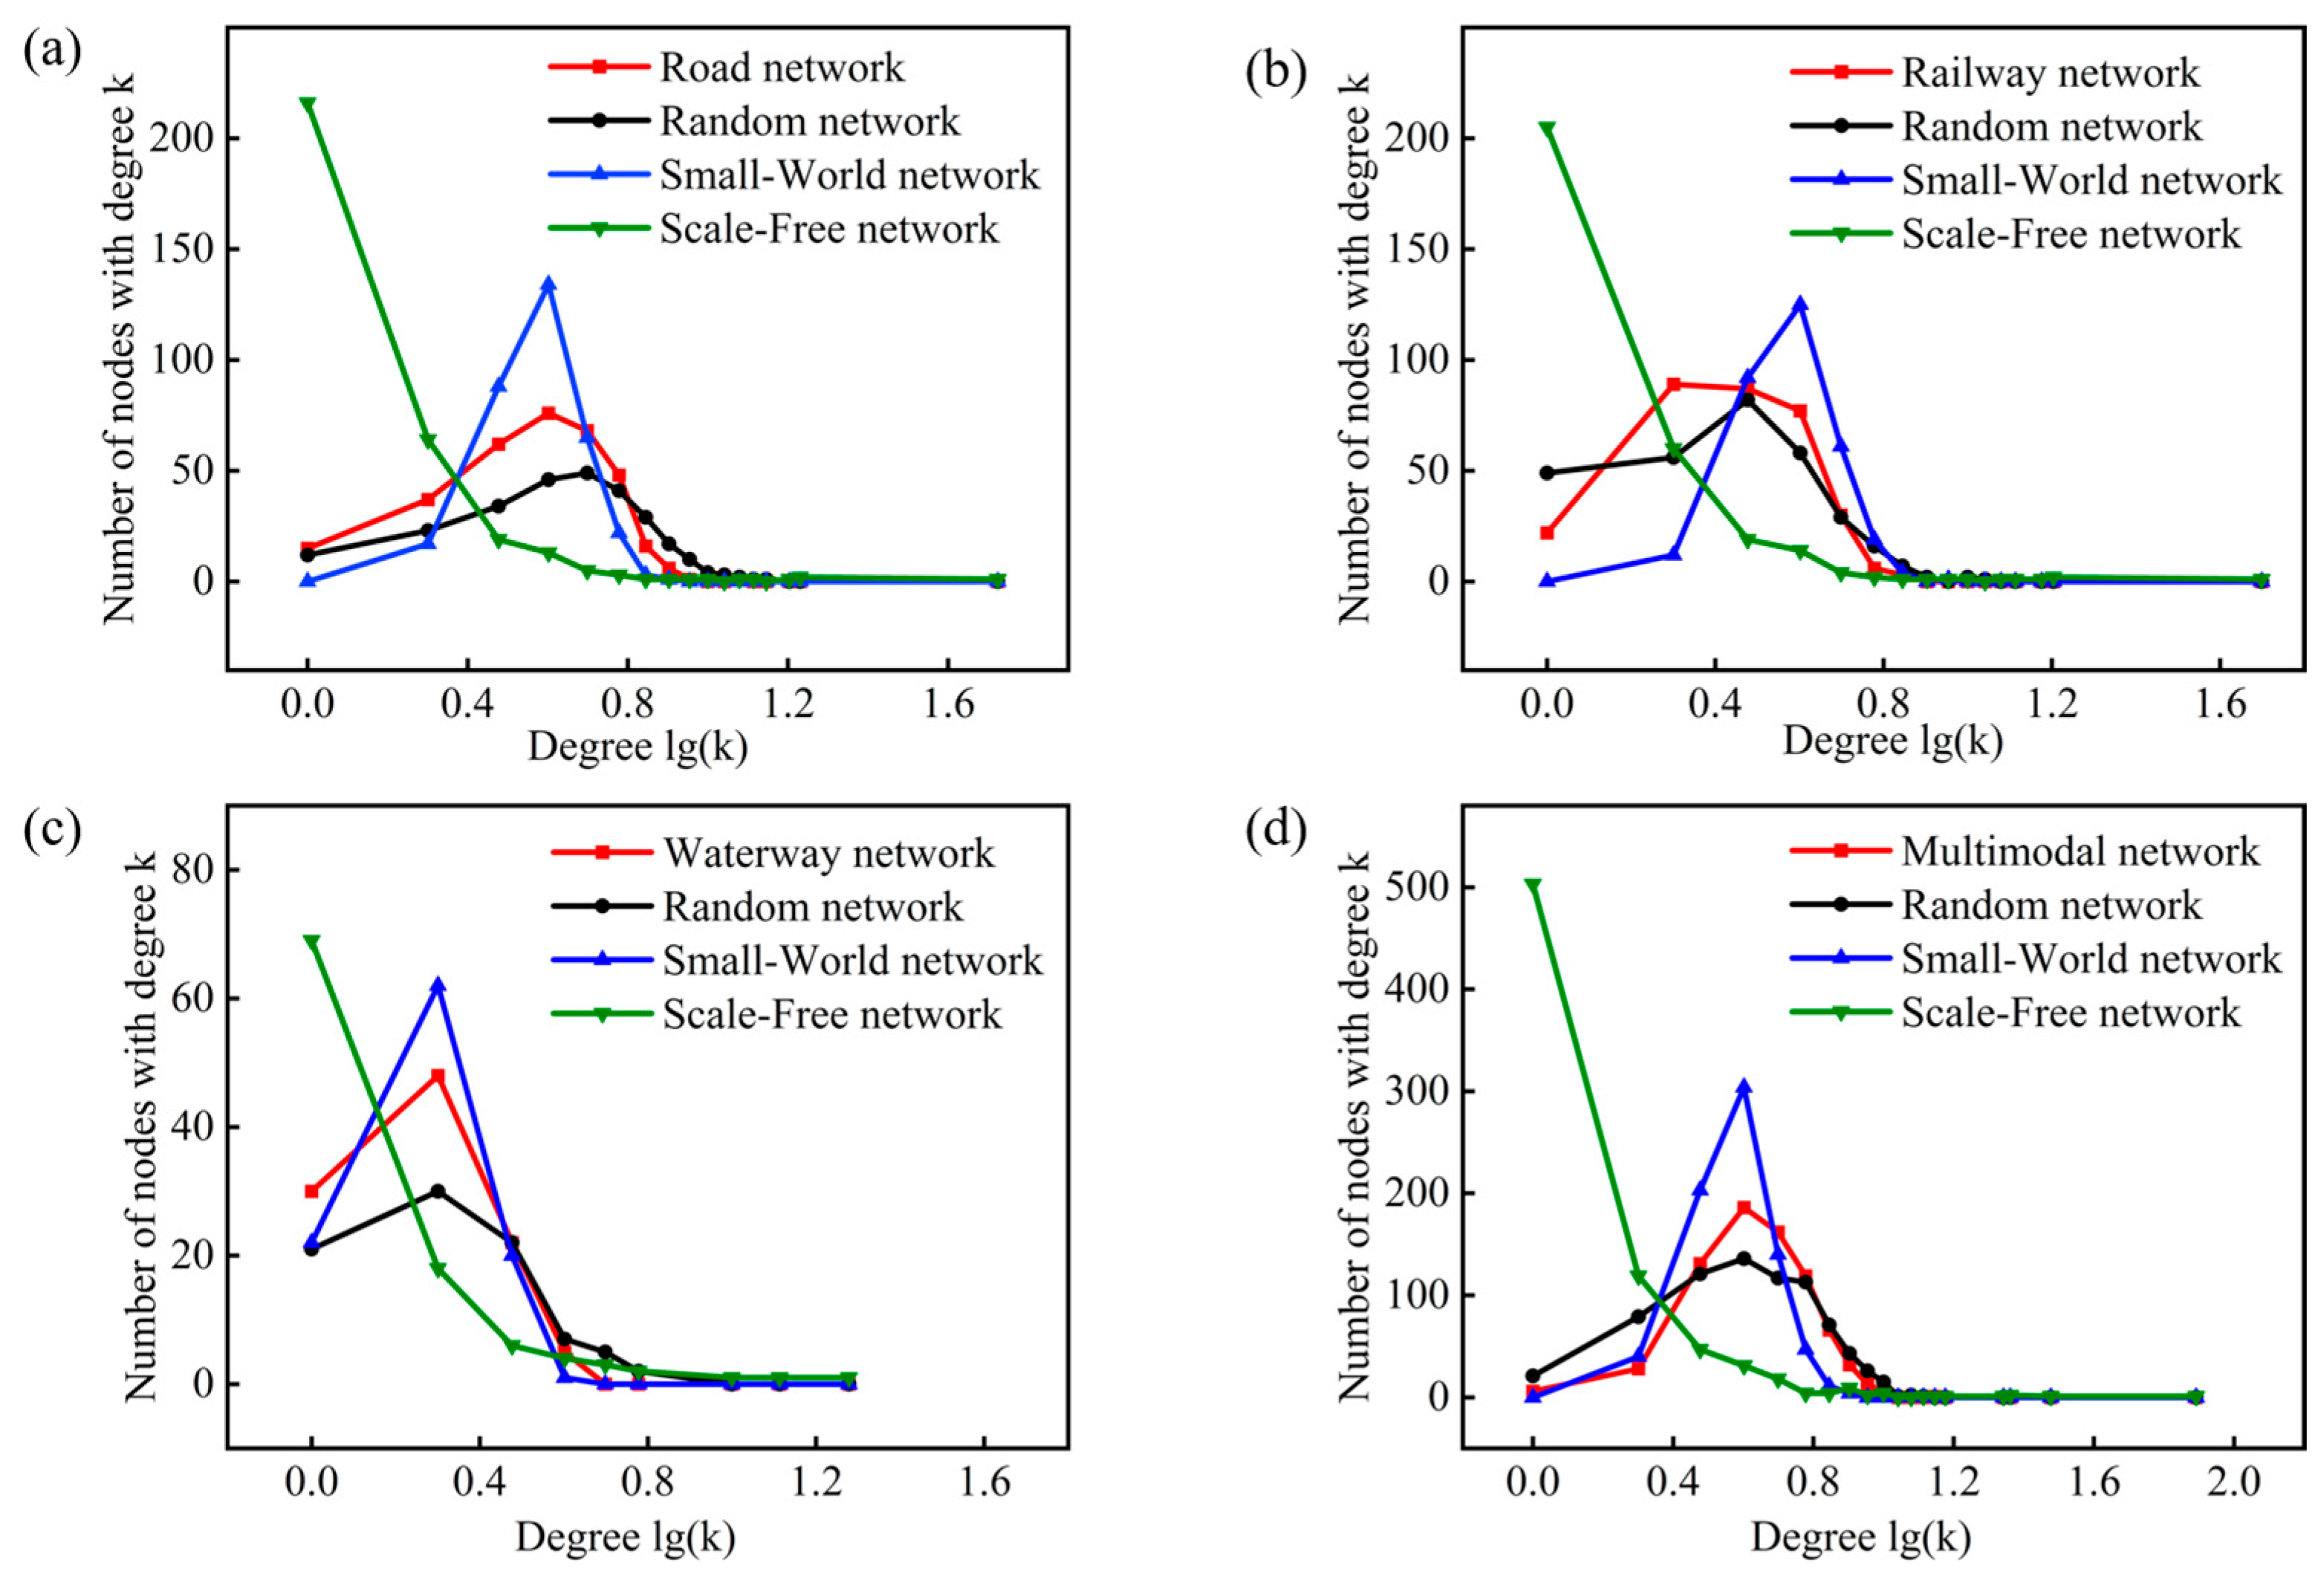
Table 1 presents the topological characteristics of the road, railway, and waterway sub-networks and the integrated transportation network. The integrated network exhibits superior connectivity to any individual sub-network. The average degrees of the road, railway, and waterway sub-networks are 4.2061, 3.1038, and 2.019, while the integrated transportation network has an average degree of 4.8358. Thus, coupling the three transportation modes significantly improves overall connectivity. The average path lengths of the road, railway, and waterway sub-networks are 9.3619, 11.0293, and 8.9334, whereas that of the integrated transportation network is 9.9832. Therefore, even with multimodal coupling, an average of about nine steps is required to travel between cities, and the network maintains high connectivity and transmission efficiency. Figure 2 compares the degree distribution of the road, railway, and waterway sub-networks and the integrated transportation network with that of the classical random, small-world, and scale-free networks. The results indicate that all four transportation networks exhibit typical small-world characteristics, including short average path lengths and high clustering, reflecting the efficiency of transportation and the compactness of regional connections. Further regional analysis, as shown in Table 2, indicates that the integrated transportation networks across the seven major geographic regions (Northeast (NEC), North China (NC), East China (EC), South China (SC), Central China (CC), Southwest (SWC), and Northwest (NWC)) all exhibit small-world characteristics, yet display notable structural differences. EC has the highest number of nodes and edges, with a relatively high average degree, highlighting its scale advantage. However, its longer average path length suggests relatively lower cross-regional transport efficiency. SC and NC show higher clustering coefficients, indicating stronger regional synergy. In contrast, NWC exhibits the weakest connectivity and local clustering, marking it as a potential structural vulnerability. Other regions fall between these extremes in their topological features.

3.2. Key Node Ranking

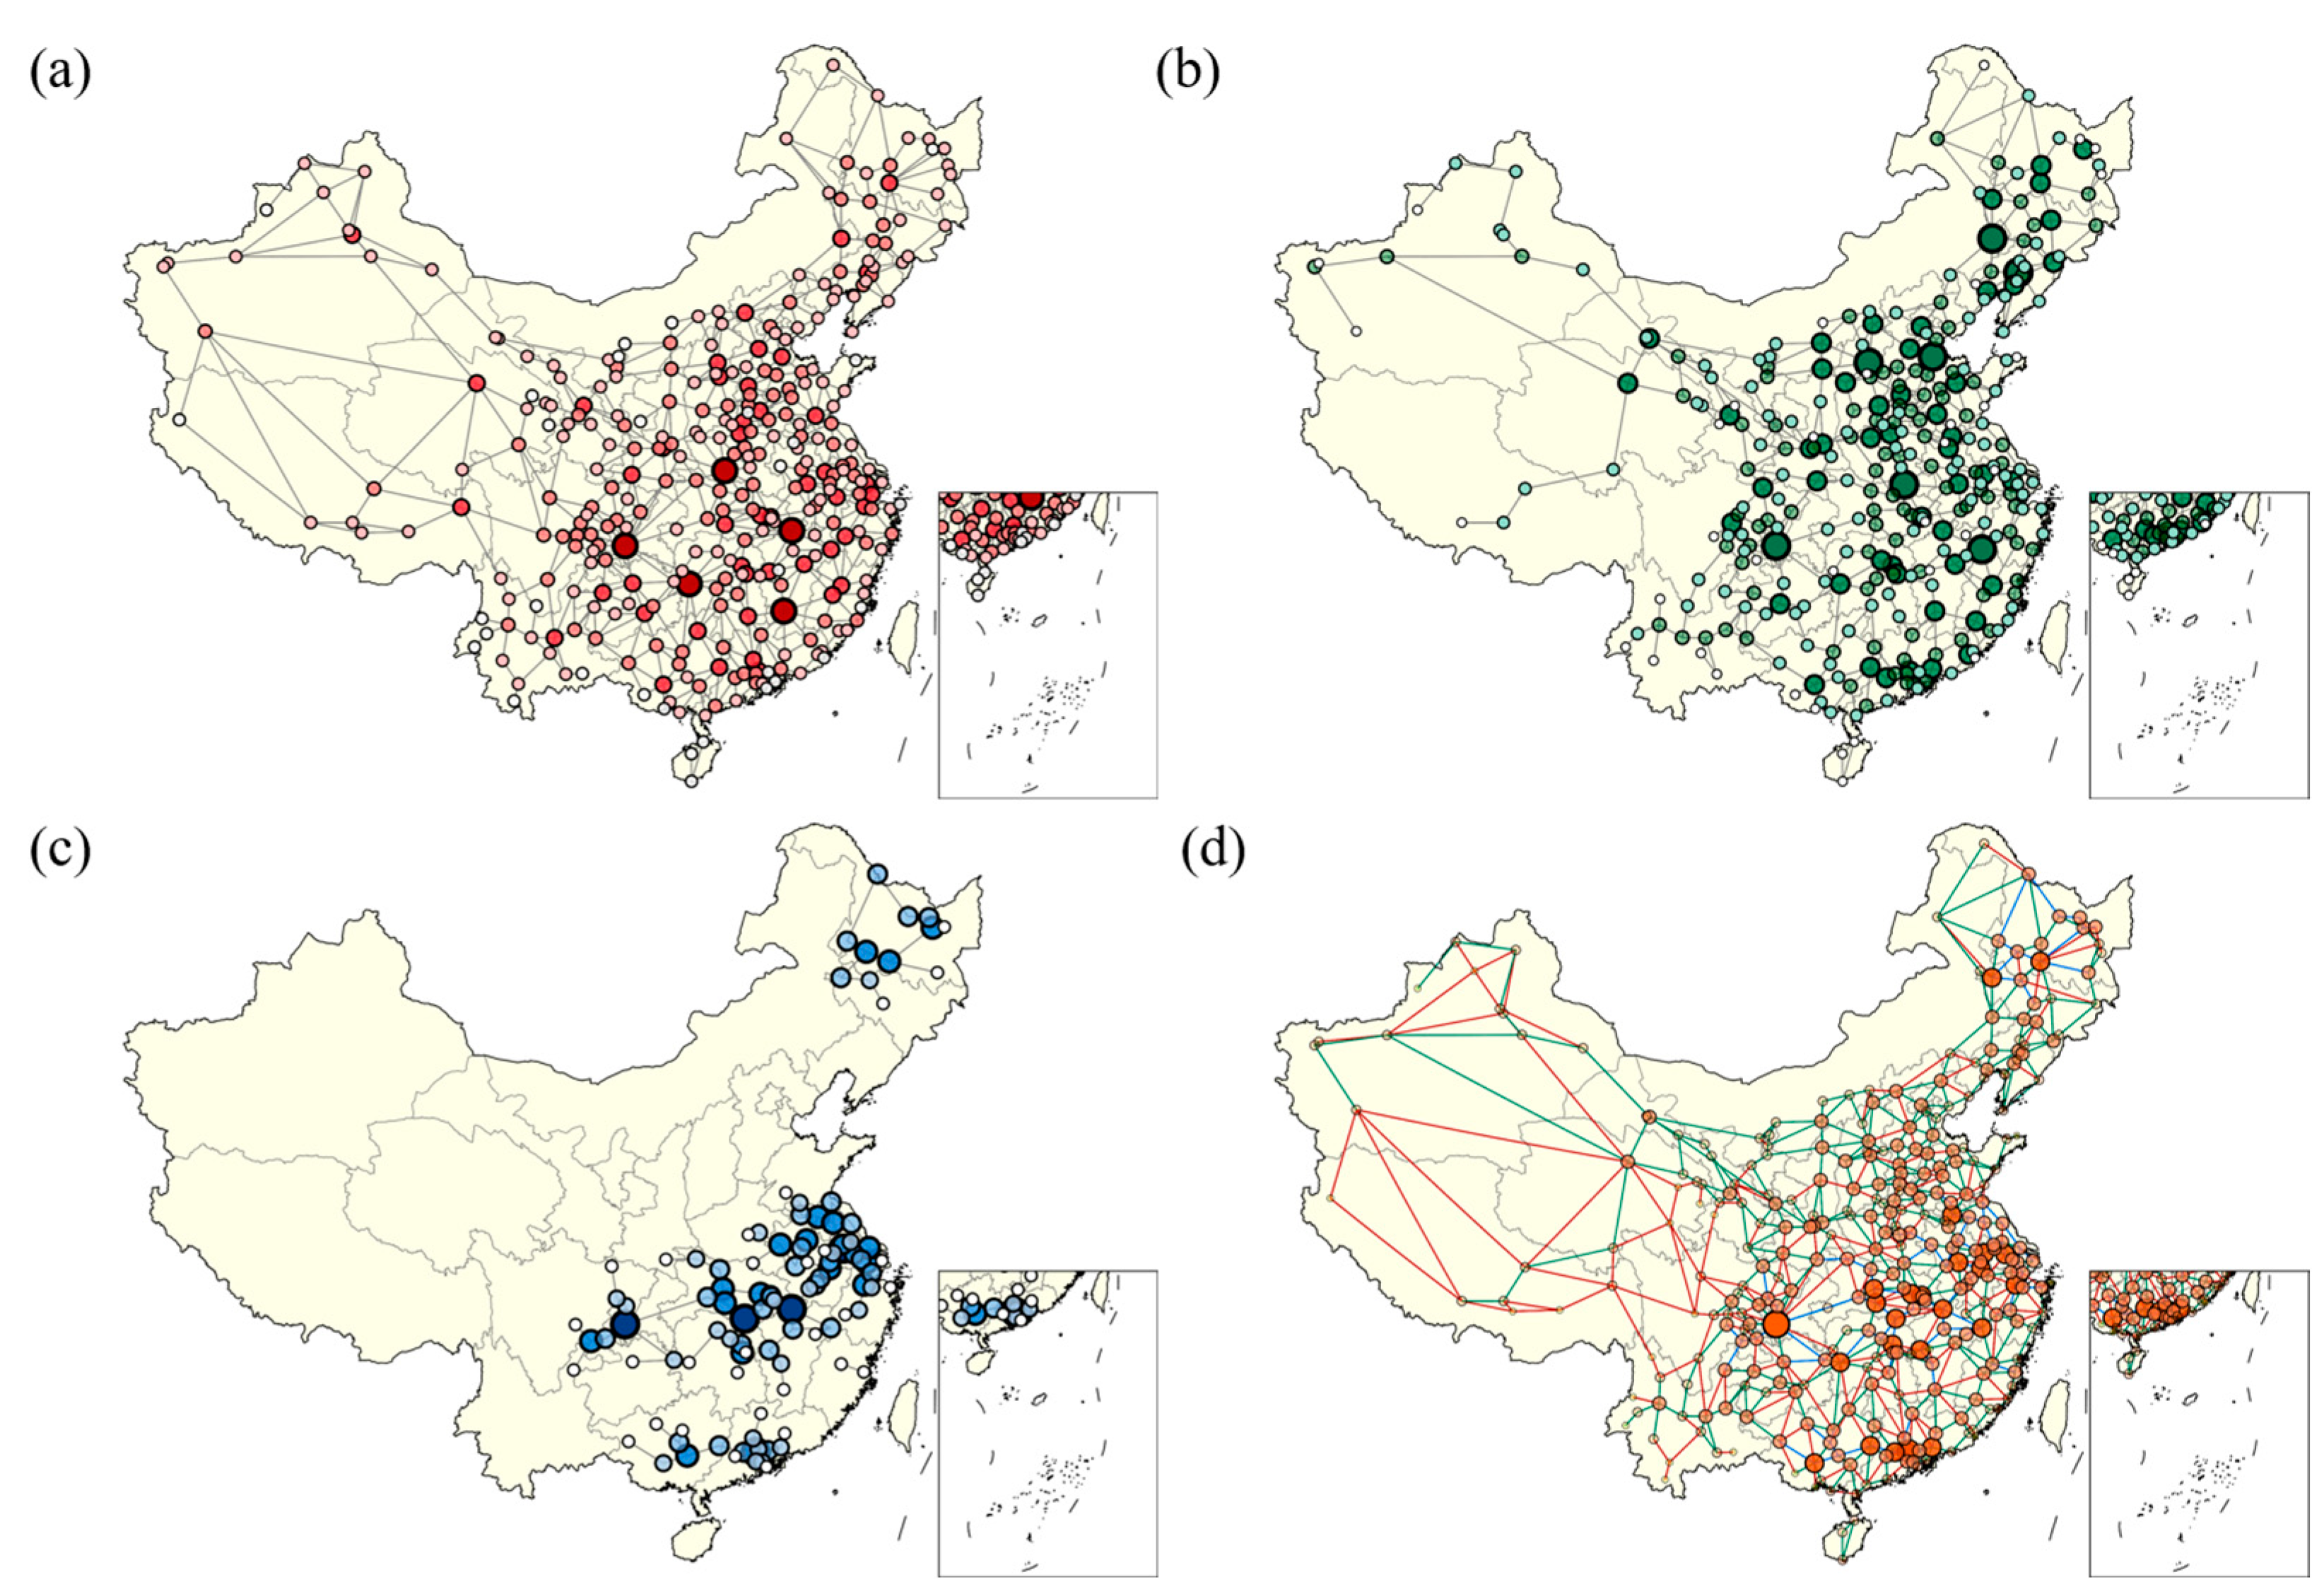
To better analyze hub nodes, key nodes were identified using the PLEA model. Figure 3 shows the spatial distribution of the key nodes across the road, railway, and waterway sub-networks and the integrated transportation network.
The key nodes in the road and railway sub-networks are mainly concentrated in central and western China. For example, Chongqing Municipality ( V P L E A = 3.38 ), Nanyang City ( V P L E A = 2.92 ), and Jiujiang City ( V P L E A = 2.81 ) are key nodes in the road sub-network, and Chongqing Municipality ( V P L E A = 2.70 ), Shenyang City ( V P L E A = 2.61 ), and Xinzhou City ( V P L E A = 2.53 ) are key nodes in the railway sub-network (Table 3). These cities are mostly located at the core of interregional transportation corridors and serve as hubs connecting Southwest China with the central and eastern regions (Figure 3a,b). In contrast, the key nodes of the waterway sub-network are distributed along the main Yangtze River trunk. Among them, Chongqing Municipality ( V P L E A = 2.00 ), Yueyang City ( V P L E A = 1.97 ), and Foshan City ( V P L E A = 1.97 ) serve as core nodes (Table 2). Therefore, the crucial hubs of inland water transportation are mainly concentrated in the middle and lower reaches of the Yangtze River (Figure 3c). The key nodes in the integrated transportation network coupling the three transportation modes show a multi-centered clustering pattern in central and western China, the middle and lower reaches of the Yangtze River, and northeastern China (Figure 3d). Chongqing Municipality ( V P L E A = 8.88 ), Jiujiang City ( V P L E A = 8.02 ), and Shangrao City ( V P L E A = 7.73 ) rank high (Table 3), reflecting their significant roles as multimodal hubs for efficient interconnection and resource integration across multiple transportation modes. Notably, Chongqing Municipality is a top-ranking key node across all sub-networks and the integrated transportation network, demonstrating its strong coupling and coordination capabilities among road, railway, and waterway transportation modes. Chongqing also serves as a core city for the integrated transportation network. Its prominent node status suggests that enhancing the comprehensive service capacity and hub functions of such core nodes can further improve the robustness and resource allocation of future transportation networks.
Notably, some economically advanced prefecture-level cities do not occupy prominent positions as key nodes in the integrated transportation network (e.g., Wuhan City). This is mainly due to their geographic locations and limited direct neighboring connections, resulting in less hub significance in the network topology than other regional nodes. Future research may construct weighted transportation network models incorporating functional indicators such as regional economic output and freight flow. By integrating structural and functional aspects, key nodes can be identified with more comprehensive considerations, thus providing more effective decision support for transportation resource allocation and infrastructure planning.
To further validate the effectiveness of the PLEA model in identifying key nodes, its performance was compared with four centrality metrics (DC, CC, EC, and BC). The evaluation is based on the changes in R after proportional node removal, as shown in Figure 4. The overall key node identification performance of the PLEA model significantly exceeds the centrality metrics (DC, BC, CC, and EC). The consistent ranking of the five methods across attack strategies (PLEA > DC > BC > CC > EC) demonstrates PLEA’s stronger performance. Specifically, the road, railway, and waterway sub-networks showed similar trends. After removing the key nodes identified by PLEA, R declined far more rapidly, demonstrating that the PLEA model can more effectively locate nodes with the greatest impact on network functionality (Figure 4a,c). In the integrated transportation network (Figure 4d), removing the top 35% of nodes identified by PLEA nearly collapses the network, nearly reducing R to zero. In contrast, networks collapse only after removing approximately 55%, 100%, 45%, and 100% of nodes identified based on BC, CC, DC, and EC, respectively. These results demonstrate the accuracy of PLEA for identifying important nodes. Removing the identified nodes causes more damage to the network, even when the network has complex features, such as geographic limits, uneven structure, and different transportation modes. Therefore, PLEA is useful for finding weak points and protecting key nodes in transportation networks.

3.3. Robustness Evaluation

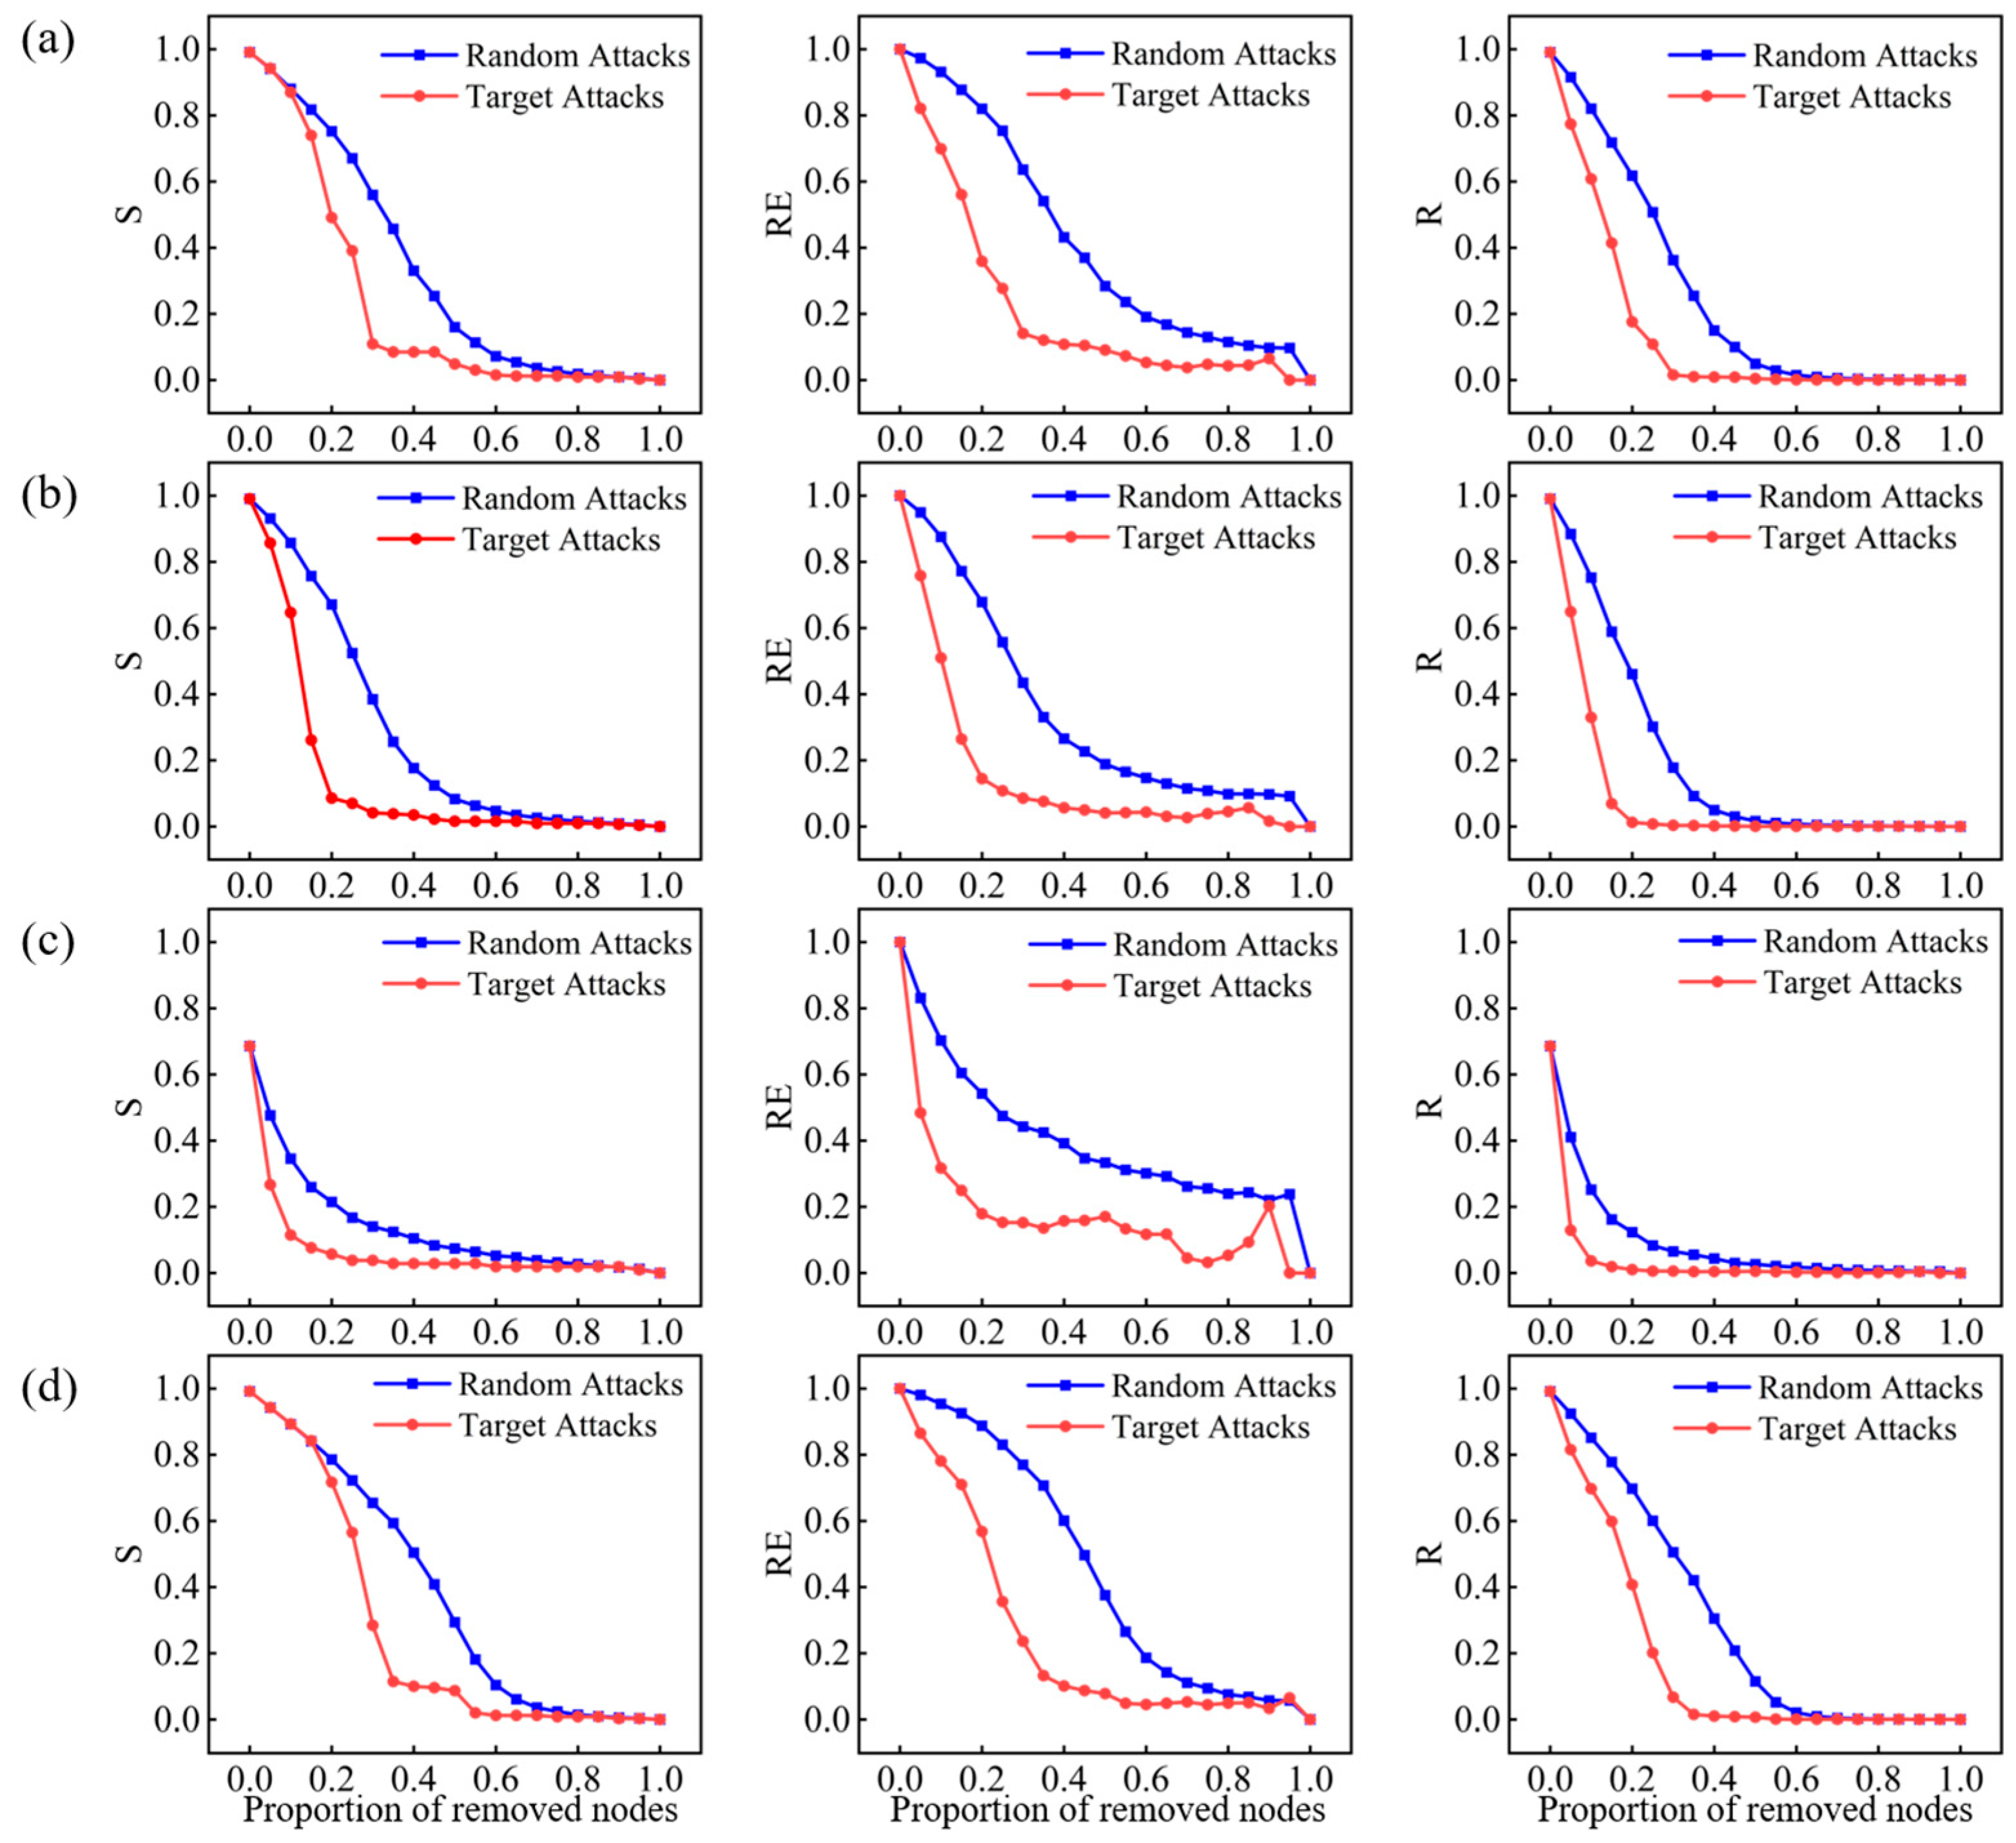
Figure 5 shows the variation trends of the largest connected component (S), relative efficiency (RE), and comprehensive robustness (R) of the transportation network under random attacks (RA) and targeted attacks (TA). The results indicate that the integrated transportation network demonstrates greater robustness than the sub-networks across all three metrics. Under the RA scenario with 50% of the nodes removed, the R of the road, railway, and waterway sub-networks drops to 0, and the networks almost collapse. However, the R of the integrated transportation network remains at 0.1. Under the TA scenario, the R of the road, railway, and waterway sub-networks drops to 0 when 25%, 10%, and 10% of the nodes are removed, respectively. In comparison, the integrated transportation network does not collapse until about 40% of the nodes are removed. These results show that combining different transportation modes can effectively improve the robustness of the transportation network.
As the node removal ratio increases, the network collapses much faster under TA than under RA. For the networks to collapse (R = 0) under RA, the road, railway, and waterway sub-networks and the integrated transportation network must lose 60%, 45%, 50%, and 65% of their nodes, respectively. However, removing only 30%, 15%, 10%, and 40% of the nodes, respectively, in the TA scenario is enough to collapse the networks. This is due to the small-world characteristics of the networks, with most nodes efficiently connected through a small number of key hubs. Therefore, the network can retain good connectivity and stable function under RA. Nevertheless, removing key nodes under TA quickly weakens the network structure. As a result, the network can still maintain relatively high overall connectivity and functional stability even with the failure of some nodes.
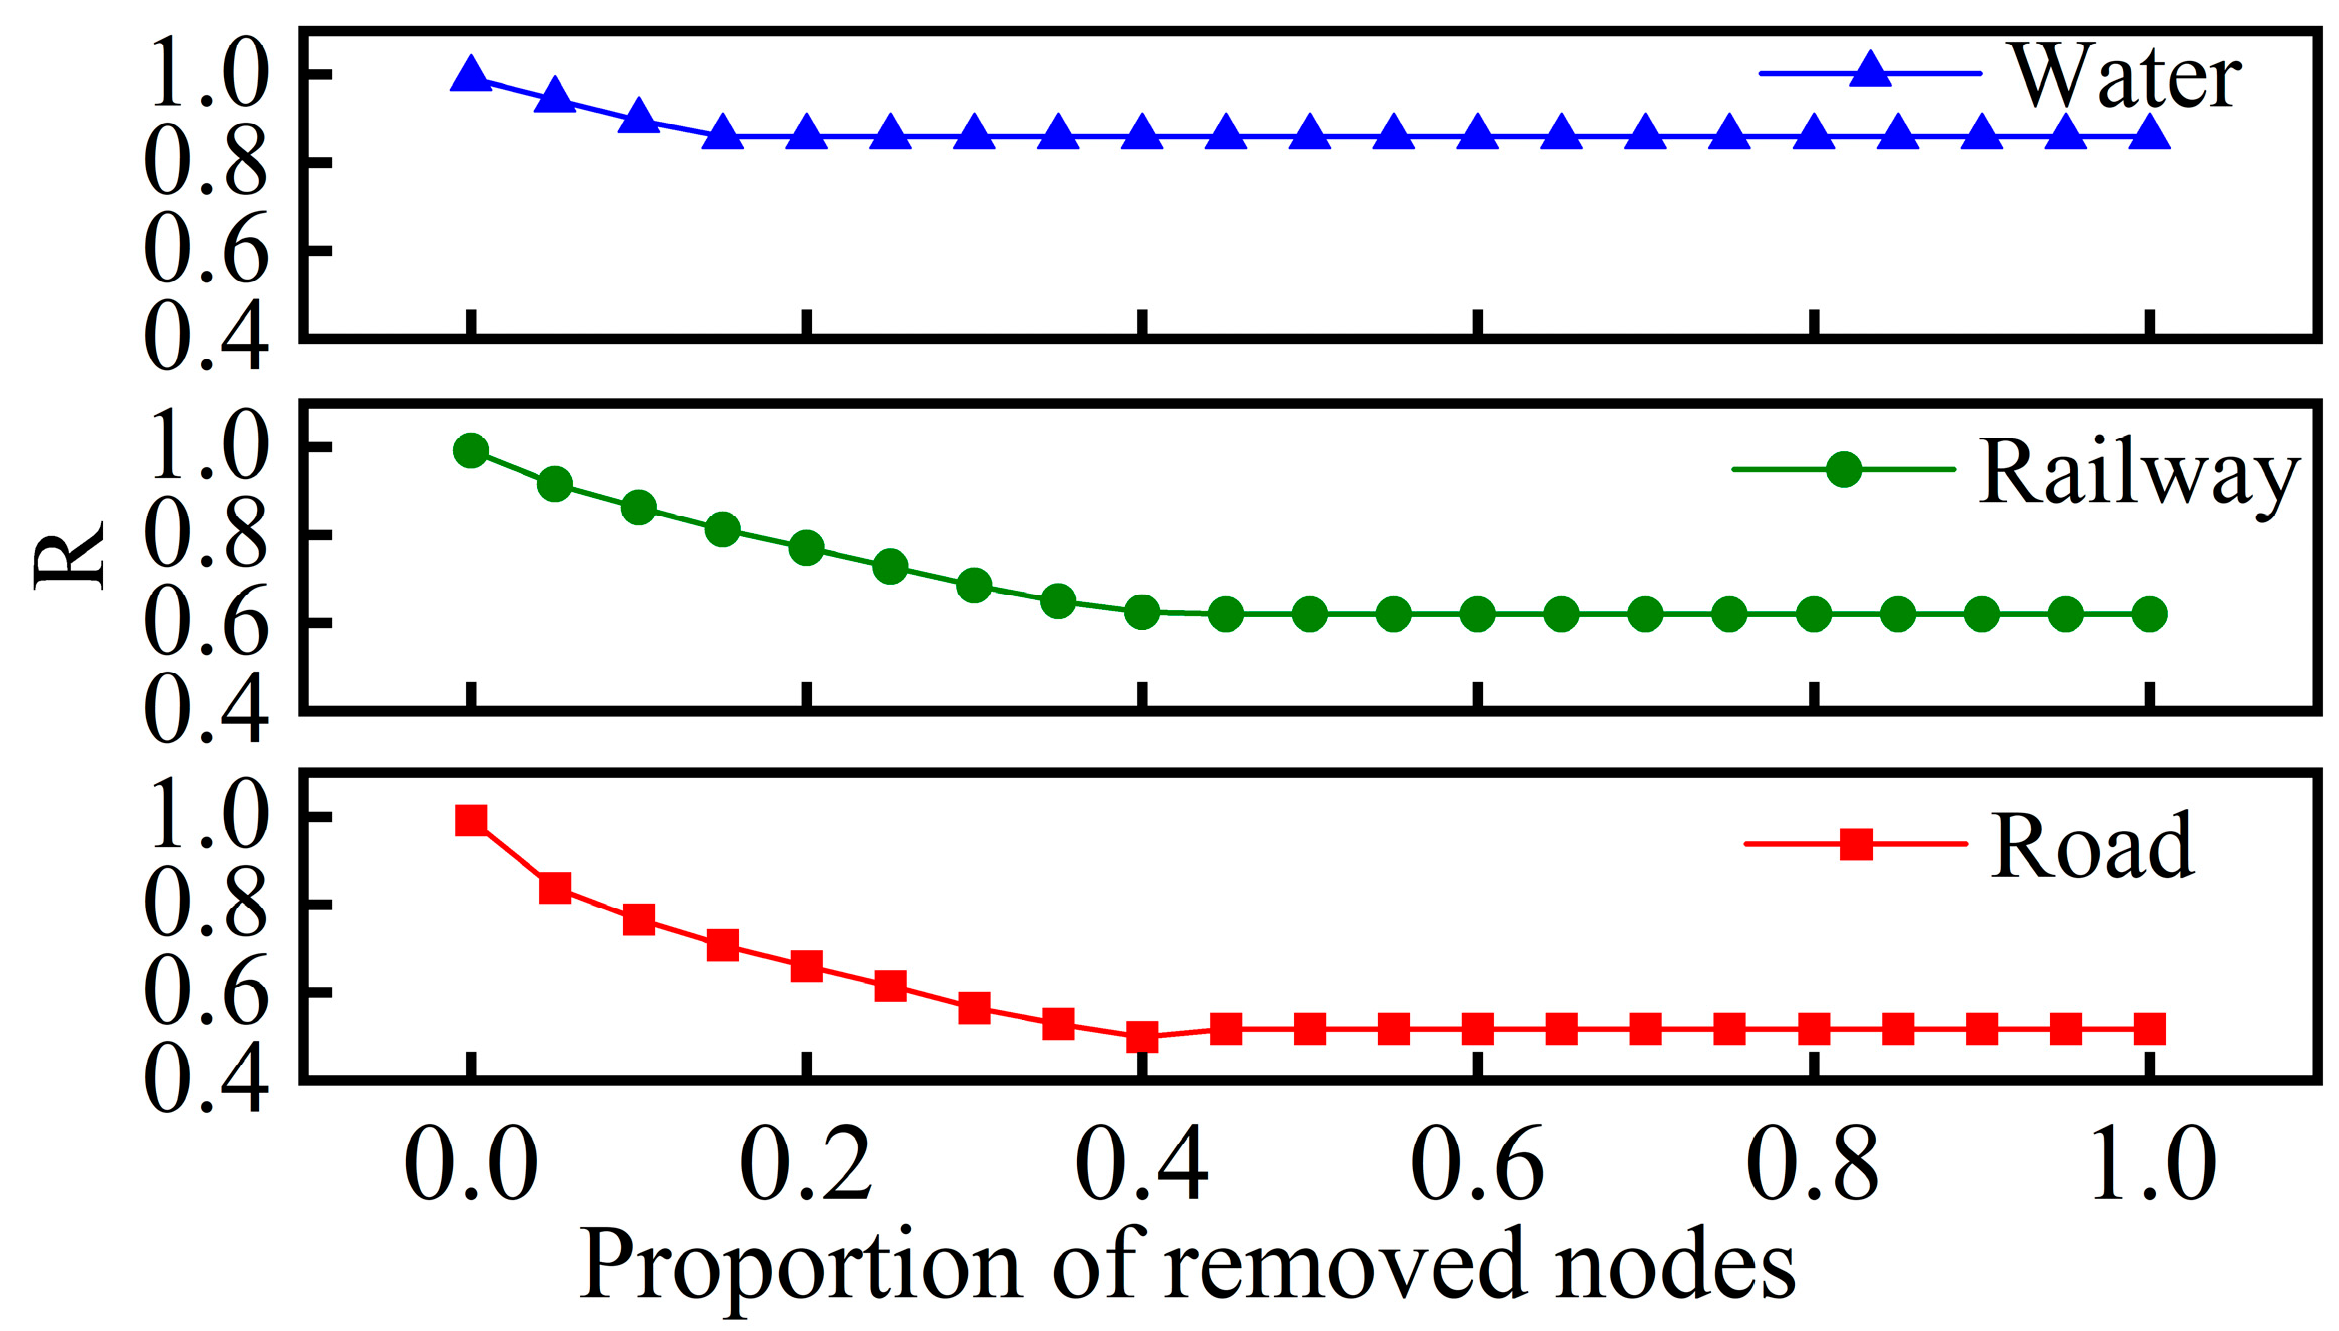
The effects of the three transportation modes, namely, road, railway, and waterway, on the robustness of the integrated transportation network are further explored. Figure 6 presents the impact of removing the road, railway, and waterway sub-networks on the robustness of the integrated transportation network. Removing the road sub-network has the most significant impact, causing the robustness of the integrated transportation network to drop to 0.52. With the railway or waterway sub-network removed, the robustness is 0.62 and 0.86, respectively. Therefore, the road sub-network plays a key role in the overall network structure, and its integrity is important for maintaining the robustness of the integrated transportation network.
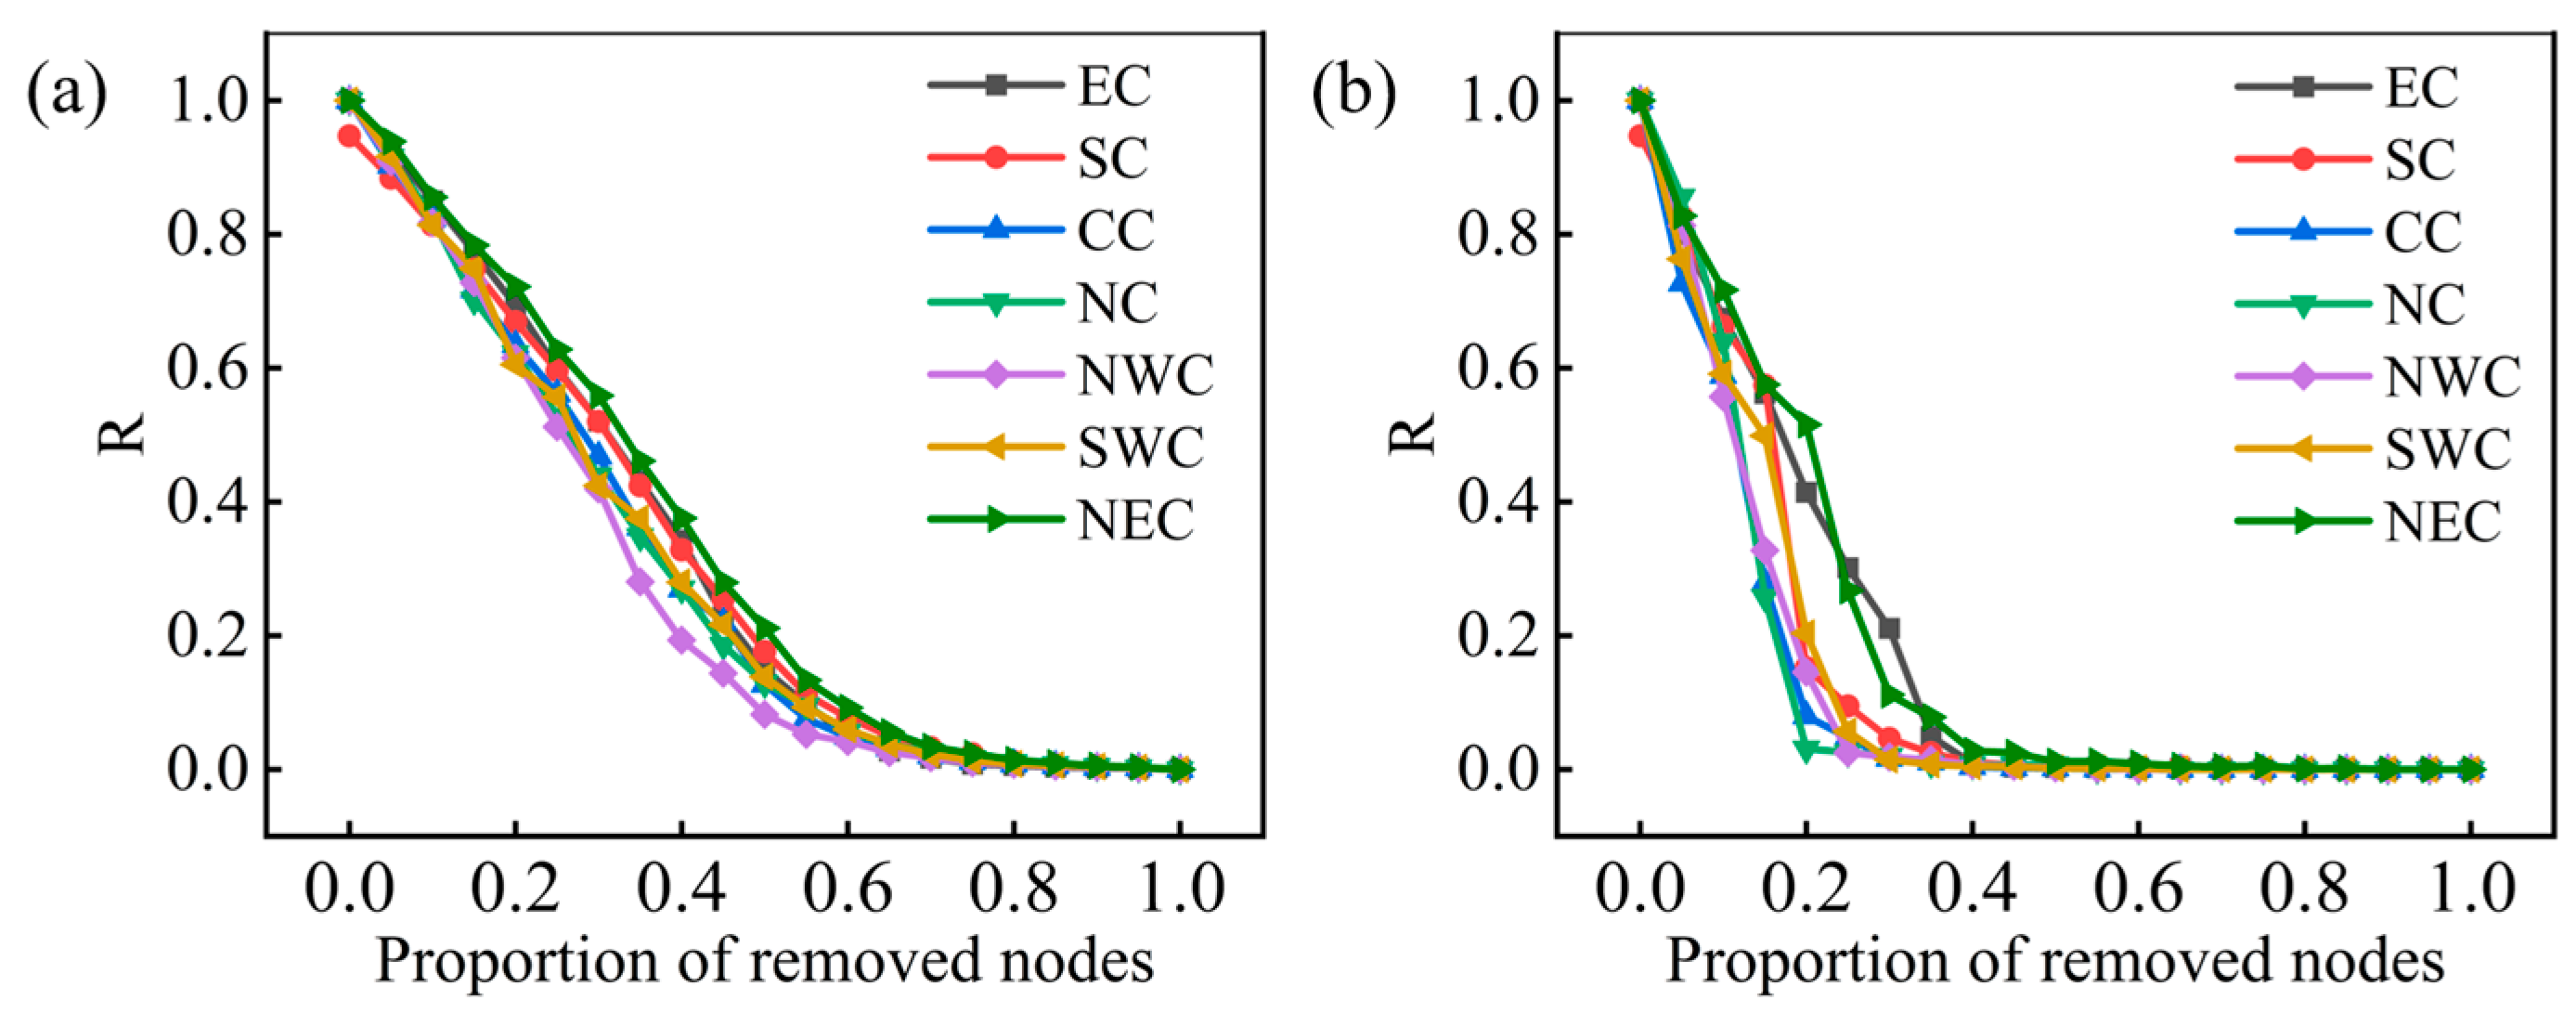
Considering that structural differences across regions may lead to significant variations in disturbance tolerance, this study further evaluates the robustness of the integrated transportation networks in the seven major regions. The results are presented in Figure 7. The figure illustrates how the integrated robustness index R changes with increasing proportions of node removal under random attack (RA) and targeted attack (TA) scenarios for each region. Overall, all regional networks exhibit strong stability under random attacks, maintaining a certain level of connectivity even after more than 40% of nodes are removed. In contrast, robustness declines much more rapidly under targeted attacks. This vulnerability is primarily attributed to the small-world characteristics shared by all seven regions. In terms of regional comparison, EC and NEC demonstrate the best performance under both attack scenarios. The observed differences in robustness are related to topological characteristics, as regions with higher average degree and redundancy tend to exhibit stronger resistance to failure. After the removal of 20% of critical nodes, the robustness index R remains at 0.414 and 0.515 for EC and NEC, respectively. This resilience can be attributed to their relatively high average degrees (4.64 and 4.40) and number of edges (531 and 207). NC and CC exhibit relatively weak robustness, with connectivity dropping to 0.026 and 0.08, respectively, after the removal of 15% of nodes. This is primarily due to the high concentration of critical nodes and long network diameters (13 and 15). NWC exhibits the weakest robustness, with the lowest average degree (3.63) and a clustering coefficient of only 0.087, resulting in near-total collapse in the later stages. In SC, the robustness index R drops to just 0.152 after 20% of nodes are removed. The results indicate that the concentration of critical nodes and the underlying network structure are key determinants of resilience against targeted attacks, rather than network size alone. Regional disparities in robustness not only affect local transportation security but may also create bottlenecks in interregional connectivity, posing potential risks to the resilience of the national transportation network. Priority should be given to enhancing redundancy and protecting critical nodes in NWC and SC.
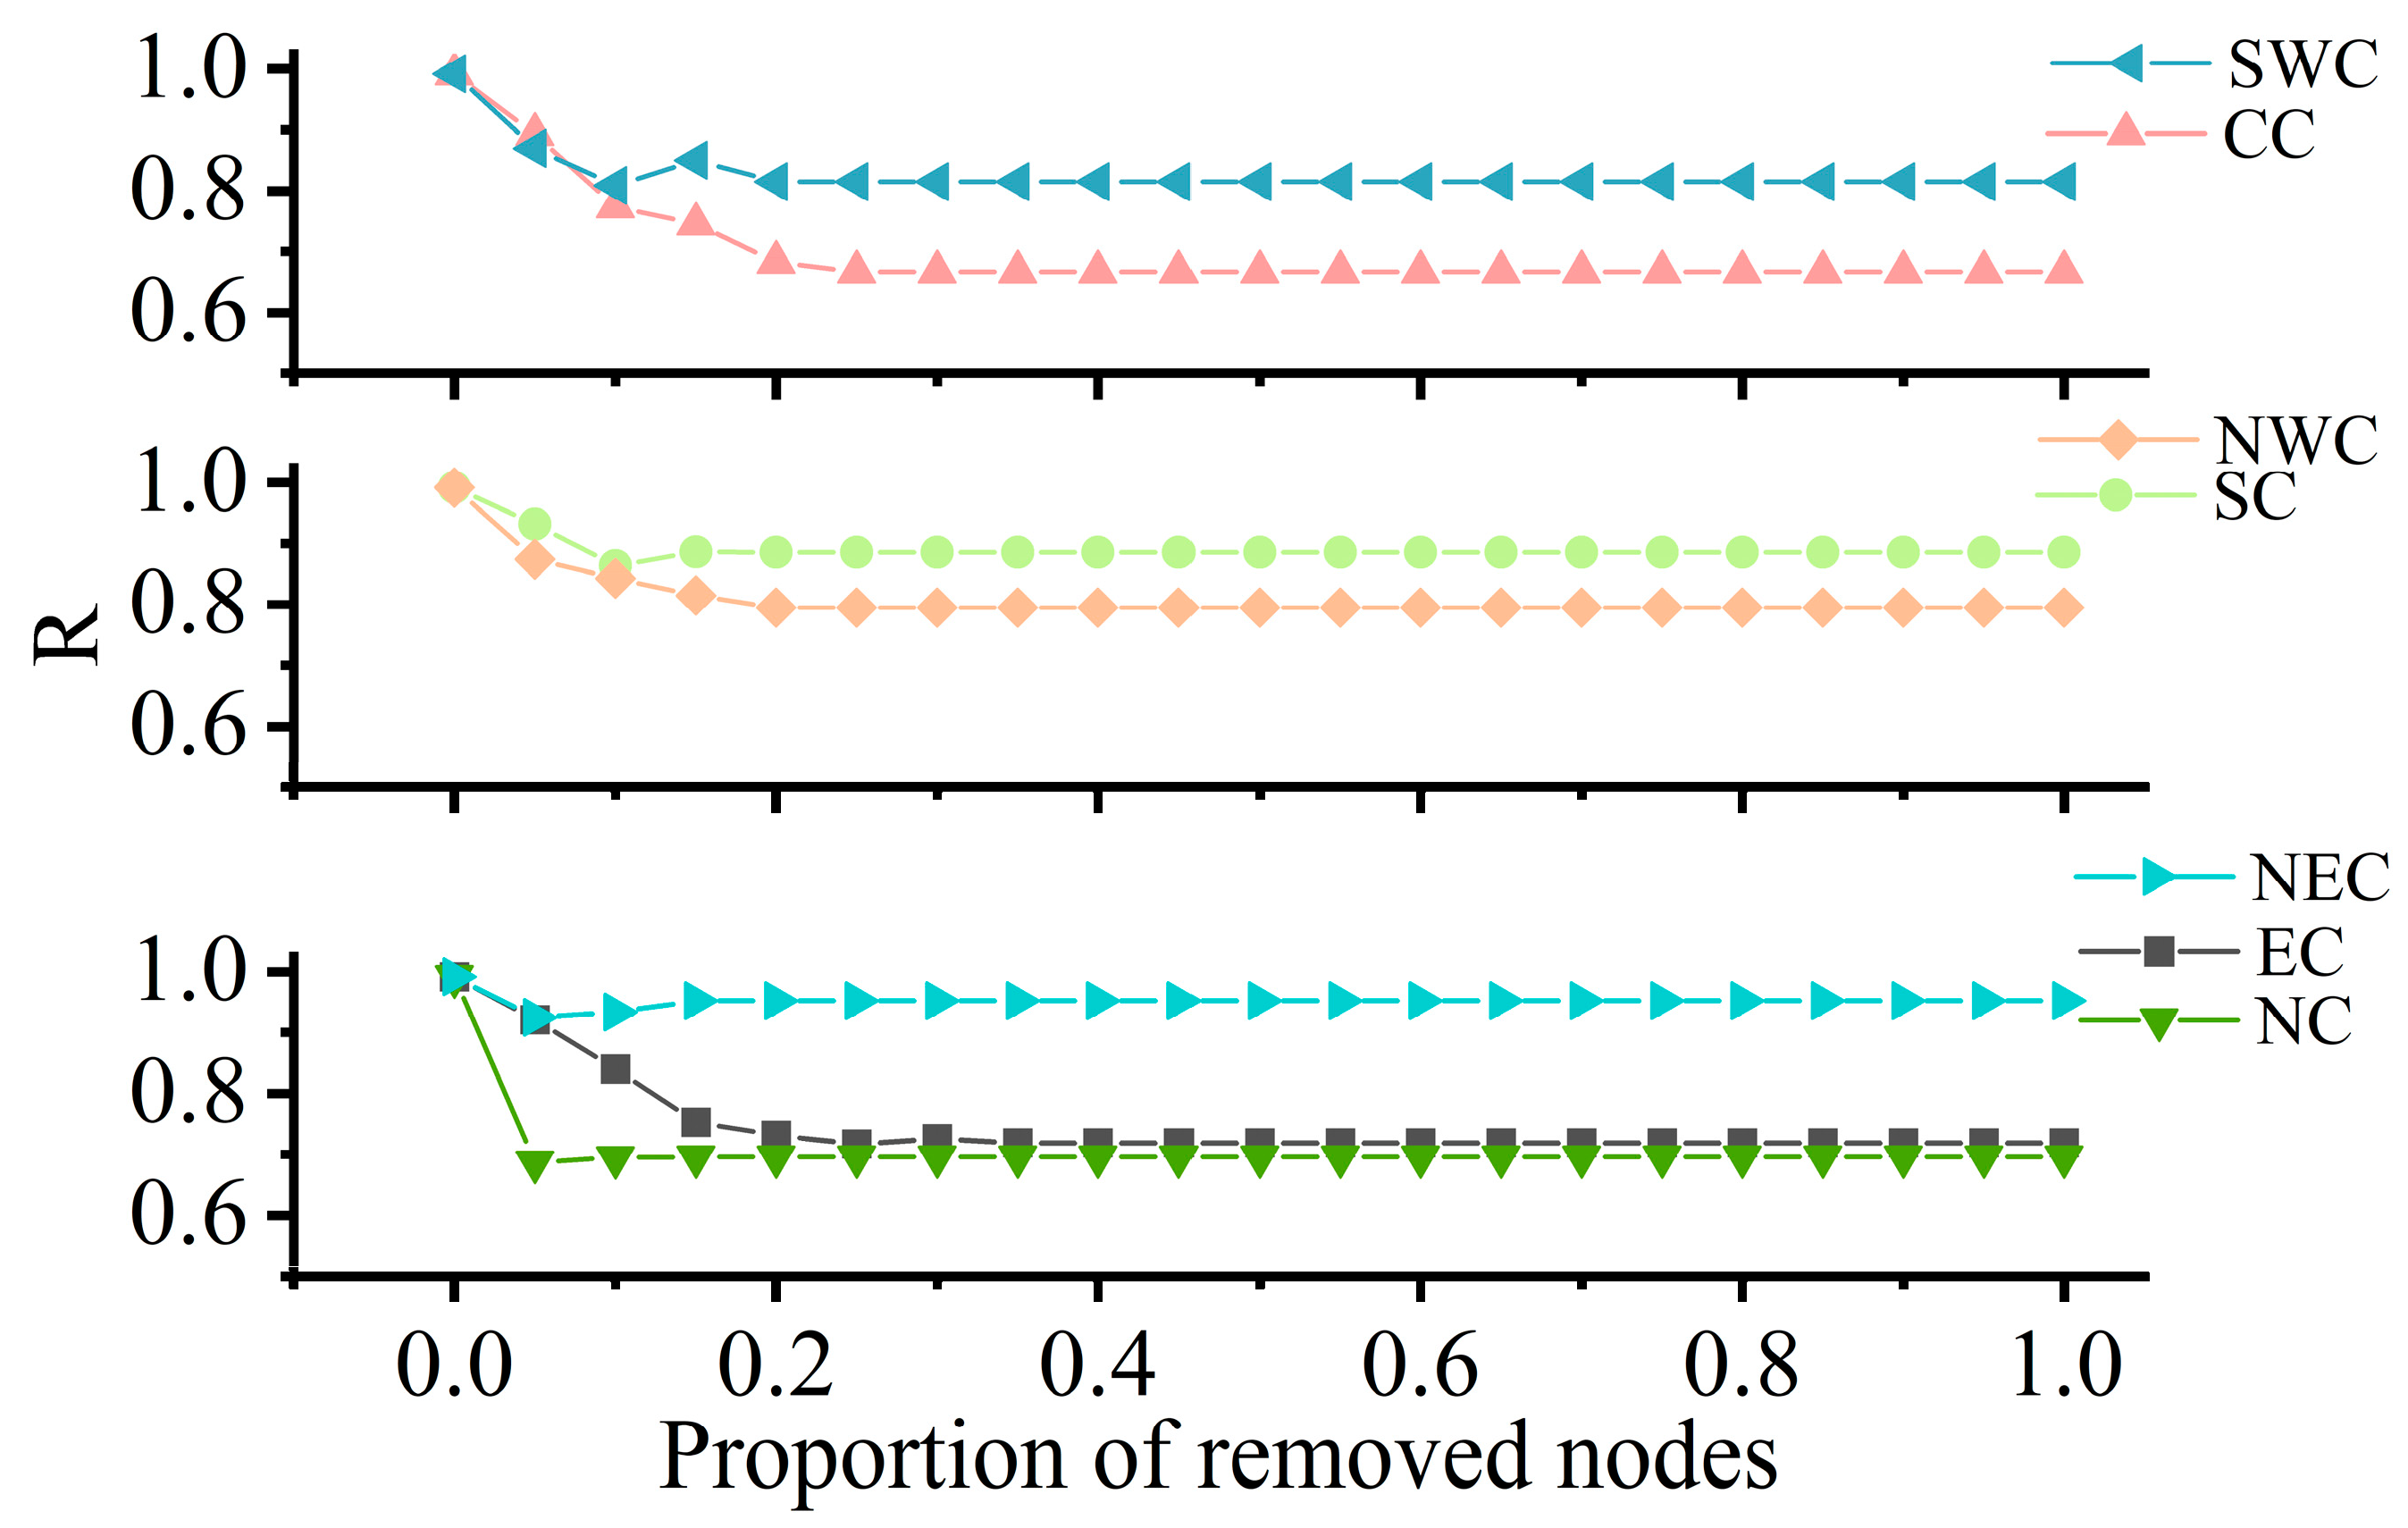
To further analyze the impact of each region on the overall robustness of the integrated transportation network, Figure 8 illustrates the changes in the comprehensive robustness index R after the removal of each of the seven major regions. The results show that NC has the greatest impact on the national network, with R rapidly decreasing to 0.695 following its removal, representing a 27.5 percent decline. This highlights its critical role as a central hub in the national transportation system. CC and SC follow, with robustness index R stabilizing at approximately 0.667 and 0.886, respectively, after their removal. This indicates that both regions play a relatively important role in maintaining national connectivity. In contrast, the impact of NWC and SWC is comparatively limited. Even after complete removal, the robustness index R remains in the range of 0.795 to 0.815, reflecting a higher level of redundancy for these regions within the national network. NEC shows the least impact, with R remaining stable at 0.952, indicating minimal sensitivity within the national network. This reflects underlying differences in regional structure and spatial function. NC and CC serve as core hubs linking the eastern coast with central and western regions, as well as key north–south corridors. Their failure disrupts multiple major interregional routes and significantly reduces network robustness. In contrast, NEC and NWC are peripheral regions with fewer nodes and limited connectivity, so their removal has minimal impact on the national network. Both EC and NEC exhibit high average degrees of 4.64 and 4.40, along with numerous redundant paths, which help maintain connectivity after node loss. However, NC and CC contain concentrated critical nodes and have large network diameters of 13 and 15, increasing their vulnerability. Economic corridors and transportation layouts further exacerbate these differences. The Beijing–Tianjin–Hebei and Central China regions handle substantial cross-regional traffic, where structural weaknesses combined with high flow volumes make failures likely to trigger cascading nationwide effects. Overall, regional influence on national robustness depends on redundancy, spatial position, and hub function. Efforts should prioritize enhancing connectivity among NC, CC, and SC while strengthening redundancy in peripheral areas to mitigate systemic risks.
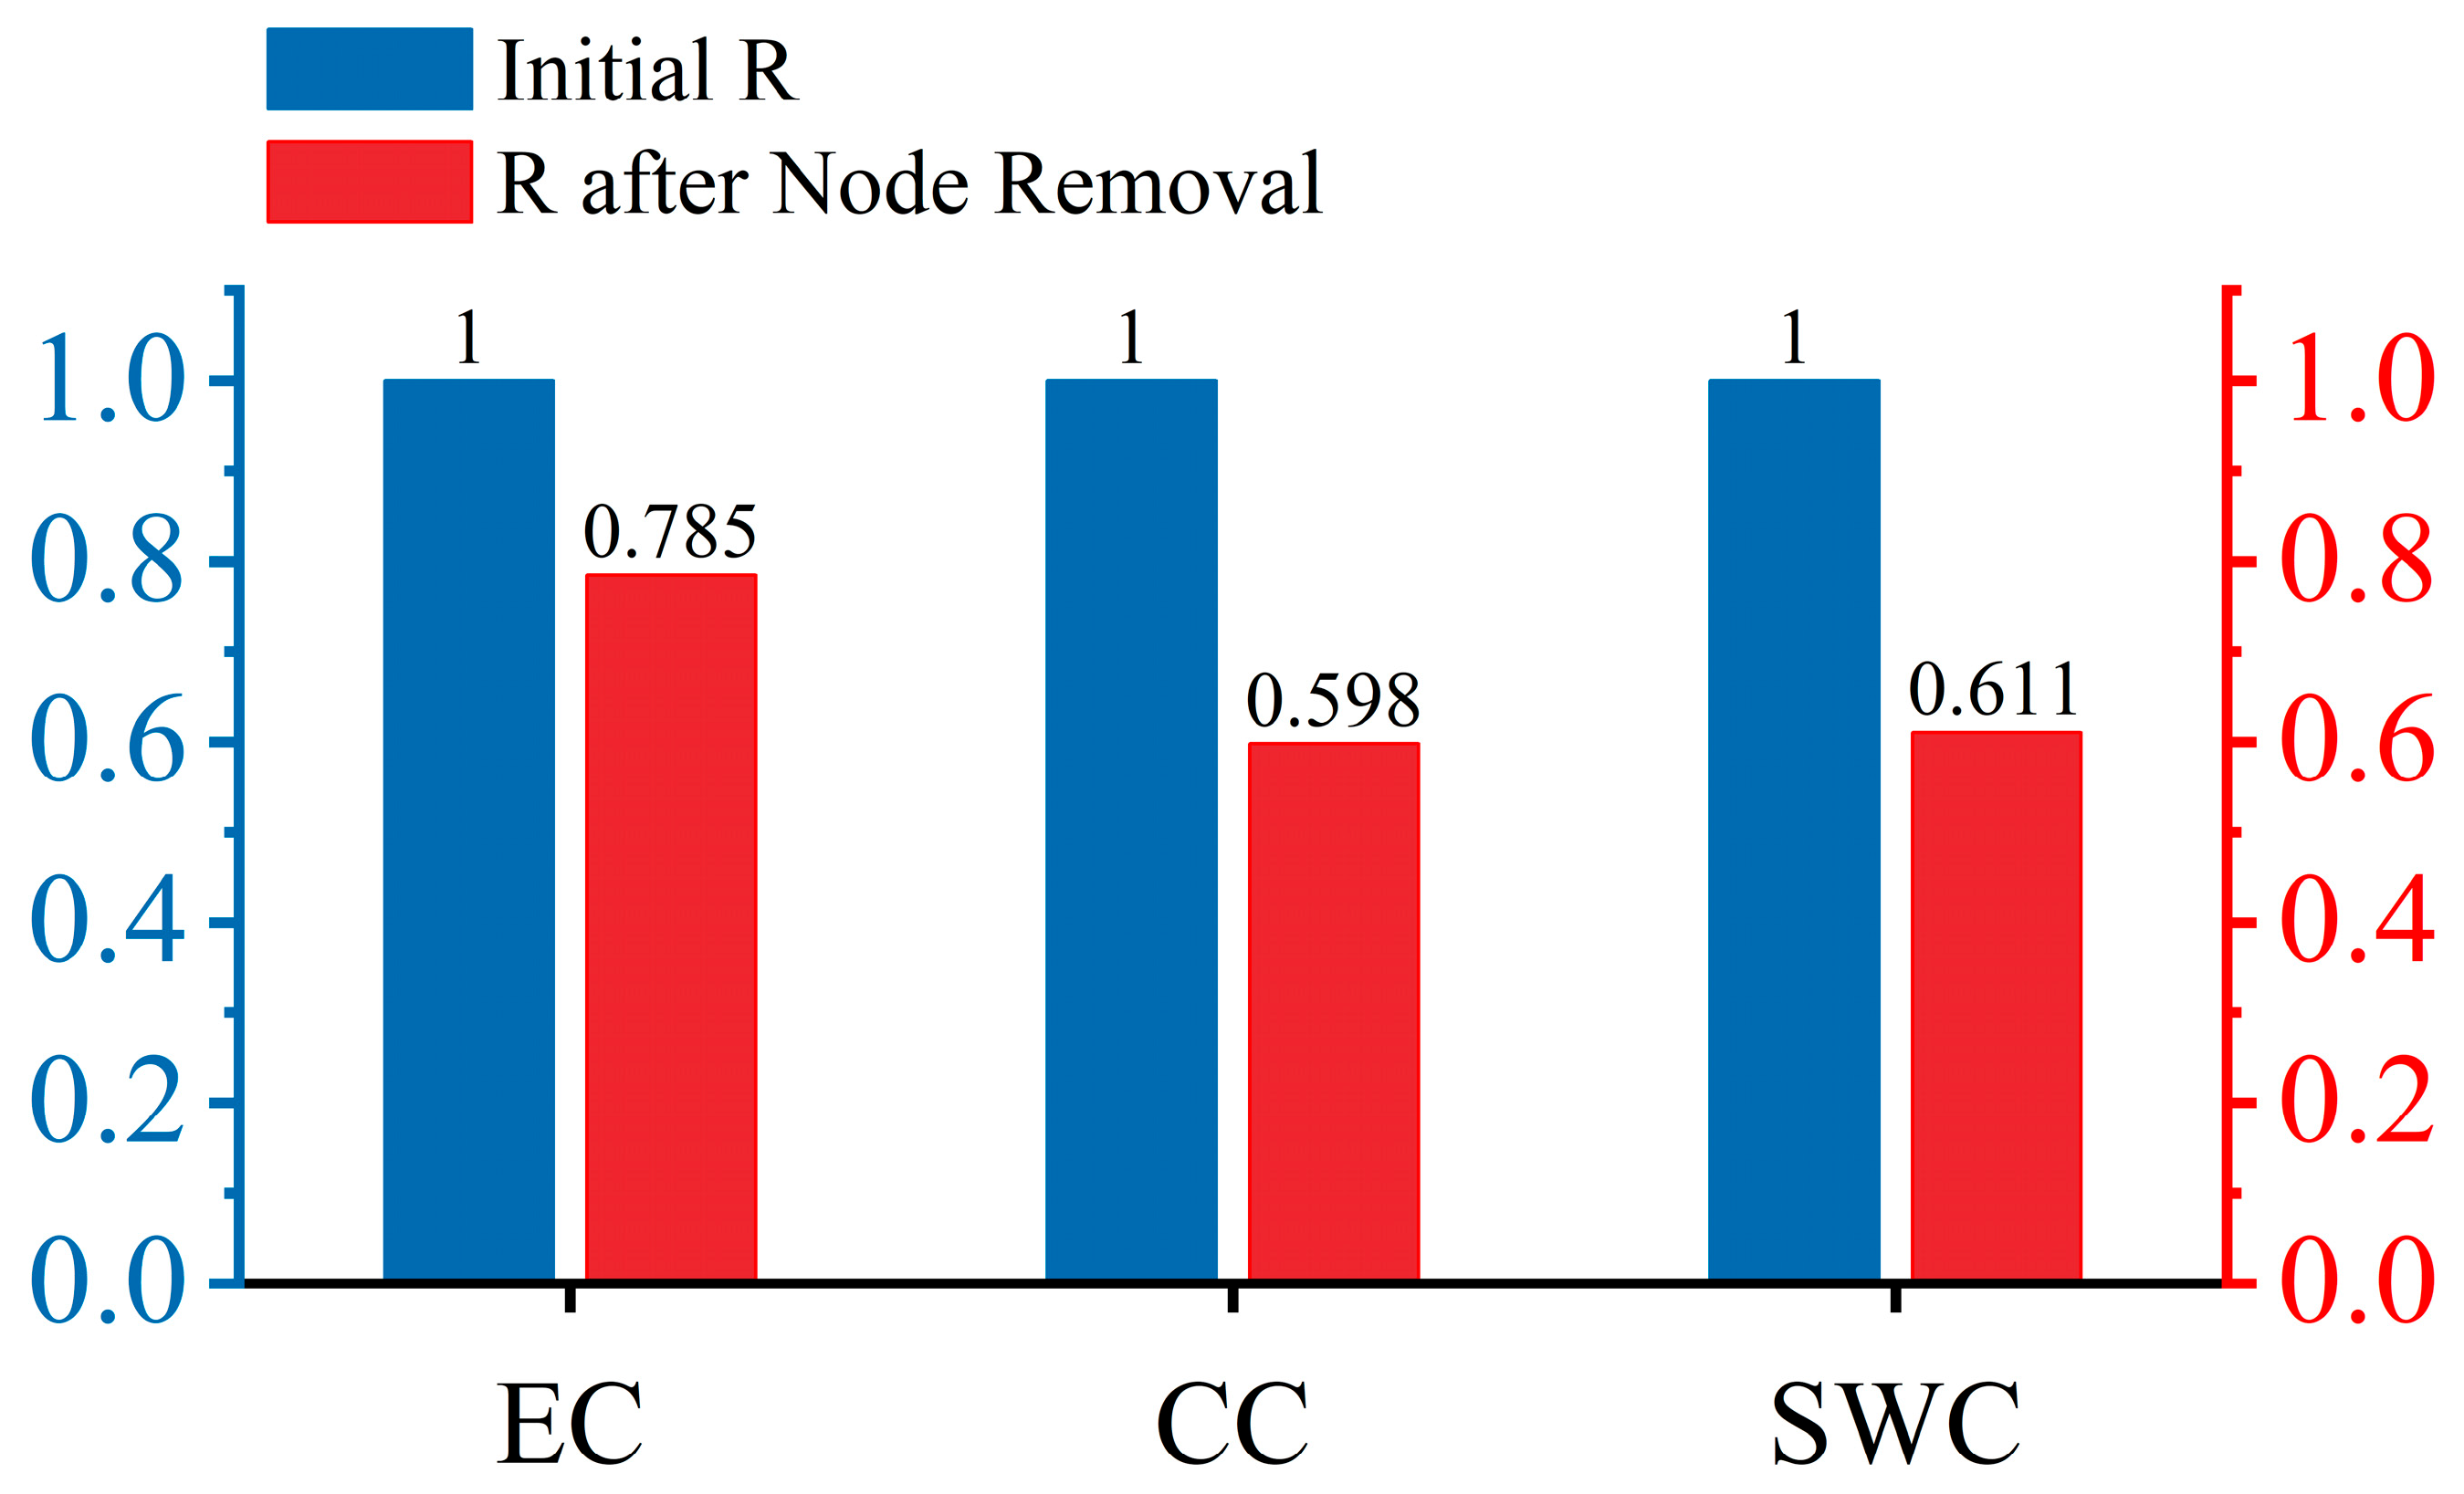
This study simulates natural disaster disturbances to evaluate the robustness of the integrated transportation network under extreme conditions. Using the 1998 Yangtze River flood as a case, the disaster severely disrupted the transport system, particularly along the Yangtze mainstream and in the Dongting and Poyang Lake basins, affecting multiple hub nodes and key corridors across EC, CC, and SWC (Figure 9). A corresponding disaster scenario was constructed by modeling the complete failure of impacted nodes and links. Simulation results show that extreme flooding leads to substantial declines in network robustness—by approximately 40% in CC and SWC, 30% in EC, and 25% nationwide (Figure 10). These findings indicate that the network exhibits high vulnerability under natural disaster scenarios, with pronounced regional disparities. This is primarily due to the high concentration of core hubs and insufficient structural redundancy. Compared to random attacks, disaster-induced disruptions cause more severe and targeted structural damage, highlighting that national robustness depends not only on network size and connectivity but also on the spatial concentration of hub functions and coupling characteristics. Future planning should prioritize adding redundancy along backbone corridors, strengthening protection in high-risk regions, and integrating disaster scenarios into robustness assessment frameworks to enhance overall system resilience.

3.4. Robustness Optimization

The impact of structural optimization strategies proposed in Section 2.5 on the robustness of the integrated transportation network is evaluated. Figure 11 presents the changes in network robustness under targeted attacks (TA) after adding 5%, 10%, and 15% of new edges to the high-importance and low-importance nodes identified by the PLEA model with geographic constraints. Increasing edges for low-importance nodes improves network robustness with greater effectiveness than for high-importance nodes. Specifically, the network collapses (R = 0) when 45%, 55%, and 60% of the nodes are removed after adding 5%, 10%, and 15% of the edges to the low-importance nodes identified by PLEA, respectively. In contrast, the network collapses following 30%, 35%, and 40% node removal after adding edges to the high-importance nodes (Figure 11a–c). These results indicate that the low mode performs better in all edge-increasing ratios, effectively delaying network collapse and enhancing overall robustness. In addition, the robustness difference between the low and high modes gradually increases as the edge addition ratio rises. Under the node removal ratio of 30%, the R values in the low mode are 0.1, 0.2, and 0.3, respectively, while those in the high mode are only 0, 0.1, and 0.2. These results further indicate that compared to strengthening the connectivity of existing important nodes, improving the connections among low-importance nodes has greater potential to enhance overall network robustness. This is because low-importance nodes often lack transport links, have limited connectivity, and sit at the network periphery with low redundancy. Adding edges to these nodes enhances their structural embeddedness and creates alternative paths, improving connectivity and efficiency under attack. In contrast, high-importance nodes already have extensive connections, and additional links offer limited marginal gains. Enhancing low-importance nodes can reduce over-reliance on central hubs and lower the risk of cascading failures under targeted disruptions. In some cases, they may even exacerbate structural centralization and increase the network’s sensitivity to hub failures. Therefore, to enhance overall robustness, optimization strategies should prioritize low-importance nodes to promote structural balance and improve system resilience. Future transportation planning should focus on cities with currently low connectivity but high potential link value, such as Shanwei and Heyuan, enhancing their network embeddedness through cross-modal and cross-regional connections. This would provide a foundation for greater regional coordination and network stability. These findings offer policy insights for the Ministry of Transport and related agencies. A shift from “hub reinforcement” to “structural balancing” is recommended, with priority given to improving “low-importance cities” within the network to enhance the system’s redundancy and resilience. This approach not only strengthens the transport system’s capacity to withstand disasters or attacks but also fosters regional integration and sustainable economic development.

4. Conclusions

We conducted a robustness-optimization assessment of China’s integrated transportation network to provide a theoretical foundation for infrastructure development. First, a multilayer integrated transportation network was constructed using all prefecture-level administrative regions as nodes, comprising road, railway, and waterway layers. Drawing on complex network theory, topological indicators were calculated, and key nodes were identified using the PLEA model. Subsequently, a comprehensive robustness metric was developed from structural connectivity and functional efficiency perspectives. Robustness analyses were performed on single-layer sub-networks, the overall integrated network, and seven regional networks under scenarios of random and targeted attacks, while also simulating the impact of natural disasters on the national network. Finally, a weighted edge-adding strategy based on PLEA scores and distance constraints was introduced to prioritize node pairs for edge addition, thereby implementing structural optimization. The results show that the integrated transportation network exhibited greater robustness than single-layer networks under both random and targeted attacks, with the road network as the core exerting the greatest influence on overall stability. EC, CC, and NC regions made significant contributions to network robustness. Key hub cities identified by the PLEA model included Chongqing and Jiujiang. Simulations of natural disasters demonstrated that regional disruptions caused a sharp decline in robustness, with impacts far exceeding those of conventional attacks. Compared to reinforcing connections among hub nodes, prioritizing the addition of edges between low-importance nodes such as Shanwei and Heyuan can effectively delay a network collapse and improve overall resilience. Future planning of the integrated transportation network should focus on achieving structural balance by appropriately allocating resources toward peripheral cities to enhance their connectivity with neighboring regions, thereby increasing the network’s adaptability and recovery capacity in response to emergencies. These findings offer strong support and guidance for transportation policy and infrastructure development.
Although this study provided an in-depth analysis of the robustness of the integrated transportation network, some limitations remain. Future research could incorporate functional indicators such as freight volume and GDP-weighted centrality to develop weighted network models. This approach would enable the identification of key nodes by integrating structural and functional aspects, providing a more comprehensive characterization of node importance within the transportation system.

Author Contributions

Conceptualization, writing-original draft, X.M.; methodology, validation, W.Y.; data curation, visualization, W.L.; data curation, resources, C.C.; software, validation, A.L.; methodology, supervision, writing—review and editing, J.W.; writing—review and editing—methodology, project administration, H.D. All authors have read and agreed to the published version of the manuscript.

Funding

This research was funded by the Science and Technology Research Program of Chongqing Municipal Education Commission (KJZD-K202300703), the National Key Research and Development Program Project (2024YFC3212500), and Research and Innovation Program for Graduate Students in Chongqing (CYS240476).

Institutional Review Board Statement

Not applicable.

Informed Consent Statement

Not applicable.

Data Availability Statement

The data presented in this study are available on request from the corresponding author.

Acknowledgments

We thank editors and anonymous reviewers for their constructive comments on the manuscript.

Conflicts of Interest

The authors declare no conflicts of interest.

References

  1. Li, S.; Zhou, Y.; Zhang, F. Interdependency in transportation system resilience: Review and discussion. Transp. Res. Part D Transp. Environ. 2025, 140, 104618. [Google Scholar] [CrossRef]
  2. Zheng, Q.; Shen, S.-L.; Zhou, A.; Lyu, H.-M. Inundation risk assessment based on G-DEMATEL-AHP and its application to Zhengzhou flooding disaster. Sustain. Cities Soc. 2022, 86, 104138. [Google Scholar] [CrossRef]
  3. Wan, C.; Yang, Z.; Zhang, D.; Yan, X.; Fan, S. Resilience in transportation systems: A systematic review and future directions. Transp. Rev. 2018, 38, 479–498. [Google Scholar] [CrossRef]
  4. Zong, Y.; Chen, X. The 1998 flood on the Yangtze, China. Nat. Hazards 2000, 22, 165–184. [Google Scholar] [CrossRef]
  5. Xie, C.; Xu, C.; Huang, Y.; Liu, J.; Shao, X.; Xu, X.; Gao, H.; Ma, J.; Xiao, Z. Advances in the study of natural disasters induced by the “23.7” extreme rainfall event in North China. Nat. Hazards Res. 2025, 5, 1–13. [Google Scholar] [CrossRef]
  6. Yang, Z.; Wang, Y.; Lian, F. Optimization of the Sino-Russian trade transportation network under geopolitical risks such as the Russia-Ukraine conflict. Transp. Res. Part E Logist. Transp. Rev. 2025, 198, 104144. [Google Scholar] [CrossRef]
  7. Artime, O.; Grassia, M.; De Domenico, M.; Gleeson, J.P.; Makse, H.A.; Mangioni, G.; Perc, M.; Radicchi, F. Robustness and resilience of complex networks. Nat. Rev. Phys. 2024, 6, 114–131. [Google Scholar] [CrossRef]
  8. Chen, X.; Ma, S.; Chen, L.; Yang, L. Resilience measurement and analysis of intercity public transportation network. Transp. Res. Part D Transp. Environ. 2024, 131, 104202. [Google Scholar] [CrossRef]
  9. Albert, R.; Barabási, A.-L. Statistical mechanics of complex networks. Rev. Mod. Phys. 2002, 74, 47. [Google Scholar] [CrossRef]
  10. Li, W.; Cai, X. Empirical analysis of a scale-free railway network in China. Phys. A Stat. Mech. Its Appl. 2007, 382, 693–703. [Google Scholar] [CrossRef]
  11. Xiao, Y.; Zhong, Z.; Sun, R. Analysis of Topological Properties and Robustness of Urban Public Transport Networks. Sustainability 2024, 16, 6527. [Google Scholar] [CrossRef]
  12. Yan, Y.; Su, B.; Chen, Z. Generalized-Norm-Based Robustness Evaluation Model of Bus Network under Snowy Weather. Sustainability 2024, 16, 5260. [Google Scholar] [CrossRef]
  13. Günay, E.E.; Kremer, G.E.O.; Zarindast, A. A multi-objective robust possibilistic programming approach to sustainable public transportation network design. Fuzzy Sets Syst. 2021, 422, 106–129. [Google Scholar] [CrossRef]
  14. Frutos Bernal, E.; Martín del Rey, A. Study of the structural and robustness characteristics of madrid metro network. Sustainability 2019, 11, 3486. [Google Scholar] [CrossRef]
  15. Bombelli, A.; Santos, B.F.; Tavasszy, L. Analysis of the air cargo transport network using a complex network theory perspective. Transp. Res. Part E Logist. Transp. Rev. 2020, 138, 101959. [Google Scholar] [CrossRef]
  16. Jiang, J.; Wu, L.; Yu, J.; Wang, M.; Kong, H.; Zhang, Z.; Wang, J. Robustness of bilayer railway-aviation transportation network considering discrete cross-layer traffic flow assignment. Transp. Res. Part D Transp. Environ. 2024, 127, 104071. [Google Scholar] [CrossRef]
  17. Ippolito, N.; Cats, O. Multi-modal and multi-layer robustness analysis of the European rail and air networks. Sci. Rep. 2024, 14, 26950. [Google Scholar] [CrossRef] [PubMed]
  18. Ma, F.; Shi, W.; Yuen, K.F.; Sun, Q.; Xu, X.; Wang, Y.; Wang, Z. Exploring the robustness of public transportation for sustainable cities: A double-layered network perspective. J. Clean. Prod. 2020, 265, 121747. [Google Scholar] [CrossRef]
  19. Guo, X.; Du, Q.; Li, Y.; Zhou, Y.; Wang, Y.; Huang, Y.; Martinez-Pastor, B. Cascading failure and recovery of metro–bus double-layer network considering recovery propagation. Transp. Res. Part D Transp. Environ. 2023, 122, 103861. [Google Scholar] [CrossRef]
  20. Freeman, L.C. Centrality in social networks: Conceptual clarification. Soc. Netw. Crit. Concepts Sociol. 2002, 1, 238–263. [Google Scholar] [CrossRef]
  21. Freeman, L.C. A set of measures of centrality based on betweenness. Sociometry 1977, 40, 35–41. [Google Scholar] [CrossRef]
  22. Bonacich, P.; Lloyd, P. Eigenvector-like measures of centrality for asymmetric relations. Soc. Netw. 2001, 23, 191–201. [Google Scholar] [CrossRef]
  23. Sabidussi, G. The centrality index of a graph. Psychometrika 1966, 31, 581–603. [Google Scholar] [CrossRef] [PubMed]
  24. Kitsak, M.; Gallos, L.K.; Havlin, S.; Liljeros, F.; Muchnik, L.; Stanley, H.E.; Makse, H.A. Identification of influential spreaders in complex networks. Nat. Phys. 2010, 6, 888–893. [Google Scholar] [CrossRef]
  25. Agryzkov, T.; Oliver, J.L.; Tortosa, L.; Vicent, J.F. An algorithm for ranking the nodes of an urban network based on the concept of PageRank vector. Appl. Math. Comput. 2012, 219, 2186–2193. [Google Scholar] [CrossRef]
  26. Li, P.; Wang, S.L.; Chen, G.W.; Yan, G.H. Key node mining in complex network based on improved local structural entropy. J. Comput. Appl. 2023, 43, 1109–1114. (In Chinese) [Google Scholar]
  27. Dunn, S.; Wilkinson, S.M. Increasing the resilience of air traffic networks using a network graph theory approach. Transp. Res. Part E Logist. Transp. Rev. 2016, 90, 39–50. [Google Scholar] [CrossRef]
  28. Sun, D.J.; Guan, S. Measuring vulnerability of urban metro network from line operation perspective. Transp. Res. Part A Policy Pract. 2016, 94, 348–359. [Google Scholar] [CrossRef]
  29. Ma, F.; Ao, Y.; Wang, X.; He, H.; Liu, Q.; Yang, D.; Gou, H. Assessing and enhancing urban road network resilience under rainstorm waterlogging disasters. Transp. Res. Part D Transp. Environ. 2023, 123, 103928. [Google Scholar] [CrossRef]
  30. Zhang, H.; Xu, M.; Ouyang, M. A multi-perspective functionality loss assessment of coupled railway and airline systems under extreme events. Reliab. Eng. Syst. Saf. 2024, 243, 109831. [Google Scholar] [CrossRef]
  31. Li, T.; Rong, L. Impacts of service feature on vulnerability analysis of high-speed rail network. Transp. Policy 2021, 110, 238–253. [Google Scholar] [CrossRef]
  32. Wang, J.; Liao, F.; Wu, J.; Sun, H.; Wang, W.; Gao, Z. Measurement of functional resilience of transport network: The case of the Beijing subway network. Transp. Policy 2023, 140, 54–67. [Google Scholar] [CrossRef]
  33. Wandelt, S.; Shi, X.; Sun, X. Estimation and improvement of transportation network robustness by exploiting communities. Reliab. Eng. Syst. Saf. 2021, 206, 107307. [Google Scholar] [CrossRef]
  34. Xu, Z.; Chopra, S.S.; Lee, H. Resilient urban public transportation infrastructure: A comparison of five flow-weighted metro networks in terms of the resilience cycle framework. IEEE Trans. Intell. Transp. Syst. 2021, 23, 12688–12699. [Google Scholar] [CrossRef]
  35. Xu, M.; Deng, W.; Zhu, Y.; Lü, L. Assessing and improving the structural robustness of global liner shipping system: A motif-based network science approach. Reliab. Eng. Syst. Saf. 2023, 240, 109576. [Google Scholar] [CrossRef]
  36. Zhang, Y.; Ayyub, B.M.; Saadat, Y.; Zhang, D.; Huang, H. A double-weighted vulnerability assessment model for metrorail transit networks and its application in Shanghai metro. Int. J. Crit. Infrastruct. Prot. 2020, 29, 100358. [Google Scholar] [CrossRef]
  37. Yang, Y.; Liu, Y.; Zhou, M.; Li, F.; Sun, C. Robustness assessment of urban rail transit based on complex network theory: A case study of the Beijing Subway. Saf. Sci. 2015, 79, 149–162. [Google Scholar] [CrossRef]
  38. Chen, P.-Y.; Hero, A.O. Assessing and safeguarding network resilience to nodal attacks. IEEE Commun. Mag. 2014, 52, 138–143. [Google Scholar] [CrossRef]
  39. Yang, S.; Xiao, R. Enhancing the global and local robustness of networks: A network motif-based approach. Commun. Nonlinear Sci. Numer. Simul. 2025, 140, 108439. [Google Scholar] [CrossRef]
  40. Chujyo, M.; Hayashi, Y. A loop enhancement strategy for network robustness. Appl. Netw. Sci. 2021, 6, 3. [Google Scholar] [CrossRef]
  41. Lee, E.H. eXplainable DEA approach for evaluating performance of public transport origin-destination pairs. Res. Transp. Econ. 2024, 108, 101491. [Google Scholar] [CrossRef]
  42. Lee, E.H.; Lee, E. Iterative DEA for public transport transfer efficiency in a super-aging society. Cities 2025, 162, 105957. [Google Scholar] [CrossRef]
  43. Vaidya, O.S.; Kumar, S. Analytic hierarchy process: An overview of applications. Eur. J. Oper. Res. 2006, 169, 1–29. [Google Scholar] [CrossRef]
  44. Mardani, A.; Zavadskas, E.K.; Govindan, K.; Amat Senin, A.; Jusoh, A. VIKOR technique: A systematic review of the state of the art literature on methodologies and applications. Sustainability 2016, 8, 37. [Google Scholar] [CrossRef]
  45. Zhan, C.; Zhang, X.; Yuan, J.; Chen, X.; Zhang, X.; Fathollahi-Fard, A.; Wang, C.; Wu, J.; Tian, G. A hybrid approach for low-carbon transportation system analysis: Integrating CRITIC-DEMATEL and deep learning features. Int. J. Environ. Sci. Technol. 2024, 21, 791–804. [Google Scholar] [CrossRef]
  46. Ma, H.; Liu, J.; Zhao, X.; Zhang, B. A study of highway logistics transportation network structure in China: From the perspective of complex network. J. Data Inf. Manag. 2022, 4, 89–105. [Google Scholar] [CrossRef]
  47. Yin, K.; Wu, J.; Wang, W.; Lee, D.-H.; Wei, Y. An integrated resilience assessment model of urban transportation network: A case study of 40 cities in China. Transp. Res. Part A Policy Pract. 2023, 173, 103687. [Google Scholar] [CrossRef]
  48. Ma, S.; Yang, L.; Chen, X.; Zhu, M. Cluster characteristics analysis and critical node identification in ecologically integrated transport networks in urban agglomerations. J. Tsinghua Univ. (Sci. Technol.) 2023, 63, 1770–1780. [Google Scholar]
  49. Davis, S.J.; Qian, M.; Zeng, W. A Comprehensive GIS Database for China’s Surface Transport Network with Implications for Transport and Socioeconomics Research; National Bureau of Economic Research: Cambridge, MA, USA, 2025. [Google Scholar]
Figure 1. The network model. (a) Road sub-network; (b) railway sub-network; (c) waterway sub-network; (d) multilayer Integrated Network with cross-modal edges.
Sustainability 17 07398 g001
Figure 2. Degree distribution of the four networks. (a) Road sub-network; (b) railway sub-network; (c) waterway sub-network; (d) integrated transportation network.
Sustainability 17 07398 g002
Figure 3. Spatial distribution characteristics of key nodes. (a) Road sub-network; (b) railway sub-network; (c) waterway sub-network; (d) integrated transportation network. ((a) node size and red intensity indicate importance. (b) node size and green intensity indicate importance. (c) node size and blue intensity indicate importance. (d) node importance indicated by orange intensity. Edges are colored by mode: red (highway), green (railway), blue (waterway).).
Sustainability 17 07398 g003
Figure 4. Comparison of R variations under different key node identification methods. (a) Road sub-network; (b) railway sub-network; (c) waterway sub-network; (d) integrated transportation network.
Sustainability 17 07398 g004
Figure 5. Network robustness under different attacks. (a) Road sub-network; (b) railway sub-network; (c) waterway sub-network; (d) integrated transportation network.
Sustainability 17 07398 g005
Figure 6. Variation trends in R of the integrated transportation network after removing the road, railway, or waterway sub-networks.
Sustainability 17 07398 g006
Figure 7. Regional network robustness under different attacks. (a) Random attacks; (b) target attacks.
Sustainability 17 07398 g007
Figure 8. The robustness of the integrated transportation network after removing each region.
Sustainability 17 07398 g008
Figure 9. Distribution of nodes affected by the 1998 Yangtze River Flood. (Affected nodes highlighted in red).
Sustainability 17 07398 g009
Figure 10. Comparison of robustness of three regional integrated transportation networks under the 1998 flood disaster scenario.
Sustainability 17 07398 g010
Figure 11. Robustness under different edge addition strategies. (a) add 5% new edges; (b) add 10% new edges; (c) add 15% new edges.
Sustainability 17 07398 g011
Table 1. Basic topological characteristics of the four networks.
Network ModelNodeEdgeDegreeClustering
Coefficient
Network
Diameter
Average Path Length
Road sub-network3306944.20610.3196249.3619
Railway sub-network3144883.10830.14522811.0293
Waterway sub-network1051062.01900.0222278.9334
Integrated transportation network74918114.83580.1555269.9832
Table 2. Basic topological characteristics of the seven major geographic regions.
Region NetworkNodeEdgeDegreeClustering CoefficientNetwork
Diameter
Average Path Length
NEC942074.40430.1295104.3294
NC1072194.09350.1548135.2957
EC2295314.63760.1482186.4255
SC1132504.42480.1669124.5761
CC1623514.33330.1422155.7301
NWC1242253.62900.0871135.3345
SWC1312684.09160.1439135.1617
Table 3. Top 5 nodes with the highest PLEA in the four networks.
Road Sub-Network V P L E A Railway Sub-Network V P L E A Waterway Sub-Network V P L E A Integrated Transportation Network V P L E A
Chongqing3.38Chongqing2.70Chongqing2.00Chongqing8.88
Nanyang2.92Shenyang2.61Yueyang1.97Jiujiang8.02
Jiujiang2.81Xinzhou2.53Foshan1.97Shangrao7.73
Huaihua2.81Shangrao2.44Zhenjiang1.81Haerbin7.66
Ganzhou2.73Tongliao2.40Jiujiang1.80Jingzhou7.53
Disclaimer/Publisher’s Note: The statements, opinions and data contained in all publications are solely those of the individual author(s) and contributor(s) and not of MDPI and/or the editor(s). MDPI and/or the editor(s) disclaim responsibility for any injury to people or property resulting from any ideas, methods, instructions or products referred to in the content.