Article

Ensemble Learning and SHAP Interpretation for Predicting Tensile Strength and Elastic Modulus of Basalt Fibers Based on Chemical Composition

1
School of Resources and Environmental Engineering, Shandong University of Technology, Zibo 255000, China
2
Shandong Key Laboratory of Intelligent Magnetoelectric Equipment and Mineral Processing Technology, Weifang 262600, China
*
Authors to whom correspondence should be addressed.
Sustainability 2025, 17(16), 7387; https://doi.org/10.3390/su17167387
Submission received: 8 July 2025 / Revised: 2 August 2025 / Accepted: 12 August 2025 / Published: 15 August 2025
(This article belongs to the Section Resources and Sustainable Utilization)

Abstract

Tensile strength and elastic modulus are key mechanical properties for continuous basalt fibers, which are inherently sustainable materials derived from naturally occurring volcanic rock. This study employs five ensemble learning models, including Extra Tree Regression, Random Forest, Extreme Gradient Boosting, Categorical Gradient Boosting, and Light Gradient Boosting Machine, to predict the tensile strength and elastic modulus of basalt fibers based on chemical composition. Model performance was evaluated using the coefficient of determination (R2), Mean Squared Error (MSE), Root Mean Squared Error (RMSE), and Mean Absolute Error (MAE). Following hyperparameter optimization, the Extreme Gradient Boosting model demonstrated superior performance for tensile strength prediction (R2 = 0.9152, MSE = 0.2867, RMSE = 0.5354, and MAE = 0.6091), while CatBoost excelled in elastic modulus prediction (R2 = 0.9803, MSE = 0.1209, RMSE = 0.3478, and MAE = 0.2692). SHapley Additive exPlanations (SHAP) analysis identified CaO and SiO2 as the most significant features, with dependency analysis further revealing optimal ranges of critical variables that enhance mechanical performance. This approach enables rapid data-driven basalt selection, reduces energy-intensive trials, lowers costs, and aligns with sustainability by minimizing resource use and emissions. Integrating machine learning with material science advances eco-friendly fiber production, supporting the circular economy in construction and composites.

Graphical Abstract

1. Introduction

Basalt, an extrusive igneous rock, forms through rapid magma solidification during volcanic eruptions under low-pressure conditions [1], resulting in a stone rich in minerals such as olivine, pyroxene, feldspar, plagioclase, quartz, and magnetite [2]. Continuous basalt fiber (CBF) can be produced from natural basalt rock through processes including raw basalt rock selection, basalt melting, homogenization, spinning, and sizing [3,4]. The straightforward, low-waste manufacturing process of CBF, leveraging low-carbon energy and minimal water/energy consumption with negligible emissions, positions it as a sustainable, high-performance fiber aligned with circular economy principles for the 21st century [5,6]. Additionally, CBF is an excellent structural and functional material, characterized by high tensile strength, high elastic modulus, fire resistance, and chemical corrosion resistance [7], and is commonly applied in the field of construction [8], vehicle and ship manufacturing [9], fire protection materials [10,11], and environmental protection [12]. The extensive availability of basalt rock as a raw material, coupled with the sustainable one-step single-phase production process and cost-effective manufacturing, has led to the increasing popularity of CBF among markets and consumers.
CBF is recognized as an optimal reinforcing material for polymer composite materials and concretes owing to its exceptional mechanical properties [13], notably high tensile strength and elastic modulus. Previous research indicates that the tensile strength and elastic modulus of basalt fibers correlate with their chemical composition. SiO2 is the predominant oxide of basalt rocks, generally accounting for 40 to 60 percent [4,14]. It is commonly believed that SiO2 plays the role of network former in the basalt fiber, present in the form of a silicon–oxygen tetrahedron [SiO4]. Increasing the content of SiO2 within a certain range can improve the tensile strength and elastic modulus of fibers, yet a higher SiO2 content can make the basalt rock difficult to melt [15]. Al2O3 is the second most abundant oxide in basalt, typically ranging from 10% to 20%. It acts both as a network former and a network modifier, playing a significant role in enhancing the tensile strength and elastic modulus of fibers [16]. MgO functions as a network modifier within basalt fibers, reducing the melt’s viscosity and crystallization temperature, thereby strengthening the mechanical strength of the fibers [17]. CaO also acts as a network modifier, and increasing the CaO content can modify the crystallization behavior of the basalt melt. When no more than 3% wt. of CaO is added to the raw basalt, it can increase the fiber’s tensile strength by 13% [18]. Na2O and K2O act as network modifiers in basalt fibers, reducing the melting point and viscosity of the melt, which facilitates the breaking of silicon–oxygen tetrahedral bonds, disrupting the network structure and diminishing the tensile strength of basalt fiber. Iron elements in basalt fibers mainly exist in divalent and trivalent forms [19,20]. Iron elements in basalt fibers mainly exist in the form of Fe2+ and Fe3+. Ferrous ions are considered network modifiers of octahedral coordination, whereas ferric ions are network-forming cations of tetrahedral coordination [21,22]. An increase in the Fe3+/Σ(Fe2+ + Fe3+) ratio suggests a higher content of iron in its higher valence state, making basalt fibers more prone to crystal precipitation during drawing, which increases surface defects and reduces tensile strength [23].
Nonetheless, these studies typically concentrate on the correlation between individual or certain oxides and the tensile strength and elastic modulus of basalt fibers. To the best of our knowledge, few studies have holistically studied the relationship between the composition of various oxides and the mechanical properties of basalt fibers. Consequently, systematically investigating the interrelation between principal oxides and fiber tensile strength and elastic modulus holds considerable importance for forecasting the mechanical performance of basalt fibers. Ensemble learning enhances overall model performance by combining the predictions of multiple base learners, making it a powerful machine learning approach [24,25]. Compared to a single machine learning model, ensemble learning techniques exhibit higher accuracy and stability, demonstrating notable advantages in classification, regression, and other “black-box” complex tasks [26]. Its widespread applications have been observed in fields involving basalt fibers, such as basalt fiber-reinforced concrete and composites.
Almohammed et al. employed seven algorithms, including ensemble learning algorithms (Random Forest (RF), Bagging RF), and Artificial Neural Network (ANN), to predict the flexural strength and split tensile strength of basalt fiber-reinforced concrete based on nine input feature variables [27]. Qiao et al. utilized classic ML methods and ensemble learning models of RF, Extreme Gradient Boosting (XGBoost), Category Boosting Algorithm (CatBoost), and Light Gradient Boosting Machine (LightGBM) to predict the freeze–thaw damage indicator D of dune sand and fiber-reinforced concrete. The results indicated that ensemble learning models generally surpassed classical learning models, with XGBoost demonstrating the best performance, achieving an R2 of 0.965 and an RMSE of 0.019 on the test set [28]. Cakiroglu et al. constructed a database for fiber-reinforced rubberized recycled concrete and employed seven models, including RF, Extra Tree Regression (ETR), XGBoost, LightGBM, and CatBoost, to predict the compressive, tensile, and flexural strength of fiber-reinforced rubberized recycled aggregate concrete. The results indicated that the CatBoost model performed best in predicting compressive and tensile strength, while the RF model exhibited superior performance in predicting flexural strength [29]. Machello et al. employed machine learning models such as Decision Tree, M5P, and RF to predict the tensile strength retention (TSR) of fiber-reinforced polymer composites. The results indicated that the ensemble learning model RF performed the best in predicting TSR [30]. To further extend this line of research, adopting ensemble learning to comprehensively uncover the relationships between various chemical compositions and the tensile strength as well as elastic modulus of basalt fibers is feasible. This approach has the potential to provide deeper insights into the optimization strategies in the production of basalt fiber.
Five ensemble learning models of RF, ETR, XGBoost, LightGBM, and CatBoost were employed to predict the tensile strength and elastic modulus of basalt fibers in this research. The feature variables consisted of the oxide composition and derived variables, while the target variables were the tensile strength and elastic modulus of basalt fibers. Various evaluation metrics, including R2, MSE, RMSE, and MAE, were utilized to assess the performance of the models. After hyperparameter tuning, the top-performing model was selected for final prediction. Through the application of SHAP (SHapley Additive exPlanations), the ranking of feature variable importance and the range of positive correlation effects on both the tensile strength and elastic modulus under the optimal model were obtained. Based on the ensemble learning models, this study provides an innovative method for judging the mechanical properties of basalt fibers from chemical composition, offering a new, sustainable, efficient, and cost-saving solution for optimizing the production process of basalt fibers.

2. Materials and Methods

2.1. Database Construction

This study established a composite dataset (as shown in the Supplementary Materials, S1) comprising 73 sets of experimental data and 95 sets of literature-derived data [1,22,31,32,33,34,35,36,37,38,39,40,41,42,43,44,45,46,47,48,49]. The experimental data were obtained from test results conducted by a basalt fiber technology company in Sichuan, China, encompassing oxide compositions and basalt mechanical properties. The literature data were systematically collected through academic platforms such as Scopus, Elsevier, Springer, and Web of Science, meticulously selected from 21 high-quality publications spanning the period 1981 to 2024. These publications cover research conducted across seven countries on two continents, including Asia and Europe. The dataset encompassed the chemical composition and content of oxides, along with the tensile strength and elastic modulus of basalt fibers produced from raw basalt. Additionally, some derived variables related to the composition and melting characteristics of basalt, such as acidity modulus (Ma), viscosity modulus (Mv), and the ratio of non-bridging oxygen (NBO) per tetrahedron (NBO/T), were incorporated into the database.
Ma, Mv, and NBO/T are parameters of basalt melt and are correlated with the mechanical properties of the basalt fibers ultimately formed. Ma specifically represents the mass ratio of the predominant acidic oxides to the predominant basic oxides in the melt. Fibers drawn from basalt with a higher Ma demonstrate greater chemical stability and a longer service life. However, as Ma increases, the viscosity of the melts also rises, simultaneously posing difficulties for fiber drawing. The value of Ma is calculated using Equation (1) [50]:
M a = ω S i O 2 + ω A l 2 O 3 ω C a O + ω M g O
where ω is the mass fraction of oxides.
Mv serves as a crucial parameter for characterizing the viscosity of basalt melts. Higher melt viscosity impedes the diffusion and migration of atoms and ions in the melt, resulting in an increased temperature for fiber preparation. In contrast, lower melt viscosity may cause the fibers to break easily during the drawing process, hindering their formation. Mv is calculated according to Equation (2) [51]:
M v = x S i O 2 + x A l 2 O 3 2 x F e 2 O 3 + x F e O + x C a O + x M g O + x K 2 O + x N a 2 O
where x is the molar mass fraction of oxides.
The NBO/T ratio, which quantifies non-bridging oxygen atoms per tetrahedron, characterizes the degree of polymerization. Essentially, NBO/T represents the ratio of the content of ions functioning as network breakers to those ions that function as network formers in silicate melt. It can be calculated by Equation (3) [6]:
N B O / T = O 2 × 2 T × 4 T
where O2- is the molar mass fraction of oxygen ions; T represents the molar mass fraction of tetrahedral coordination cations.
In the machine learning process, strong inter-variable correlations or multicollinearity relationships primarily impact model stability, overfitting tendency, interpretability, and generalization capability. Pearson correlation analysis is commonly employed to identify and filter features exhibiting such multicollinear relationships. The Pearson Correlation Coefficient (PCC) serves as a classical statistical measure for quantifying linear associations between two continuous variables. The PCC is mathematically expressed as follows:
r = i = 1 n ( x i x ¯ ) × ( y i y ¯ ) / i = 1 n ( x i x ¯ ) 2 × i = 1 n ( y i y ¯ ) 2
where x i and y i represent paired observational datasets; x ¯ and y ¯ denote their respective sample means. The PCC ranges between [−1, 1]. A value of r < 0 indicates negative correlation, with stronger negative association approaching −1; conversely, r > 0 signifies positive correlation, with increasing strength nearing 1. Feature selection can be systematically performed by employing Pearson correlation heatmaps.

2.2. Data Preprocessing

During the machine learning preprocessing phase, handling of missing values in the dataset was prioritized. Specific chemical components such as K2O and Na2O contained missing entries, necessitating systematic imputation. Since analytical techniques employed in this study (including ICP-OES, XRF, and chemical analysis) determined chemical compositions in both literature-derived and experimental datasets, absent values typically indicated concentrations below instrumental detection limits. Consequently, filling these missing entries with zero is physically justified, reflecting the analytical reality that these components existed below measurable thresholds. This approach maintains data integrity while aligning with fundamental measurement principles.
The variables utilized for constructing the database in this study are categorized into feature variables and target variables. The feature variables include SiO2, Al2O3, TiO2, Fe2O3, CaO, Na2O, MgO, FeO, K2O, Ma, Mv, and NBO/T, whereas the target variables comprise the tensile strength and elastic modulus. To improve the computational speed and accuracy of the model while minimizing underfitting, the feature variables and target variables are normalized to [0, 1] and [0, 10], respectively. The normalization of feature variables (x) and target variables (y) was conducted using the following formulas:
x * = ( x i x m i n ) / ( x m a x x m i n )
y * = 10 × ( y i y m i n ) / ( y m a x y m i n )
where x * and y * denote the normalized data for x and y, respectively; x i and y i represent the i-th observations of x and y; x m i n and x m a x are the minimum and maximum values of x; and y m i n and y m a x are the minimum and maximum values of y.
Following data filling and normalization, the dataset partitioning was performed on the processed data. The 168-sample dataset was stratified into training (80%, 134 samples) and testing subsets (20%, 34 samples) using stratified random sampling. This division was subsequently followed by 5-fold stratified cross-validation during model training for parameter optimization. The implementation of 5-fold stratified cross-validation mitigates random bias from single data splits through five distinct partitioning iterations. It ensures full utilization of limited data by incorporating all samples in both training and validation phases, while maintaining computational efficiency. This approach enables a more accurate assessment of model stability and generalization capability by aggregating results across multiple validation cycles. To ensure distributional consistency between training and testing subsets, a Kolmogorov–Smirnov test (p-value > 0.05) was implemented, confirming statistical homogeneity of the data partitions. After the model training and prediction, all these variables are restored to their initial ranges.

2.3. Ensemble Learning Models

Ensemble learning refers to the process of strategically generating and combining multiple models to better solve specific machine learning problems. The basic concept is to combine several machine learning models into one predictive model. Bagging and Boosting are the common methods used in ensemble learning [52]. The Bagging method creates an ensemble learner by parallelly generating individual learners without interdependence, whereas Boosting serially generates an ensemble learner with interdependent individual learners. Both the Bagging and Boosting methods are designed to mitigate model variance and bias or enhance predictive performance, thereby achieving superior accuracy and robustness. Five integrated learning models of Random Forest (RF), Extra Tree Regression (ETR), Extreme Gradient Boosting (XGBoost), Light Gradient Boosting Machine (LightGBM), and Category Boosting Algorithm (CatBoost) were selected for this study based on their complementary strengths: RF and ETR employ bootstrap aggregation to reduce overfitting risks through feature subspace randomization, which is particularly effective for limited datasets; XGBoost and LightGBM integrate L1/L2 regularization and gradient-based one-side sampling to prevent overfitting while maintaining efficiency on small samples; CatBoost utilizes ordered Boosting and target-based encoding to minimize target leakage, enhancing generalization on sparse data. These capabilities collectively address key challenges in material science datasets characterized by restricted sample sizes and high feature dimensionality. These models are employed to predict the tensile strength and elastic modulus of basalt fibers.

2.3.1. RF

RF aggregates predictions from multiple Decision Trees, each trained on a random subset of the data and features, reducing variance and improving generalization [53]. The ensemble prediction is computed from Equation (7):
y ^ = 1 T t = 1 T h t ( x )
where h t ( x ) is the prediction from the t-th tree.
RF is capable of dealing with high-dimensional and nonlinear data, featuring strong generalization and robustness against noise. However, it might suffer from high computational demands and difficulty in interpretability.

2.3.2. ETR

ETR is an ensemble learning method belonging to the family of Extremely Randomized Trees (Extra-trees) algorithms, specifically designed for regression tasks [54]. It is rooted in the concept of RF (Random Forest) and introduces additional randomness by splitting nodes using random thresholds for selected features, without employing bootstrapping. ETR models offer faster training speeds and are able to avoid overfitting, although they may be less accurate and more sensitive to noise compared to other methods.

2.3.3. XGBoost

XGBoost employs gradient boosting to optimize a loss function, sequentially adding trees that correct residuals from prior models [55]. The prediction model of XGBoost can be represented as the sum of predictions from multiple trees (Equation (8)):
y i ^ = ϕ x i = k = 1 K f k ( x i ) , f k F
where y i ^ is the predicted output for the i-th instance, K is the number of trees, f k is the function represented by the k-th tree, and F is the space of all possible trees. Equation (9) is as follows:
O b j θ = i = 1 n l ( y i , y i ^ ) + k = 1 K Ω ( f k )
where l ( y i , y i ^ ) is a differentiable convex loss function that measures the difference between the prediction y i ^ and the true label y i , and Ω ( f k ) is a regularization term that penalizes the complexity of the trees to prevent overfitting. A typical form of Ω ( f ) is as follows:
Ω f = γ T + 1 2 λ j = 1 T ω J 2
where T is the number of leaves in the tree, ω is the score of the j-th leaf, and γ and λ are hyperparameters controlling the penalty on the number of leaves and the scores of leaves, respectively. During training, XGBoost approximates the loss function using a second-order Taylor expansion and greedily adds trees that minimize the objective function. XGBoost offers high accuracy and scalability, but it is computationally intensive and requires careful tuning.

2.3.4. LightGBM

LightGBM is a gradient boosting framework that uses tree-based learning algorithms. It is designed to be distributed and efficient, with a focus on speed and accuracy. The basic principle of LightGBM can be described through the following steps: Splitting Decision, Leaf-wise Growth, Gradient-based Splitting [53].
The formula for the prediction in LightGBM is similar to that of other gradient boosting algorithms:
F x = i = 1 I α h i ( x )
where F x represents the final prediction for input x, I is the number of iterations (trees), α is the weight of the i-th tree, and h i ( x ) is the prediction of the i-th tree on input x .
LightGBM is a powerful and efficient machine learning algorithm that is well-suited for large-scale data analysis. Its Leaf-wise Growth strategy, efficient implementation, and focus on speed make it a popular choice for many applications.

2.3.5. CAT Boost

CatBoost is a Gradient Boosting Decision Tree (GBDT) framework. It builds upon the principles of gradient boosting, where a strong predictor is constructed by combining multiple weak predictors in a sequential manner [56]. CatBoost handles categorical features by converting them into numerical features through a process called “ordered boosting”. It calculates the best split points for categorical features by considering the distribution of the target variable within each category. This approach ensures that the model can effectively learn from categorical data without the need for one-hot encoding or other preprocessing steps. CatBoost excels in handling large and intricate datasets, and its complexity and resource requirements should be taken into account when deciding on its application.

2.4. Hyperparameter Tuning and Model Evaluation

Although most machine learning models can achieve satisfactory predictive outcomes using default parameters, hyperparameter tuning is essential for attaining the true optimal performance of machine learning models on experimental data. While machine learning models have many hyperparameters, only a subset significantly enhances model performance. This study employs the GridSearchCV technique to optimize the primary hyperparameters of each model. GridSearchCV is a hyperparameter tuning method that integrates grid search with cross-validation (CV), systematically traversing a predefined grid of hyperparameter combinations and evaluating each set’s performance using CV. Specifically, the training set is partitioned into 5 folds (4 for training and 1 for validation per iteration), with 5 cycles ensuring every subset participates in validation. The optimal parameter configuration is ultimately selected based on the highest mean performance metric across all validation cycles. And the metrics of each model to measure the prediction of the tensile strength and elastic modulus of basalt fibers are the coefficient of determination (R2), the Mean Squared Error (MSE), the Mean Absolute Error (MAE), and the Root Mean Squared Error (RMSE).
The coefficient of determination (R2) measures how well a statistical model predicts an outcome. It is calculated as the regression sum of squares divided by the total sum of squares and quantifies the effectiveness of the model in predicting the outcome:
R 2 = 1 i ( y i ^ y i ) 2 i ( y i ¯ y i ) 2
The MSE indicates the proximity of a regression line to a given set of data points. Furthermore, it is calculated as the average of the squared differences between the actual values and the predicted values. The RMSE is the square root of the MSE. The MAE measures the average absolute difference between the predicted values and the actual values.
M S E = 1 n i = 1 n ( y i y i ^ ) 2
R M S E = 1 n i = 1 n ( y i y i ^ ) 2
M A E = 1 n i = 1 n y i y i ^
In the above equations, from Equation (12) to Equation (15), y i represents the actual value of n-samples, y i ^ is the predicted value corresponding to y i , and y i ¯ is the average value of n-samples.

2.5. SHAP Analysis

SHAP is a method for interpreting the prediction results of machine learning models. Its core idea is to decompose the prediction results into the influence of each feature by calculating the SHAP value of each feature variable to quantify its contribution to the prediction results [57]. This enables a clear visualization of the role that each feature variable plays in the model’s predictions, thus achieving model interpretability. The SHAP interpretability analysis aids in analyzing the critical feature variables and their ranges that affect the tensile strength and elastic modulus of basalt fibers, as well as the dependency relationships between these properties and the feature variables.
The ensemble learning process used in this study is shown in Figure 1.

3. Results and Discussion

3.1. Data Description

The Kolmogorov–Smirnov test results (Table 1) demonstrate that all feature variables (including Al2O3, Fe2O3, and 10 other oxides) exhibit statistically validated distributional consistency between the training and testing datasets (p > 0.05). The maximum Kolmogorov–Smirnov statistic was observed for Fe2O3 (D = 0.208, p = 0.164), which, despite representing the highest deviation among features, remains below the conventional significance threshold (α = 0.05). These findings confirm that stratified sampling effectively preserved data distribution homogeneity across the datasets, meeting the statistical prerequisites for subsequent modeling. This ensures the reliability of model evaluation outcomes in predicting basalt fiber mechanical properties.
Figure 2 depicts the PCCs among different variables. All absolute PCC values were less than 0.76, and only eight variable pairs, namely NBO/T-Al2O3, NBO/T-CaO, NBO/T-MgO, NBO/T-Ma, Mv-MgO, Mv-Ma, Ma-CaO, and Ma-MgO, had PCC values greater than 0.60, which involve derivative variables paired with oxides. This is because derivative variables are inherently derived from oxide variables, establishing a strong intrinsic link between them. Furthermore, the correlation coefficients among individual oxides are all less than 0.60, indicating that the compositional contents of each oxide are inherently independent. In conclusion, the results of the correlation analysis indicate that the correlations among all variables are not strong. This characteristic is advantageous for reducing overfitting phenomena, decreasing model complexity, and enhancing model selectivity and reliability.

3.2. The Performance of Ensemble Learning Models

Table 2 presents the statistical performance metrics (R2, MSE, RMSE, and MAE) for the ensemble learning models in predicting the tensile strength and elastic modulus. The XGBoost model outperformed others in the tensile strength prediction during both the training and testing phases, with the highest R2 and the lowest MSE, RMSE, and MAE. Specifically, during the model testing phase, the XGBoost model demonstrated a higher prediction accuracy for the tensile strength compared to other models, with an R2 of 0.9152, MSE of 0.2867, RMSE of 0.5354, and MAE of 0.6091. The minimal variance of its prediction errors further confirms superior stability. In contrast, the RF model demonstrated the least predictive capability, reflected by its R2 of 0.6607, MSE of 1.9816, RMSE of 1.4077, and MAE of 1.1277 during the testing phase, where significantly higher error variance indicates unstable outputs. Overall, the XGBoost model provided a reliable prediction of the tensile strength based on basalt oxide compositions and derived variables, as evidenced by minimal errors and an R2 approaching 1. Furthermore, the lower R2 values observed during the testing phase compared to the training phase suggest that the XGBoost model was not overfitted. The CatBoost model surpassed all others in predicting the elastic modulus, achieving the highest R2 of 0.9803 and the lowest MSE, RMSE, and MAE values of 0.1209, 0.3478, and 0.2692, respectively, during both the training and testing phases. Its low error variance establishes unmatched consistency in predictions. Similarly, the R2, MSE, and RMSE values of the CatBoost model were lower during the testing phase compared to the training phase, suggesting the absence of overfitting phenomena in the CatBoost modeling process.
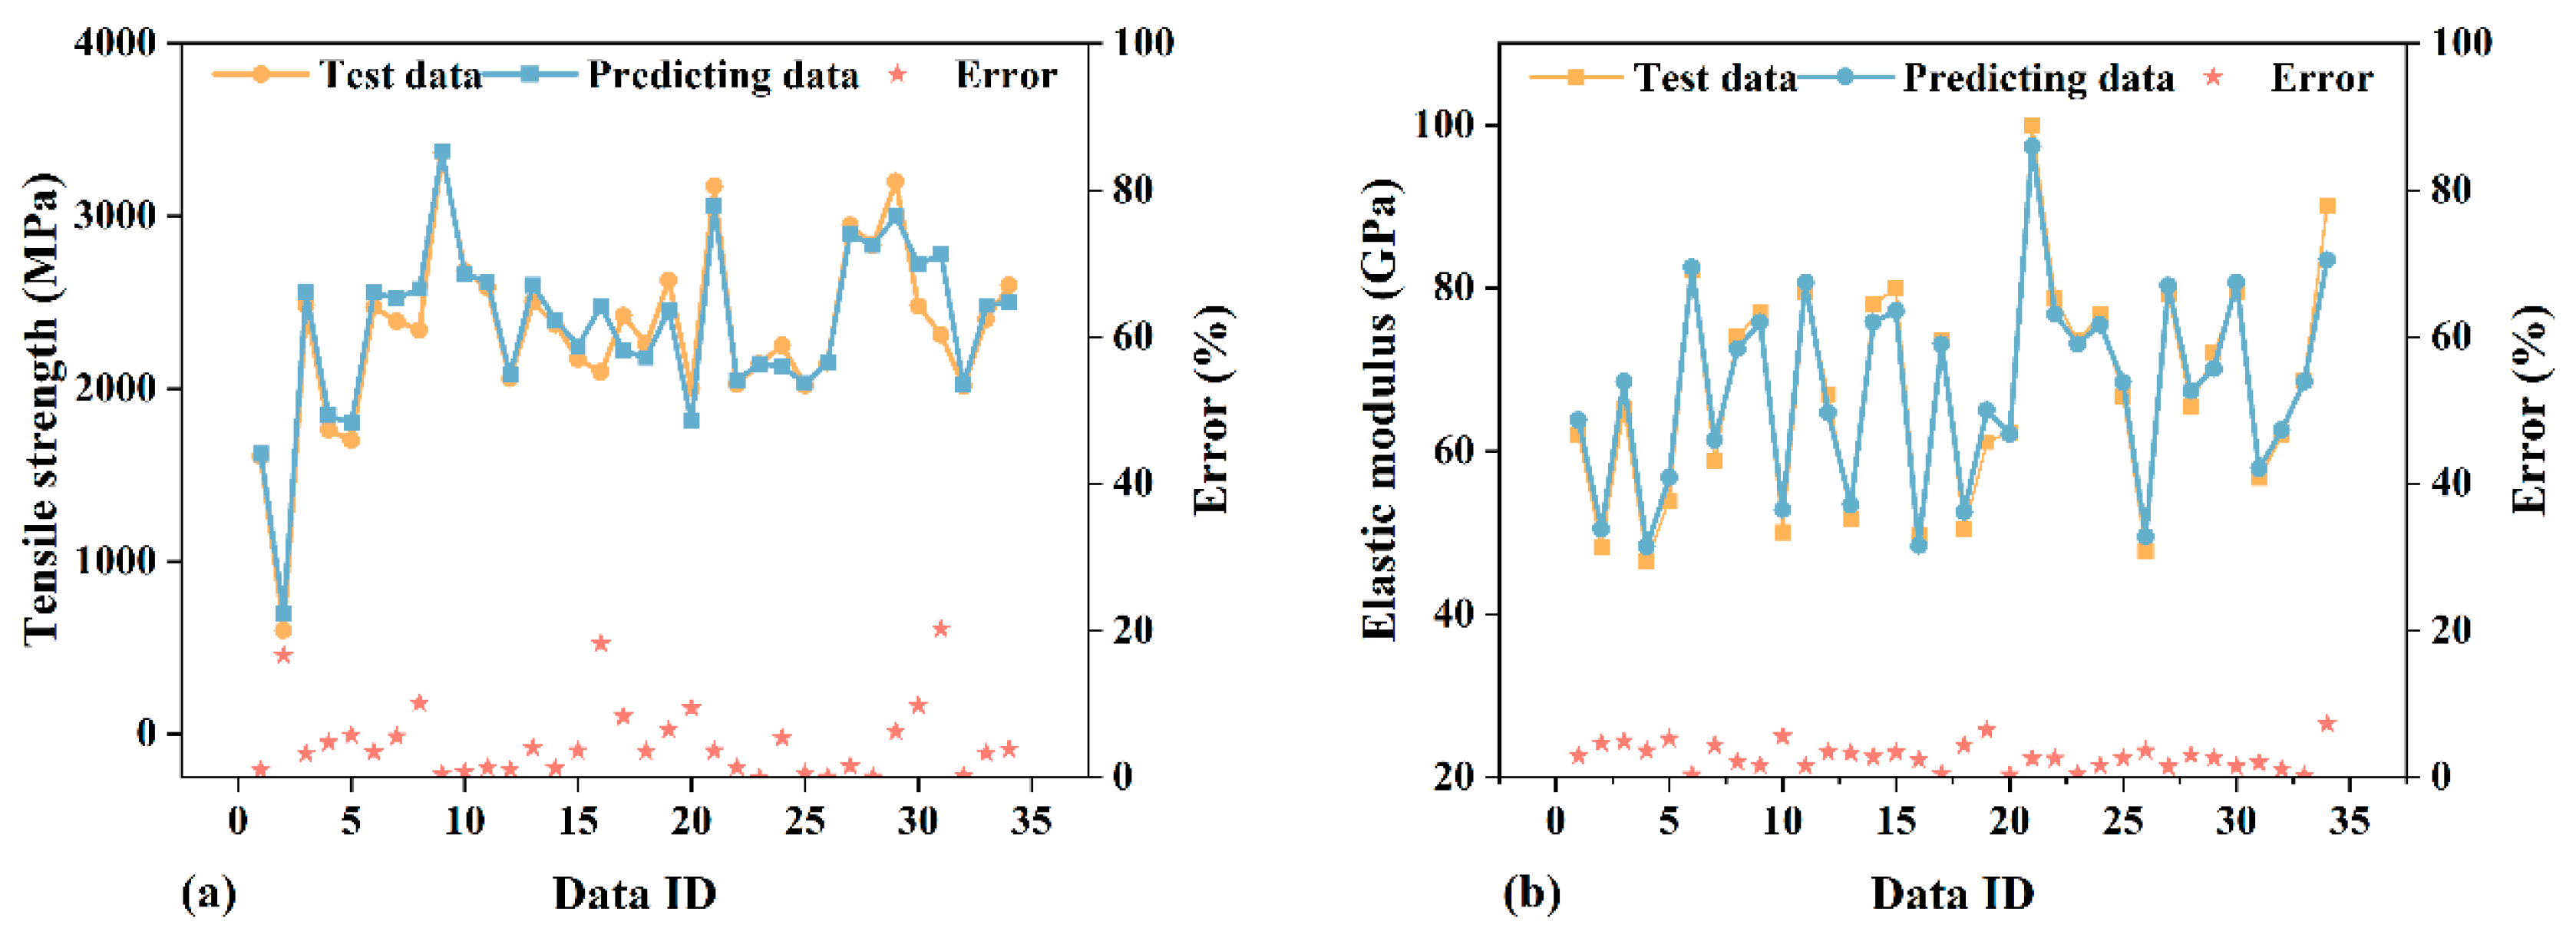
Figure 3 illustrate the test data and predicting data of the tensile strength and elastic modulus using the XGBoost and CatBoost models, respectively. It can be observed that the predicting data for the tensile strength and elastic modulus align well with the test data, with mean absolute error values of only 4.85% and 2.84%, respectively, further demonstrating the effectiveness of the XGBoost and CatBoost models in predicting the tensile strength and elastic modulus.
The XGBoost and CatBoost models demonstrate excellent predictive performance in forecasting the tensile strength and elastic modulus. Both of them utilize gradient boosting, leveraging optimization algorithms and parallel processing to ensure efficient training and prediction. The results also indicate that the Boosting algorithm successfully captured the essence of tensile strength and elastic modulus prediction in complex and diverse data environments. Additionally, the XGBoost and CatBoost models exhibit superior adaptability to small data samples and outperform other ensemble models in predictive performance.
Based on the comparison of research results using machine learning or traditional regression models to predict the mechanical properties of basalt fibers (Table 3), superior predictive accuracy was achieved in this study.

3.3. Feature Importance Measured by SHAP Analysis

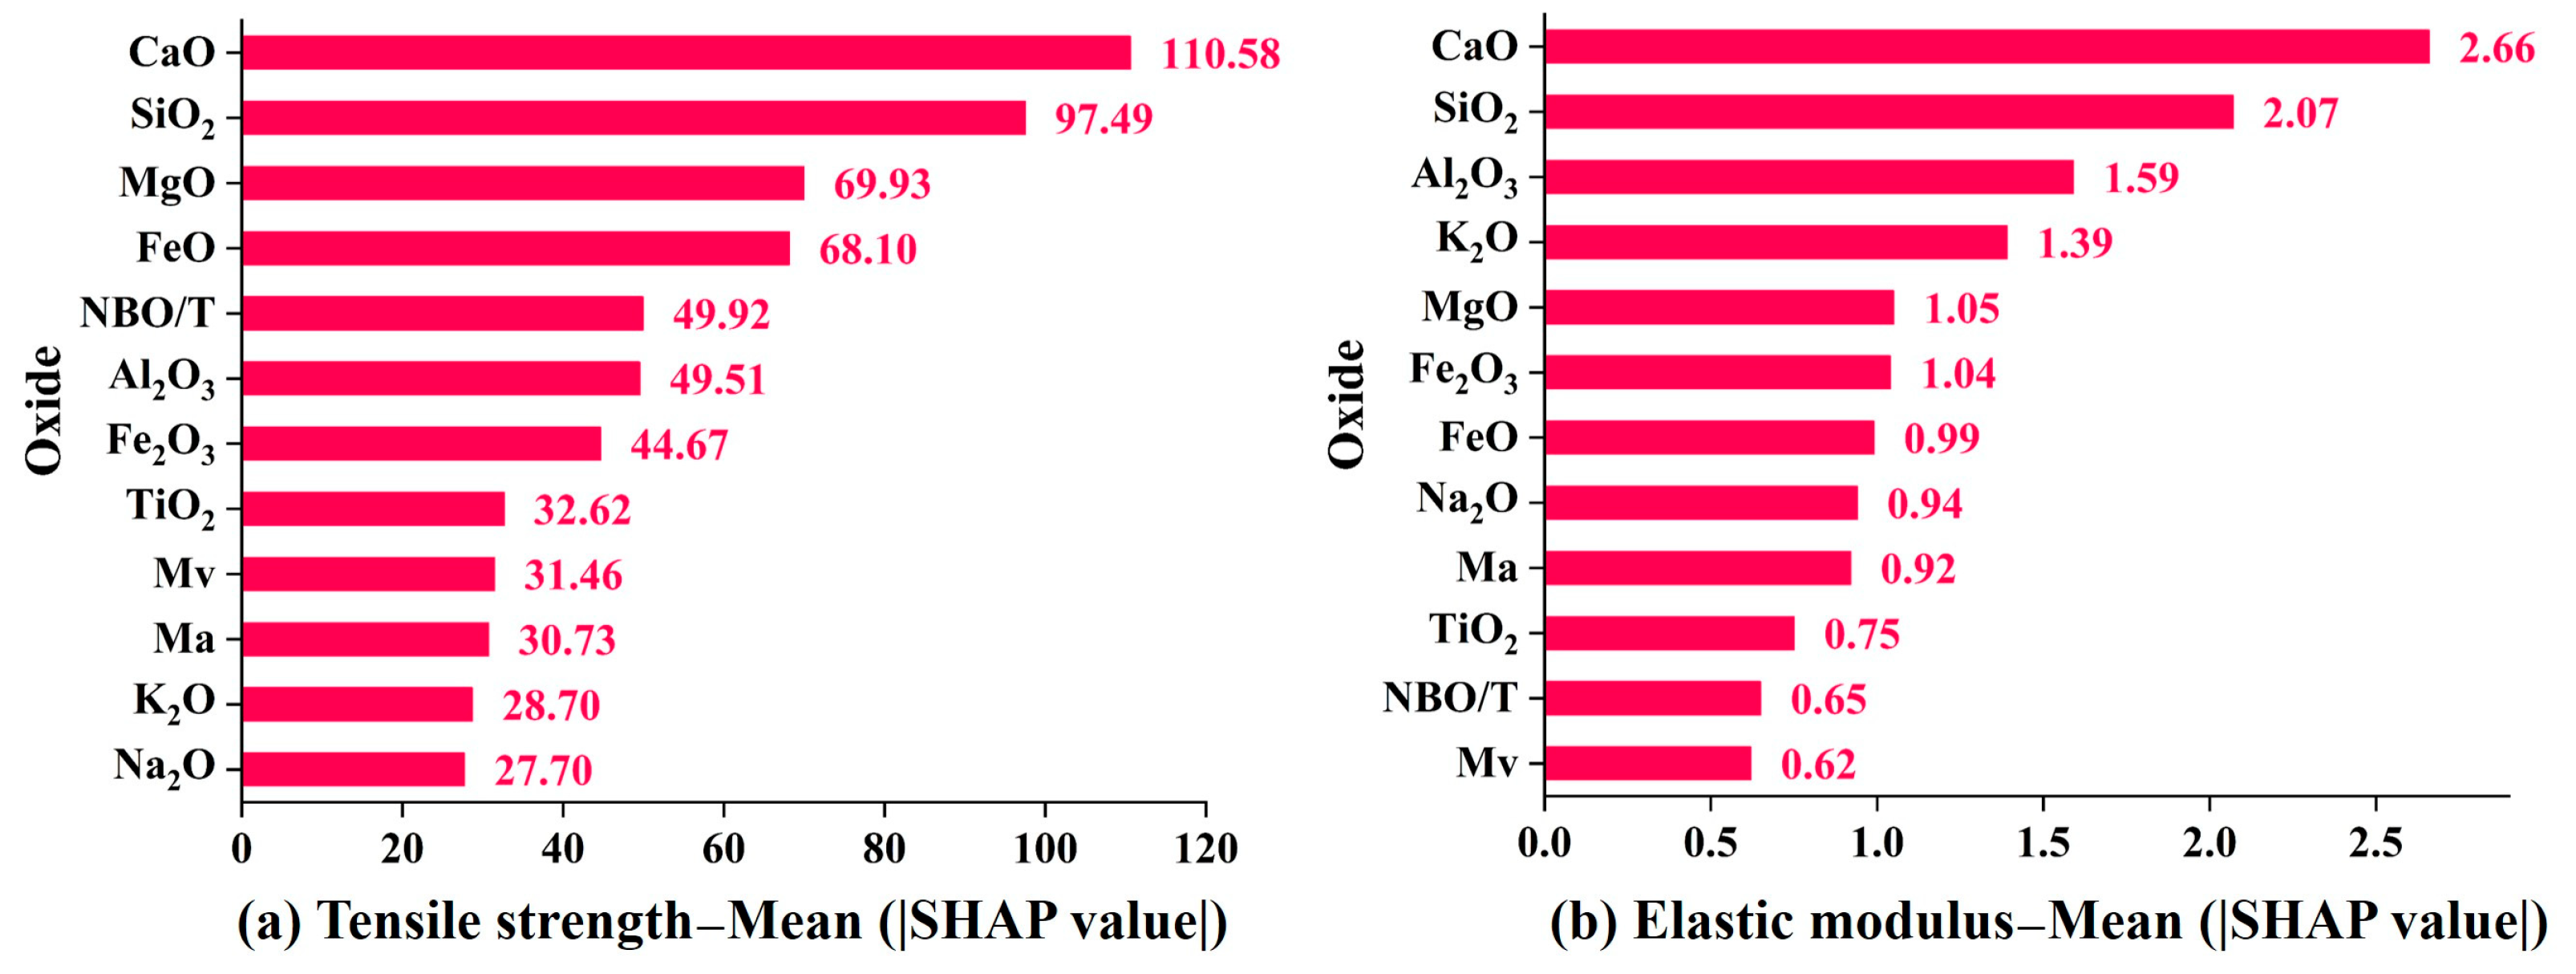
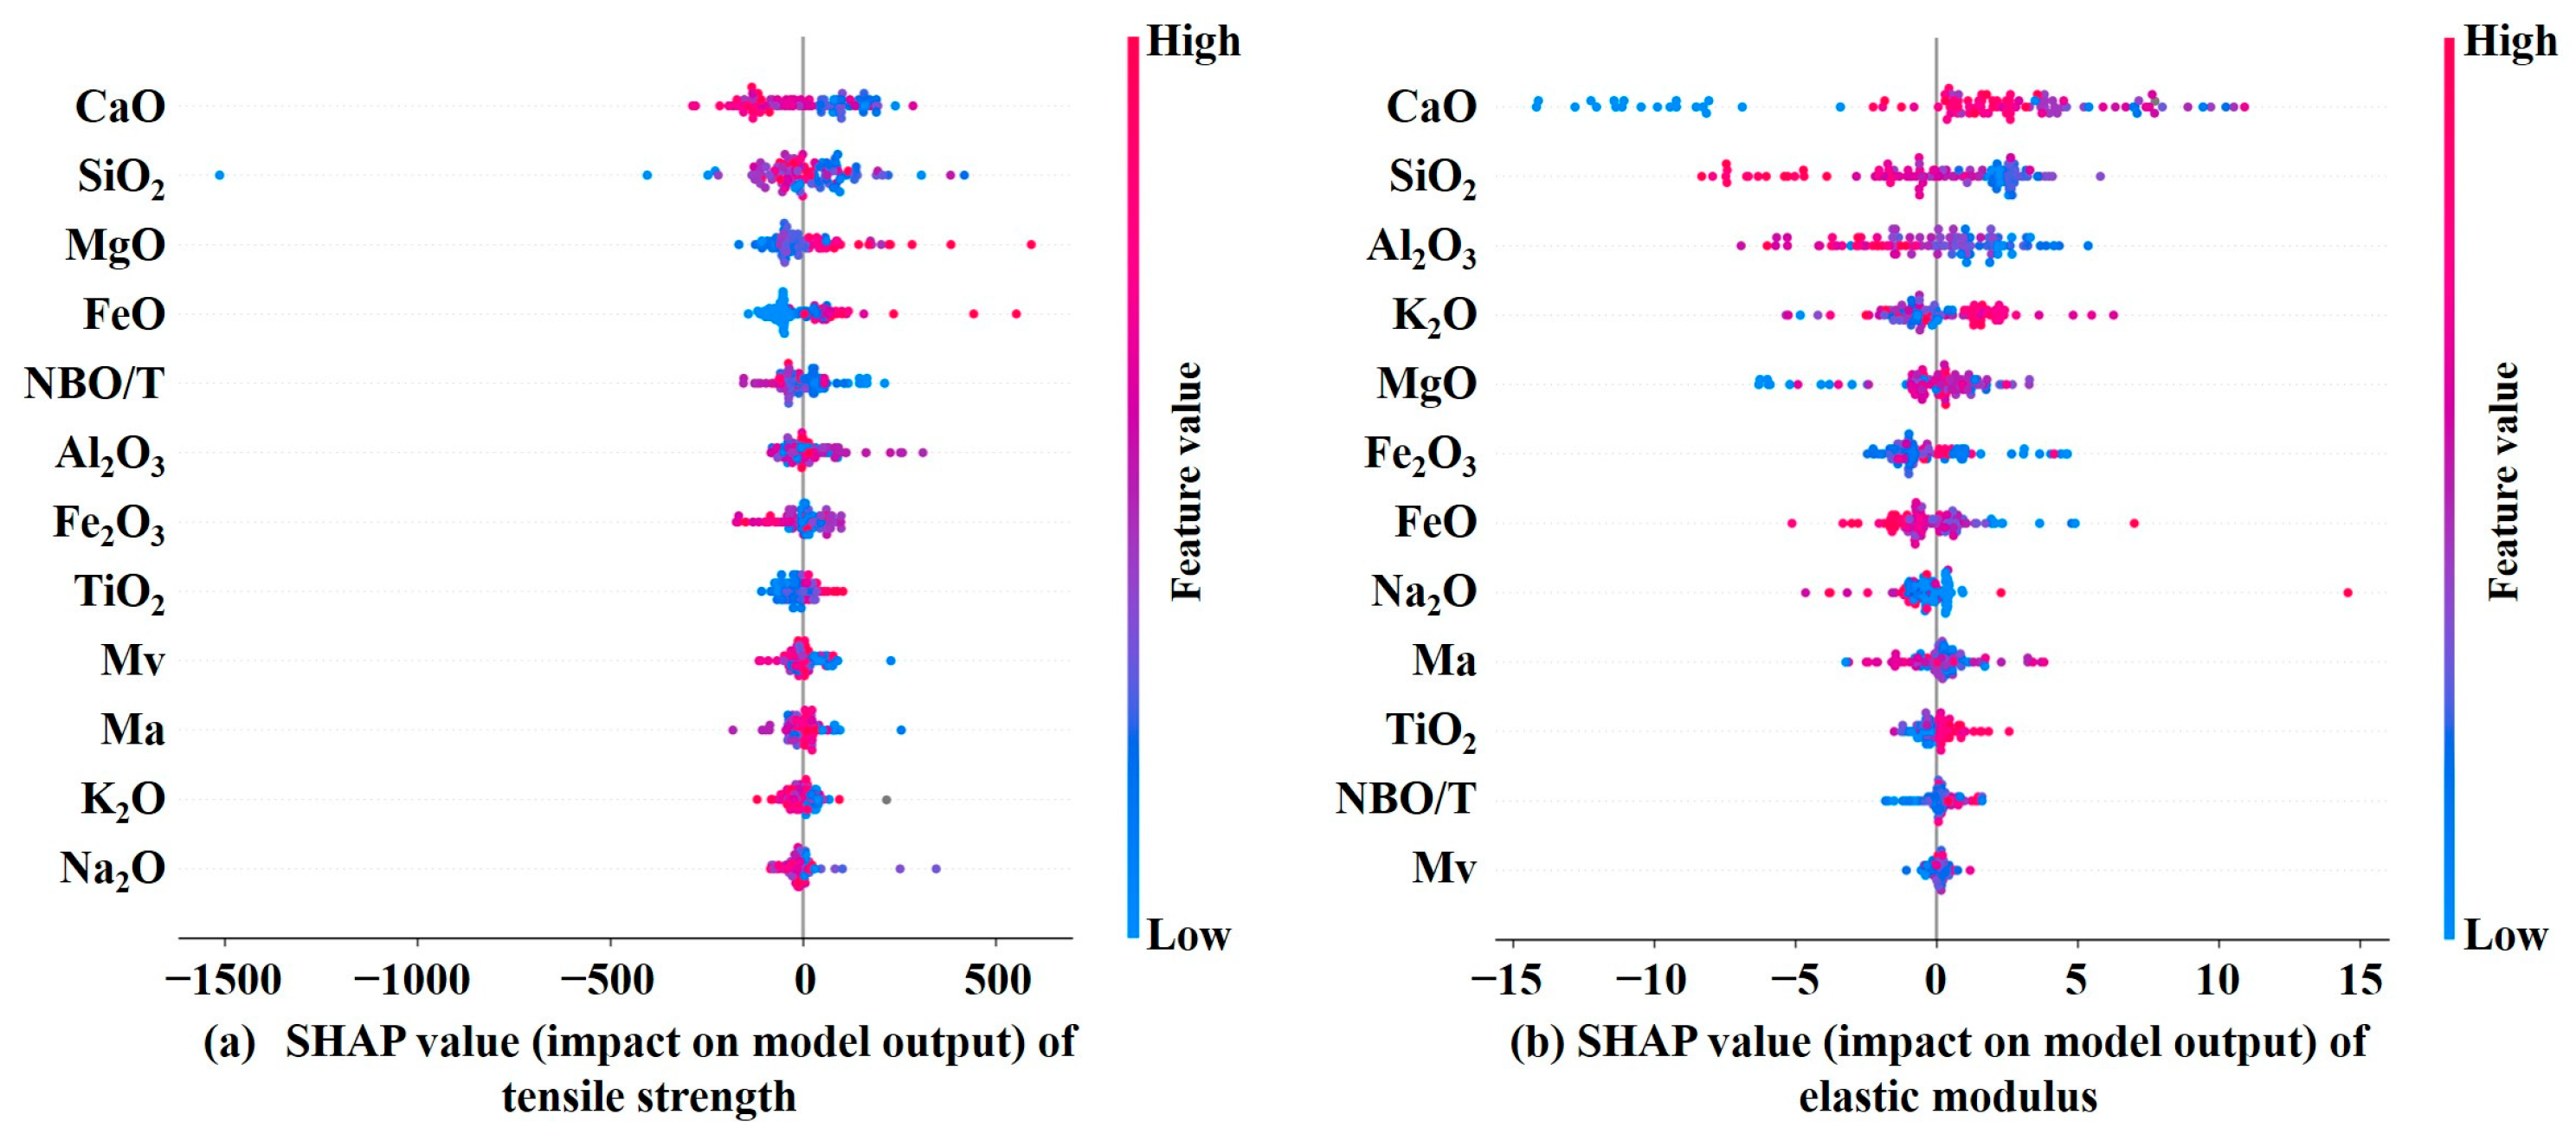
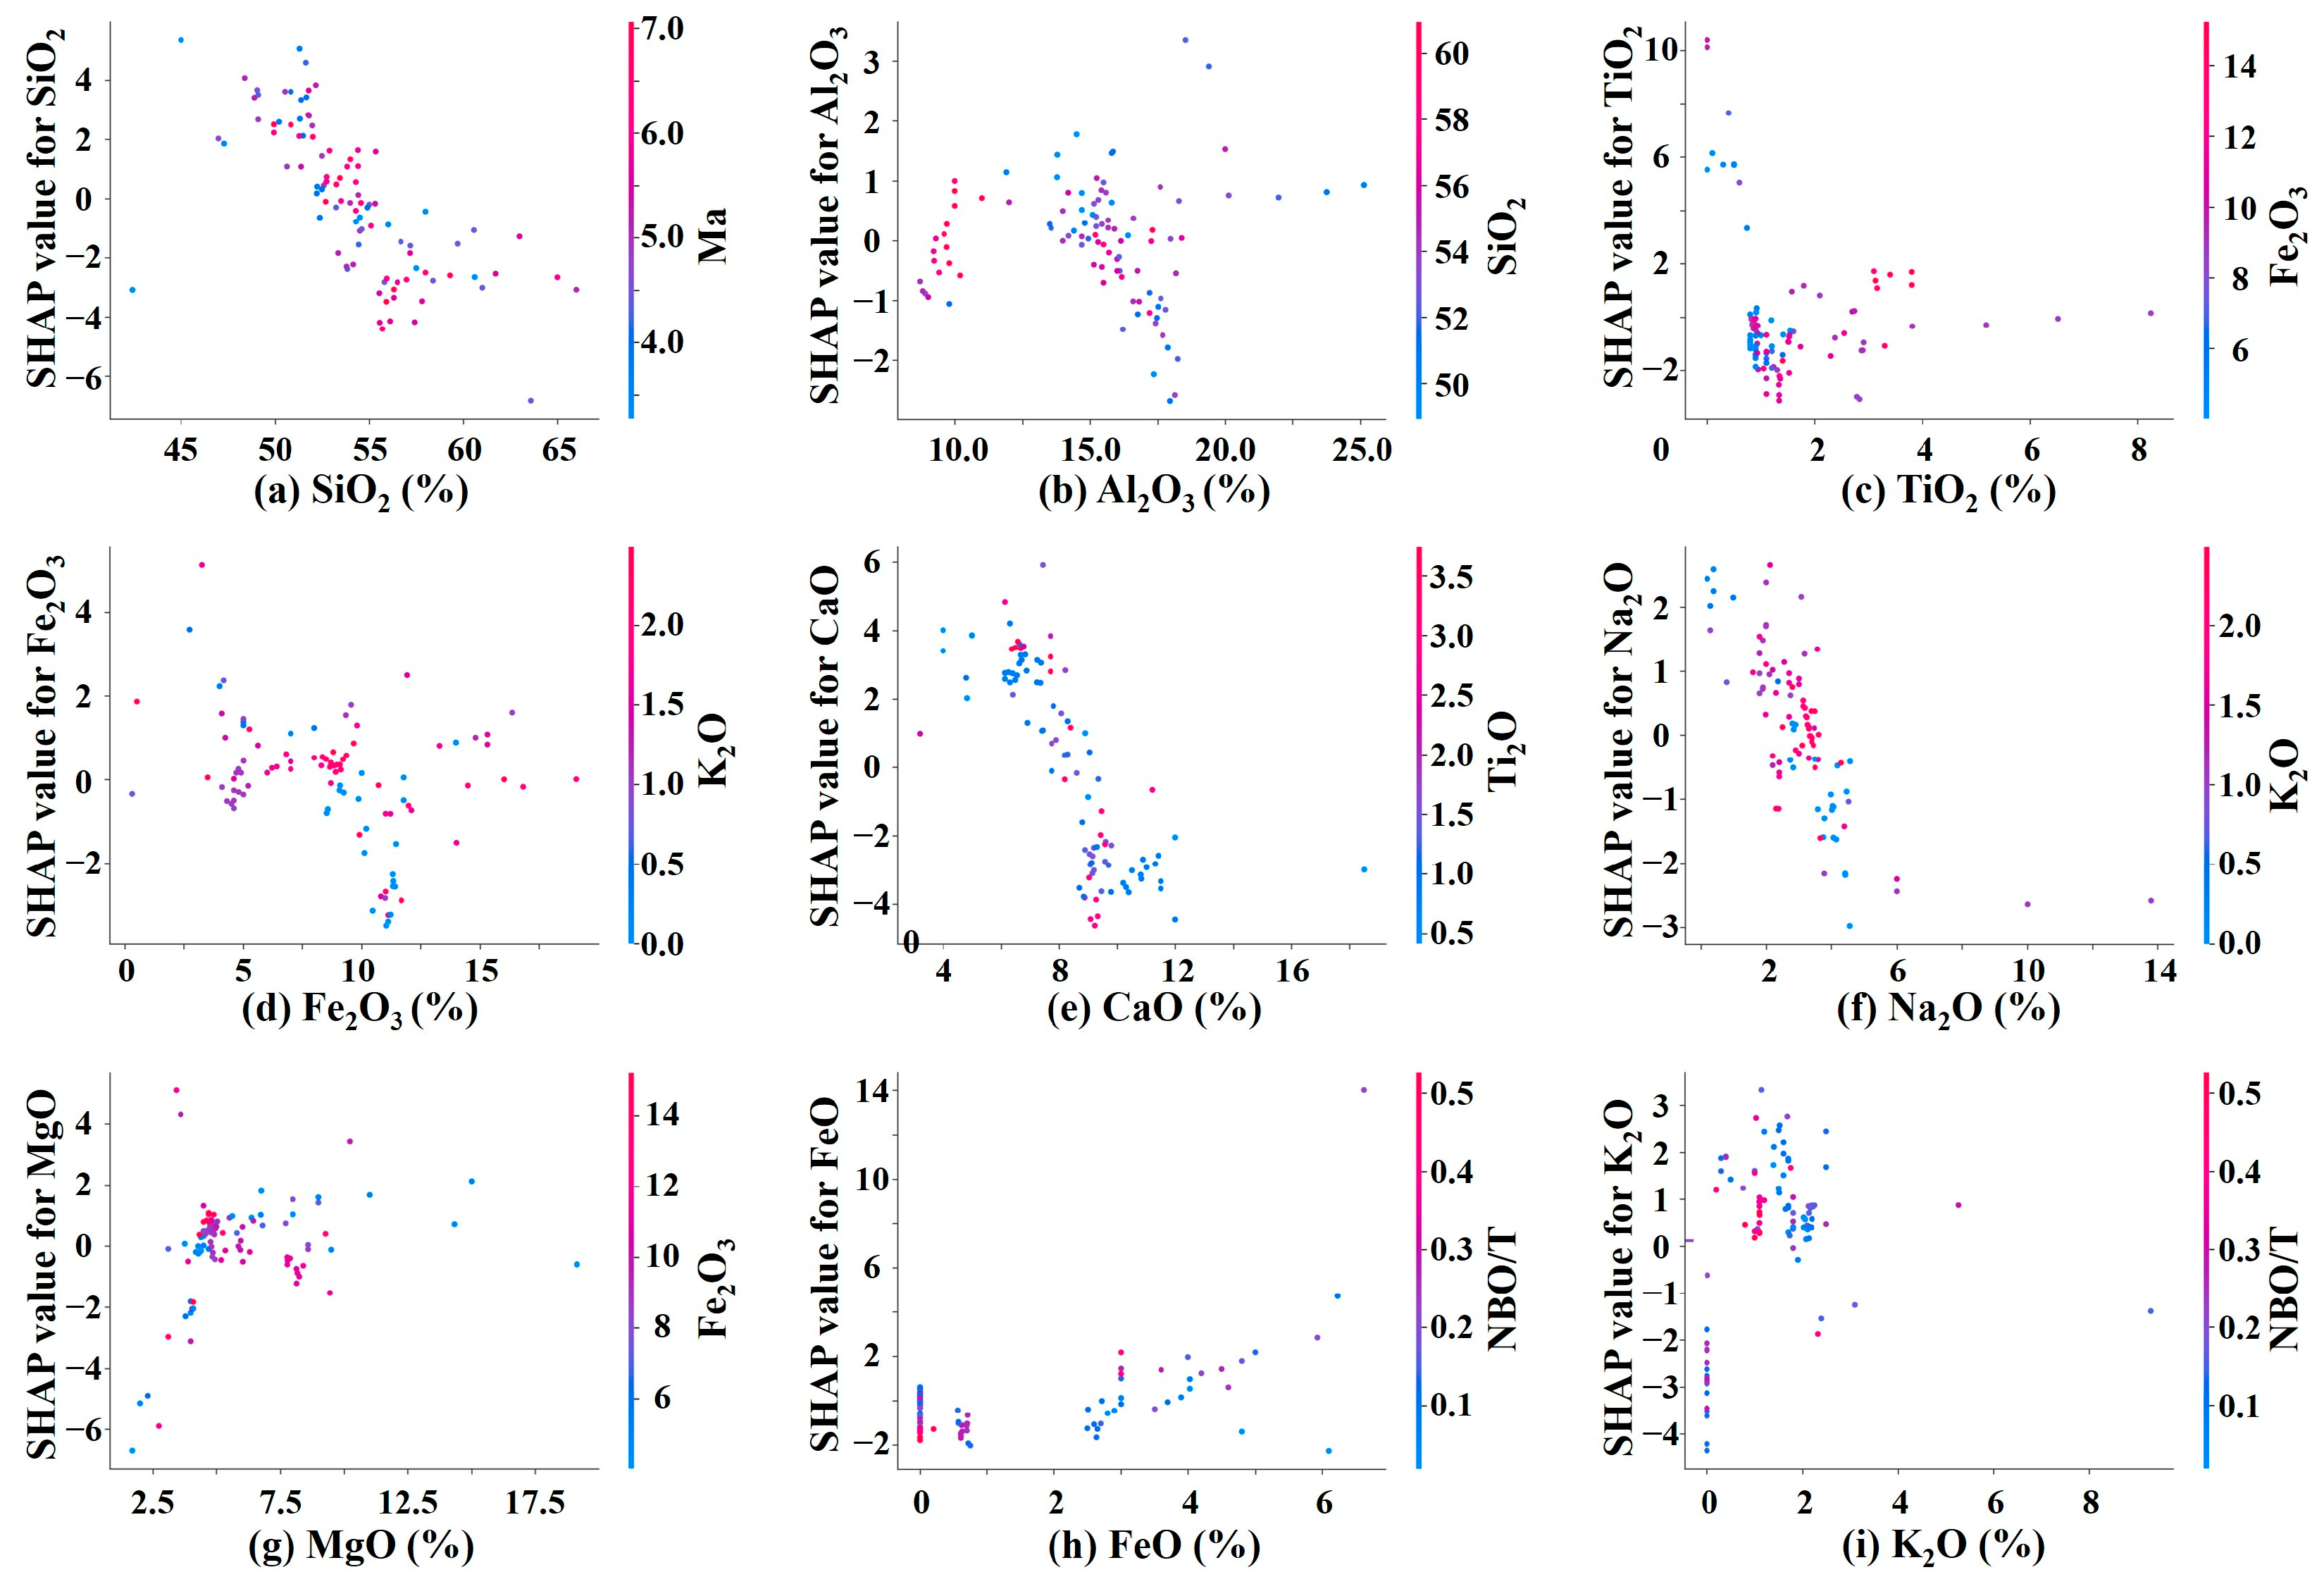
The importance of each feature variable obtained by sorting mean absolute SHAP values and SHAP values based on tensile strength and elastic modulus prediction performance is shown in Figure 4 and Figure 5, respectively. The dependence plots of variables are shown in Figure 6 and Figure 7. They clearly demonstrate how individual feature variables, as well as those with the strongest interactions, affect the model’s prediction results. The ranking of feature variables in predicting the tensile strength using the XGBoost model is as follows: CaO, SiO2, MgO, FeO, NBO/T, Al2O3, Fe2O3, TiO2, Mv, Ma, K2O, and Na2O (Figure 4a). CaO and SiO2 are the most influential oxides, with SHAP values of 110.58 and 97.49, respectively. SiO2 and Al2O3 generally serve as the backbone of basalt glass, commonly existing in the form of silicon–oxygen tetrahedra [SiO4] and aluminum–oxygen tetrahedra [AlO4] [61]. Together, they form the basalt glass network, providing basalt fibers with basic tensile strength and deformation resistance.

3.4. Optimal Oxide Ranges for Predicting the Tensile Strength and Possible Mechanism

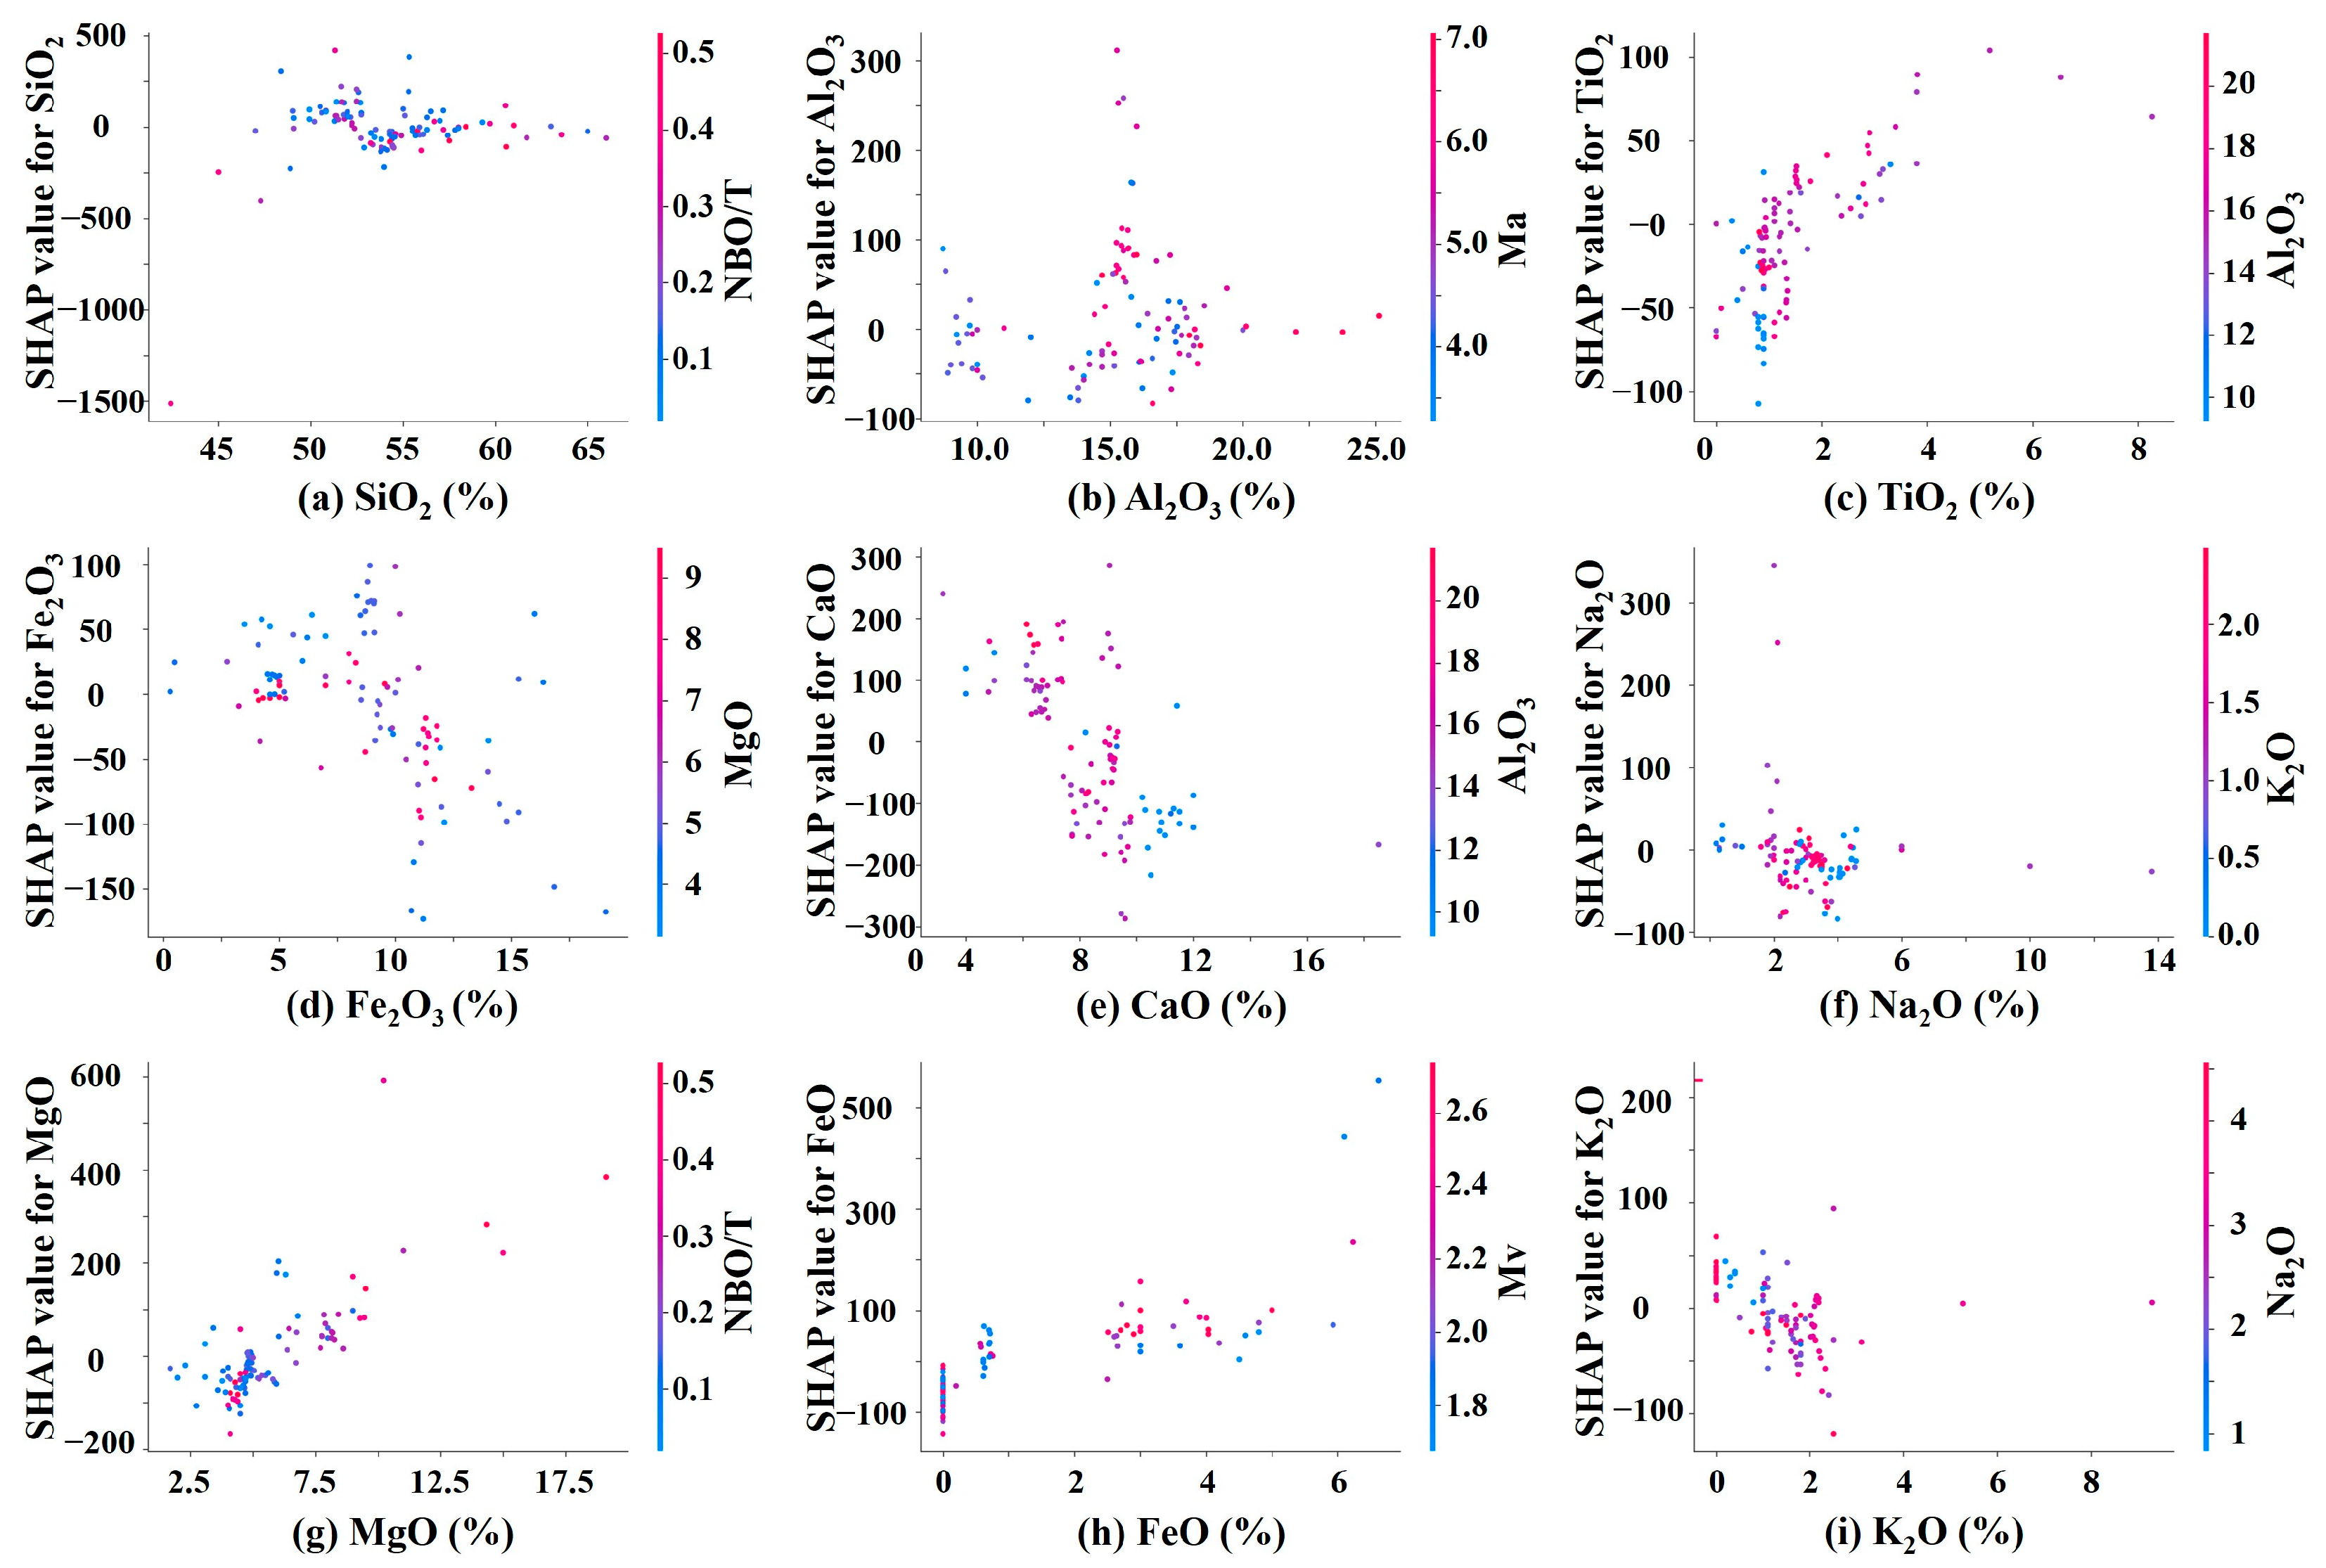
SHAP dependence plots visualize the influence of individual features on model predictions. The x-axis represents feature values, while the y-axis indicates corresponding SHAP values (marginal contributions). Color mapping reflects feature magnitude (red: high values; blue: low values) or interaction effects. Red regions signify positive predictive impacts from high feature values, whereas blue areas denote negative influences from low values. Combined with SHAP values, this visualization reveals dynamic relationships (e.g., ascending/descending trends or nonlinear patterns) between feature variations and prediction variables, facilitating the interpretation of model decision-making mechanisms.
As shown in Figure 6a,b, SiO2 and Al2O3 in the ranges of 48.39–63.00% and 8.70–25.13%, respectively, contribute positively to improving the tensile strength of basalt fibers. The tensile strength of continuous basalt fibers is intrinsically linked to the structural integrity of the basalt glass network. Enhanced network compactness correlates with increased tensile strength, whereas structural disorder in the glass network diminishes it. Specifically, SiO2 and Al2O3 act as network formers that promote atomic packing density, thereby improving the tensile strength of continuous basalt fibers. The Ca2+ found in calcium oxide does not participate in the formation of the basalt glass network [18]. An appropriate Ca2+ content can balance the charges within the basalt glass network, contributing to the increased tensile strength of basalt fibers. However, excessive Ca2+ polarizes bridging oxygen and weakens silicon–oxygen bonds, thus lowering the tensile strength of the basalt fibers. It is evident that larger CaO content (red points) might negatively impact the tensile strength, as shown in Figure 5a, whereas CaO levels between 3.20% and 11.41% can increase the tensile strength of basalt fibers (Figure 6e).
Overall, MgO behaves similarly to CaO, while the Mg ion has a smaller radius than the Ca ion. Therefore, a relatively high content of Mg ions has a limited effect on the distortion of the basalt fiber network, which can improve network polymerization and increase fiber length. According to Figure 6g, the appropriate MgO content to increase the strength of basalt fibers is 3.10–15.00%. FeO also functions similarly to CaO overall. When its content is between 0.57% and 6.62%, increasing FeO content can increase the tensile strength of basalt fibers (Figure 6h). An increase in Fe2O3 content indicates the presence of more Fe3+ ions in basalt glass, which promotes the spontaneous crystallization of basalt glass melt during fiber formation, thereby reducing the fiber tensile strength [23]. As shown in Figure 6d, a lower Fe2O3 content (ranging from 0.30 to 16.37%) is conducive to increasing the fiber tensile strength. TiO2, Mv, Ma, K2O, and Na2O are the least influential in predicting the tensile strength. The respective ranges of their positive influence on basalt fiber tensile strength are listed in Table 4.

3.5. Optimal Oxide Ranges for Predicting the Elastic Modulus and Possible Mechanism

Figure 4b and Figure 5b illustrate the importance ranking of feature variables affecting the elastic modulus of basalt fibers. The ranking is in the order of CaO, SiO2, Al2O3, K2O, MgO, Fe2O3, FeO, Na2O, Ma, TiO2, NBO/T, and Mv. The elastic modulus of basalt fibers originates from the energy of the glass network, which depends on the atomic packing density and dissociation energy per unit volume of basalt glass. Specifically, it is influenced by the radius, atomic mass, field strength, and oxygen bonding ability of metal cations within the system.
SiO2 and Al2O3 constitute the backbone of the basalt fiber network, and their influence on the elastic modulus of basalt fibers ranks highly in importance. CaO, K2O, MgO, Fe2O3, FeO, and Na2O, among others, are network modifiers for the fibers, where metal cations primarily serve to balance the fiber’s charge and influence the atomic packing density. Among them, the Ca2+ ion has a relatively large ionic radius (99 pm) and a moderate charge, making it an appropriate network modifier that helps balance the energy of the basalt glass network [62]. The K+ ion has the largest ionic radius (133 pm) and carries fewer charges, resulting in greater distortion energy when inserted into the basalt fiber network, potentially disrupting the energy balance of the basalt glass network [59]. Therefore, both CaO and K2O exert significant effects on the elastic modulus of basalt fibers. As shown in Figure 4b, MgO, Fe2O3, FeO, Na2O, TiO2, and other variables have relatively minor impacts on the elastic modulus. Table 4 and Figure 7 also outline the ranges within which the feature variables positively contribute to the elastic modulus.

3.6. Limitations and Future Directions

Although this study effectively predicted the tensile strength and elastic modulus of basalt fibers through ensemble learning, the following limitations persist: First, the limited sample size (n = 168) may lead to high sensitivity in hyperparameter tuning and constrained stability of the grid search, necessitating mitigation using data expansion combined with transfer learning. Second, the predictive accuracy of single ensemble models (e.g., standalone XGBoost/CatBoost) remains improvable, prompting plans to construct dynamic weighting or stacking ensemble frameworks to integrate multi-model advantages. Third, the cost-effectiveness of machine learning remains insufficiently validated, requiring more experimental validation under actual operating conditions. Notably, this study innovatively combines ensemble learning with SHAP analysis, enabling both performance prediction and mechanistic interpretation of composition–property relationships, which complements the physicochemical mechanisms of oxides. And the computational costs were substantially lower than traditional experimentation (∼USD 2000 per experimental trial, as quoted by the Yingkou Jianke Basalt Fiber Research Institute). Future research directions include (1) constructing multi-objective joint optimization frameworks; (2) developing physics-informed interpretable models to deepen understanding of composition–structure–property linkages; and (3) promoting real-time online prediction applications in industrial basalt fiber production.

4. Conclusions

This study innovatively integrates five ensemble learning models, namely Random Forest, Extra Tree Regression, XGBoost, LightGBM, and CatBoost, with SHAP analysis to enable accurate performance prediction and interpretable composition–property insights, complementing physicochemical oxide mechanisms while achieving computational costs substantially lower than traditional experiments. Based on the research results, the main conclusions are as follows:
(1) The XGBoost and CatBoost models demonstrated the best performance in predicting the tensile strength and elastic modulus, respectively. XGBoost demonstrated superior tensile strength prediction accuracy (R2 = 0.9152, MSE = 0.2867, RMSE = 0.5354, and MAE = 0.6091), while CatBoost achieved optimal elastic modulus estimation (R2 = 0.9803, MSE = 0.1209, RMSE = 0.3478, and MAE = 0.2692), outperforming all comparative models.
(2) The ranking of feature variables influencing the tensile strength and elastic modulus of basalt fibers is as follows: CaO, SiO2, MgO, FeO, NBO/T, Al2O3, Fe2O3, TiO2, Mv, Ma, K2O, and Na2O for the tensile strength, and CaO, SiO2, TiO2, K2O, MgO, Fe2O3, FeO, Na2O, Ma, Al2O3, NBO/T, and Mv for the elastic modulus.
(3) CaO and SiO2 significantly affected both the tensile strength and elastic modulus. As the primary network former with the highest content, SiO2 promotes atomic packing density, thereby significantly enhancing the tensile strength and elastic modulus of continuous basalt fibers. The Ca2+ ion has a relatively large ionic radius and a moderate charge, making it an appropriate network modifier that helps balance the energy of the basalt glass network, which affects the tensile strength and elastic modulus.
(4) The ranges of feature variables that positively influence both the tensile strength and elastic modulus were identified using dependence plots.
This ensemble machine learning approach not only successfully predicts the mechanical properties of basalt fibers but also enables the determination of fiber drawing feasibility, thereby facilitating the rapid selection of high-quality basalt raw materials, significantly reducing experimental costs, and enhancing production efficiency.

Supplementary Materials

The following supporting information can be downloaded at https://www.mdpi.com/article/10.3390/su17167387/s1.

Author Contributions

Conceptualization, G.L. and L.Z. (Lunlian Zheng); methodology, L.Z. (Ling Zhang); software, P.L.; validation, L.Y., G.L., and L.Z. (Ling Zhang); formal analysis, L.Z. (Lunlian Zheng); investigation, P.L.; resources, G.L.; data curation, L.Y.; writing—original draft preparation, G.L.; writing—review and editing, L.Z. (Ling Zhang) and L.Y.; visualization, L.Z. (Lunlian Zheng) and P.L.; supervision, L.Z. (Ling Zhang); project administration, L.Y.; funding acquisition, G.L., L.Z. (Ling Zhang), and L.Y. All authors have read and agreed to the published version of the manuscript.

Funding

This work was supported by the National Natural Science Foundation of China (52004228, 52474104), the Shandong Provincial Natural Science Foundation (ZR2021QE016), and the Shandong Key Laboratory of Intelligent Magnetoelectric Equipment and Mineral Processing Technology.

Institutional Review Board Statement

Not applicable.

Informed Consent Statement

Not applicable.

Data Availability Statement

Data will be made available upon request.

Conflicts of Interest

The authors declare no conflicts of interest.

References

  1. Deák, T.; Czigány, T. Chemical Composition and Mechanical Properties of Basalt and Glass Fibers: A Comparison. Text. Res. J. 2009, 79, 645–651. [Google Scholar] [CrossRef]
  2. Girnis, A.V. Partition of Trace Elements between Minerals and Melt: Parameterization of Experimental Data on Olivine, Pyroxene, and Feldspars. Geochem. Int. 2024, 62, 221–233. [Google Scholar] [CrossRef]
  3. Khater, G.A.; Gomaa, M.M.; Kang, J.; Mahmoud, M.A. Effect of CaO/SiO2 molar ratio on the electrical and physical properties of basaltic glass materials. Heliyon 2019, 5, e01248. [Google Scholar] [CrossRef] [PubMed]
  4. Liu, J.; Yang, J.; Chen, M.; Lei, L.; Wu, Z. Effect of SiO2, Al2O3 on heat resistance of basalt fiber. Thermochim. Acta 2018, 660, 56–60. [Google Scholar] [CrossRef]
  5. Soares, B.; Preto, R.; Sousa, L.; Reis, L. Mechanical behavior of basalt fibers in a basalt-UP composite. Procedia Struct. Integr. 2016, 1, 82–89. [Google Scholar] [CrossRef]
  6. Zhang, L.; Yang, L.; Lai, C.; Fu, D.; Lin, J.; Hou, H.; Zhao, Y.; Zhang, Z.; Bu, C.; Zheng, X. Prediction of tensile strength of basalt continuous fiber from chemical composition using machine learning models. Polym. Compos. 2023, 44, 6634–6645. [Google Scholar] [CrossRef]
  7. Yan, L.; Chu, F.; Tuo, W.; Zhao, X.; Wang, Y.; Zhang, P.; Gao, Y. Review of research on basalt fibers and basalt fiber-reinforced composites in China (I): Physicochemical and mechanical properties. Polym. Polym. Compos. 2021, 29, 1612–1624. [Google Scholar] [CrossRef]
  8. Adesina, A. Performance of cementitious composites reinforced with chopped basalt fibres—An overview. Constr. Build. Mater. 2021, 266, 120970. [Google Scholar] [CrossRef]
  9. Balaji, K.V.; Shirvanimoghaddam, K.; Rajan, G.S.; Ellis, A.V.; Naebe, M. Surface treatment of Basalt fiber for use in automotive composites. Mater. Today Chem. 2020, 17, 100334. [Google Scholar] [CrossRef]
  10. Ding, C.; Xue, K.; Yi, G. Research on fire resistance and economy of basalt fiber insulation mortar. Sci. Rep. 2023, 13, 17288. [Google Scholar] [CrossRef]
  11. Bhat, T.; Chevali, V.; Liu, X.; Feih, S.; Mouritz, A.P. Fire structural resistance of basalt fibre composite. Compos. Part A-Appl. Sci. Manuf. 2015, 71, 107–115. [Google Scholar] [CrossRef]
  12. Jagadeesh, P.; Rangappa, S.M.; Siengchin, S. Basalt fibers: An environmentally acceptable and sustainable green material for polymer composites. Constr. Build. Mater. 2024, 436, 136834. [Google Scholar] [CrossRef]
  13. Fiore, V.; Scalici, T.; Di Bella, G.; Valenza, A. A review on basalt fibre and its composites. Compos. Part B Eng. 2015, 74, 74–94. [Google Scholar] [CrossRef]
  14. Moiseev, E.A.; Gutnikov, S.I.; Malakho, A.P.; Lazoryak, B.I. Effect of iron oxides on the fabrication and properties of continuous glass fibers. Inorg. Mater. 2008, 44, 1026–1030. [Google Scholar] [CrossRef]
  15. Chen, X.; Zhang, Y.; Huo, H.; Wu, Z. Improving the tensile strength of continuous basalt fiber by mixing basalts. Fibers Polym. 2017, 18, 1796–1803. [Google Scholar] [CrossRef]
  16. Gutnikov, S.I.; Malakho, A.P.; Lazoryak, B.I.; Loginov, V.S. Influence of alumina on the properties of continuous basalt fibers. Russ. J. Inorg. Chem. 2009, 54, 191–196. [Google Scholar] [CrossRef]
  17. Farouk, M.; Soltan, A.; Schlüter, S.; Hamzawy, E.; Farrag, A.; El-Kammar, A.; Yahya, A.; Pollmann, H. Optimization of microstructure of basalt-based fibers intended for improved thermal and acoustic insulations. J. Build. Eng. 2021, 34, 101904. [Google Scholar] [CrossRef]
  18. Si, J.; Wang, Z.; Li, J.; Zuo, C.; Zhang, P.; Wei, C.; Wang, J.; Li, W.; Miao, S. Effects of CaO added to raw basalt on producing continuous basalt fibers and their mechanical properties. J. Non-Cryst. Solids 2021, 568, 120941. [Google Scholar] [CrossRef]
  19. Meng, Y.; Liu, J.; Xia, Y.; Liang, W.; Ran, Q.; Xie, Z. Preparation and characterization of continuous basalt fibre with high tensile strength. Ceram. Int. 2021, 47, 12410–12415. [Google Scholar] [CrossRef]
  20. Chen, X.; Zhang, Y.; Huo, H.; Wu, Z. Study of high tensile strength of natural continuous basalt fibers. J. Nat. Fibers 2020, 17, 214–222. [Google Scholar] [CrossRef]
  21. Gutnikov, S.I.; Manylov, M.S.; Lipatov, Y.V.; Lazoryak, B.I.; Pokholok, K.V. Effect of the reduction treatment on the basalt continuous fiber crystallization properties. J. Non-Cryst. Solids 2013, 368, 45–50. [Google Scholar] [CrossRef]
  22. Manylov, M.S.; Gutnikov, S.I.; Lipatov, Y.V.; Malakho, A.P.; Lazoryak, B.I. Effect of deferrization on continuous basalt fiber properties. Mendeleev Commun. 2015, 25, 386–388. [Google Scholar] [CrossRef]
  23. Xing, D.; Xi, X.Y.; Ma, P.C. Factors governing the tensile strength of basalt fibre. Compos. Part A-Appl. Sci. Manuf. 2019, 119, 127–133. [Google Scholar] [CrossRef]
  24. Wu, Y. From ensemble learning to deep ensemble learning: A case study on multi-indicator prediction of pavement performance. Appl. Soft Comput. J. 2024, 166, 112188. [Google Scholar] [CrossRef]
  25. Dong, X.; Yu, Z.; Cao, W.; Shi, Y.; Ma, Q. A survey on ensemble learning. Front. Comput. Sci. 2020, 14, 241–258. [Google Scholar] [CrossRef]
  26. Maleki, S.; Karimi-Jashni, A.; Mousavifard, M. Removal of Ni(II) ions from wastewater by ion exchange resin: Process optimization using response surface methodology and ensemble machine learning techniques. J. Environ. Chem. Eng. 2024, 12, 112417. [Google Scholar] [CrossRef]
  27. Almohammed, F.; Thakur, M.S.; Lee, D.; Kumar, R.; Singh, T. Flexural and split tensile strength of concrete with basalt fiber: An experimental and computational analysis. Constr. Build. Mater. 2024, 414, 134936. [Google Scholar] [CrossRef]
  28. Qiao, L.; Miao, P.; Xing, G.; Luo, X.; Ma, J.; Farooq, M.A. Interpretable machine learning model for predicting freeze-thaw damage of dune sand and fiber reinforced concrete. Case Stud. Constr. Mater. 2023, 19, e02453. [Google Scholar] [CrossRef]
  29. Cakiroglu, C.; Shahjalal, M.; Islam, K.; Mahmood, S.M.F.; Billah, A.H.M.M.; Nehdi, M.L. Explainable ensemble learning data-driven modeling of mechanical properties of fiber-reinforced rubberized recycled aggregate concrete. J. Build. Eng. 2023, 76, 107279. [Google Scholar] [CrossRef]
  30. Machello, C.; Aghabalaei Baghaei, K.; Bazli, M.; Hadigheh, A.; Rajabipour, A.; Arashpour, M.; Mahdizadeh Rad, H.; Hassanli, R. Tree-based machine learning approach to modelling tensile strength retention of Fibre Reinforced Polymer composites exposed to elevated temperatures. Compos. B Eng. 2024, 270, 111132. [Google Scholar] [CrossRef]
  31. Ding, L.; Liu, Y.; Liu, J.; Wang, X. Correlation analysis of tensile strength and chemical composition of basalt fiber roving. Polym. Compos. 2019, 40, 2959–2966. [Google Scholar] [CrossRef]
  32. Eduard, K.; Rainer, G.; Jona, S. Basalt, glass and carbon fibers and their fiber reinforced polymer composites under thermal and mechanical load. AIMS Mater. Sci. 2016, 3, 1561–1576. [Google Scholar] [CrossRef]
  33. Wei, B.; Cao, H.; Song, S. Tensile behavior contrast of basalt and glass fibers after chemical treatment. Mater. Design. 2010, 31, 4244–4250. [Google Scholar] [CrossRef]
  34. Sergey, I.G.; Evgeniya, S.Z.; Sergey, S.P.; Bogdan, I.L. Correlation of the chemical composition, structure and mechanical properties of basalt continuous fibers. AIMS Mater. Sci. 2019, 6, 806–820. [Google Scholar] [CrossRef]
  35. Wang, L. Study on Effect of Basalt Fiber Component on Elastic Modulus. Master’s Thesis, Southeast University, Nanjing, China, 2021. [Google Scholar] [CrossRef]
  36. Kuzmin, K.L.; Gutnikov, S.I.; Zhukovskaya, E.S.; Lazoryak, B.I. Basaltic glass fibers with advanced mechanical properties. J. Non-Cryst. Solids 2017, 476, 144–150. [Google Scholar] [CrossRef]
  37. Kuzmin, K.L.; Zhukovskaya, E.S.; Gutnikov, S.I.; Pavlov, Y.V.; Lazoryak, B.I. Effects of Ion Exchange on the Mechanical Properties of Basaltic Glass Fibers. Int. J. Appl. Glass Sci. 2016, 7, 118–127. [Google Scholar] [CrossRef]
  38. Wu, Z.; Liu, J.; Jiang, M.; Wang, Y.; Lei, L. A High-Temperature Resistant Basalt Fiber Composition. China Patent No. 201410139342.1, 30 July 2014. [Google Scholar]
  39. Wang, X.; Sun, K.; Shao, J.; Ma, J. Fracture properties of graded basalt fiber reinforced concrete: Experimental study and Mori-Tanaka method application. Constr. Build. Mater. 2023, 398, 132510. [Google Scholar] [CrossRef]
  40. Ramachandran, B.E.; Velpari, V.; Balasubramanian, N. Chemical durability studies on basalt fibres. J. Mater. Sci. Technol. 1981, 16, 3393–3397. [Google Scholar] [CrossRef]
  41. Dong, J.F.; Wang, Q.Y.; Guan, Z.W.; Chai, H.K. High-temperature behaviour of basalt fibre reinforced concrete made with recycled aggregates from earthquake waste. J. Build. Eng. 2022, 48, 103895. [Google Scholar] [CrossRef]
  42. Xing, D.; Chang, C.; Xi, X.Y.; Hao, B.; Zheng, Q.; Gutnikov, S.I.; Lazoryak, B.I.; Ma, P.C. Morphologies and mechanical properties of basalt fibre processed at elevated temperature. J. Non-Cryst. Solids 2022, 582, 121439. [Google Scholar] [CrossRef]
  43. Nasir, V.; Karimipour, H.; Taheri-Behrooz, F.; Shokrieh, M.M. Corrosion behaviour and crack formation mechanism of basalt fibre in sulphuric acid. Corros. Sci. 2012, 64, 1–7. [Google Scholar] [CrossRef]
  44. Li, R.; Gu, Y.; Zhang, G.; Yang, Z.; Li, M.; Zhang, Z. Radiation shielding property of structural polymer composite: Continuous basalt fiber reinforced epoxy matrix composite containing erbium oxide. Compos. Sci. Technol. 2017, 143, 67–74. [Google Scholar] [CrossRef]
  45. Ahmad, M.R.; Chen, B. Effect of silica fume and basalt fiber on the mechanical properties and microstructure of magnesium phosphate cement (MPC) mortar. Constr. Build. Mater. 2018, 190, 466–478. [Google Scholar] [CrossRef]
  46. Vejmelková, E.; Koňáková, D.; Scheinherrová, L.; Doleželová, M.; Keppert, M.; Černý, R. High temperature durability of fiber reinforced high alumina cement composites. Constr. Build. Mater. 2018, 162, 881–891. [Google Scholar] [CrossRef]
  47. Qin, J.; Qian, J.; Li, Z.; You, C.; Dai, X.; Yue, Y.; Fan, Y. Mechanical properties of basalt fiber reinforced magnesium phosphate cement composites. Constr. Build. Mater. 2018, 188, 946–955. [Google Scholar] [CrossRef]
  48. Tang, C.; Jiang, H.; Zhang, X.; Li, G.; Cui, J. Corrosion Behavior and Mechanism of Basalt Fibers in Sodium Hydroxide Solution. Mater. 2018, 11, 1381. [Google Scholar] [CrossRef]
  49. Li, M.; Gong, F.; Wu, Z. Study on mechanical properties of alkali-resistant basalt fiber reinforced concrete. Constr. Build. Mater. 2020, 245, 118424. [Google Scholar] [CrossRef]
  50. Gutnikov, S.I.; Popov, S.S.; Efremov, V.A.; Ma, P.C.; Lazoryak, B.I. Correlation of Phase Composition, Structure, and Mechanical Properties of Natural Basalt Continuous Fibers. Nat. Resour. Res. 2021, 30, 1105–1119. [Google Scholar] [CrossRef]
  51. Morozov, N.N.; Bakunov, V.S.; Morozov, E.N.; Aslanova, L.G.; Granovskii, P.A.; Prokshin, V.V.; Zemlyanitsyn, A.A. Materials Based on Basalts from the European North of Russia. Glass Ceram. 2001, 58, 100–104. [Google Scholar] [CrossRef]
  52. Khan, A.A.; Chaudhari, O.; Chandra, R. A review of ensemble learning and data augmentation models for class imbalanced problems: Combination, implementation and evaluation. Expert Syst. Appl. 2024, 244, 122778. [Google Scholar] [CrossRef]
  53. Bakır, R.; Orak, C.; Yüksel, A. Optimizing hydrogen evolution prediction: A unified approach using random forests, lightGBM, and Bagging Regressor ensemble model. Int. J. Hydrogen Energy 2024, 67, 101–110. [Google Scholar] [CrossRef]
  54. Geurts, P.; Ernst, D.; Wehenkel, L. Extremely randomized trees. Mach. Learn. 2006, 63, 3–42. [Google Scholar] [CrossRef]
  55. Chen, T.; Guestrin, C. XGBoost: A Scalable Tree Boosting System. In Proceedings of the 22nd ACM SIGKDD International Conference on Knowledge Discovery and Data Mining, San Francisco, CA, USA, 13–17 August 2016. [Google Scholar] [CrossRef]
  56. Huang, X.; Liu, W.; Guo, Q.; Tan, J. Prediction method for the dynamic response of expressway lateritic soil subgrades on the basis of Bayesian optimization CatBoost. Soil Dyn. Earthq. Eng. 2024, 186, 108943. [Google Scholar] [CrossRef]
  57. Zhou, Z.; Cao, J.; Shi, X.; Zhang, W.; Huang, W. Probabilistic rutting model using NGBoost and SHAP: Incorporating other performance indicators. Constr. Build. Mater. 2024, 438, 137052. [Google Scholar] [CrossRef]
  58. Yang, F.; Wen, C.; Zhu, S.; Feng, Y.; Ye, Z.; Peng, H.; Guan, P. Machine learning model of plant fiber/PLA composite: Prediction and analysis of mechanical strength. Compos. Part Appl. Sci. Manuf. 2025, 199, 109201. [Google Scholar] [CrossRef]
  59. Golkarnarenji, G.; Naebe, M.; Badii, K.; Milani, A.S.; Jazar, R.N.; Khayyam, H. A machine learning case study with limited data for prediction of carbon fiber mechanical properties. Comput. Ind. 2019, 105, 123–132. [Google Scholar] [CrossRef]
  60. Chokshi, S.; Gohil, P.; Lalakiya, A.; Patel, P.; Parmar, A. Tensile strength prediction of natural fiber and natural fiber yarn: Strain rate variation upshot. Mater. Today Proc. 2020, 27, 1218–1223. [Google Scholar] [CrossRef]
  61. Wu, Z.; Liu, J.; Chen, X. The role of chemical composition in continuous basalt fibers. In Continuous Basalt Fiber Technology; Chemical Industry Press: Beijing, China, 2020; pp. 45–48. [Google Scholar]
  62. Cao, H.; Yan, Y.; Yue, L.; Zhao, J. Microscopic fine structure. In Basalt Fiber; National Defense Industry Press: Beijing, China, 2017; pp. 43–45. [Google Scholar]
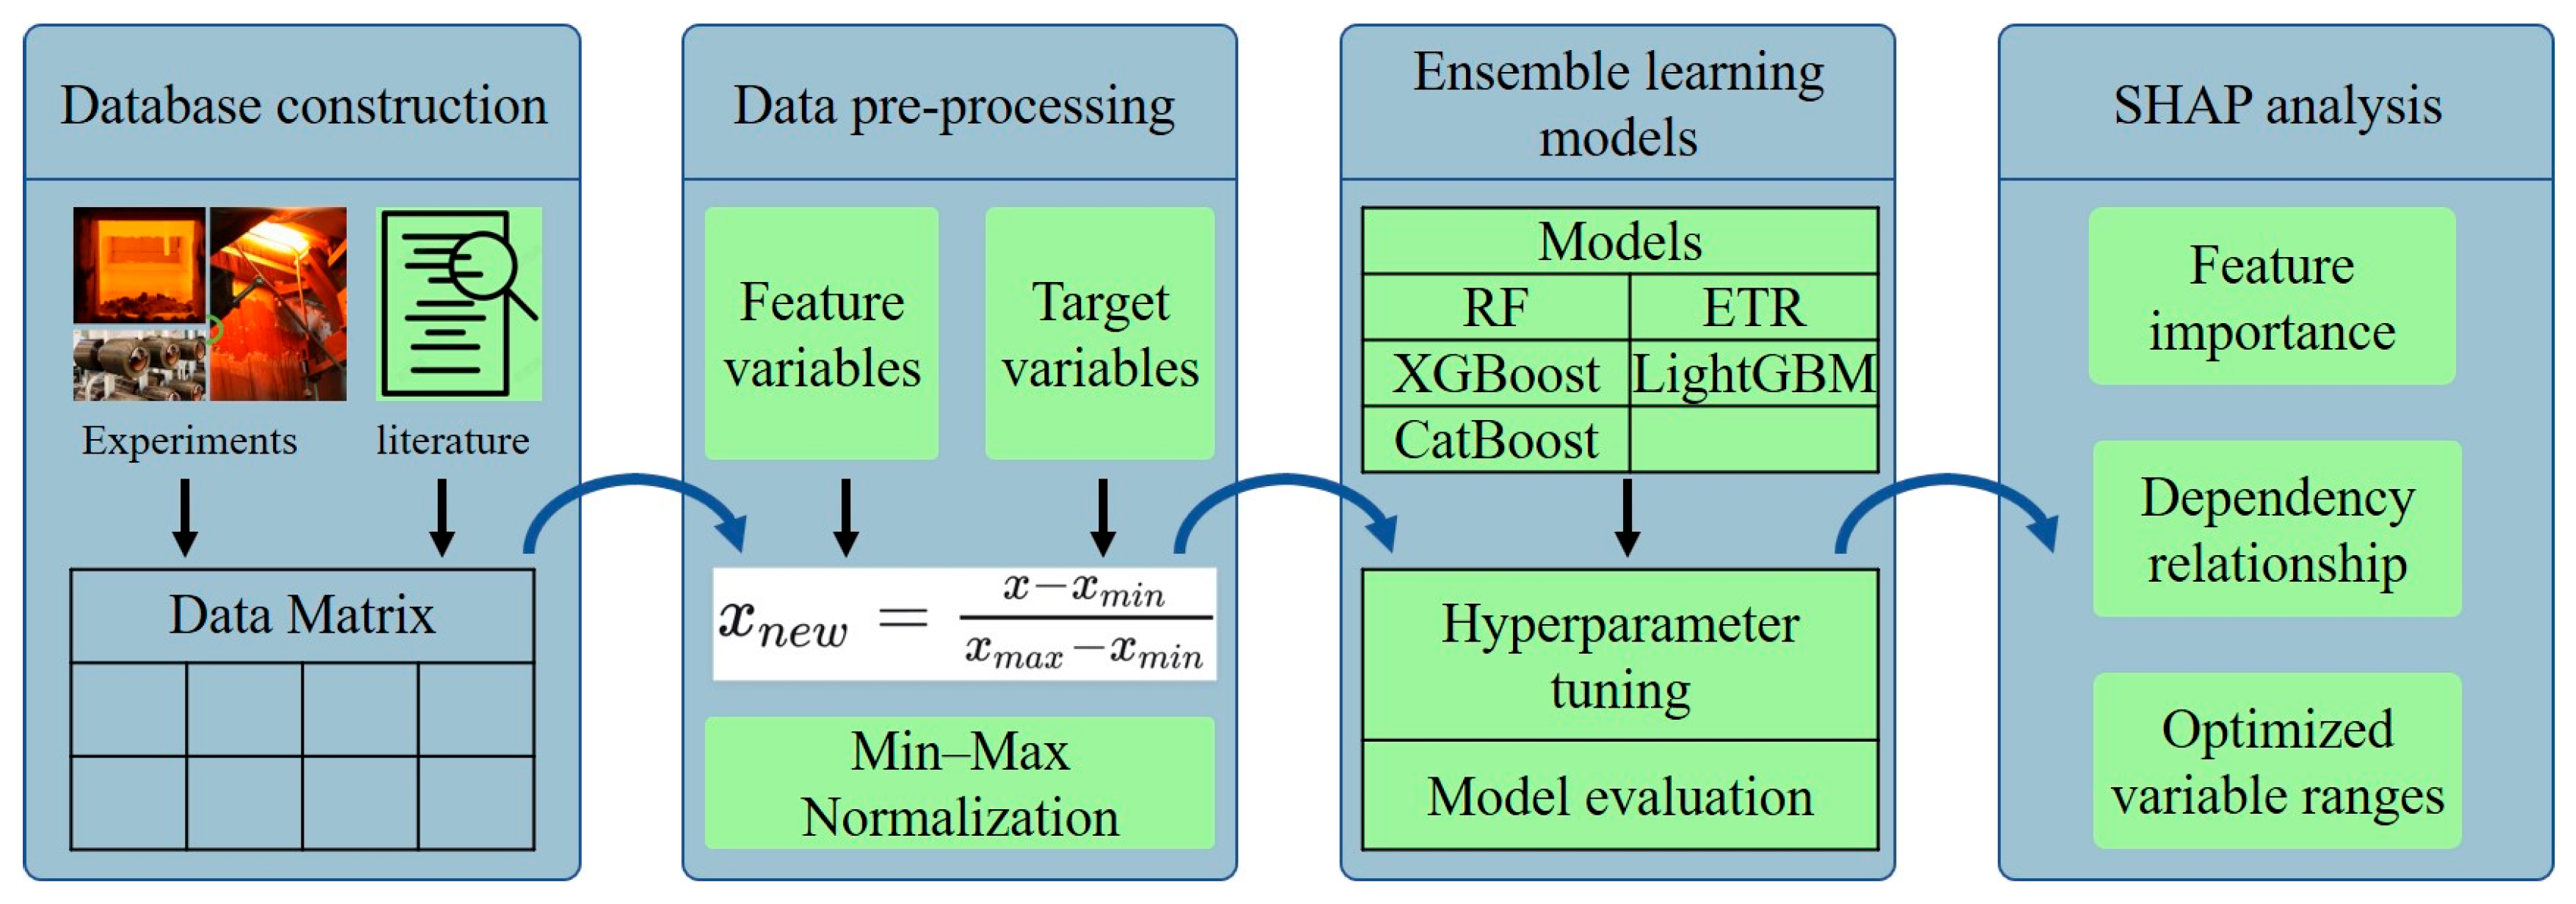
Figure 1. The flowchart of ensemble learning.
Sustainability 17 07387 g001
Figure 2. The PCCs for feature variables and target variables.
Sustainability 17 07387 g002
Figure 3. The test data, predicting data, and errors of the tensile strength and elastic modulus from the XGBoost and CatBoost models. (a) The test data, predicting data, and errors of the tensile strength and elastic modulus from the XGBoost model; (b) The test data, predicting data, and errors of the tensile strength and elastic modulus from the CatBoost model.
Sustainability 17 07387 g003
Figure 4. The ranking of feature variables based on tensile strength and elastic modulus prediction performance. (a) Ranking of feature variables based on tensile strength prediction performance; (b) Ranking of feature variables based on elastic modulus prediction performance.
Sustainability 17 07387 g004
Figure 5. The ranking of SHAP values based on tensile strength and elastic modulus prediction performance. (a) Ranking of SHAP values based on tensile strength prediction performance; (b) Ranking of SHAP values based on elastic modulus prediction performance.
Sustainability 17 07387 g005
Figure 6. The dependence plots of variables based on tensile strength prediction performance.
Sustainability 17 07387 g006
Figure 7. The dependence plots of variables based on elastic modulus prediction performance.
Sustainability 17 07387 g007
Table 1. The Kolmogorov–Smirnov test results of feature variables.
FeatureAl2O3CaOFe2O3FeOK2OMaMgOMvNBO/TNa2OSiO2TiO2
K-S
Statistic
0.1200.1170.2080.1200.1210.1260.1050.1600.1350.1130.1530.093
p-value0.7790.8020.1640.7830.7750.7280.8890.4390.6550.8380.4900.953
Table 2. The R2, MSE, RMSE, and MAE values of five ensemble learning models.
ModelMetricsRFETRXGBoostLightGBMCatBoost
Tensile strength
prediction
R2 train0.83570.99640.99740.65380.9939
R2 test0.66070.86770.91520.85960.8751
MSE train0.70420.01890.01451.48370.0260
MSE test1.98160.74240.28671.34240.5645
RMSE train0.83920.13750.12041.21810.1614
RMSE test1.40770.86160.53541.15860.7513
MAE train0.6728 0.00070.00140.99430.1283
MAE test1.12770.38090.60910.96760.6193
Elastic modulus
prediction
R2 train0.85600.99740.99980.99270.9986
R2 test0.55750.80610.93030.96640.9803
MSE train0.94490.70450.52600.45460.0024
MSE test6.58612.02460.43060.23090.1209
RMSE train0.97190.83900.71130.67430.0491
RMSE test2.56631.42290.65620.48050.3478
MAE train0.81630.64520.55770.45820.0384
MAE test1.97261.21490.52990.37820.2692
Table 3. Comparison of the research results.
Study (Year)MaterialInput FeaturesOutput TargetsModel TypePerformance
Our workBasalt fiberOxide compositionTensile strength, elastic modulusXGBR
CatBoost
0.92,
0.98
Yang et al. ([58])Plant fiber/PLA composite Grammage, PLA content, beating degree, calendering temperature,
calendering pressure,
fiber length,
and fiber width
Tensile strength
bursting strength
density
Support Vector Regression (SVR), Artificial Neural Network (ANN), Decision Tree GBR(R2 = 0.90, RMSE = 0.44),
(R2 = 0.91, RMSE = 4.56),
(R2 = 0.92, RMSE = 0.06)
Golkarnarenji et al. ([59])Carbon fiberCyclization,
dehydrogenation,
and oxidation
Tensile strength,
Young’s modulus
ANN-LMAAverage error of less than ± 3.7%,
less than ± 2.4%
Chokshi et al. ([60])Natural bamboo fiberStrain rateTensile strengthPolynomial model0.80
Table 4. The ranges within which the feature variables positively influence tensile strength and elastic modulus.
%SiO2Al2O3TiO2Fe2O3CaONa2OMgOFeOK2O
Tensile strength[48.39, 63.00][8.70, 25.13][0, 8.26][0.30, 16.37][3.20, 11.41][0.20, 6.00][3.10, 15.00][0.57, 6.62][0, 9.30]
Elastic modulus[45.01, 55.34][9.28, 25.13][0.11, 10.38][0.50, 10.96][3.20, 9.05][0.20, 3.20][3.42, 15.00][0, 6.62][0.20, 5.27]
MaMvNBO/T
Tensile strength[2.15, 8.56][1.32, 3.34][0.02, 0.37]
Elastic modulus[3.80, 8.56][1.39, 3.34][0.02, 0.36]
Disclaimer/Publisher’s Note: The statements, opinions and data contained in all publications are solely those of the individual author(s) and contributor(s) and not of MDPI and/or the editor(s). MDPI and/or the editor(s) disclaim responsibility for any injury to people or property resulting from any ideas, methods, instructions or products referred to in the content.