Article

Urban Forest Health Under Rapid Urbanization: Spatiotemporal Patterns and Driving Mechanisms from the Chang–Zhu–Tan Green Heart Area

College of Forestry, Central South University of Forestry and Technology, Changsha 410004, China
*
Author to whom correspondence should be addressed.
Sustainability 2025, 17(16), 7268; https://doi.org/10.3390/su17167268
Submission received: 20 July 2025 / Revised: 5 August 2025 / Accepted: 7 August 2025 / Published: 12 August 2025

Abstract

The Ecological Green Heart Area of the Chang–Zhu–Tan Urban Agglomeration in Central China faces increasing forest health threats due to rapid urbanization and land use change. This study assessed the spatiotemporal dynamics and drivers of forest health from 2005 to 2023 using a multi-dimensional framework based on vitality, organizational structure, and anti-interference capacity. A forest health index (FHI) was constructed using multi-source data, and the optimal parameter geographic detector (OPGD) model was applied to identify dominant and interacting factors. The results show the following: (1) FHI declined from 0.62 (2005) to 0.55 (2015) and rebounded to 0.60 (2023). (2) Healthier forests were concentrated in the east and center, with degradation in the west and south; (3) Topography was the leading driver (q = 0.17), followed by climate, while socioeconomic factors gained influence over time. (4) Interactions among factors showed strong nonlinear enhancement. This research demonstrates the effectiveness of the OPGD model in capturing spatial heterogeneity and interaction effects, underscoring the need for differentiated, spatially informed conservation and land management strategies. This research provides scientific support for integrating ecological protection with urban planning, contributing to the broader goals of ecosystem resilience, sustainable land use, and regional sustainability.

1. Introduction

Forests are the foundation of terrestrial ecosystems, delivering ecosystem services essential for human well-being and sustainable development. However, accelerating urbanization and associated human activities are primary drivers of global ecosystem degradation. In densely populated urban clusters, the expansion of construction land and infrastructure intensifies pressure on forest ecosystems. This frequently results in forest degradation, biodiversity loss, and the impairment of vital ecological functions, which threaten regional ecological health and stability [1]. The establishment of green infrastructure, such as ecological corridors and interconnected landscape patches within urban agglomerations, is increasingly recognized as a key strategy to mitigate the pressures of rapid urbanization and guide sustainable land use planning [2]. This approach is critical for developing rational landscape patterns and enhancing the integrity, stability, and sustainability of urban ecosystems. Therefore, a scientific assessment of urban forest health dynamics and their underlying drivers is imperative. Such an analysis is critical for ensuring regional ecological security and sustaining human well-being.
Over the past decades, forest health assessments have evolved considerably. Early frameworks, such as those proposed by Kolb et al. [3], primarily emphasized utilitarian and ecosystem perspectives. In China, the concept was introduced by Zhao et al. [4] and subsequently expanded into more comprehensive systems encompassing structural, functional, and resilience-based indicators [5,6]. Despite these advancements, many existing studies still rely on uni-dimensional or structurally biased frameworks that often overlook critical aspects such as disturbance resistance and landscape connectivity. In parallel, the rapid development of remote sensing and geospatial technologies has enabled large-scale, long-term assessments using multi-source data [7,8,9,10]. A variety of analytical approaches—including structural equation modeling [11] and modified gravity models [12]—have been adopted to investigate the drivers of forest health, highlighting the influence of climate variability, topographic features, and human disturbance [13,14]. Nevertheless, the complex interactions between natural and anthropogenic factors—particularly under conditions of rapid urbanization—remain insufficiently understood, especially with regard to their synergistic or nonlinear effects. Moreover, empirical studies focusing on legally protected, cross-jurisdictional ecological zones are still limited, constraining the generalizability of findings and their relevance to broader policy and planning contexts.
The Chang–Zhu–Tan Urban Agglomeration, a key economic growth pole in China, is noted for its efforts to balance development with ecological conservation. To curb urban sprawl and safeguard ecological security, the region established the Ecological Green Heart Area, a 529.79 km2 forest-centered zone at the intersection of Changsha, Zhuzhou, and Xiangtan. This represents China’s first trans-administrative ecological protection area established through provincial legislation. The Green Heart Area is vital for ensuring regional ecological security in the face of urban expansion. Therefore, studying its forest health provides a critical reference for other metropolitan regions worldwide confronting similar development pressures.
In this context, a comprehensive understanding of forest health dynamics in the Green Heart Area can provide scientific support for evaluating conservation effectiveness and informing spatially differentiated land management. This study addresses the identified research gaps by pursuing the following objectives: (1) to construct a multi-dimensional forest health evaluation framework based on vitality, organizational structure, and anti-interference capacity; (2) to characterize the spatiotemporal evolution of forest health in the Green Heart Area from 2005 to 2023 under rapid urbanization; and (3) to identify the dominant natural and anthropogenic driving factors, along with their interactive effects, using the OPGD model. This regional case study provides insights into the universal challenge of balancing rapid urbanization with ecological conservation, a critical issue for achieving sustainable development worldwide. The findings can offer valuable lessons for other metropolitan areas globally facing similar pressures on their urban green infrastructure.

2. Materials and Methods

2.1. Study Area

The Ecological Green Heart Area of the Chang–Zhu–Tan Urban Agglomeration is located at the junction of the Changsha, Zhuzhou, and Xiangtan cities in central-eastern Hunan Province (112°53′ E to 113°18′ E, 27°43′ N to 29°07′ N), covering approximately 529.79 km2 (Figure 1). Characterized by low mountains and hilly terrain, the area has a forest coverage rate exceeding 60%. It represents a complex, integrated ecosystem composed of mountains, waters, forests, farmlands, and lakes. Its strategic location makes it a critical ecological link connecting the three cities, providing key functions such as water conservation, climate regulation, and biodiversity protection.

2.2. Data Sources and Processing

This study utilized remote sensing imagery, meteorological records, socioeconomic statistics, and auxiliary data, with specific sources detailed in Table 1. In ArcGIS 10.8, all spatial datasets were clipped to the boundary of the Ecological Green Heart Area. The datasets were uniformly projected to WGS_1984_UTM_Zone_49N and co-registered to ensure spatial alignment. To maintain data integrity, all raster layers were kept at their original 28.63 m resolution without resampling. In the driver factor analysis, in order to align the 28.63 m remote sensing data with the 1000 m socioeconomic dataset, we used the nearest neighbor resampling method and uniformly resampled the socioeconomic data to a resolution of 28.63 m to ensure that the OPGD model had a uniform spatial scale.
Remote sensing data were primarily derived from Landsat 5 TM and Landsat 8 OLI images sourced from the Google Earth Engine (GEE) platform. Images were selected from April to October of each year with cloud coverage below 30% [16]. Key indicators obtained or calculated from these data include the enhanced vegetation index (EVI), the renormalized difference vegetation index (RDVI), and the annual maximum land surface temperature (LST). A digital elevation model (DEM) was also used. Fractional vegetation cover (FVC) was estimated from the annual maximum normalized difference vegetation index (NDVI) based on a 5–95% confidence interval [17]. Net primary productivity (NPP) data were acquired from the Geographic Remote Sensing Ecology Network. To normalize different temporal resolutions, all time-series raster data were aggregated into annual averages [18].
Meteorological data, including monthly average temperatures and total precipitation, were sourced from the Fine Resolution Mapping of Mountain Environment (FRMM). Socioeconomic data consisted of Landscan population density, per capita GDP from the Geographic Remote Sensing Ecological Network, railway and highway networks from the National Geographic Information Resource Directory, and data on night lights [15]. Auxiliary data included the administrative boundary of the Ecological Green Heart Area and 2023 forest, grassland, and wetland comprehensive monitoring data, which were provided by the Hunan Provincial Forestry Bureau.

2.3. Methodology

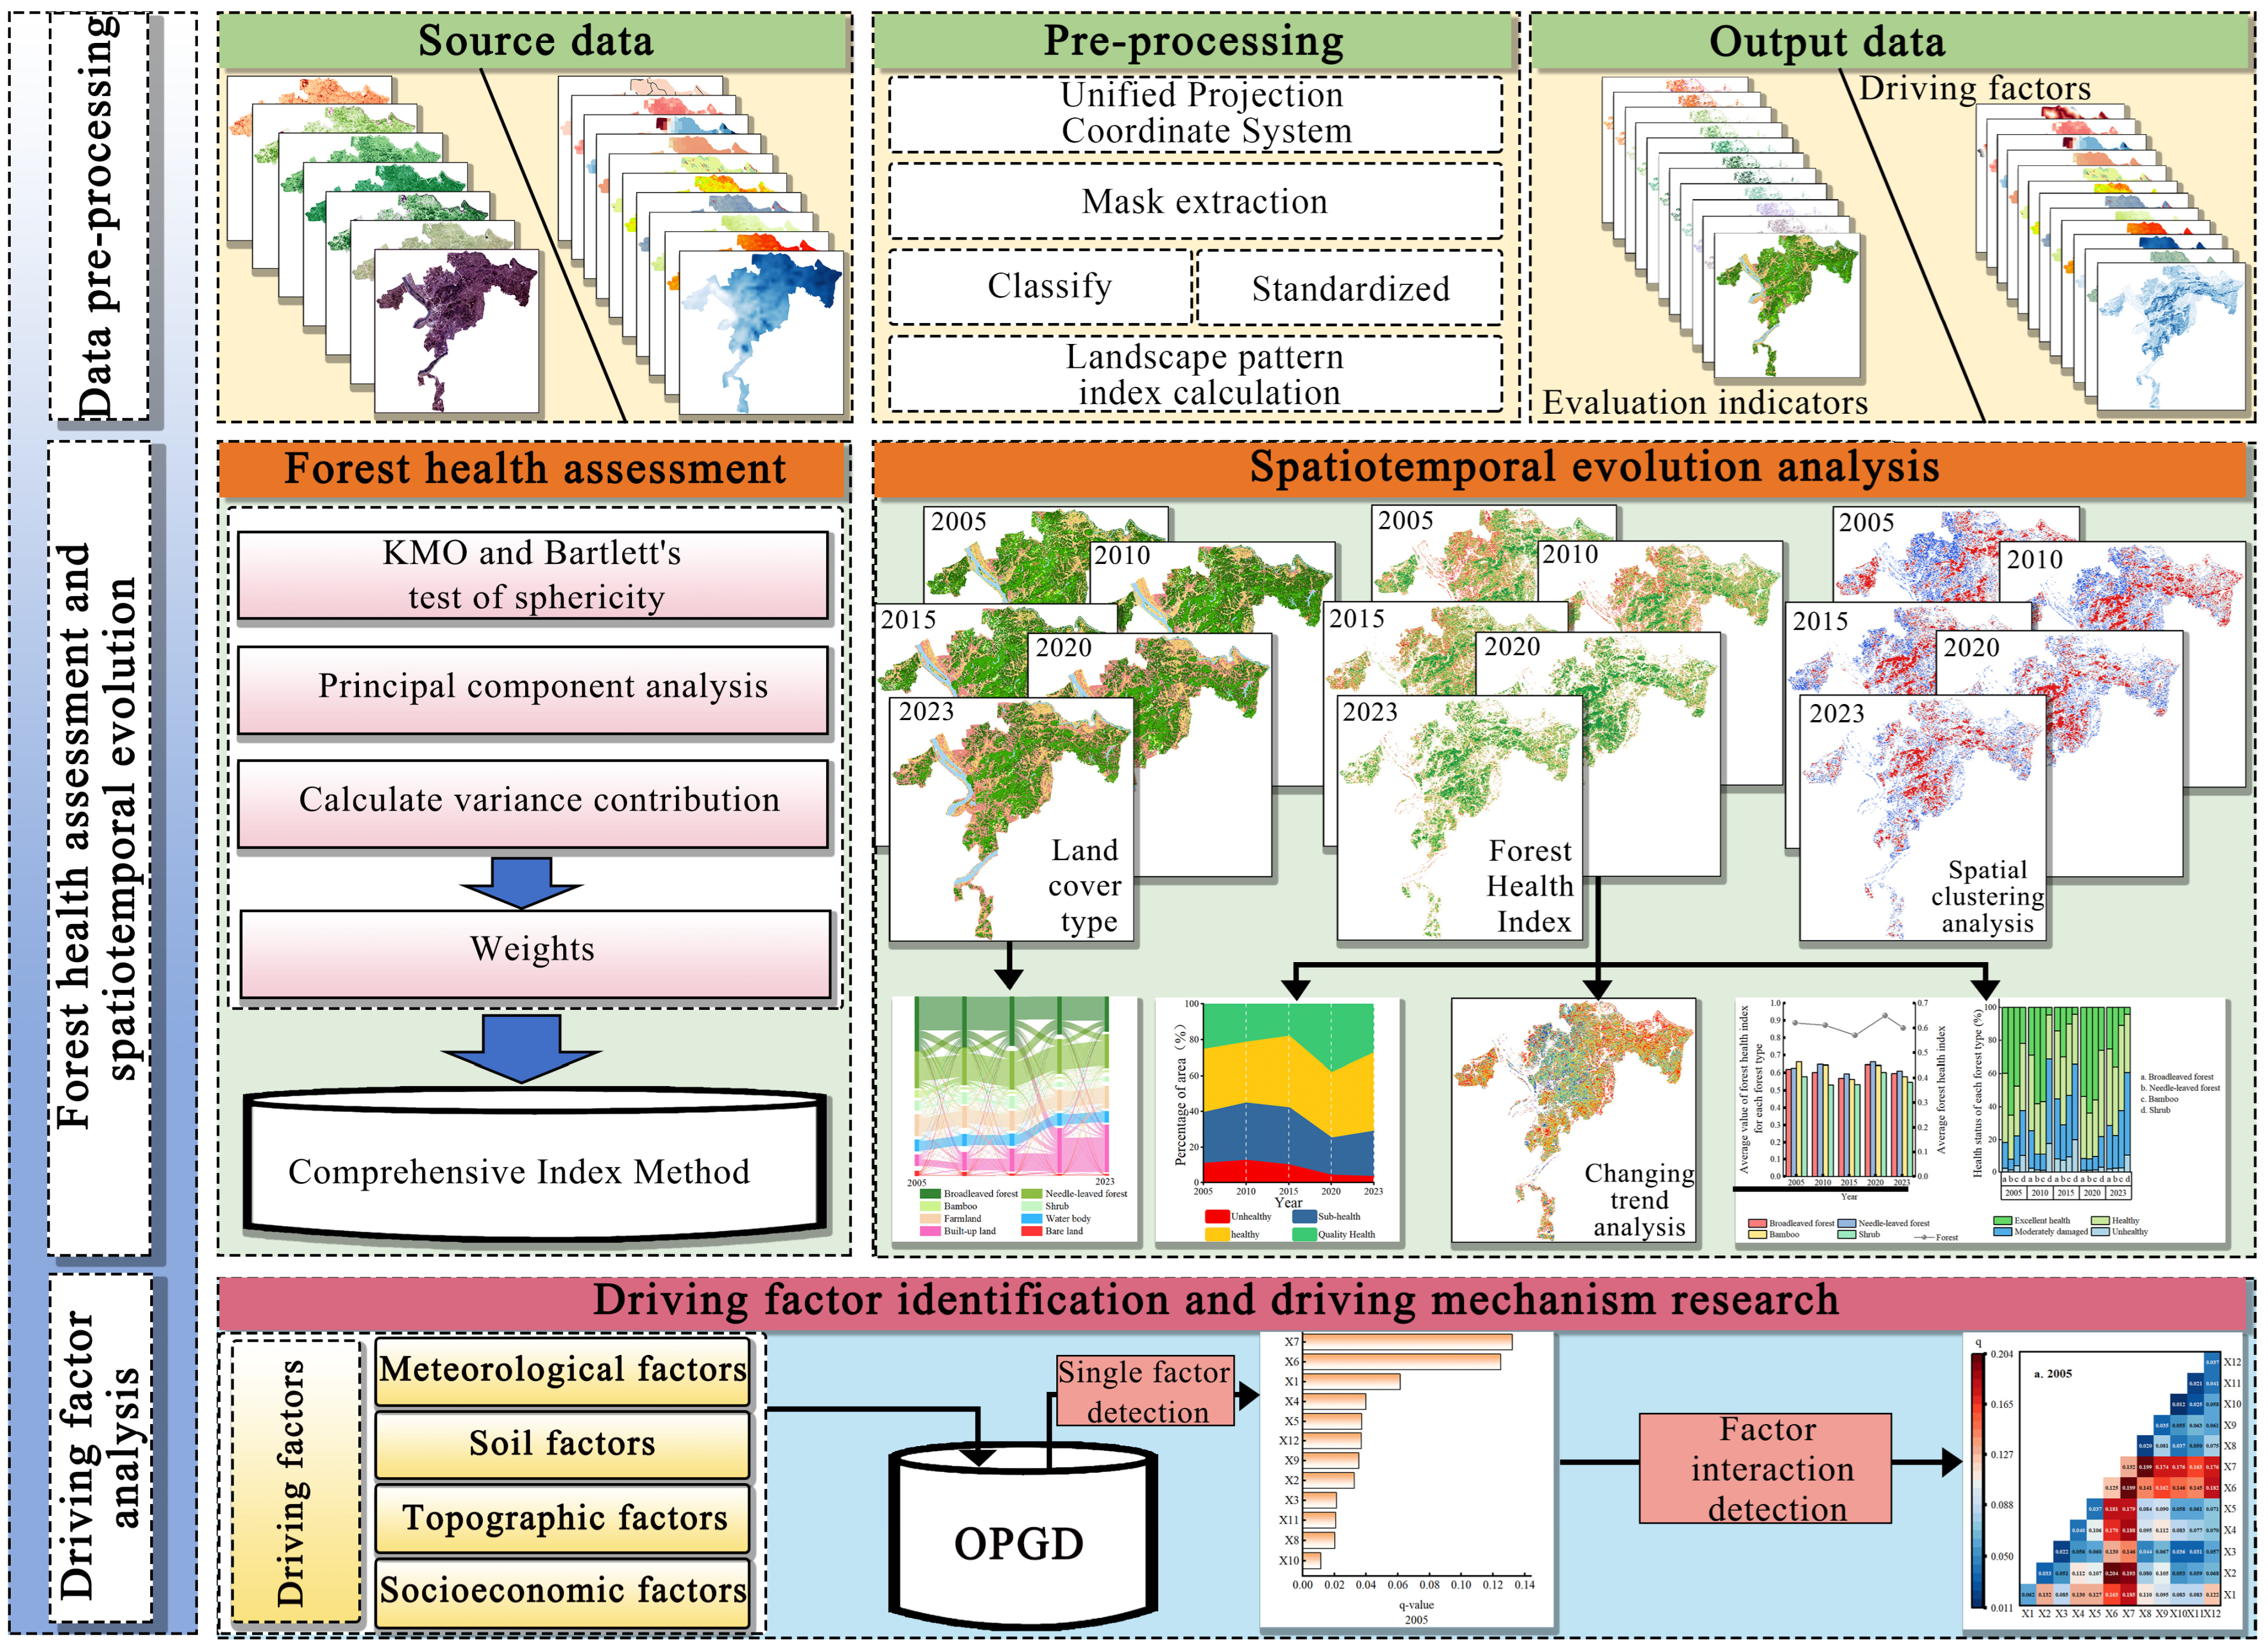
This study comprises three main components: data preprocessing, forest health assessments with spatiotemporal analysis, and driving factor analysis (Figure 2). The preprocessing stage includes unified projection, masking of the study area, land cover classification, data standardization, and calculation of landscape pattern indices. A forest health assessment employs a composite index method, in which indicator weights are determined through factor analysis and validated using the KMO and Bartlett tests to construct a comprehensive forest health index (FHI). Subsequently, using time-series data from 2005, 2010, 2015, 2020, and 2023, the spatiotemporal evolution of forest health is analyzed to investigate its temporal trends and spatial variability. Finally, the analysis of driving factors covered four categories: meteorological, soil, topographical, and socioeconomic. The optimal parameter geographic detector was used to conduct both single-factor and interaction detection, thereby revealing the mechanisms influencing forest health.

2.3.1. Land Cover Classification

In this study, we classified land cover in the Green Heart Area using the random forest algorithm [19] on GEE. This method was selected due to its excellent generalization ability, robustness against overfitting, and effectiveness in handling high-dimensional datasets [20]. The classification integrated spectral, texture, and terrain features (details are provided in Table S1 in the Supplementary Material) to distinguish eight land cover types: broadleaved forests (BF), needle-leaved forests (NF), bamboos, shrubs, farmland, water bodies, built-up land, and bare land. The 2023 forest, grassland, and wetland comprehensive monitoring dataset served as auxiliary data for training the classifier and as a reference for accuracy validation. The final accuracy of the classification was assessed using overall accuracy (OA) and the Kappa coefficient. The results are detailed in Table S2 in the Supplementary Material.

2.3.2. Selection of Forest Health Assessment Indicators

This study established a forest health assessment system based on three dimensions: vitality, organizational, and anti-interference. The integration of high-resolution remote sensing data and landscape pattern analysis enabled the dynamic monitoring of forest health.
Healthy forests are characterized by high biological productivity and stable vegetation cover. Vitality indicators were selected to represent these attributes. The EVI was chosen for its suitability in monitoring high-coverage areas without saturation issues. NPP was included as a key indicator of carbon sequestration capacity and ecosystem carbon source–sink functions. Additionally, FVC and the RDVI were used to distinguish between forest degradation and restoration.
Recognizing the impact of forest landscape patterns on forest health [21], the largest patch index (LPI), the landscape shape index (LSI), Shannon’s diversity index (SHDI), and the contagion index (CONTAG) were selected as organizational indicators to reflect landscape structural stability and connectivity. The LPI was used to measure the area of dominant patches and the integrity of core habitats. The LSI and SHDI described patch shape complexity and landscape diversity, respectively. CONTAG reflected the aggregation of dominant types; its reduction may signify patch fragmentation caused by human disturbance or natural succession.
To assess the ability of forests to resist and mitigate external disturbances, anti-interference indicators were selected to evaluate heat stress and fire risk. LST reflects local thermal conditions. The risk level of forest fires was calculated based on meteorological, topographical, and land cover factors, enabling the identification of both fire probability and potential spread risk [22].

2.3.3. Comprehensive Assessment of Forest Health

We normalized the original indicators using the min–max normalization method, which linearly transforms values to a [0, 1] interval [23]. We subsequently used factor analysis to assign weights to the indicators (detailed in Tables S3–S5 in the Supplementary Material), which simplifies correlated variables by summarizing their shared variance into a few underlying factors [24]. To quantitatively evaluate the forest health of the Green Heart Area, we employed the composite index method, integrating the normalized and weighted indicators to reflect the overall health level [25]. Cluster analysis was applied to classify the resulting forest health indices, with classification thresholds defined based on the centroids of the clusters [26]. This process yielded four health categories: unhealthy (0–0.48), moderately damaged (0.48–0.56), healthy (0.56–0.64), and excellent health (0.64–1).

2.3.4. Changing Trends of Forest Health

To analyze the temporal evolution of forest health in the Green Heart Area from 2005 to 2023, we employed the slope analysis method [27]. A positive slope value indicates an improvement trend, whereas a negative value indicates a trend of degradation. Based on the results, we used the quantile method to classify the trend slopes into five categories: significant deterioration (<–0.0072), slight deterioration (–0.0072 to –0.0026), stable (–0.0026 to 0.0026), slight improvement (0.0026 to 0.0072), and marked improvement (>0.0072).

2.3.5. Spatial Clustering Analysis

Spatial autocorrelation analysis was employed to assess the spatial distribution patterns of forest health [28]. Specifically, global spatial autocorrelation was used to measure the overall degree of spatial clustering, while local spatial autocorrelation identified the locations of significant hotspots (High–High clusters) and coldspots (Low–Low clusters), allowing for an analysis of their dynamic trends over time.

2.3.6. Driving Forces of Forest Health

This study employed an optimal parameter geographic detector to identify the primary driving factors influencing the spatial variation in the FHI. This method quantifies the explanatory power (q-value) of each factor on the spatiotemporal heterogeneity of forest health. Its principle ensures that it is immune to multicollinearity among multiple independent variables. For the calculation formula, refer to the study by Song et al. [29]. Based on forest health formation mechanisms, 12 driving factors were selected and grouped into three categories. Natural environmental factors included the annual average temperature (X1), annual total precipitation (X2), the soil type (X3), soil moisture content (X4), and the soil pH value (X5). Topographic factors included the elevation (X6), slope (X7), and aspect (X8). In order to accurately capture the pressures of urbanization, the socioeconomic factors selected for this study included the distance from roads (X9), population density (X10), GDP (X11), and night lights (X12). Parameter optimization involved selecting the optimal spatial scale and data discretization method [30].

3. Results

3.1. Spatial and Temporal Changes in Land Cover Types

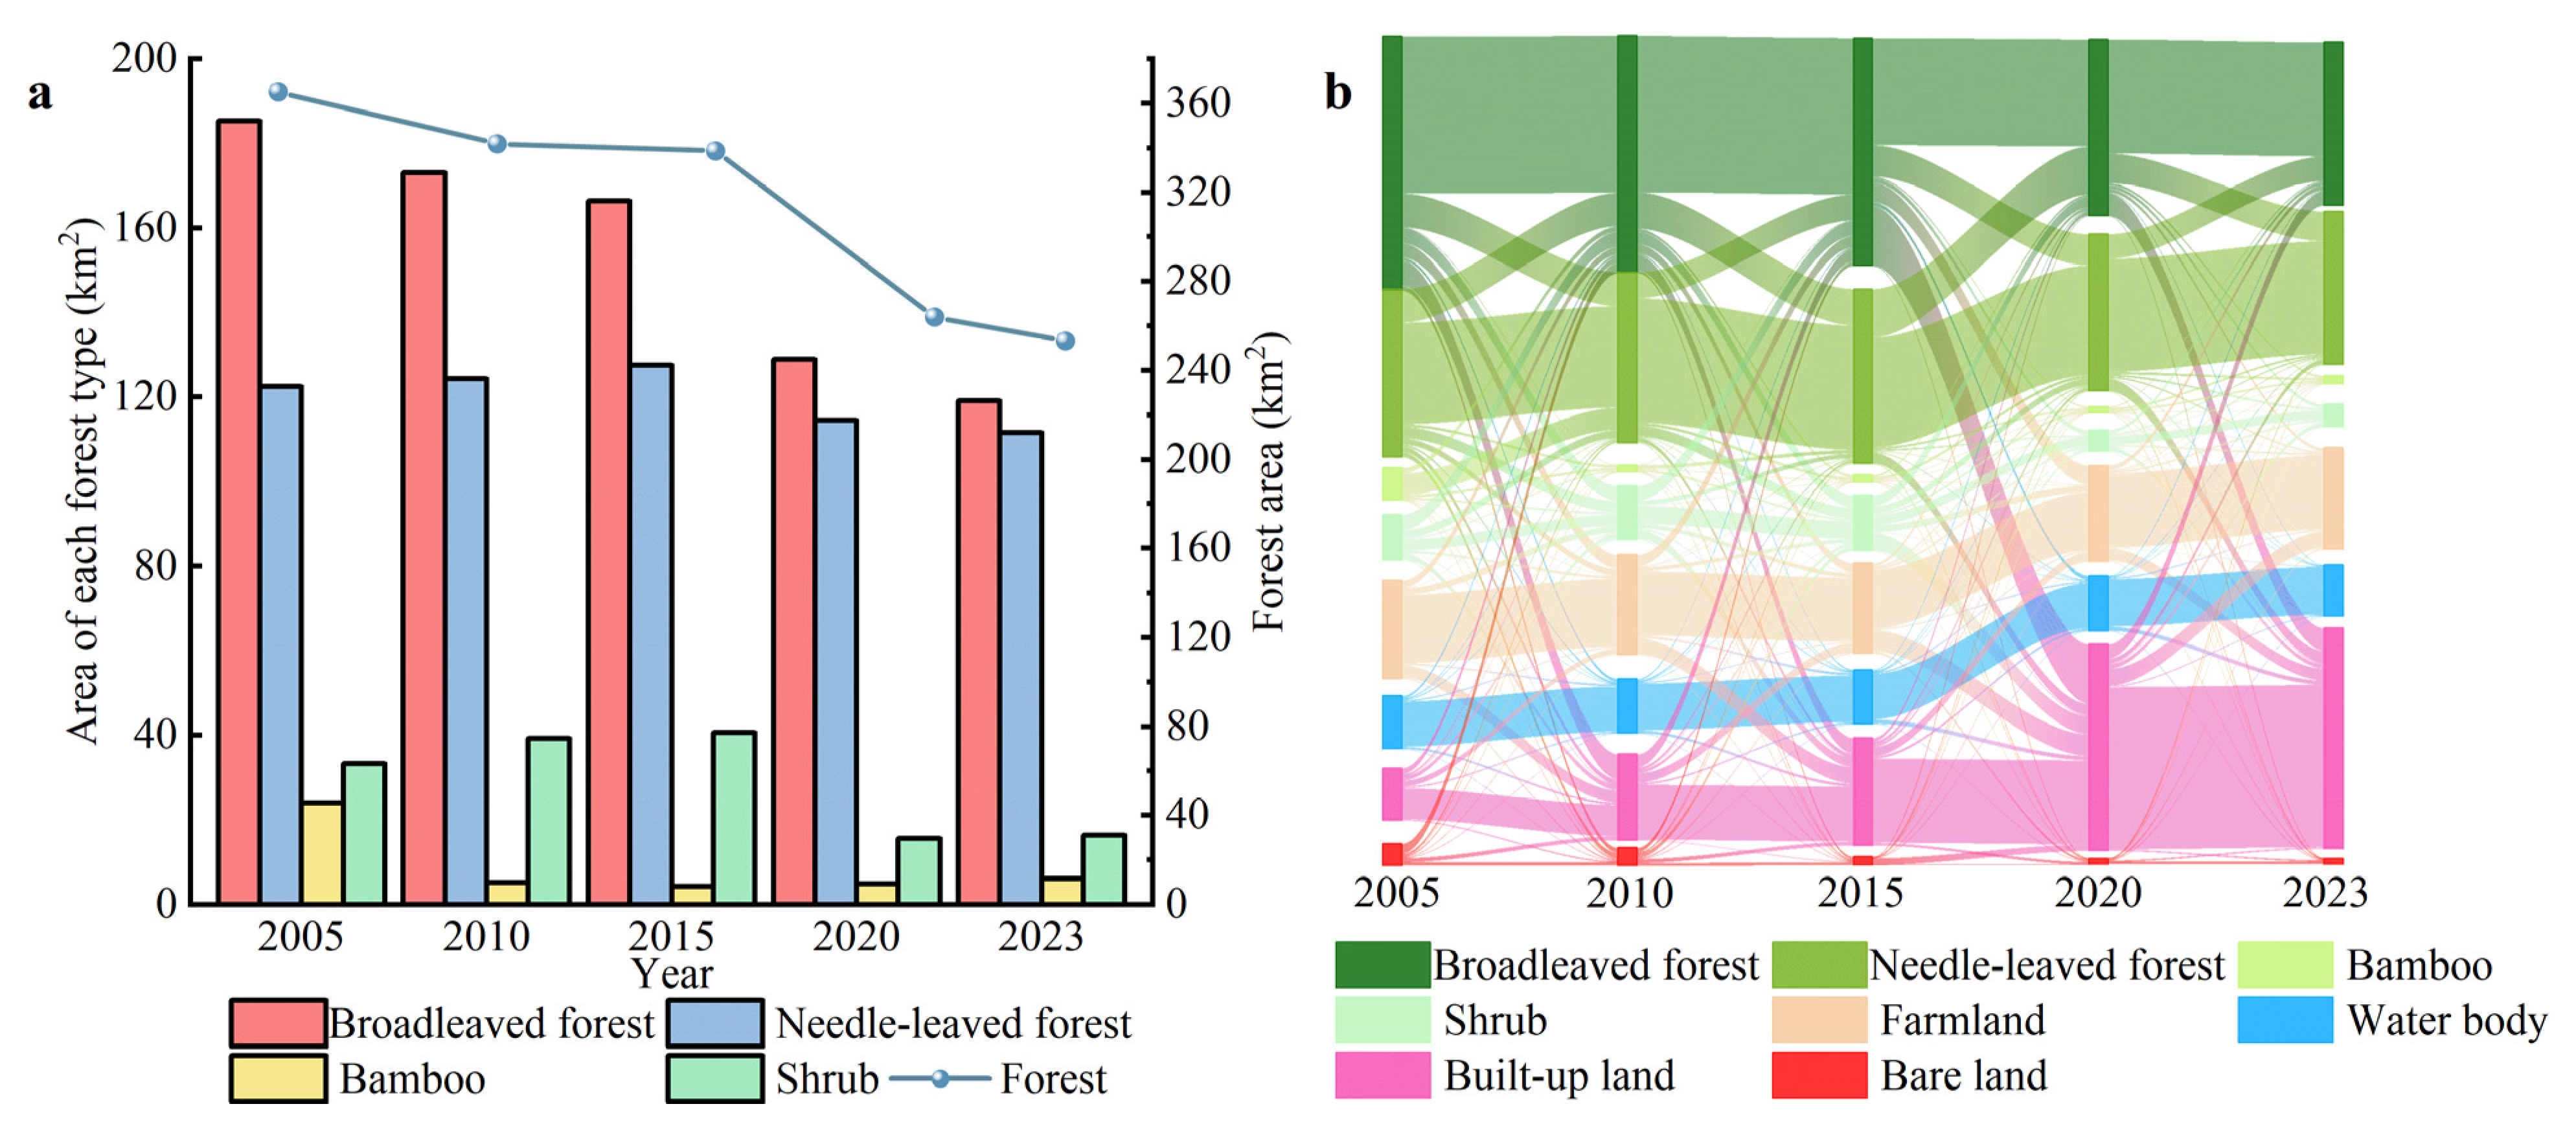
From 2005 to 2023, the total forest area decreased by 30.66%, from 365.16 km2 to 253.20 km2. This decline was primarily due to a continuous decrease in broadleaf forest and a reduction in coniferous forest beginning in 2020, while shrubland and bamboo forest areas showed fluctuating decreases. Bamboo forests consistently constituted the smallest proportion of forest cover (Figure 3a). An analysis of land cover conversion (Figure 3b) reveals that from 2005 to 2023, large areas of broadleaf and coniferous forests were converted to shrubland, farmland, and construction land. Significant bidirectional conversion between shrubland and farmland was also observed, reflecting frequent land use adjustments from human activities. Concurrently, the continuous expansion of construction land, sourced primarily from forests and farmland, indicates the intensifying encroachment of urbanization on ecological land.
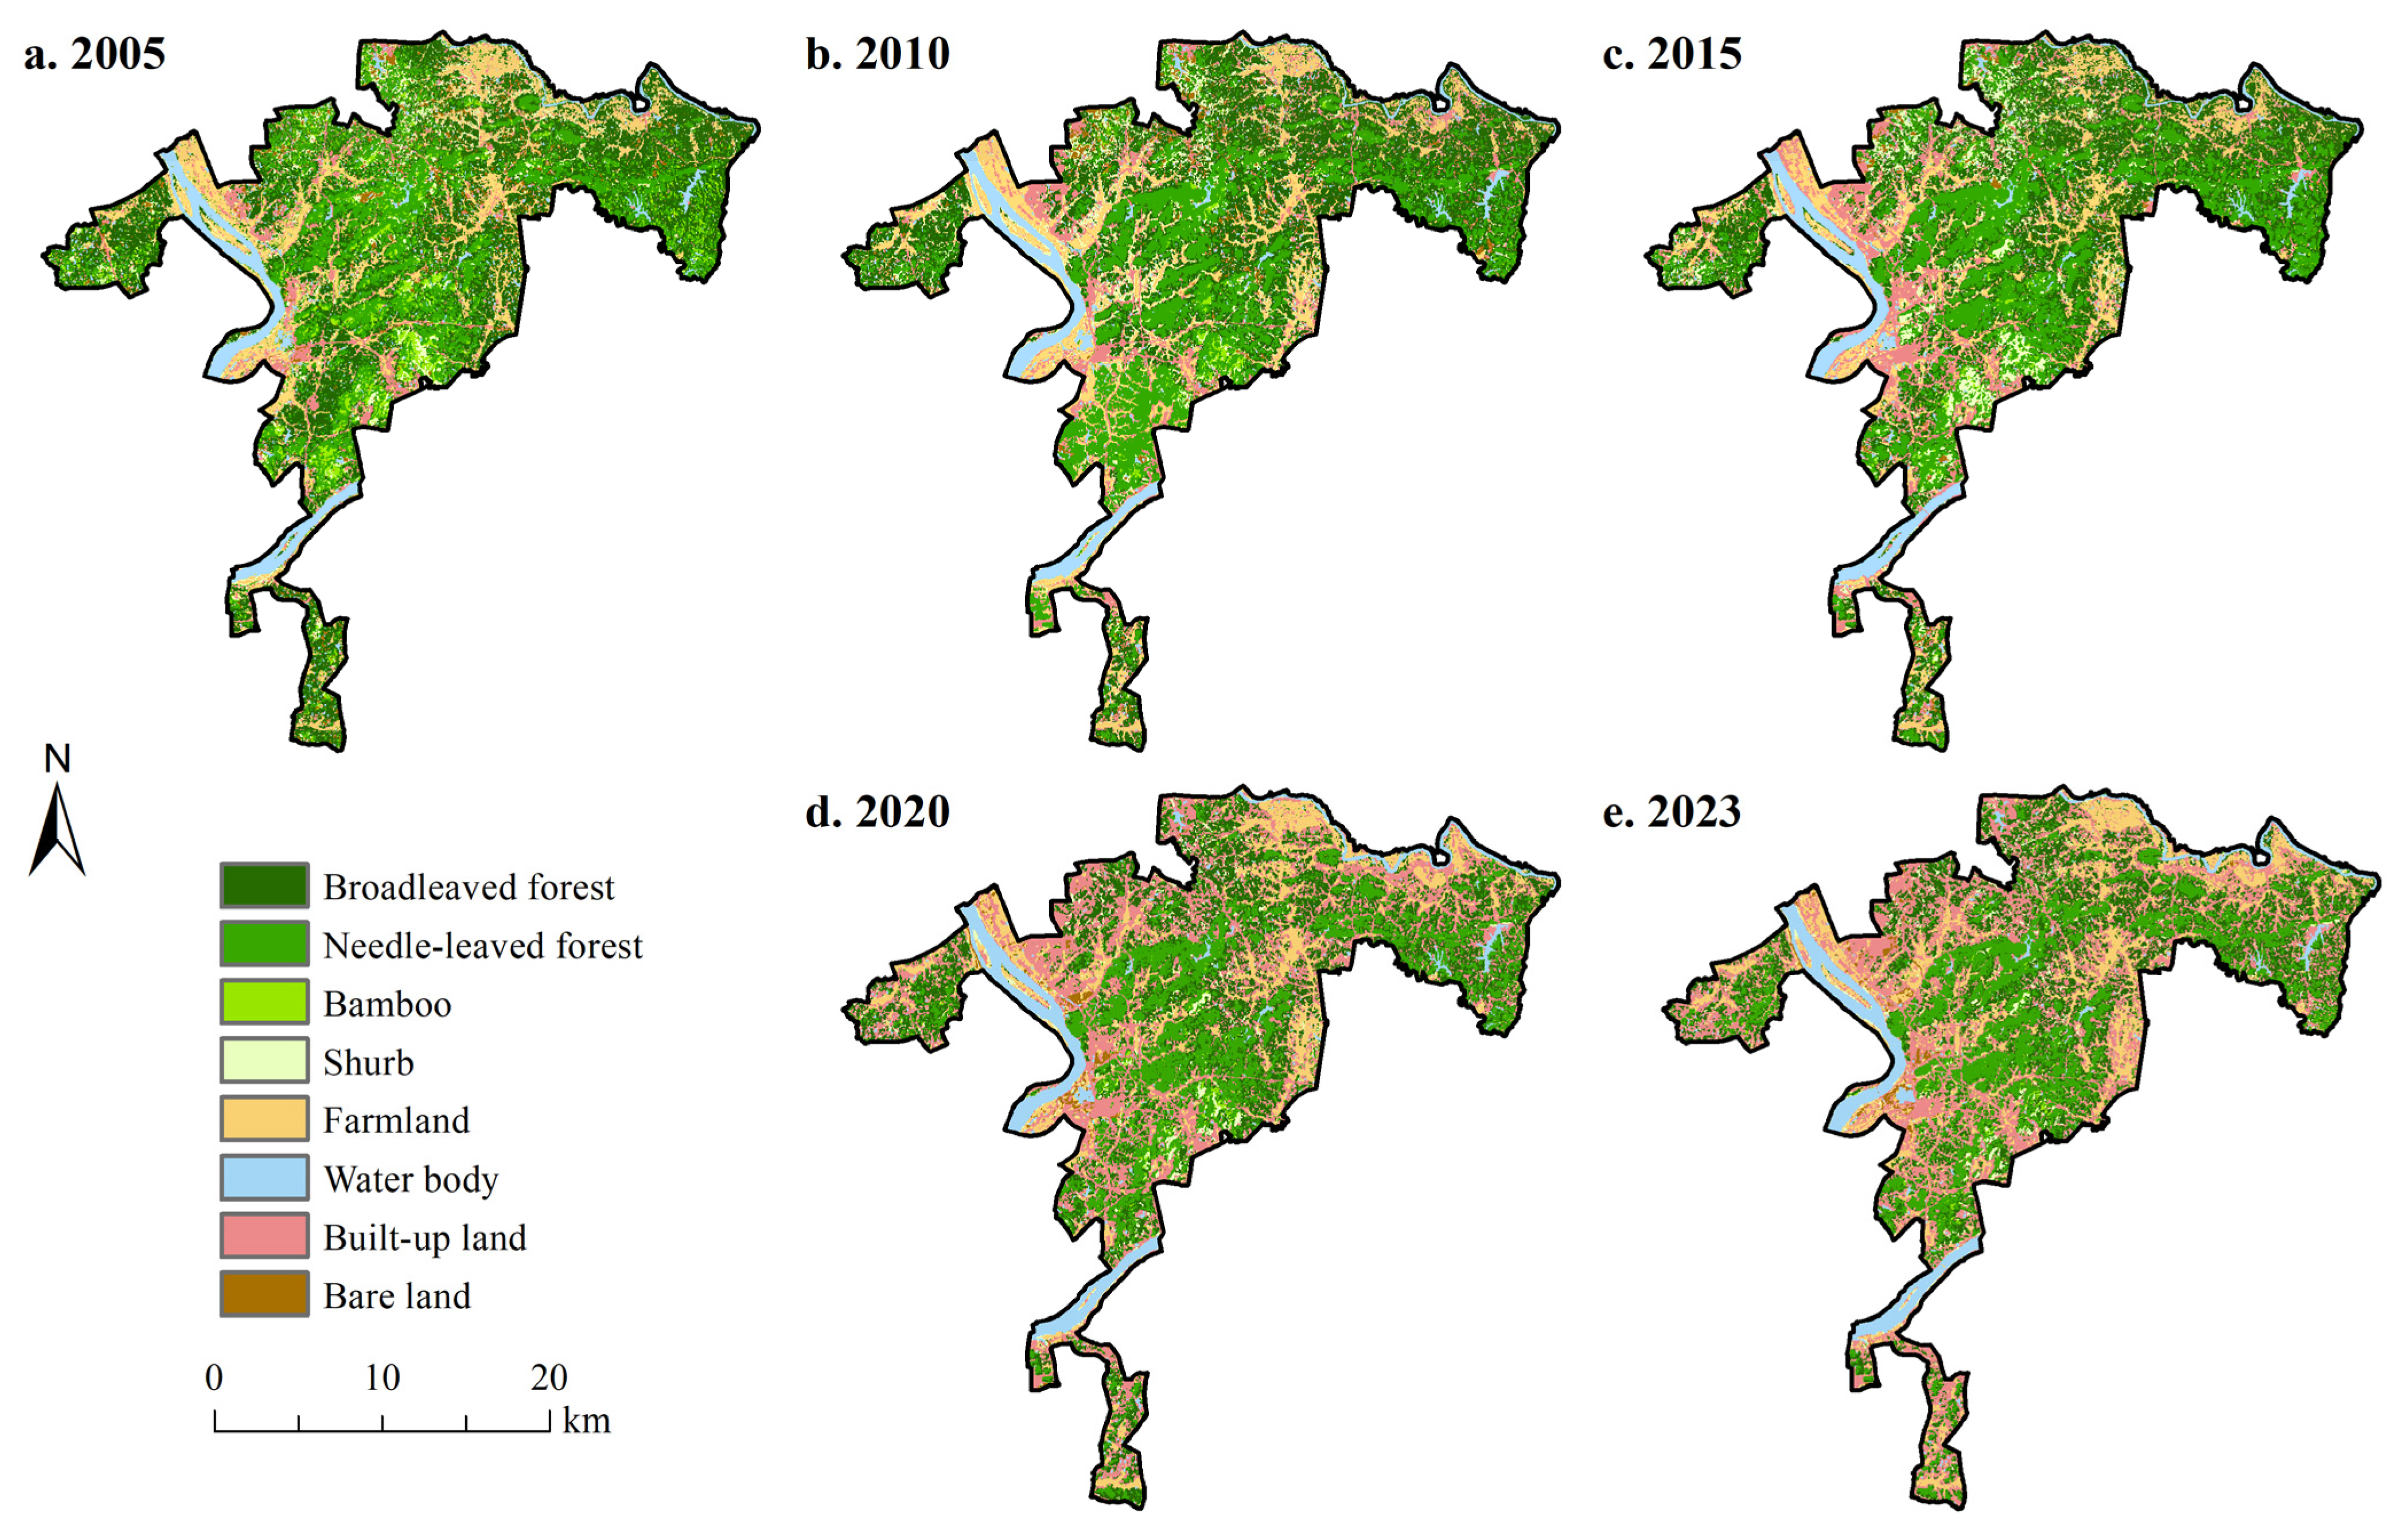
The spatial distribution of land cover in the study area reveals dynamic evolution (Figure 4). From 2005 to 2010, forest land was relatively intact, with broadleaved forests and needle-leaved forests widely distributed throughout the central regions. After 2015, however, forest edges were increasingly encroached upon by farmland, construction land, and bare land. This led to significant forest fragmentation, particularly in riparian zones and around settlements. Between 2020 and 2023, construction land expanded primarily along waterways and transportation routes, further exacerbating this fragmentation. The dominant trend has been the conversion of forest to non-forest land, increasing the dispersion and discontinuity of forest patches. These changes have profoundly impacted the regional ecological structure and function, providing a critical context for the dynamic evolution of forest health.

3.2. Temporal and Spatial Variations in Forest Health Indicators

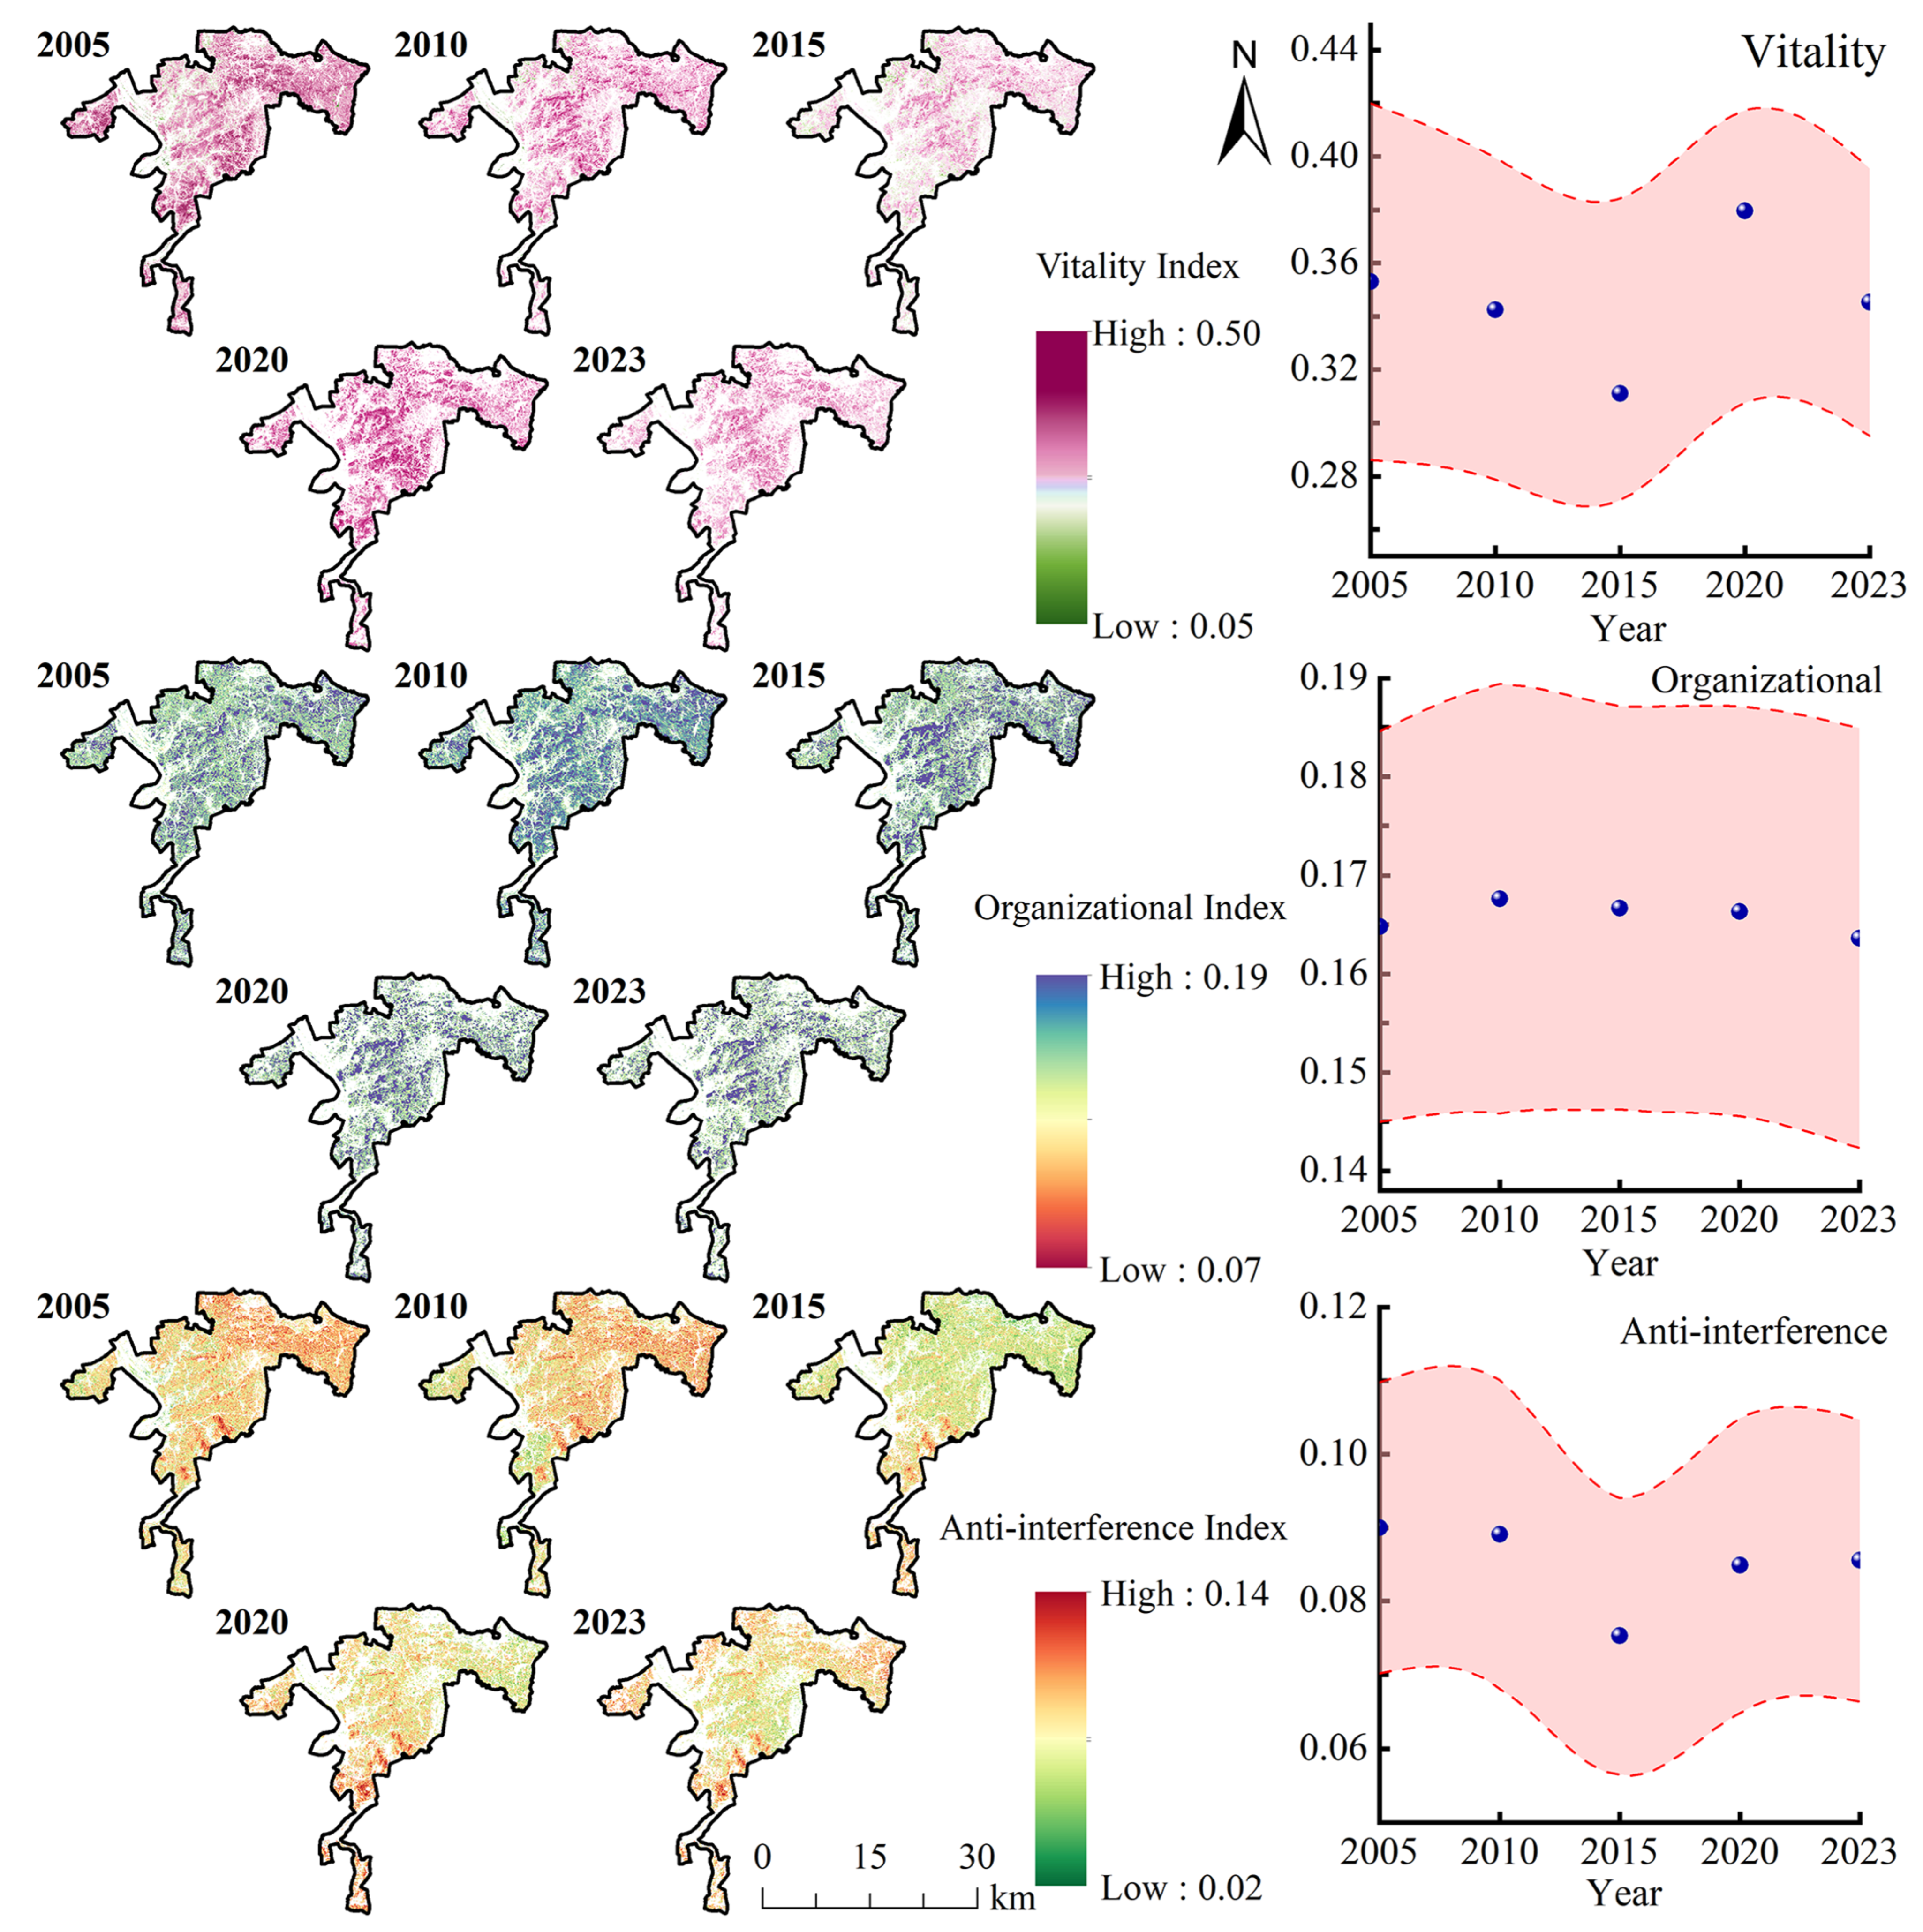
Figure 5 illustrates the spatiotemporal trends of the three forest health sub-indicators–vitality, organizational, and anti-interference–from 2005 to 2023. All three indicators exhibited significant spatial heterogeneity and inconsistent temporal trends. The vitality indicator showed an overall fluctuating upward trend, with notable local improvements after 2015, reflecting enhanced vegetation conditions. The spatial pattern of the organizational indicator was relatively stable, although structural functions weakened in some areas during 2010 and 2020, indicating that the forest spatial structure remains susceptible to local disturbances. The anti-interference indicator remained at a low level with pronounced spatial heterogeneity. A decline in disturbance resistance was particularly evident in some areas between 2015 and 2023, suggesting that the ecosystem’s capacity to withstand external pressures remains inadequate. Collectively, the forest health sub-indicators demonstrate differentiated spatial patterns and a temporal trend of phased improvement coexisting with local degradation. This reveals the complex dynamics of forest health under the combined influence of natural processes and human activities.

3.3. Spatiotemporal Variations and Spatial Clustering of the FHI

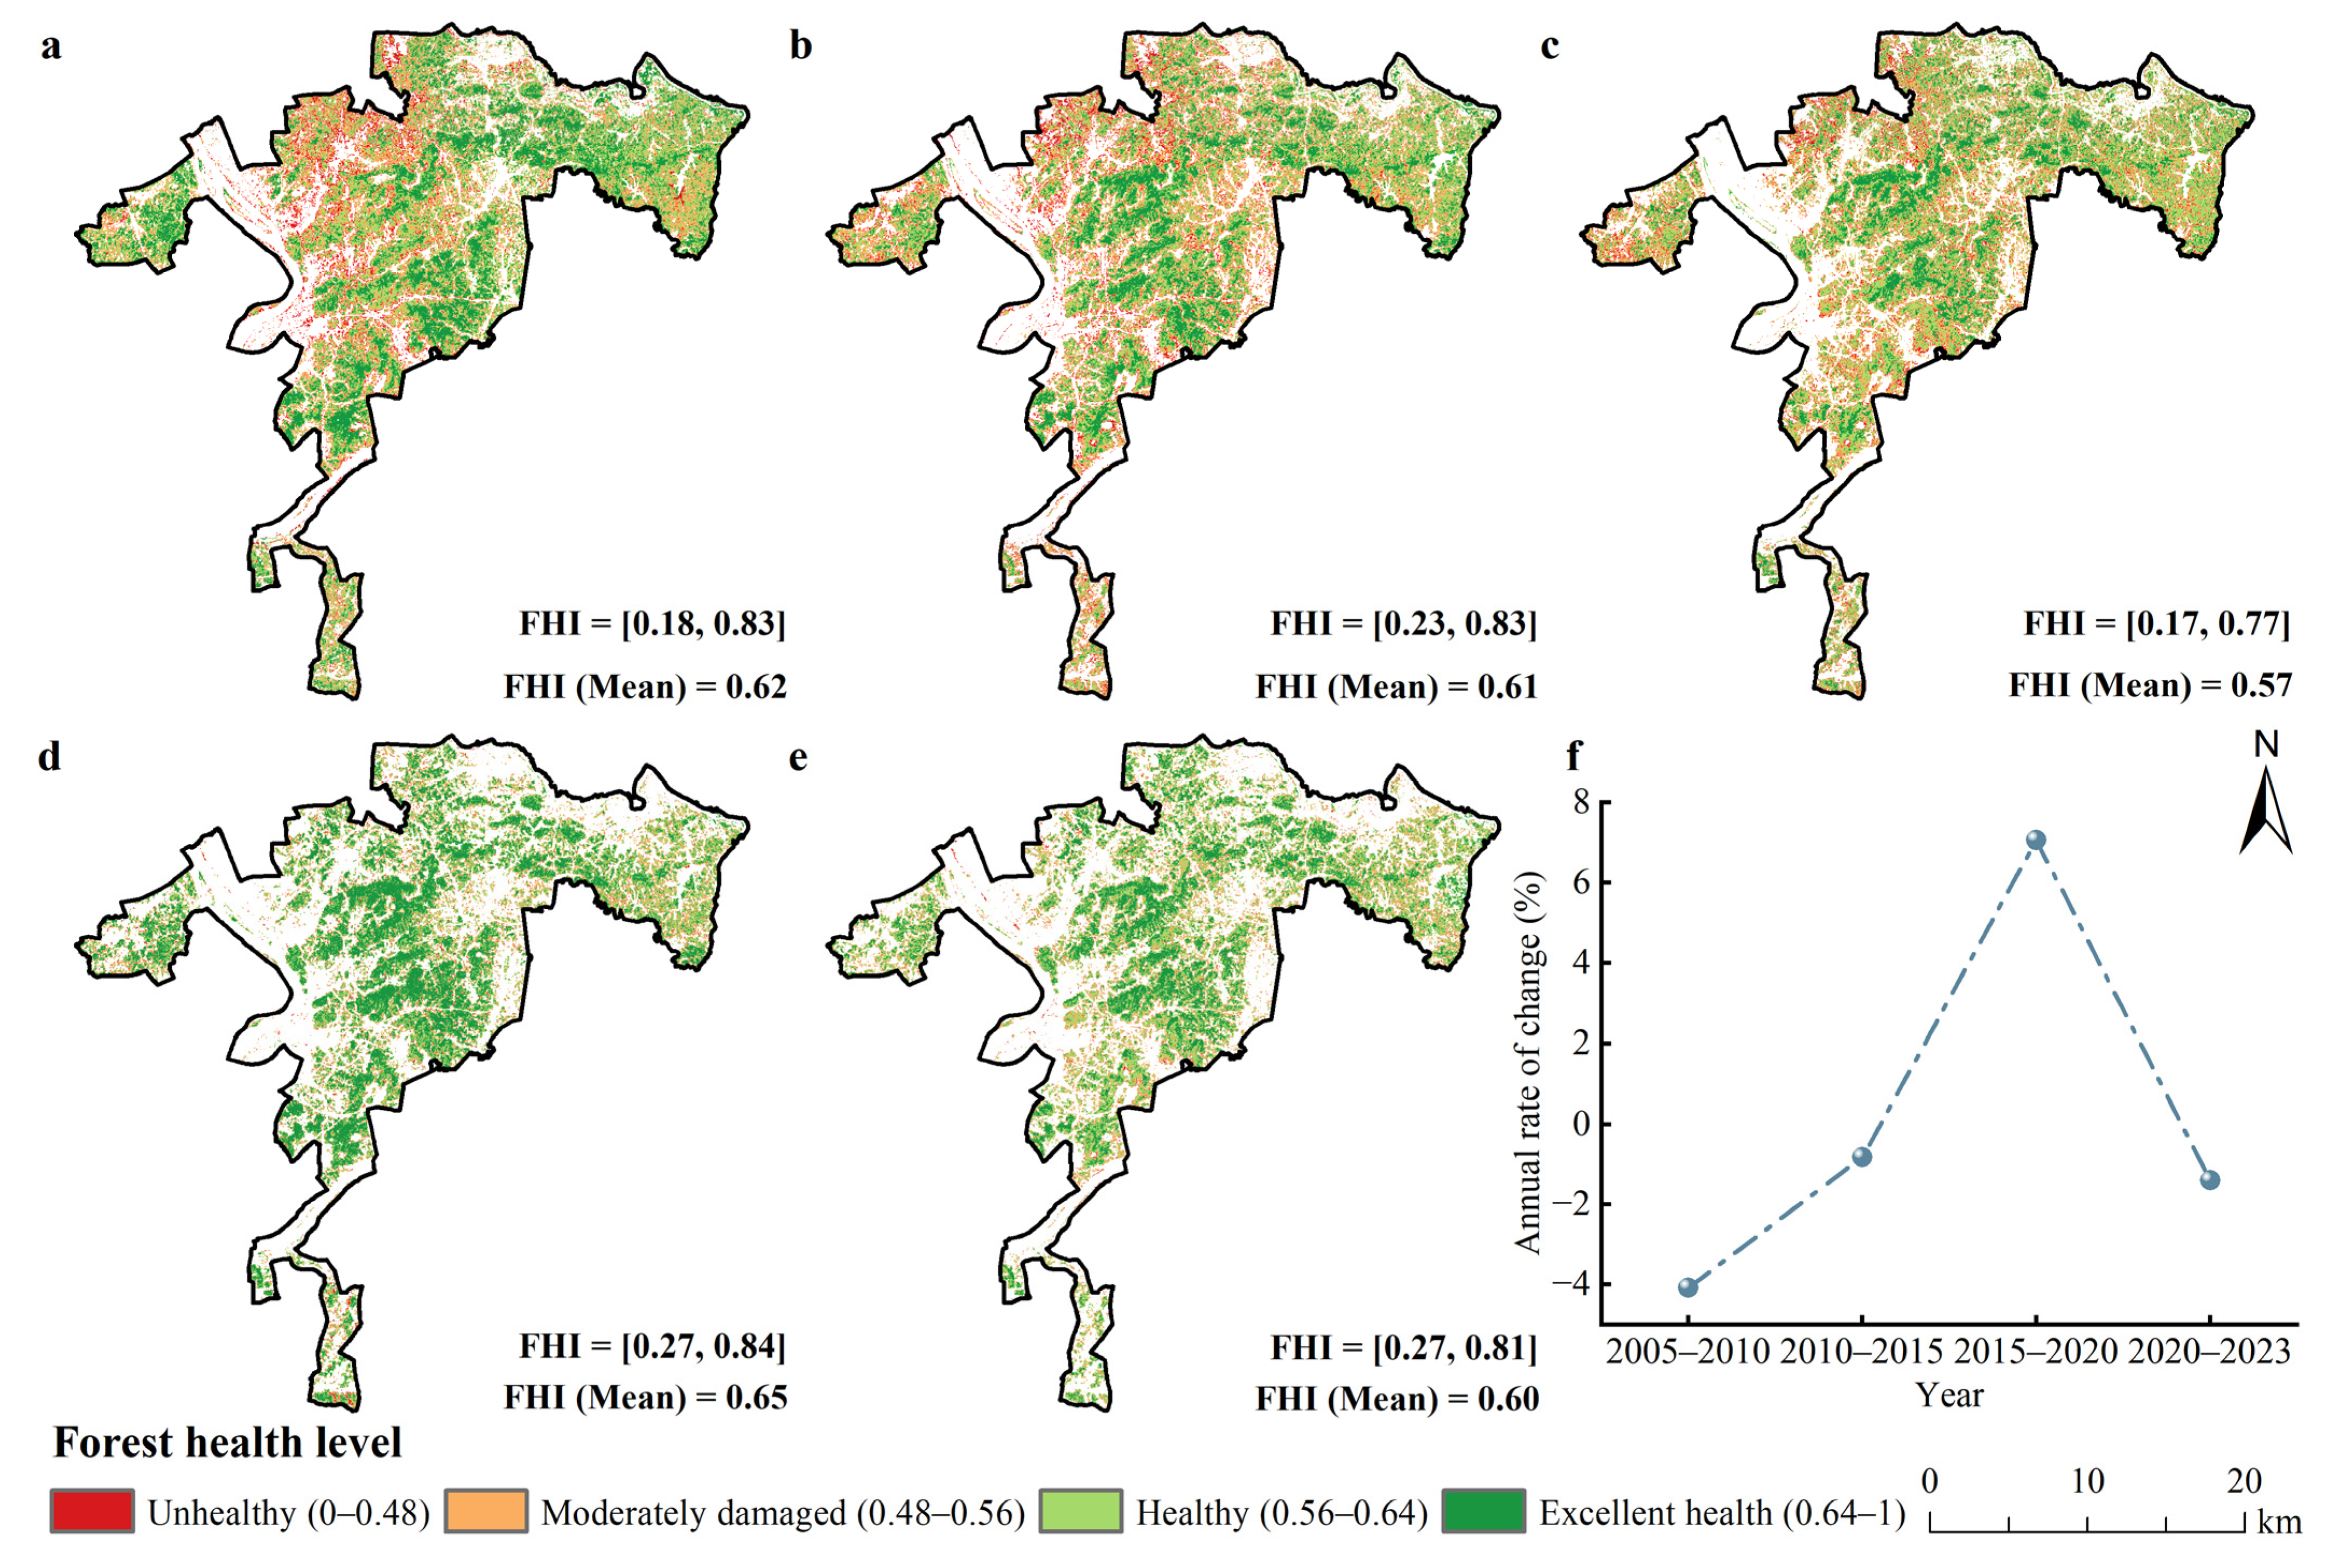
From 2005 to 2023, forest health in the Green Heart Area showed a fluctuating trend (Figure 6a–e). The average FHI decreased from 0.62 in 2005 to a minimum of 0.55 in 2015, recovered to 0.65 in 2020, and then slightly decreased to 0.60 in 2023. Spatially, higher health levels were concentrated in the northeastern and central-eastern regions, contrasting with poorer conditions in the west and south. The nadir of forest health occurred in 2015, characterized by extensive areas classified as unhealthy and moderately damaged, especially in the southwest. Subsequently, a recovery phase after 2020 saw a significant expansion of healthy and excellent health areas and a corresponding contraction of unhealthy and moderately damaged zones. By 2023, the spatial pattern had stabilized, accompanied by a slight decrease in the overall FHI from its 2020 peak. The annual change rate of the forest health index shown in Figure 6f also reflects this trend.
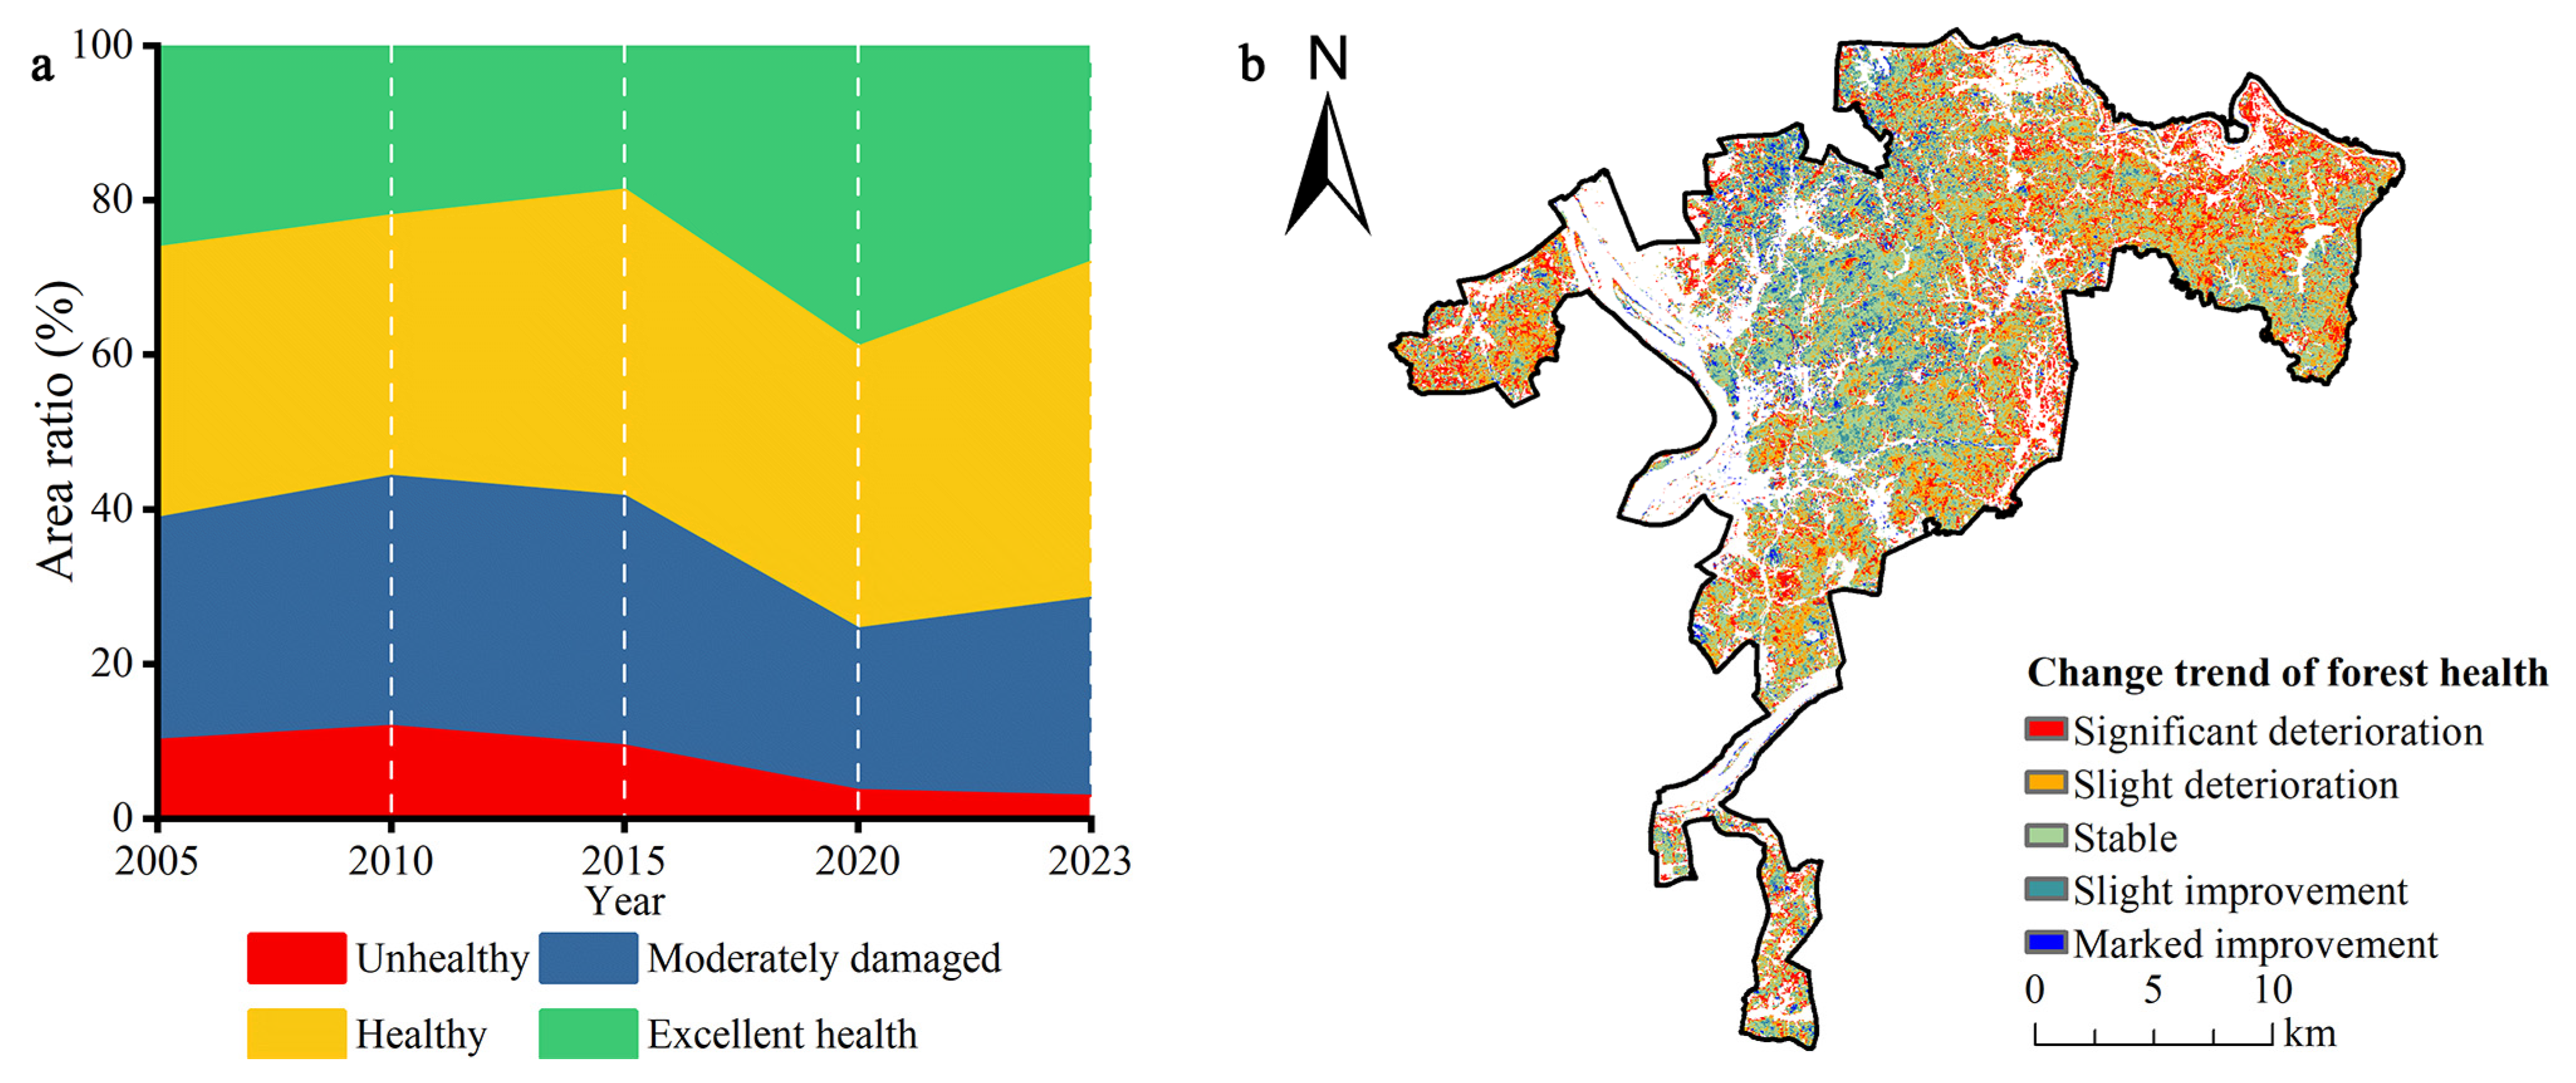
Between 2005 and 2023, the proportions of different forest health grades in the Green Heart Area fluctuated significantly (Figure 7a). The changes in the excellent health type were particularly pronounced, following a V-shaped trend: it decreased from 26.5% in 2005 to 11.6% in 2015 before rebounding to 39.3% in 2020 and then declining to 28.3% in 2023. Conversely, the combined proportion of unhealthy and moderately damaged areas followed an inverted pattern, increasing from 38.5% in 2005 to a peak of 54.8% in 2015, then falling to 24.2% in 2020. The proportion of healthy forest areas remained relatively stable throughout the period. Overall, forest health recovered significantly after its 2015 nadir, though the extent of excellent health areas have decreased slightly since 2020. The trend classification map reveals the spatial dynamics of these changes (Figure 7b). Approximately 40% of the area remained stable, while 28% experienced slight deterioration. In contrast, 12% showed slight improvements, and 3% showed marked improvements. Areas of significant deterioration constituted 17% of the area and were primarily concentrated in marginal zones and localized patches. In summary, the study area is characterized by overall stability, interspersed with localized and intertwined patterns of both improvement and deterioration.
The health status of different forest types varied significantly between 2005 and 2023 (Figure 8). A common temporal pattern emerged: nearly all forest types experienced a decline in health around 2015, followed by a recovery in 2020 and a subsequent decline of varying degrees by 2023. Needle-leaved forests maintained the highest and most stable health levels, with their health index peaking at 0.6623 in 2020 and the proportion of excellent health areas consistently exceeding 30%. In contrast, broadleaf forests fluctuated notably; their health index dropped to a low of 0.5682 in 2015 before rebounding to 0.6477 in 2020 and then declining again. Bamboo forests experienced the most dramatic shift. After 2020, the proportion of excellent health areas plummeted from 56.00% to just 10.99% by 2023, while the moderately damaged proportion concurrently rose to 35.09%. Shrubs consistently exhibited the poorest health conditions. By 2023, only 4.31% of shrubs were classified as “excellent health”, while over half (50.56%) were considered “moderately damaged”.
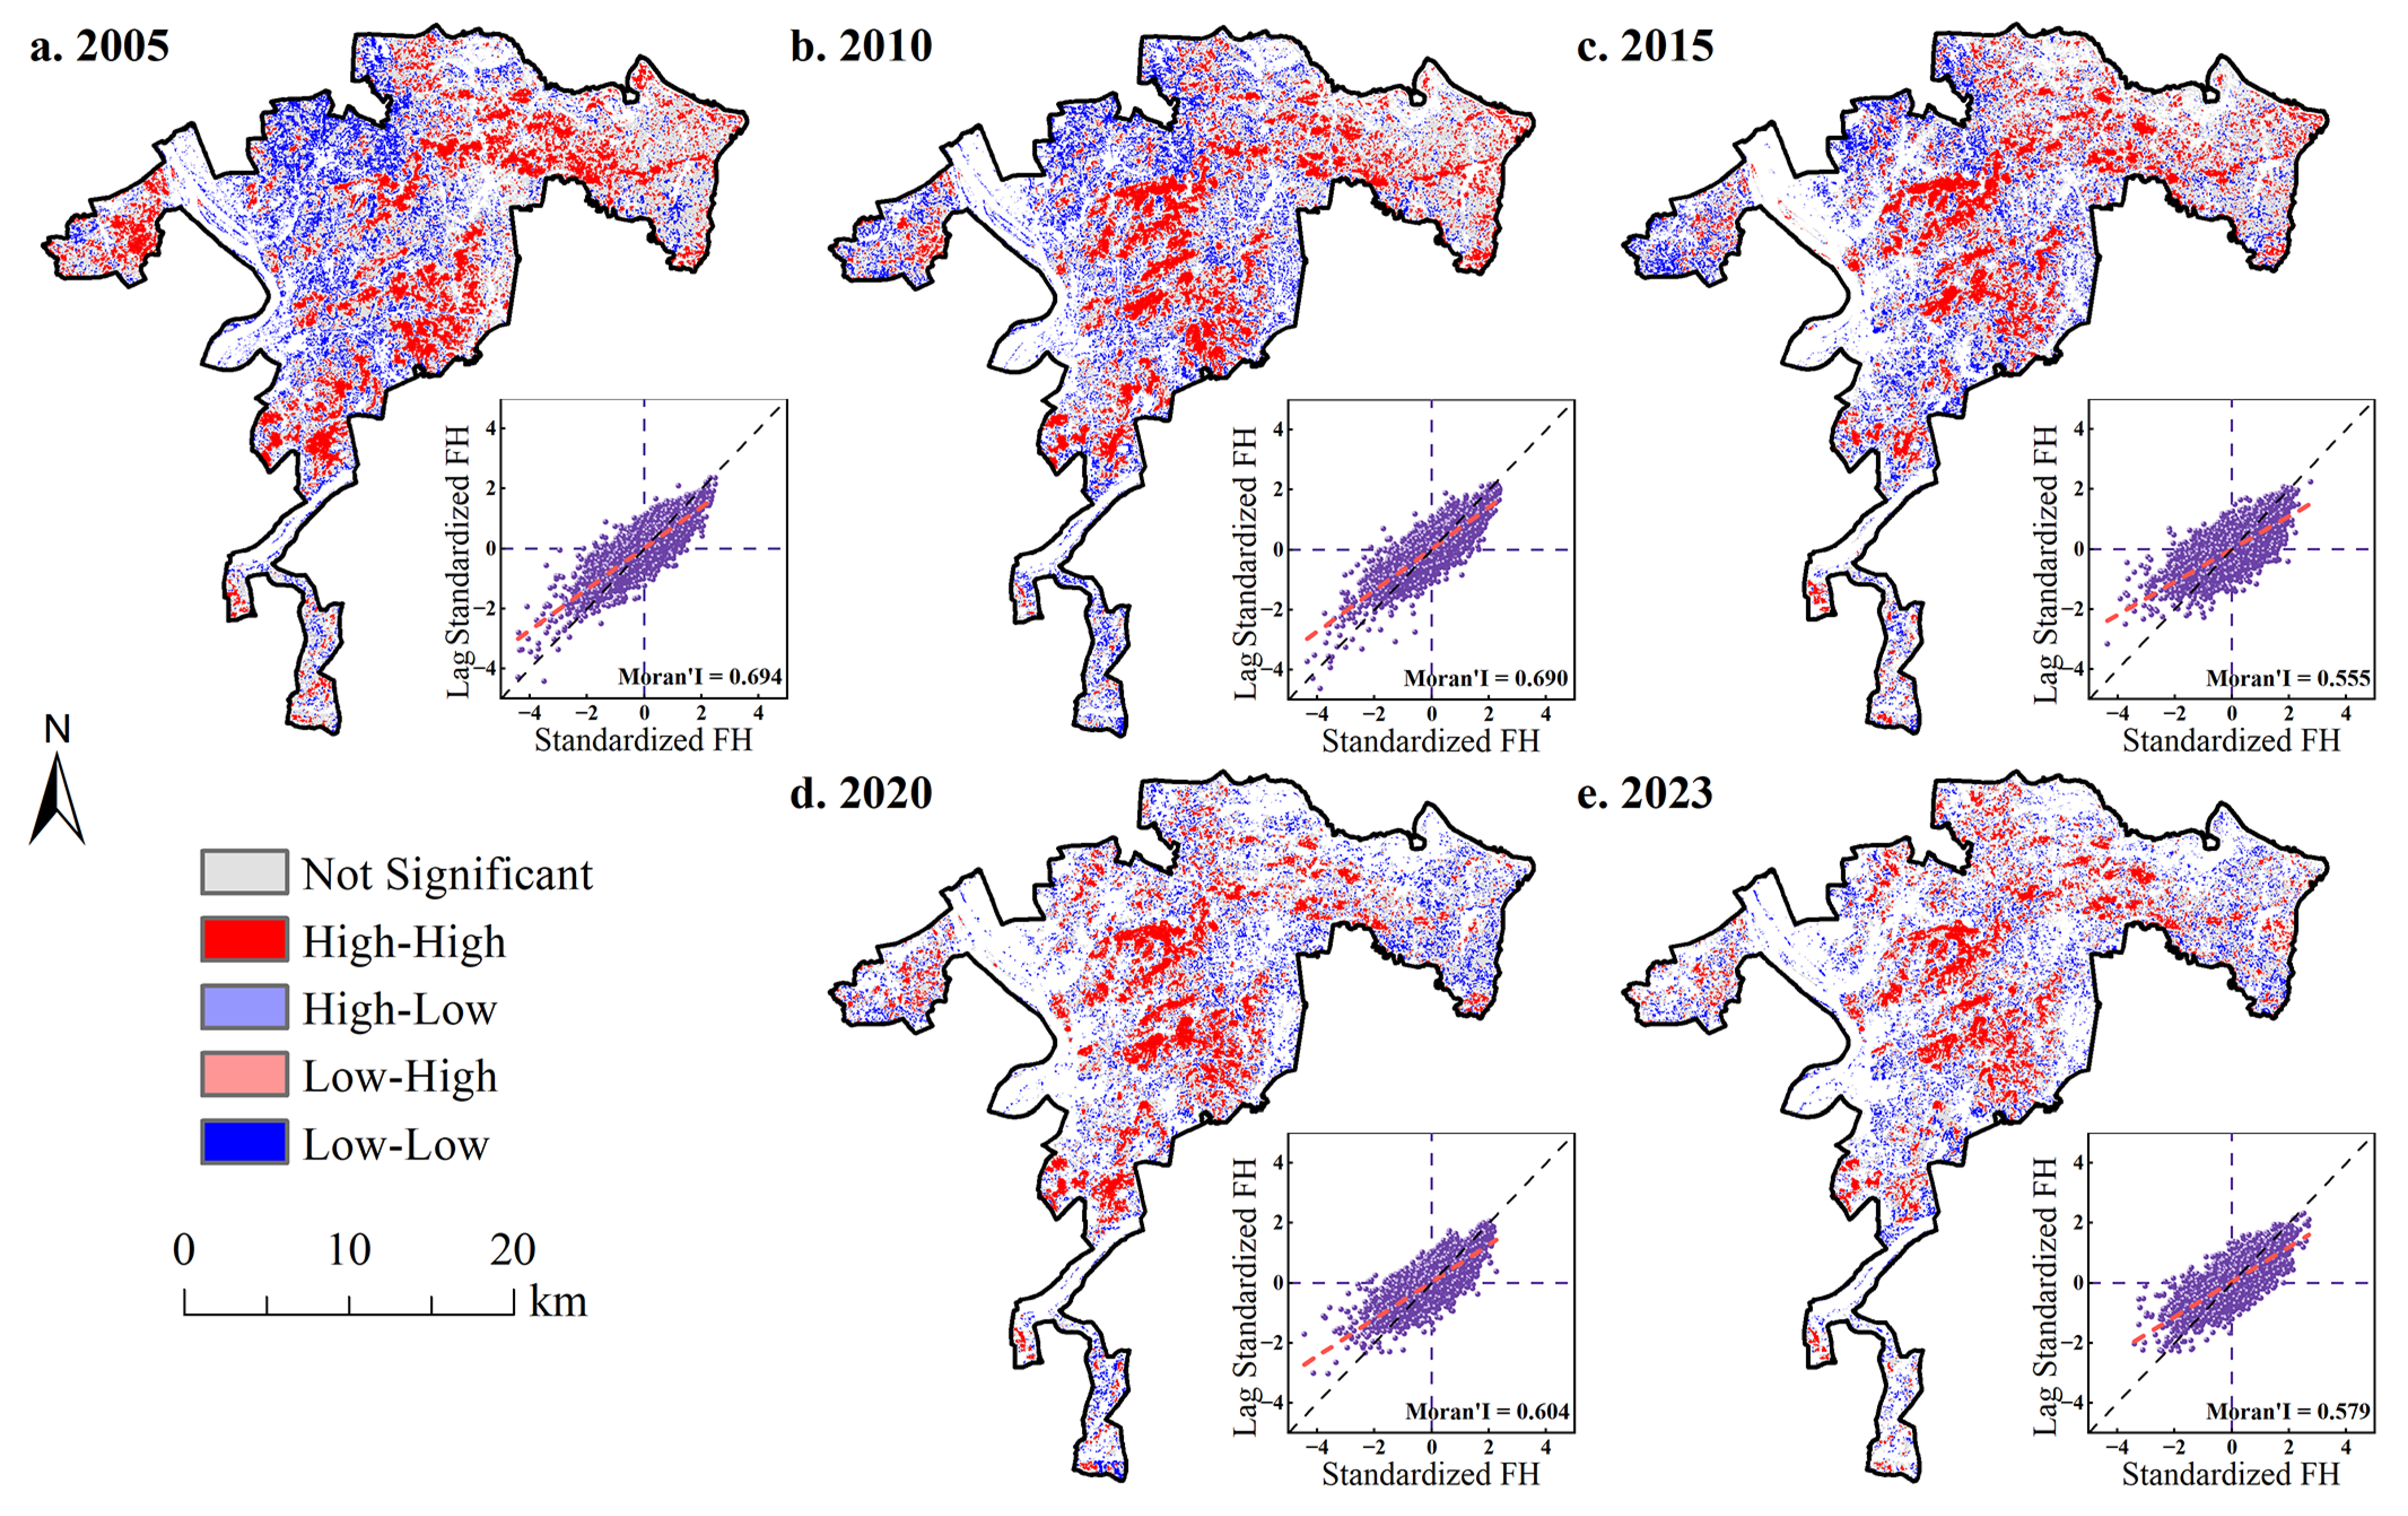
Global spatial autocorrelation analysis reveals a significant and dynamic clustering pattern of forest health in the Green Heart Area from 2005 to 2023. The global Moran’s I index for each year was statistically significant (p < 0.01), with values ranging from 0.555 in 2015 to 0.694 in 2005. This indicates a strong positive spatial autocorrelation and a non-random distribution of forest health. The Moran’s I index fluctuated over the period: it first decreased from its peak in 2005 to a trough in 2015, then rebounded in 2020 before declining again by 2023. Despite these fluctuations, the overall degree of spatial clustering remained high.
Local spatial autocorrelation analysis identified five cluster types: High–High (hotspots), Low–Low (coldspots), High–Low, Low–High, and not significant (Figure 9). The results reveal significant local spatial aggregation, dominated by High–High and Low–Low clusters. Temporally, the distribution of these clusters evolved. Between 2005 and 2015, large High–High clusters were concentrated in the central-southern region, while extensive Low–Low clusters were present in the northern and central areas. After 2015, the High–High clusters contracted, though they began a slight recovery by 2020. The Low–Low clusters, while remaining dominant, also saw their extent decrease over the same period. The High–Low and Low–High clusters, representing spatial outliers, consistently constituted a small proportion of the area and were sparsely distributed.

3.4. Analysis of the Driving Forces Behind Temporal and Spatial Changes in Forest Health

3.4.1. Optimal Parameter Identification

To determine the optimal spatial scale for factor analysis, this study used 2023 data as a benchmark and compared the explanatory power of FHI drivers at six scales ranging from 75 m to 1000 m (details are provided in Table S6 in the Supplementary Material). Ultimately, 750 m was selected as the optimal scale for analyzing the drivers of the FHI for the five periods from 2005 to 2023.
Different methods exhibit significant performance differences across regions, and the optimal combination is selected based on the principle of maximizing the q-value. Based on the results (details are provided in Figure S1 in the Supplementary Material), different classification methods were applied to each variable: the annual average temperature (X1) and soil type (X3) were classified into three and six categories using the quantile method; annual precipitation (X2) and nighttime light (X12) were classified into six and three categories using the natural breakpoint method; soil moisture content (X4) and elevation (X6) were classified into four categories using the standard deviation method; soil pH (X5), the distance from roads (X9), population density (X10), and GDP (X11) are categorized into six, six, three, and four categories, respectively, using the geometric distance method; the slope (X7) and slope direction (X8) are categorized into five and four categories, respectively, using the equal interval method.

3.4.2. Driving Factor Analysis

Single-factor analysis indicates that while the explanatory power of individual drivers varied annually, a stable dominant pattern emerged (details are provided in Figure S2 in the Supplementary Material). Topographic factors, specifically elevation and slope, were consistently the primary drivers, maintaining high q-values throughout the study period. For instance, elevation had q-values of approximately 0.17 in 2010 and 0.16 in 2015, reflecting the stable controlling influence of topography. Other natural environmental factors, including the annual average temperature and soil pH, also demonstrated strong explanatory power, particularly before 2020. In contrast, socioeconomic factors such as population density, GDP, and night lights had a weaker influence with consistently lower q-values. However, the explanatory power of population density increased significantly in 2023, suggesting that the disruptive impact of human activity on forest health has intensified. Additionally, factors like precipitation, slope aspect, and soil type showed significant annual fluctuations in their q-values, indicating that their influence is characterized by high spatiotemporal uncertainty.
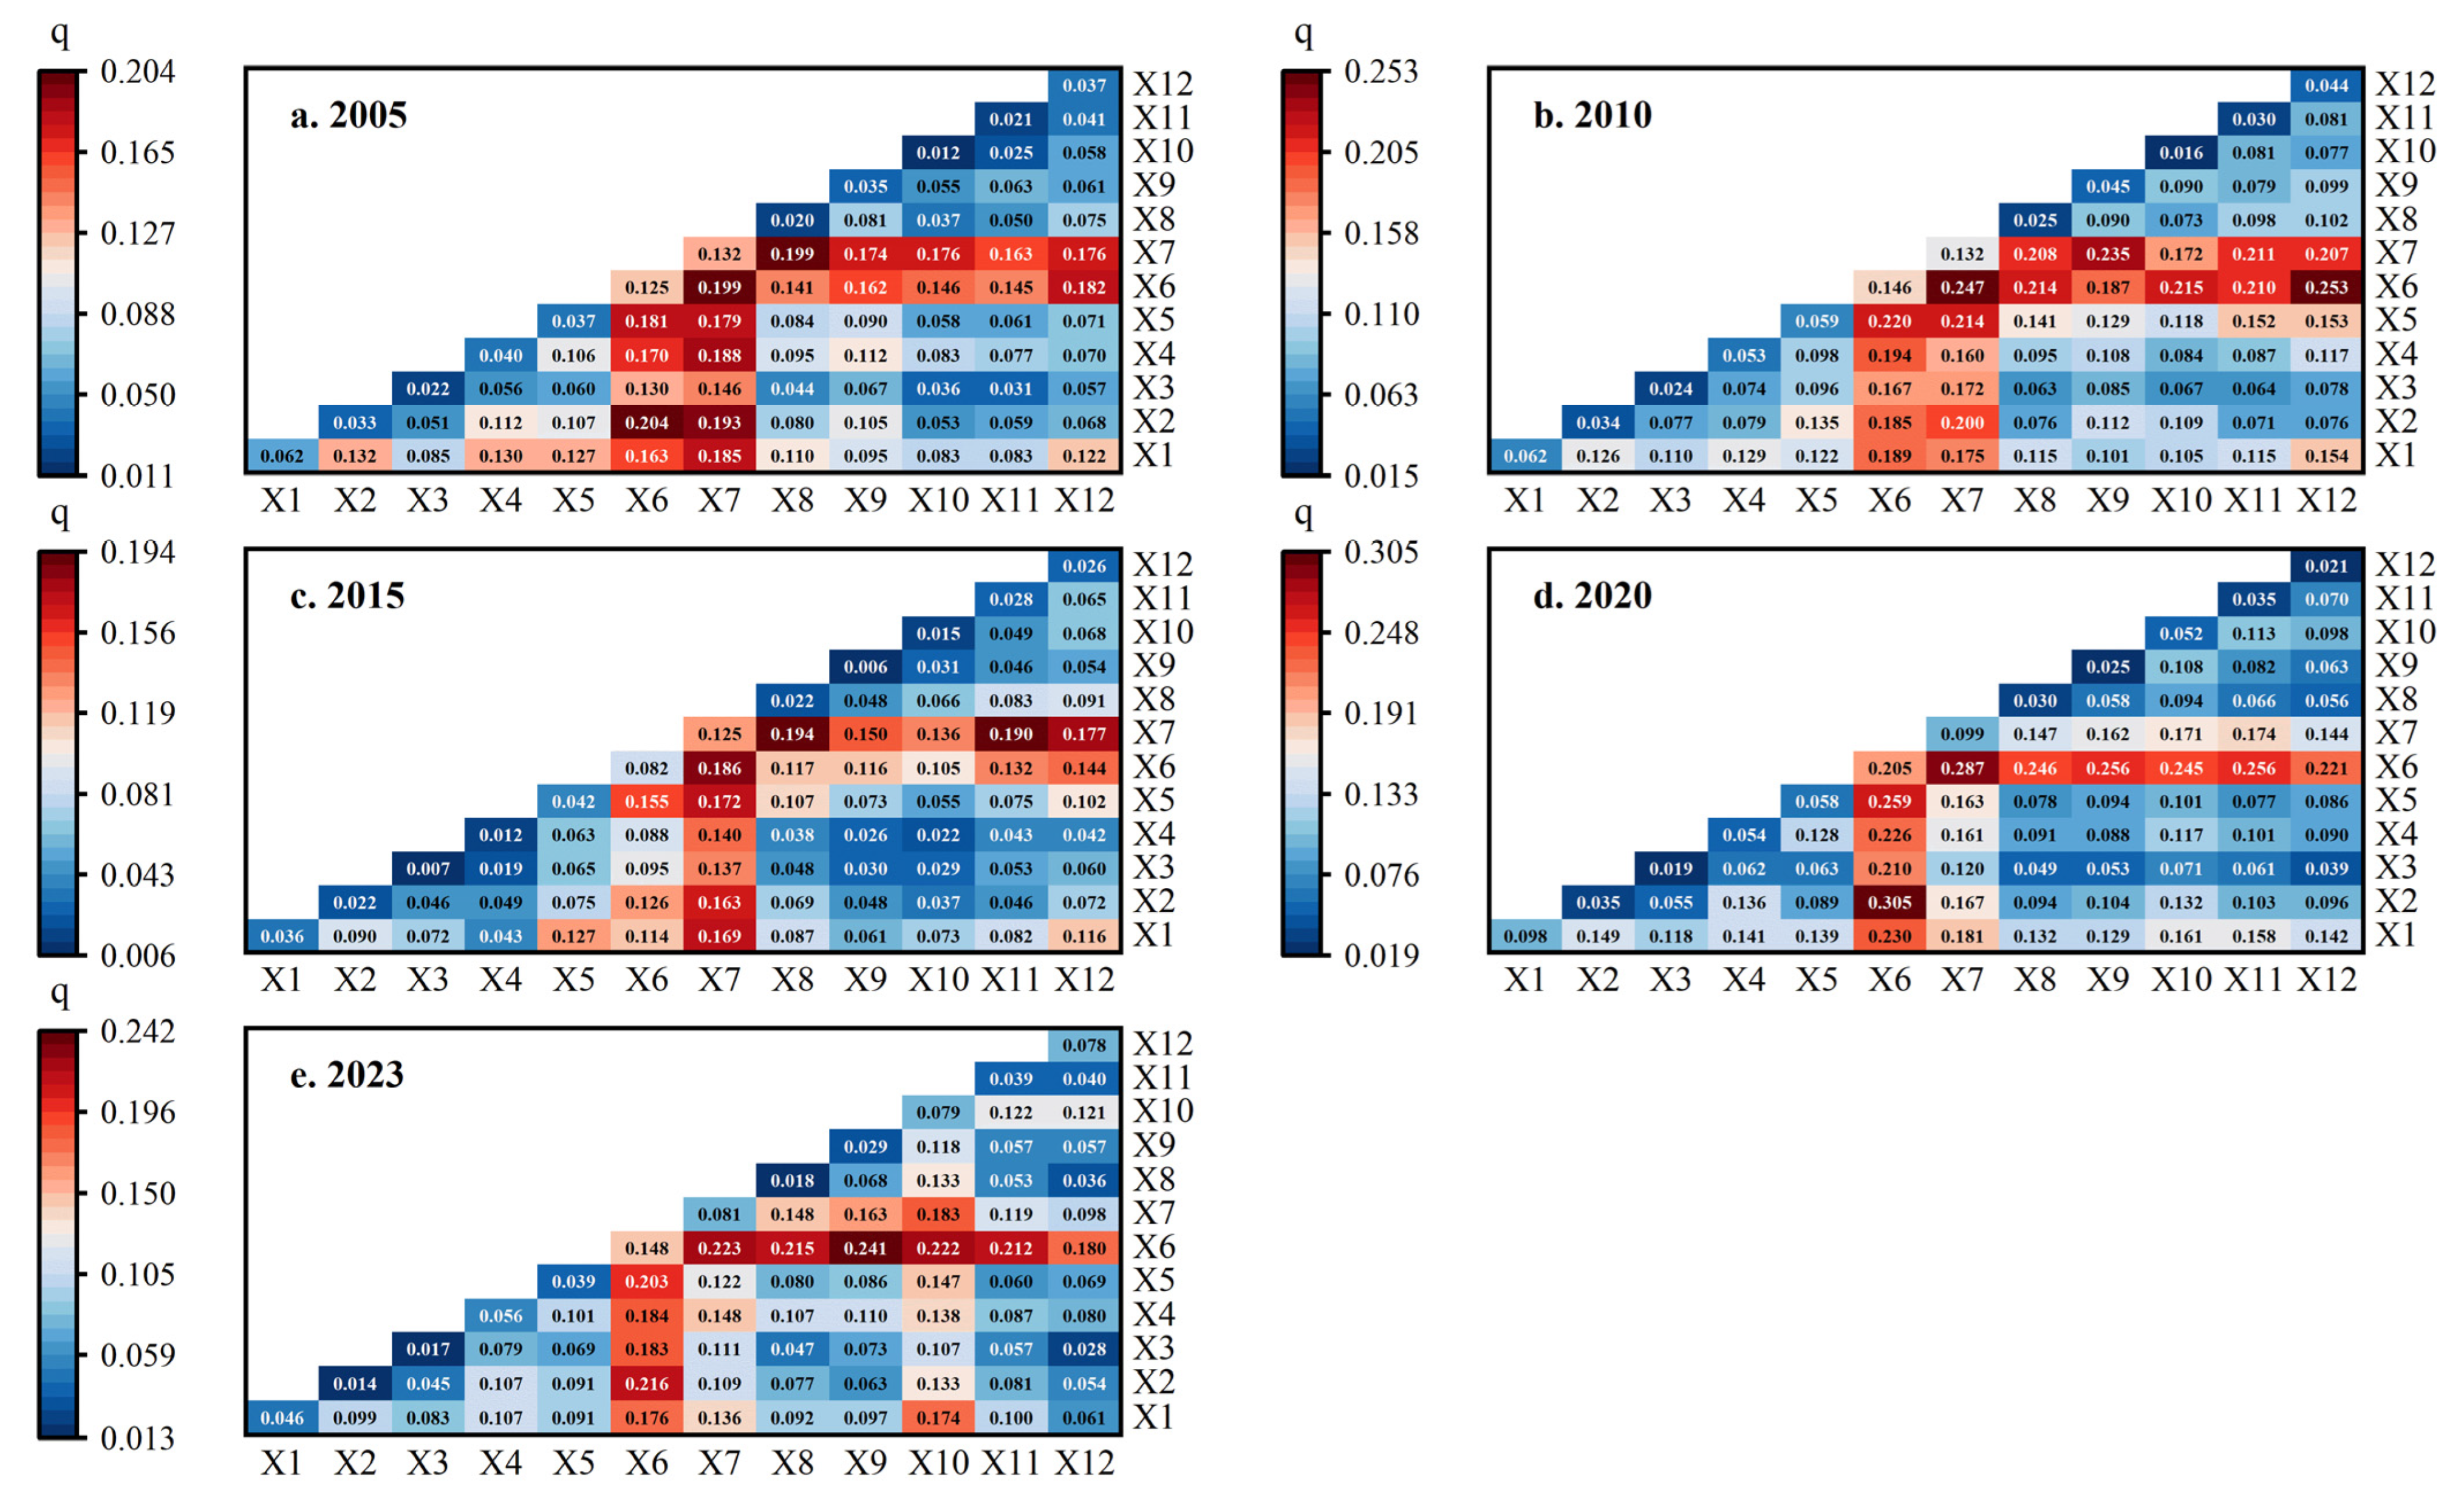
Interaction detection analysis (Figure 10) revealed that the explanatory power for forest health was enhanced when the two factors were considered together. The interaction between any two factors was greater than that of a single factor, indicating that the spatial variation in forest health is driven by the composite effect of multiple drivers. Throughout the study period, several interacting pairs consistently exhibited high q-values, including elevation (X6) ∩ slope (X7), elevation (X6) ∩ soil moisture content (X4), and slope (X7) ∩ distance from roads (X9). Notably, the interaction between elevation (X6) and annual precipitation (X2) in 2020 demonstrated strong nonlinear enhancement, producing a q-value of 0.305 that significantly exceeded the influence of any single factor. Furthermore, interactions between natural and socioeconomic factors, such as annual average temperature (X1) ∩ GDP (X11) and slope (X7) ∩ population density (X10), also yielded high q-values.

4. Discussion

4.1. Dynamic Responses of Forest Health in the Context of Rapid Urbanization

During the period from 2005 to 2023, the FHI in the Green Heart Region underwent a process of fluctuating deterioration, gradual improvement, and eventual stabilization. This was not a simple linear decline or improvement but rather a complex dynamic response resulting from the combined effects of multiple pressures and interventions. From 2005 to 2015, there was a sustained decline in health levels, with the average FHI dropping from 0.62 to a low of 0.55. This deterioration was the result of the combined effects of extreme climate events and intensified human activities. On the one hand, the study area experienced prolonged low temperatures, snowfall, and freezing conditions in southern China in 2008 [31]; extreme high temperatures and drought in 2013 [32]; and flooding in 2015 [33]. These climate changes pose a major threat to forest health [34]. On the other hand, this period coincided with the rapid advancement of urbanization [35], during which intensified infrastructure development and land conversion along the periphery of the Green Heart Zone contributed to increased forest fragmentation [36] and diminished the area’s ecological resilience [37]. From 2015 to 2020, the FHI significantly rebounded to a peak of 0.65, strongly demonstrating that proactive ecological intervention measures are key to reversing degradation trends. Following the initial degradation, the Hunan Provincial Government and local authorities strengthened protection regulations for the Green Heart Zone and implemented a series of ecological projects, including degraded forest restoration, afforestation, and national land greening [38]. These measures significantly improved FVC and NPP, leading to a noticeable improvement in the structure and function of forest ecosystems. However, the FHI slightly declined to 0.60 after 2020, as ecological restoration entered a consolidation phase with slowed growth rates [39]. Meanwhile, ongoing urbanization pressures and climate fluctuations persist, but the enhanced ecological resilience from prior restoration efforts has kept the FHI relatively stable. The overall forest health status in the Green Heart Zone exhibits a distribution pattern of “higher in the east and central regions, lower in the west and south”. The eastern and central parts of the study area are characterized by large, contiguous forest patches with high vegetation cover, well-preserved ecological integrity, and low levels of human interference [40]. In contrast, the southwestern region—bordering urbanized zones and major transportation routes—suffers from intense anthropogenic disturbance, increased forest fragmentation, and ecological function decline, resulting in a concentration of sub-healthy and unhealthy forest areas [41]. Over a prolonged period, the study area has undergone intense urbanization, resulting in sustained ecological stress [42]. Approximately 17% of the area has experienced significant deterioration in FHI, primarily in localized patches concentrated in peripheral regions, and these areas highly overlap with zones of intense human activity, highlighting the ongoing stress on forest ecosystems from urbanization and land development. Changes in land use and cover patterns directly reflect the spatial impact of human activities on forest ecosystems under urbanization. The reduction in forest area and increased fragmentation not only weaken the overall stability and connectivity of ecosystems but also increase the risk of localized degradation of forest health, particularly in urban–rural transition zones and along transportation corridors.

4.2. Key Drivers of Forest Health

The single-factor analysis reveals that topographic factors, particularly elevation and slope, are the most consistent and powerful drivers of forest health, maintaining high q-values throughout the study period. This aligns with established ecological principles, as topography governs the large-scale redistribution of water, heat, and soil nutrients, thereby shaping the macro-spatial patterns of forest health [43]. Climatic and soil factors are also significant drivers. The annual mean temperature and soil pH, in particular, exhibited moderate to high explanatory power in most years. Optimal thermal regimes and soil physicochemical properties play a vital role in sustaining ecosystem stability and productivity [44]. In contrast, socioeconomic factors such as population density, GDP, and night lights exerted a weaker overall influence, although the explanatory power of population density showed a notable increase in recent years like 2023. This suggests that while human activities are not the dominant large-scale driver, they can cause significant disturbances in critical localized areas [29].
The interaction detection results confirmed that the spatial differentiation of forest health is driven by the synergistic effect of multiple factors, as two-factor interactions consistently had greater explanatory power than single factors. The strong nonlinear enhancement between natural factors was evident in the interaction between elevation and precipitation in 2020, which yielded a q-value of 0.305. Furthermore, strong interactions between natural and socioeconomic factors, such as temperature ∩ GDP and slope ∩ population density, highlight the complex and nonlinear response mechanisms of forest ecosystems to combined drivers [45].

4.3. Management Implications

This study indicates that the spatial pattern of forest health in the Green Heart Area is driven by topographic factors at a broad scale and influenced by socioeconomic factors at a local scale. This multi-scale driving mechanism suggests that effective ecological management requires a differentiated strategy that combines large-scale conservation with targeted local interventions.
Given the significant spatial heterogeneity, management policies should be tailored to specific zones. In the core forest areas of the central and eastern regions, where topography has shaped a stable, high-level health pattern, management should prioritize natural recovery and strict conservation. Conversely, for peripheral areas experiencing localized health decline, particularly along urban–rural transition zones and transportation corridors, establishing stricter ecological buffer zones and development controls is necessary to mitigate the pressures of urbanization.
The health recovery observed between 2015 and 2020 demonstrates the effectiveness of ecological restoration projects. However, restoration alone is insufficient to offset the intensifying pressures of urbanization. Future management must therefore adopt an integrated approach that combines active restoration with proactive spatial controls. This requires not only continued investment in ecological projects but also the strict enforcement of land use controls and development intensity restrictions to create a sustainable management model. Only through such a synergistic strategy can the stable enhancement of urban forest ecological functions be achieved.

4.4. Prospects

This study still has several limitations that warrant further refinement in future work. First, due to data acquisition constraints, key indicators related to biodiversity and ecological functioning—such as understory vegetation and soil microbial activity—were not included in the current assessment system. Their omission may lead to an underestimation of forest degradation and limit the comprehensiveness and sensitivity of the results. Additionally, due to the challenges of large-scale field surveys in terms of resources and implementation, the current study has not been able to obtain ground observations to systematically validate the indicator system, affecting the scientific rigor and robustness of the assessment of health indicator validity. Second, while the 30 m resolution remote sensing data used is appropriate for regional analysis, it cannot adequately capture micro-topographic variability in mountainous terrains. In addition, inconsistencies among remote sensing sources may introduce uncertainty in identifying driving factors. Third, the use of annual time-series data is effective for capturing long-term trends but may overlook seasonal variations critical to forest dynamics—especially in monsoon-affected regions. The lower temporal granularity also makes it difficult to detect short-term disturbances and their delayed or cumulative effects. Despite the above limitations, this study established a systematic and replicable forest health assessment framework under existing data and technical conditions, providing strong support for ecological management and policy-making in urbanized areas. Future research can be further expanded and deepened in the following four aspects: First, combine high-resolution remote sensing data (such as LiDAR, hyperspectral imagery, and drone imagery) with ground survey data to construct a multi-source, multi-scale forest health monitoring and verification system, enhancing the precision and scientific explanatory power of assessment indicators. Second, conduct comparative analyses at different spatial scales (e.g., forest compartments and watershed units) to explore the stability and spatial heterogeneity of driving factors, providing support for hierarchical management and regional policy formulation. Third, introduce remote sensing data with higher temporal resolution (e.g., quarterly and monthly) and utilize time-series disturbance detection techniques to capture seasonal and abnormal fluctuations in forest health, enhancing the timeliness and early warning capabilities of monitoring. Fourth, integrate long-term ecological monitoring data with socioeconomic data to analyze the lag effects, threshold responses, and cumulative impacts of driving factors, thereby revealing the interactive mechanisms between human activities and natural processes and providing support for the construction of a governance system with predictive and adaptive management capabilities.

5. Conclusions

This study established a forest health evaluation system based on a vitality, organizational, and anti-interference framework using multi-source remote sensing data. We systematically analyzed the spatiotemporal evolution of forest health in the Ecological Green Heart Area of the Chang–Zhu–Tan Urban Agglomeration, China’s first trans-administrative ecological protection zone, from 2005 to 2023. Our results show that the FHI exhibited a fluctuating trend of initial decline, subsequent recovery, and recent stabilization. Spatially, forest health demonstrated a core–periphery pattern, with healthier core areas surrounded by peripheral zones of poorer health, particularly in the western and southern regions most impacted by urbanization. Using the optimal parameter geographic detector, we identified a clear hierarchy of driving factors. Topographic factors, primarily elevation and slope, were the dominant long-term drivers shaping the large-scale patterns of forest health by regulating the water, heat, and soil environment. Climatic factors, such as the annual mean temperature and precipitation, were the next most influential. Although individually weaker, the influence of socioeconomic factors related to urbanization is increasing. Crucially, interactive effects among all factors are widespread and significantly enhance their combined impact, indicating that forest health results from multiple synergistic forces. Using the Green Heart Area as a typical case, this study demonstrates that the evolution of forest health in large urban ecological zones is a complex process driven by the interplay of natural disasters, policy interventions, and persistent human pressures from urbanization. This research provides a critical scientific reference for the protection, planning, and management of ecological spaces within other urban agglomerations that face similar development challenges. Based on the above findings, we propose a set of practical strategies to enhance forest health in urban ecological zones: (1) Implement differentiated management between core and peripheral areas by strengthening ecological conservation in high-vitality core zones and prioritizing targeted restoration in degraded peripheral zones. (2) Integrate forest protection objectives into urban development planning to minimize land use conflicts and enhance spatial coordination. (3) Establish inclusive, multi-level governance frameworks to support cross-boundary ecological management. Future research should aim to integrate high-resolution remote sensing data with in situ ecological monitoring to capture the dynamic responses of forest ecosystems to urbanization. Moreover, leveraging multi-source data for assessing ecological stressors, identifying high-risk or vulnerable zones, and informing adaptive conservation strategies will be crucial to improving the resilience and sustainability of urban ecological spaces.

Supplementary Materials

The following supporting information can be downloaded at https://www.mdpi.com/article/10.3390/su17167268/s1, Table S1. Random forest classification feature variable set. Table S2. Land cover classification accuracy table for 2005–2023. Table S3. KMO and Bartlett’s sphericity test. Table S4. Principal component analysis eigenvalues and variance contribution rates. Table S5. Weights of evaluation indicators. Table S6. Comparison of spatial unit scale effects on the driving factors and the 90th percentile of the q-value. Figure S1. Optimal spatial discretization at 750 m. Figure S2. Ranking of individual driving factors affecting FH from 2005 to 2023.

Author Contributions

Conceptualization, Y.X.; methodology, Y.X.; software, Y.X.; validation, J.L.; formal analysis, J.L.; investigation, Y.X.; resources, J.S. and C.C.; data curation, Y.X.; writing—original draft preparation, Y.X.; writing—review and editing, Y.X.; visualization, Y.X.; supervision, J.S. and C.C. All authors have read and agreed to the published version of the manuscript.

Funding

This research was funded by the National Key Research and Development Program (2022YFD2200505) and the Science and Technology Bureau of Changsha (69199060).

Data Availability Statement

The raw data supporting the conclusions of this article will be made available by the authors upon request.

Acknowledgments

The authors would like to thank the research team members for their contributions to this work.

Conflicts of Interest

The authors declare no conflicts of interest.

References

  1. Yang, C.; Liu, H.; Li, Q.; Cui, A.; Xia, R.; Shi, T.; Zhang, J.; Gao, W.; Zhou, X.; Wu, G. Rapid urbanization induced extensive forest loss to urban land in the Guangdong-Hong Kong-Macao Greater Bay Area, China. Chin. Geogr. Sci. 2021, 31, 93–108. [Google Scholar] [CrossRef]
  2. Gong, C.; Pang, H.; Olhnuud, A.; Hao, F.; Lyu, F. Green Infrastructure Fluctuations in Urban Agglomeration of Shanxi Province, China: Implications for Controlling Ecological Crises. Land 2024, 13, 600. [Google Scholar] [CrossRef]
  3. Kolb, T.; Wagner, M.; Covington, W.W. Concepts of forest health: Utilitarian and ecosystem perspectives. J. For. 1994, 92, 10–15. [Google Scholar] [CrossRef]
  4. Zhao, L.; Ye, J.; Cao, G.; Wang, X.; Wu, L.; Liu, J.; Wu, S. Forest Health Theory and Sustained Control of Forest Disease and Pest Thinking about American Forestry Observation. J. Nanjing For. Univ. (Nat. Sci. Ed.) 2002, 26, 5–9. [Google Scholar] [CrossRef]
  5. Chen, G.; Dai, L.; Ji, L.; Deng, H.; Hao, Z.; Wang, O. Assessing forest ecosystem health I. Model, method, and index system. Chin. J. Appl. Ecol 2004, 15, 1743–1749. [Google Scholar]
  6. Li, X. Pilot Study and Application on the Indicators for Forest Health Assessment. Master’s Thesis, Chinese Academy of Forestry, Beijing, China, 2006. [Google Scholar]
  7. Sahana, M.; Sajjad, H.; Ahmed, R. Assessing spatio-temporal health of forest cover using forest canopy density model and forest fragmentation approach in Sundarban reserve forest, India. Model. Earth Syst. Environ. 2015, 1, 49. [Google Scholar] [CrossRef]
  8. Sharma, L.K.; Raj, A. Spatiotemporal forest health assessment for ecosystem management of Sariska National Park (India) under regional climatic inconstancies. Environ. Dev. Sustain. 2024, 26, 1–24. [Google Scholar] [CrossRef]
  9. Kayet, N.; Pathak, K.; Chakrabarty, A.; Singh, C.; Chowdary, V.; Kumar, S.; Sahoo, S. Forest health assessment for geo-environmental planning and management in hilltop mining areas using Hyperion and Landsat data. Ecol. Indic. 2019, 106, 105471. [Google Scholar] [CrossRef]
  10. Torres, P.; Rodes-Blanco, M.; Viana-Soto, A.; Nieto, H.; García, M. The role of remote sensing for the assessment and monitoring of forest health: A systematic evidence synthesis. Forests 2021, 12, 1134. [Google Scholar] [CrossRef]
  11. Yuan, Z.; Ali, A.; Jucker, T.; Ruiz-Benito, P.; Wang, S.; Jiang, L.; Wang, X.; Lin, F.; Ye, J.; Hao, Z. Multiple abiotic and biotic pathways shape biomass demographic processes in temperate forests. Ecology 2019, 100, e02650. [Google Scholar] [CrossRef] [PubMed]
  12. Cai, X.; Lyu, J.; Wang, C. The network characteristics and driving mechanism of the spatial correlation of forest ecological security in China. J. Nat. Resour. 2022, 37, 2137–2152. [Google Scholar] [CrossRef]
  13. Allen, C.D.; Macalady, A.K.; Chenchouni, H.; Bachelet, D.; McDowell, N.; Vennetier, M.; Kitzberger, T.; Rigling, A.; Breshears, D.D.; Hogg, E.T. A global overview of drought and heat-induced tree mortality reveals emerging climate change risks for forests. For. Ecol. Manag. 2010, 259, 660–684. [Google Scholar] [CrossRef]
  14. Trumbore, S.; Brando, P.; Hartmann, H. Forest health and global change. Science 2015, 349, 814–818. [Google Scholar] [CrossRef]
  15. Wu, Y.; Shi, K.; Chen, Z.; Liu, S.; Chang, Z. Developing improved time-series DMSP-OLS-like data (1992–2019) in China by integrating DMSP-OLS and SNPP-VIIRS. IEEE Trans. Geosci. Remote Sens. 2021, 60, 4407714. [Google Scholar] [CrossRef]
  16. Gao, Y.; Peng, D.; Zhang, N.; Yang, P.; Yang, C.; Yang, C.; Chen, J. Remote sensing classification of stand type coupled with time series features. J. Beijing For. Univ. 2024, 46, 68–81. [Google Scholar] [CrossRef]
  17. Guo, W. Research on the Temporal and Spatial Changes of Fractional Vegetation Cover and the Influencing Factors in Poyang Lake Area. Master’s Thesis, Jiangxi Agricultural University, Nanchang, China, 2024. [Google Scholar]
  18. Zhang, X.; Wu, T.; Du, Q.; Ouyang, N.; Nie, W.; Liu, Y.; Gou, P.; Li, G. Spatiotemporal changes of ecosystem health and the impact of its driving factors on the Loess Plateau in China. Ecol. Indic. 2025, 170, 113020. [Google Scholar] [CrossRef]
  19. Breiman, L. Random forests. Mach. Learn. 2001, 45, 5–32. [Google Scholar] [CrossRef]
  20. Yuan, T.; Zhang, X.; Chen, X. Machine Learning based Enterprise Financial Audit Framework and High Risk Identification. arXiv 2025, arXiv:2507.06266. [Google Scholar] [CrossRef]
  21. da Silva, P.G.; Beirão, M.d.V.; de Castro, F.S.; Perillo, L.N.; Camarota, F.; Solar, R.R.; Fernandes, G.W.; Neves, F.d.S. Isolation drives species gains and losses of insect metacommunities over time in a mountaintop forest archipelago. J. Biogeogr. 2023, 50, 2069–2083. [Google Scholar] [CrossRef]
  22. Wang, L. Classification of Forest Fire Risk in Hongya County Based on GIS Technology. Master’s Thesis, Sichuan Agricultural University, Sichuan, China, 2018. [Google Scholar]
  23. Li, X. Multi-scale Assessment of Forest Health around Dongting Lake Based on Cloud Model. Ph.D. Thesis, Central South University of Forestry and Technology, Changsha, China, 2020. [Google Scholar]
  24. Shrestha, N. Factor analysis as a tool for survey analysis. Am. J. Appl. Math. Stat. 2021, 9, 4–11. [Google Scholar] [CrossRef]
  25. Dong, L.; Gao, X.; Zhu, Y.; Liu, Z. Forest health assessment of Pangu Forest Farm based on Landsat TM in Great Xing’an Mountains of northeastern China. J. Beijing For. Univ. 2021, 43, 87–99. [Google Scholar] [CrossRef]
  26. Khan, R.W.A.; Shaheen, H.; Islam Dar, M.E.U.; Habib, T.; Manzoor, M.; Gillani, S.W.; Al-Andal, A.; Ayoola, J.O.; Waheed, M. A data-driven approach to forest health assessment through multivariate analysis and machine learning techniques. BMC Plant Biol. 2025, 25, 915. [Google Scholar] [CrossRef] [PubMed]
  27. Zou, S.; Qian, J.; Xu, B.; Tu, Z.; Zhang, W.; Ma, X.; Liang, Y. Spatiotemporal changes of ecosystem health and their driving mechanisms in alpine regions on the northeastern Tibetan Plateau. Ecol. Indic. 2022, 143, 109396. [Google Scholar] [CrossRef]
  28. Zhang, X.; Zhang, F.; Chen, W.; Li, G.; Bi, P.; Wang, Z. Spatio-temporal changes of ecological service values in Yunnan-Kweichow Plateau. Bull. Surv. Map. 2022, 08, 30–35. [Google Scholar] [CrossRef]
  29. Song, Y.; Wang, J.; Ge, Y.; Xu, C. An optimal parameters-based geographical detector model enhances geographic characteristics of explanatory variables for spatial heterogeneity analysis: Cases with different types of spatial data. GISci. Remote Sens. 2020, 57, 593–610. [Google Scholar] [CrossRef]
  30. Shi, Z.; Xie, H.; Wang, Z.; Hu, X.; Wang, X.; Xie, X.; Lin, H.; Liu, X. Analysis of spatiotemporal heterogeneity of habitat quality and their driving factors based on optimal parameters-based geographic detector for Fuzhou City, China. J. Environ. Eng. Technol 2023, 13, 1921–1930. [Google Scholar] [CrossRef]
  31. Ding, J.; Liu, N.; Liu, T.; Liao, C.; Xia, W.; Xu, J. Analysis on 2008 lce Disaster and Its Causes in Southern China. J. Anhui Agric. Sci. 2009, 37, 4162–4166. [Google Scholar] [CrossRef]
  32. Luo, B.; Li, Y. Characteristics of Serious High Temperature and Drought and Anomalies of Atmospheric Circulation in Summer of 2013 in Hu’nan Province. J. Arid Meteorol. 2014, 32, 593–598. [Google Scholar]
  33. Yao, Y. The Spatial and Temporal Characteristics of Argo—Meteorological Disasters During 1950–2015 in China. Master’s Thesis, Northwest A&F University, Yangling, China, 2016. [Google Scholar]
  34. Bratu, I.; Dinca, L.; Constandache, C.; Murariu, G. Resilience and decline: The impact of climatic variability on temperate oak forests. Climate 2025, 13, 119. [Google Scholar] [CrossRef]
  35. The Official Website of the People’s Government of Hunan Province. Analysis of the Process of New Urbanization in Hunan During the 12th Five-Year Plan Period. Available online: https://www.hunan.gov.cn/hnszf/zfsj/sjfx/201606/t20160620_4849184.html (accessed on 27 June 2025).
  36. Upreti, M.; Kumar, A. Landscape modeling for urban growth characterization and its impact on ecological infrastructure in Delhi-NCR: An approach to achieve SDGs. Phys. Chem. Earth 2023, 131, 103444. [Google Scholar] [CrossRef]
  37. Hou, Y.; Liu, Y.; Zeng, H. Assessment of urban ecosystem condition and ecosystem services in Shenzhen based on the MAES analysis framework. Ecol. Indic. 2023, 155, 110962. [Google Scholar] [CrossRef]
  38. Zhang, Y.; Peng, C.; Li, W.; Tian, L.; Zhu, Q.; Chen, H.; Fang, X.; Zhang, G.; Liu, G.; Mu, X. Multiple afforestation programs accelerate the greenness in the ‘Three North’ region of China from 1982 to 2013. Ecol. Indic. 2016, 61, 404–412. [Google Scholar] [CrossRef]
  39. Crouzeilles, R.; Curran, M.; Ferreira, M.S.; Lindenmayer, D.B.; Grelle, C.E.; Rey Benayas, J.M. A global meta-analysis on the ecological drivers of forest restoration success. Nat. Commun. 2016, 7, 11666. [Google Scholar] [CrossRef]
  40. Zhang, J.; Zhang, P.; Wang, R.; Liu, Y.; Lu, S. Identifying the coupling coordination relationship between urbanization and forest ecological security and its impact mechanism: Case study of the Yangtze River Economic Belt, China. J. Environ. Manag. 2023, 342, 118327. [Google Scholar] [CrossRef]
  41. Ren, X.; Yang, Y.; Wang, Z. A Long-Term and Comprehensive Assessment of the Ecological Costs Arising from Urban Agglomeration Expansion in the Middle Reaches of the Yellow River Basin. Land 2023, 12, 1736. [Google Scholar] [CrossRef]
  42. Chen, L.; Zhang, A. Identification of land use conflicts and dynamic response analysis of Natural-Social factors in rapidly urbanizing areas—A case study of urban agglomeration in the middle reaches of Yangtze River. Ecol. Indic. 2024, 161, 112009. [Google Scholar] [CrossRef]
  43. Xiong, X.; Li, C.; Chen, J. Topographic regulatory role of vegetation response to climate change. Acta Geogr. Sin. 2023, 78, 2256–2270. [Google Scholar] [CrossRef]
  44. Bhaduri, D.; Sihi, D.; Bhowmik, A.; Verma, B.C.; Munda, S.; Dari, B. A review on effective soil health bio-indicators for ecosystem restoration and sustainability. Front. Microbiol. 2022, 13, 938481. [Google Scholar] [CrossRef]
  45. Guo, A.; Yang, J.; Sun, W.; Xiao, X.; Cecilia, J.X.; Jin, C.; Li, X. Impact of urban morphology and landscape characteristics on spatiotemporal heterogeneity of land surface temperature. Sustain. Cities Soc. 2020, 63, 102443. [Google Scholar] [CrossRef]
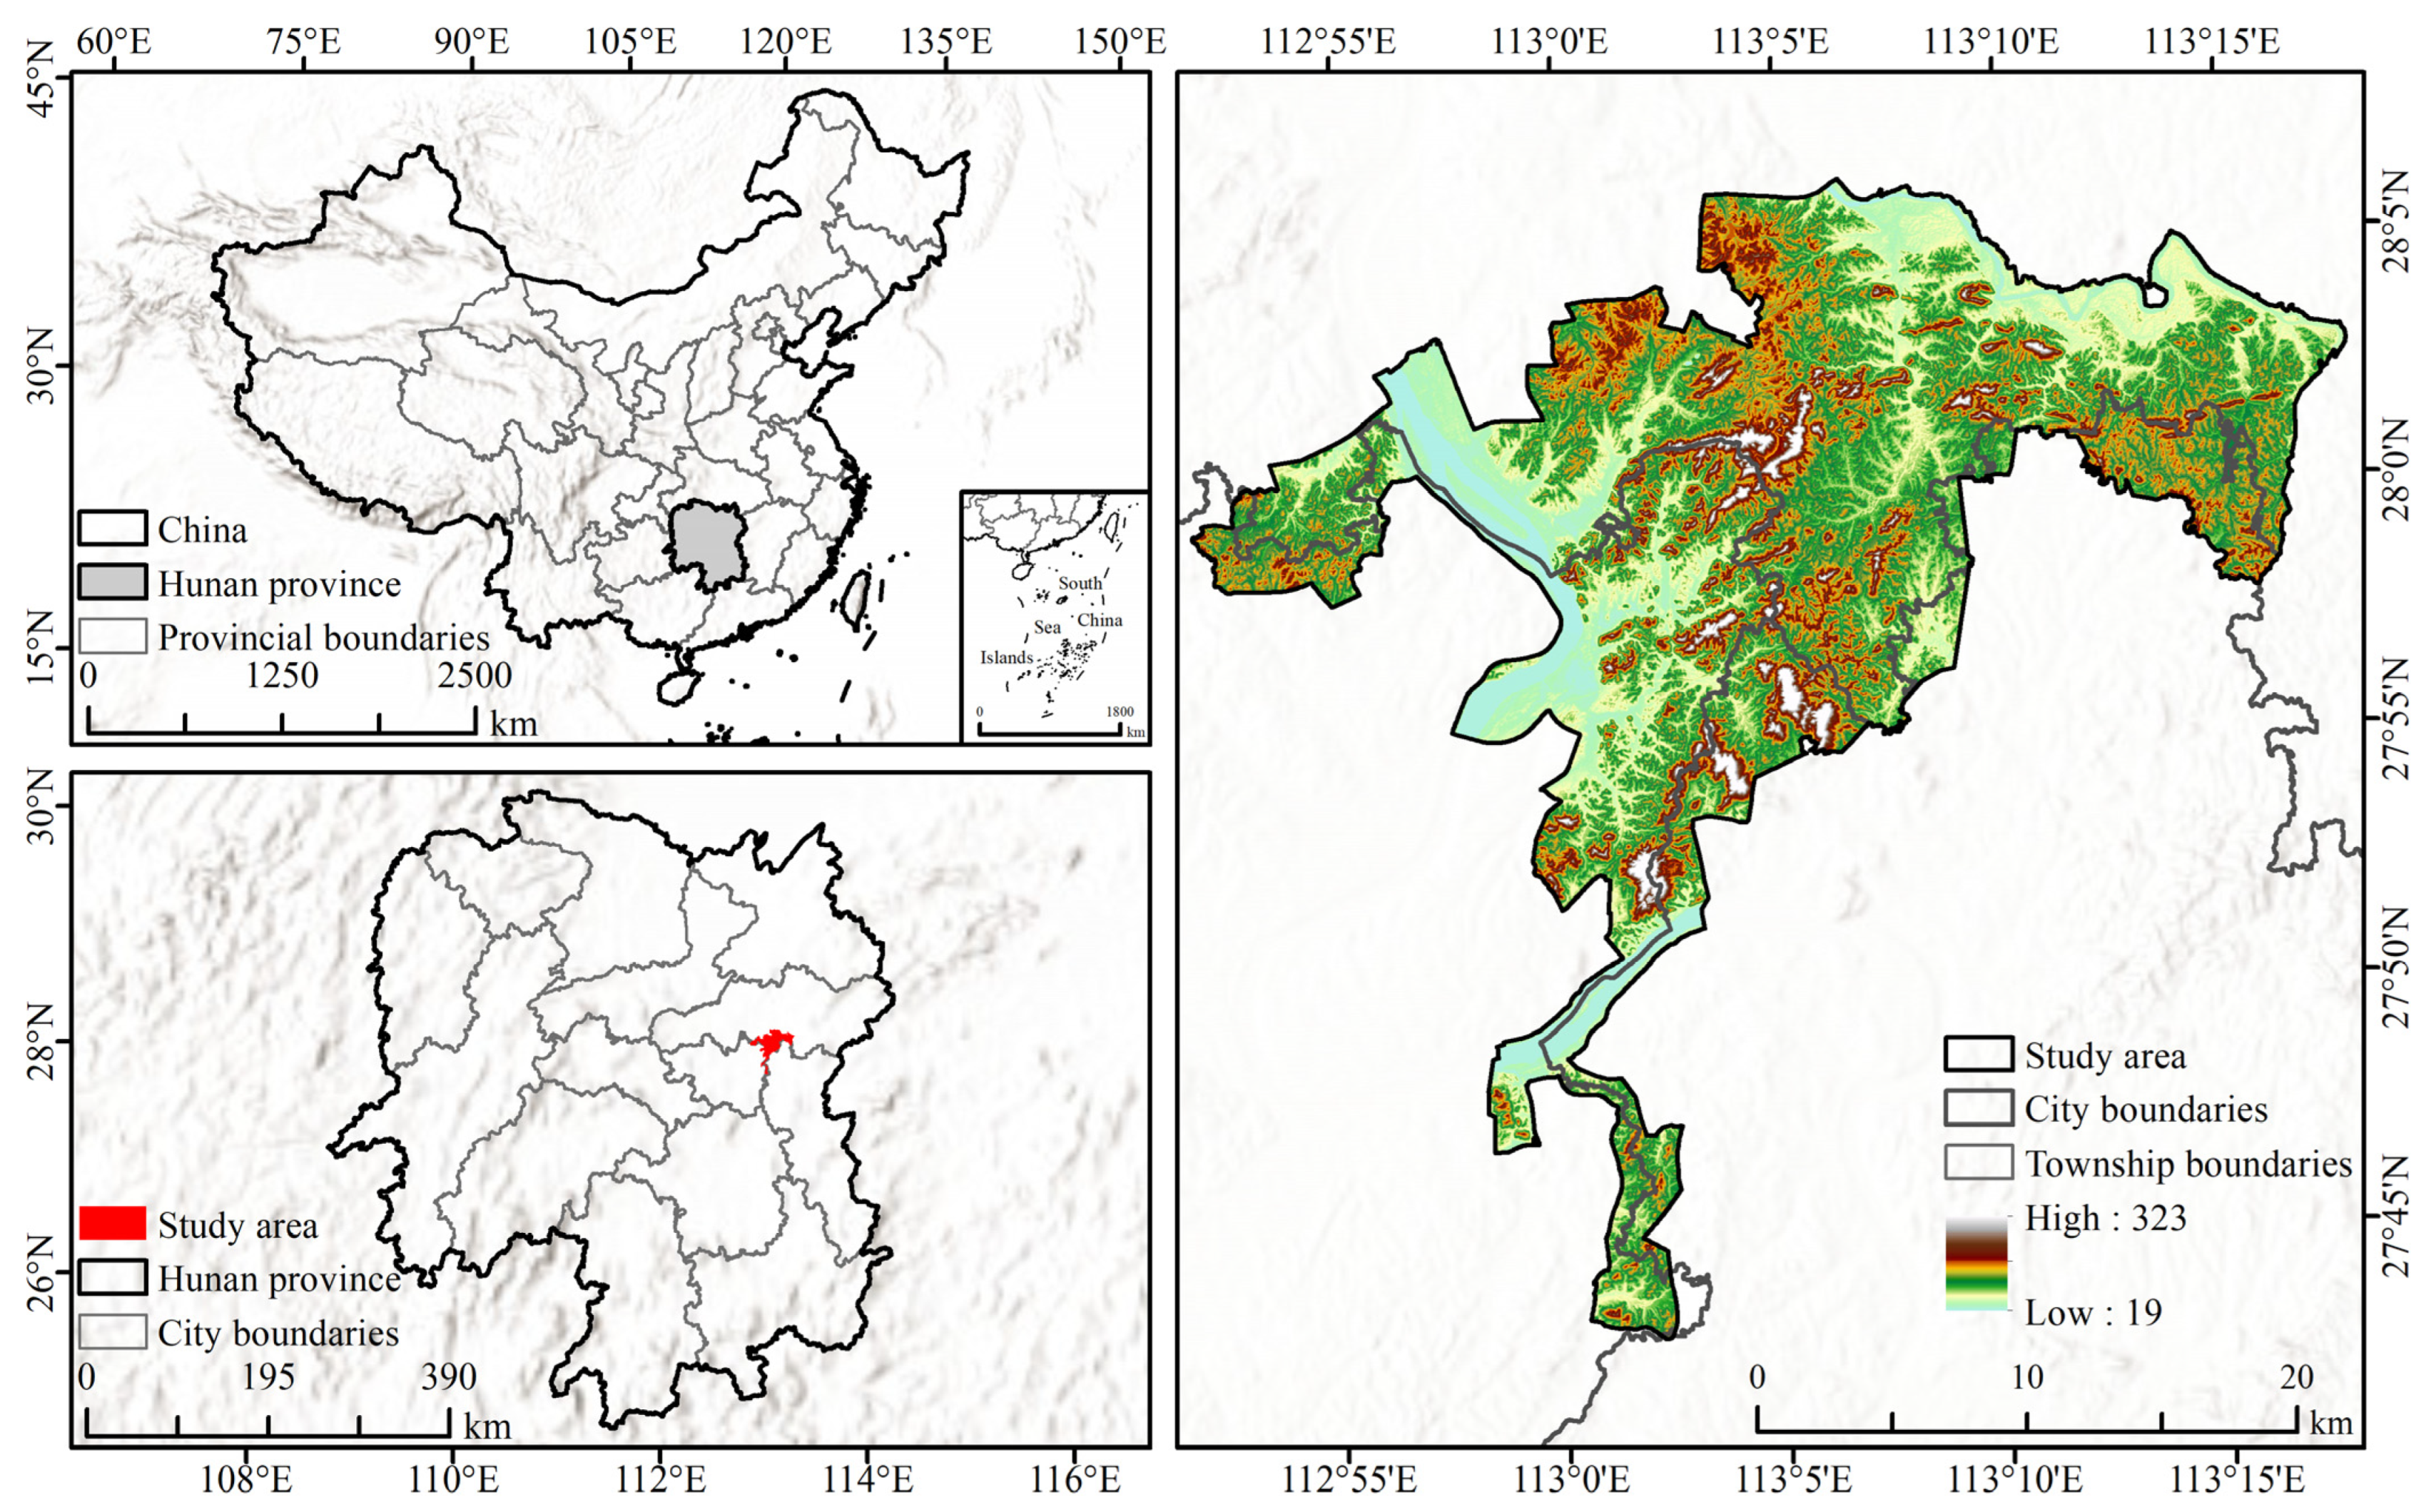
Figure 1. Geographic location and elevation of the study area.
Sustainability 17 07268 g001
Figure 2. Technical workflow.
Sustainability 17 07268 g002
Figure 3. (a) Relationship between forest area changes and (b) land cover transitions from 2005 to 2023.
Sustainability 17 07268 g003
Figure 4. Land cover type distribution map for 2005–2023.
Sustainability 17 07268 g004
Figure 5. Spatiotemporal changes in the vitality, organizational, and anti-interference indices from 2005 to 2023.
Sustainability 17 07268 g005
Figure 6. (ae) Spatial changes in the FHI from 2005 to 2023 and the (f) annual change rate of the FHI.
Sustainability 17 07268 g006
Figure 7. (a) Classification of FHI area proportions and (b) classification distribution map of health index change trends from 2005 to 2023.
Sustainability 17 07268 g007
Figure 8. (a) Average value of the FHI and (b) classification-based area proportions for different forest types.
Sustainability 17 07268 g008
Figure 9. Local spatial autocorrelation analysis of FH.
Sustainability 17 07268 g009
Figure 10. Interaction effects of driving factors from 2005 to 2023. (Note: X1–X12 correspond to the annual average temperature, annual total precipitation, soil type, soil moisture content, soil pH, elevation, slope, slope aspect, distance from roads, population density, GDP, and nighttime light, respectively).
Sustainability 17 07268 g010
Table 1. Data sources used in the study.
Data TypeNameResolution (m)Sources
Remote sensingLandsat 5 TM30https://earthengine.google.com/ (accessed on 30 March 2025)
Landsat 8 OIL30
EVI30
NPP30http://gisrs.cn/ (accessed on 26 January 2025)
FVC30https://earthengine.google.com/ (accessed on 30 March 2025)
RDVI30
LST annual max30
MeteorologicalMonthly average temperature30Fine Resolution Mapping of Mountain Environment
Monthly total precipitation30
TopographyDEM30https://earthengine.google.com/ (accessed on 30 March 2025)
Slope30Derived from DEM
Aspect30
SocioeconomicPopulation density1000https://landscan.ornl.gov/ (accessed on 5 March 2025)
Gross domestic product per capita1000http://gisrs.cn/ (accessed on 26 January 2025)
Night lights1000Wu et al. (2021b) [15]
Road data (railroads, expressways, national, provincial, and county roads)30https://www.webmap.cn/ (accessed on 5 March 2025)
AuxiliaryThe Ecological Green Heart Area 2023 comprehensive forest, grassland, and wetland monitoring data/The Forestry Department of Hunan Province
The Ecological Green Heart Area administrative boundary/
Disclaimer/Publisher’s Note: The statements, opinions and data contained in all publications are solely those of the individual author(s) and contributor(s) and not of MDPI and/or the editor(s). MDPI and/or the editor(s) disclaim responsibility for any injury to people or property resulting from any ideas, methods, instructions or products referred to in the content.