Article

Technical and Economic Analysis of Sustainable Photovoltaic Systems for Street Lighting

by
Valeriu-Sebastian Hudișteanu
*,
Ionuț Nica
,
Marina Verdeș
,
Iuliana Hudișteanu
,
Nelu-Cristian Cherecheș
,
Florin-Emilian Țurcanu
,
Iulian Gherasim
and
Catalin-Daniel Galatanu
Faculty of Civil Engineering and Building Services, Gheorghe Asachi Technical University of Iasi, 700050 Iasi, Romania
*
Author to whom correspondence should be addressed.
Sustainability 2025, 17(16), 7179; https://doi.org/10.3390/su17167179
Submission received: 10 July 2025 / Revised: 30 July 2025 / Accepted: 31 July 2025 / Published: 8 August 2025
(This article belongs to the Special Issue Outdoor Lighting Innovations and the Sustainable Development Goals)

Abstract

This paper presents an analysis of the feasibility and sustainability of using local photovoltaic systems, ON-GRID central photovoltaic systems, and HYBRID systems for street lighting. By generating electricity from renewable sources (photovoltaic panels), solar energy contributes to environmental protection by avoiding the use of fossil fuels and nuclear fission energy, while also aligning with the European Union’s Energy Strategy commitments for the medium term (until 2030) and long term (toward 2050). The implementation of local/central photovoltaic systems for street lighting largely depends on the existing power supply infrastructure, the solar potential of the site, and a clear understanding of potential electricity and cost savings. This study compares local and central photovoltaic systems for street lighting to analyze their technical performance and economic feasibility. The main sustainable objective that this work aims to achieve is Sustainable Development Goal 7. The optimal solution for photovoltaic systems in street lighting was determined through this analysis. The estimated cost for implementing an ON-GRID photovoltaic power plant with a capacity of 153.90 kWp is approximately EUR 773,977.22, with a discounted Payback Time of about 9.33 years. The implementation of this solution results in an annual reduction in greenhouse gas emissions by approximately 58.52 tons of CO2.

1. Introduction

In recent decades, air pollution has become the greatest environmental health threat and a major cause of diseases [1]. Clean energy and energy efficiency are key components of the European Union’s Sustainable Energy Strategy for the medium term (until 2030) and long term (toward 2050) in order to reduce energy consumption and air pollutants [2,3]. Renewable energy sources have experienced continuous growth and have proven to be a suitable solution for humanity [4]. The world’s smart cities frequently use energy from renewable sources [4,5]. The smart grid concept is also an integral part of a smart city. Smart grids are capable of integrating distributed energy sources [4]. Also, sustainable development in the energy sector represents an important mission in terms of energy efficiency and low GHG emissions [1,3,6].
Romania has various renewable energy resources, including biomass, hydropower, geothermal potential, wind energy, solar energy, and photovoltaics [7]. These resources are distributed throughout the country [8] and can be further exploited as technology advances and becomes more cost-effective. In 2024, the electricity production structure was as follows: 32.16% hydro, 19.16% nuclear, 15.43% wind, 15.11% natural gas, 13.45% coal, 3.01% photovoltaic, 0.83% biomass, and 0.01% fuel oil [9], while the average CO2 emissions from electricity production were close to the European level, around 172 g CO2/kWh [9]. The installed capacity of photovoltaic power plants in Romania is approximately 2000 MWp [7].
In the context of the need to implement energy efficiency measures in all areas with real energy-saving potential, public lighting becomes an important element of the energy efficiency process [10]. The lighting sources used for public lighting have become increasingly efficient and necessary in order to achieve sustainable systems [11,12]. Nowadays, the recommendation is to fully use public lighting based on LED sources [13,14].
The main sustainable objective that this work aims to achieve is Sustainable Development Goal 7 (SDG 7)—ensure access to affordable, reliable, sustainable, and modern energy for all [15]. A growing number of scientific studies have investigated how PV-powered LED public lighting systems contribute to this objective [16,17,18,19,20], especially in reducing urban energy demand and enhancing access in off-grid areas [21].
The types of electricity supply for public lighting have evolved over time, from the electrical grid to those completely autonomous [22]. Also, a multitude of energy sources are used, such as conventional or renewable ones. Among the renewable energy sources used to power public lighting systems, both centralized and local, can be mentioned: photovoltaic systems [23], wind power plants [24], micro-hydropower plants [25], or biomass [13].
Contemporary solar street lighting systems combine high-efficiency photovoltaic panels with advanced lithium battery storage [26], smart LED lighting assemblies [27,28], and sophisticated control systems that optimize energy consumption based on environmental conditions and usage patterns [29]. These systems have proven especially beneficial in remote areas, humanitarian settings, and regions with unreliable grid electricity, offering autonomous lighting solutions that improve safety, security, and quality of life. Recent technological advancements have led to the development of more efficient and durable photovoltaic panels, high-performance LED lighting with intelligent controls [30], and sophisticated battery storage systems [26] that offer enhanced safety and longevity. Due to the degradation models [31,32] of the batteries by high operating temperatures, their capacity fades after 10 years of operation, and they need to be replaced.
Considering the versatility of photovoltaic systems, which can be integrated both as local [33,34] and central sources of electricity supply [30,35], these are the most widespread alternative solutions to power public lighting. Over the past decade, the photovoltaic public lighting sector has seen significant growth due to a rising awareness of sustainability [36], energy efficiency, and the necessity for resilient infrastructure in both developed and developing regions. Solar-powered street lighting exemplifies the integration of various technological fields, including photovoltaic engineering, LED lighting technology, energy storage systems [26], and intelligent control mechanisms [37].
Strong evidence supports the expanded implementation of photovoltaic public lighting systems as key to sustainable infrastructure development, the renewable energy transition, and climate change mitigation. With appropriate planning, community involvement, and technical design, these systems offer reliable, cost-effective, and environmentally responsible lighting solutions for a wide range of applications and locations [38].
The environmental benefits of solar street lighting are significant, including substantial reductions in carbon emissions, resource conservation, and ecosystem protection, often justifying the implementation costs even when direct economic returns are minimal. Economic analyses show that solar solutions are becoming more cost-effective, especially in areas with high electricity prices and abundant solar resources [39].
Challenges remain, particularly regarding upfront capital costs, technical capacity building, and regulatory frameworks. However, innovative financing solutions, standardization efforts, and supportive policy development are effectively mitigating these barriers [38]. The literature presents studies on the use of electricity generated by photovoltaic systems, covering both autonomous solutions [33] and ON-GRID or HYBRID variants [35]. Most studies focus on each solution separately, and very few of them present technical–economic and comparative environmental impact components [39].
The most important thing is that a technical–economic analysis is not universally valid, because some costs are strongly dependent on the local context and particularities: the price of electricity and the price of assembly labor [39]. Moreover, in the literature consulted, details are not available regarding how various costs are taken into account.
In the present study, we explored the economic and environmental impact of using autonomous, ON-GRID, and HYBRID photovoltaic systems for public lighting to determine the optimal energy supply solution for implementation. The optimal use of photovoltaic systems was determined by comparing the three photovoltaic systems in terms of technical feasibility, compliance with road and pedestrian lighting requirements (regulated by NP 062-2002 [40], SR-EN 13201-2015 [41], and SR-EN 13201-2016 [42,43,44,45]), photovoltaic system performance, economic viability, economic efficiency, and environmental protection. This study was conducted numerically using Dialux Evo, and the results were processed analytically. The results are concluded in compliance with lighting requirements M4, M5, and M6 [41,42,43,44,45,46].

2. Materials and Methods

This study analyzes the use of local/central photovoltaic systems (Figure 1) for street lighting for a total of 726 lighting fixtures across three types of roads: 7200 m of national road, 2300 m of communal road, and 25,000 m of local roads. The analysis focuses on a functional public lighting system installed near roadways and pedestrian paths, utilizing LED lighting fixtures.

2.1. Public Lighting

2.1.1. Technical Standards

For the design of the public lighting system, the following standards are currently used as the basis: SR EN 13201-1 [41]; SR EN 13201-2 [42]; SR EN 13201-3 [43]; SR EN 13201-4 [44]; and SR EN 13201-5 [45].

2.1.2. The Components of the Public Lighting System

The main components of the public lighting system are public lighting poles, electrical lines for powering the public lighting fixtures, lighting system ignition points, distribution boxes, lighting fixtures, motion detection sensors, modern communication networks for public lighting systems, and the remote management platform associated with a public lighting system [46].

2.1.3. Analysis of the Existing Situation

In preparing the analysis, the existing infrastructure of the electricity supply system was identified, along with the solar potential of the site, a clear understanding of the potential electricity savings and costs to be achieved through the implementation of photovoltaic systems for powering street lighting, as well as the quantitative determination of the reduction in greenhouse gas emissions resulting from this implementation.
The lighting fixtures will be mounted on the electrical poles of the 0.40 kV distribution line at a height of 8 to 10 m using brackets made from galvanized steel flat bars and notch clamps [27,47].
As a result of the energy balance of the analyzed lighting system with an installed power of 45.76 kW, Table 1, and an energy consumption of 177.44 MWh/year, Table 2, the consumption is based on the installed power of the lighting system and the schedule for switching on and off public lighting with monthly adjustment, as presented in Table 3.
This energy consumption estimate was made to facilitate the calculation of greenhouse gas (GHG) emissions (CO2).

2.1.4. Selection of Lighting Classes

The present study is focused on evaluating the ecological, energy, and economic impact of street lighting for three types of roads: national, communal, and local. The selection of the lighting class for the national road was carried out in accordance with standardized photometric and traffic-based criteria. Table 4 presents the classification process based on traffic intensity, road geometry, and safety needs, as defined by European Norm EN 13201. The information regarding the real situation of the systems is as follows:
The analyzed national road (NR) has the following characteristics:
  • Design speed for roads of technical class II: 50 km/h [49];
  • Importance category: C [49];
  • Road platform width: 7.00 m [49];
  • Average distance between poles: 40.00 m;
  • Maximum height for lighting fixture installation: 10.00 m;
  • Number of lanes: 2;
  • Distance from the curb: 3.00 ÷ 6.00 m;
  • Pole placement: unilateral;
  • Average reflection coefficient: 0.07—(corresponding to asphalt road R3).
The analyzed communal road (CR) has the following characteristics:
  • Design speed for roads of technical class IV: 40 km/h [49];
  • Importance category: C [49];
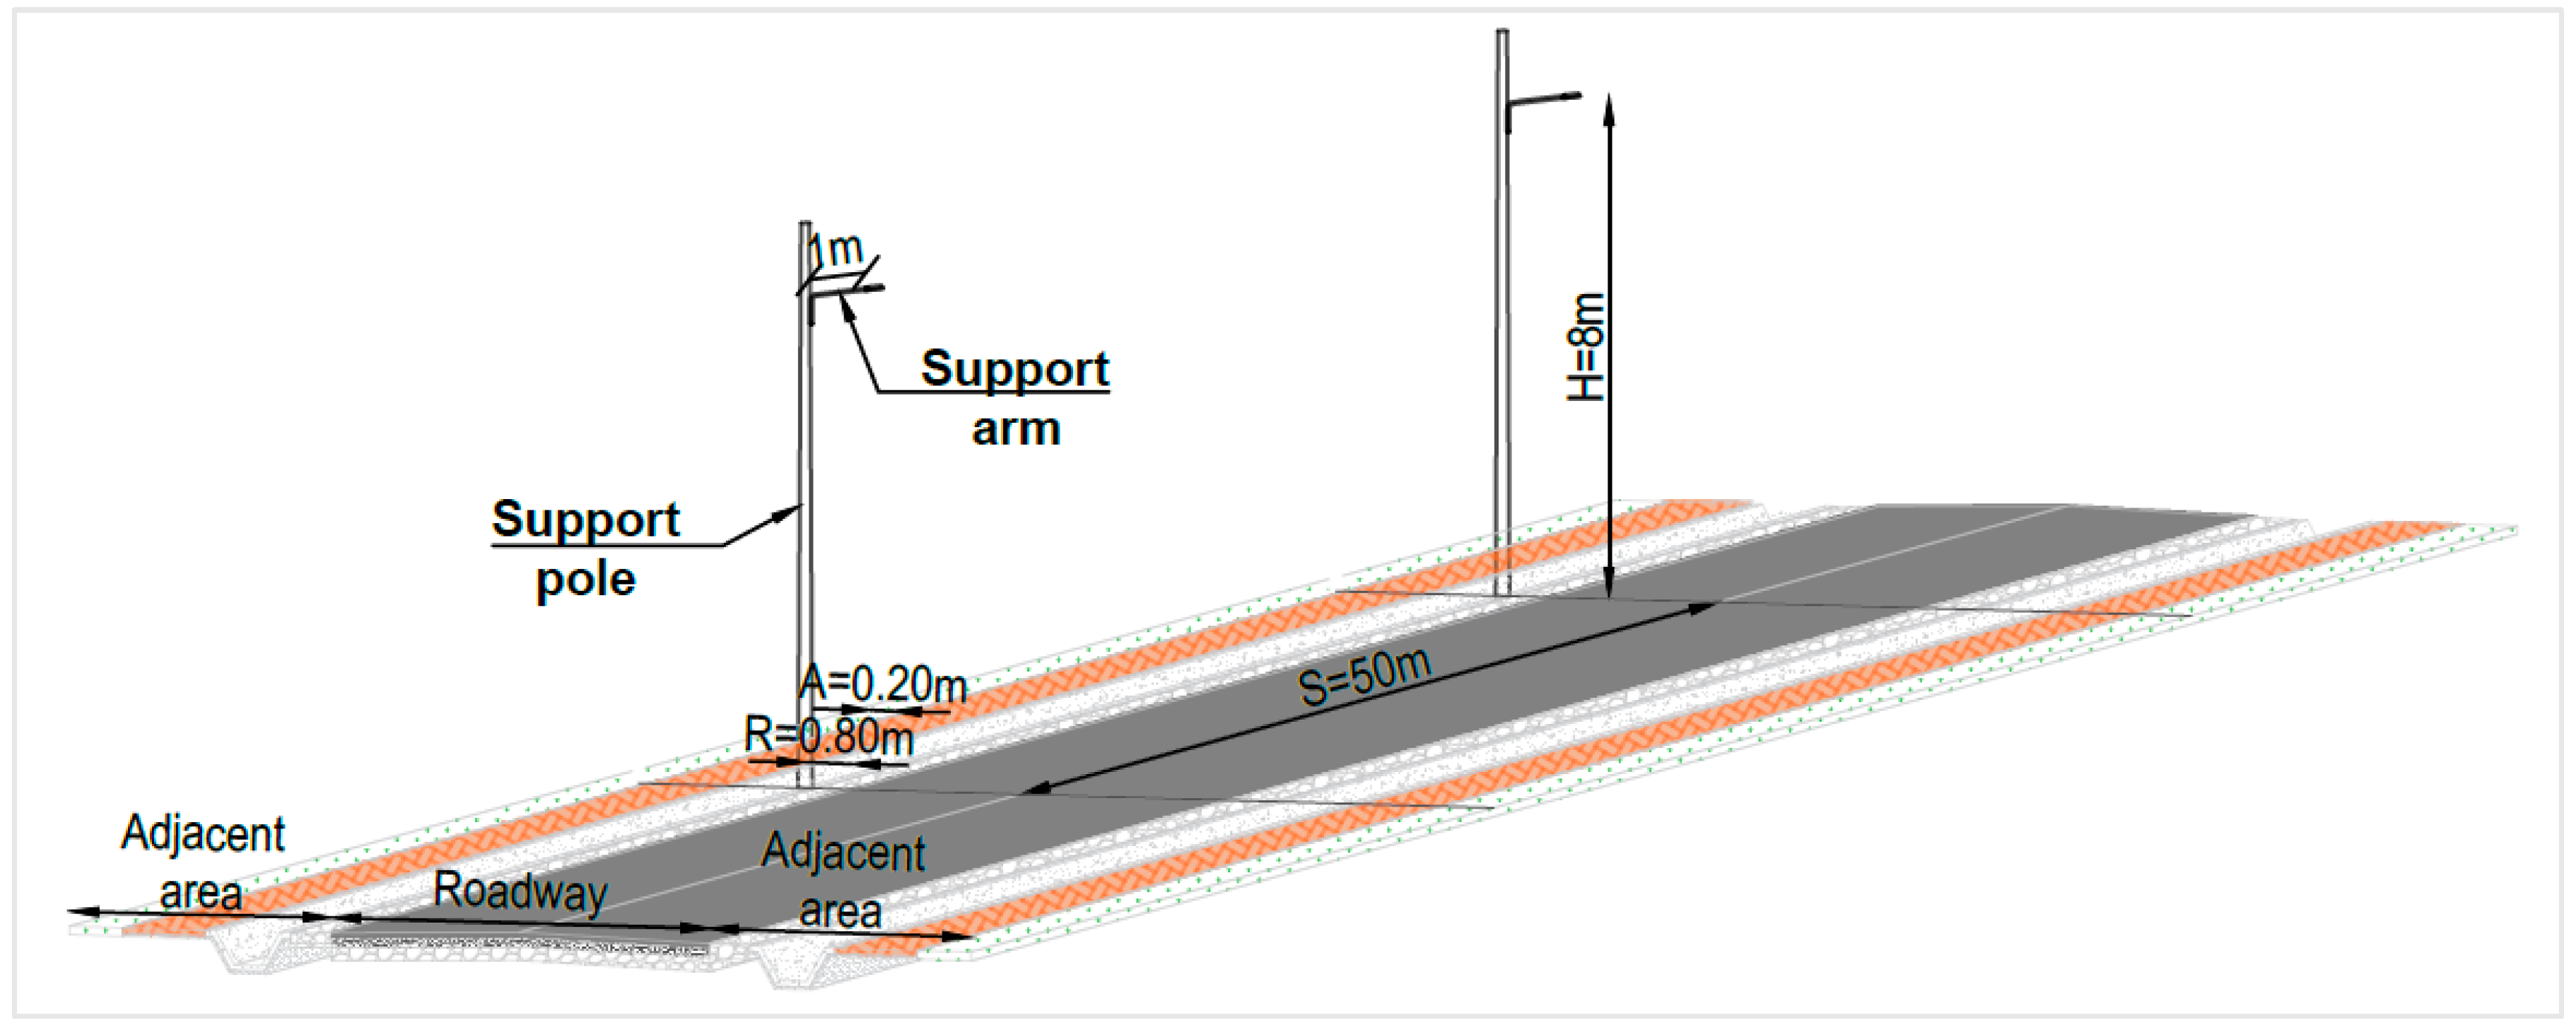
  • Road platform width: 5.50 m [49];
  • Average distance between poles: 50.00 m;
  • Maximum height for lighting fixture installation: 10.00 m;
  • Number of lanes: 2;
  • Distance from the curb: 1.00 ÷ 3.00 m;
  • Pole placement: unilateral;
  • Average reflection coefficient: 0.07—(corresponding to asphalt road R3).
The analyzed local road (LR) has the following characteristics:
  • Design speed for roads of technical class IV: 30 km/h [49];
  • Importance category: C [49];
  • Road platform: 5.50 m wide [49];
  • Average distance between poles: 50.00 m;
  • Maximum height of the lighting fixture installation: 10.00 m;
  • Number of traffic lanes: 2;
  • Distance from the curb: 1.00 to 2.00 m;
  • Placement of poles: unilateral;
  • Average reflection coefficient: 0.07—(corresponding to asphalt road R3).

3. Results and Discussion

3.1. Calculation Summary

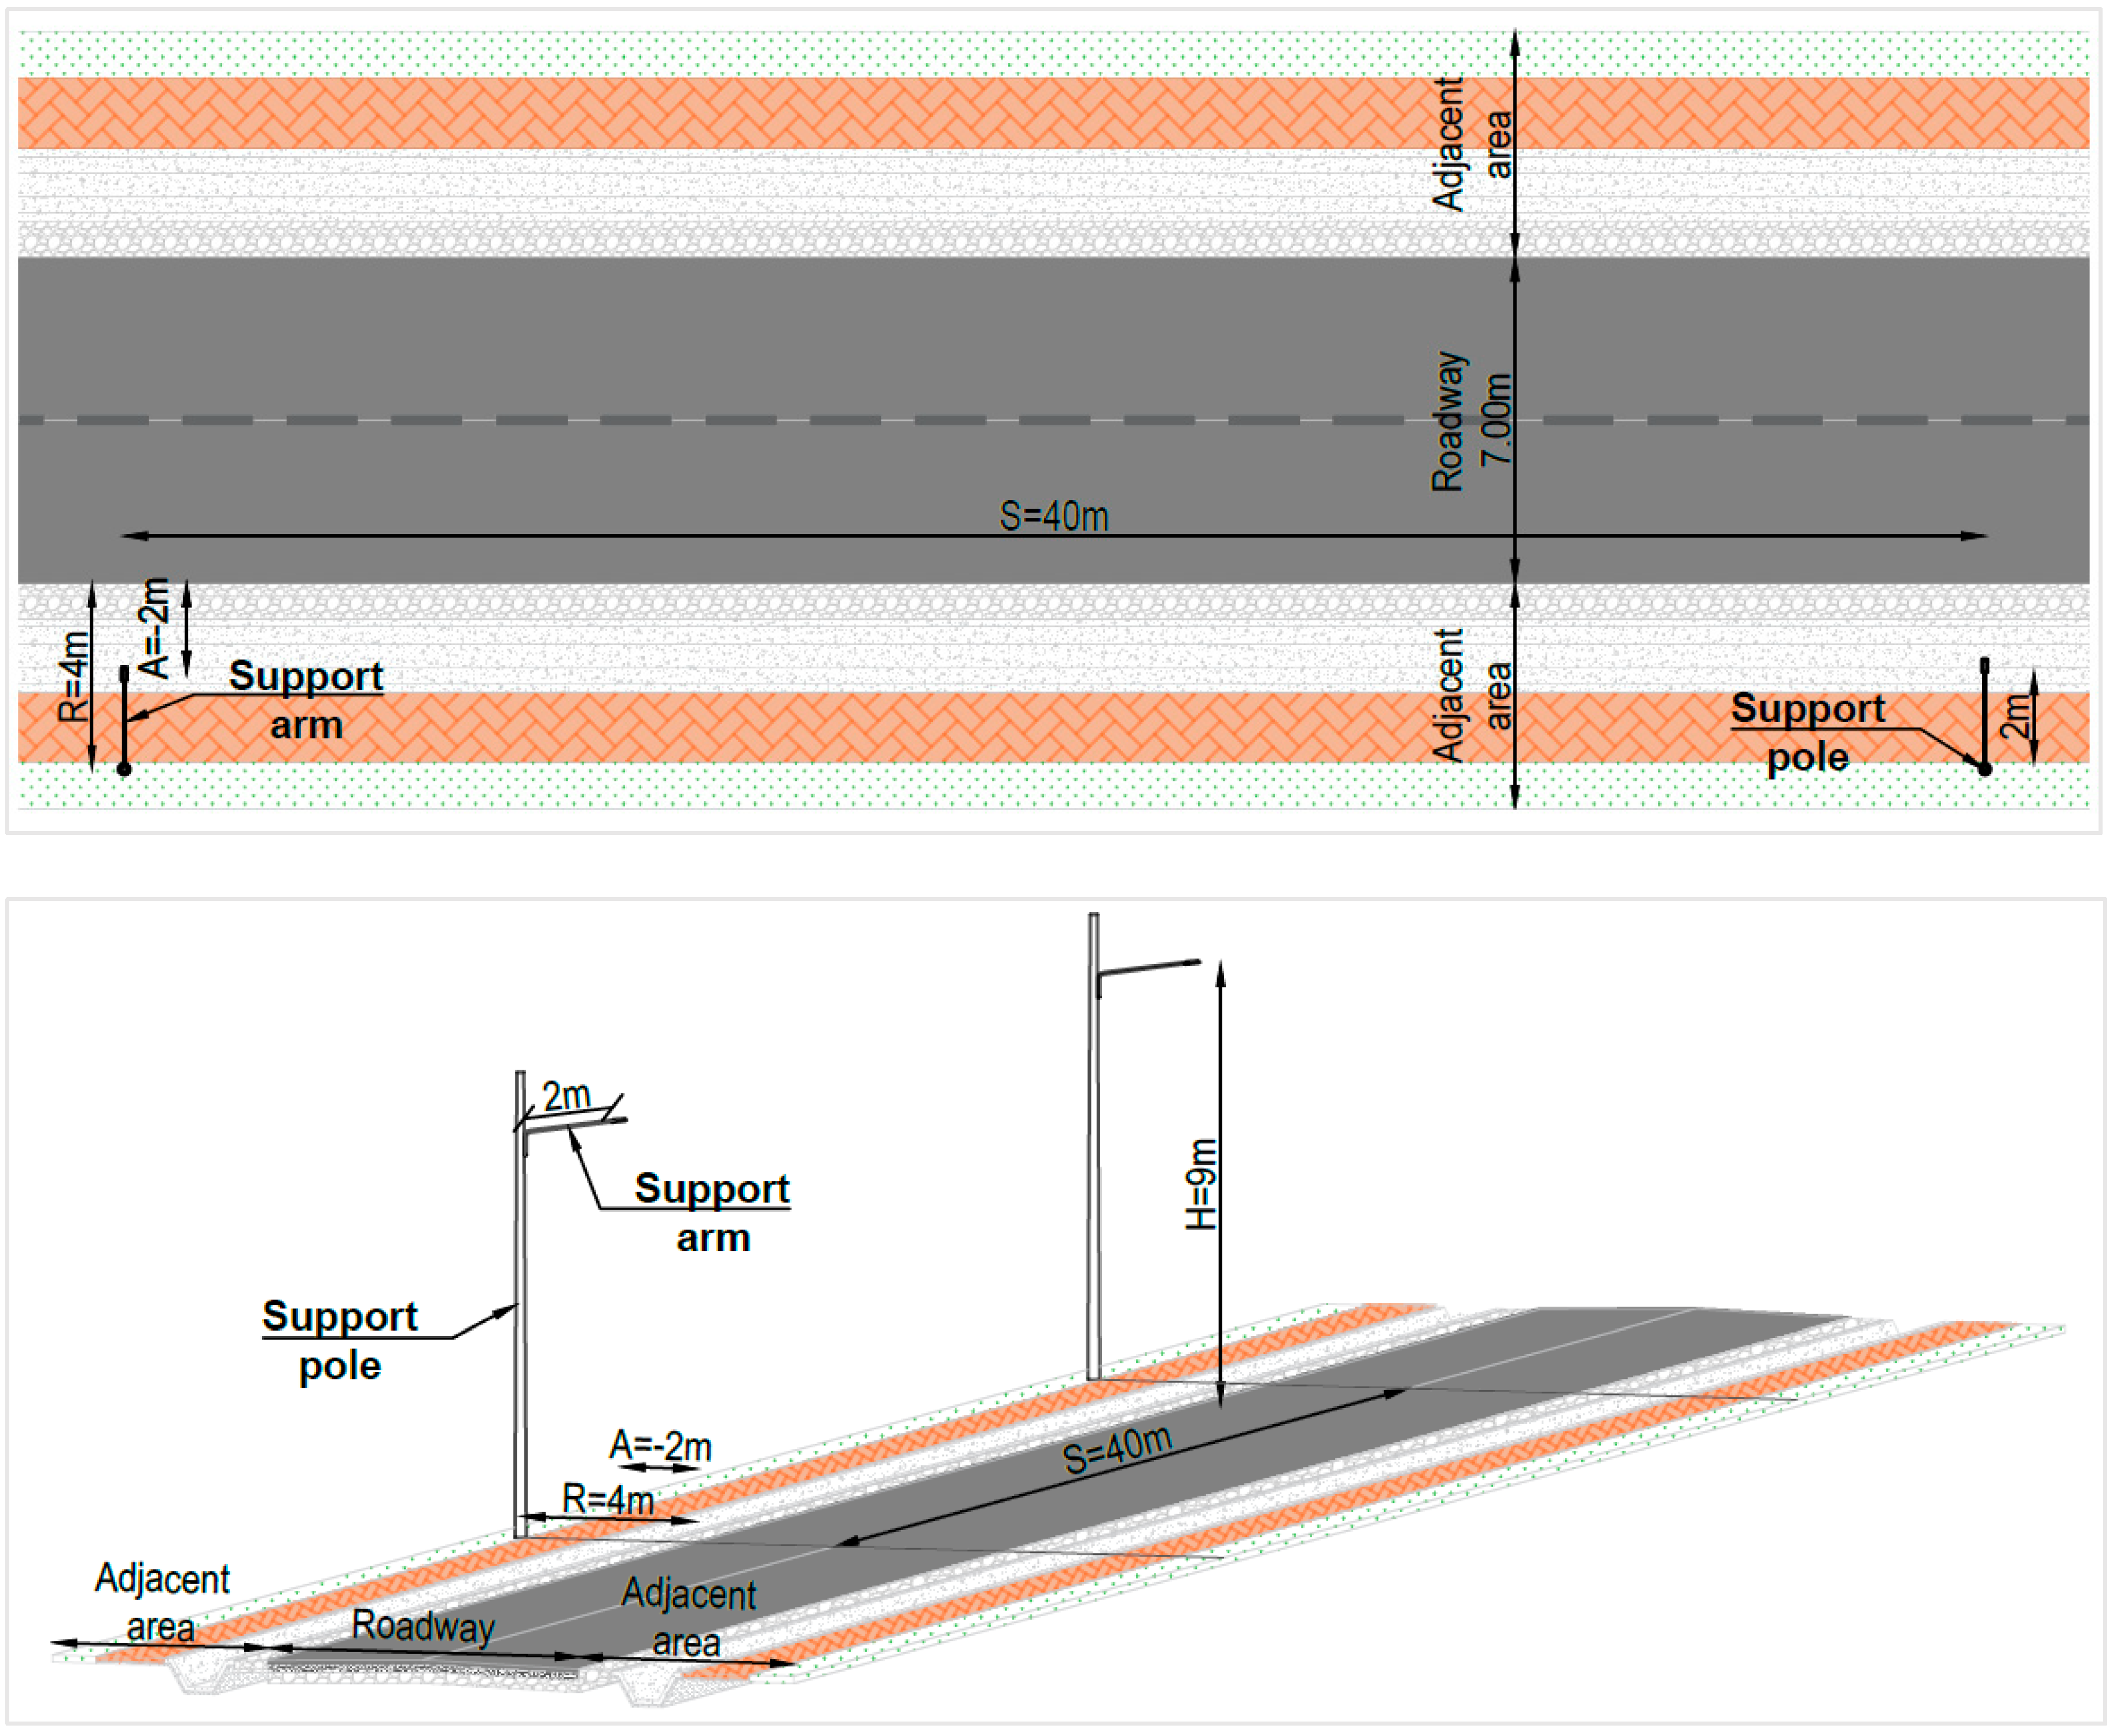
The dimensioning of the street lighting system was carried out using a specialized calculation program DIALux evo [50], adhering to the provisions of the standards “NP-062 Standard for the design of road and pedestrian lighting systems” [40] and “SR-EN 13201-3 Public Lighting—Part 3: Calculation of performance” [43]. The input data for the national road lighting analysis is presented in Table 5, while the results are presented numerically in Table 5 and graphically in Figure 2, Figure 3 and Figure 4. Table 5 summarizes the classification of the lighting system as M4 for the national road, based on factors such as traffic intensity, design speed, and environmental conditions.
To validate the lighting design for class M4, performance parameters were computed and are detailed in Table 6.
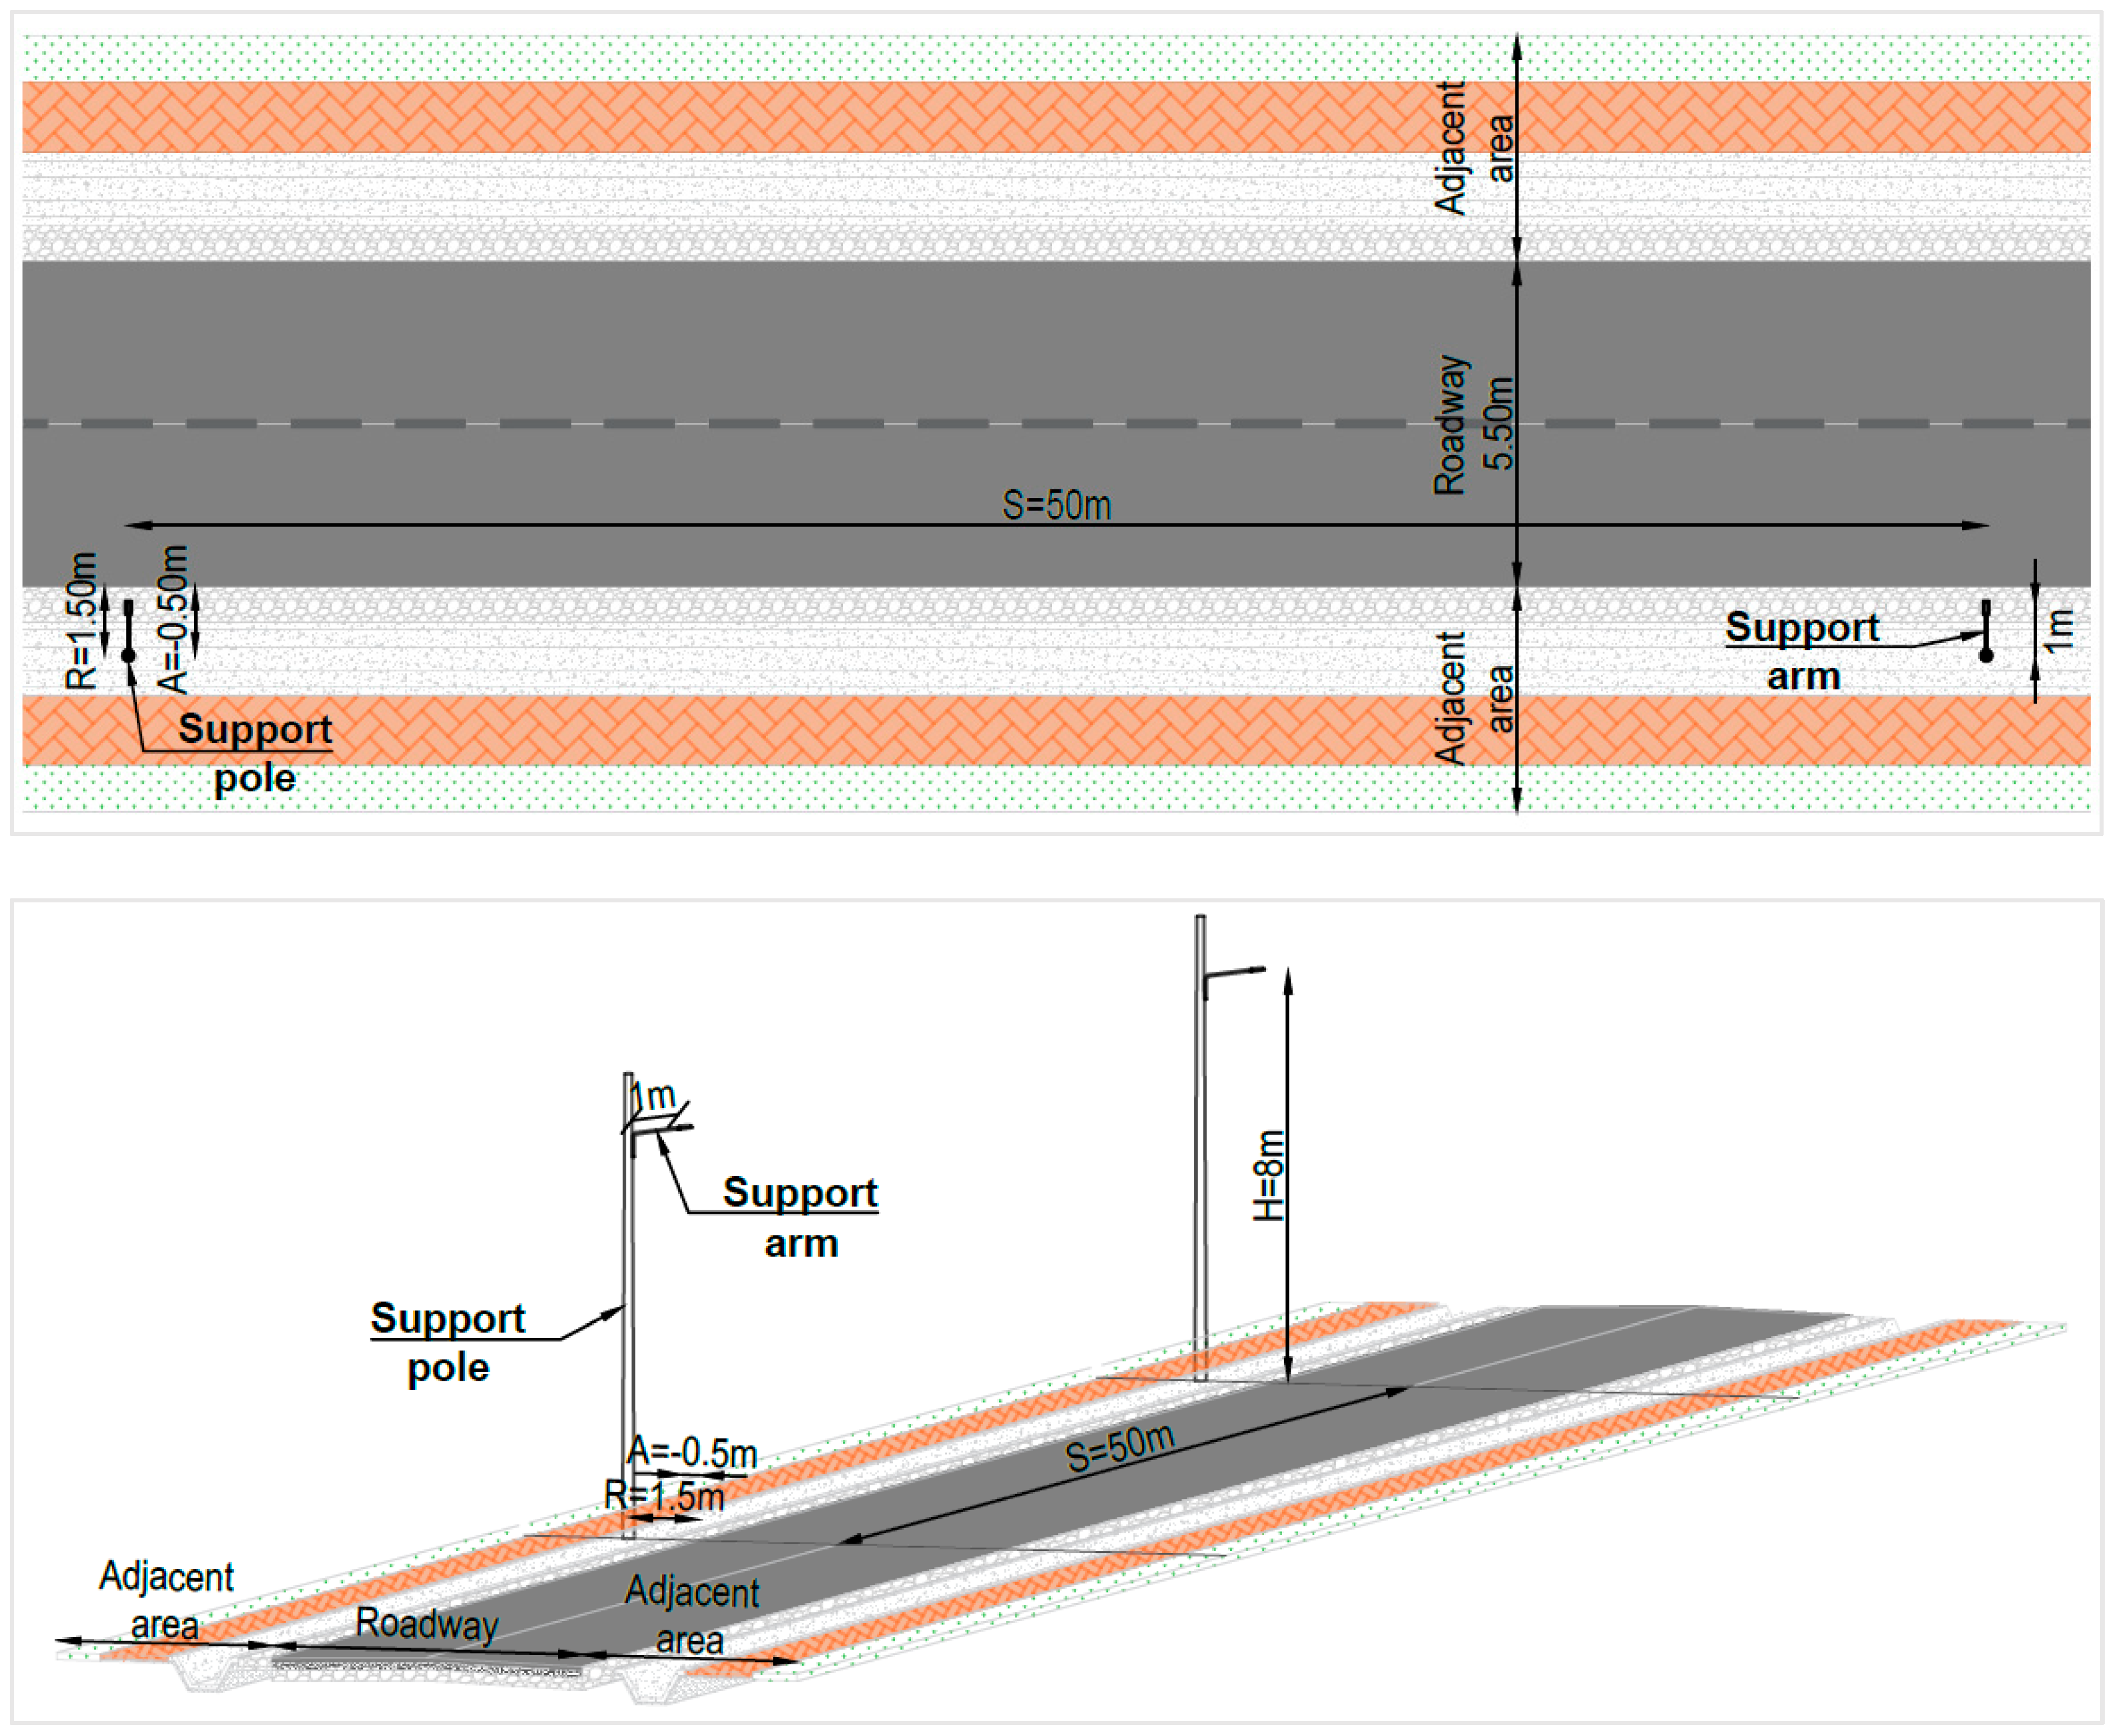
The input data for the M5 (communal road) lighting analysis is presented in Table 7, while the results are presented numerically in Table 8 and graphically in Figure 5, Figure 6 and Figure 7.
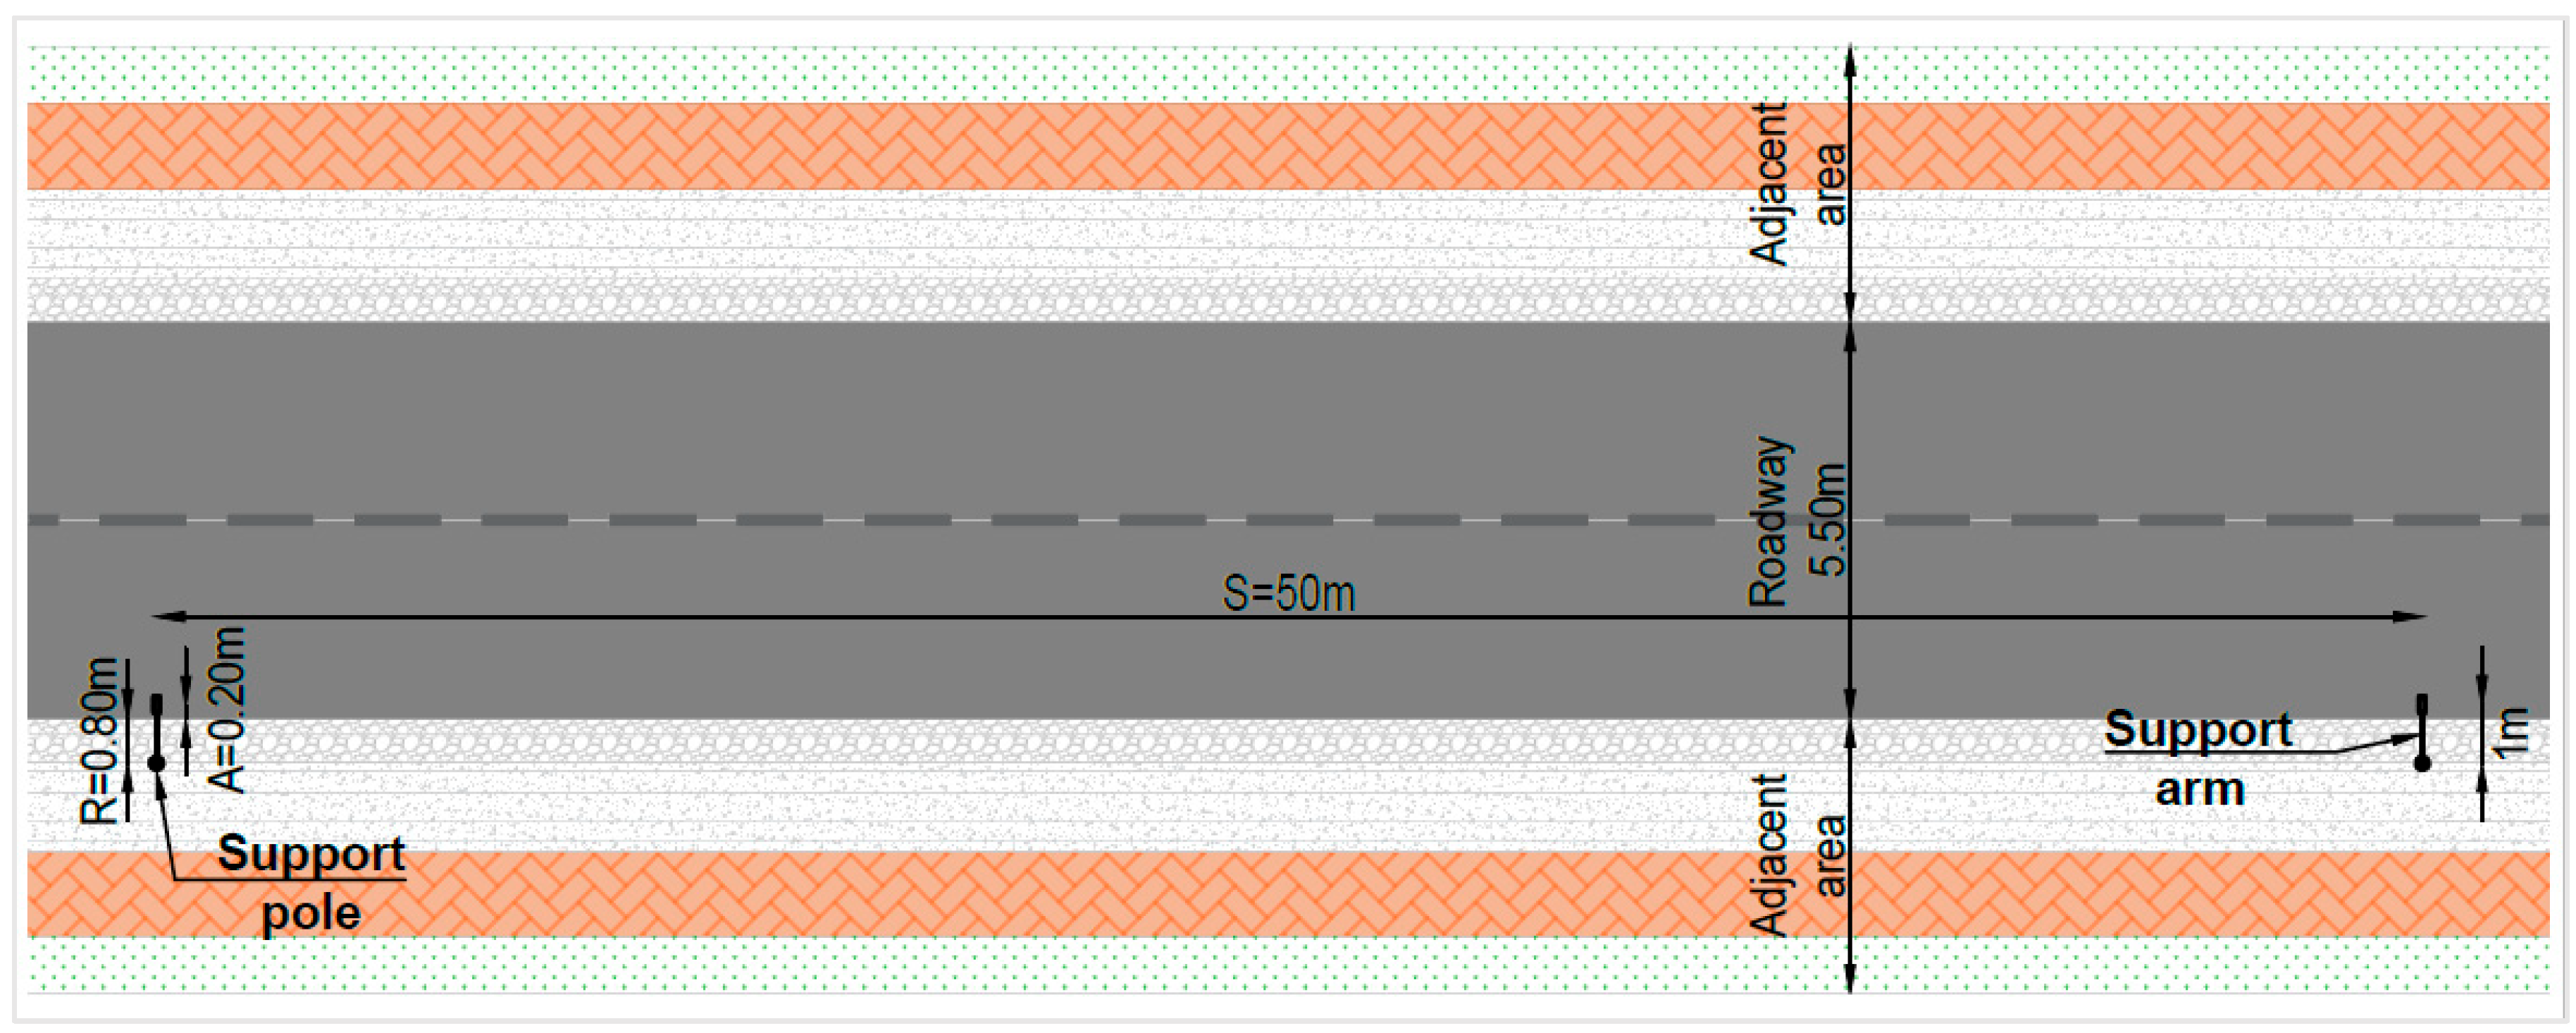
For evaluating the local road lighting, the following input data was used, Table 9, while the results are presented numerically in Table 10 and graphically in Figure 8, Figure 9 and Figure 10.
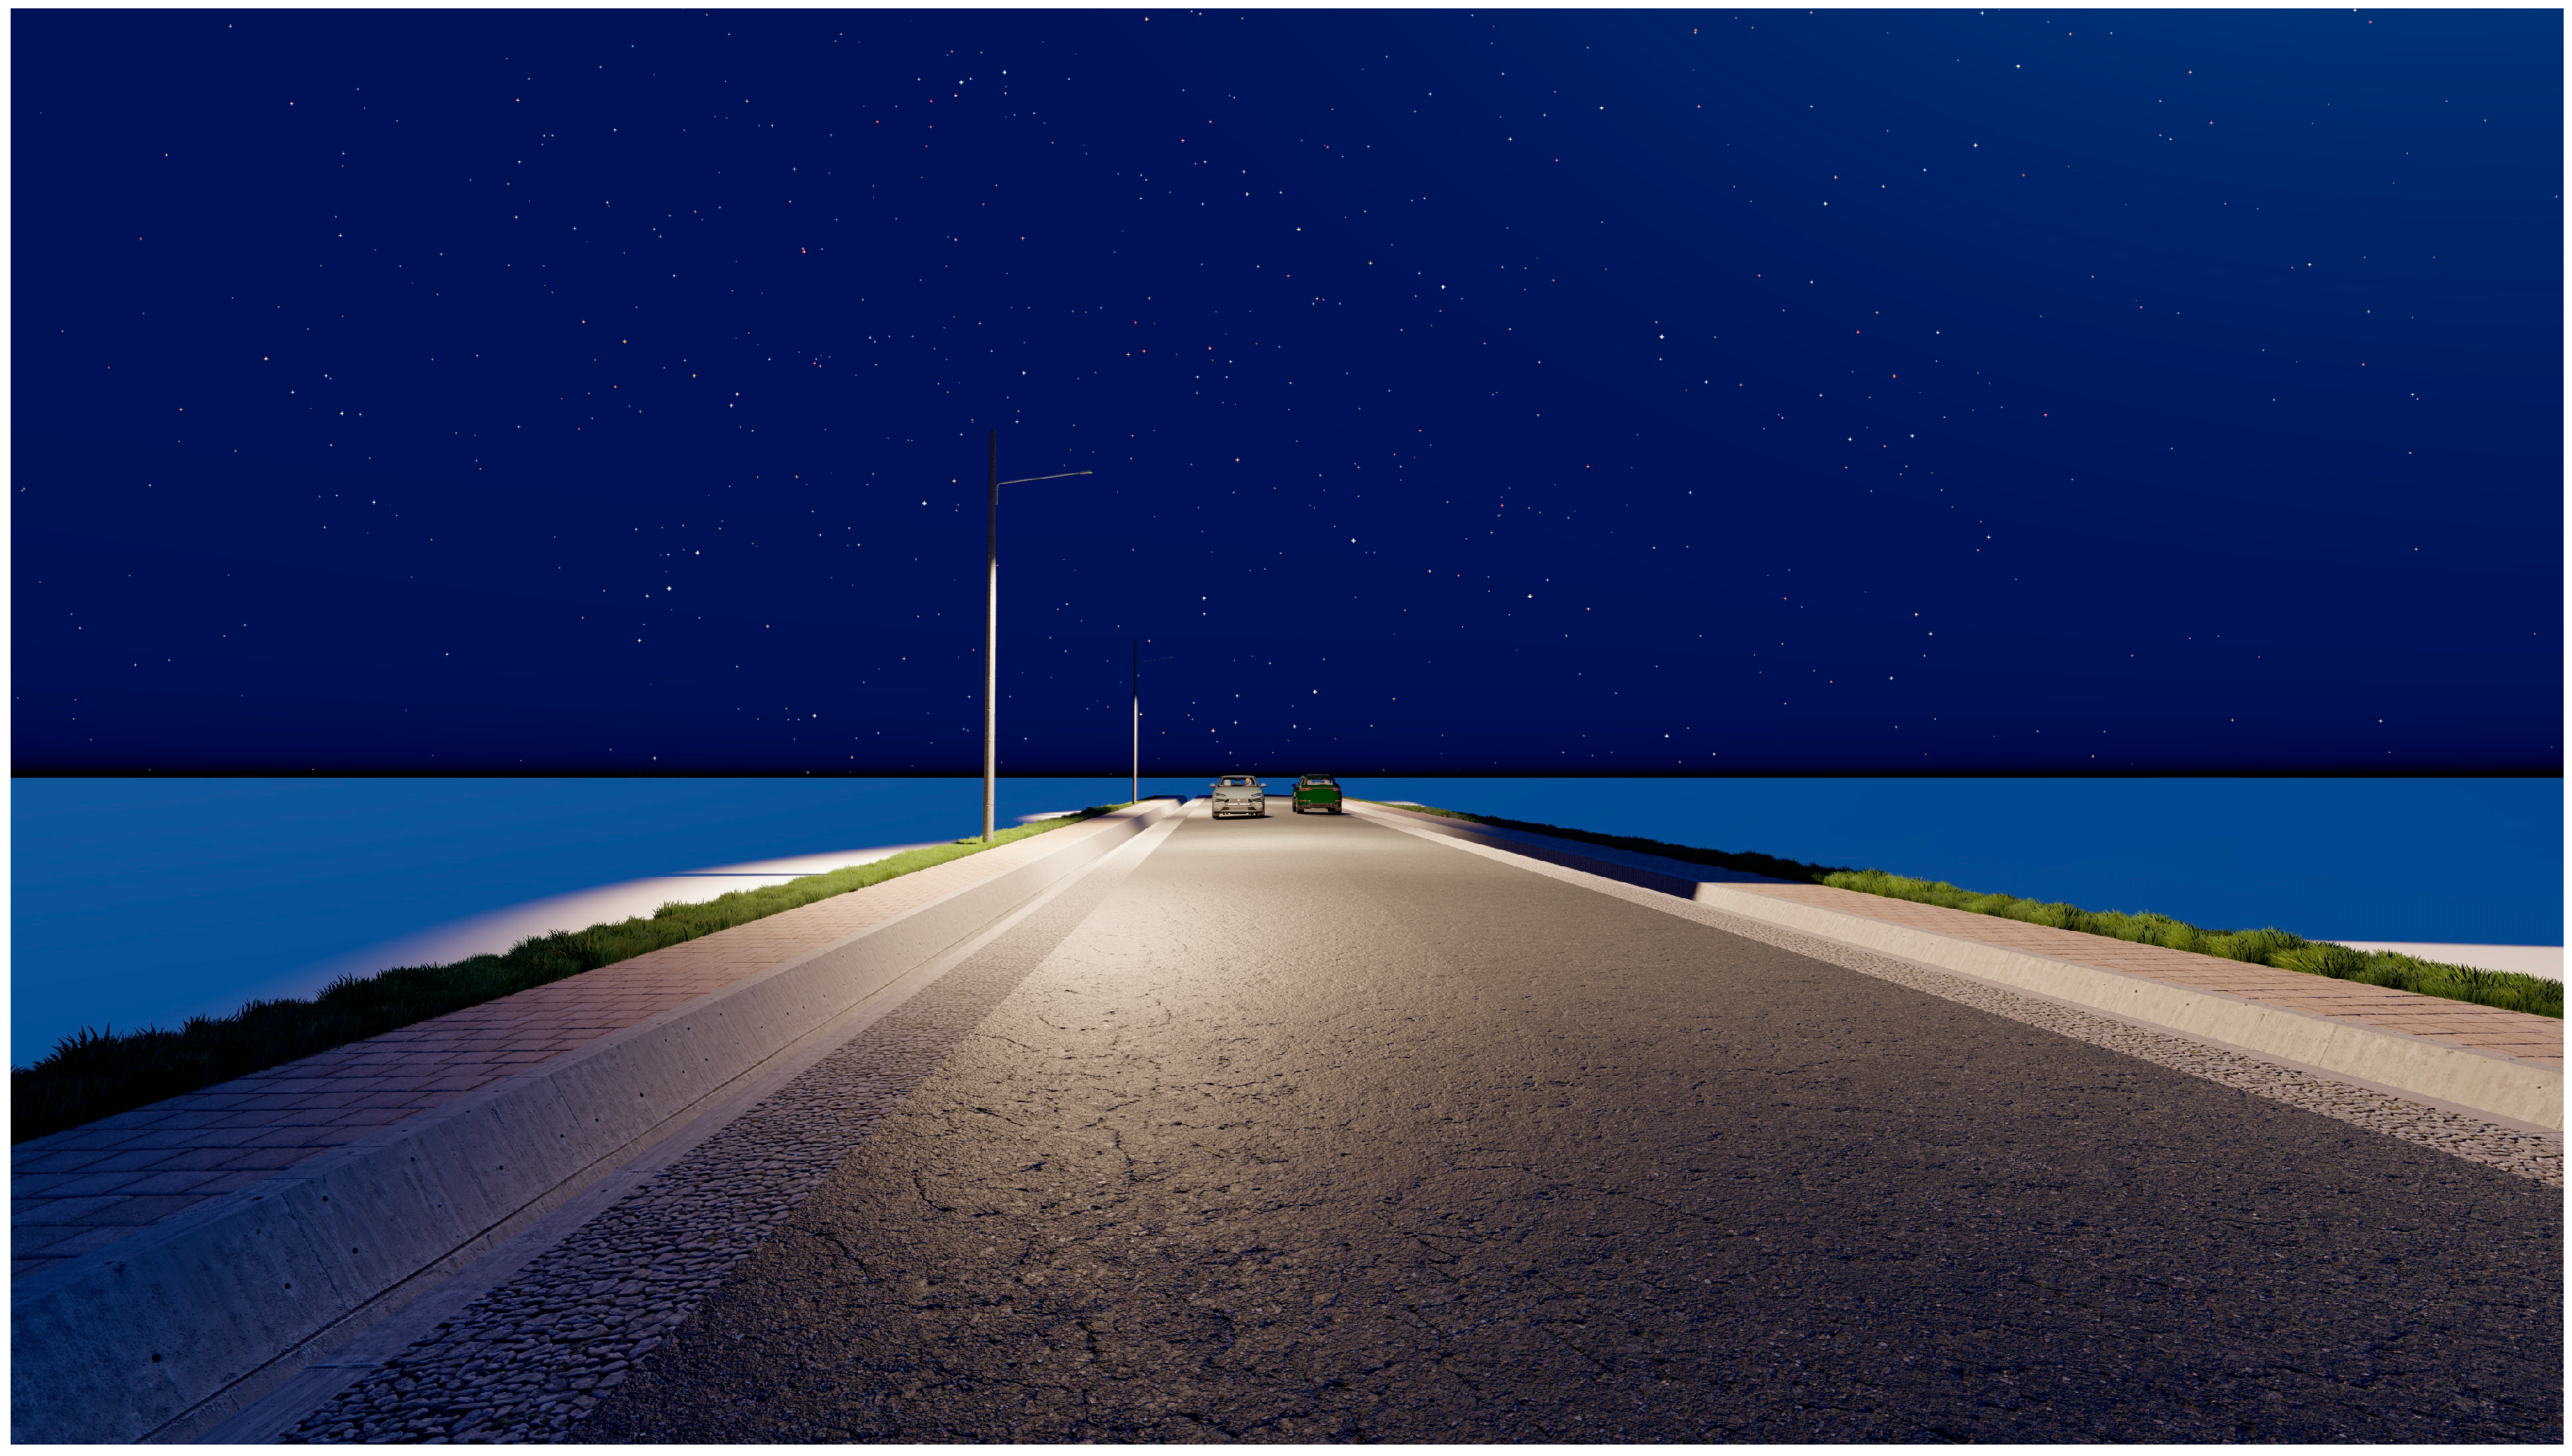
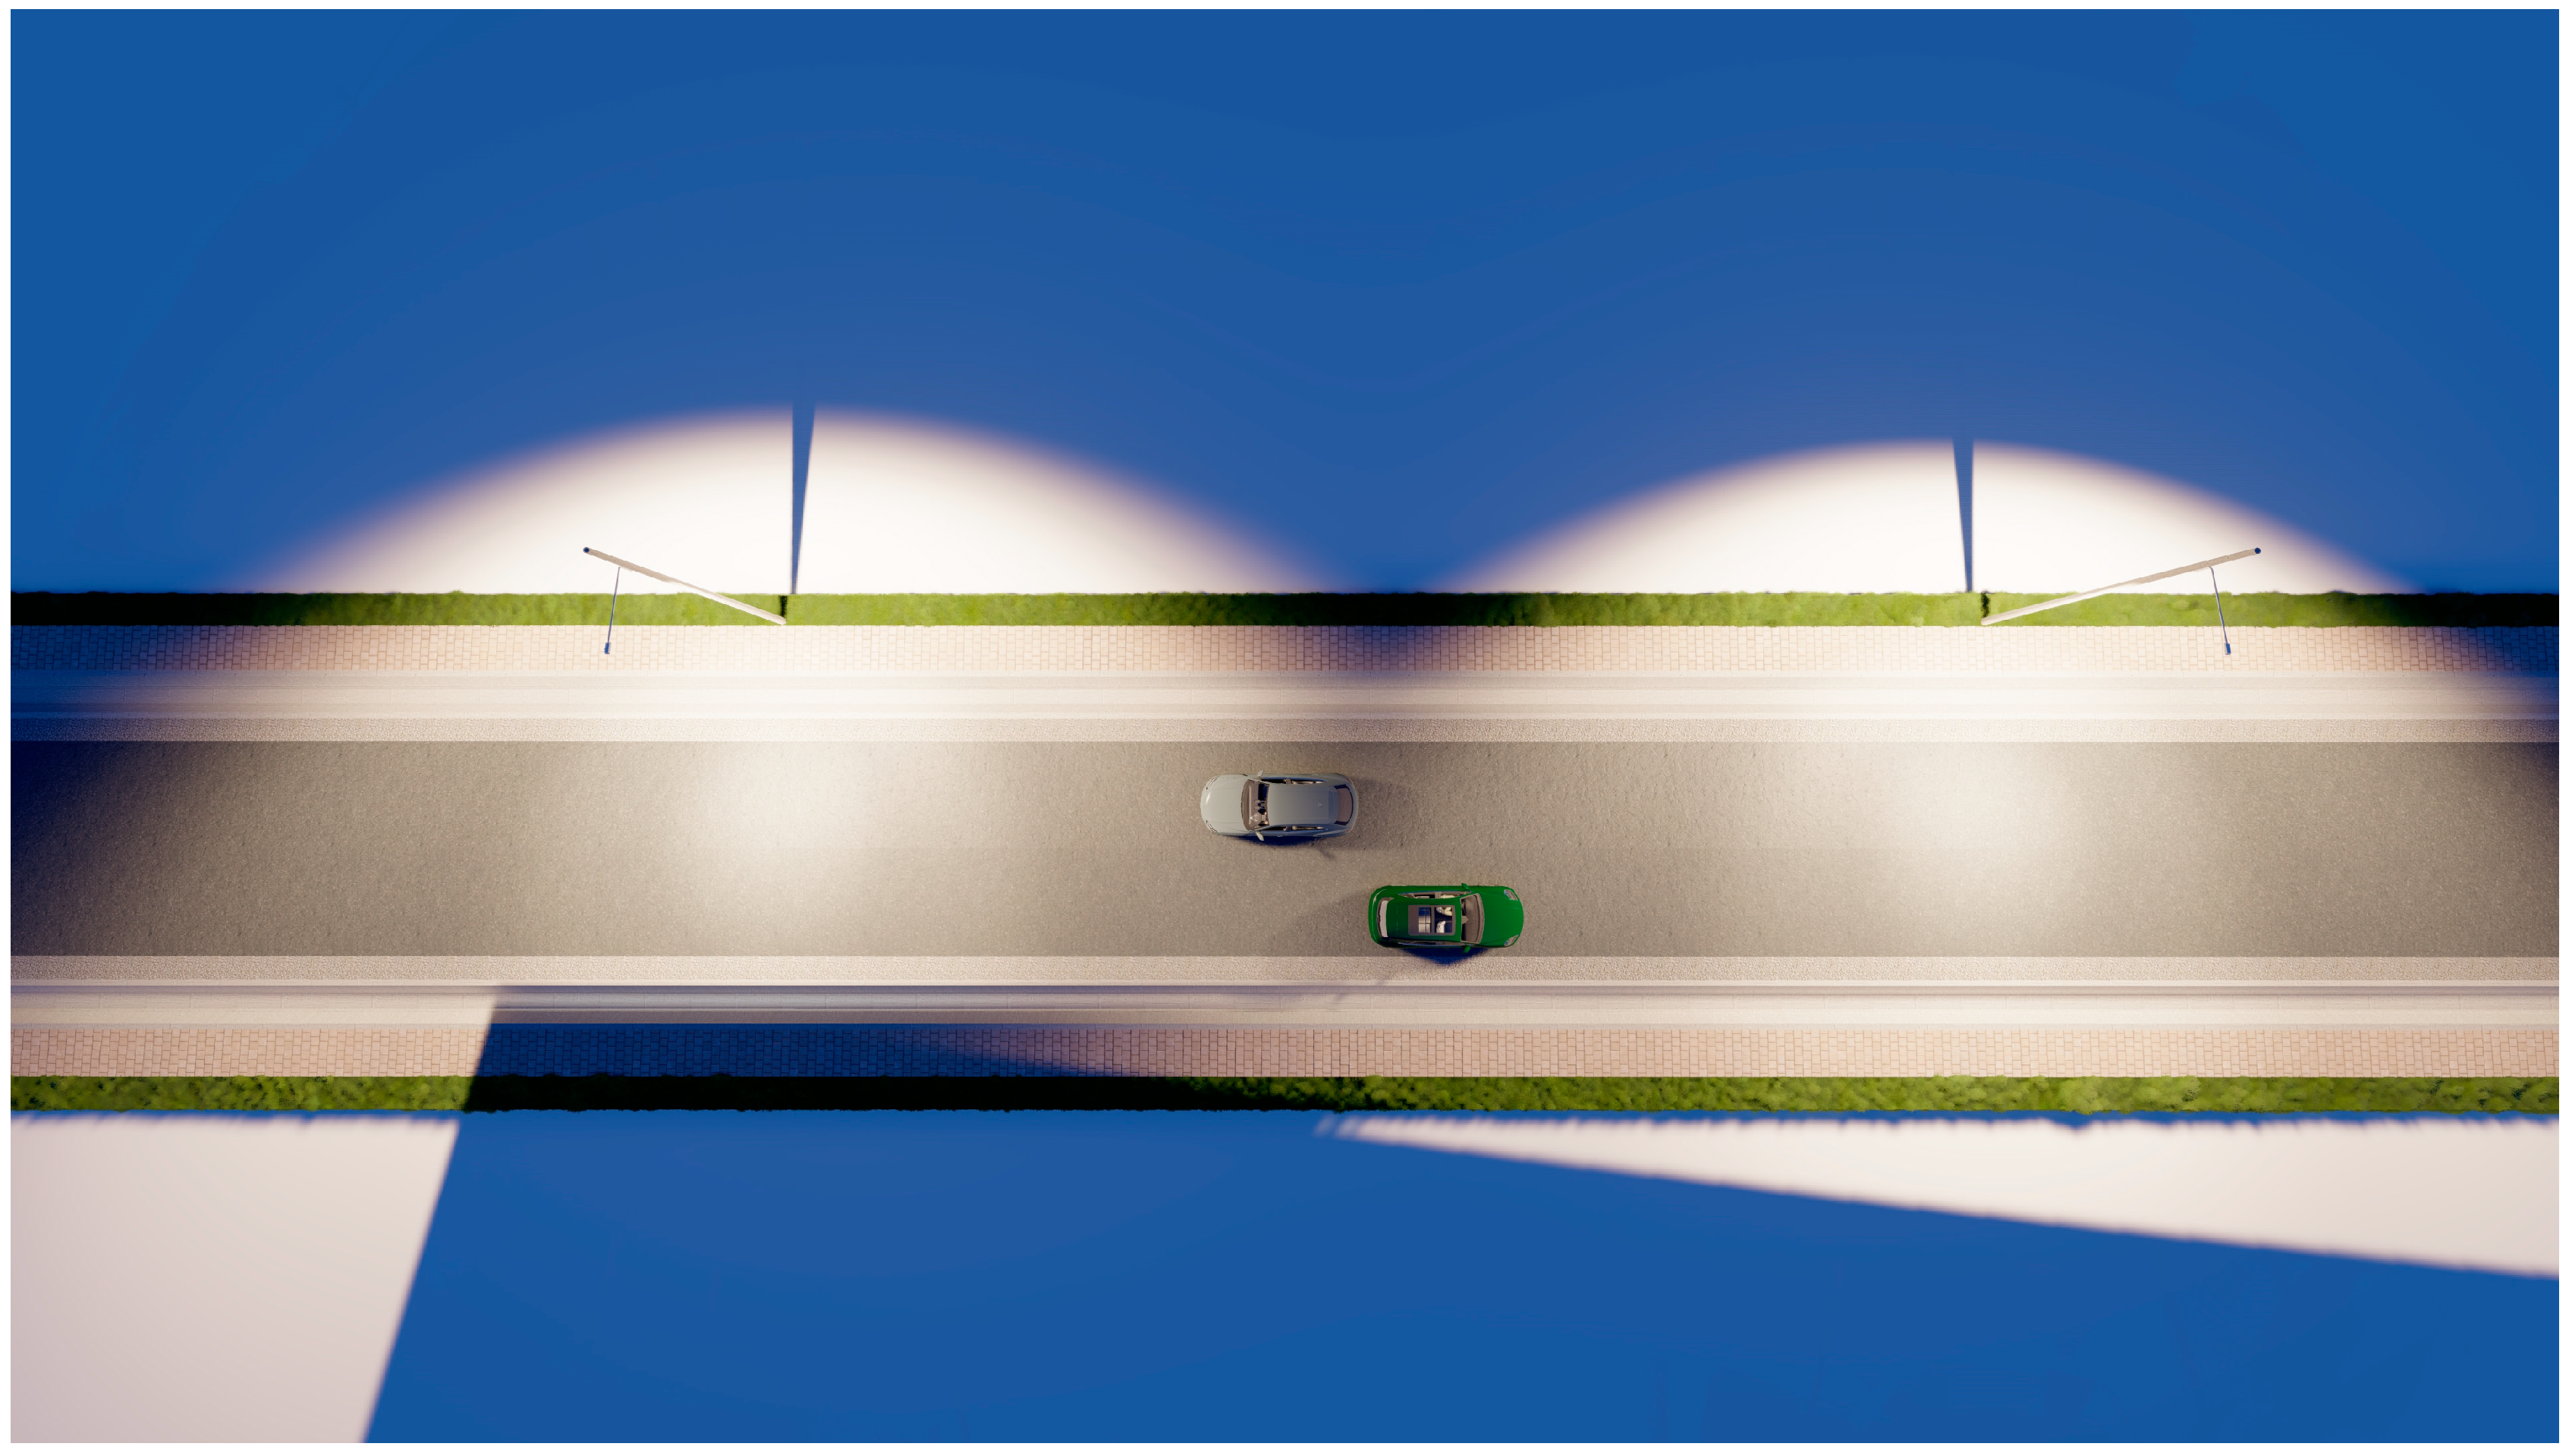
The 3D analysis presented in Figure 11 regarding the night frontal view and Figure 12 regarding the aerial view demonstrates the integration of the street lighting system within the transverse profile of the road, ensuring proper alignment of the poles and uniform light distribution in accordance with the requirements of the road lighting class [51].
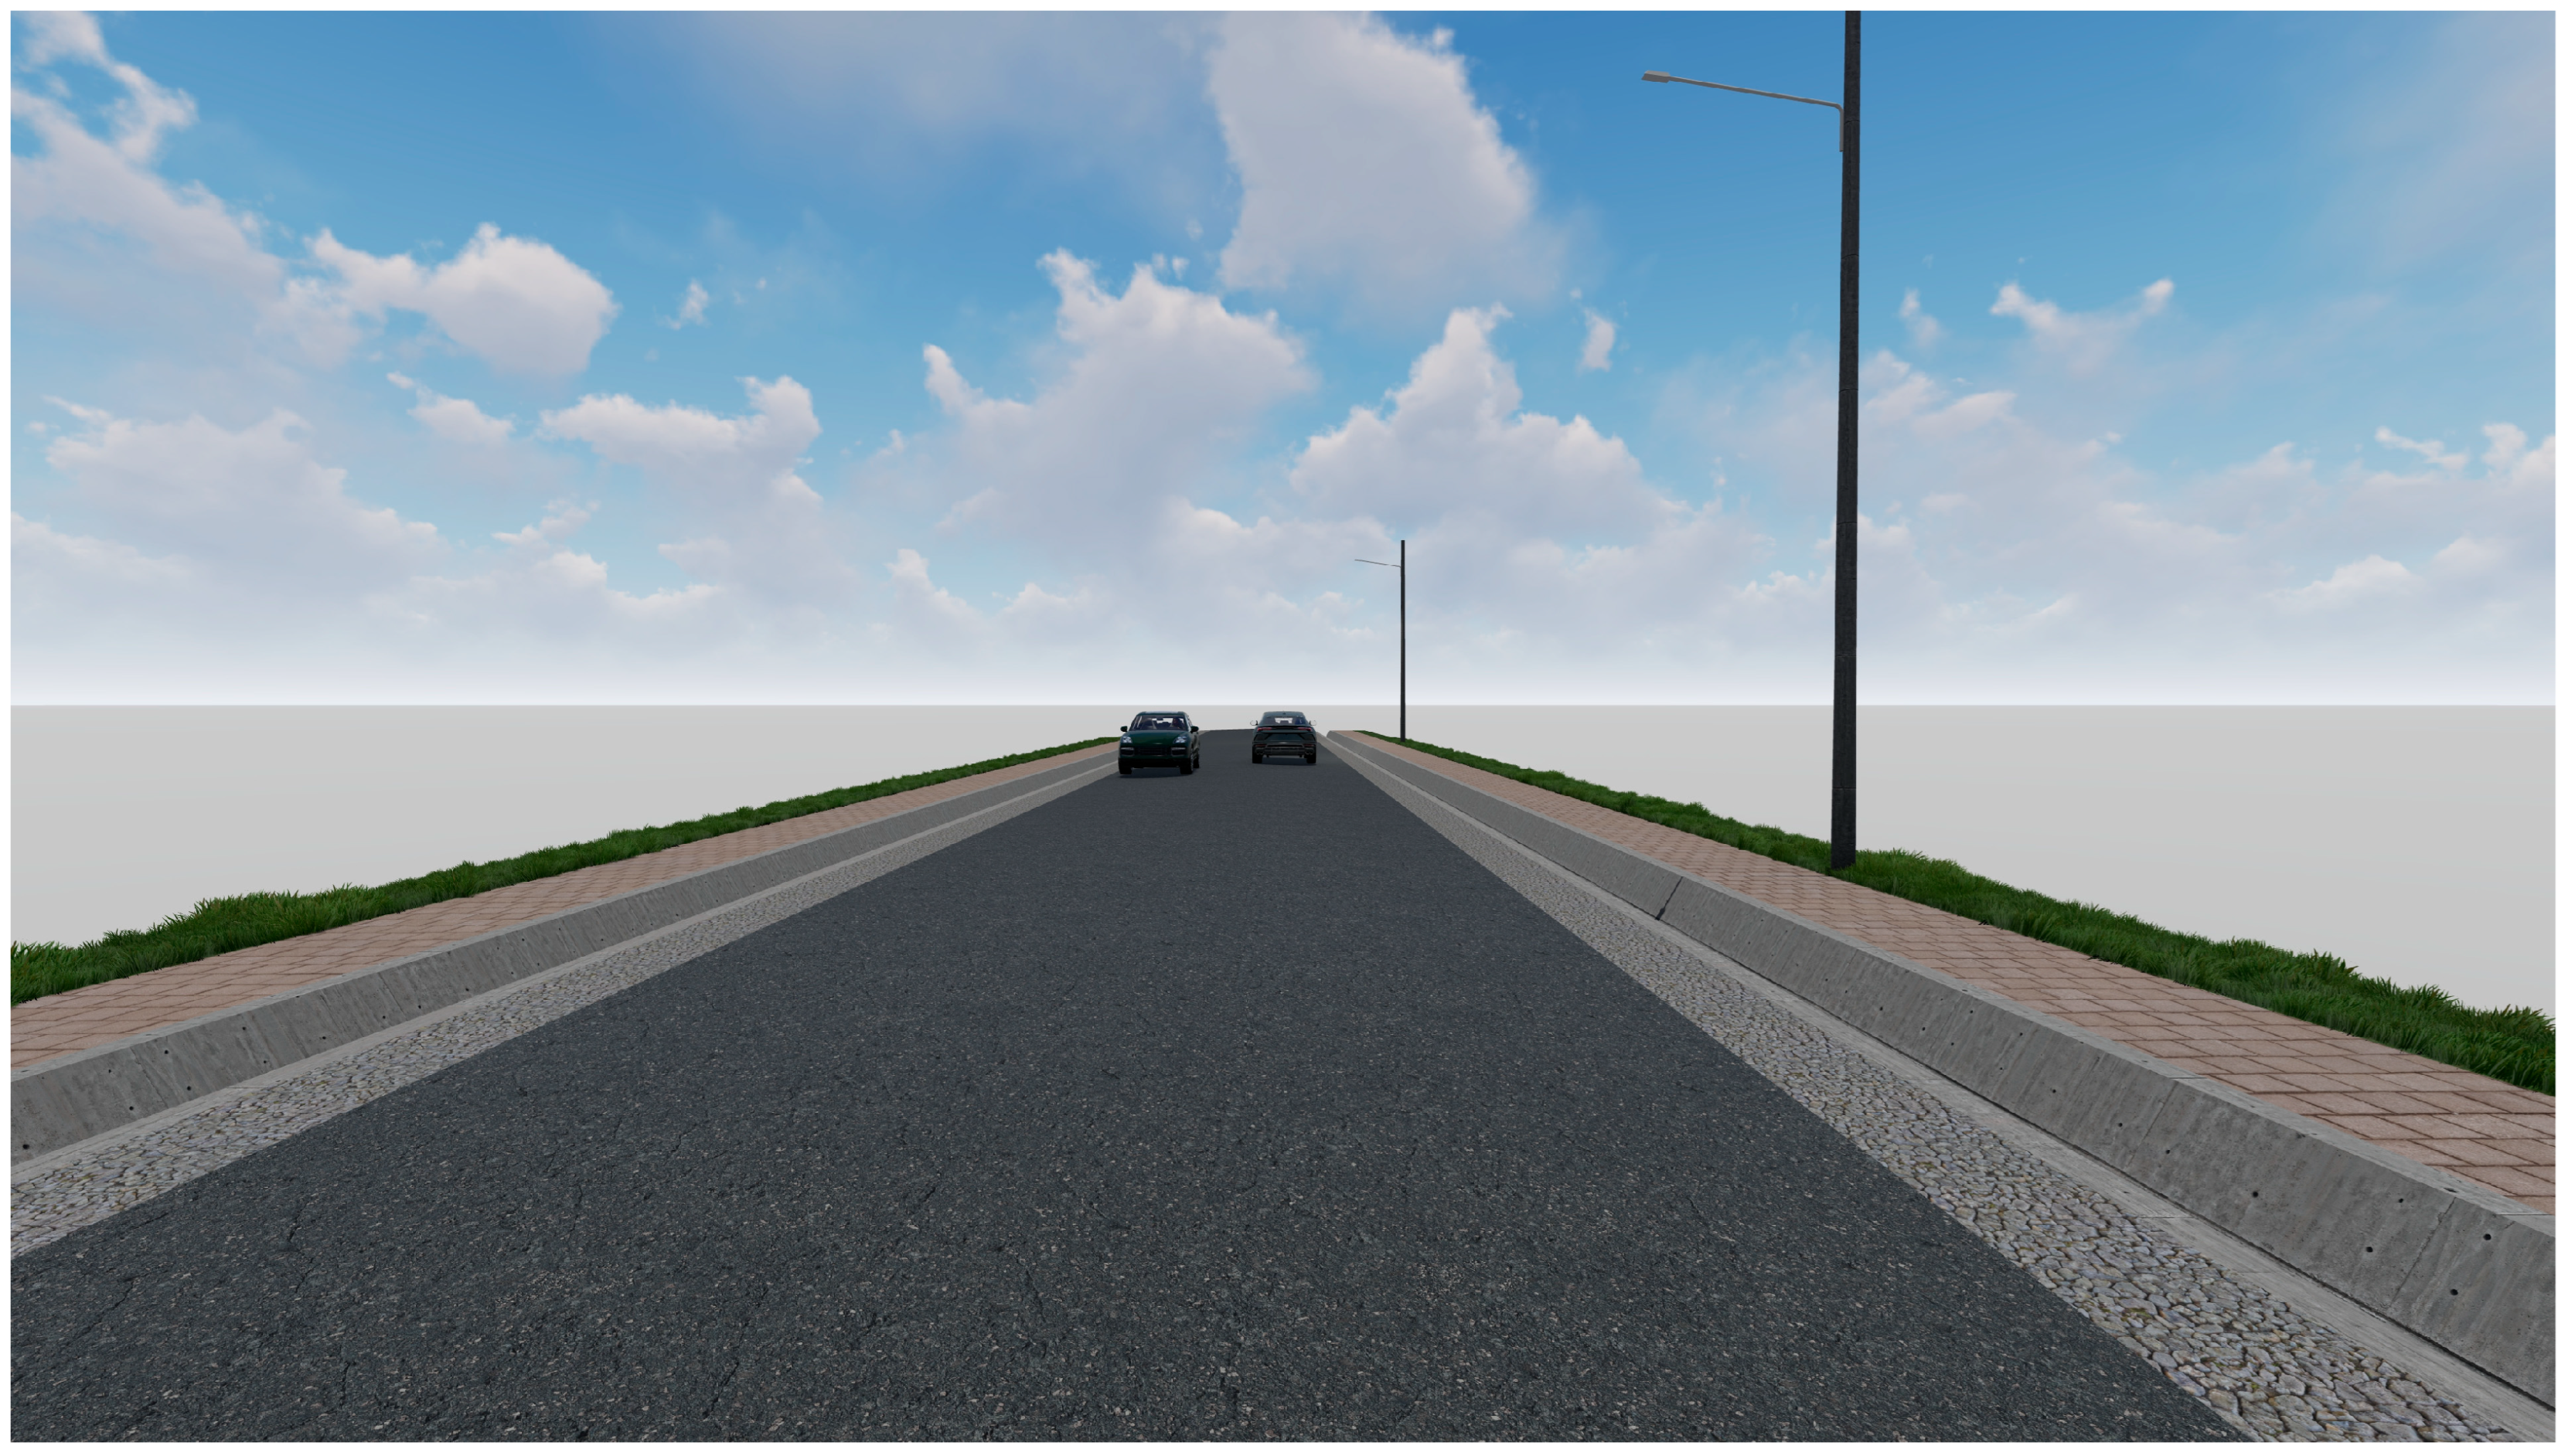
Daytime perspective view (Figure 13) illustrates the integration of the street lighting system into the geometric configuration of the road, with the placement of lighting poles on the sidewalks, ensuring safety zone compliance and conformity with road lighting regulations.

3.2. Analysis of Local Photovoltaic System for Street Lighting

Autonomous photovoltaic lighting fixtures can be installed on the electric poles of the 0.40 kV distribution line by replacing the existing lighting devices with a complete independent lighting system consisting of a monocrystalline photovoltaic panel, programmable charge controller, batteries, LED luminares, and auxiliary materials [17,52].
The panels used in this study are high-quality monocrystalline photovoltaic modules with a robust anodized aluminum frame to prevent the accumulation of ice and water [53]. Their efficiency, quality-to-price ratio, and compact construction characteristics recommend these modules as an integral part of an autonomous lighting system [53].
The photovoltaic module is mounted at the top of the pole at an optimal angle (less than 15°) to maximize incident solar radiation, and the batteries are placed in a box attached to the existing pole. During installation, the module is oriented toward the south, ensuring it receives solar radiation throughout the day without shading. The electrical energy generated by the photovoltaic modules will charge the batteries during the day. This system operates from dusk until dawn.
To determine the performance of photovoltaic systems that are not connected to the electrical grid but instead rely on storing electrical energy in batteries to provide power when the sun is not shining, the OFF-GRID photovoltaic systems performance calculation tool (PVGIS) developed by the European Union [54] was used. This application utilizes information about the daily variation in electrical energy consumption to simulate the flow of energy to users and from the batteries.
Before choosing this autonomy, the battery discharge patterns were simulated using historical meteorological data (low irradiance winter days), and the 3 days of storage were used in the following calculation, which ensures >90% lighting reliability during the entire year. The installed photovoltaic power and the storage capacity of the solar battery for the studied case are reported in Table 11 and also in Appendix A.
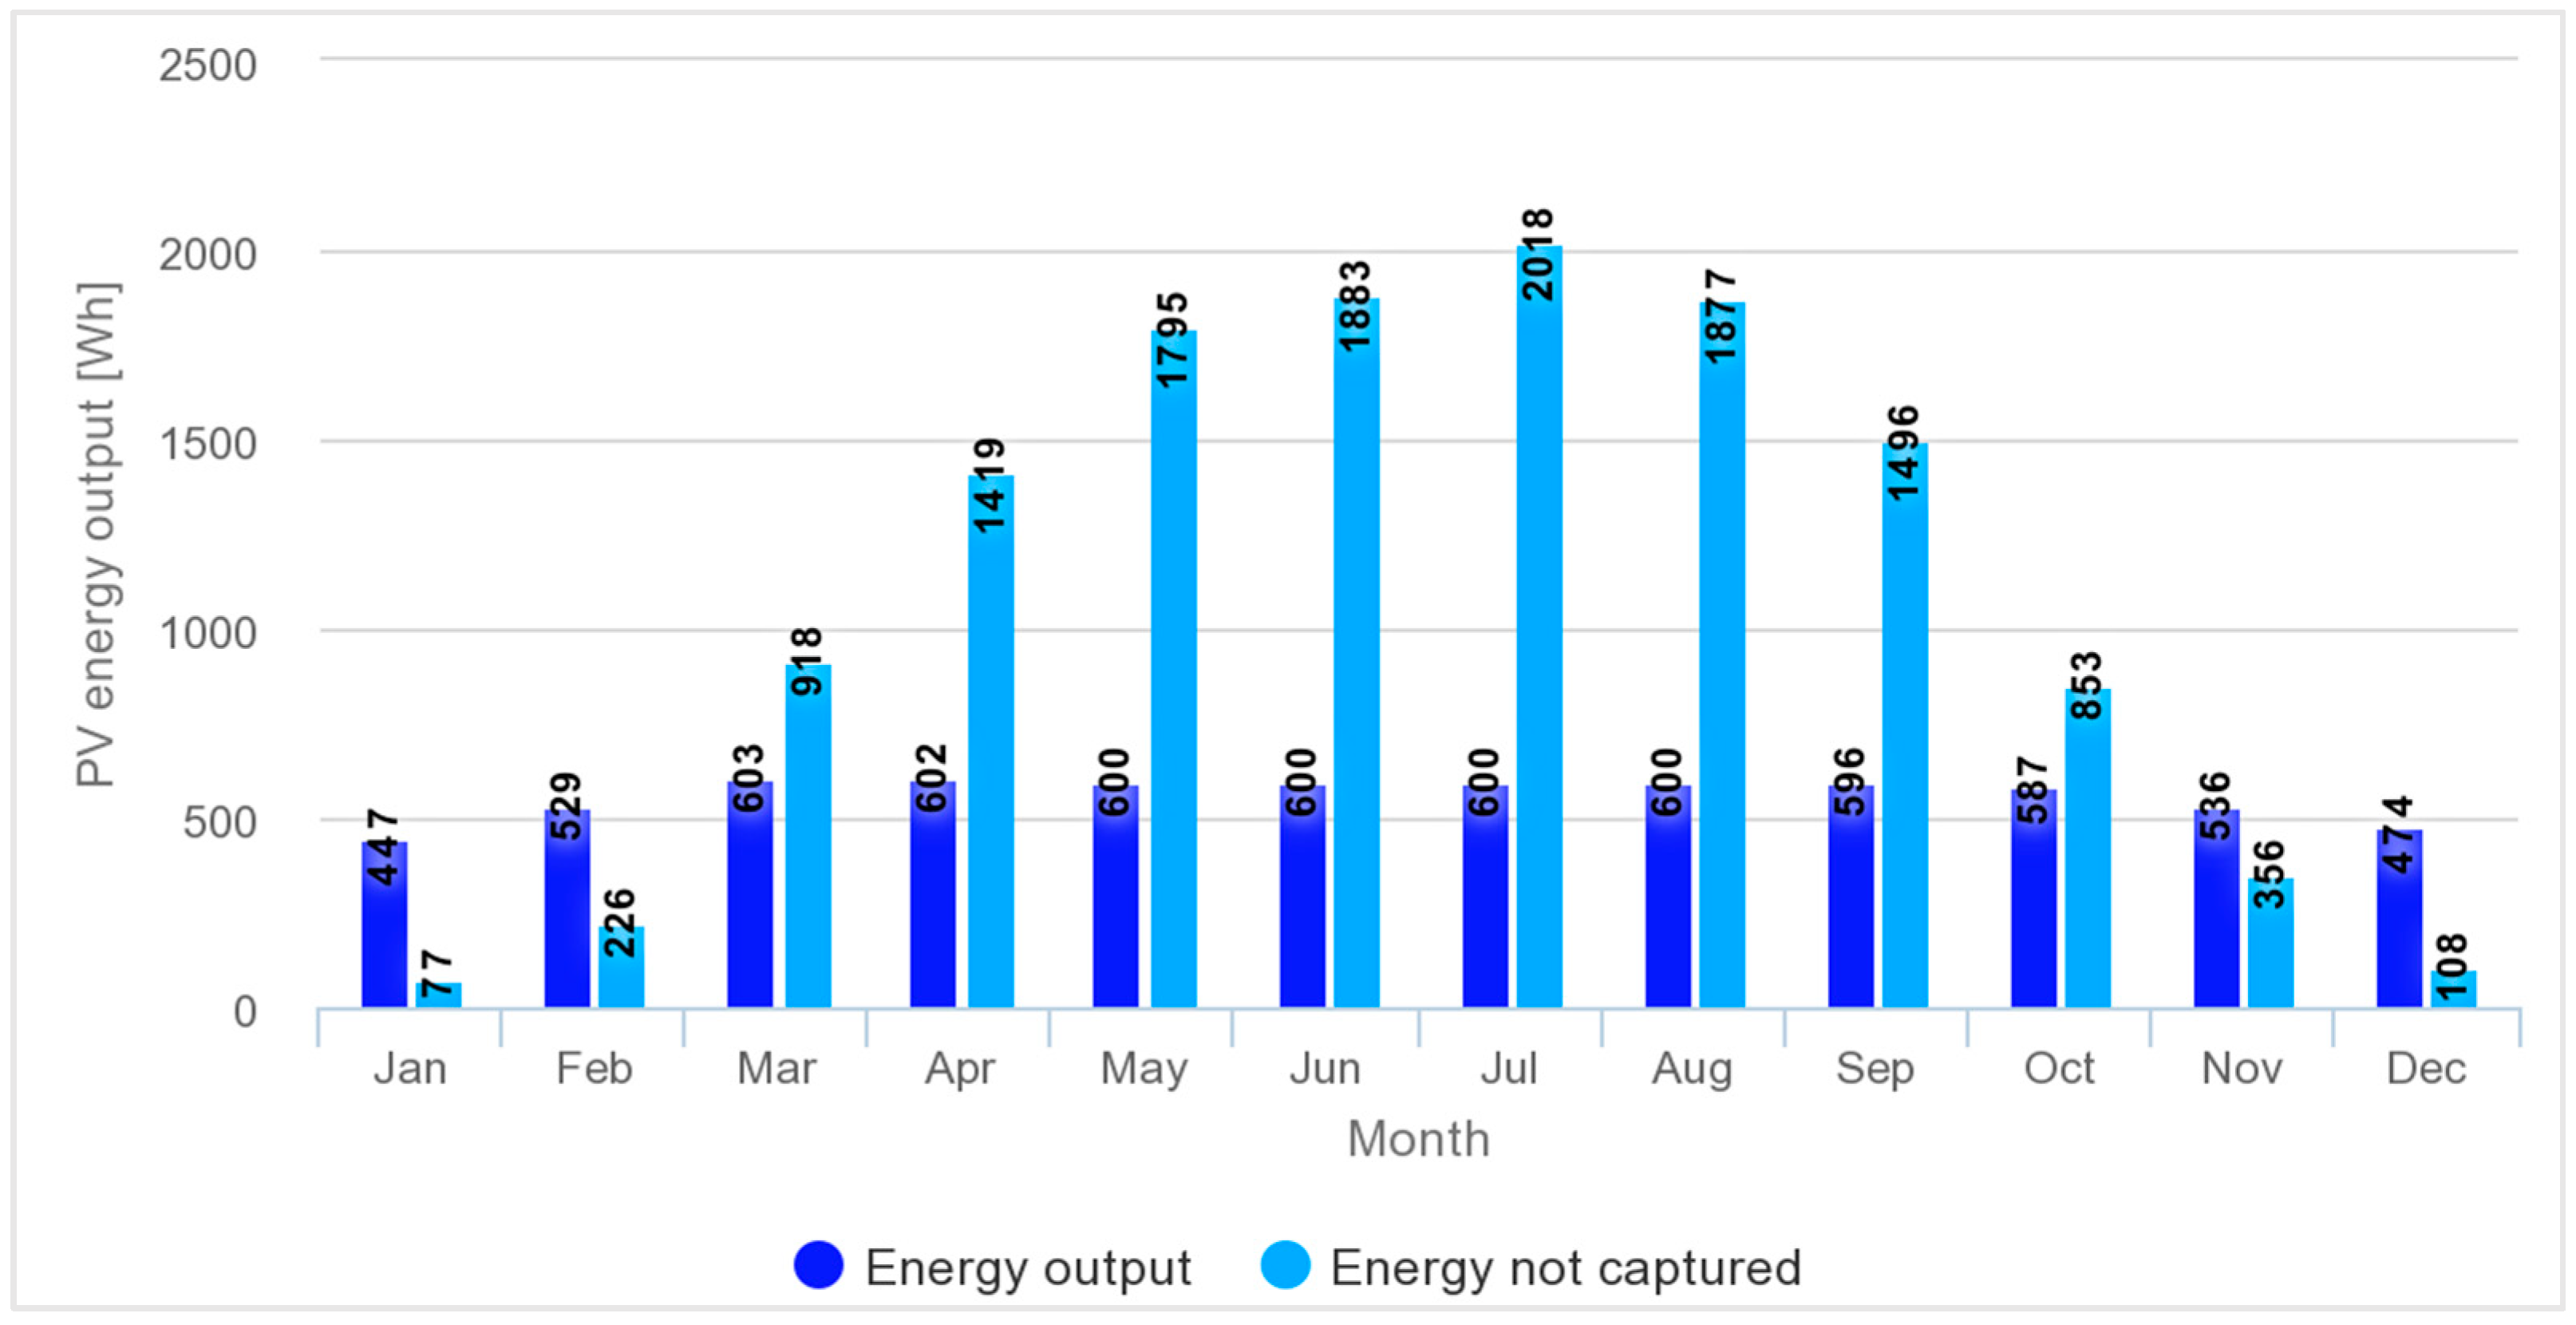
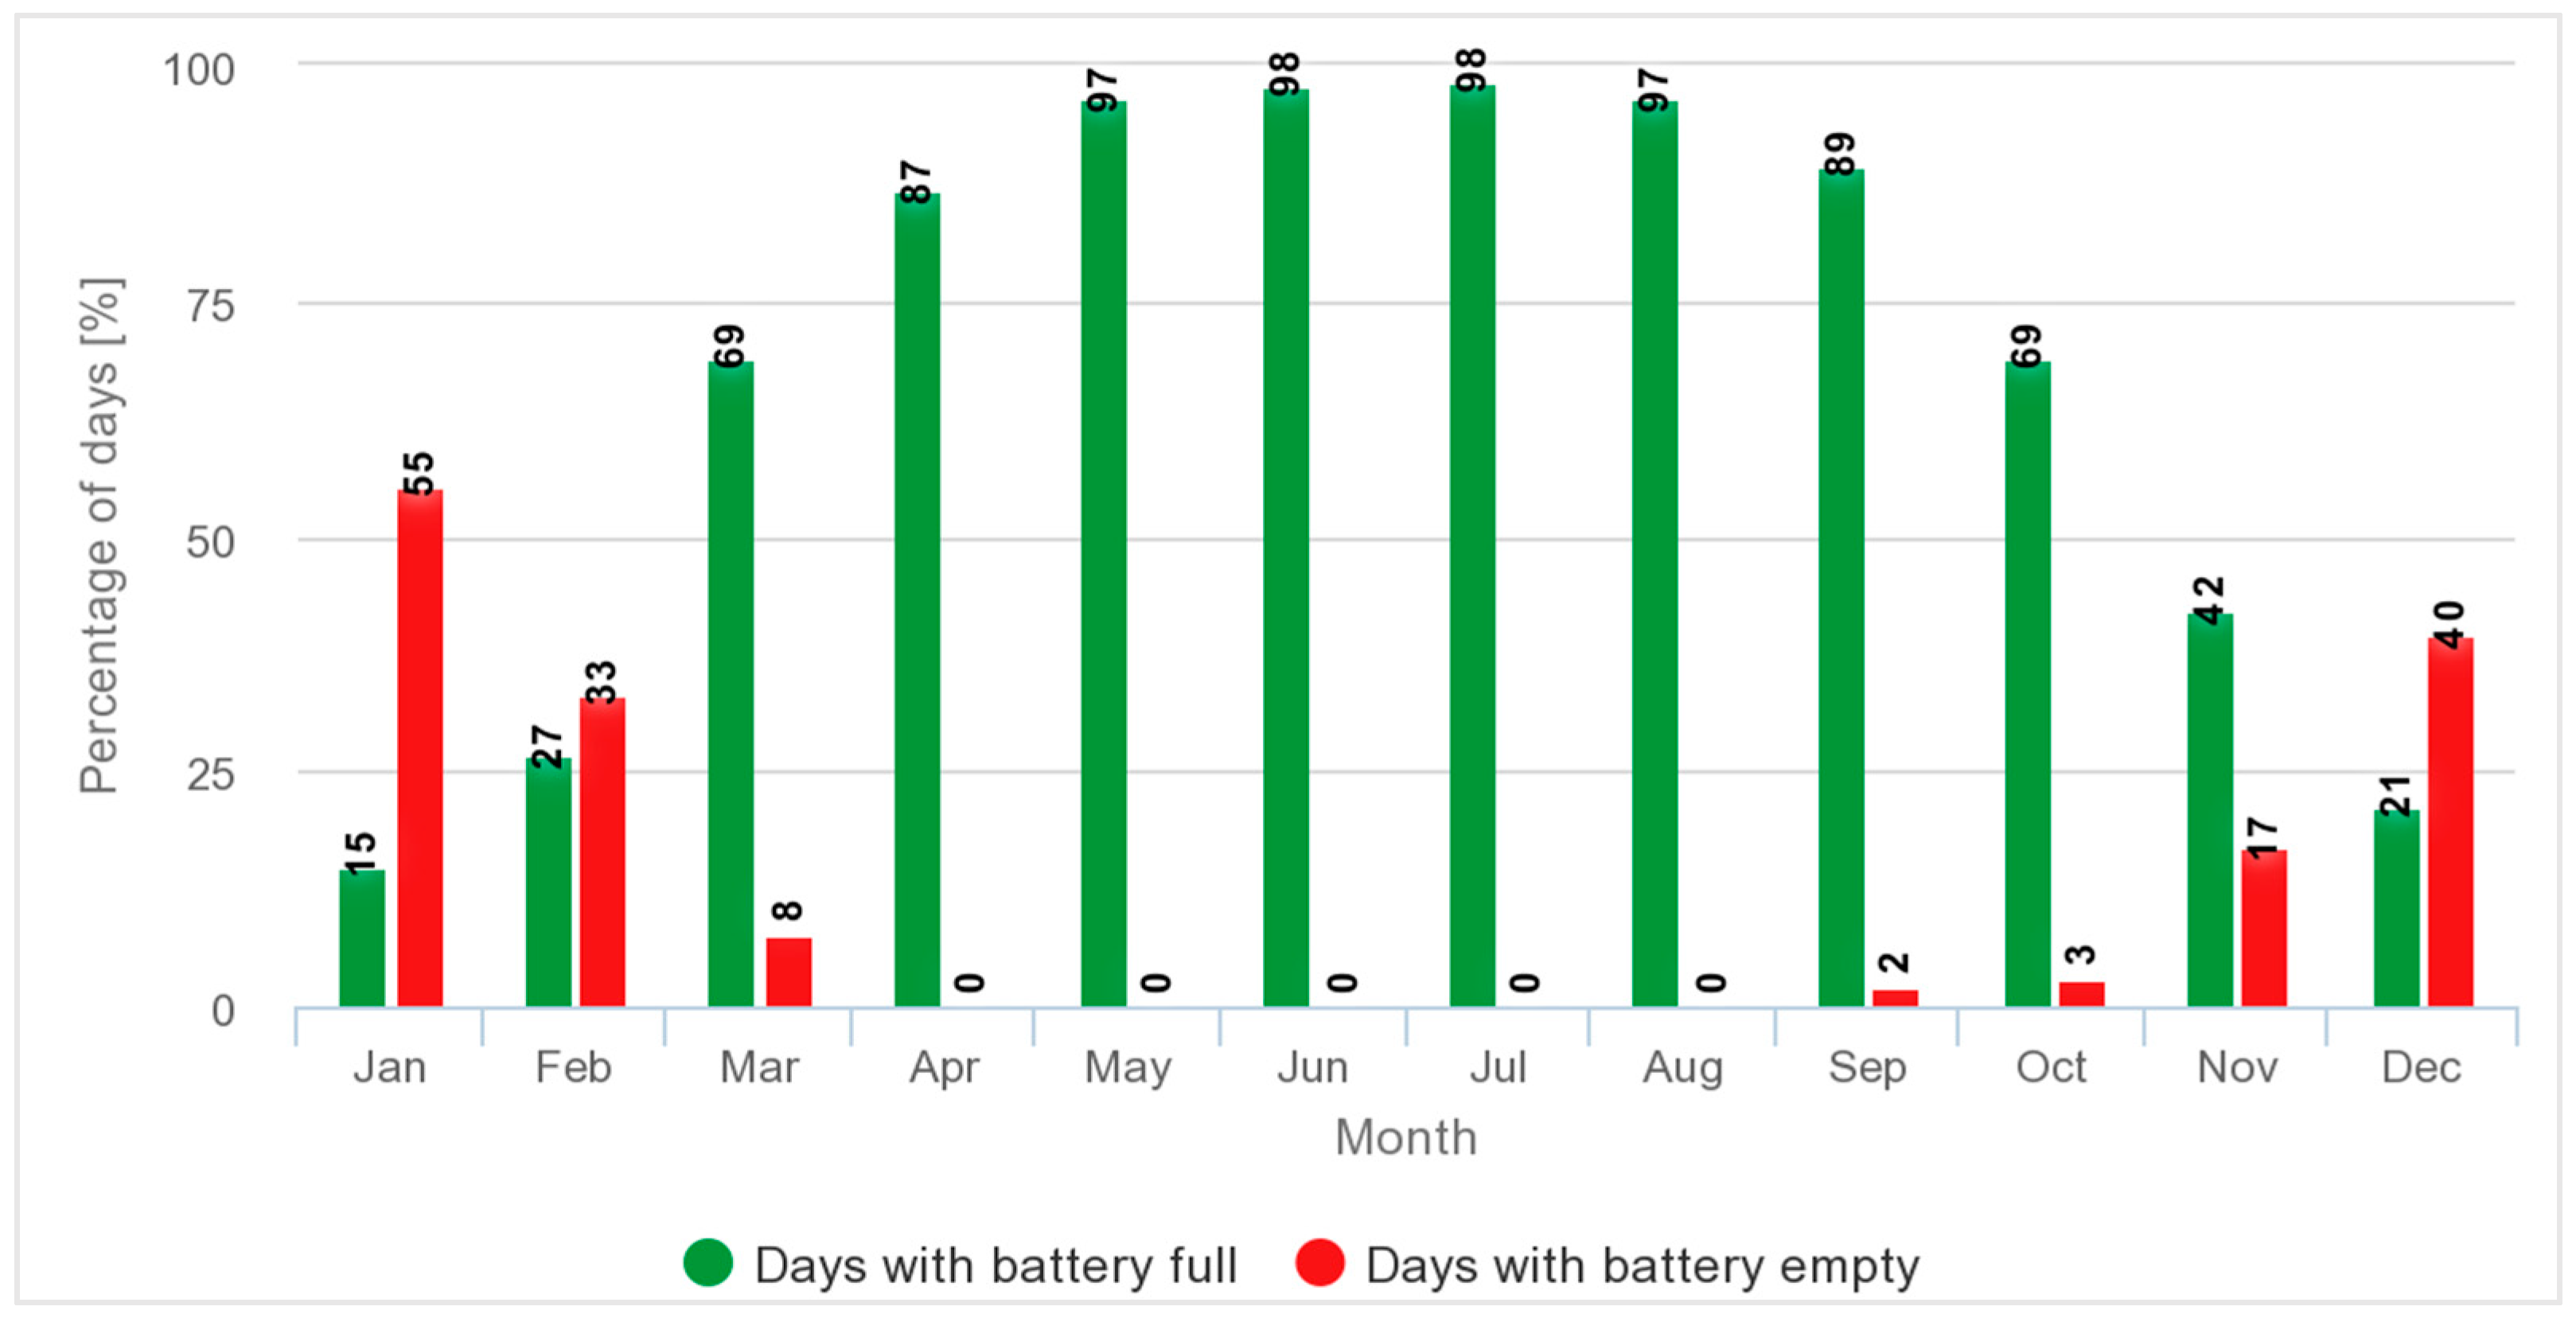
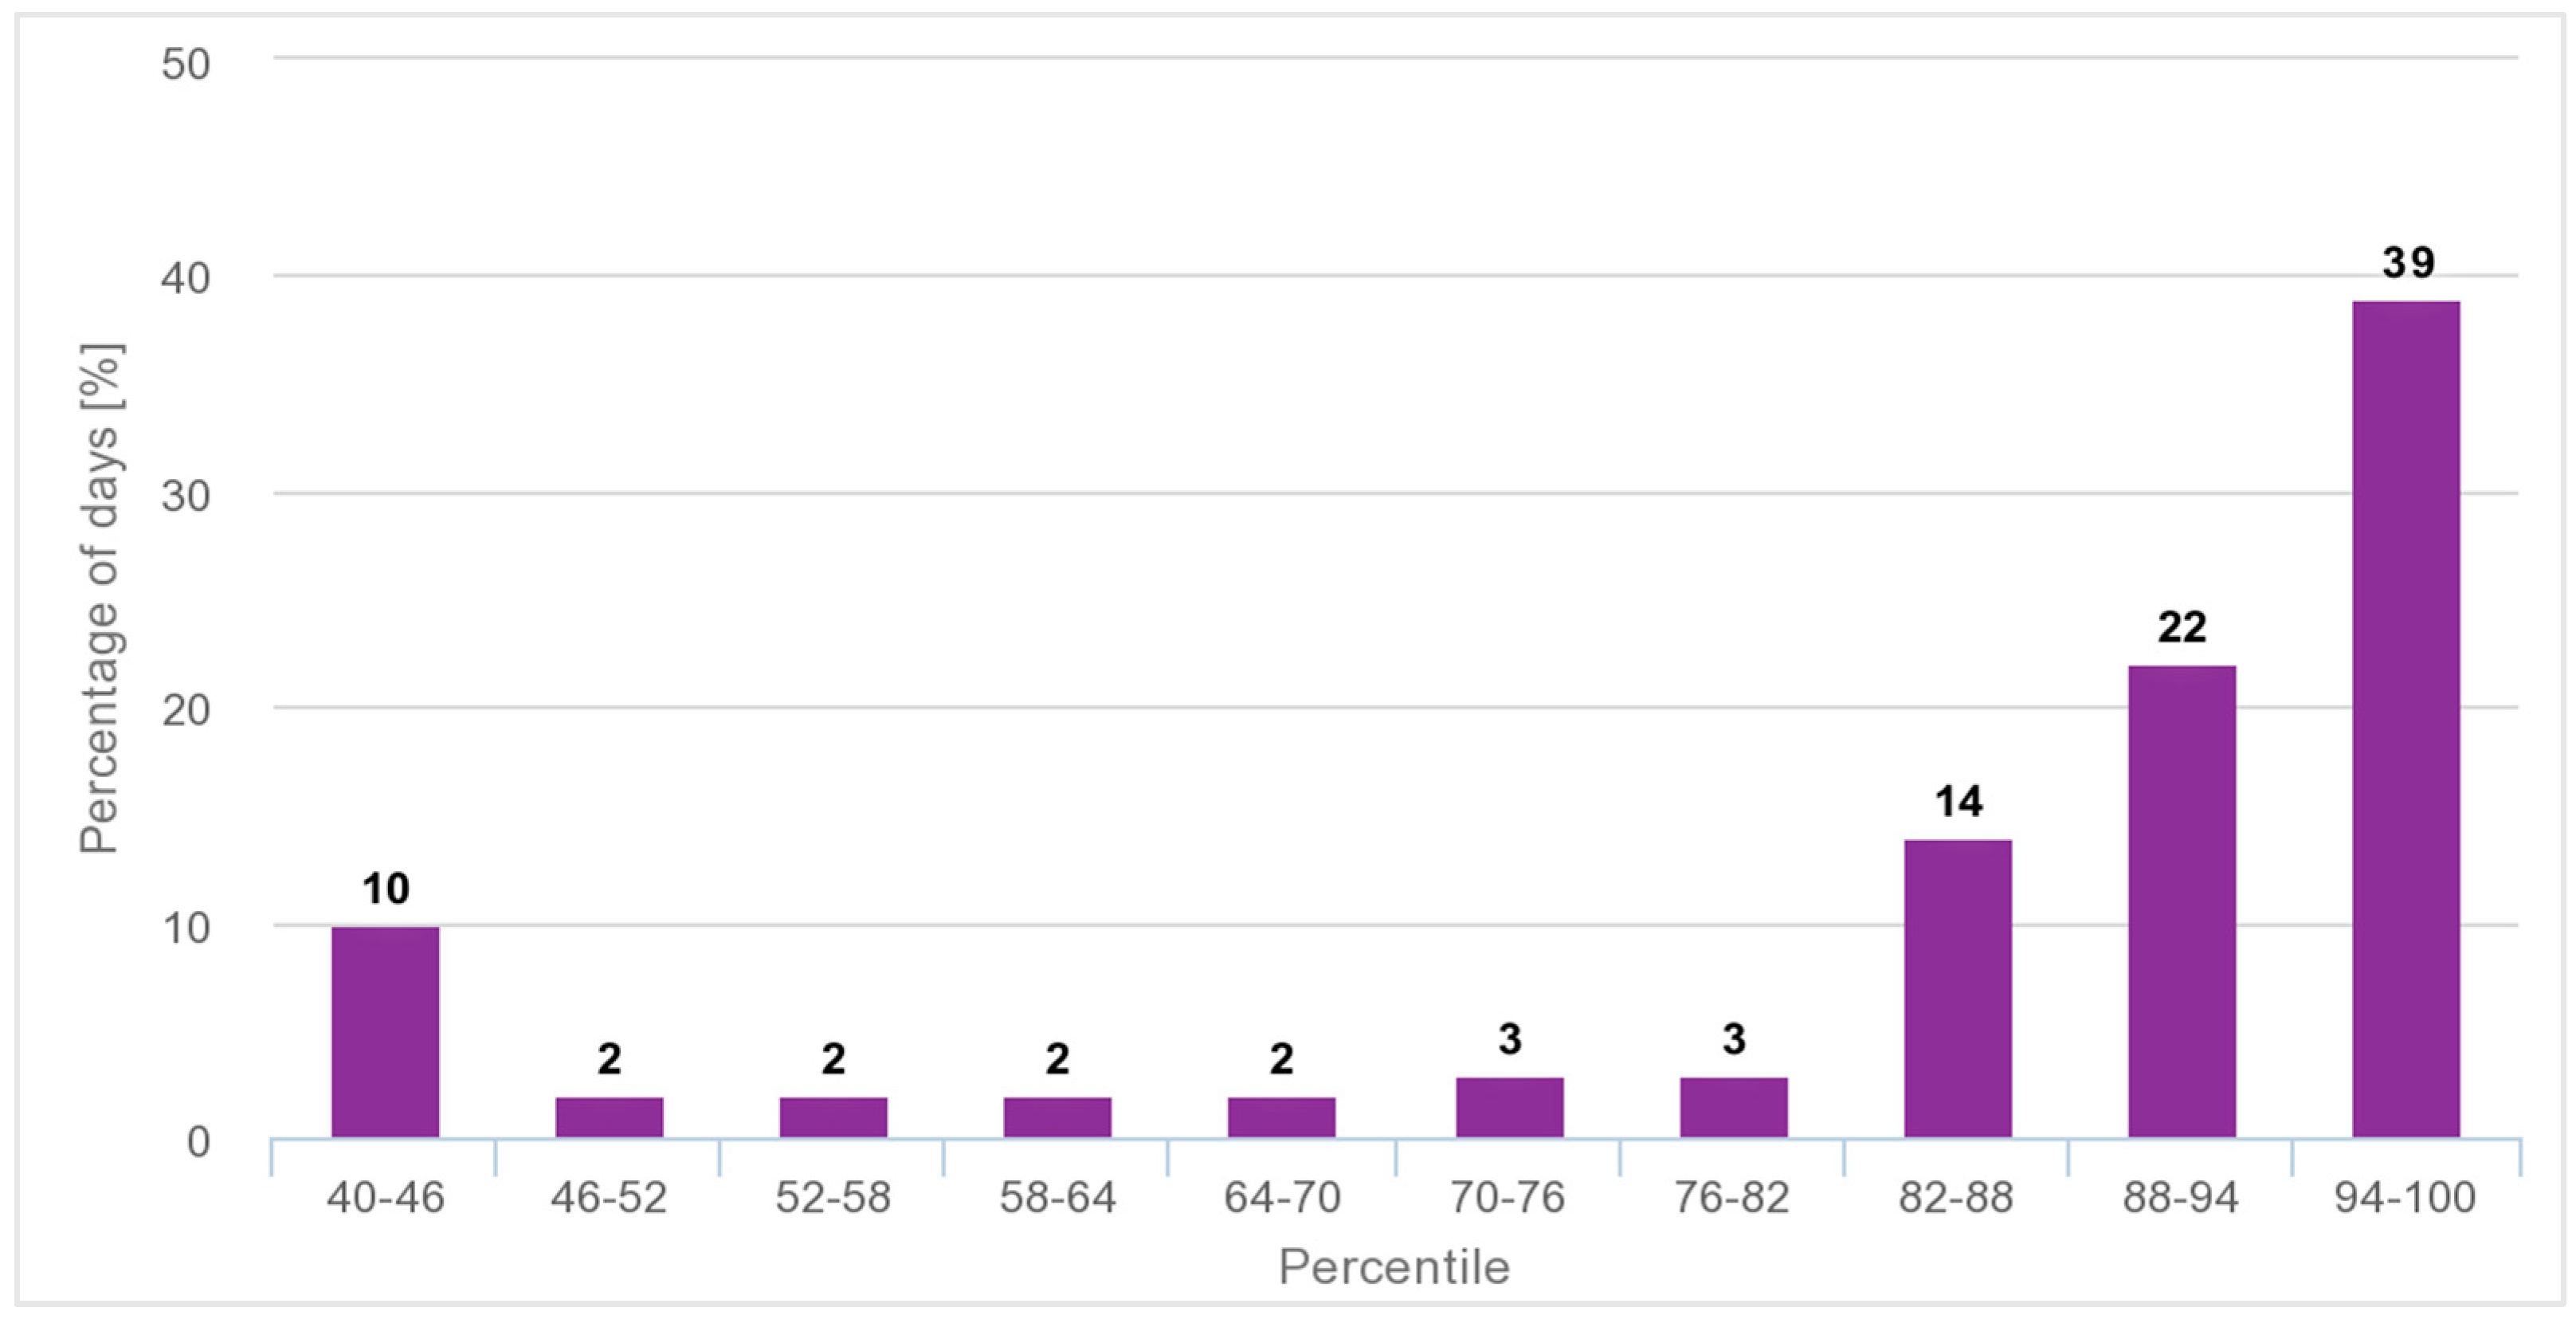
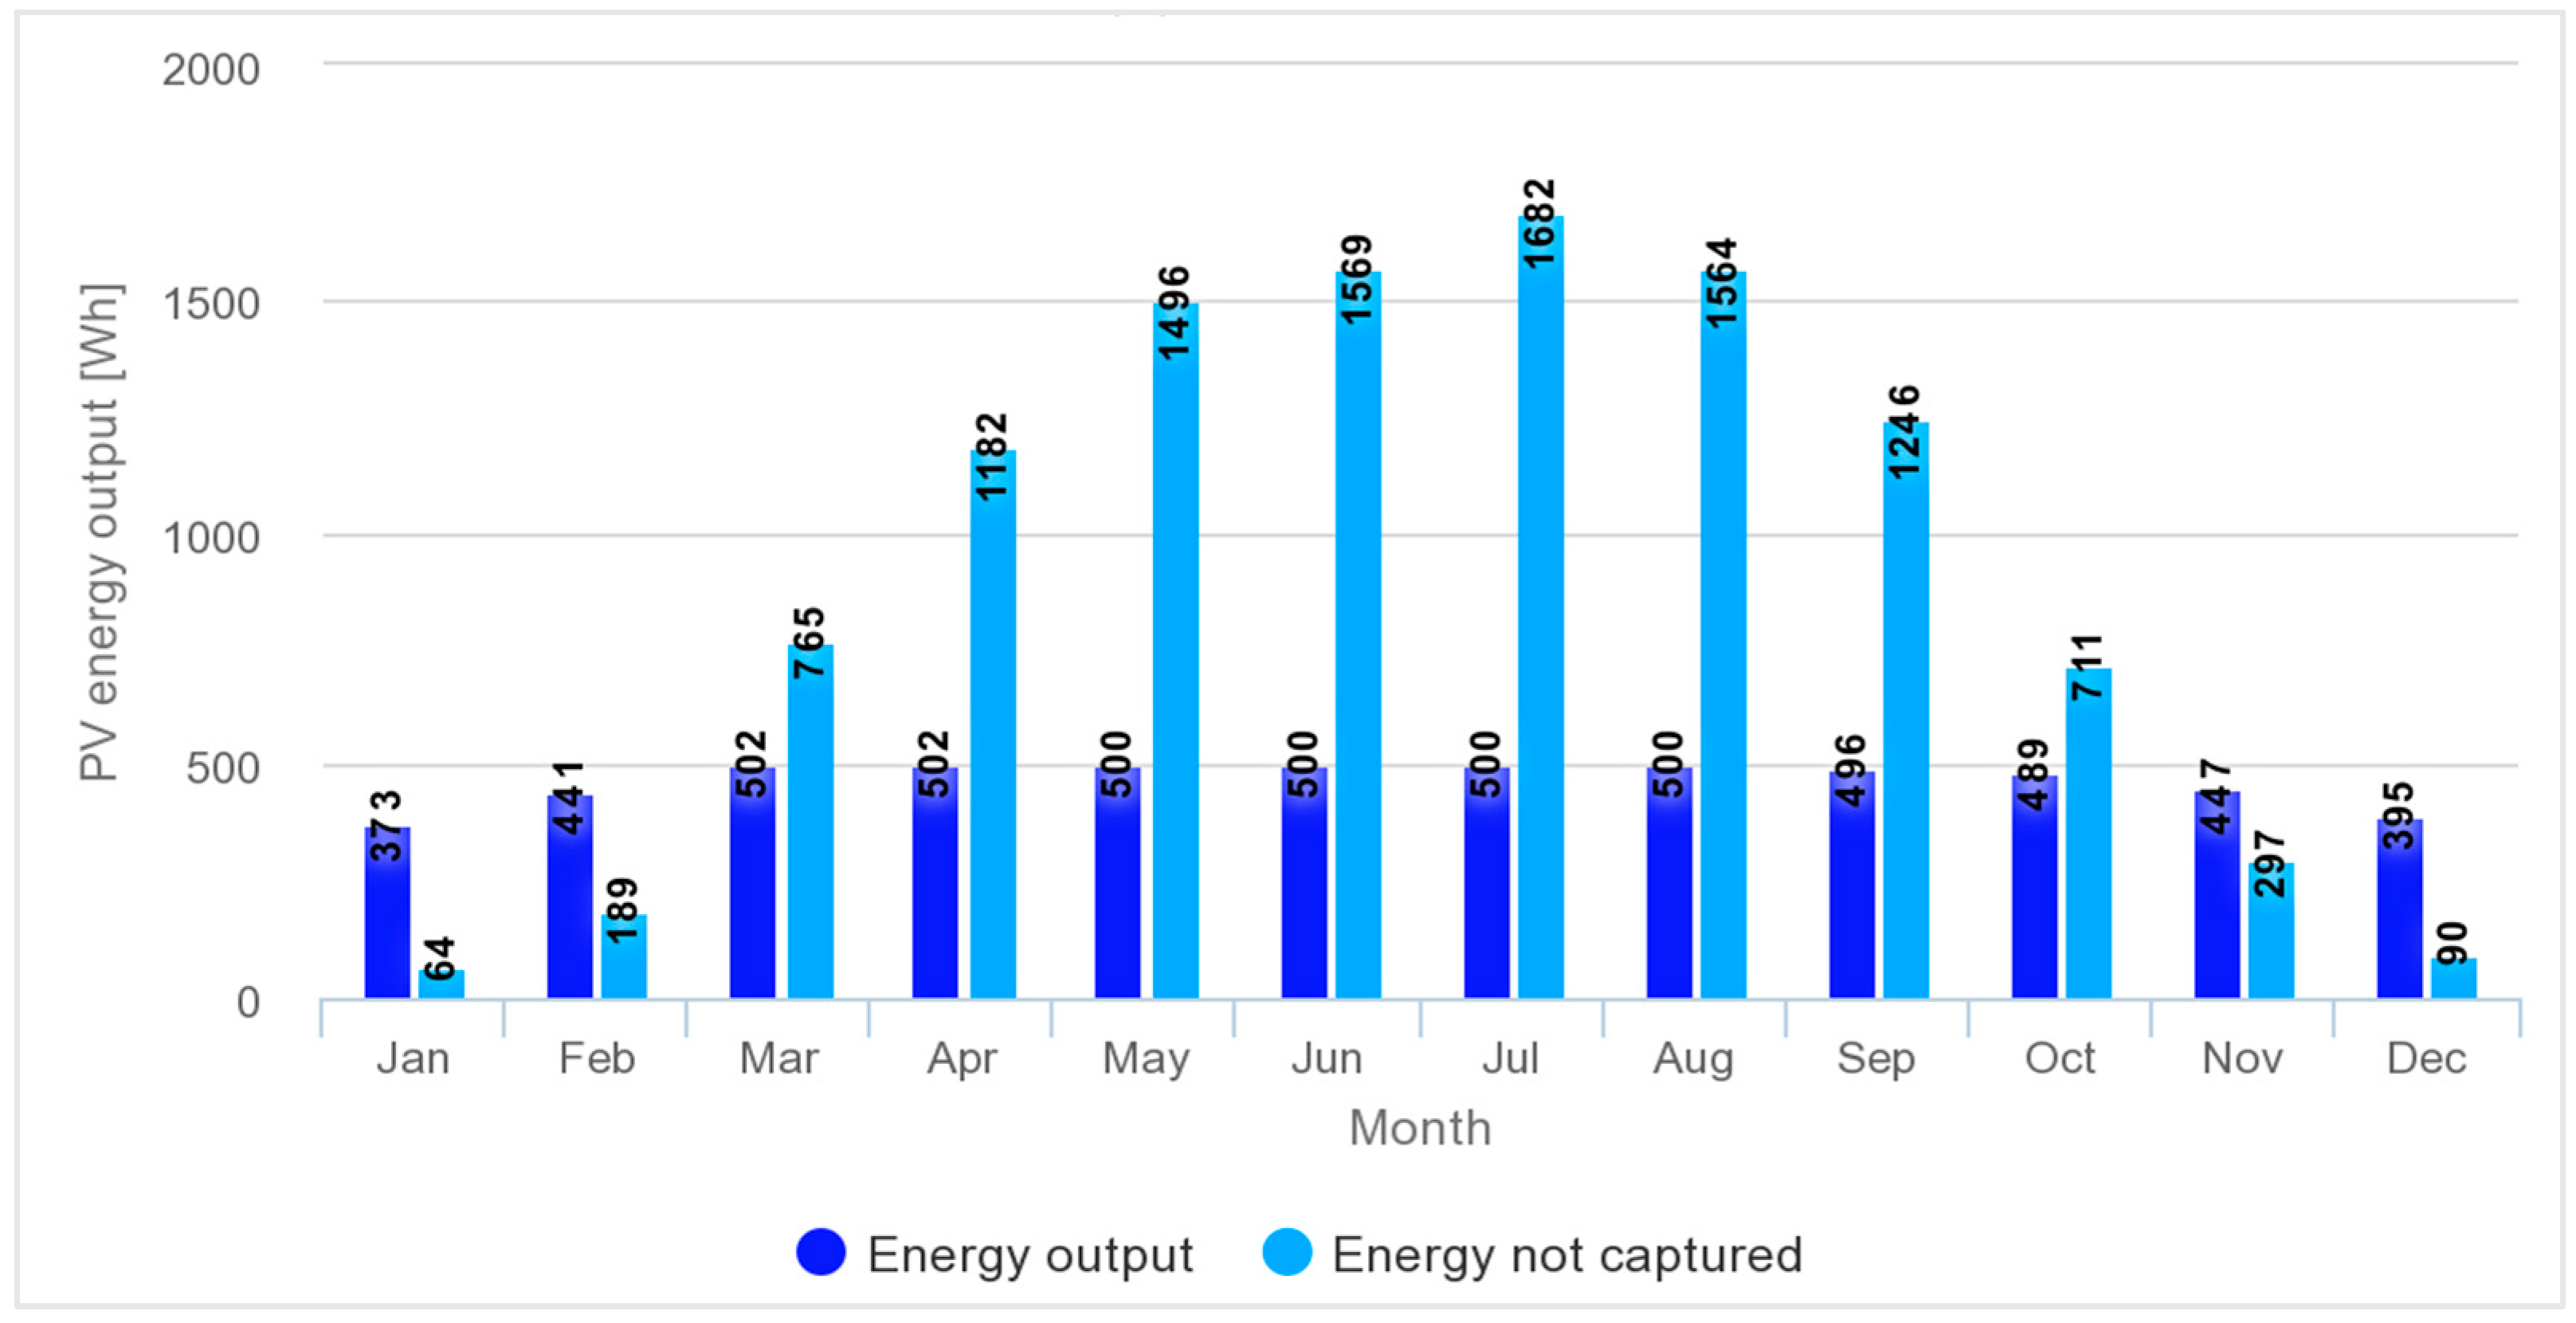
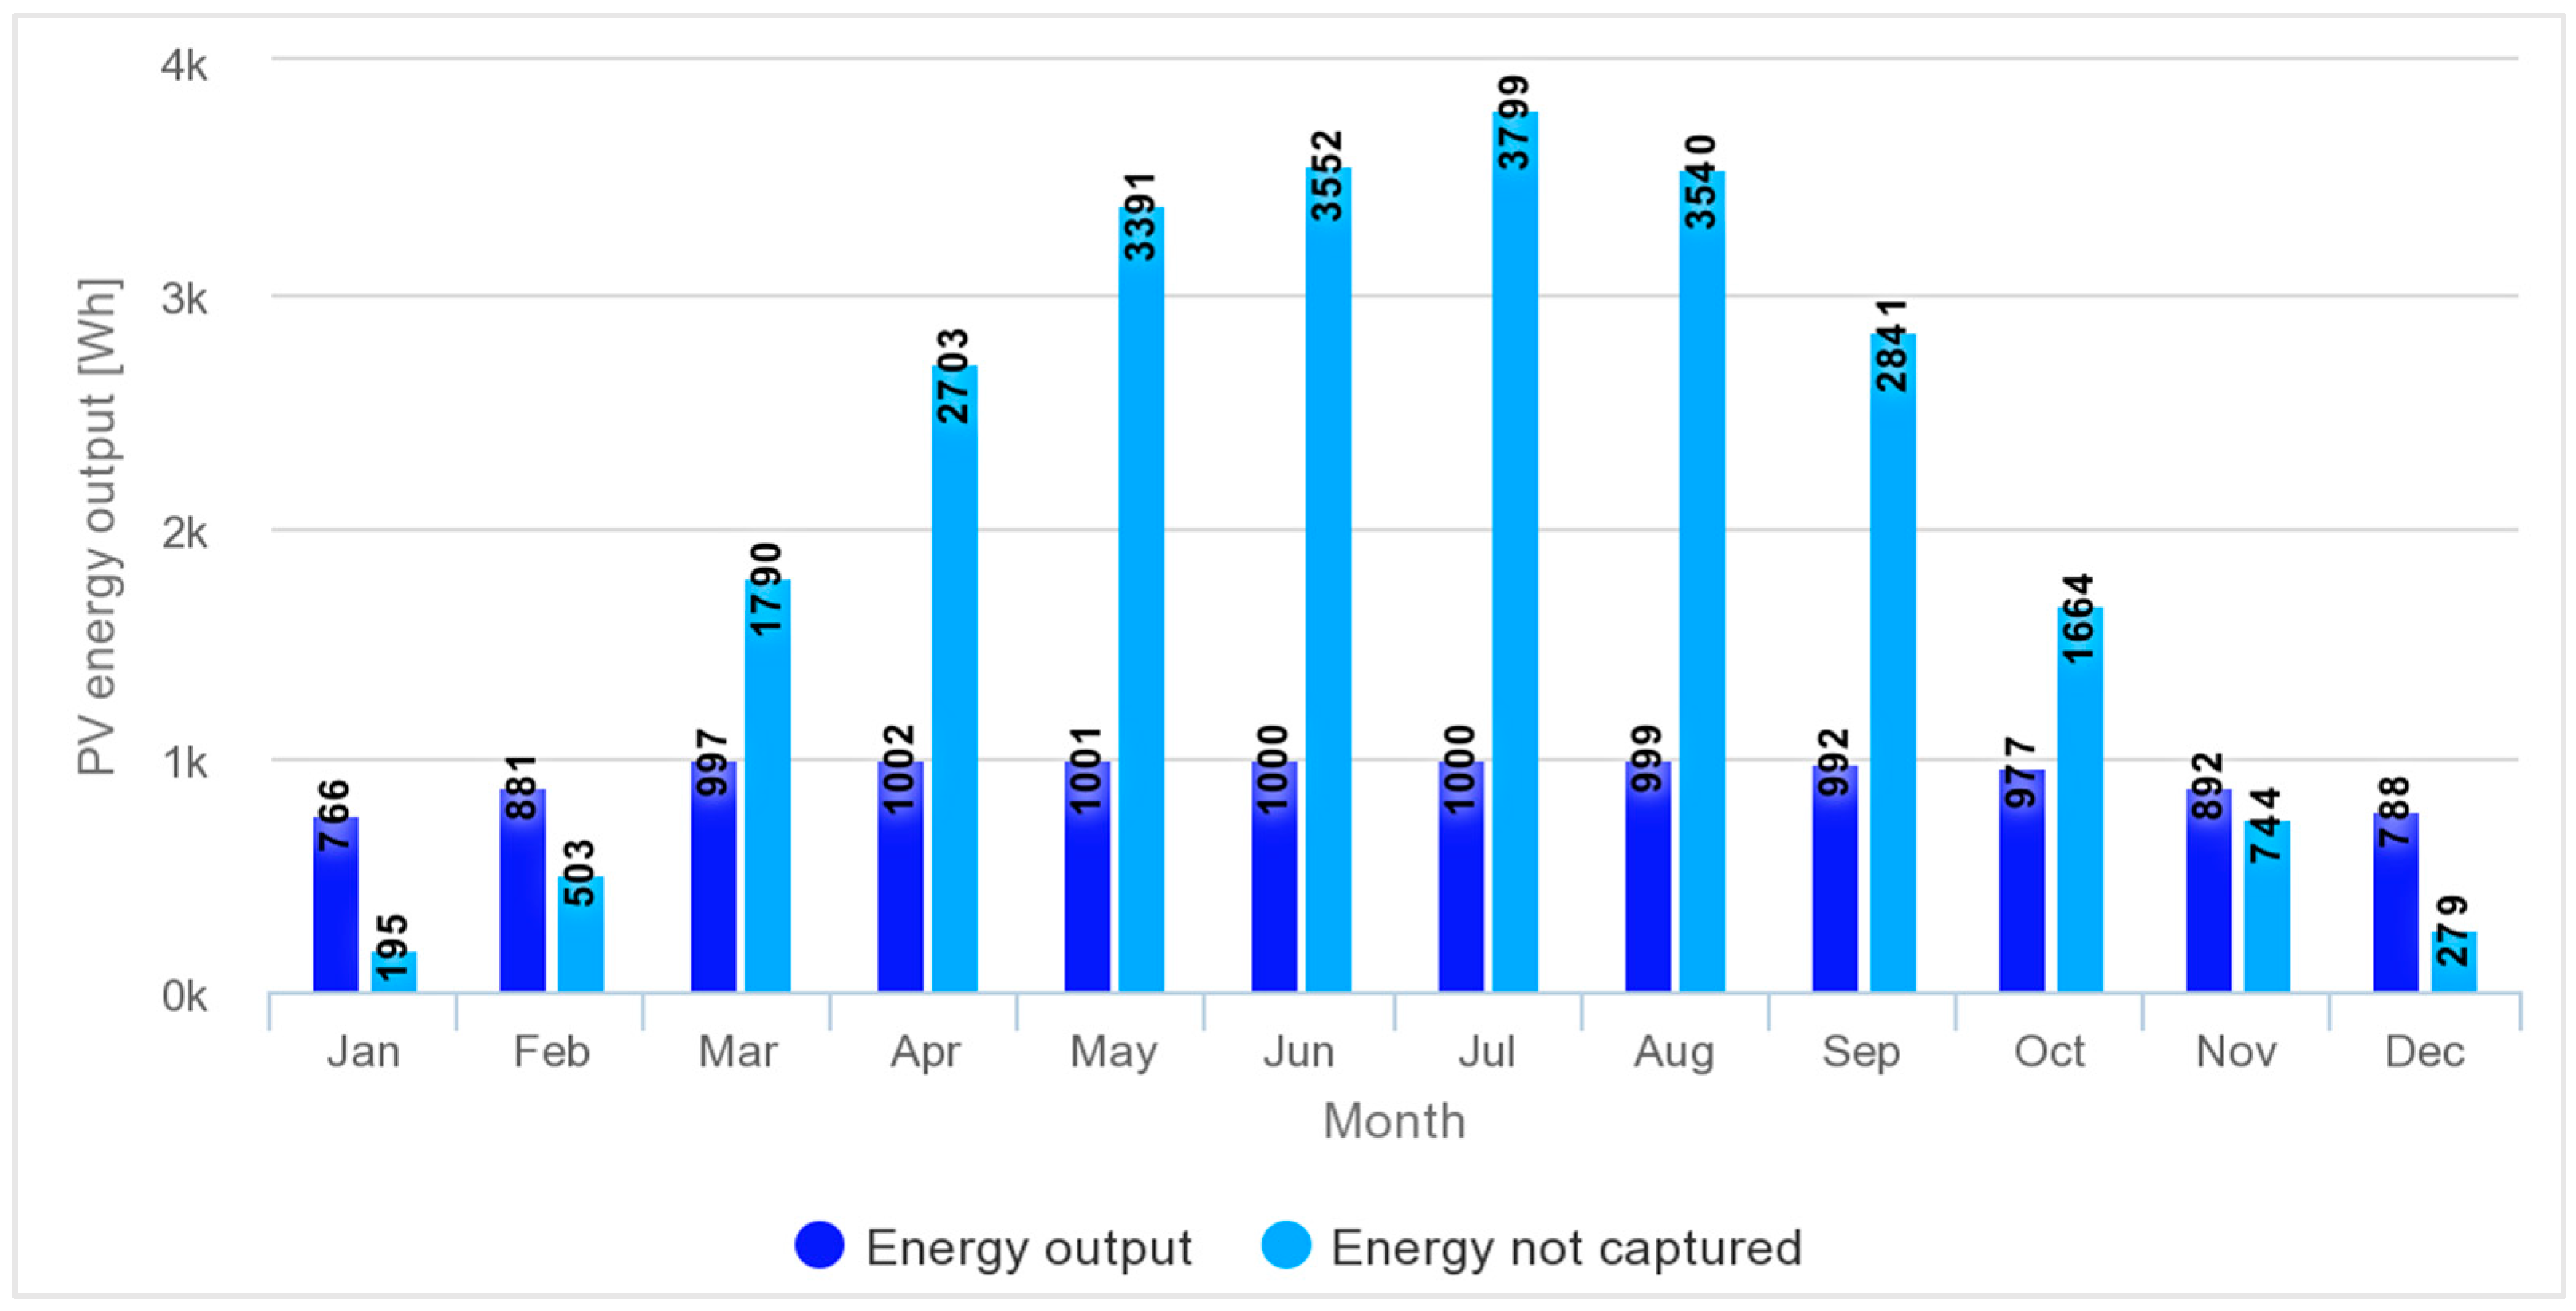
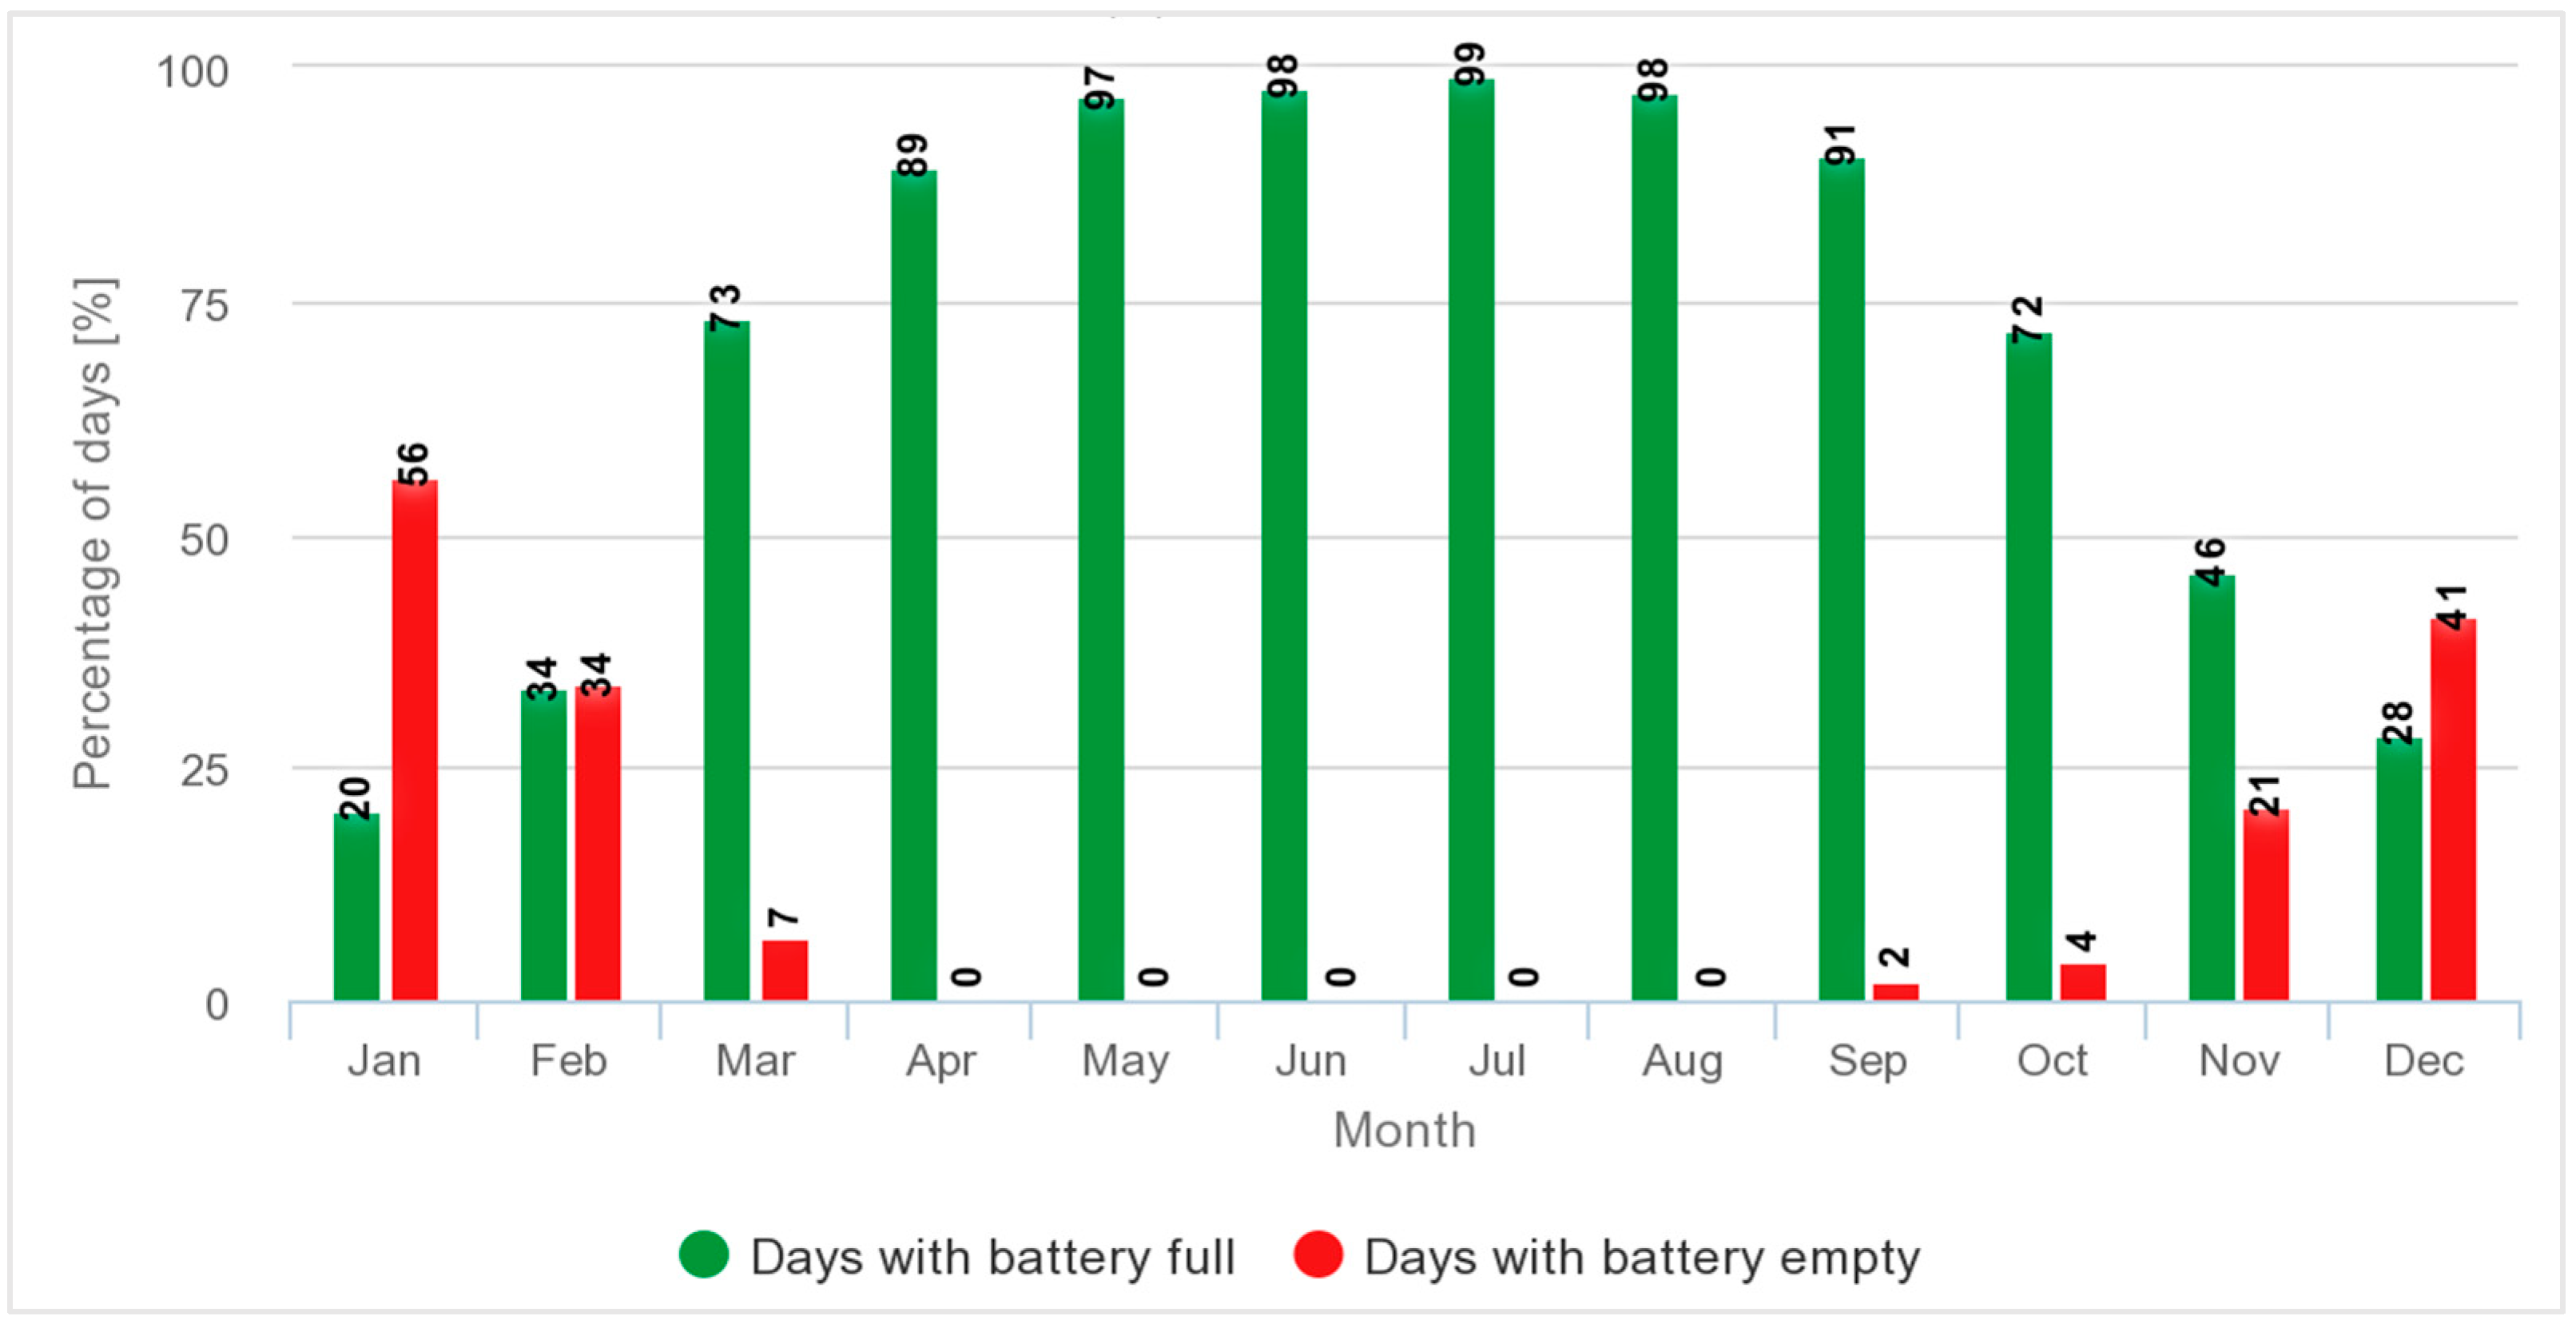
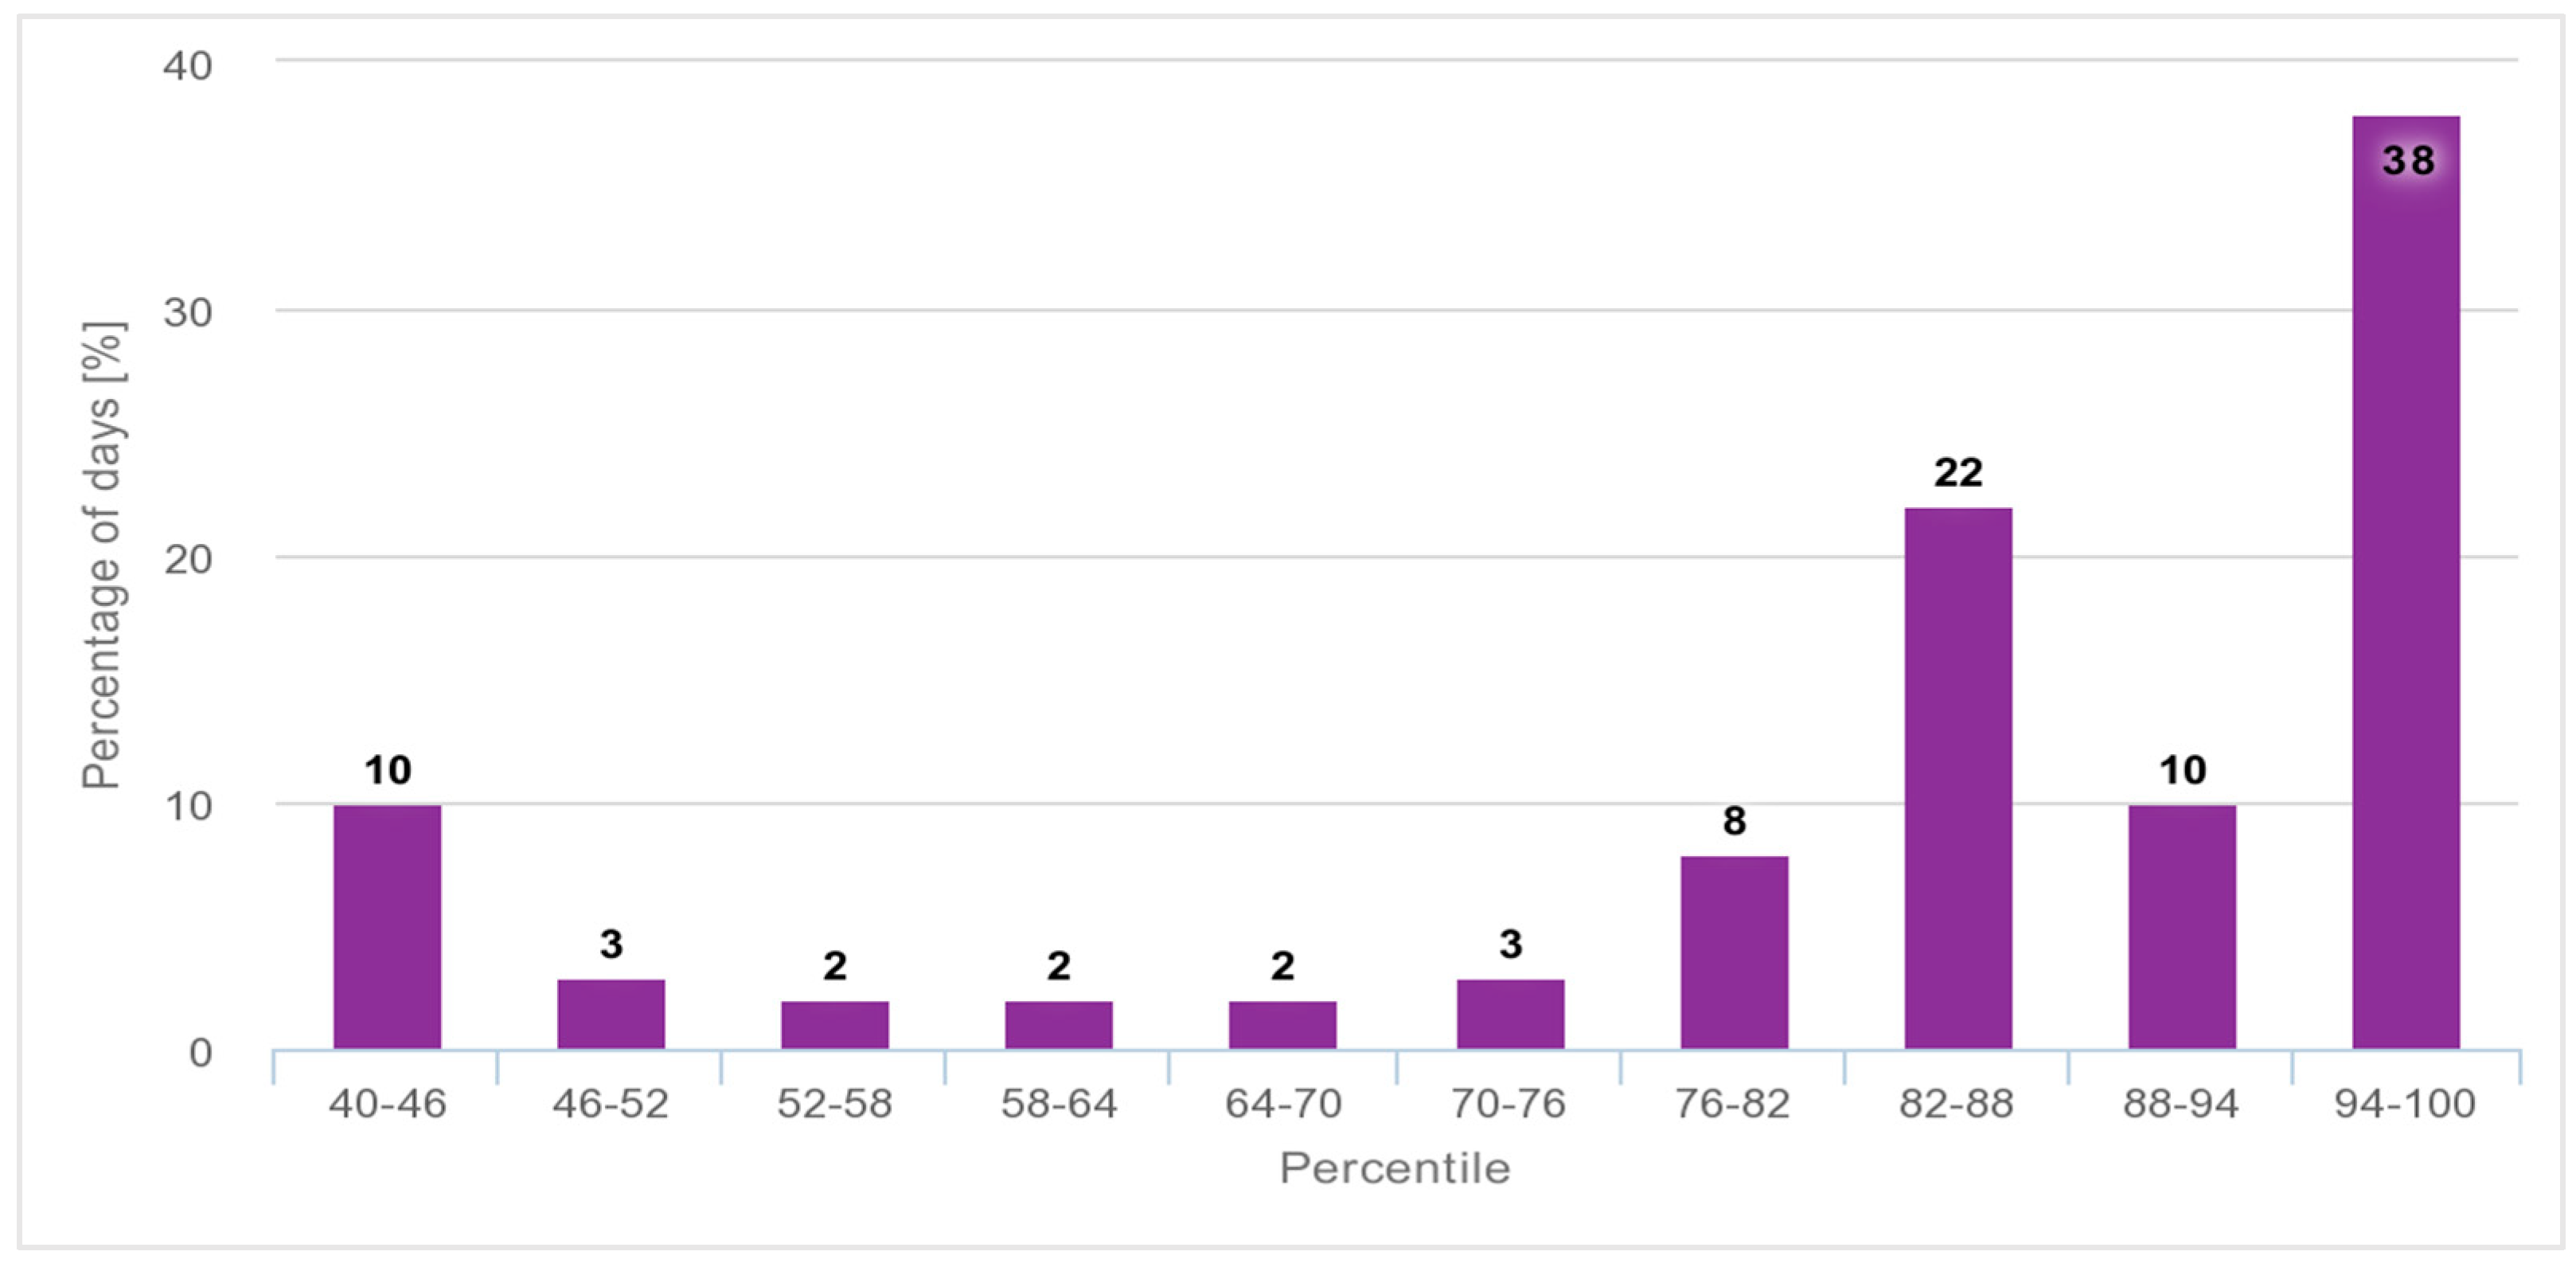
In terms of energy production, battery performance, and discharge state, the results are detailed in the following images—Figure 14, Figure 15 and Figure 16 and in Appendix A.
During the present study, load was considered as a constant value without considering the dynamic impact of factors such as seasonal variations in nighttime lighting duration and power changes due to appliance aging on the load.
Analyzing the data from Figure 9, Figure 12 and Figure 15, the installation of two photovoltaic panels with total powers of 1100 Wp, 600 Wp, and 500 Wp generates an average production deficit of 425.96 Wh, 269.27 Wh, and 224.39 Wh, respectively, while the average uncaptured energy is 2963.16 Wh, 1613.40 Wh, and 1344.50 Wh.
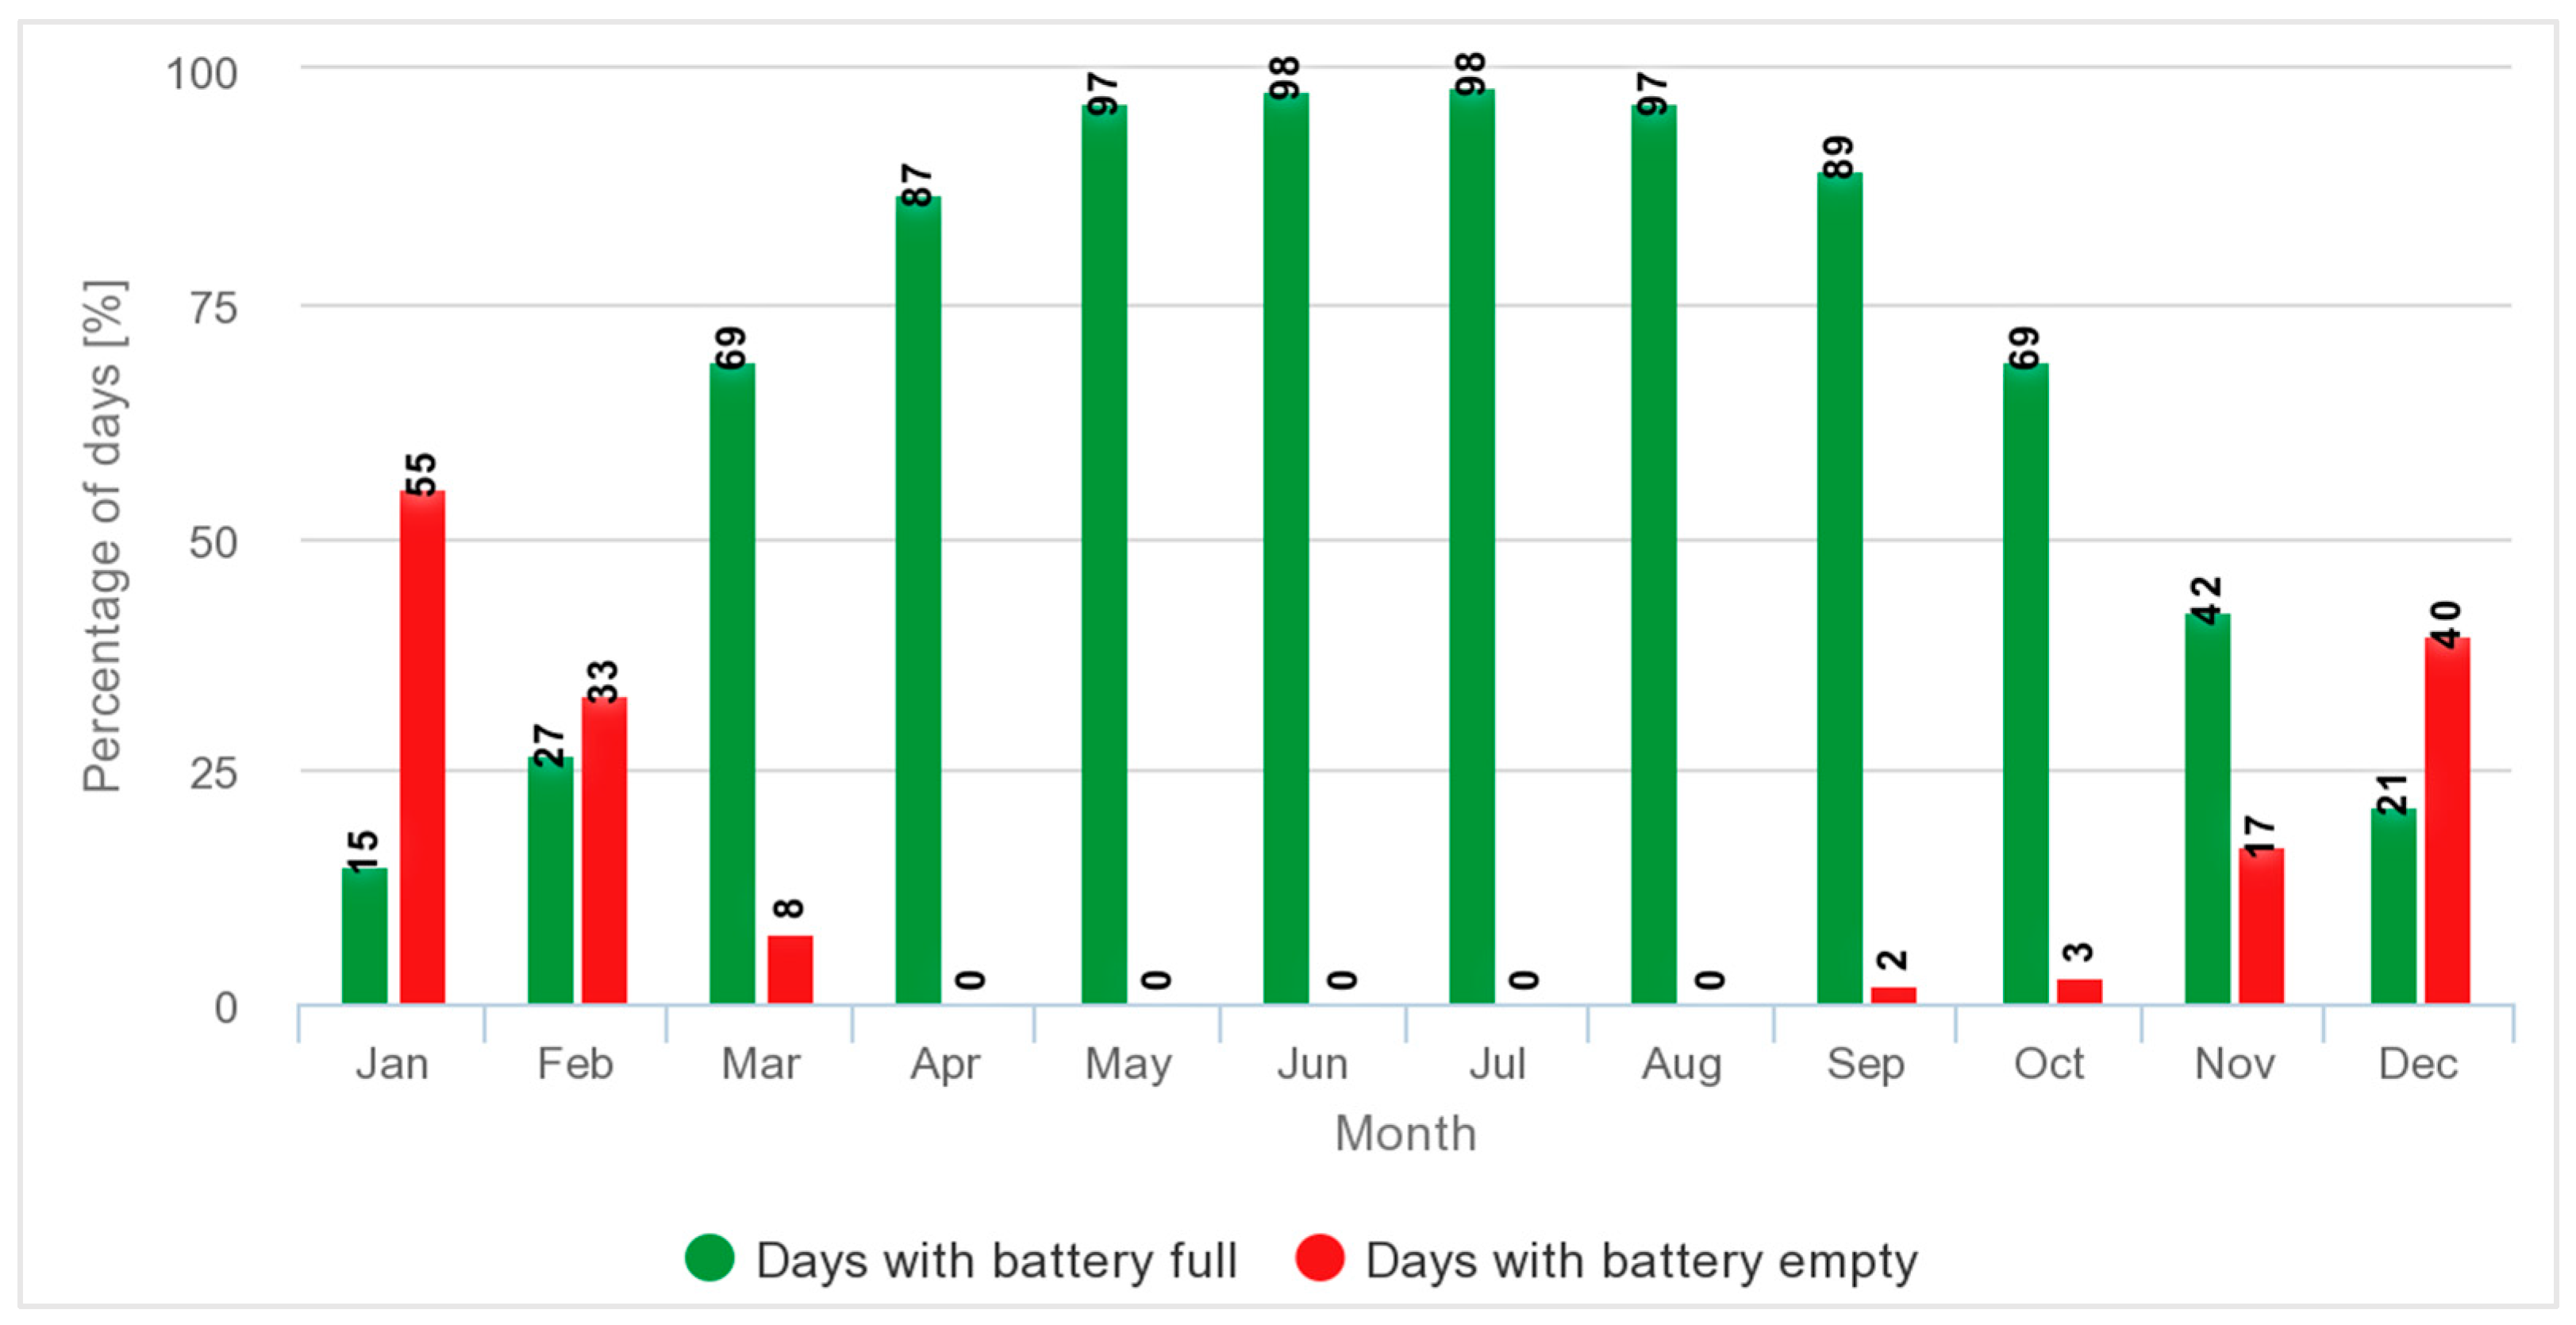
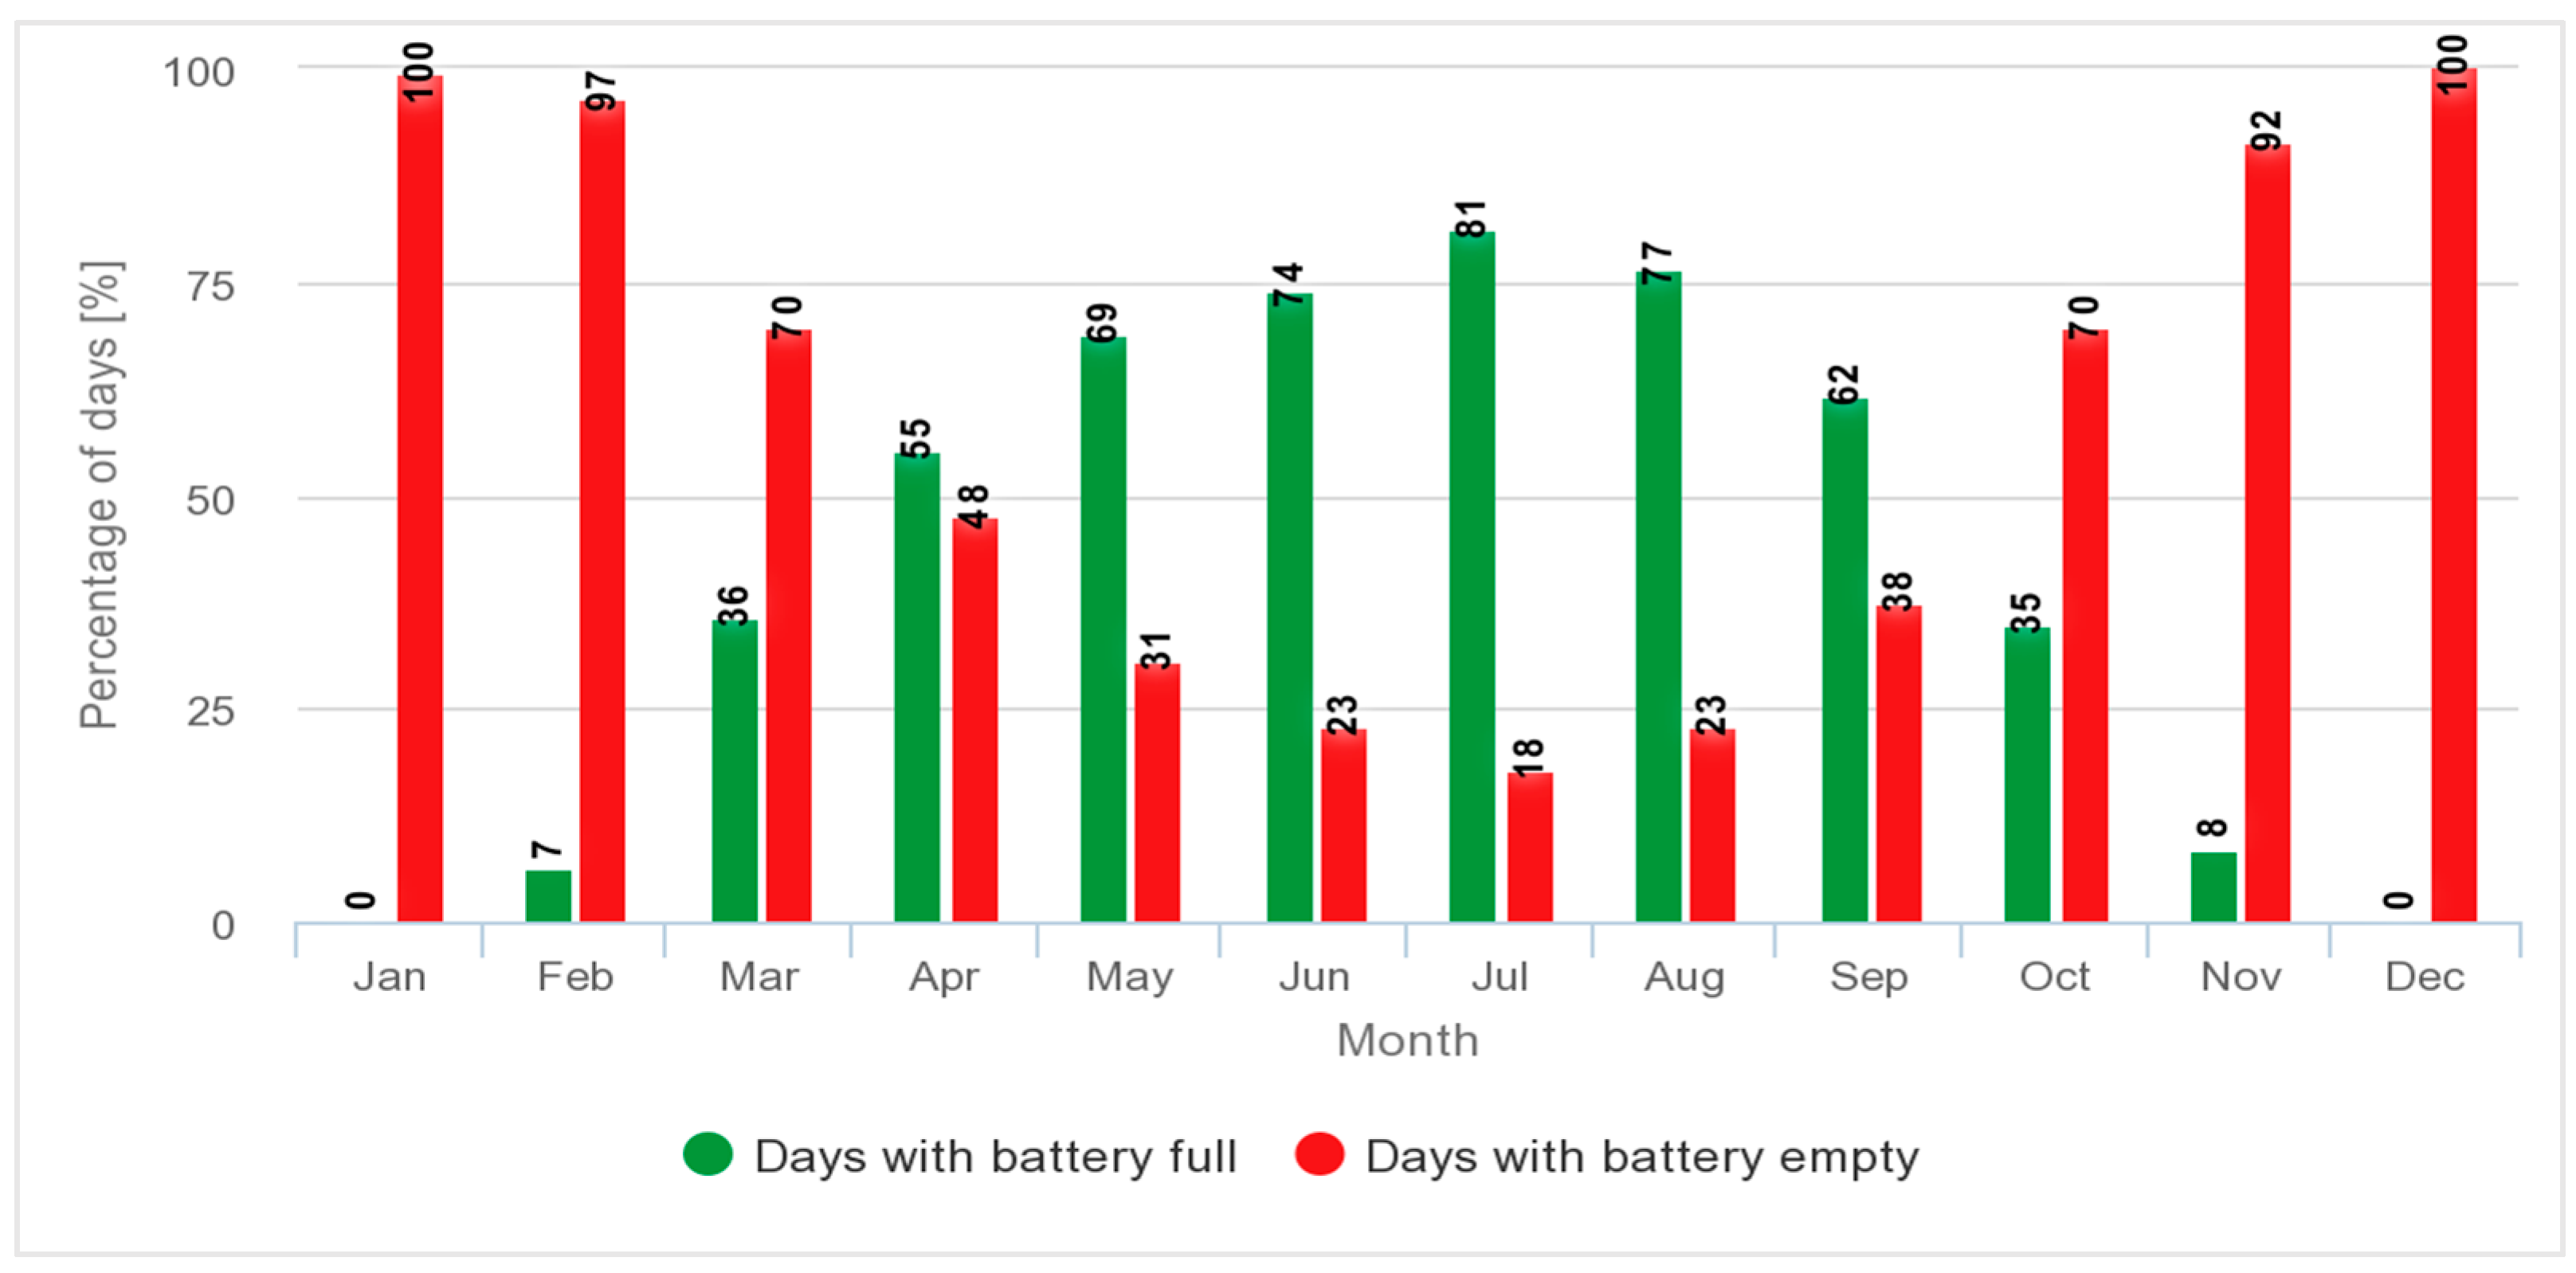
From Figure 10, Figure 13 and Figure 16, it is evident that in the months of January, February, November, and December, the power supply for public lighting at night cannot be guaranteed every day, as there are periods when the batteries do not charge completely. This situation is also confirmed by the data from Figure 9, Figure 12 and Figure 15, which indicate that during the same time of the year, the electricity production is insufficient to ensure the operation of the system.
Analyzing the data from Figure 11, Figure 14 and Figure 16, the results show that the batteries are fully charged in 70.57%, 67.53%, and 67.53% of the days in a year, while in 13.69%, 13.12%, and 13.12% of the days they are discharged. Under these conditions, public lighting cannot be ensured for approximately 50, 48, and 48 days per year, which limits the use of the system only to well-justified cases, considering its importance for road and pedestrian safety.
The energy storage systems, with capacities of 3600 Wh, 2880 Wh, and 2400 Wh, have been sized to ensure the operation of public lighting during the winter season for approximately 1.5 days, with a discharge cutoff limit of 40% for the batteries.

3.3. Analysis of Central ON-GRID Photovoltaic System for Street Lighting

Currently, the technology used in this energy context is traditional [55]. Therefore, an analysis was conducted on the establishment of a photovoltaic power plant designed to cover the electricity consumption of street lighting. The change in production technology is justified from three essential perspectives: technical, economic, and environmental impact. It is proposed to analyze a photovoltaic power plant installed on non-productive agricultural land, located on the outskirts of a locality.
The determination of the performance of the studied photovoltaic system was carried out by monitoring the average and annual energy productions, without energy storage in batteries. The calculation takes into account solar radiation, air temperature, wind speed, and the type of PV module. The user can choose how the modules are mounted, either on a standalone support or integrated into a building surface. By simulating in PVGIS, the optimal tilt and orientation that maximizes annual energy production were also calculated.
For this case, the PV solar system includes the following main components:
  • Photovoltaic modules: composed of 144 monocrystalline photovoltaic cells and have a nominal unit power of 450 Wp. In the installation, 342 photovoltaic modules will be mounted to cover the electricity consumption of the analyzed public lighting;
  • Power inverter: three-phase unidirectional with a nominal unit power of 60.00 kW (alternating current). Three-phase unidirectional power inverters will be installed in the system—three pieces;
  • Mounting structure for photovoltaic modules: metal parts made of OL, sized and designed for the specific conditions of the project;
  • Electrical panel: within the photovoltaic solar system, it provides switching devices and protective and/or measuring devices specific to photovoltaic systems. An electrical panel for the power plant will be installed in the system (TPV);
  • Junction box for the PV arrays: a housing in which all the PV strings are electrically connected and where protection devices are located. In the installation, 22 junction boxes for the PV arrays will be mounted;
  • The electrical cable networks within the photovoltaic solar include the energy cables laid in metal conduits up to the connection of the photovoltaic electrical installation to the distribution network of the national energy system;
  • Grounding system: conductors and components used to establish equipotential bonds between the metallic elements associated with the photovoltaic solar installation and the conductors and components connecting to the grounding electrode of the metallic elements related to the photovoltaic solar system;
  • Low-voltage electrical installation: data cables and equipment associated with the remote monitoring of the installed power inverters and the control and monitoring system of the installed power inverter.
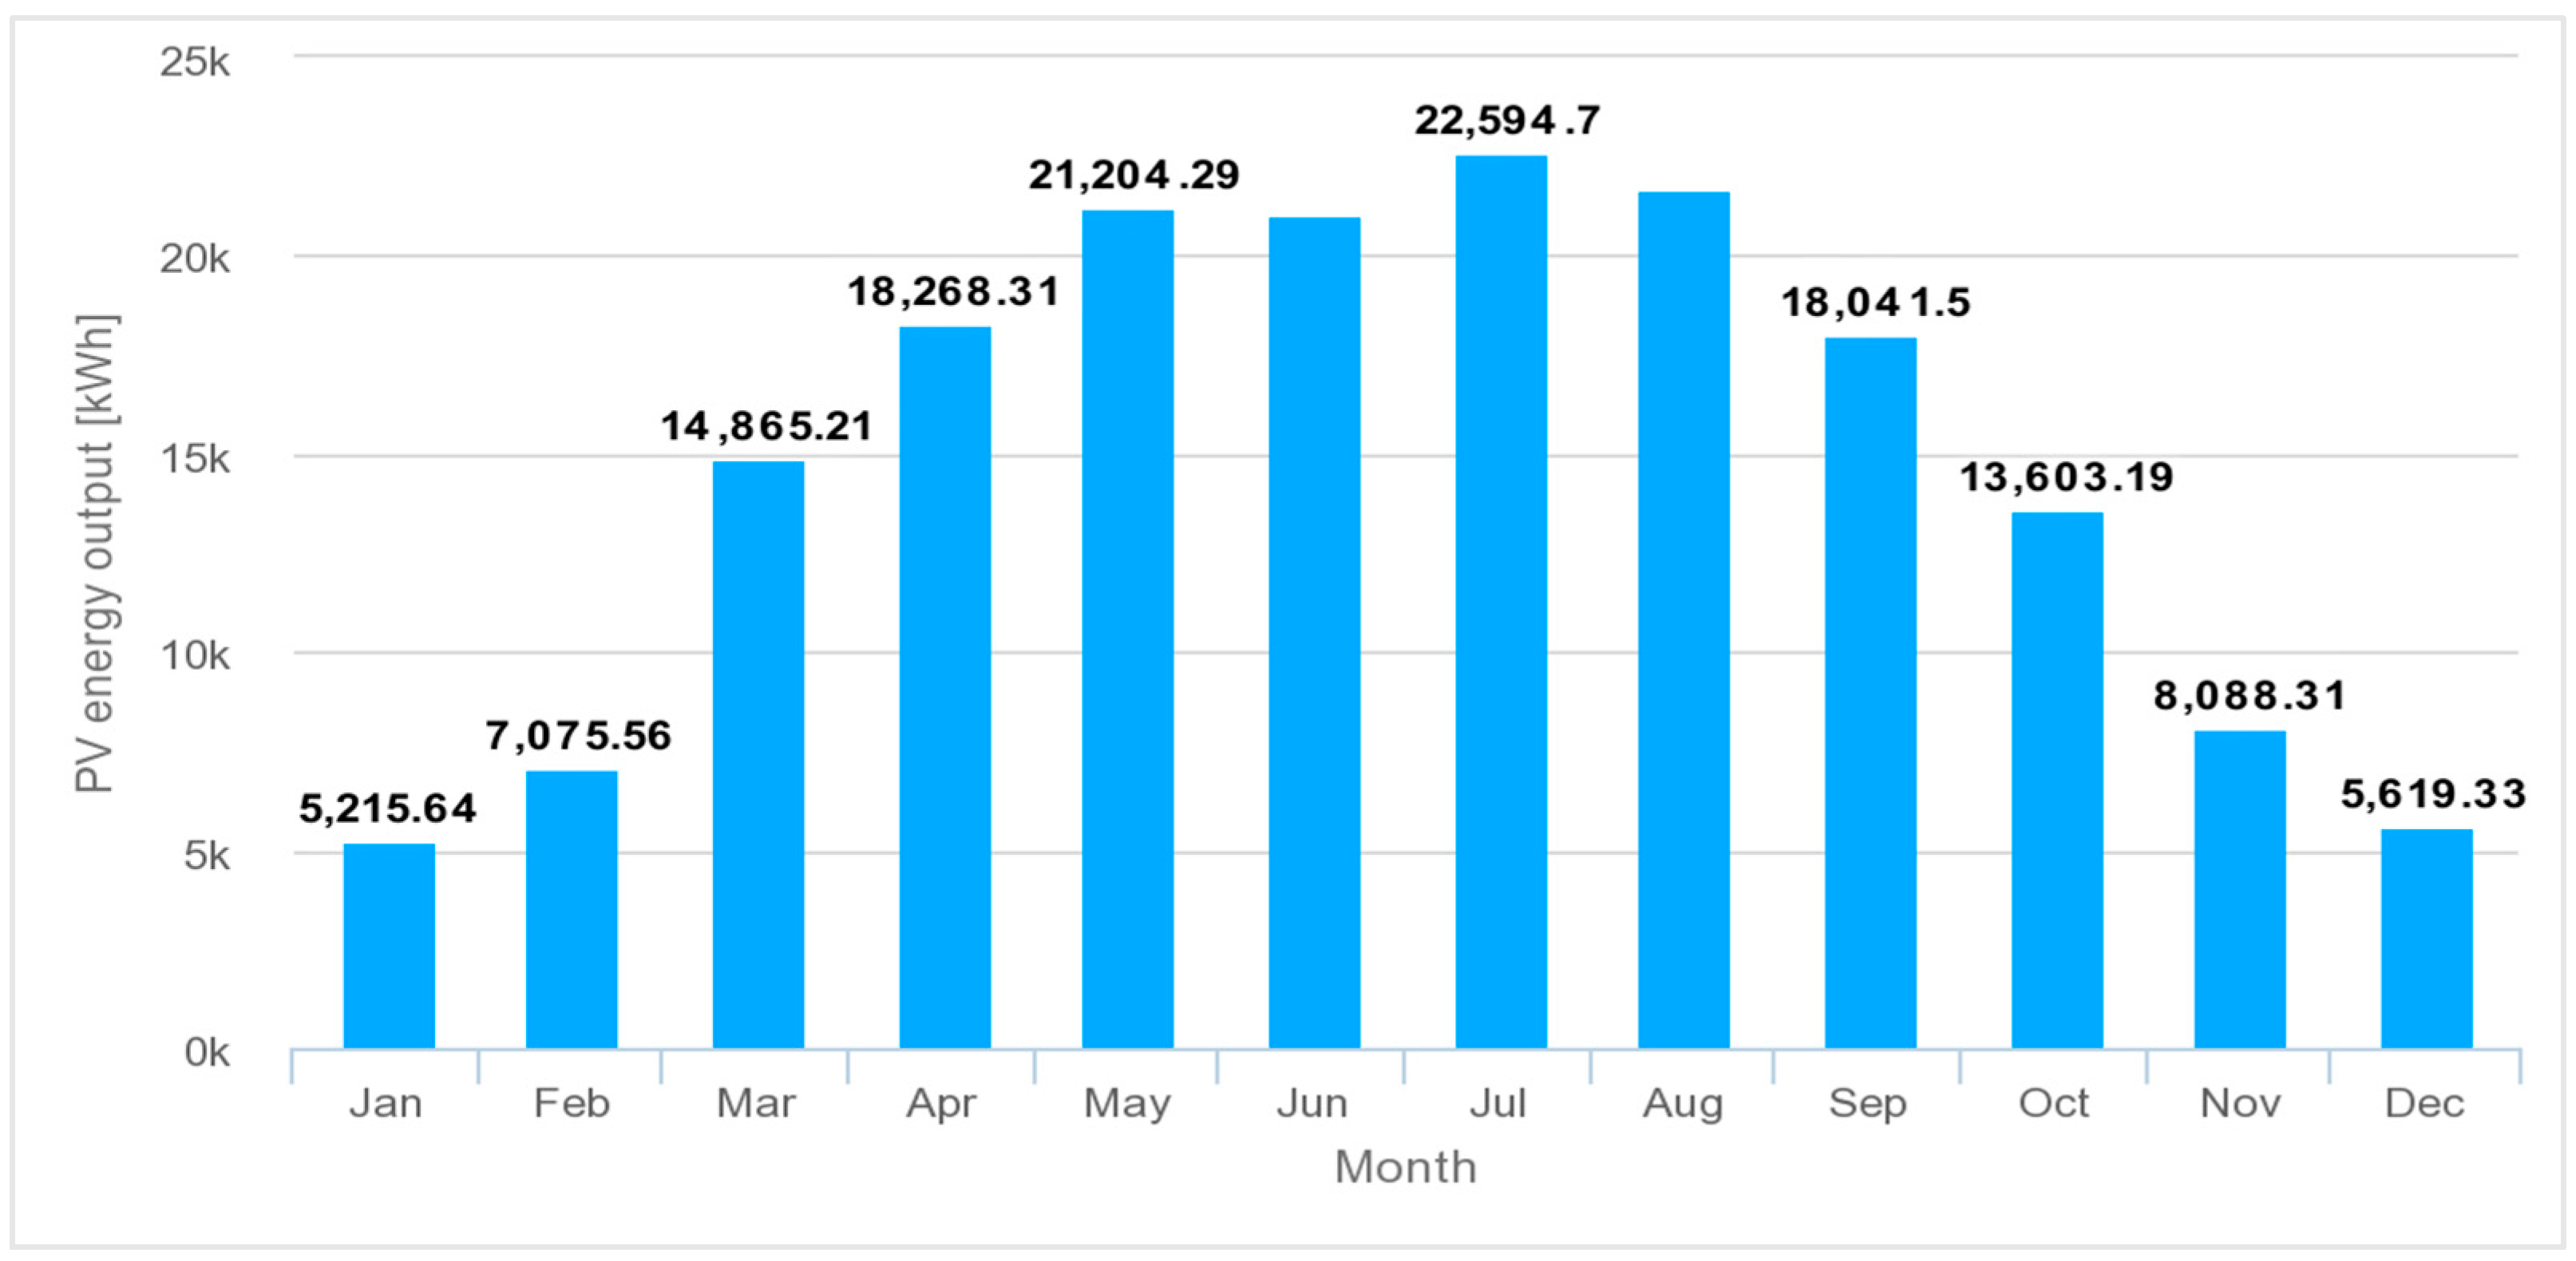
The proposed photovoltaic power plant has a capacity of 153.90 [kWp] with an annual electricity production of 177,334.56 [kWh]—Figure 17, covering almost entirely the electricity consumption of the analyzed lighting system.

3.4. Analysis of Using Central HYBRID Photovoltaic Systems for Street Lighting

The photovoltaic system described in Section 3.3 will be studied next as a HYBRID system, as follows:
  • Replacing the three ON-GRID inverters with three HYBRID inverters with the same technical specifications;
  • Implementing an energy storage system composed of 50 B-BOX systems, each including one cabinet and two lithium iron phosphate (LiFePO4) batteries with a battery management system (BMS) for use with an external inverter or charger;
  • Extending the electrical network to connect public lamps to the solar energy source.
Thus, the possibility of using a HYBRID central photovoltaic system that includes photovoltaic panels, batteries, and HYBRID inverters is being analyzed. The photovoltaic system converts solar energy into electrical energy, which can be stored in a set of batteries for use at night or in low-light conditions.
Once energy consumption exceeds the capacity of the batteries, the system automatically switches to the power supply from the grid, which serves as a backup source for supplying street lighting.
The calculation uses information about the daily variation in electricity consumption to simulate the flow of energy to users and into the batteries [45]. The batteries were sized to store the electrical energy necessary for the operation of the lighting device for an average period of one day.
Figure 18 highlights the dependence of the photovoltaic system on the electrical grid power supply, illustrating the automatic switching of the system when the batteries reach a discharge limit of 40% during certain times of the year.
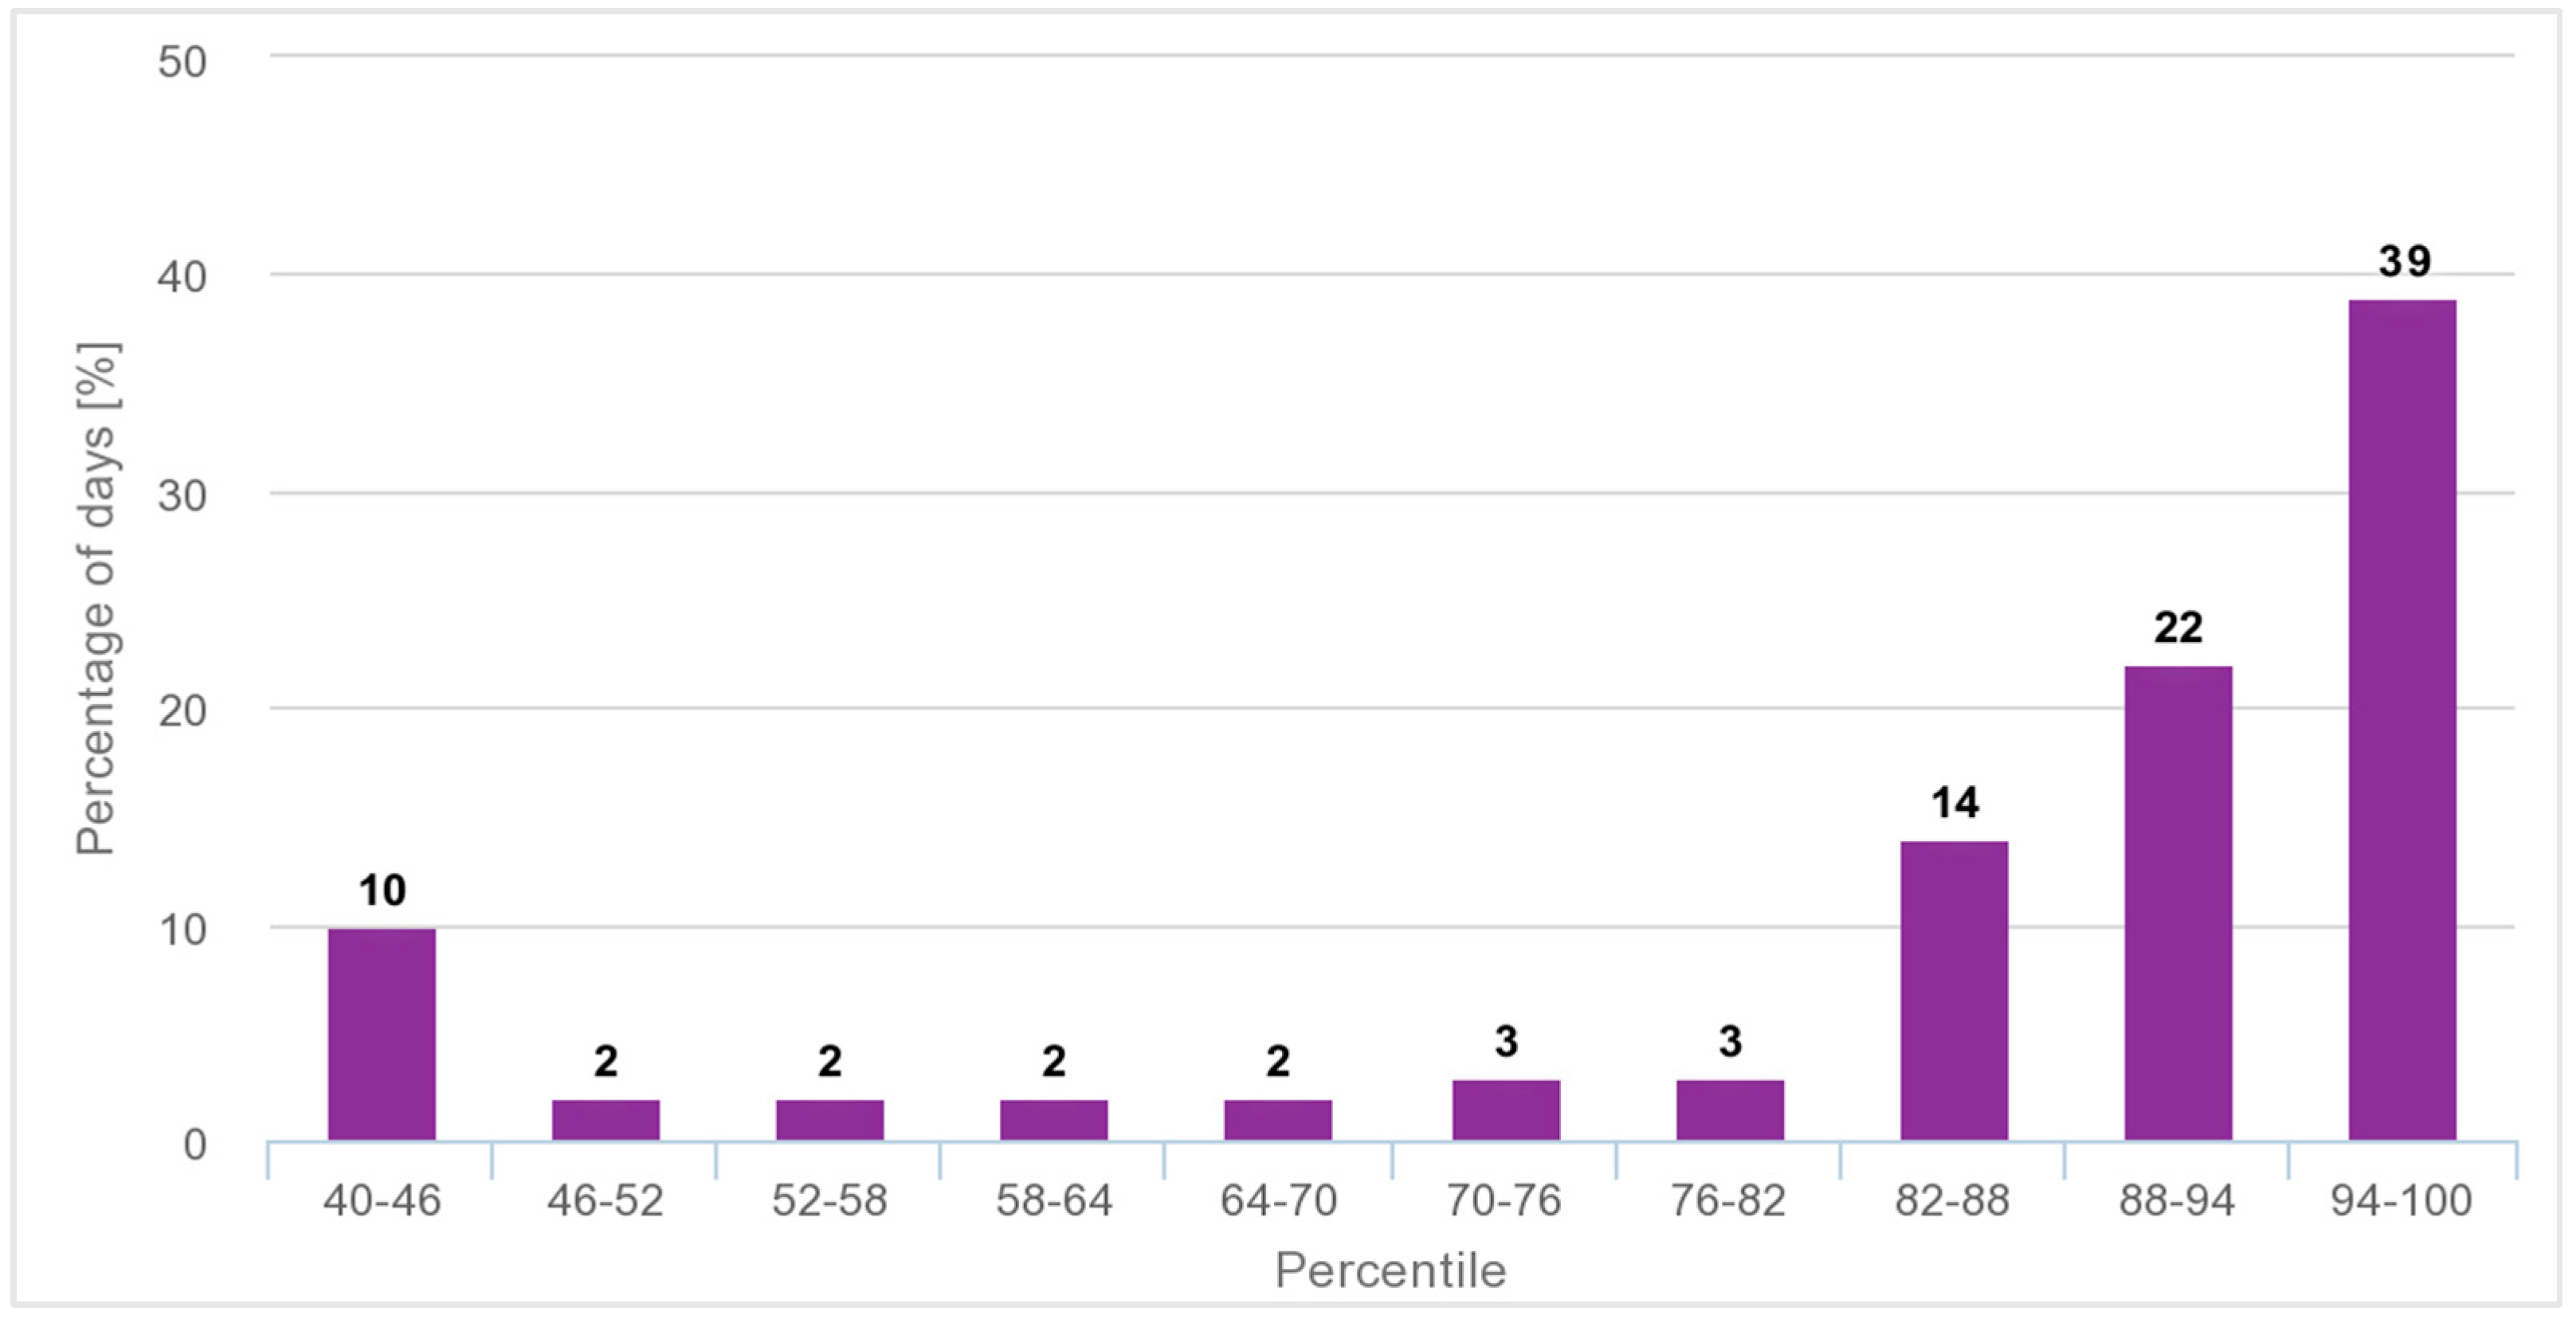
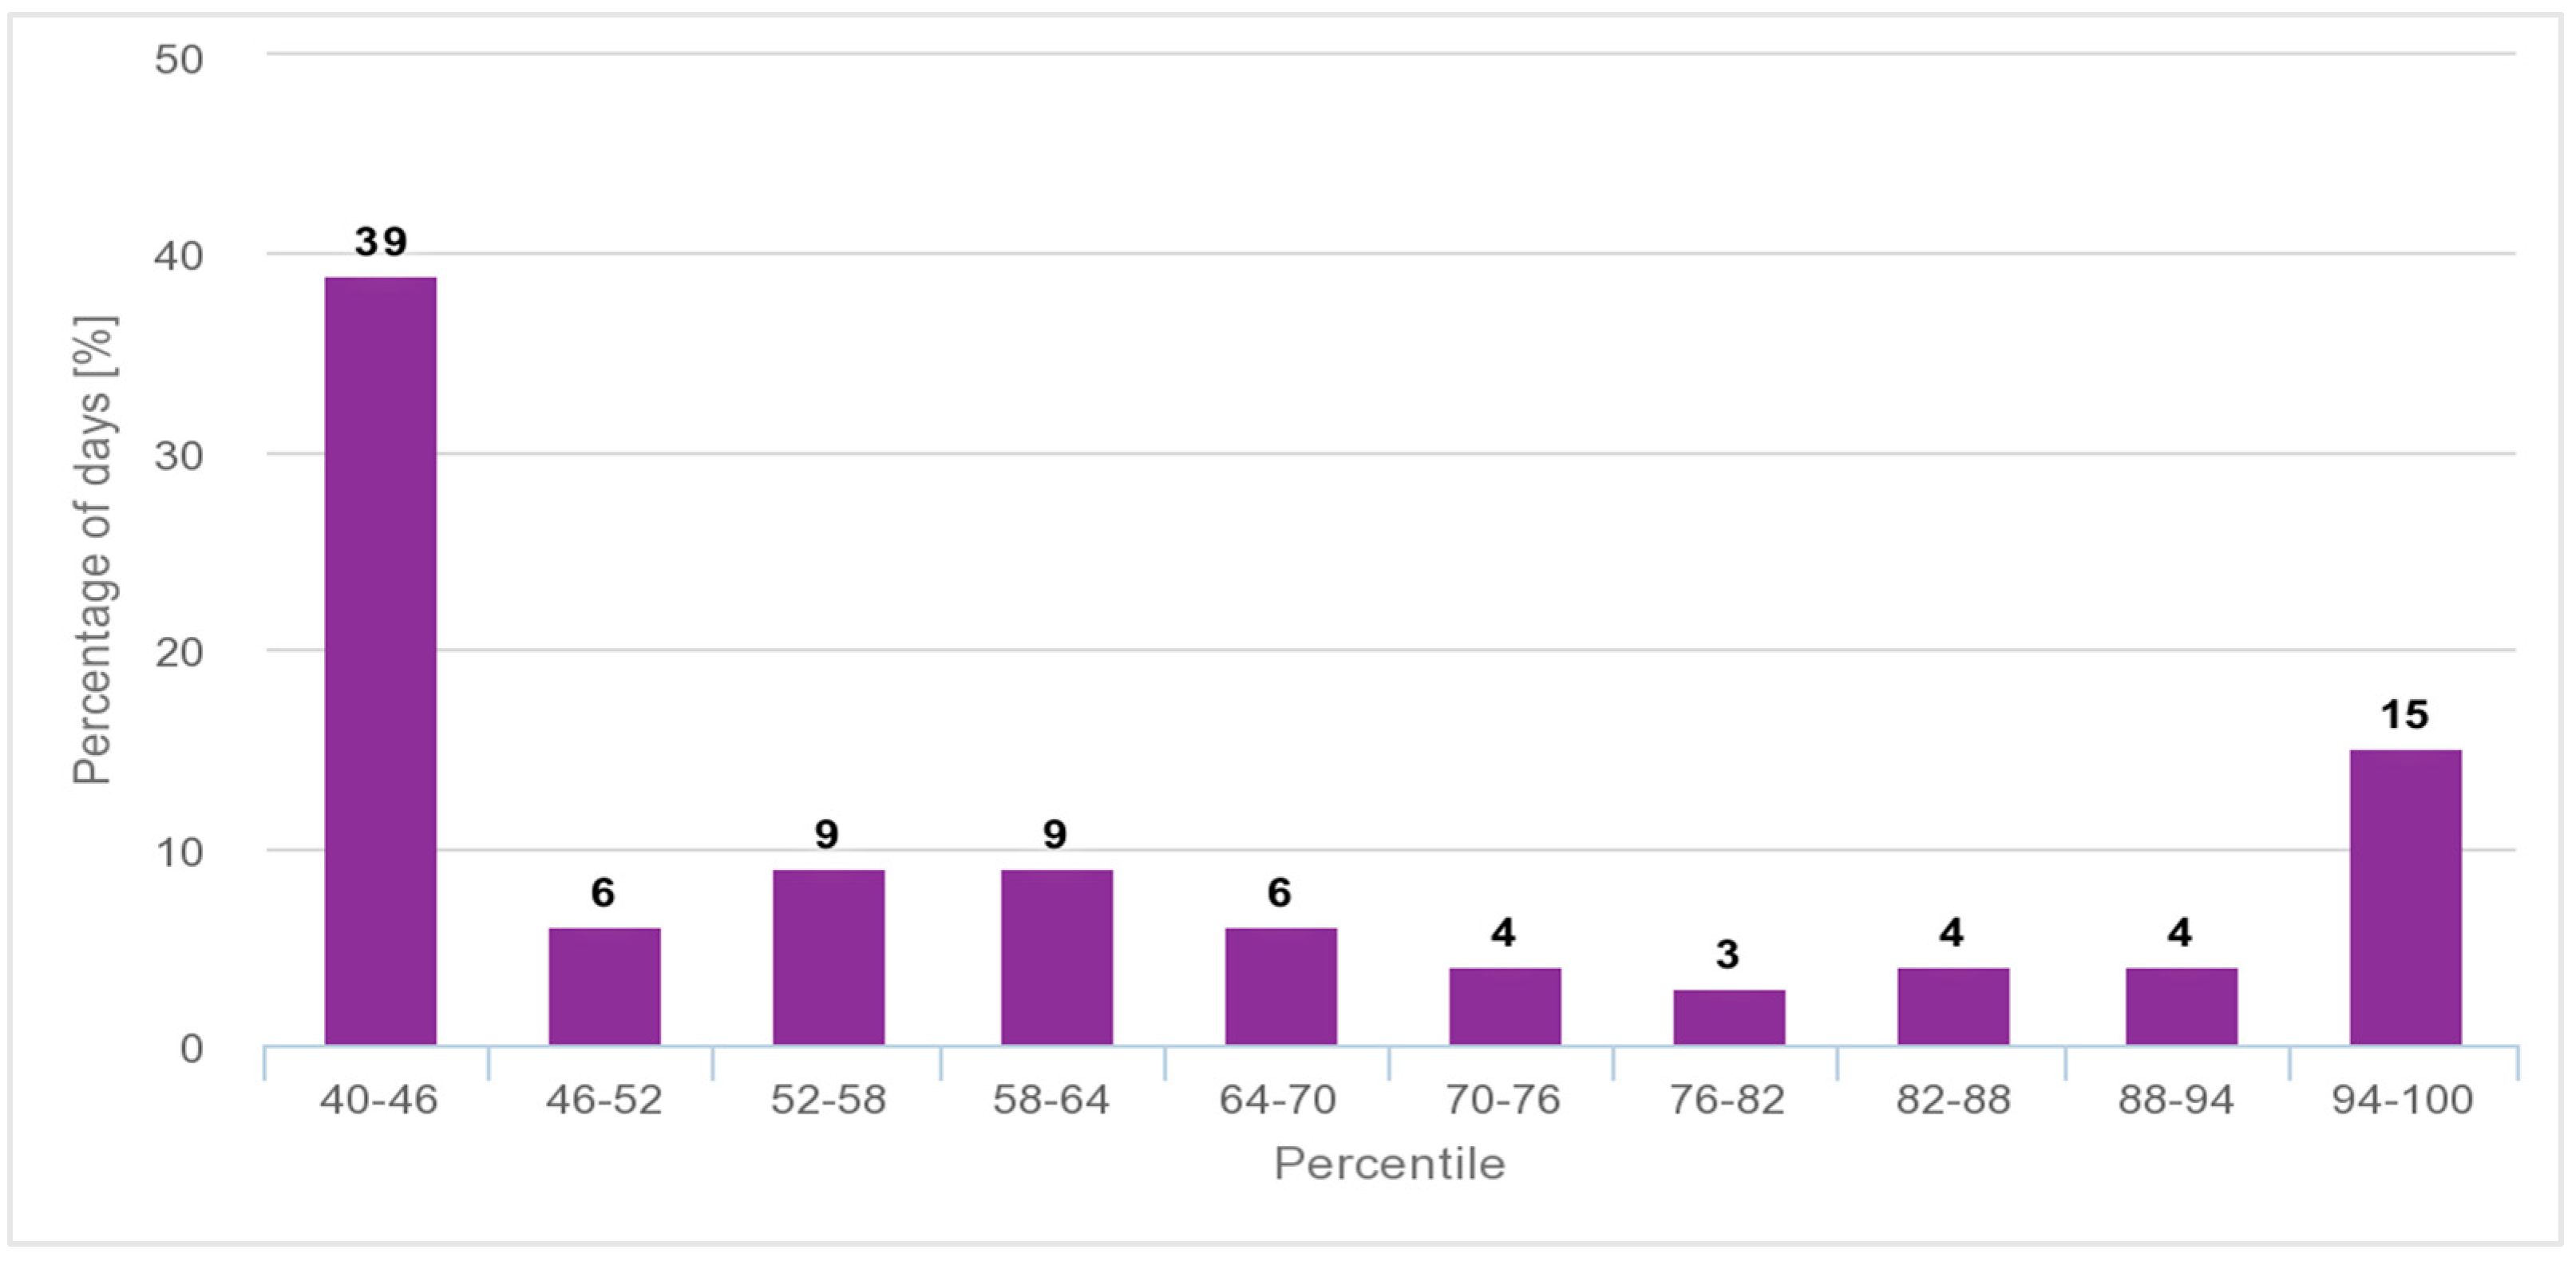
Figure 19 shows that the batteries are fully charged in 42.14% of the days of the year, while in 57.86% of the days, they do not reach maximum capacity. The storage system, with a capacity of 690,000 Wh, ensures the operation of public lighting for approximately one day, with a discharge limit of 40%. Although it does not fully cover nighttime consumption, the use of stored energy helps reduce dependence on conventional energy sources.

3.5. Analysis of Local Photovoltaic System for Street Lighting

3.5.1. Economic Viability Analysis

The estimated value of the project for a total of 726 autonomous photovoltaic poles is presented below in Table 12. The average total price per autonomous photovoltaic pole was estimated at EUR 1750.92, including VAT.

3.5.2. Calculation of Economic Efficiency

The electricity savings over a 20-year period were determined, and a comparison between expenses and revenues was made, taking into account system maintenance and the necessary battery replacements every 7 years [55]. The weighted average electricity price for the year 2024 in Romania was 0.26 Euro/kWh [56]. The recommended energy efficiency measures are relevant to the beneficiary’s activity if they can be quantified in monetary terms or energy savings. In this regard, considering the mathematical model for assessing the economic efficiency of the proposed solution, the energy savings for the energy efficiency measures were estimated. During the present analysis, the soft costs that may distort investment comparison were neglected, considering the large scale of the systems and study interval.
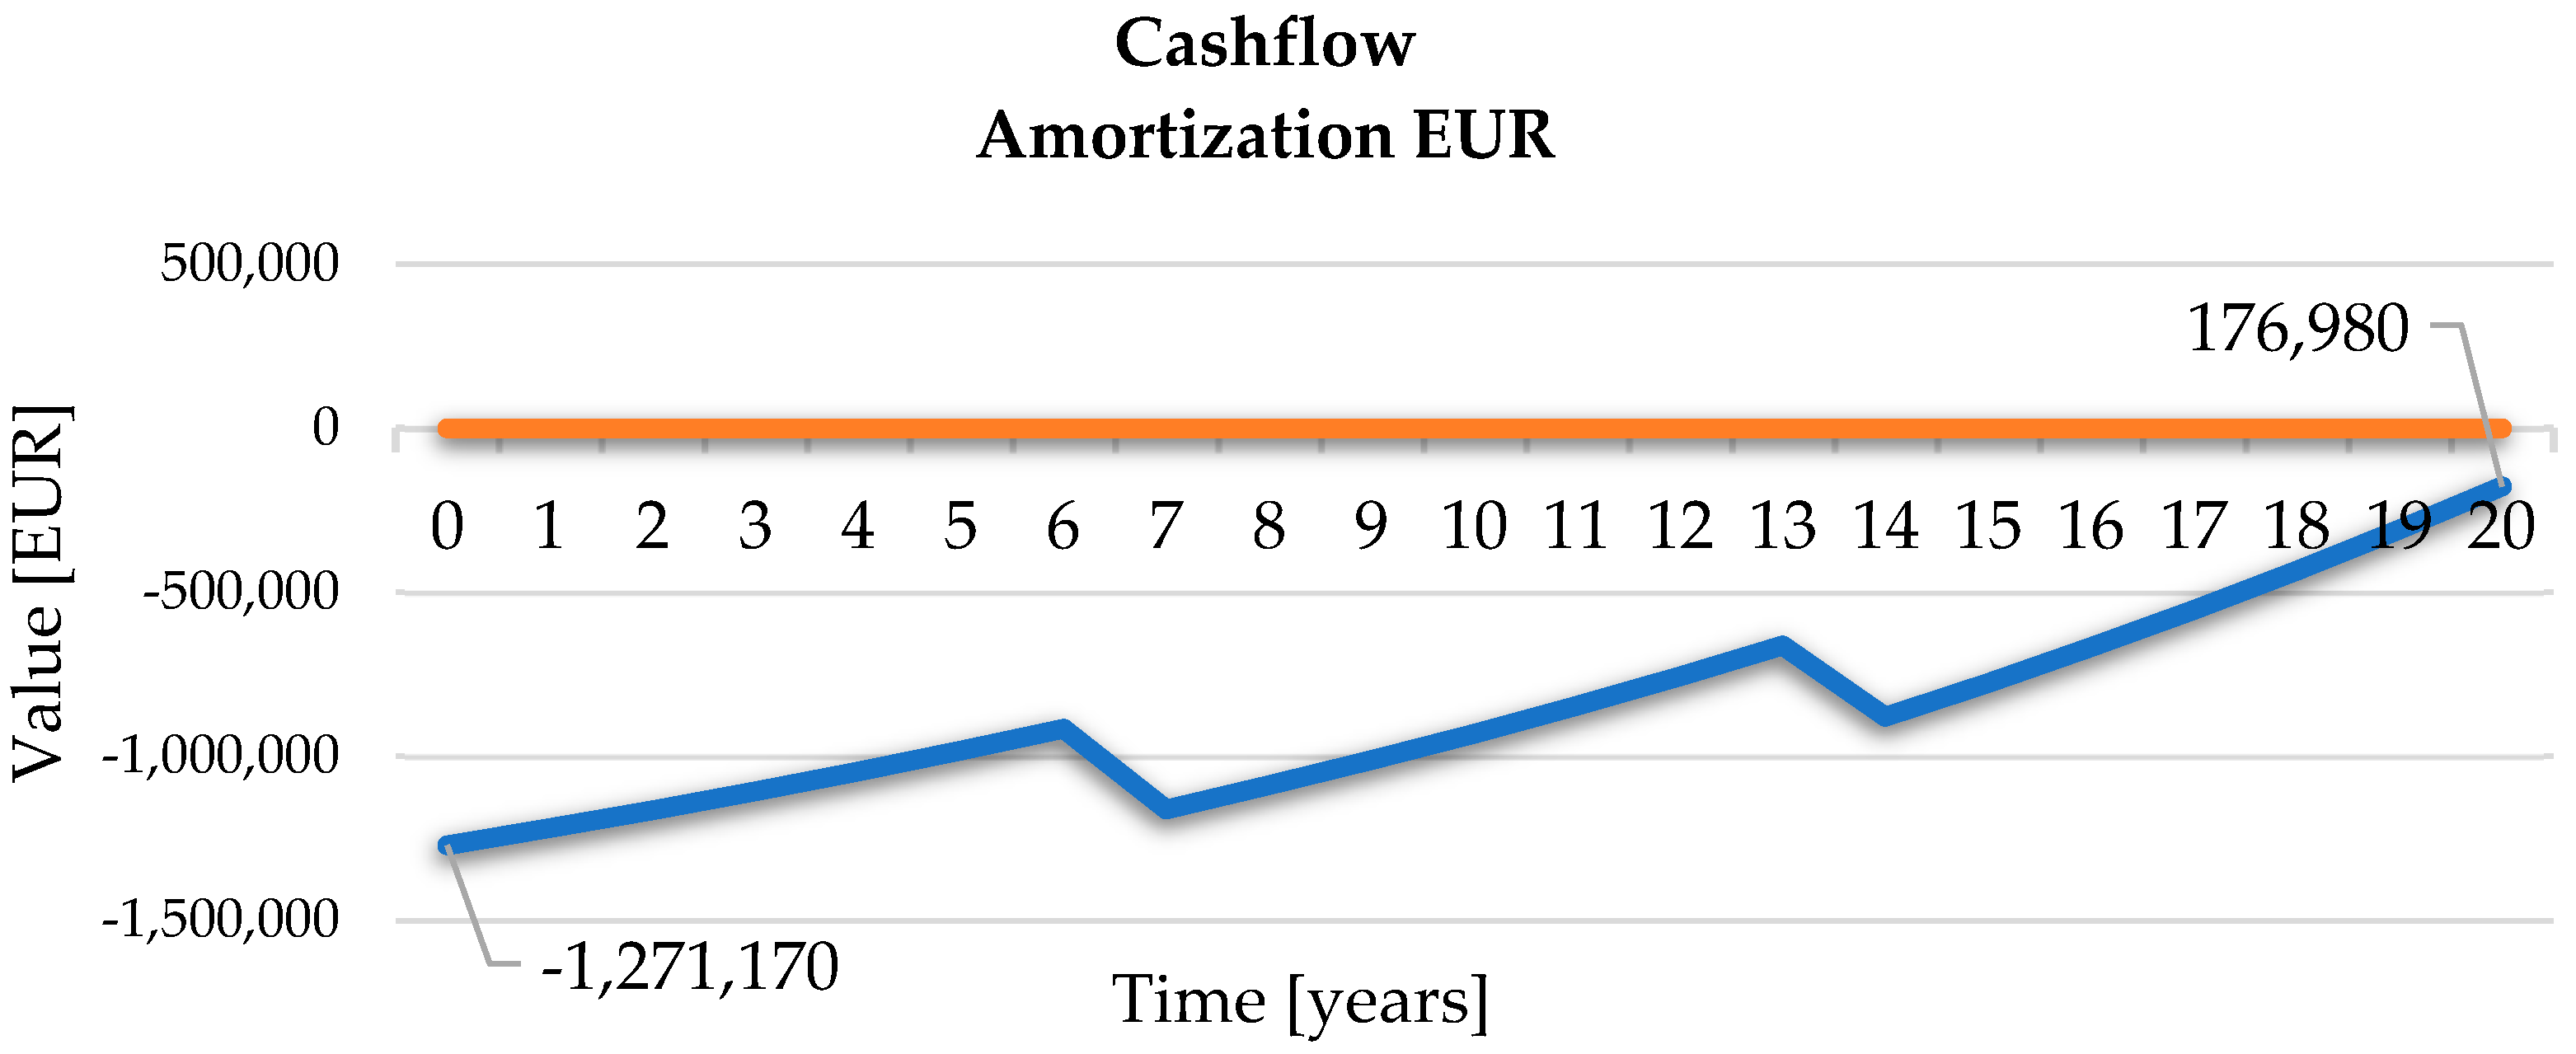
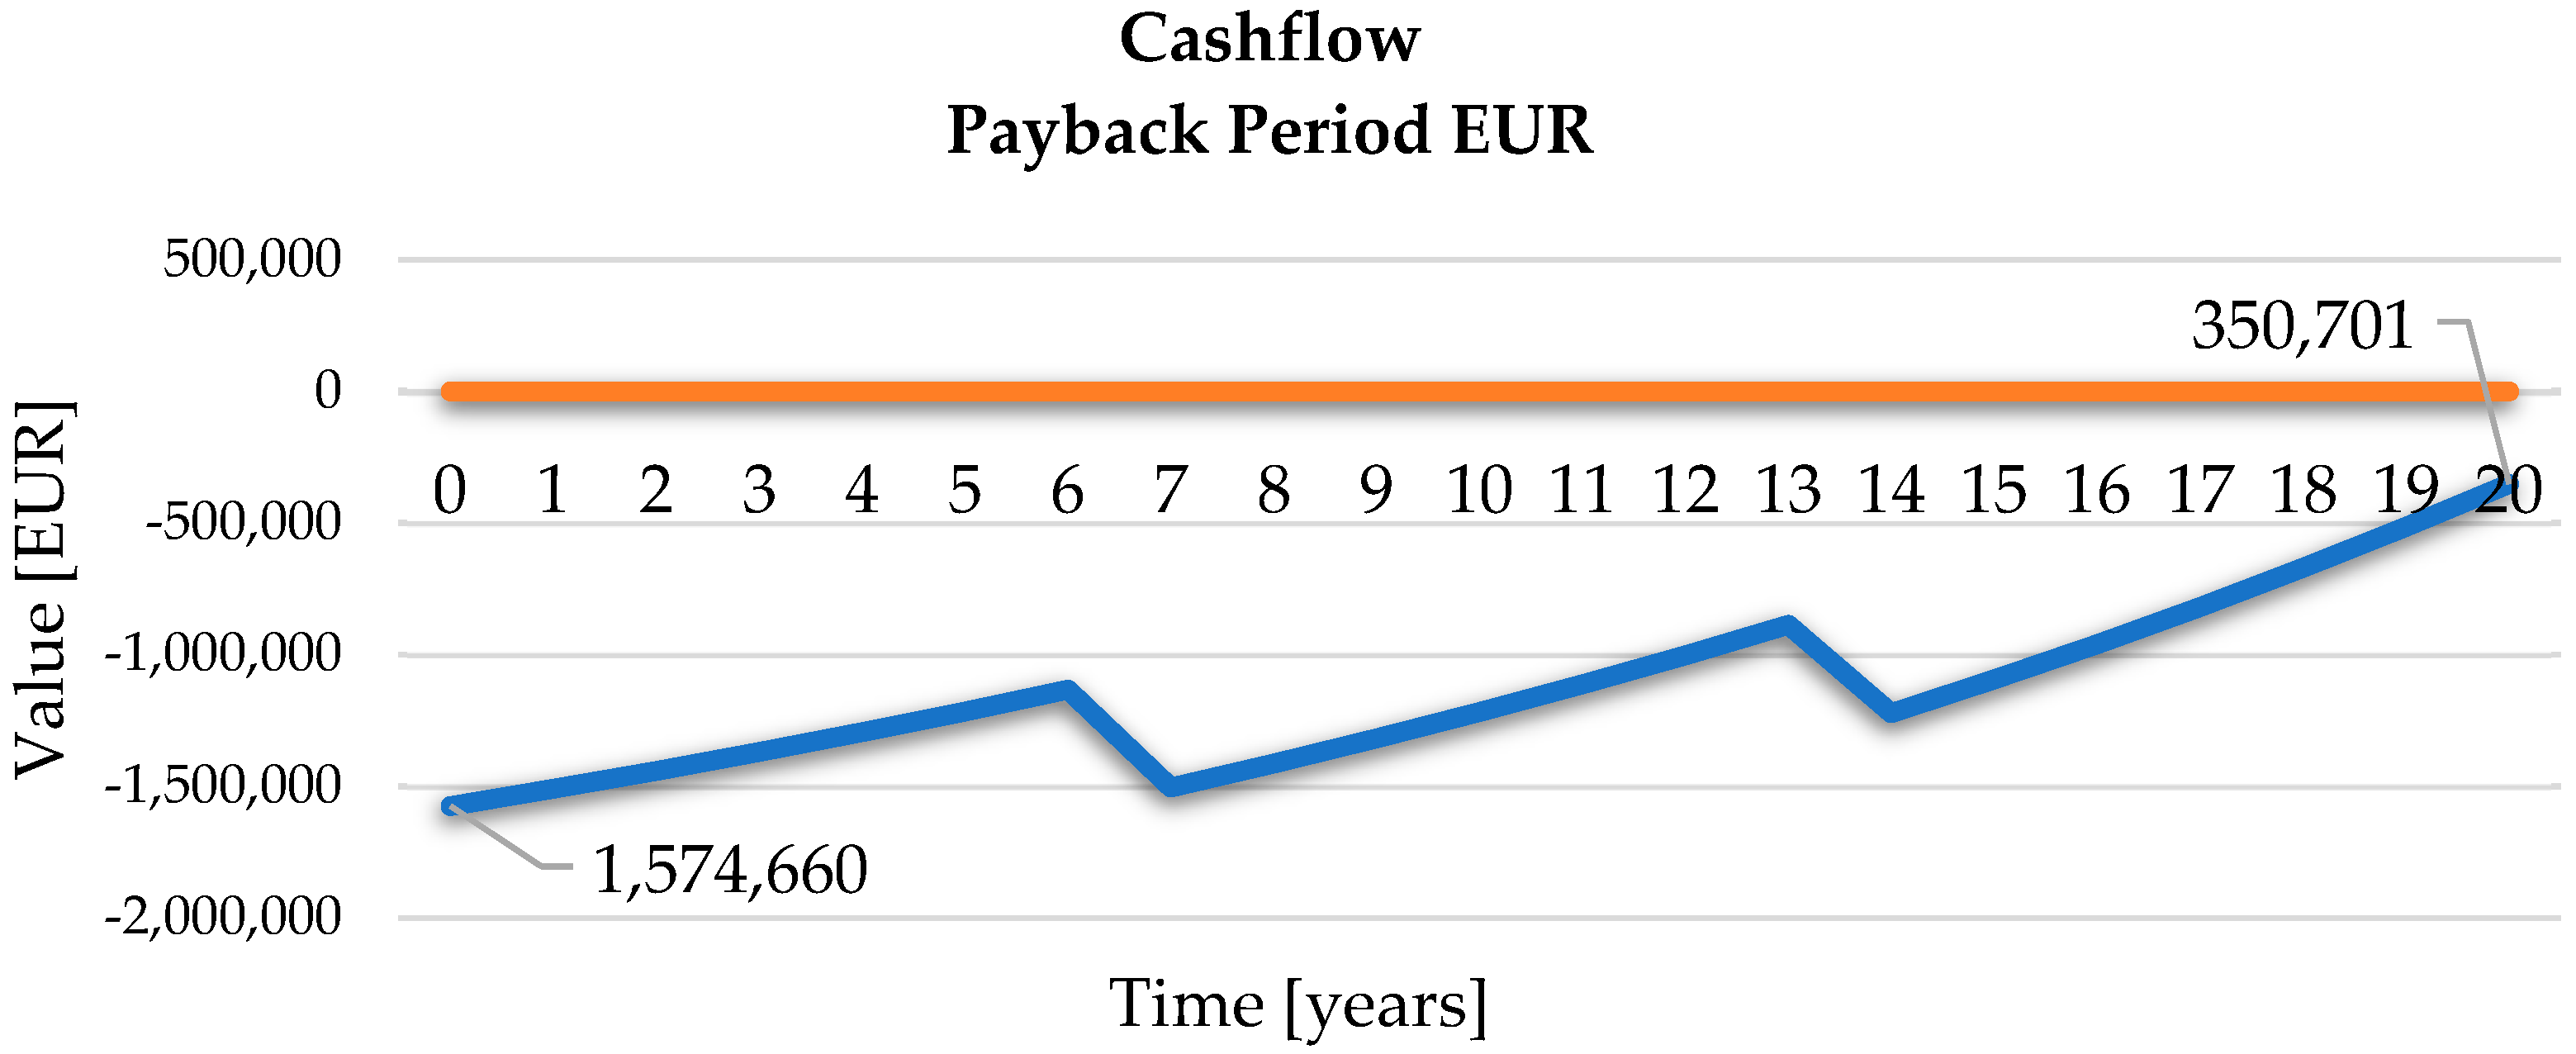
The Payback Time (PBT) of the investment was calculated for the energy efficiency measures that require investments for their implementation, along with a series of indicators highlighting the feasibility of the proposed measures (Table 13), namely the investment payback period, the net present value, and the internal rate of return. For all proposed solutions, an inflation rate of 5% was considered, corresponding to an emerging country (Romania), with a solution lifespan of 20 years. Since the investment values are known, Figure 20 presents the cumulative cash flow over the considered 20-year period.

3.5.3. Quantitative and Percentage Reduction in Resulting Greenhouse Gas Emissions

CO2 emissions were calculated using the emission factor from annex VI of Regulation (EU) No. 601/2012 [48] on the monitoring and reporting of greenhouse gas emissions in accordance with Directive 2003/87/EC [46] of the European Parliament and of the Council (based on the fuel used), which is multiplied by the amount of energy savings proposed to be achieved annually through the project until the end of the project’s sustainability period (measured in MWh). For saved electricity, the emission factor used is 0.33 tons CO2/MWh [46].
Based on the data presented above, greenhouse gas emissions for energy production in power plants within the National Electricity System (SEN) are calculated, as the energy produced from renewable sources has a very low impact on the three types of fuel. In this context, the value of greenhouse gas emissions for the first year after the implementation of the project involving the installation of a 475.60 kWp photovoltaic panel system is calculated. During the present study, the GHG emissions calculation method does not account for the carbon footprint of photovoltaic equipment over its entire lifecycle.
GHG for the energy saved (177.40 MWh/year) will be
GHGr = 177.40 MWh × 0.33 tCO2/MWh = 58.54 tCO2
GHGPV = 177.40 MWh × 0.33 tCO2/MWh = 58.54 tCO2
The GHG1 value of 0.00 tCO2 after the implementation of the project:
GHG1 = GHGr − GHGPV = 58.54 tCO2 − 58.54 tCO2 = 0.00 tCO2
The percentage value of GHG after the implementation of the project will be
G HG C O 2   =   ( G HG r G HG 1 ) G HG r × 100   =   58.54 0.00 58.54 × 100   =   100 %

3.6. Analysis of Using Grid-Connected Central Photovoltaic System for Street Lighting

3.6.1. Economic Viability Analysis

The estimated value of the investment for the construction of the photovoltaic power plant is EUR 773,977.22 including VAT—Table 14.
Construction and installation (C + I) represents the set of execution works necessary for the realization of an investment objective, including both the actual construction works (structures, foundations, finishes, etc.) and the assembly works for the related equipment and installations. The value of C + I, expressed in euros and included in the general estimate, reflects the costs associated with these works, according to the categories of expenses specified in the relevant chapters and subsections of the general estimate.

3.6.2. Calculation of Economic Efficiency

The calculation of economic efficiency was performed similarly to Section 3.5.2.
The feasibility indicators for the investment in energy efficiency measures that involve investments in their implementation, as well as a series of indicators that highlight the feasibility of the proposed measures, are presented in Table 15. To emphasize the payback period of the investment, the cumulative cash flow for the 20 years considered is indicated in Figure 21.

3.6.3. Quantitative and Percentage Reduction in Resulting Greenhouse Gas Emissions

The calculation for the reduction in greenhouse gases was performed similarly to Section 3.5.3. In this context, the value of greenhouse gas emissions for the first year after the implementation of the project involving the installation of a 153.90 kWp photovoltaic panel system is calculated.
GHG for the energy saved (177.33 MWh/year) will be
GHGr = 177.40 MWh × 0.33 tCO2/MWh = 58.54 tCO2
GHGPV = 177.33 MWh × 0.33 tCO2/MWh = 58.52 tCO2
The value of GHG1 is 0.02 tCO2 after the implementation of the project:
GHG1 = GHGr − GHGPV = 58.54 tCO2 − 58.52 tCO2 = 0.02 tCO2
The percentage value of GHG after the implementation of the project will be
GHG C O 2   =   ( GHG r GHG 1 ) GHG r × 100   =   58.54 0.02 58.54 × 100   =   99.97 %

3.7. Analysis of HYBRID Central Photovoltaic System for Street Lighting

3.7.1. Economic Viability Analysis

The estimated value of the project for the construction of the photovoltaic power plant is EUR 1,574,660.16 including VAT are presented in Table 16.

3.7.2. Calculation of Economic Efficiency

The investment feasibility indicators for energy efficiency measures that involve investments in their implementation, as well as a series of indicators highlighting the feasibility of the proposed measures, are presented in Table 17. Additionally, to emphasize the payback period of the investment, Figure 22 illustrates the cumulative cash flow for the considered 20-year period.

3.7.3. Quantitative and Percentage Reduction in Greenhouse Gas Emissions

The calculation for the reduction in greenhouse gases was performed similarly to Section 3.5.3. In this context, the value of greenhouse gas emissions for the first year after the implementation of the project, which involves the installation of a photovoltaic system of 153.90 kWp, is calculated.
GHG for the saved energy (177.33 MWh/year) will be
GHGr = 177.40 MWh × 0.33 tCO2/MWh = 58.54 tCO2
GHGPV = 177.33 MWh × 0.33 tCO2/MWh = 58.52 tCO2
The value of GHG1 is 0.02 tCO2 after the implementation of the project:
GHG1 = GHGr − GHGPV = 58.54 tCO2 − 58.52 tCO2 = 0.02 tCO2
The percentage value of GHG after the implementation of the project will be
G HG C O 2   =   ( G HG r G HG 1 ) G HG r × 100   =   58.54 0.02 58.54 × 100   =   99.97 %

3.8. Discussion

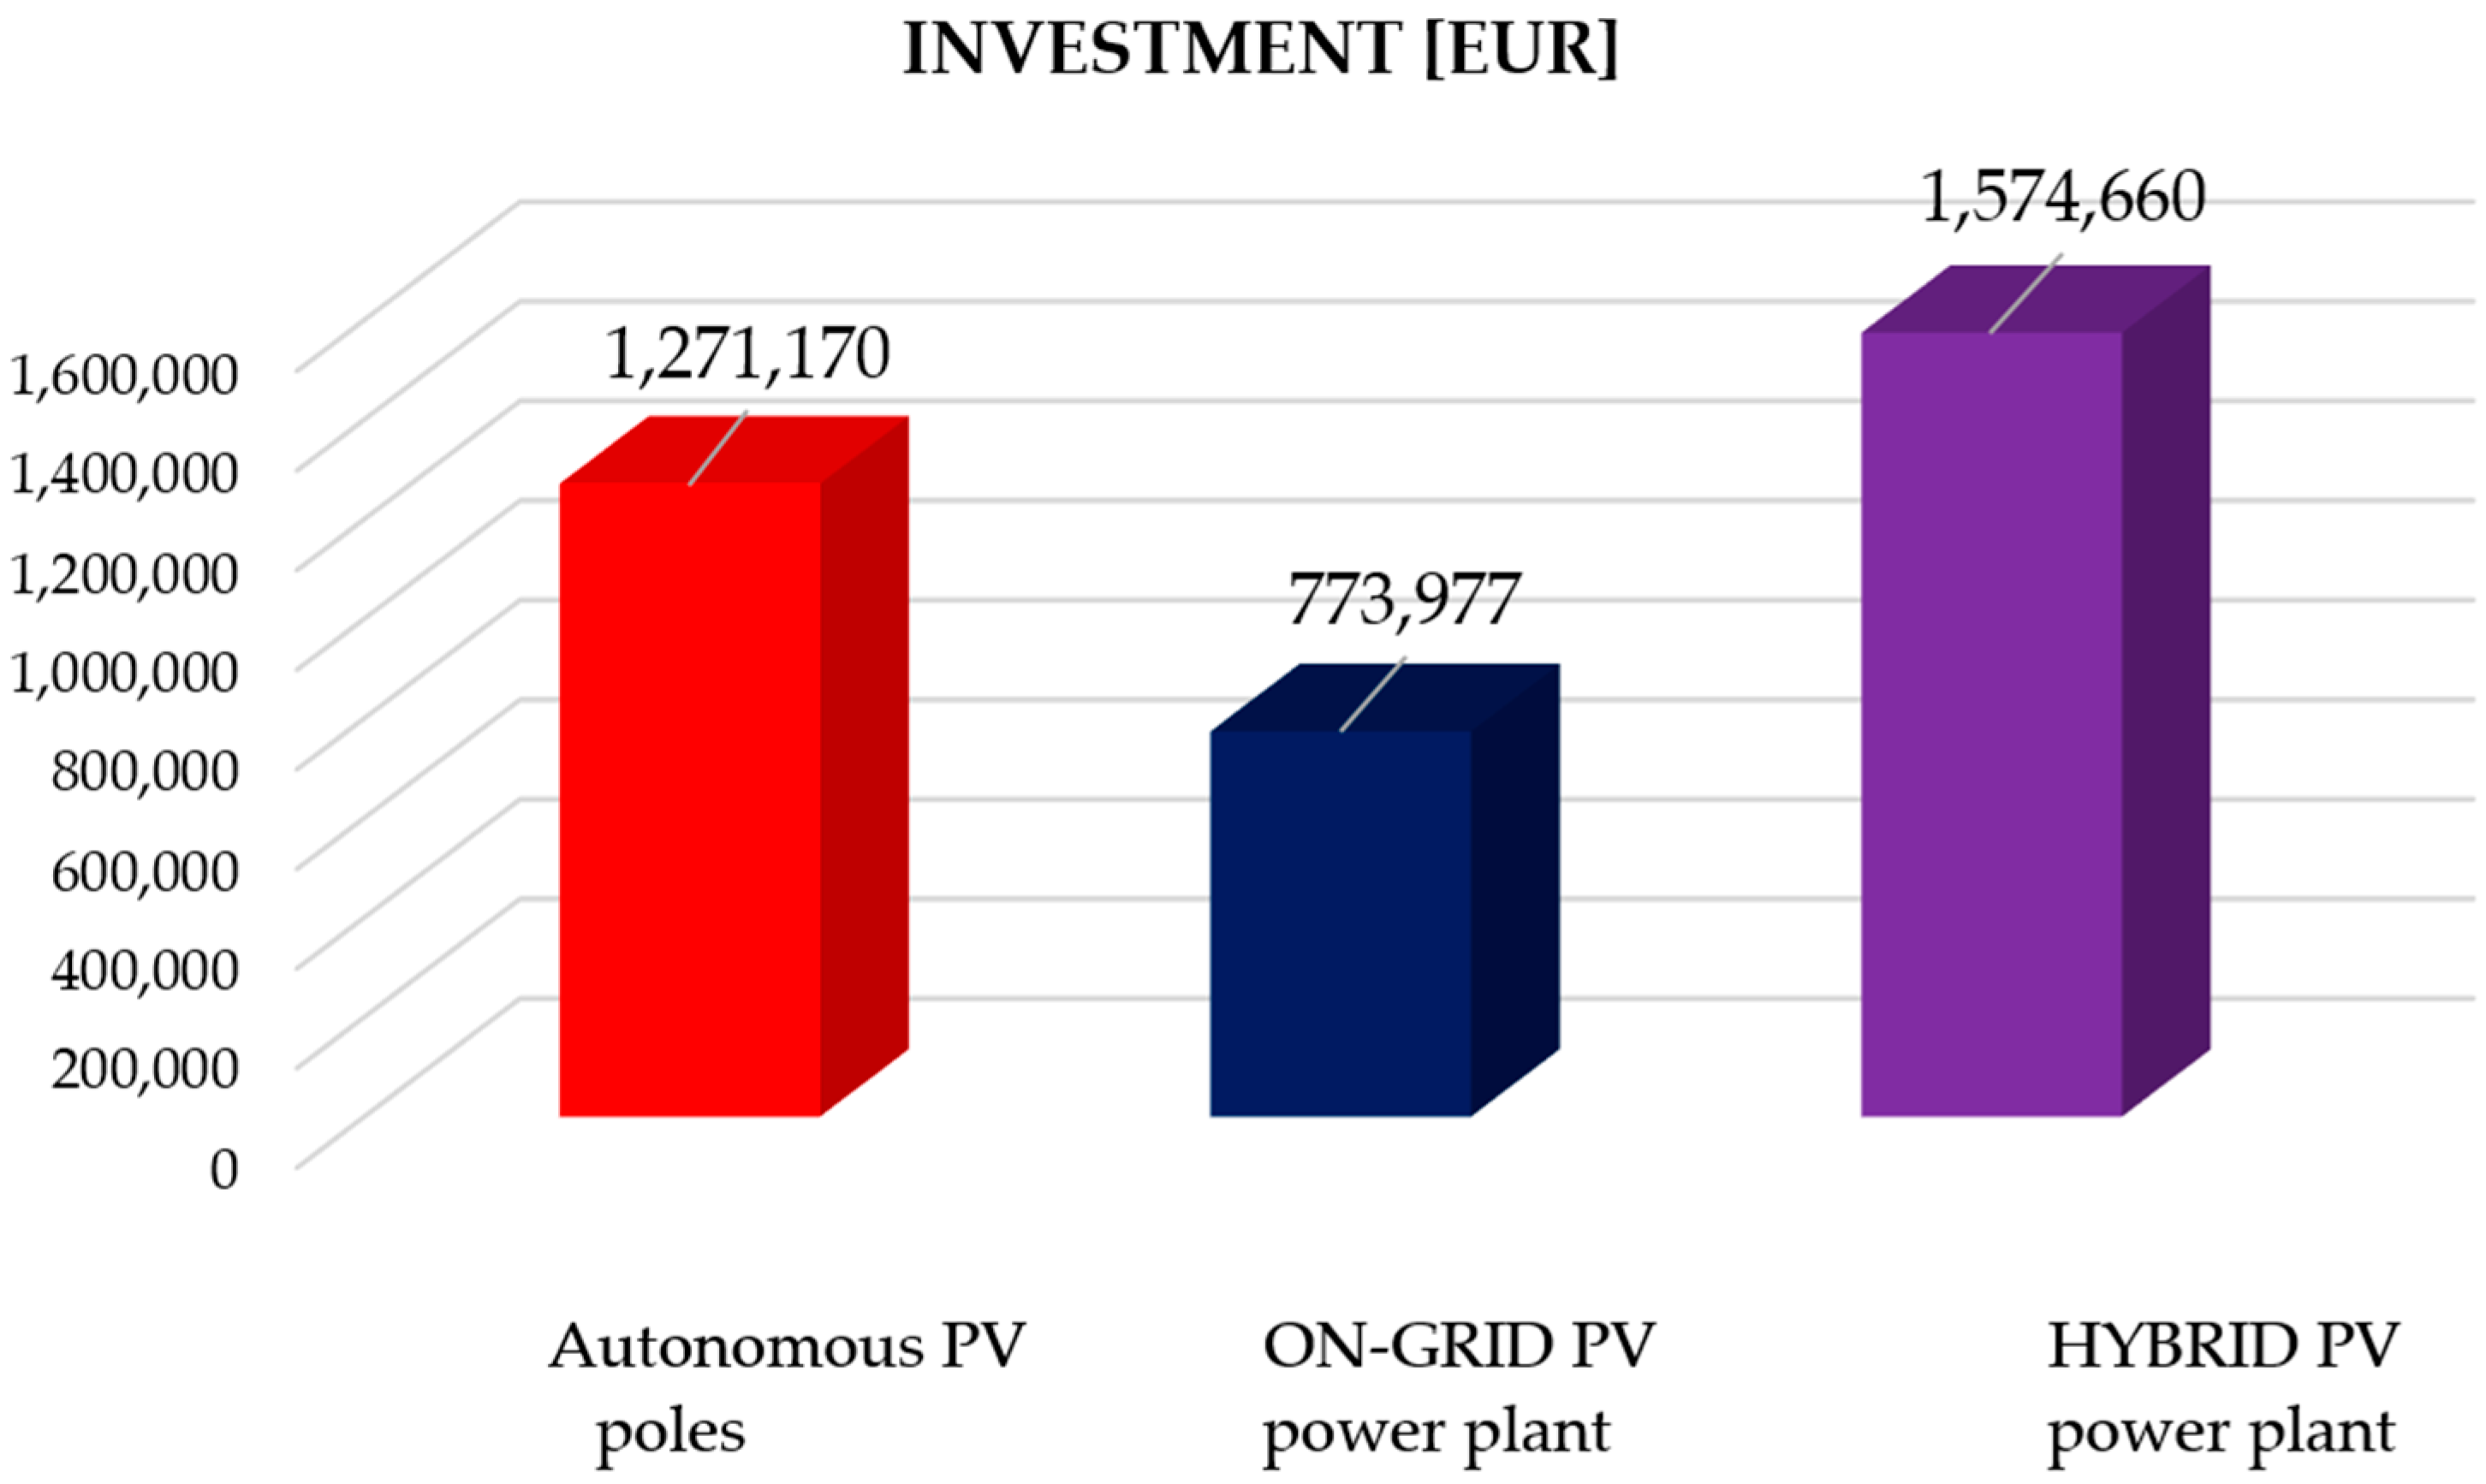
As observed in Figure 23, the use of HYBRID photovoltaic systems for street lighting represents the least economically viable option, while the use of ON-GRID photovoltaic systems represents the most economically viable option. The economic feasibility of using autonomous photovoltaic poles is similar to that of HYBRID photovoltaic systems in the analysis conducted, but it represents the most viable option for street lighting in areas where there is no electricity network or where the existing network is very old or damaged.
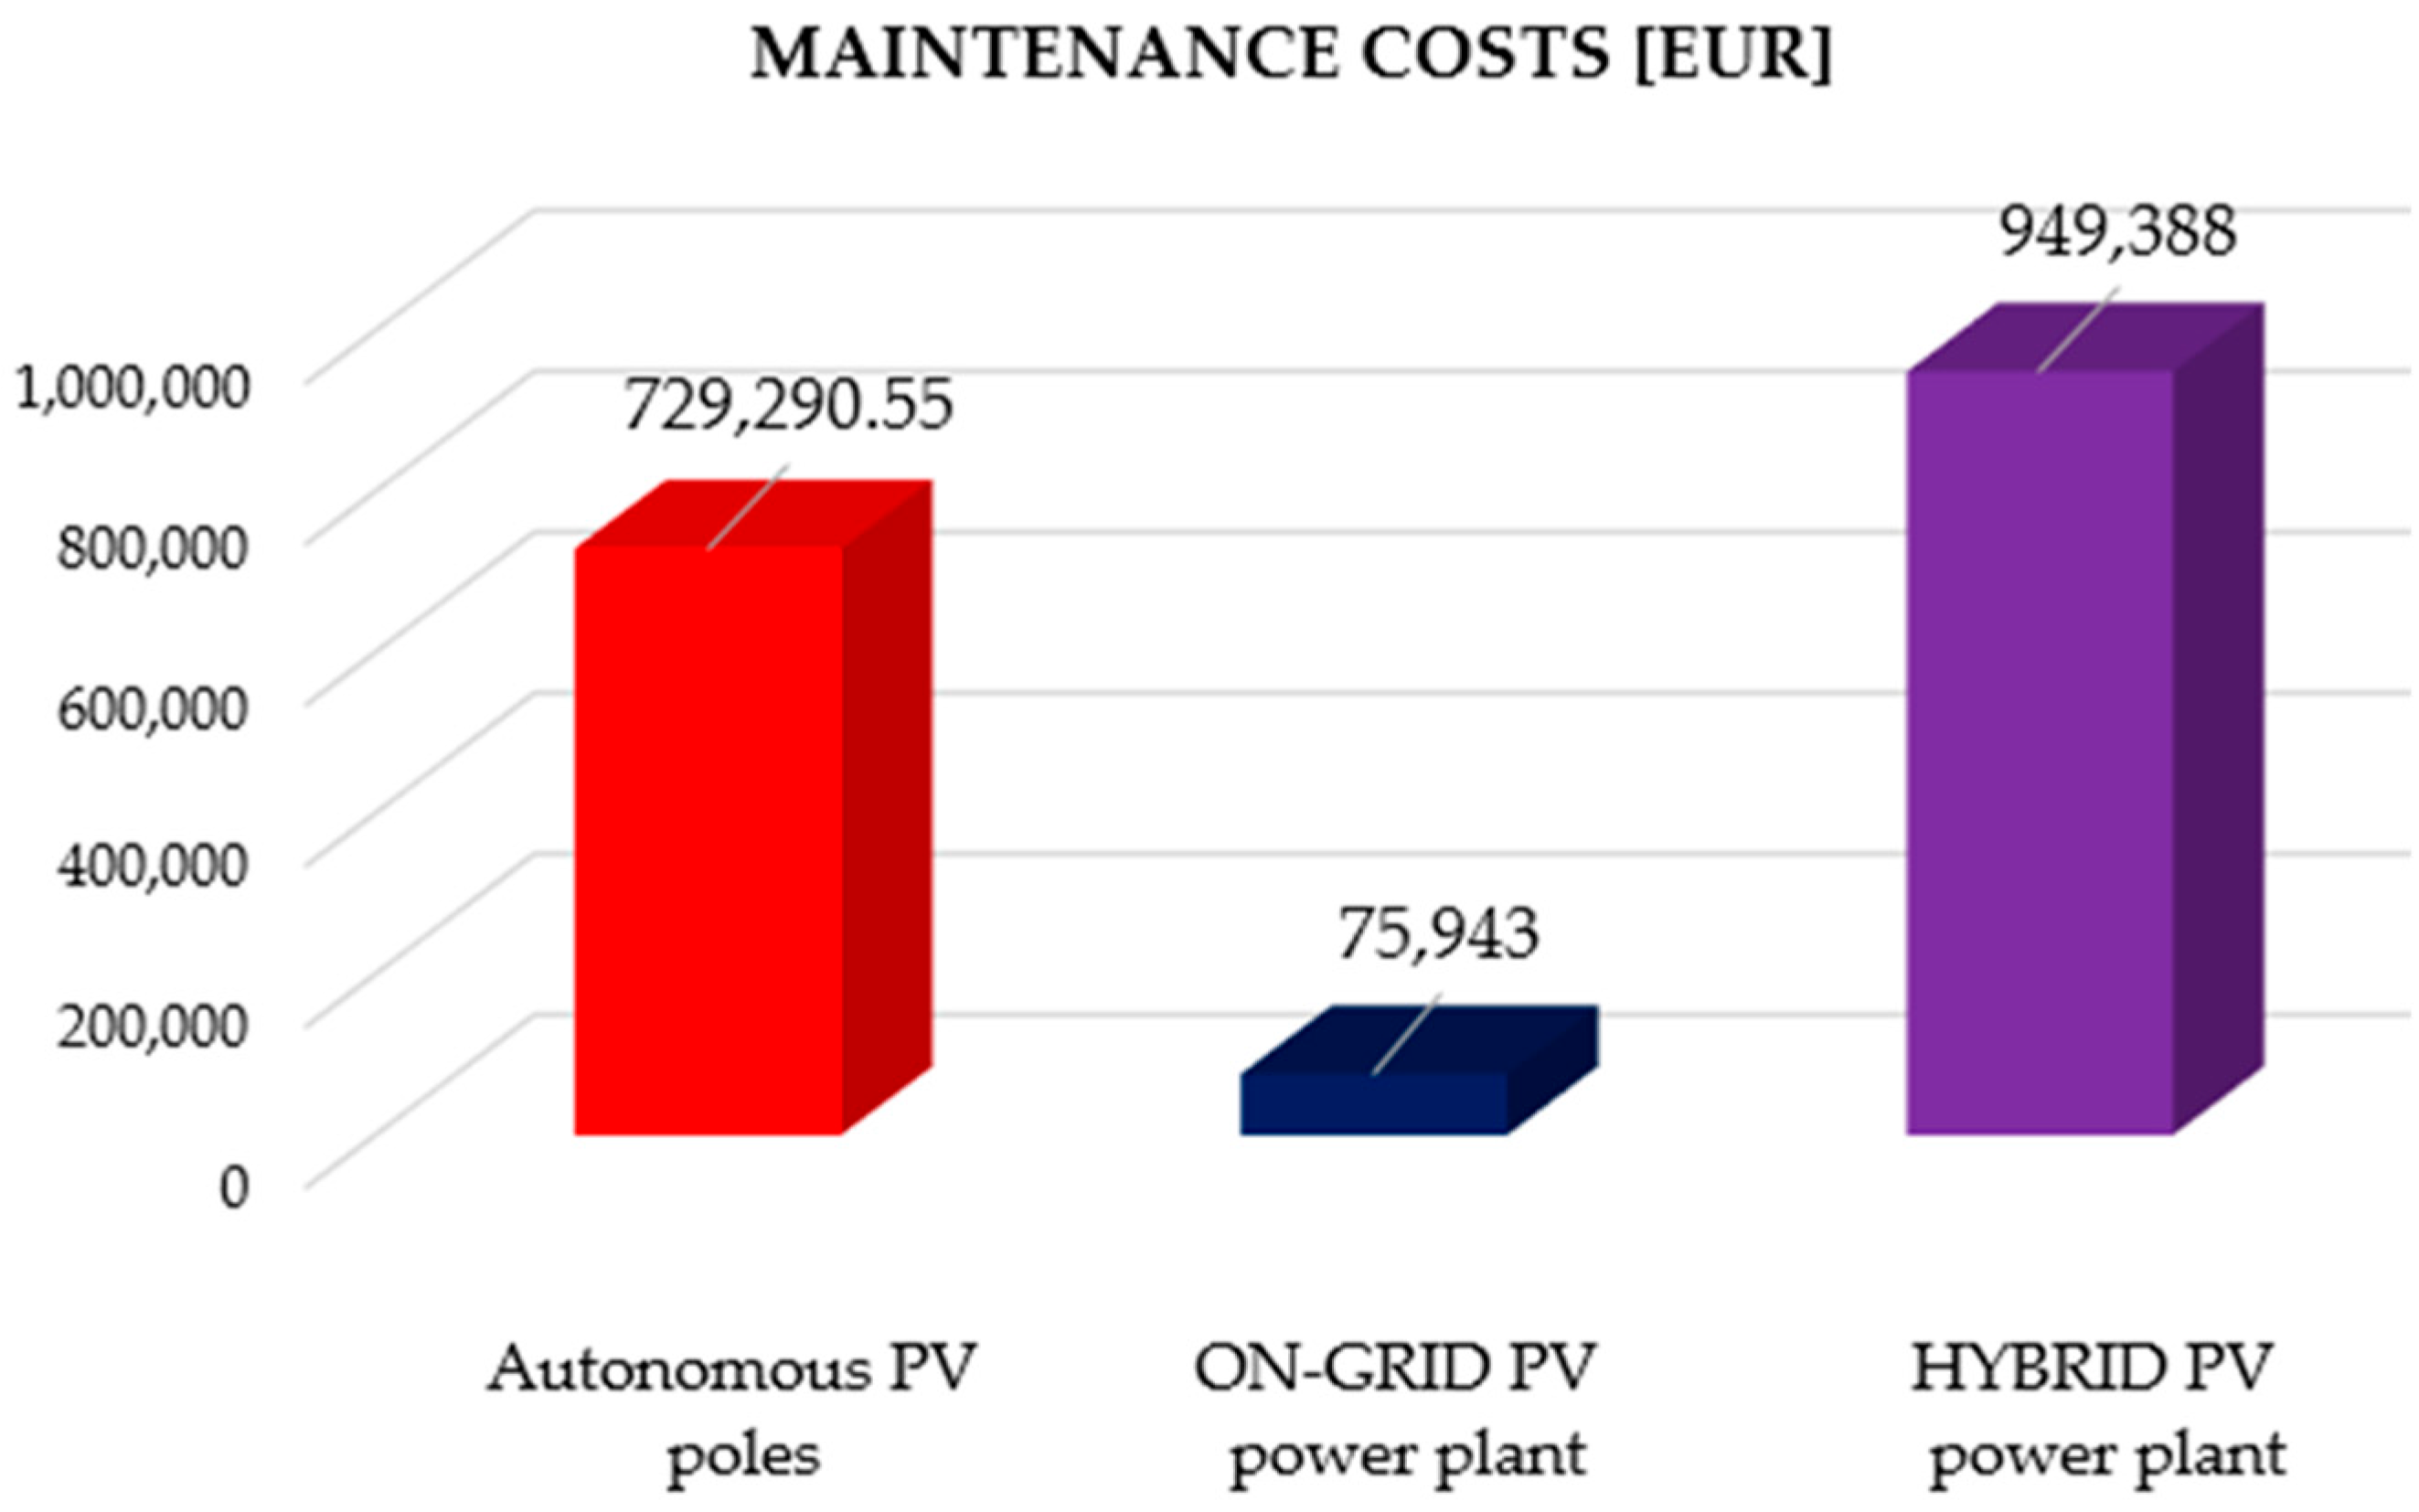
The HYBRID photovoltaic power plant incurs the highest maintenance costs over the entire analysis period, including the annual washing of the photovoltaic panels and the replacement of inverters and storage systems every 7 years.
The ON-GRID photovoltaic power plant has the lowest maintenance costs throughout the analysis period, as this system does not store electrical energy. Maintenance expenses are limited to the annual washing of the photovoltaic panels and replacement of inverters every 7 years, as shown in Figure 24.
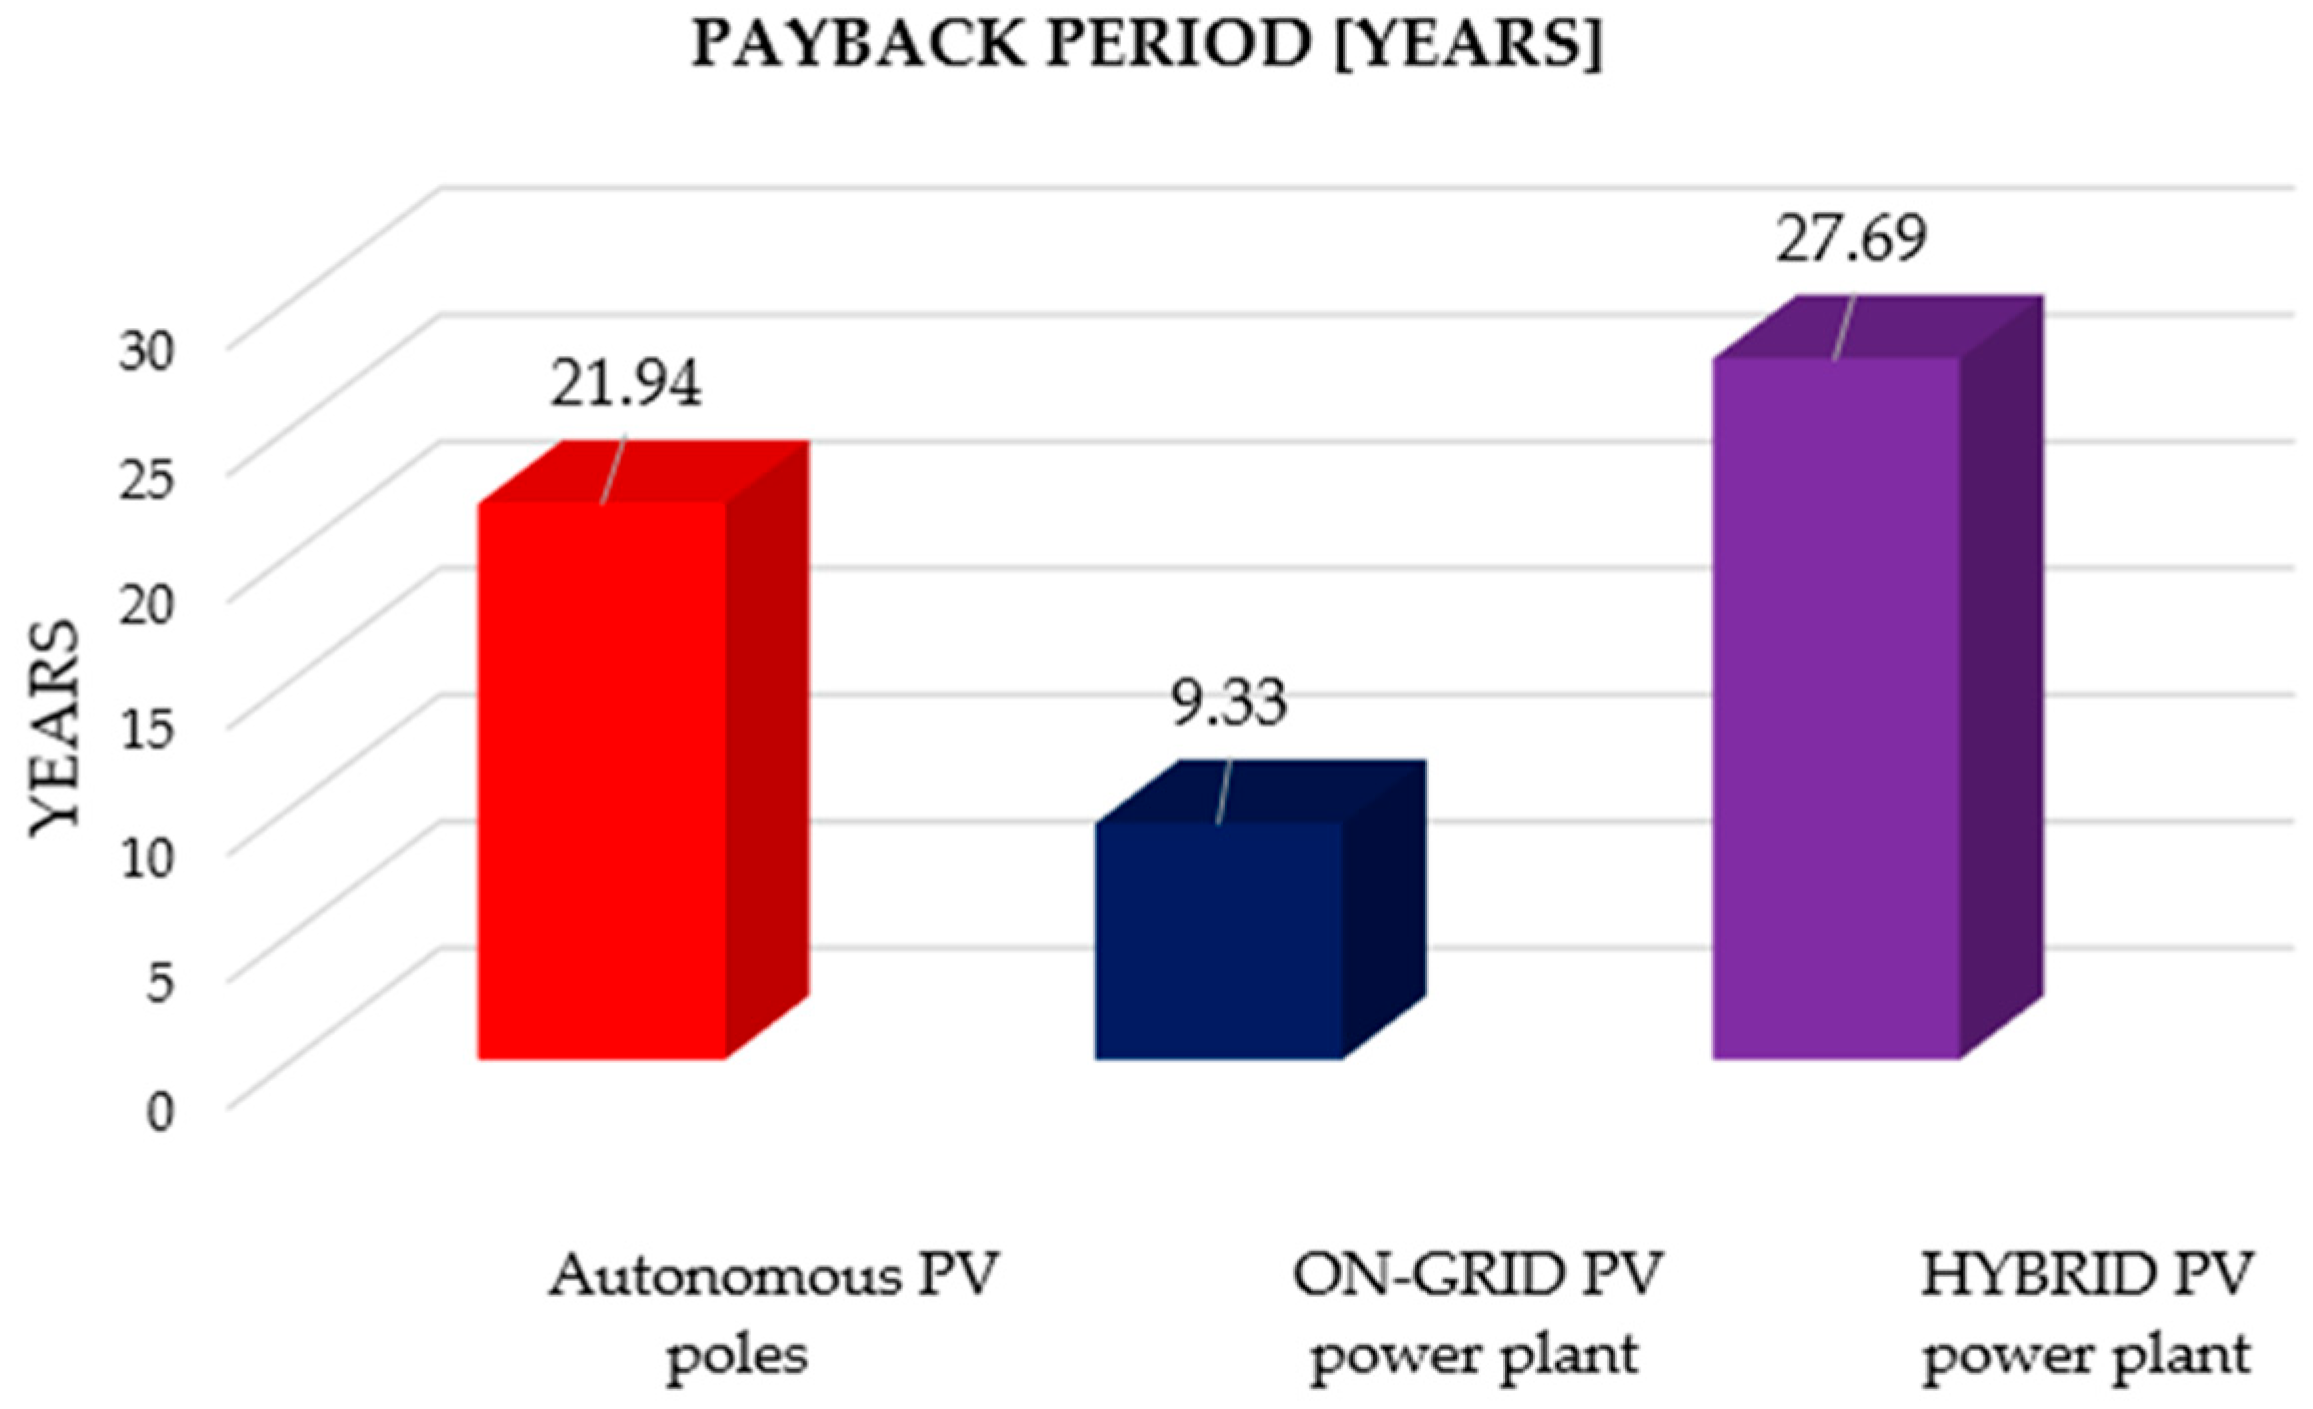
The longest payback period is for the HYBRID photovoltaic power plant, at 27.69 years, followed by autonomous photovoltaic poles with a payback period of 21.94 years. The advantage of these solutions is the storage of electrical energy in batteries to provide power for street lighting during the night, while the drawbacks are the high costs for investment and long payback periods.
The ON-GRID photovoltaic power plant has the shortest payback period of 9.33 years, due to the lower costs associated with its implementation—Figure 25. However, its disadvantage lies in its dependence on the electricity grid and government programs regarding the share of renewable energy sources in the national energy system.
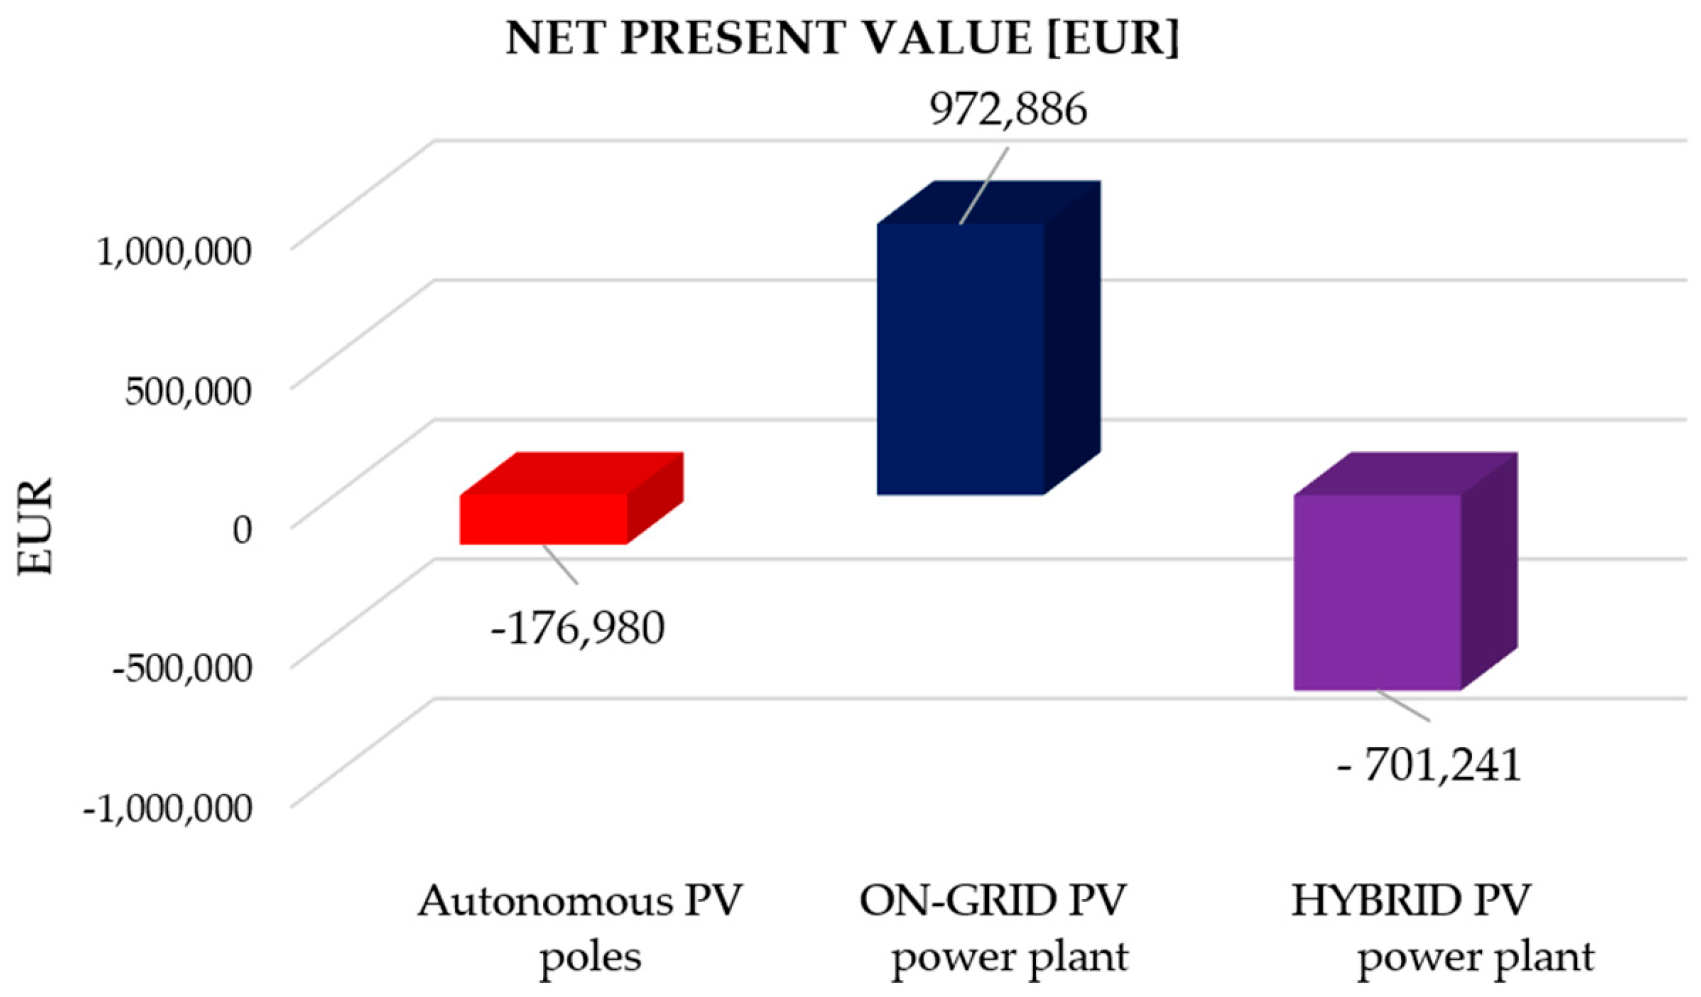
By comparing expenses and revenues, taking into account the system maintenance over a 20-year period, the ON-GRID photovoltaic power plant generates a significantly higher net present value than the other analyzed systems. Figure 26 shows that the autonomous photovoltaic poles and the HYBRID photovoltaic power plant do not recoup their investment within the analysis period.
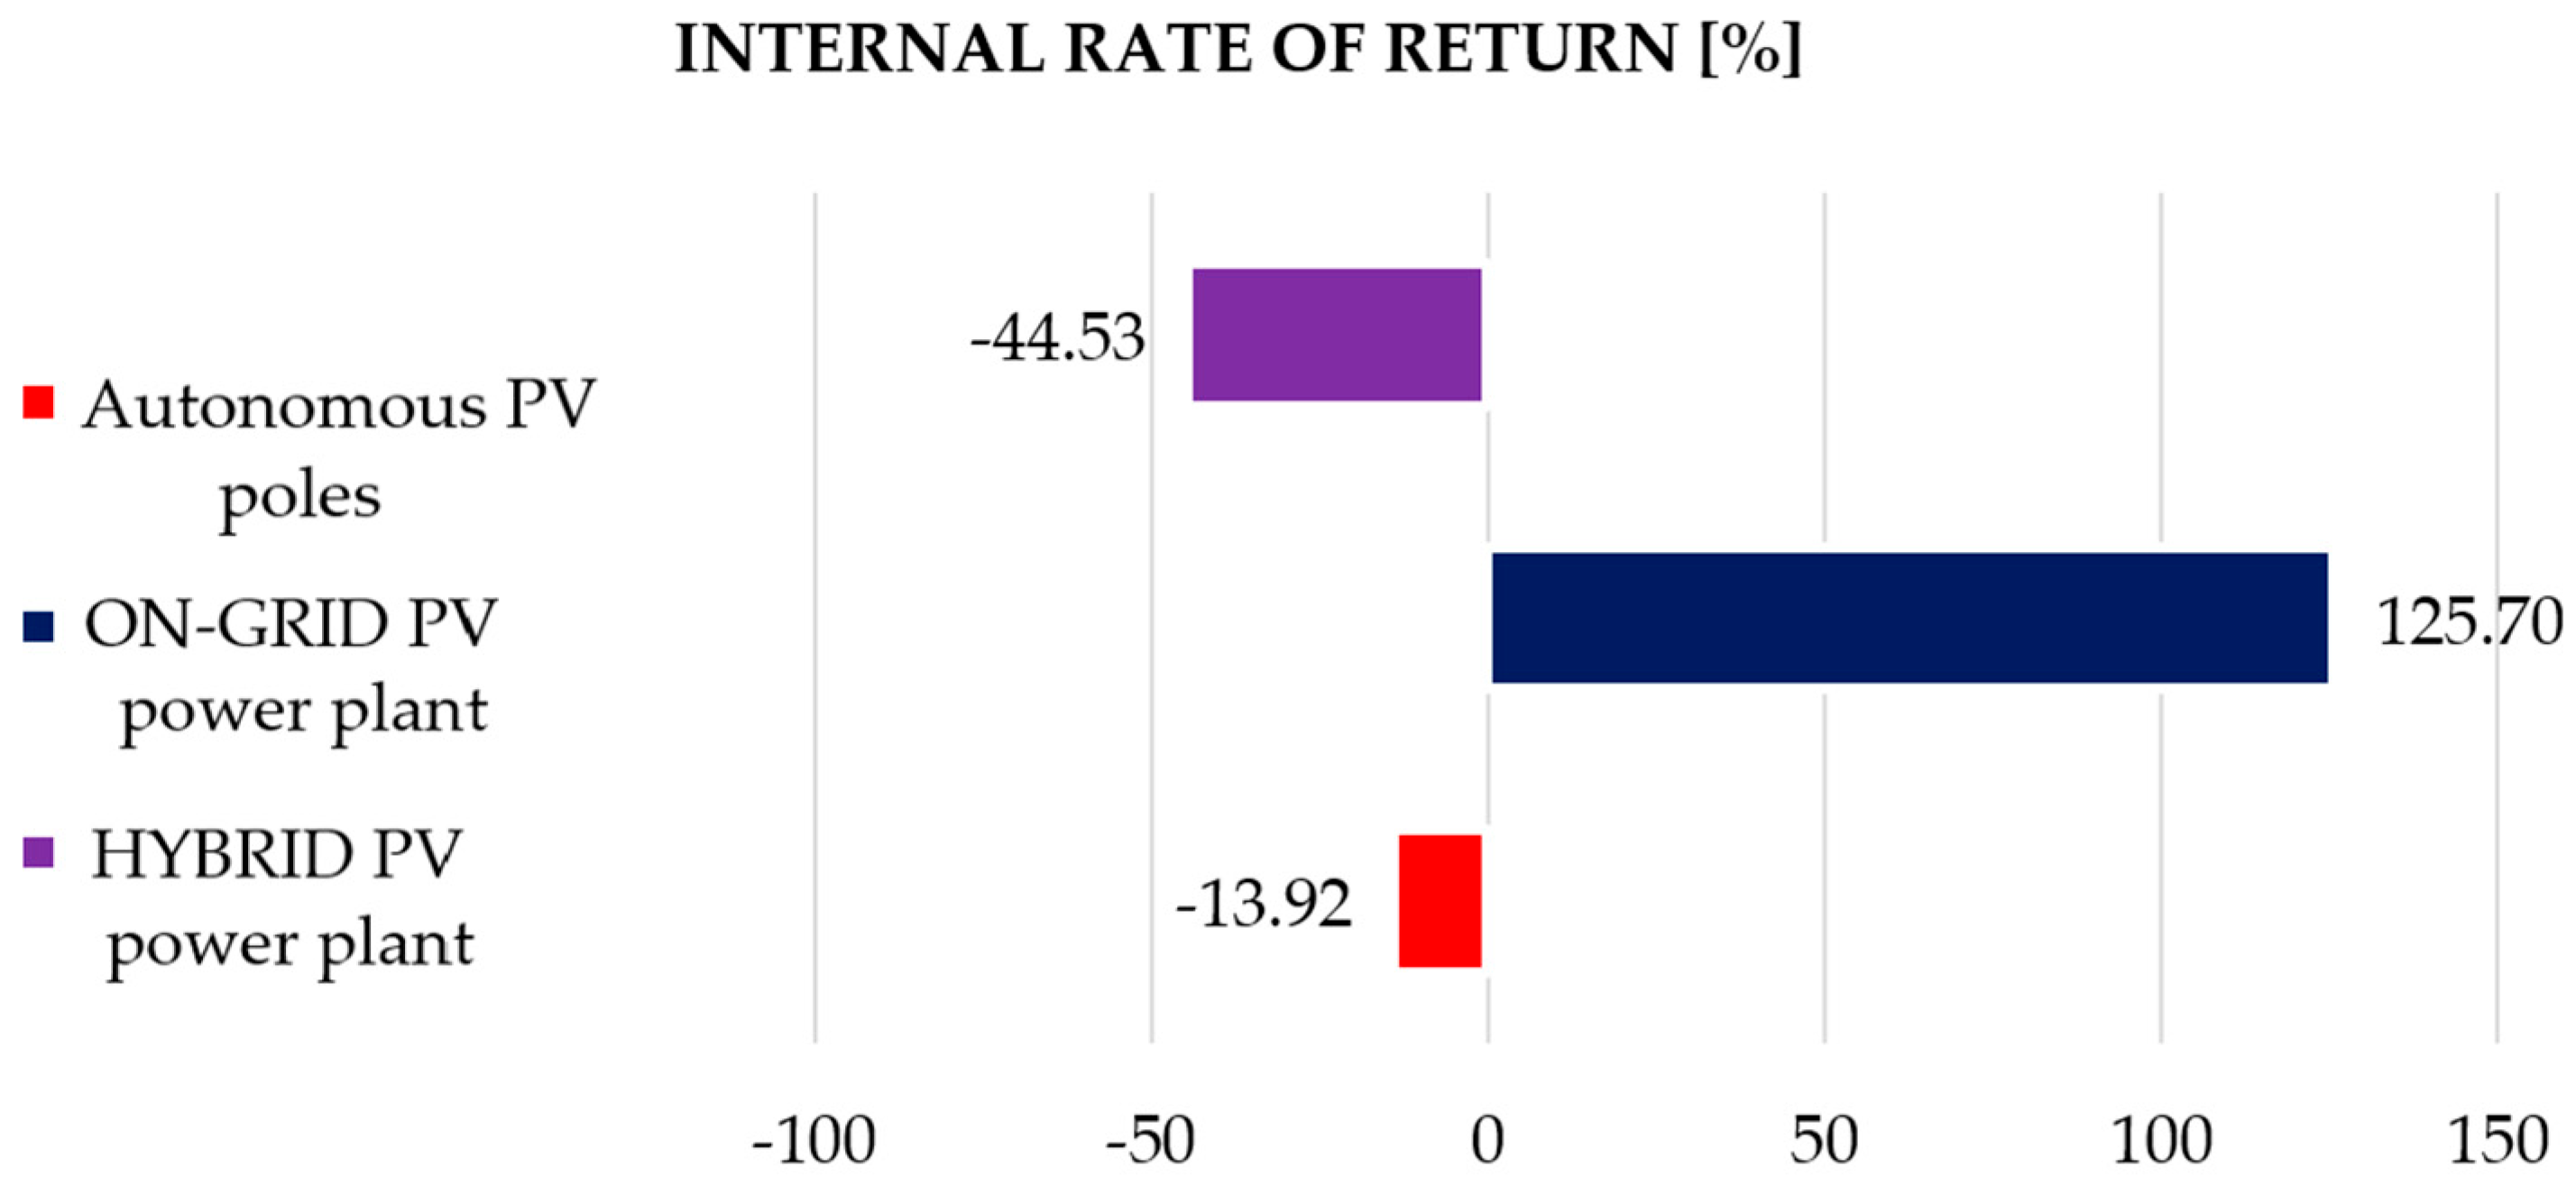
The internal rate of return indicates the efficiency of the analyzed scenarios. Figure 27 shows that the ON-GRID photovoltaic power plant represents a feasible solution, while the autonomous photovoltaic poles and the HYBRID photovoltaic power plant are not economically viable for the analyzed objective.
From a technical perspective, the deployment of photovoltaic panels requires an estimated surface area of approximately 2500 m2. To optimize land use and minimize ecological impact, it is recommended that the PV system be installed preferentially on artificialized surfaces such as industrial rooftops, parking areas, or—where these are unavailable—on non-productive agricultural land. Furthermore, the proximity of a medium-voltage electrical network is a critical requirement for the proposed site. Such proximity ensures minimal costs associated with injecting electricity into the distribution grid. National grid data provided by Transelectrica [8] indicate that the available connection capacity in the targeted region, identified as Zone J, is 1000 MW, thereby confirming the feasibility of integrating the PV system within existing infrastructure. In alignment with the European Union’s climate and energy policy, the project also supports broader objectives by promoting energy consumption reduction measures at both enterprise and public utility levels, including street lighting. These policies incentivize the adoption of renewable energy sources through mechanisms such as quantitative compensation and financial settlement schemes for prosumers.
The adoption of PV-LED public lighting not only accelerates SDG 7 but also intersects with SDG 11 (Sustainable Cities), SDG 13 (Climate Action), and SDG 3 (Good Health and Well-Being), making it one of the most catalytic infrastructure upgrades of the coming decade.
The disadvantage of this system is its dependence on the national energy system. The electricity produced during the day is injected into the grid, and at night, through EU prosumer policy facilities, represented by quantitative compensation and financial settlement, electricity is consumed from the public electricity supply grid for street lighting. The electricity consumed from the national energy system at night is produced from the following sources: hydro, coal, nuclear, hydrocarbons, wind, and biomass [7]. From this data, we can observe that a portion of the energy is produced by burning fossil and nuclear fission fuels.
This means that by implementing this system, there is no contribution to environmental protection at night by not using fossil and nuclear fission fuels.
However, this disadvantage will be eliminated through EU policy [7]. Thus, Romania, through the National Energy Strategy 2018–2030, commits to constructing two new nuclear units and maintaining an increasing trend in production capacities from intermittent renewable sources. Also, the construction of a large-capacity pumped storage power plant is mandatory for the stability of the power system.
Economic sensitivity
Considering the long analysis period of photovoltaic systems, a sensitivity analysis of economic parameters was conducted. Therefore, the following variations in costs were considered:
-
A ±20% variation in electricity price;
-
A ±10% variation in annual maintenance costs.
The results highlight the influence of these parameters on the amortization. However, the main results in terms of economic efficiency remain the same, while Case 3 is close to breakeven, but still a loss. In Table 18, the following scenarios were analyzed: favorable scenario (+20% energy and −10% maintenance) and unfavorable scenario (−20% energy and +10% maintenance).
Therefore, Case 2 is the most robust to variations (positive and negative), Case 1 has high sensitivity and the risk of going into loss, and Case 3 remains economically inefficient even in the favorable scenario.
SWOT Analysis
In order to outline potential directions for the future development of similar research, a SWOT analysis was carried out on the solutions proposed in this study—Table 19. This structured assessment highlights the strengths, weaknesses, opportunities, and threats associated with the implementation of these solutions.
Based on the SWOT analysis, a logic flow was developed to guide decision making regarding the optimal photovoltaic lighting system. This flow considers factors such as grid availability, reliability requirements, budget constraints, sustainability goals, and available space. The main implications reveal that OFF-GRID systems are suitable only for remote or low-priority areas due to limited reliability, ON-GRID solutions offer the best economic efficiency but rely on grid stability, while HYBRID systems provide the highest resilience and CO2 reduction potential, albeit at a higher cost. This structured approach supports strategic planning for sustainable public lighting infrastructure.

4. Conclusions

The implementation of an ON-GRID photovoltaic (PV) power plant specifically designed to meet the electricity demands of street lighting emerges as the optimal solution for integrating photovoltaic systems into public infrastructure. This transition in electricity generation technology is substantiated by a multidimensional analysis encompassing technical, economic, and environmental criteria.
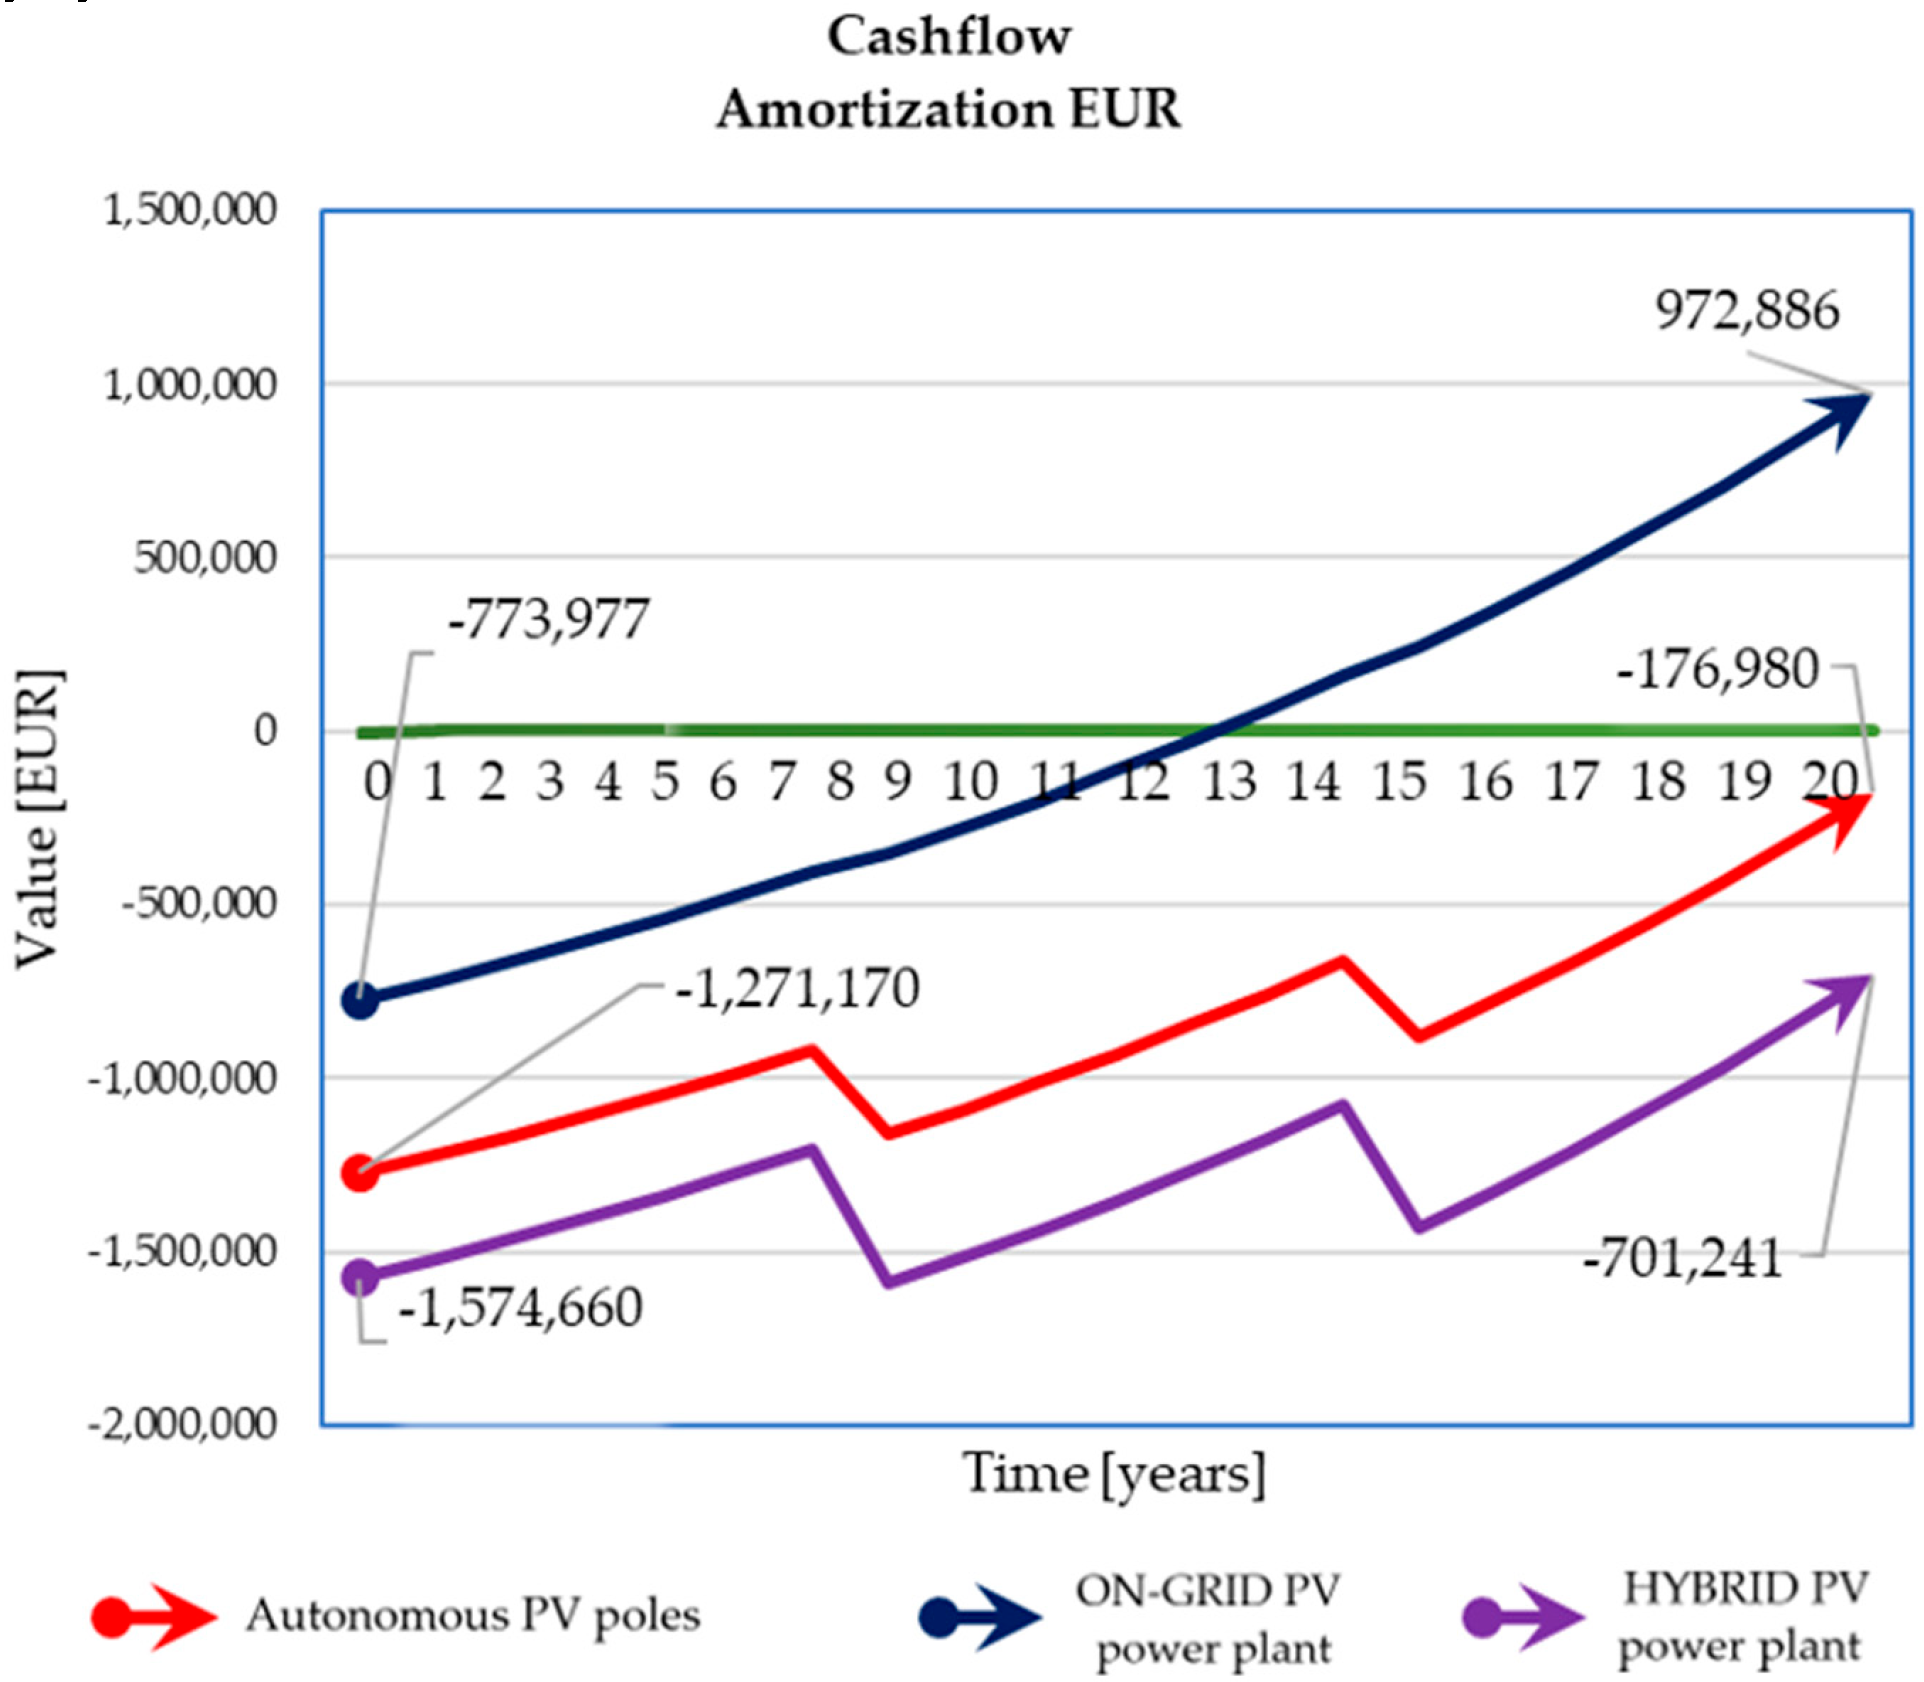
From an economic standpoint, the analysis clearly identifies the ON-GRID PV scenario as the most cost-effective option. As illustrated in Figure 28, this solution demonstrates superior financial viability. Notably, the internal rate of return (IRR) associated with this scenario reaches 125.7%, reflecting the high economic efficiency and attractiveness of the investment.
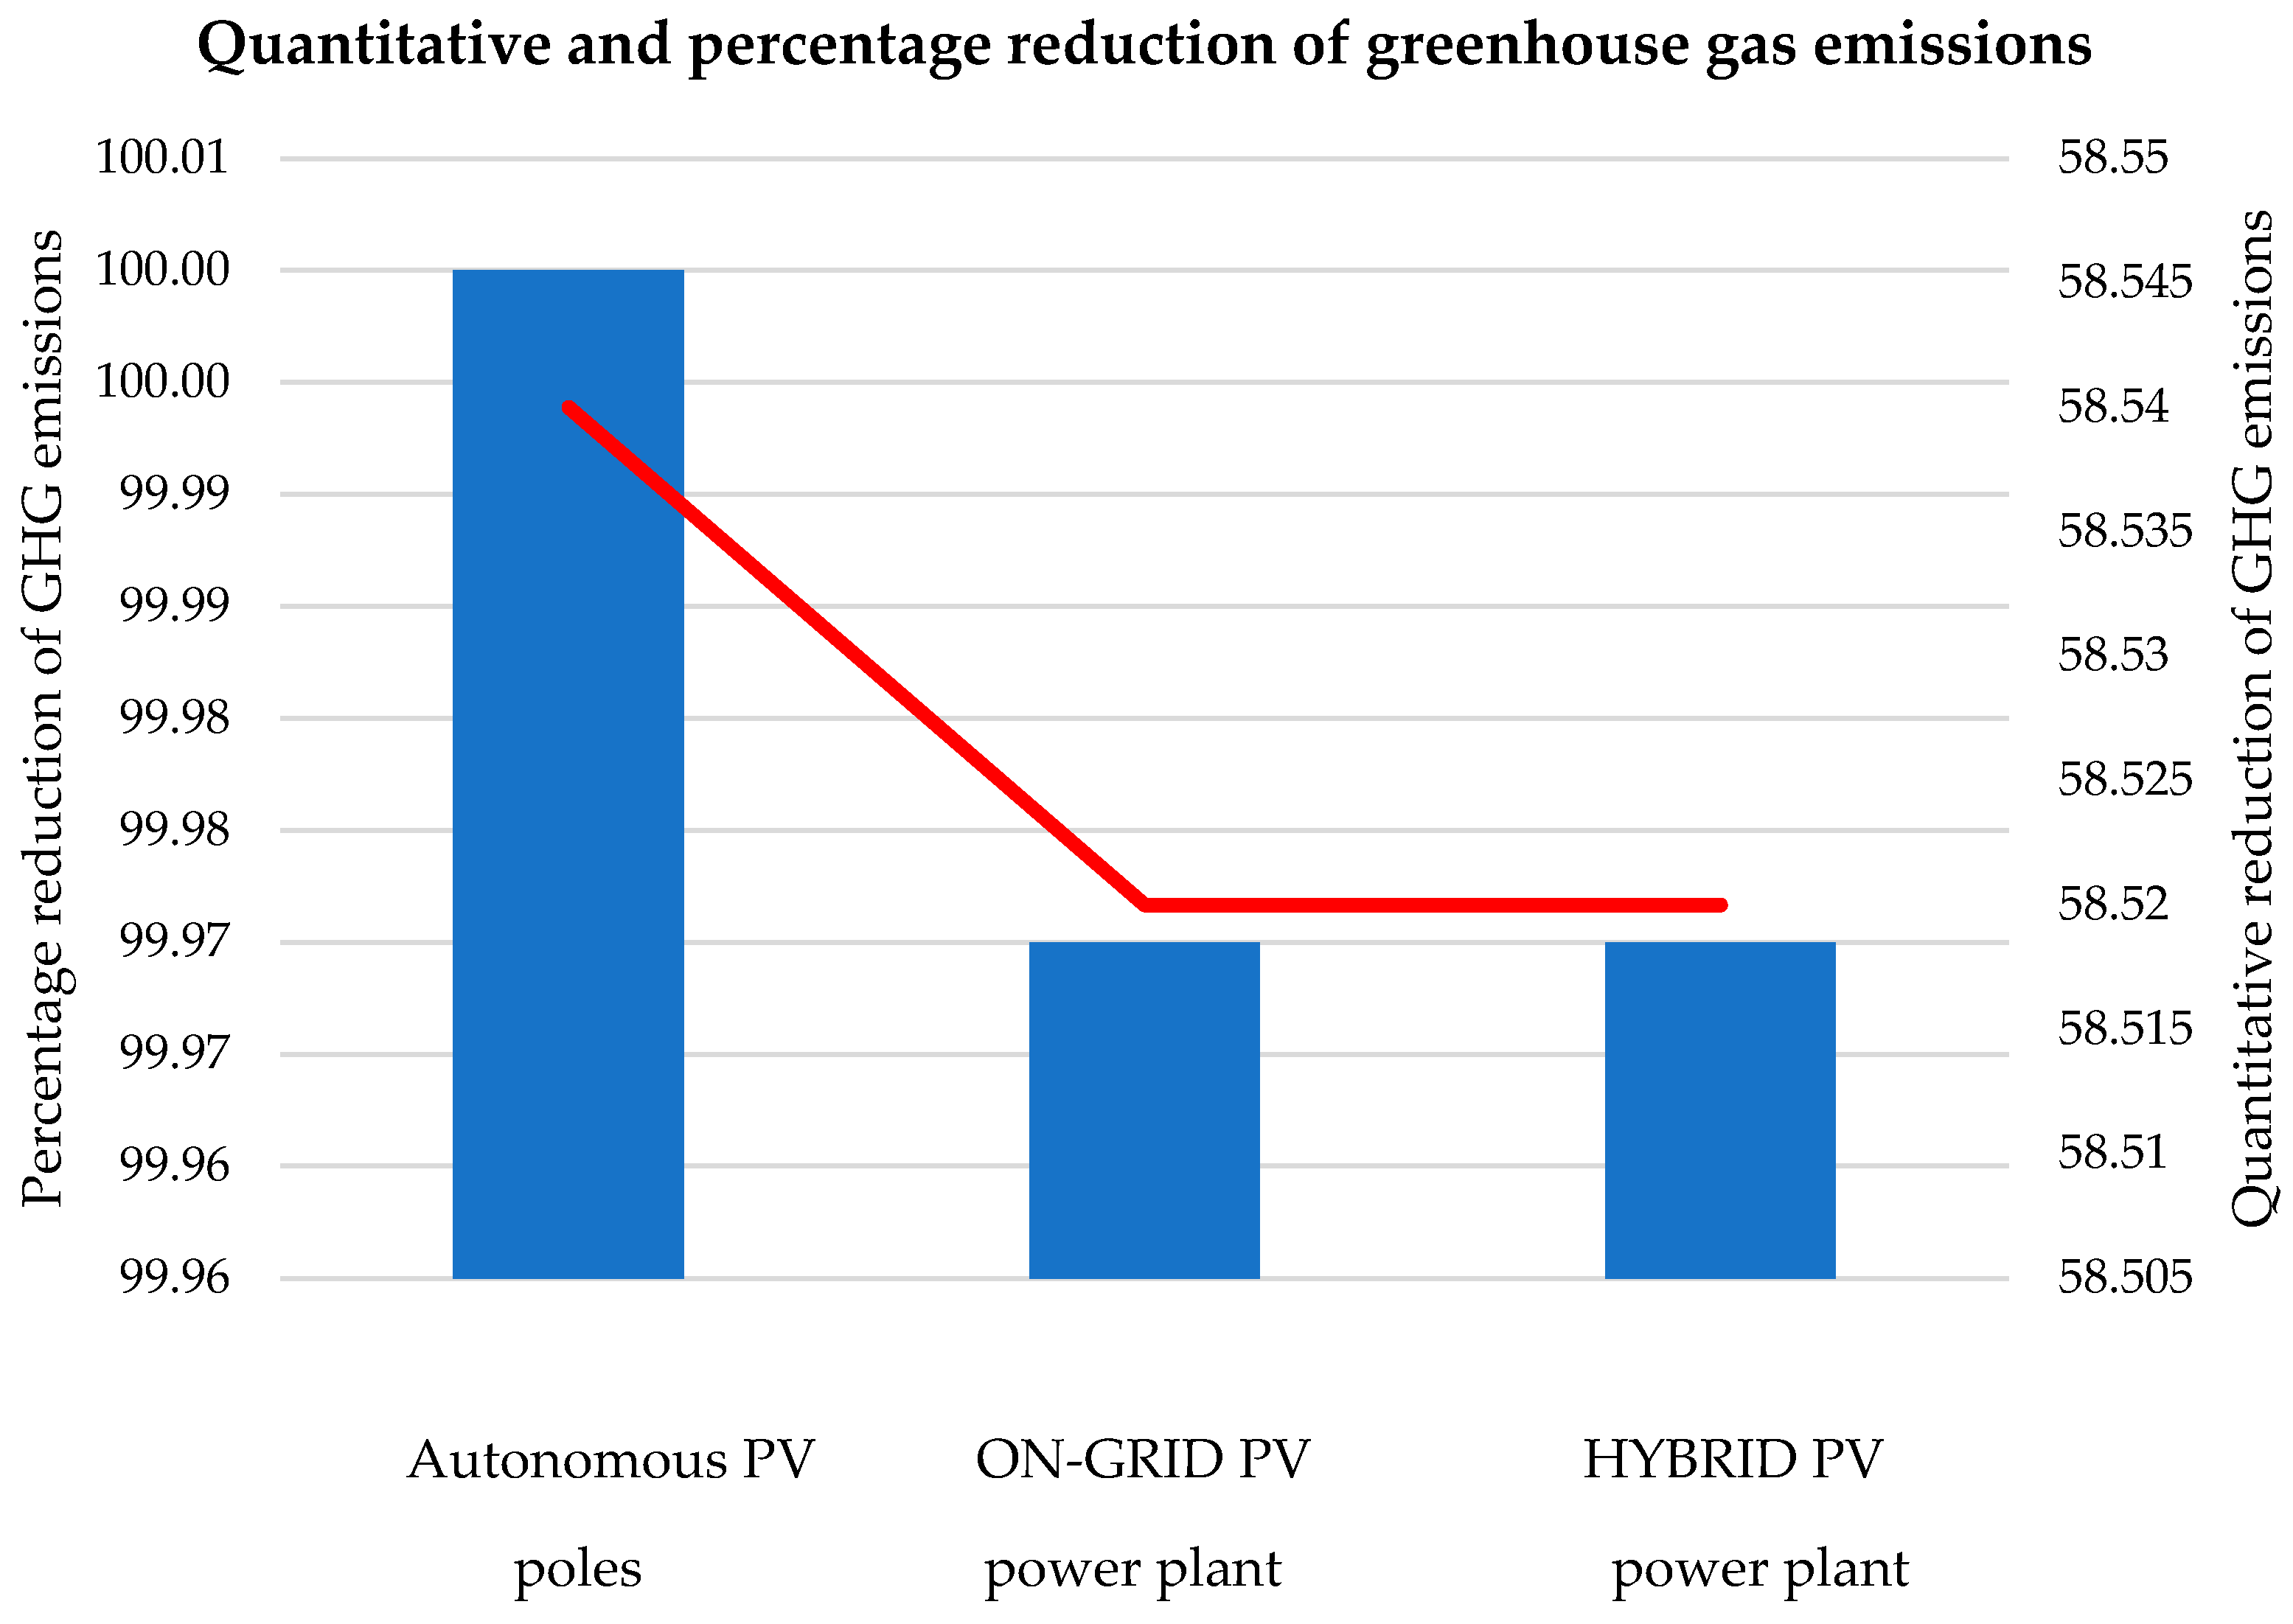
In terms of environmental impact, the current level of greenhouse gas emissions associated with electricity consumption from the grid is quantified at 58.52 metric tons of CO2 (tCO2), as shown in Figure 29. The implementation of the ON-GRID photovoltaic project results in a complete offset of this emission volume, achieving a reduction of 58.52 tCO2. This translates to an emissions mitigation rate of 99.97%, thereby underlining the project’s significant contribution to environmental sustainability and climate change mitigation.
The proposed ON-GRID photovoltaic solution for street lighting not only satisfies technical feasibility and economic efficiency criteria but also delivers substantial environmental benefits, positioning it as a robust and sustainable choice for modern urban energy systems.
In terms of achieving Sustainable Development Goal (SDG) 7, the present analysis makes an important contribution by studying the share of renewables in the energy mix, efficient LED luminaires, autonomous and modular energy solutions, and financial savings for municipalities. These findings highlight that PV-powered public lighting can significantly support SDG 7 by promoting clean energy access, improving energy efficiency, and enabling resilient infrastructure, especially in urban expansion zones and remote communities.
The analysis presented and the available details regarding costs allow comparisons with the situation in other geographical areas, different in terms of available solar radiation but also in terms of implementation costs.
Further development
Building upon the results and limitations outlined in this study, several opportunities for future research and practical improvements were identified. These directions aim to enhance the applicability, accuracy, and scalability of the current work, while also addressing unresolved challenges and exploring new dimensions of the topic.
Based on opportunities, the role of a large-capacity pumped storage power plant in electricity could be a good solution to store the surplus energy produced during the day by photovoltaic and wind systems. At night, electricity is produced by high-head pumped storage hydroelectric plants, which pump water from a lower storage lake to an upper storage lake, consuming the surplus electricity produced during the day from renewable energy sources.
The technical evolution of Romania’s energy sector must introduce the sixth dimension of the energy system—(6) electricity storage, alongside (1) energy sources, (2) production, (3) transmission, (4) distribution, and (5) consumption. In future studies, a broader, more global perspective could be adopted to analyze the adaptability and scalability of the proposed solutions under varying climatic and solar resource conditions.
It is not justified to implement small storage capacities for consumers but rather to implement large storage capacities that exhibit high economic efficiency, high efficiency, and contribute to the flexibility of the energy system. Electricity storage capacity is of particular importance, similar to the natural gas market. In terms of battery behavior, future studies could analyze the passive or active battery thermal management to ensure stability and an extended period of operation. Therefore, the smart lighting concept would permit solving the issues with batteries not fully loaded, coupled with an occupancy system.
The incorporation of detailed control algorithms and decision-making models for source switching and load prioritization, particularly for public lighting applications, together with battery management are immediate directions that will be conducted in future research. Also, the carbon intensity of nighttime electricity consumption, accounting for the evolving national energy mix over time, would generate more accurate results in terms of long-term impact.

Author Contributions

Conceptualization, V.-S.H., I.N. and N.-C.C.; methodology, V.-S.H., C.-D.G. and N.-C.C.; software, V.-S.H. and I.N.; validation, V.-S.H., C.-D.G. and I.G.; formal analysis, V.-S.H. and I.H.; investigation, V.-S.H., I.N., F.-E.Ț., M.V. and I.H.; resources, V.-S.H. and I.N.; data curation, V.-S.H., F.-E.Ț., C.-D.G., I.G. and I.H.; writing—original draft preparation, V.-S.H., M.V. and I.N.; writing—review and editing, V.-S.H., N.-C.C., C.-D.G. and I.H.; visualization, V.-S.H. and I.N.; supervision, V.-S.H. and C.-D.G.; project administration, V.-S.H.; funding acquisition, V.-S.H. and M.V. All authors have read and agreed to the published version of the manuscript.

Funding

This research received no external funding.

Institutional Review Board Statement

Not applicable.

Informed Consent Statement

Not applicable.

Data Availability Statement

Data are contained within the article.

Conflicts of Interest

The authors declare no conflicts of interest.

Nomenclature

Acronyms
PNIESCThe Project of the National Integrated Plan in the Field of Energy and Climate Change
EUEuropean Union
LEAOverhead Power Line
VWSVisual Weighted Score
PVPhotovoltaic
PVGISPhotovoltaic Geographical Information System
BMSBuilding Management System
UNIUpdated Net Income
PBTPayback Time
DPBTDiscounted Payback Time
GHGGreenhouse Gas
IRRInternal Rate of Return
UPSUninterruptible Power Supply
NVRNetwork Video Recorder
Parameters
LmAverage luminance [cd/m2]
UoGeneral luminance uniformity coefficient
UlLongitudinal luminance uniformity coefficient
TIThreshold increment
REILighting efficiency ratio
SDistance between poles [m]
HMounting height [m]
RClearance [m]
AOverhang (advancement) [m]

Appendix A

The annex contains additional information regarding the structure of autonomous systems for powering the lighting system for CR case—Table A1 and Figure A1, Figure A2 and Figure A3 and LR case—Table A2 and Figure A4, Figure A5 and Figure A6.
Table A1. The components of the autonomous photovoltaic pole—communal road.
ComponentParameterValueQuantity
Monocrystalline photovoltaic panel
[55]
Nominal electrical power300 W2 pieces
Nominal current9.17 A
Short-circuit current9.78 A
Nominal voltage32.70 V
Open circuit voltage39.80 V
Dimensions1.640 × 990 × 30 mm
Solar regulator [56]Maximum voltage 100 V1 piece
Maximum charging current15.00 A
Low-voltage disconnect22.00 V
Reconnect25.20 V
Boost charging voltage28.80 V
Overvoltage protectionYes
Reverse polarity protectionYes
Degree of protectionIP32
Size133.50 × 70 × 35 mm
Weight165 g
Gel solar battery [57]Nominal voltage12 V2 pieces
Capacity120 Ah
Dimensions (L × l × h)410 × 175 × 227 mm
Weight33.50 kg
LED street lighting fixture [58]Power60 W1 piece
Nominal voltage24 V
Degree of protectionIP65
LED typemultiled
Auxiliary materials [47,59,60,61,62,63]Battery box IP65, connectivity, protections, conductors, metal support, brackets, and OL-Zn collars--
Table A2. The components of the autonomous photovoltaic pole—local road.
ComponentParameterValueQuantity
Monocrystalline photovoltaic panel
[55]
Nominal electrical power250 W2 pieces
Nominal current9.33 A
Short-circuit current9.87 A
Nominal voltage26.80 V
Open circuit voltage32.84 V
Dimensions1.350 × 880 × 35 mm
Solar regulator [56]Maximum voltage 75 V1 piece
Maximum charging current10.00 A
Low-voltage disconnect22.00 V
Reconnect25.20 V
Boost charging voltage28.80 V
Overvoltage protectionYes
Reverse polarity protectionYes
Degree of protectionIP32
Size133.50 × 70 × 35 mm
Weight165 g
Gel solar battery [57]Nominal voltage12 V2 pieces
Capacity100 Ah
Dimensions (L × l × h)330 × 171 × 224 mm
Weight27.50 kg
LED street lighting fixture [58]Power50 W1 piece
Nominal voltage24 V
Degree of protectionIP65
LED typemultiled
Auxiliary materials [47,59,60,61,62,63]Battery box IP65, connectivity, protections, conductors, metal support, brackets, and OL-Zn collars--
Figure A1. Estimation of energy production for the OFF-GRID photovoltaic system—CR.
Sustainability 17 07179 g0a1
Figure A2. Battery performance for the OFF-GRID photovoltaic system—CR.
Sustainability 17 07179 g0a2
Figure A3. The battery charging percentage at the end of the day—CR.
Sustainability 17 07179 g0a3
Figure A4. Estimation of energy production for the OFF-GRID photovoltaic system—LR.
Sustainability 17 07179 g0a4
Figure A5. Battery performance for the OFF-GRID photovoltaic system—LR.
Sustainability 17 07179 g0a5
Figure A6. The battery charging percentage at the end of the day—LR.
Sustainability 17 07179 g0a6

References

  1. Cumo, F.; Pennacchia, E.; Sferra, A.S. Sustainability in Public Lighting: The Methodology for Identifying Environmentally Optimal Solutions in Replacement Planning—A Case Study. Energies 2025, 18, 535. [Google Scholar] [CrossRef]
  2. European Commission. Available online: https://climate.ec.europa.eu (accessed on 23 June 2025).
  3. UNDP. Sustainable Street Lighting, A Guide to Efficient Public Street Lighting for Lebanon; UNDP-CEDRO Publication: New York, NY, USA, 2015. [Google Scholar]
  4. Alboteanu, L.; Manolea, G. Photovoltaic Panels—Solutions for a Smart City (Panourile Fotovoltaice—Soluții pentru un oraș inteligent). AGIR Bull. 2017, 1, 69–75. [Google Scholar]
  5. Belloni, E.; Massaccesi, A.; Moscatiello, C.; Martirano, L. Implementation of a New Solar-Powered Street Lighting System: Optimization and Technical-Economic Analysis Using Artificial Intelligence. IEEE Access 2024, 12, 46657–46667. [Google Scholar] [CrossRef]
  6. Omar, A.; Almaeeni, S.; Attia, H.; Takruri, M.; Altunaiji, A.; Sanduleanu, M.; Shubair, R.; Ashhab, M.S.; al Ali, M.; al Hebsi, G. Smart City: Recent Advances in Intelligent Street Lighting Systems Based on IoT. J. Sens. 2022, 2022, 5249187. [Google Scholar] [CrossRef]
  7. Ministry of Energy. Romania’s Energy Strategy 2016–2030, with a View to 2050; Romania Ministry of Energy: Bucharest, Romania, 2016. [Google Scholar]
  8. Available online: https://www.transelectrica.ro/en/web/tel/home (accessed on 23 June 2025).
  9. National Energy Regulatory Authority. Report on the Results of the Electricity Market Monitoring in December 2023; National Energy Regulatory Authority: Ljubljana, Slovenia, 2023.
  10. Sustainable Street Lighting, Brighter Cities, Brighter Future. The Conoler Series. Available online: www.econoler.com (accessed on 23 June 2025).
  11. Velásquez, C.; Espín, F.; Castro, M.Á.; Rodríguez, F. Energy Efficiency in Public Lighting Systems Friendly to the Environment and Protected Areas. Sustainability 2024, 16, 5113. [Google Scholar] [CrossRef]
  12. Lv, Z.; Guo, H.; Zhang, L.; Liang, D.; Zhu, Q.; Liu, X.; Zhou, H.; Liu, Y.; Gou, Y.; Dou, X.; et al. Urban public lighting classification method and analysis of energy and environmental effects based on SDGSAT-1 glimmer imager data. Appl. Energy 2024, 355, 122355. [Google Scholar] [CrossRef]
  13. Molina-Moreno, V.; Utrilla, P.N.C.; Cortés-García, F.J.; Peña-García, A. The use of led technology and biomass to power public lighting in a local context: The case of baeza (Spain). Energies 2018, 11, 1783. [Google Scholar] [CrossRef]
  14. Meflah, A.; Chekired, F.; Drir, N.; Canale, L. Accurate Method for Solar Power Generation Estimation for Different PV (Photovoltaic Panels) Technologies. Resources 2024, 13, 166. [Google Scholar] [CrossRef]
  15. Available online: https://sdgs.un.org/goals/goal7 (accessed on 23 June 2025).
  16. Sorooshian, S. The sustainable development goals of the United Nations: A comparative midterm research review. J. Clean. Prod. 2024, 453, 142272. [Google Scholar] [CrossRef]
  17. Tavares, P.; Ingi, D.; Araújo, L.; Pinho, P.; Bhusal, P. Reviewing the Role of Outdoor Lighting in Achieving Sustainable Development Goals. Sustainability 2021, 13, 12657. [Google Scholar] [CrossRef]
  18. Valetti, L.; Piccablotto, G.; Taraglio, R.; Pellegrino, A. Long-Term Monitoring Campaign of LED Street Lighting Systems: Focus on Photometric Performances, Maintenance and Energy Savings. Sustainability 2023, 15, 16910. [Google Scholar] [CrossRef]
  19. Jettanasen, C.; Ngaopitakkul, A. Characteristics and Effects of Conducted Emission from Grid-Connected and Stand-Alone Micro-Inverters in a Nano-Grid Road Lighting System. Sustainability 2019, 11, 5690. [Google Scholar] [CrossRef]
  20. Pardo-Bosch, F.; Blanco, A.; Sesé, E.; Ezcurra, F.; Pujadas, P. Sustainable strategy for the implementation of energy efficient smart public lighting in urban areas: Case study in San Sebastian. Sustain. Cities Soc. 2022, 76, 103454. [Google Scholar] [CrossRef]
  21. Bian, J.; Yang, J.J. Smart Street Lighting Powered by Renewable Energy: A Multi-Criteria, Data-Driven Decision Framework. Sustainability 2025, 17, 5874. [Google Scholar] [CrossRef]
  22. Brusso, B.C.; Canale, L.; Hamady, M. History of Artificial Lighting, from Fire to LED [History]. IEEE Ind. Appl. Mag. 2025, 31, 10–25. [Google Scholar] [CrossRef]
  23. Faustino, R.; Lameirinhas, R.A.M.; Bernardo, C.P.C.V.; Torres, J.P.N.; Santos, M. Study of the application of solar cells in public lighting. Int. J. Innov. Res. Sci. Stud. 2025, 8, 543–559. [Google Scholar] [CrossRef]
  24. Allery, T.A.; Martino, A.; Begay, S. Solar Street Lighting: Using Renewable Energy for Safety for the Turtle Mountain Band of Chippewa. 2018. Available online: https://www.energy.gov/sites/prod/files/2018/11/f57/Allery-2018-solar-street-lighting.pdf (accessed on 23 June 2025).
  25. Ocana-Miguel, A.; Gago-Calderon, A.; Andres-Diaz, J.R. Experimental Outdoor Public Lighting Installation Powered by a Hydraulic Turbine Installed in the Municipal Water Supply Network. Water 2022, 14, 710. [Google Scholar] [CrossRef]
  26. Slimene, M.B.; Arbi Khlifi, M. Modelling and study of energy storage devices for photovoltaic lighting. Energy Explor. Exploit. 2020, 38, 1932–1945. [Google Scholar] [CrossRef]
  27. Zerari, H.; Messikh, L.; Kouzou, A.; Ouchtati, S. Smart energy management and monitoring system for public lighting system based on photovoltaic and storage systems. Electroteh. Electron. Autom. (EEA) 2021, 69, 5–10. [Google Scholar] [CrossRef]
  28. Baburajan, S.; Amin, F.; Zarooni, A.; Osman, A. Solar-powered LED Street Lighting System Case Study-American University of Sharjah, UAE. Saudi J. Eng. Technol. 2017, 2, 49–56. [Google Scholar] [CrossRef]
  29. Simanjuntak, I.U.V.; Dani, A.W.; Salamah, K.S.; Silalahi, L.M. Analysis of solar power public street lighting optimization with Pvsyst software in a residential complex area. Int. J. Electron. Telecommun. 2024, 70, 743–749. [Google Scholar] [CrossRef]
  30. Junisbekov, M.; Grigoryev, D.; Tolganbayeva, M.; Turgynbekov, Y.; Omirbekova, Z. Design, Simulation, and Analysis of a Solar-Powered Street Lighting Control System for Power Consumption Prediction. Preprints 2024, 2024120003. [Google Scholar] [CrossRef]
  31. Wang, Q.; Jiang, B.; Li, B.; Yan, Y. A critical review of thermal management models and solutions of lithium-ion batteries for the development of pure electric vehicles. Renew. Sustain. Energy Rev. 2016, 64, 106–128. [Google Scholar] [CrossRef]
  32. Kalkan, O.; Celen, A.; Bakirci, K. Experimental and numerical investigation of the LiFePO4 battery cooling by natural convection. J. Energy Storage 2021, 40, 102796. [Google Scholar] [CrossRef]
  33. Orejon-Sanchez, R.D.; Andres-Diaz, J.R.; Gago-Calderon, A. Autonomous photovoltaic led urban street lighting: Technical, economic, and social viability analysis based on a case study. Sustainability 2021, 13, 11746. [Google Scholar] [CrossRef]
  34. Pratama, S.G.; Namyra Alissa, R.A.D.; Nafis, R.F.; Arrayyan, A.Z.; Putra, K.T. Implementation and Feasibility Study of Solar-powered Streetlighting Systems in Rural Community Area. E3S Web Conf. 2023, 425, 05007. [Google Scholar] [CrossRef]
  35. M’hamed, R.; Boussemaha, B.; Mouaadh, Y.; Youcef, H.; Mohammed, D. Low cost of smart unilateral street lighting system with photovoltaic power plant using particle swarm optimization. Stud. Eng. Exact Sci. 2024, 5, e11658. [Google Scholar] [CrossRef]
  36. Liu, G. Sustainable feasibility of solar photovoltaic powered street lighting systems. Int. J. Electr. Power Energy Syst. 2014, 56, 168–174. [Google Scholar] [CrossRef]
  37. Sadeghian, O.; Mohammadi-Ivatloo, B.; Oshnoei, A.; Aghaei, J. Unveiling the potential of renewable energy and battery utilization in real-world public lighting systems: A review. Renew. Sustain. Energy Rev. 2024, 192, 114241. [Google Scholar] [CrossRef]
  38. Vargas-Salgado, C.; Montagud-Montalvá, C.; Alfonso-Solar, D.; Izquierdo-De-Andrés, L. Toward Carbon Neutrality: A Methodological Approach for Assessing and Mitigating Urban Emissions at the Neighborhood Level, Applied to Benicalap, Valencia. Sustainability 2025, 17, 5150. [Google Scholar] [CrossRef]
  39. Duman, A.C.; Güler, Ö. Techno-economic analysis of off-grid photovoltaic LED road lighting systems: A case study for northern, central and southern regions of Turkey. Build. Environ. 2019, 156, 89–98. [Google Scholar] [CrossRef]
  40. NP 062-2002; Norm for the Design of Road and Pedestrian Lighting Systems. MDPLA: Bucharest, Romania, 2002.
  41. EN 13201-1; 2015 Public Lighting—Part 1. Selection of Lighting Classes. CEN: Brussels, Belgium, 2016.
  42. EN 13201-2; 2016 Public Lighting—Part 2: Performance Requirements. CEN: Brussels, Belgium, 2016.
  43. EN 13201-3; 2016 Public Lighting—Part 3: Calculation of Performance. CEN: Brussels, Belgium, 2016.
  44. EN 13201-4; 2016 Public Lighting—Part 4: Methods for Measuring Photometric Performance. CEN: Brussels, Belgium, 2016.
  45. EN 13201-5; 2016 Public Lighting—Part 5: Energy Performance Indicators. CEN: Brussels, Belgium, 2016.
  46. European Union. Directive 2003/87/EC of the European Parliament and of the Council of 13 October 2003 Establishing a Scheme for Greenhouse Gas Emission Allowance Trading Within the Community and Amending Council Directive 96/61/EC; EU: Brussels, Belgium, 2003. [Google Scholar]
  47. Ciobanu, I. Increasing Energy Efficiency in Modern PUBLIC Lighting Systems (Creșterea Eficienței Energetice în Sistemele de Iluminat Public Moderne). Ph.D. Thesis, Polytechnic University of Bucharest, Bucharest, Romania, 2022. [Google Scholar]
  48. Available online: www.ro-electrice.ro (accessed on 23 June 2025).
  49. PE 136-1988; Republican Regulation for the Rational Use of Electricity in Artificial Lighting and Domestic Uses. Ministry of Development, Public Works and Administration: Bucharest, Romania, 1988.
  50. DIALux Evo. Lighting Design Software for Individual Rooms, Entire Buildings, Streets, Outdoor Areas and Emergency Lighting. Available online: https://www.dialux.com/en-GB/download (accessed on 23 June 2025).
  51. ORDER No. 49 of January 27, 1998: Technical Norms Regarding the Design, Construction and Modernization of Roads. Available online: https://legislatie.just.ro/Public/DetaliiDocument/15882 (accessed on 23 June 2025).
  52. Shahzad, K.; Čuček, L.; Sagir, M.; Ali, N.; Rashid, M.I.; Nazir, R.; Nizami, A.S.; Al-Turaif, H.A.; Ismail, I.M.I. An ecological feasibility study for developing sustainable street lighting system. J. Clean. Prod. 2018, 175, 683–695. [Google Scholar] [CrossRef]
  53. Available online: www.energyprod.ro (accessed on 23 June 2025).
  54. Photovoltaic Geographial Information System (PVGIS). Available online: https://re.jrc.ec.europa.eu (accessed on 23 June 2025).
  55. Aitio, A.; Howey, D.A. Predicting battery end of life from solar off-grid system field data using machine learning. Joule 2021, 5, 3204–3220. [Google Scholar] [CrossRef]
  56. Available online: www.depozitsolar.ro (accessed on 23 June 2025).
  57. Skandali, C.; Zerefos, S.; Tsangrassoulis, A.; Peña-García, A.; Triantafyllidis, G.A.; Zissis, G.; Doulos, L.T. Reviewing the parameters that affect sustainability and energy efficient concepts in road and urban lighting design. J. Clean. Prod. 2025, 490, 144607. [Google Scholar] [CrossRef]
  58. GEO 27-2022 Regarding the Measures Applicable to Final Customers in the Electricity and Natural Gas Market, as Well as for Amending and Supplementing Certain Normative Acts in the Energy Field. Available online: https://www.correggionet.eu/wp-content/uploads/2022/03/GEO-272022_EN.pdf (accessed on 23 June 2025).
  59. Available online: www.generatoare-solare.ro (accessed on 23 June 2025).
  60. European Comission. Commission Regulation (EU) No 601/2012 of 21 June 2012 on the monitoring and reporting of greenhouse gas emissions pursuant to Directive 2003/87/EC of the European Parliament and of the Council. Off. J. Eur. Union 2012, 181, 30–104. [Google Scholar]
  61. Available online: www.e-acumulatori.ro (accessed on 23 June 2025).
  62. Available online: www.electric14.ro (accessed on 23 June 2025).
  63. Available online: www.schrack.ro (accessed on 23 June 2025).
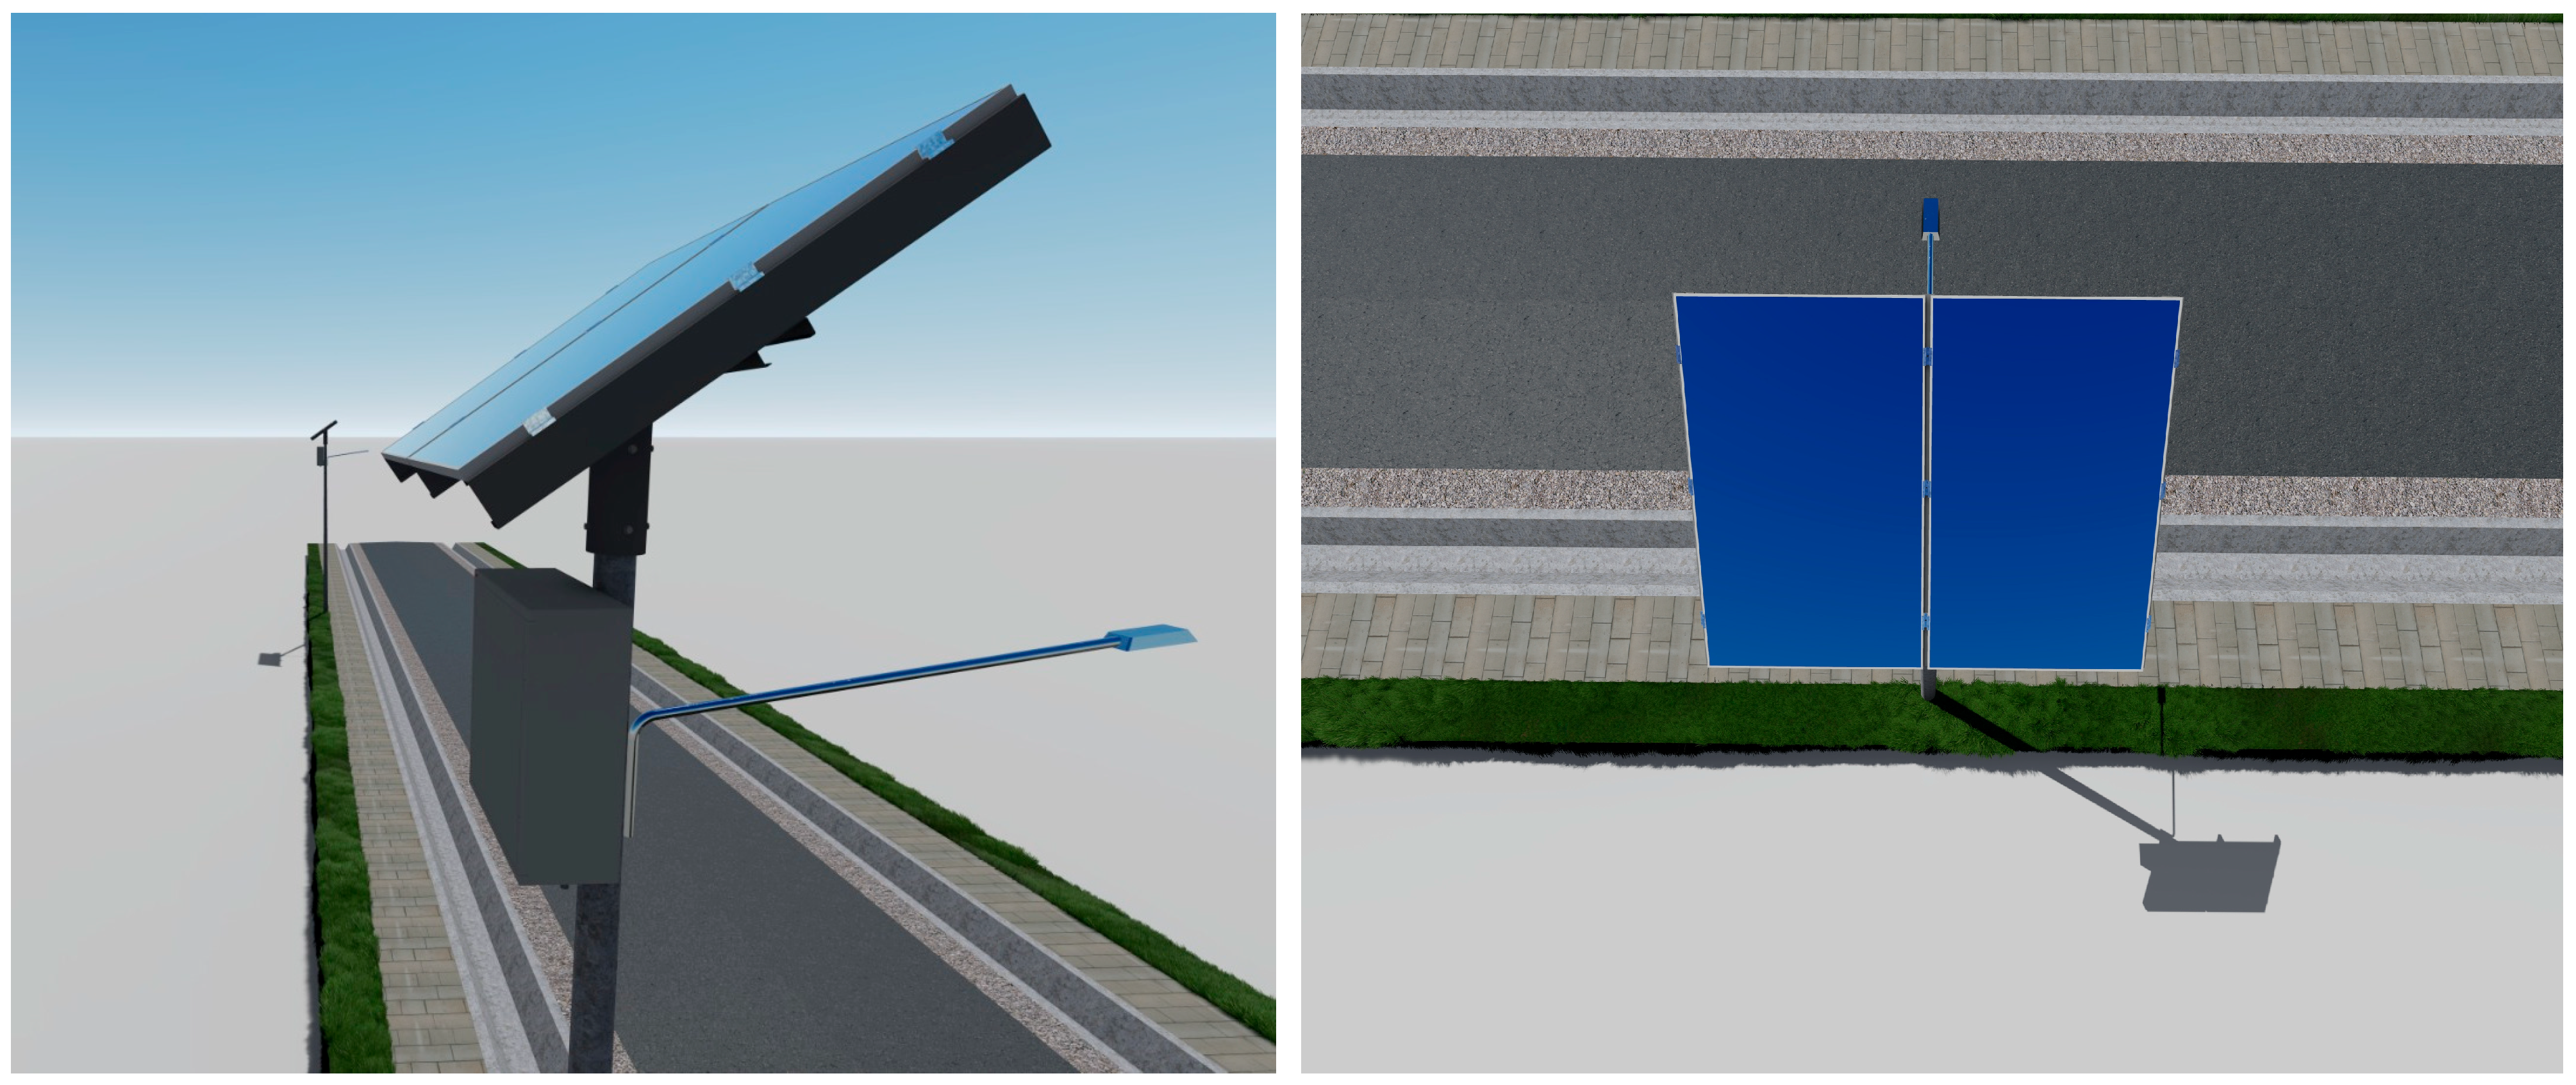
Figure 1. Three-dimensional analysis—aesthetic design for street lighting fixture, monocrystalline photovoltaic panels, battery box, and charge regulator mounted on the existing electric line poles.
Sustainability 17 07179 g001
Figure 2. Geometric characteristics of the lighting system in the national road area.
Sustainability 17 07179 g002
Figure 3. Road luminance [cd/m2] (iso-luminance curves), M4.
Sustainability 17 07179 g003
Figure 4. Road luminance [cd/m2] (value grid), M4.
Sustainability 17 07179 g004
Figure 5. Geometric characteristics of the lighting system in the communal road area.
Sustainability 17 07179 g005
Figure 6. Horizontal luminance [cd/m2] (iso-luminance curves), M5.
Sustainability 17 07179 g006
Figure 7. Horizontal luminance [cd/m2] (value grid), M5.
Sustainability 17 07179 g007
Figure 8. Geometric characteristics of the lighting system in the local road area.
Sustainability 17 07179 g008aSustainability 17 07179 g008b
Figure 9. Horizontal luminance [cd/m2] (iso-luminance curves), M6.
Sustainability 17 07179 g009
Figure 10. Horizontal luminance [cd/m2] (value grid), M6.
Sustainability 17 07179 g010
Figure 11. Three-dimensional analysis—night frontal view of the street lighting system.
Sustainability 17 07179 g011
Figure 12. Three-dimensional analysis—aerial view of the street lighting system.
Sustainability 17 07179 g012
Figure 13. Three-dimensional qualitative analysis—daytime perspective view.
Sustainability 17 07179 g013
Figure 14. Estimation of energy production for the photovoltaic system OFF-GRID—NR.
Sustainability 17 07179 g014
Figure 15. Battery performance for the photovoltaic system OFF-GRID—NR.
Sustainability 17 07179 g015
Figure 16. Battery charge percentage at the end of the day—NR.
Sustainability 17 07179 g016
Figure 17. The monthly energy production from the fixed-tilt photovoltaic system.
Sustainability 17 07179 g017
Figure 18. Battery performance for the photovoltaic system.
Sustainability 17 07179 g018
Figure 19. The battery charging percentage at the end of the day.
Sustainability 17 07179 g019
Figure 20. Cumulative cash flow for the considered 20-year period—local photovoltaic system.
Sustainability 17 07179 g020
Figure 21. Cumulative cash flow for the 20 years considered—grid-connected photovoltaic system.
Sustainability 17 07179 g021
Figure 22. Cumulative cash flow for the 20 years considered—HYBRID photovoltaic system.
Sustainability 17 07179 g022
Figure 23. Comparative chart of analyzed scenarios: investment value.
Sustainability 17 07179 g023
Figure 24. Comparative chart of analyzed scenarios: maintenance costs.
Sustainability 17 07179 g024
Figure 25. Comparative chart of analyzed scenarios: payback period.
Sustainability 17 07179 g025
Figure 26. Comparative chart of analyzed scenarios: net present value.
Sustainability 17 07179 g026
Figure 27. Comparative chart of analyzed scenarios: internal rate of return.
Sustainability 17 07179 g027
Figure 28. Comparative graph of analyzed scenarios: cash flow.
Sustainability 17 07179 g028
Figure 29. Comparative graph of analyzed scenarios: quantitative and percentage reduction in GHG emissions.
Sustainability 17 07179 g029
Table 1. Installed power of lighting fixtures.
Road ClassPower of the Lighting
Fixture [W]
Number of Lighting FixturesInstalled Power
[kW]
Technical class II (national road—M4)10018018.00
Technical class IV (communal road—M5)60462.76
Technical class IV
(local road—M6)
5050025.00
TOTAL45.76
Table 2. Estimation of the energy consumption of the analyzed public lighting system.
Estimation of the Energy Consumption of the Analyzed Public Lighting System.
MonthOperating HoursInstalled Power
[kW]
Monthly Energy Consumption [kWh]
January432.4545.7619,788.91
February346.3645.7615,849.43
March343.1745.7615,703.46
April279.0045.7612,767.04
May268.1545.7612,270.54
June219.0045.7610,021.44
July244.2845.7611,178.25
August279.0045.7612,767.04
September321.0045.7614,688.96
October358.6745.7616,412.74
November397.5045.7618,189.60
December389.0545.7617,802.93
Table 3. Schedule for switching on and off public lighting, with monthly adjustment [48].
Schedule for Switching On and Off Public Lighting, with Monthly Adjustment (Considering the Average Values)
No. Crt.MonthPeriodZone 1
Switch-On TimeSwitch-Off Time
01234
1January1–3117:227:17
2February1–2818:006:37
3March1–31 18:405:47
4April1–30 19:174:47
5May1–31 19:524:17
6June1–30 20:223:52
7July1–31 20:124:00
8August1–31 19:374:37
9September1–30 18:525:22
10October1–31 18:005:57
11November1–30 17:106:35
12December1–31 18:527:07
Table 4. Selection of the lighting class for the national road [32].
ParameterOptionsEvaluation Index VWSSelected Criterion
National RoadCommunal RoadLocal Road
VelocityVery high (V ≥ 100 km/h)20−1−1
High (70 < V < 100 km/h)1
Moderate (40 < V < 70 km/h)0
Low (V ≤ 40 km/h)−1
Traffic volumeHigh100−1
Moderate0
Low−1
Traffic compositionMixed, with a high percentage of non-motorized vehicles2111
Mixt1
Only motorized vehicles0
Separation of traffic directionsNo1111
Yes0
Intersection densityHigh (>3/km)1111
Moderate (≤3/km)0
Parked vehiclesYes1000
No0
Ambient lightingHigh1−1−1−1
Moderate0
Low−1
Navigation loadPoor1000
Good0
Very good−1
Sum of weighted values (VWS)210
The lighting class number is calculated as follows: M = 6 − VWS
Resulting lighting classM4M5M6
Table 5. National road—lighting system class M4.
National Road—Lighting System Class M4
Characteristics
Distance between poles40.00 m
Height of the light point9.00 m
Bracket extension of the light point4.00 m
Overhang (advancement) (A)−2.00 m
Bracket tilt15°
Bracket length2.00 m
Table 6. Parameters calculated for NR—M4.
ParameterCalculatedNominal
Lm0.76 cd/m2≥0.75 cd/m2
Uo0.58≥0.40
UI0.81≥0.60
TI15%≥15%
REI0.68≥0.30
Table 7. Communal road—lighting system class M5.
Communal Road—Lighting System Class M5
Parameter
Distance between poles50.00 m
Height of the light point8.00 m
Clearance (R)1.50 m
Bracket extension of the light point−0.50 m
Bracket tilt15°
Bracket length1.00 m
Table 8. Parameters calculated for CR—M5.
ParameterCalculatedNominal
Lm0.51 cd/m2≥0.50 cd/m2
Uo0.44≥0.35
UI0.47≥0.40
TI15%≥15%
REI0.79≥0.30
Table 9. Local road—lighting system class M6.
Local Road—Lighting System Class M6
Parameter
Distance between poles50.00 m
Height of the light point8.00 m
Clearance (R)0.80 m
Bracket extension of the light point0.20 m
Bracket tilt15°
Bracket length1.00 m
Table 10. Parameters calculated for LR—M6.
ParameterCalculatedNominal
Lm0.44 cd/m2≥0.30 cd/m2
Uo0.44≥0.35
UI0.45≥0.40
TI12%≥20%
REI0.72≥0.30
Table 11. Components of the autonomous photovoltaic pole—national road.
ComponentParameterValueQuantity
Monocrystalline photovoltaic panel [33] Nominal electrical power550 W2 pieces
Nominal current13.20 A
Short-circuit current14.00 A
Nominal voltage41.70 V
Open circuit voltage49.60 V
Dimensions2.261 × 1134 × 30 mm
Solar regulator [34]Maximum voltage 100 V1 piece
Maximum charging current15.00 A
Low-voltage disconnect22.00 V
Reconnect25.20 V
Boost charging voltage28.80 V
Overvoltage protectionYes
Reverse polarity protectionYes
Degree of protectionIP32
Size133.50 × 70 × 35 mm
Weight165 g
Gel solar battery [35]Nominal voltage12 V2 pieces
Capacity150 Ah
Dimensions (L × l × h)485 × 172 × 240 mm
Weight44 kg
LED street lighting fixture [36]Power100 W1 piece
Nominal voltage24 V
Degree of protectionIP65
LED typemultiled
Auxiliary materials [20,37]Battery box IP65, connectivity, protections, conductors, metal support, brackets, and OL-Zn collars
Table 12. Implementation costs of the investment—local photovoltaic system.
DescriptionEuro
(Including VAT)
PiecesTotal Euro
(Including VAT)
Obj. 1 Remove existing lighting fixtures25.8572618,763.42
1.1. Remove existing lighting fixtures25.8572618,763.42
Obj. 2 Autonomous photovoltaic pole—NR (M4)1854.41180333,793.64
2.1. Equipment1150.50180207,089.17
 2.1.1. Monocrystalline photovoltaic panel 550 W157.7936056,803.54
 2.1.2. Charge controllers 100 V 15 A73.3418013,201.93
 2.1.3. Solar battery 12 V 150 Ah331.27360118,999.04
 2.1.4. LED lighting fixture 24 V 100 W100.4718018,084.65
2.2. Street photovoltaic pole487.7718087,798.03
2.3. Installation of machinery/equipment216.1518038,906.45
Obj. 3 Autonomous photovoltaic pole—CR (M5)1453.804666,874.69
3.1. Equipment752.464634,613.41
 3.1.1. Monocrystalline photovoltaic panel 300 W110.079210,126.16
 3.1.2. Charge controllers 100 V 15 A73.34463373.83
 3.1.3. Solar battery 12 V 120 Ah247.567217,824.51
 3.1.4. LED lighting fixture 24 V 60 W71.50463288.91
3.2. Street photovoltaic pole485.184622,318.52
3.3. Installation of machinery/equipment216.15469942.76
Obj. 4 Autonomous photovoltaic pole—LR (M6)1352.20500676,098.15
4.1. Equipment650.87500325,432.06
 4.1.1. Monocrystalline photovoltaic panel 250 W110.321000110,319.80
 4.1.2. Charge controllers 75 V 10 A73.3450036,672.04
 4.1.3. Solar battery 12 V 100 Ah158.651000158,646.74
 4.1.4 LED lighting fixture 24 V 60 W39.5950019,793.48
4.2. Street photovoltaic pole485.18500242,592.63
4.3. Installation of machinery/equipment216.15500108,073.46
TOTAL1750.927261,271,170.15
TOTAL C + I777.22726564,263.86
Table 13. Feasibility indicators of the proposed measures.
DescriptionUnitValue
Total investment valueEUR1,271,170.15
Maintenance costsEUR729,290.55
The value of the economy per yearEUR91,173.99
Net Present Income (NPI)EUR−176,980.80
Discount rate%5
Lifespan of the solutionYEARS20
Payback Time (PBT)YEARS13.94
Discounted Payback Time (DPBT)YEARS21.94
Internal rate of return (IRR)%−13.92
Table 14. Implementation costs of the investment—grid-connected central photovoltaic system.
DescriptionTotal Euro
(Including VAT)
Obj. 1 Utilities87,076.34
1.1. Electric connection79,719.02
1.2. Telecommunications—data voice7357.32
Obj. 2 Land development79,695.46
2.1. Removal of the topsoil layer (2.448 m2)7965.32
2.2. Fencing (203.00 m, with a 4.00 m vehicle access gate and a 1.00 m pedestrian access gate)30,164.68
2.3. Foundations for lighting poles4920.10
2.4. Container platforms for personnel and transformer station 16,058.21
2.5. Access road made of stone (40.00 m)20,587.14
Obj. 3 Photovoltaic power plant 153,90 kWp373,524.51
3.1. Foundations for metal supports58,907.70
3.2. Supports for photovoltaic panels122,241.18
3.3. Wiring and accessories101,313.45
3.4. Grounding21,204.10
3.5. Junction boxes for PV (22 pieces)32,711.14
3.6. Photovoltaic power plant panel board14,479.95
3.7. Earthworks16,217.02
3.8. Lighting poles (6 pieces)4641.87
3.9. Transport1808.09
Obj. 4 Video surveillance subsystem14,747.55
4.1. Earthworks6105.62
4.2. Trenches and cables3110.25
4.3. Equipment4232.23
4.4. Transport1299.46
Obj. 5 Installation of machines/equipment150,156.38
5.1. Equipment129,768.38
 5.1.1. Monocrystalline photovoltaic panel 450 W (342 pieces)103,015.46
 5.1.2. 60 kW three-phase grid-connected inverter (3 pieces)21,422.51
 5.1.3. UPS 3000 VA 2U RACK2377.98
 5.1.4. Outdoor video surveillance camera (12 pieces)1017.56
 5.1.5. NVR 32 CH703.30
 5.1.6. Street lighting fixture LED 80 W1231.57
5.2. Installation of machinery/equipment20,388.01
TOTAL773,977.22
TOTAL C + I611,300.46
Table 15. Feasibility indicators of the proposed measures.
DescriptionUnitValue
Total investment valueEUR773,977.22
Maintenance costsEUR75,943.55
Annual savings valueEUR91,140.36
Net Present Income (NPI)EUR972,886.48
Discount rate%5
Lifespan of the solutionYEARS20
Payback Time (PBT)YEARS8.49
Discounted Payback Time (DPBT)YEARS9.33
Internal rate of return (IRR) %125.70
Table 16. Implementation costs of the investment—HYBRID central photovoltaic system.
DescriptionTotal Euro
(Including VAT)
Obj. 1 Utilities—similar to grid-connected PV system87,076.34
Obj. 2 Land development—similar to grid-connected PV system79,695.46
Obj. 3 Photovoltaic power plant 153.90 kWp422,934.97
3.1.–3.9. Similar to grid-connected PV system373,524.51
3.10. Concrete platforms and containers (energy storage system)49,410.46
Obj. 4 Video surveillance subsystem14,747.55
Obj. 5 Installation of machines/equipment586,878.97
5.1. Equipment530,978.10
 5.1.1. Monocrystalline photovoltaic panel 450 W (342 pieces)103,015.46
 5.1.2. 60 kW three-phase grid-connected inverter (3 pieces)56,923.80
 5.1.3. UPS 3000 VA 2U RACK2377.98
 5.1.4. Outdoor video surveillance camera (12 pieces)1017.56
 5.1.5. NVR 32 CH703.30
 5.1.6. Street lighting fixture LED 80 W1231.57
 5.1.7. Lithium-ion battery storage system B-BOX 13.80 kW (50 pieces)365,708.44
5.2. Installation of machinery/equipment55,900.87
TOTAL1,574,660.16
TOTAL C + I938,978.40
Table 17. Feasibility indicators of the proposed measures.
DescriptionUnitValue
Total investment valueEUR1,574,660.16
Maintenance costsEUR949,388.73
Annual savings valueEUR91,140.36
Net Present Income (NPI)EUR−701,241.65
Discount rate%5
Lifespan of the solutionYEARS20
Payback Time (PBT)YEARS17.28
Discounted Payback Time (DPBT)YEARS27.69
Internal rate of return (IRR) %−44.53
Table 18. Economic sensitivity to fluctuations in electricity pricing and maintenance costs.
ScenarioCase 1Case 2Case 3
Favorable scenario2,502,4288,873,577−327,061
Unfavorable scenario−773,7084,298,485−3,163,473
Table 19. SWOT analysis of the studied cases.
AspectAutonomous PV PolesON-GRID PV Power PlantHYBRID PV System (PV + Battery + Grid Backup)
Strengths- Full energy independence
- Modular and easy to deploy
- No grid connection required
- Lower cost per kWh at scale
- Economically efficient for large deployments
- Easier to monitor and maintain
- Combines autonomy and efficiency
- Provides backup during grid outages
- High resilience and flexibility
Weaknesses- Limited storage capacity
- Sensitive to adverse weather
- Higher unit cost
- Fully dependent on grid availability
- Requires centralized space
- Potential distribution losses
- Higher upfront cost (PV + battery)
- More complex to manage
- Needs dual maintenance
Opportunities- Suitable for remote/off-grid areas
- Can be integrated into smart city projects
- Easy to scale gradually
- Surplus energy can be fed into the grid
- Eligible for support schemes (e.g., feed-in tariff, net metering)
- Ideal for urban municipalities
- Suitable for unstable grid regions
- Can participate in demand–response programs
- Scalable and future-proof
Threats- Battery aging and degradation
- Blackout risk in poor solar conditions
- Legal risk in case of failures
- Vulnerable to energy price fluctuations
- Regulatory risk regarding grid injection
- May face grid capacity limits
- Higher long-term costs (battery replacement)
- Risk of over-engineering for small applications
- More points of failure
Disclaimer/Publisher’s Note: The statements, opinions and data contained in all publications are solely those of the individual author(s) and contributor(s) and not of MDPI and/or the editor(s). MDPI and/or the editor(s) disclaim responsibility for any injury to people or property resulting from any ideas, methods, instructions or products referred to in the content.