Article

Risk Assessment of Flood Disasters with Multi-Source Data and Its Spatial Differentiation Characteristics

1
School of Safety Science and Emergency Management, Wuhan University of Technology, Wuhan 430070, China
2
Hubei Provincial Research Center for Crisis and Disaster Emergency Management, Wuhan University of Technology, Wuhan 430070, China
3
School of Geological Engineering, Qinghai University, Xining 810016, China
*
Author to whom correspondence should be addressed.
Sustainability 2025, 17(15), 7149; https://doi.org/10.3390/su17157149
Submission received: 23 June 2025 / Revised: 1 August 2025 / Accepted: 1 August 2025 / Published: 7 August 2025
(This article belongs to the Special Issue Sustainable Transport and Land Use for a Sustainable Future)

Abstract

The changing global climate and rapid urbanization make extreme rainstorm events frequent, and the flood disaster caused by rainstorm has become a prominent problem of urban public safety in China, which severely restricts the healthy and sustainable development of social economy. The weight calculation method of traditional risk assessment model is single and ignores the difference of multi-dimensional information space involved in risk analysis. This study constructs a flood risk assessment model by incorporating natural, social, and economic factors into an indicator system structured around four dimensions: hazard, exposure, vulnerability, and disaster prevention and mitigation capacity. A combination of the Analytic Hierarchy Process (AHP) and the entropy weight method is employed to optimize both subjective and objective weights. Taking the central urban area of Wuhan with a high flood risk as an example, based on the risk assessment values, spatial autocorrelation analysis, cluster analysis, outlier analysis, and hotspot analysis are applied to explore the spatial clustering characteristics of risks. The results show that the overall assessment level of flood hazard in central urban area of Wuhan is medium, the overall assessment level of exposure and vulnerability is low, and the overall disaster prevention and mitigation capability is medium. The overall flood risk levels in Wuchang and Jianghan are the highest, while some areas in Qingshan and Hanyang have the lowest levels. The spatial characteristics of each dimension evaluation index show obvious autocorrelation and spatial differentiation. These findings aim to provide valuable suggestions and references for reducing urban disaster risks and achieving sustainable urban development.

1. Introduction

The changing global climate and rapid urbanization have contributed to more frequent and intense extreme weather phenomena. The resulting flood disasters still have a serious impact on many parts of the world and are on rise [1]. Wuhan has a large number of rivers and streams, and with its high precipitation, the city is prone to flood disasters. In 2016, the flood disaster that occurred in Wuhan resulted in 14 deaths and 1 person missing, with the direct economic loss estimated to exceed 22.65 billion yuan. It is worth noting that 85% of the flooded areas in this disaster were located in Wuhan’s central districts [2]. From the distribution of flood areas, it is evident that the temporal and spatial variability of urban rainfall does not match its flood control and disaster mitigation capacity. Additionally, as demonstrated by Wang et al. [3], climate and urbanization pressures may further enlarge flood-affected zones in Wuhan, reflecting the growing and sustained flood risk in the metropolitan region. Therefore, studying the spatial distribution differences of flood disaster risks is of critical importance for strengthening the flood prevention planning and management of the city.
To mitigate flood-induced losses, Scholars have conducted extensive research on flood disaster risk assessment, and four main assessment approaches have been developed to date. The first risk assessment method is the historical data statistical method [4,5], which analyzes the collected historical data and then evaluates the flood disaster risk. However, this method requires a great deal of data to analyze the time series and dynamic changes of disasters, and it is difficult to ensure the integrity of data [6]. The second approach is the indicator system method [7], which, similar to multi-criteria techniques, typically integrates multiple factors to assess the influence of each indicator on the overall risk evaluation. However, the evaluation indicators determined by this method through expert judgment make the result of risk assessment subjective to a certain extent [8]. The third method is the combination of GIS and remote sensing technology, which has been widely used in the drawing of flood risk maps [9]. The fourth method is the scenario simulation method [10], which inputs topographic data and rainfall conditions into the hydrodynamic model to predict the future flood risk. However, this method has high requirements on computer performance, and is currently mostly used for flood risk research in small areas [11]. Among the above methods, the index system method is widely employed in the risk assessment and analysis of different disasters because it is easier to operate and implement and has more efficient data utilization. Among them, the analytic hierarchy process (AHP) is the most widely used. This method demonstrates the relationships between factors by layering them, providing a reasonable framework for decision-making [12,13,14]. However, the AHP depends on the cognitive level and judgment of experts and is highly subjective. Therefore, it is necessary to combine the analytic hierarchy process with other quantitative methods to achieve optimization. The entropy weight method is an objective approach to determining weights based on data characteristics [15]. Wu et al. [16] applied an integrated approach combining AHP and the entropy weight method to assess flood risks in the Huai River Basin across multiple time periods. The results showed that this method is simple to operate and can significantly improve the assessment effectiveness. In order to mitigate the impact of human subjectivity on the assessment results, the weights of the indicators are determined using a hybrid method integrating AHP and the entropy method.
Although the distribution range of flood disaster risk in the study region can be determined by risk assessment methods such as index system method, it is difficult to find specific prevention positions directly from the risk distribution map. For this reason, some scholars have conducted studies on the spatiotemporal distribution characteristics of flood disasters. Taking Chongqing as an example, Cai et al. [17] used spatial statistical technology to analyze the local flood disaster risk hotspots in mountainous cities. The results show that there is spatial correlation of flood risk in Chongqing, and the risk hotspots are mainly in the main urban region and adjacent to the Yangtze River. Gao et al. [18] carried out a detailed investigation into the spatial distribution of flood risk in the Beijing-Tianjin-Hebei region, and the results showed that this region showed a strong clustering effect in space. Zhang et al. [19] used spatial analysis technology to analyze the distribution of waterlogging hot spots in Guangzhou, and the results demonstrated that the historical urban regions of Guangzhou were the major hotspots for waterlogging events, and showed a single-core aggregation pattern.
The existing research has made good progress in flood disaster risk assessment. However, the existing analysis on the weight of evaluation indicators focuses on qualitative or quantitative analysis, and the research combining qualitative analysis and quantitative analysis needs to be perfected. In addition, most current studies on flood disaster risk are carried out in urban macro-scale or administrative divisions, focusing on measuring the overall level of flood risk within a region, but ignoring multidimensional risk information and failing to reveal the inherent spatial differences of risk. Therefore, this paper studies the spatial attributes of flood risk distribution from three aspects: risk identification, spatial correlation analysis and cluster analysis, aiming at providing suggestions for urban flood control planning and management. Firstly, this research develops a multi-dimensional index system for flood disaster risk assessment, encompassing hazard, exposure, vulnerability, and disaster prevention and mitigation capacity. Secondly, the analytic hierarchy process (AHP) and entropy method were utilized to assign index weights. The flood risk index was then calculated and spatially analyzed in ArcGIS to determine risk distribution within the study region. Finally, according to the flood disaster risk value, the spatial correlation analysis and cluster analysis are carried out to determine the geographic distribution characteristics and clustering trend of flood disaster risk.

2. Study Area

Figure 1 depicts the study area as the central urban region of Wuhan, China, which incorporates the seven districts of Jiangan, Jianghan, Qiaokou, Hanyang, Wuchang, Qingshan, and Hongshan. Climatically, Wuhan is located in a humid northern subtropical monsoon zone, with an average annual rainfall of 1150–1450 mm. Most of the rainfall occurs from May to August, accounting for approximately 63% of the total annual precipitation [20]. The study area is distributed along the Yangtze River and Han River, and there are many lakes around it, making these areas prone to flood disasters. In terms of social economy, the urbanization rate of Wuhan is 80.04% in 2017 [21]. The study area is a relatively densely populated area in Wuhan, and flood disasters will cause heavy casualties and property losses. Historically, the entire urban area of Wuhan was submerged during the major floods in 1870 and 1931 [22]. Recent records show that in July 2016, Wuhan was hit by heavy rainstorms, resulting in severe flooding in the main urban area, affecting up to one million people and causing direct economic losses of 3.996 billion yuan [21].

3. Materials and Methods

3.1. Data Source

This study selected some representative indicators from four dimensions: flood disaster hazard, exposure, vulnerability and disaster prevention and mitigation capability. These indicators cover three aspects: nature, economy and society. The study also incorporates the specific characteristics of Wuhan’s central urban area, such as its low-lying landscape, dense river network, high population concentration, active economic sectors, and well-developed medical infrastructure. The evaluation indicators used and their data sources are summarized in Table 1.

3.2. Analysis of Risk Indicators

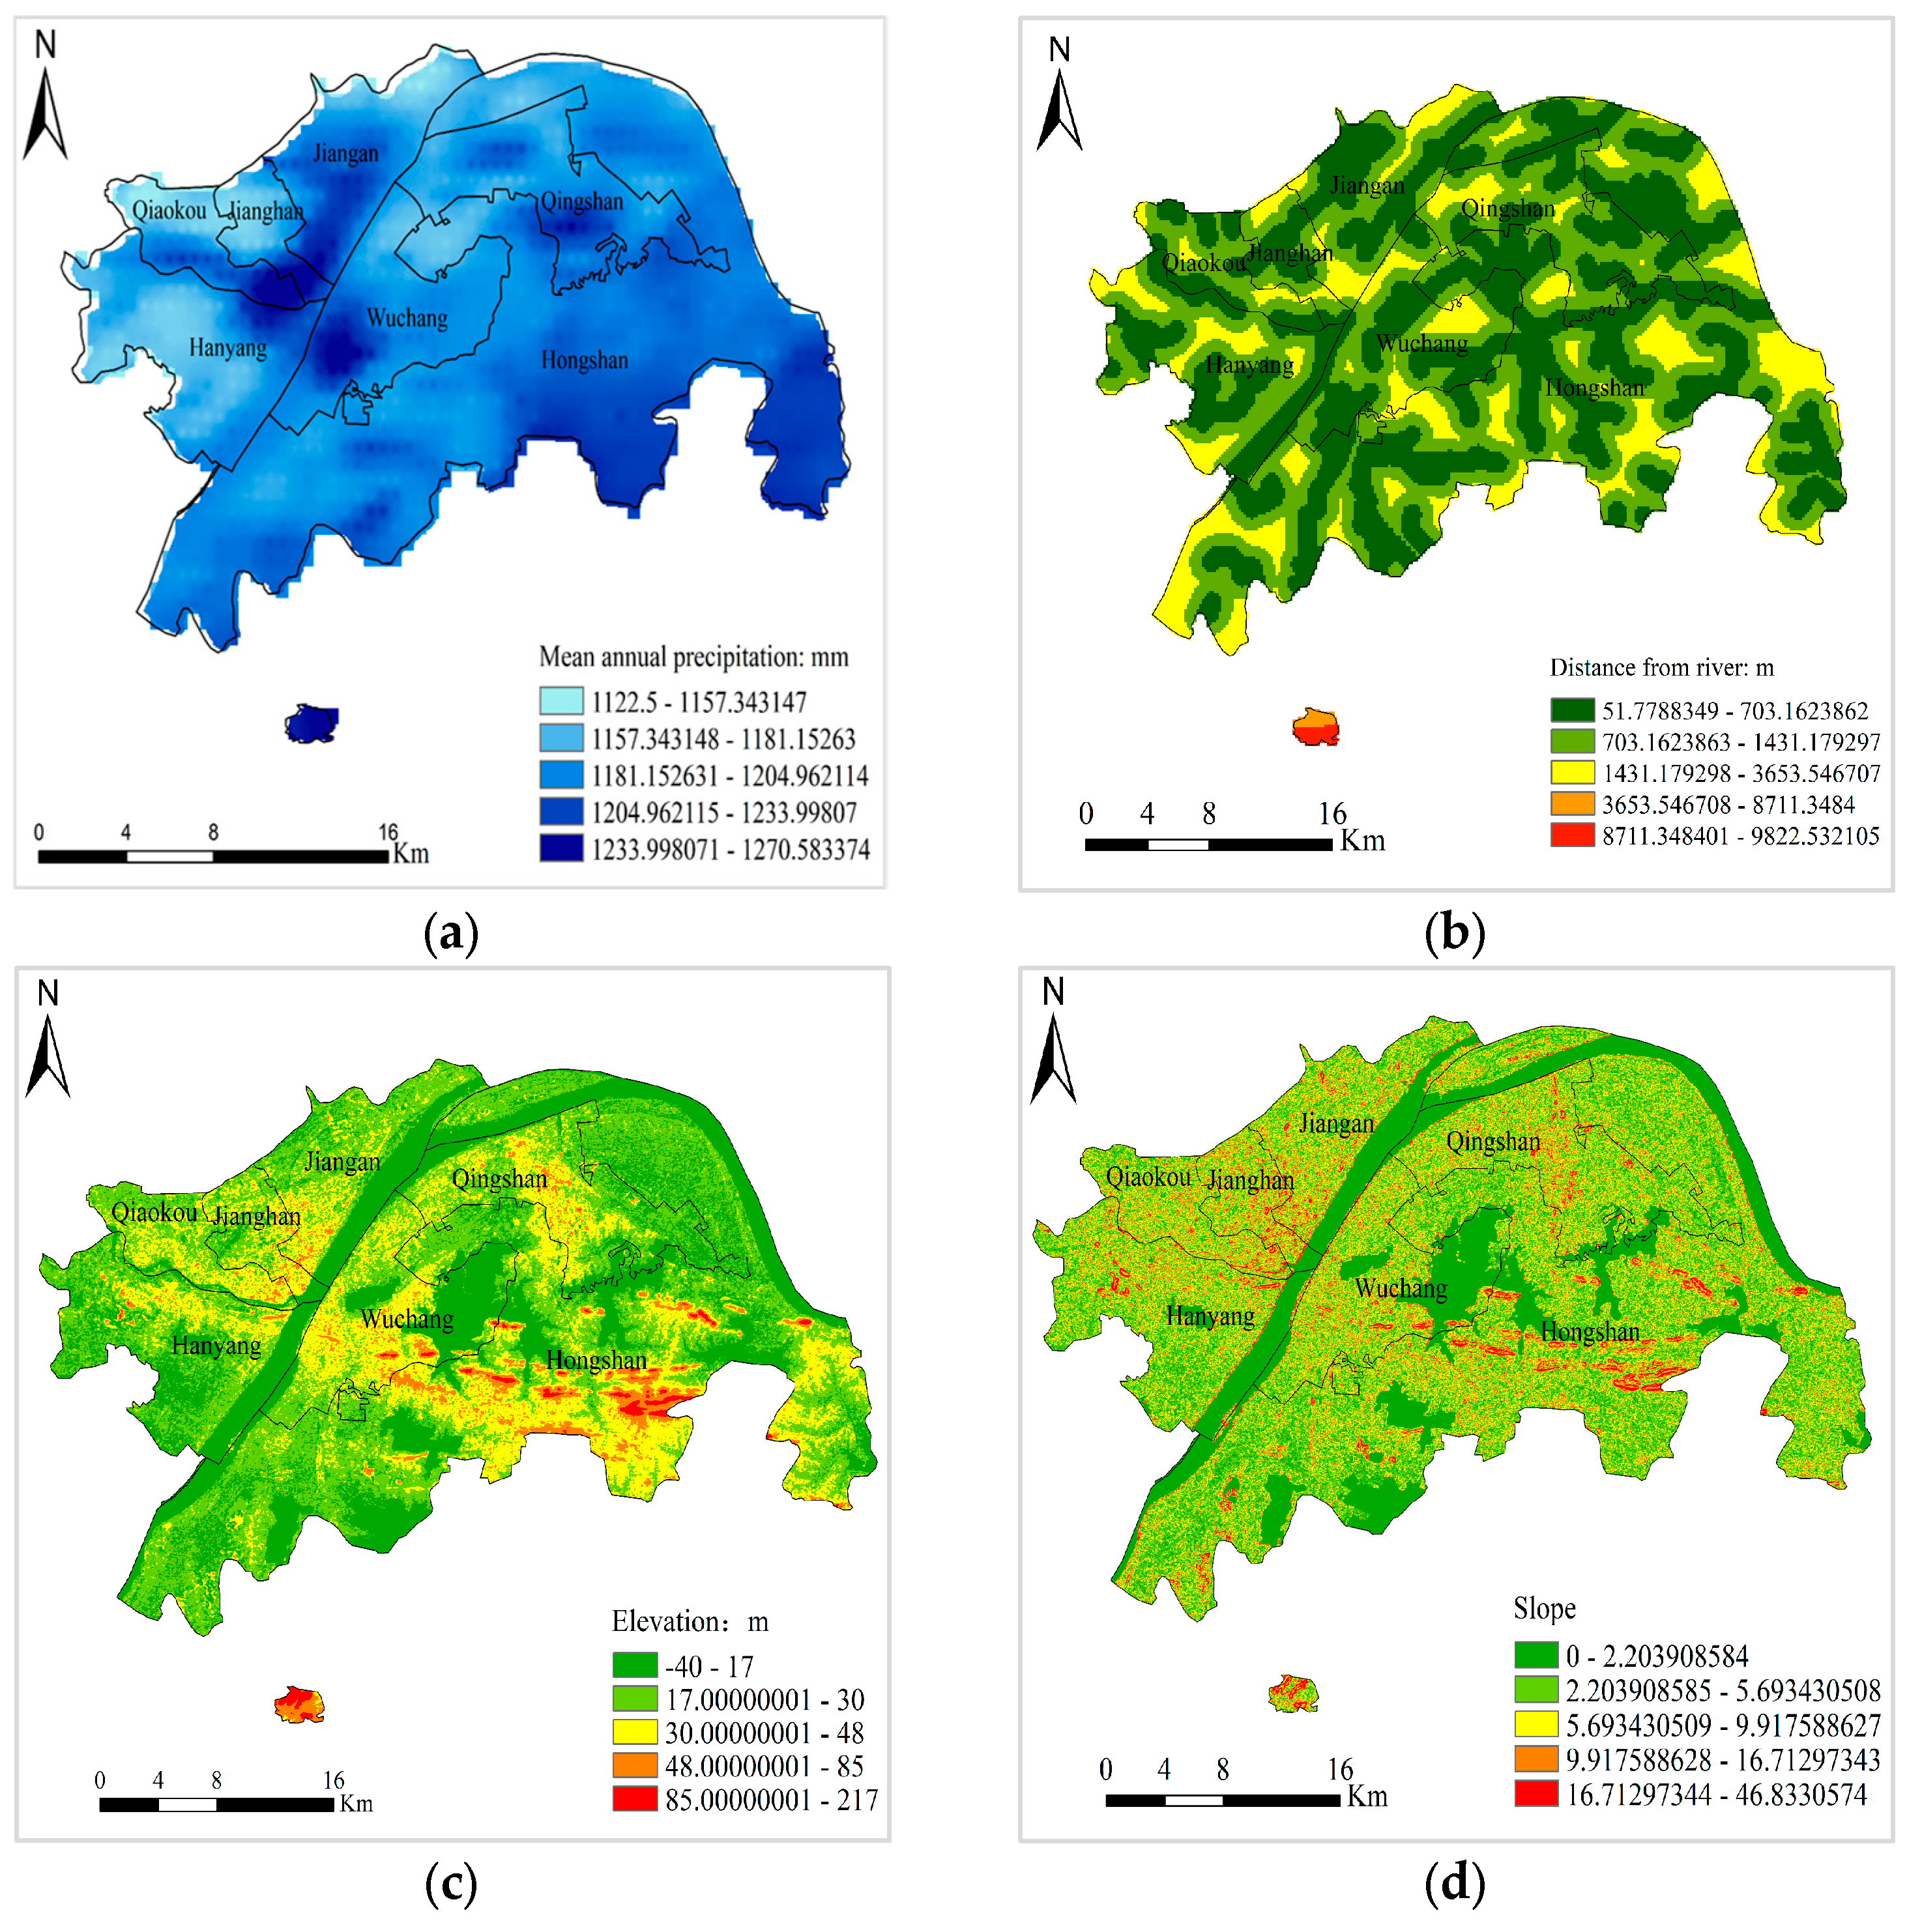
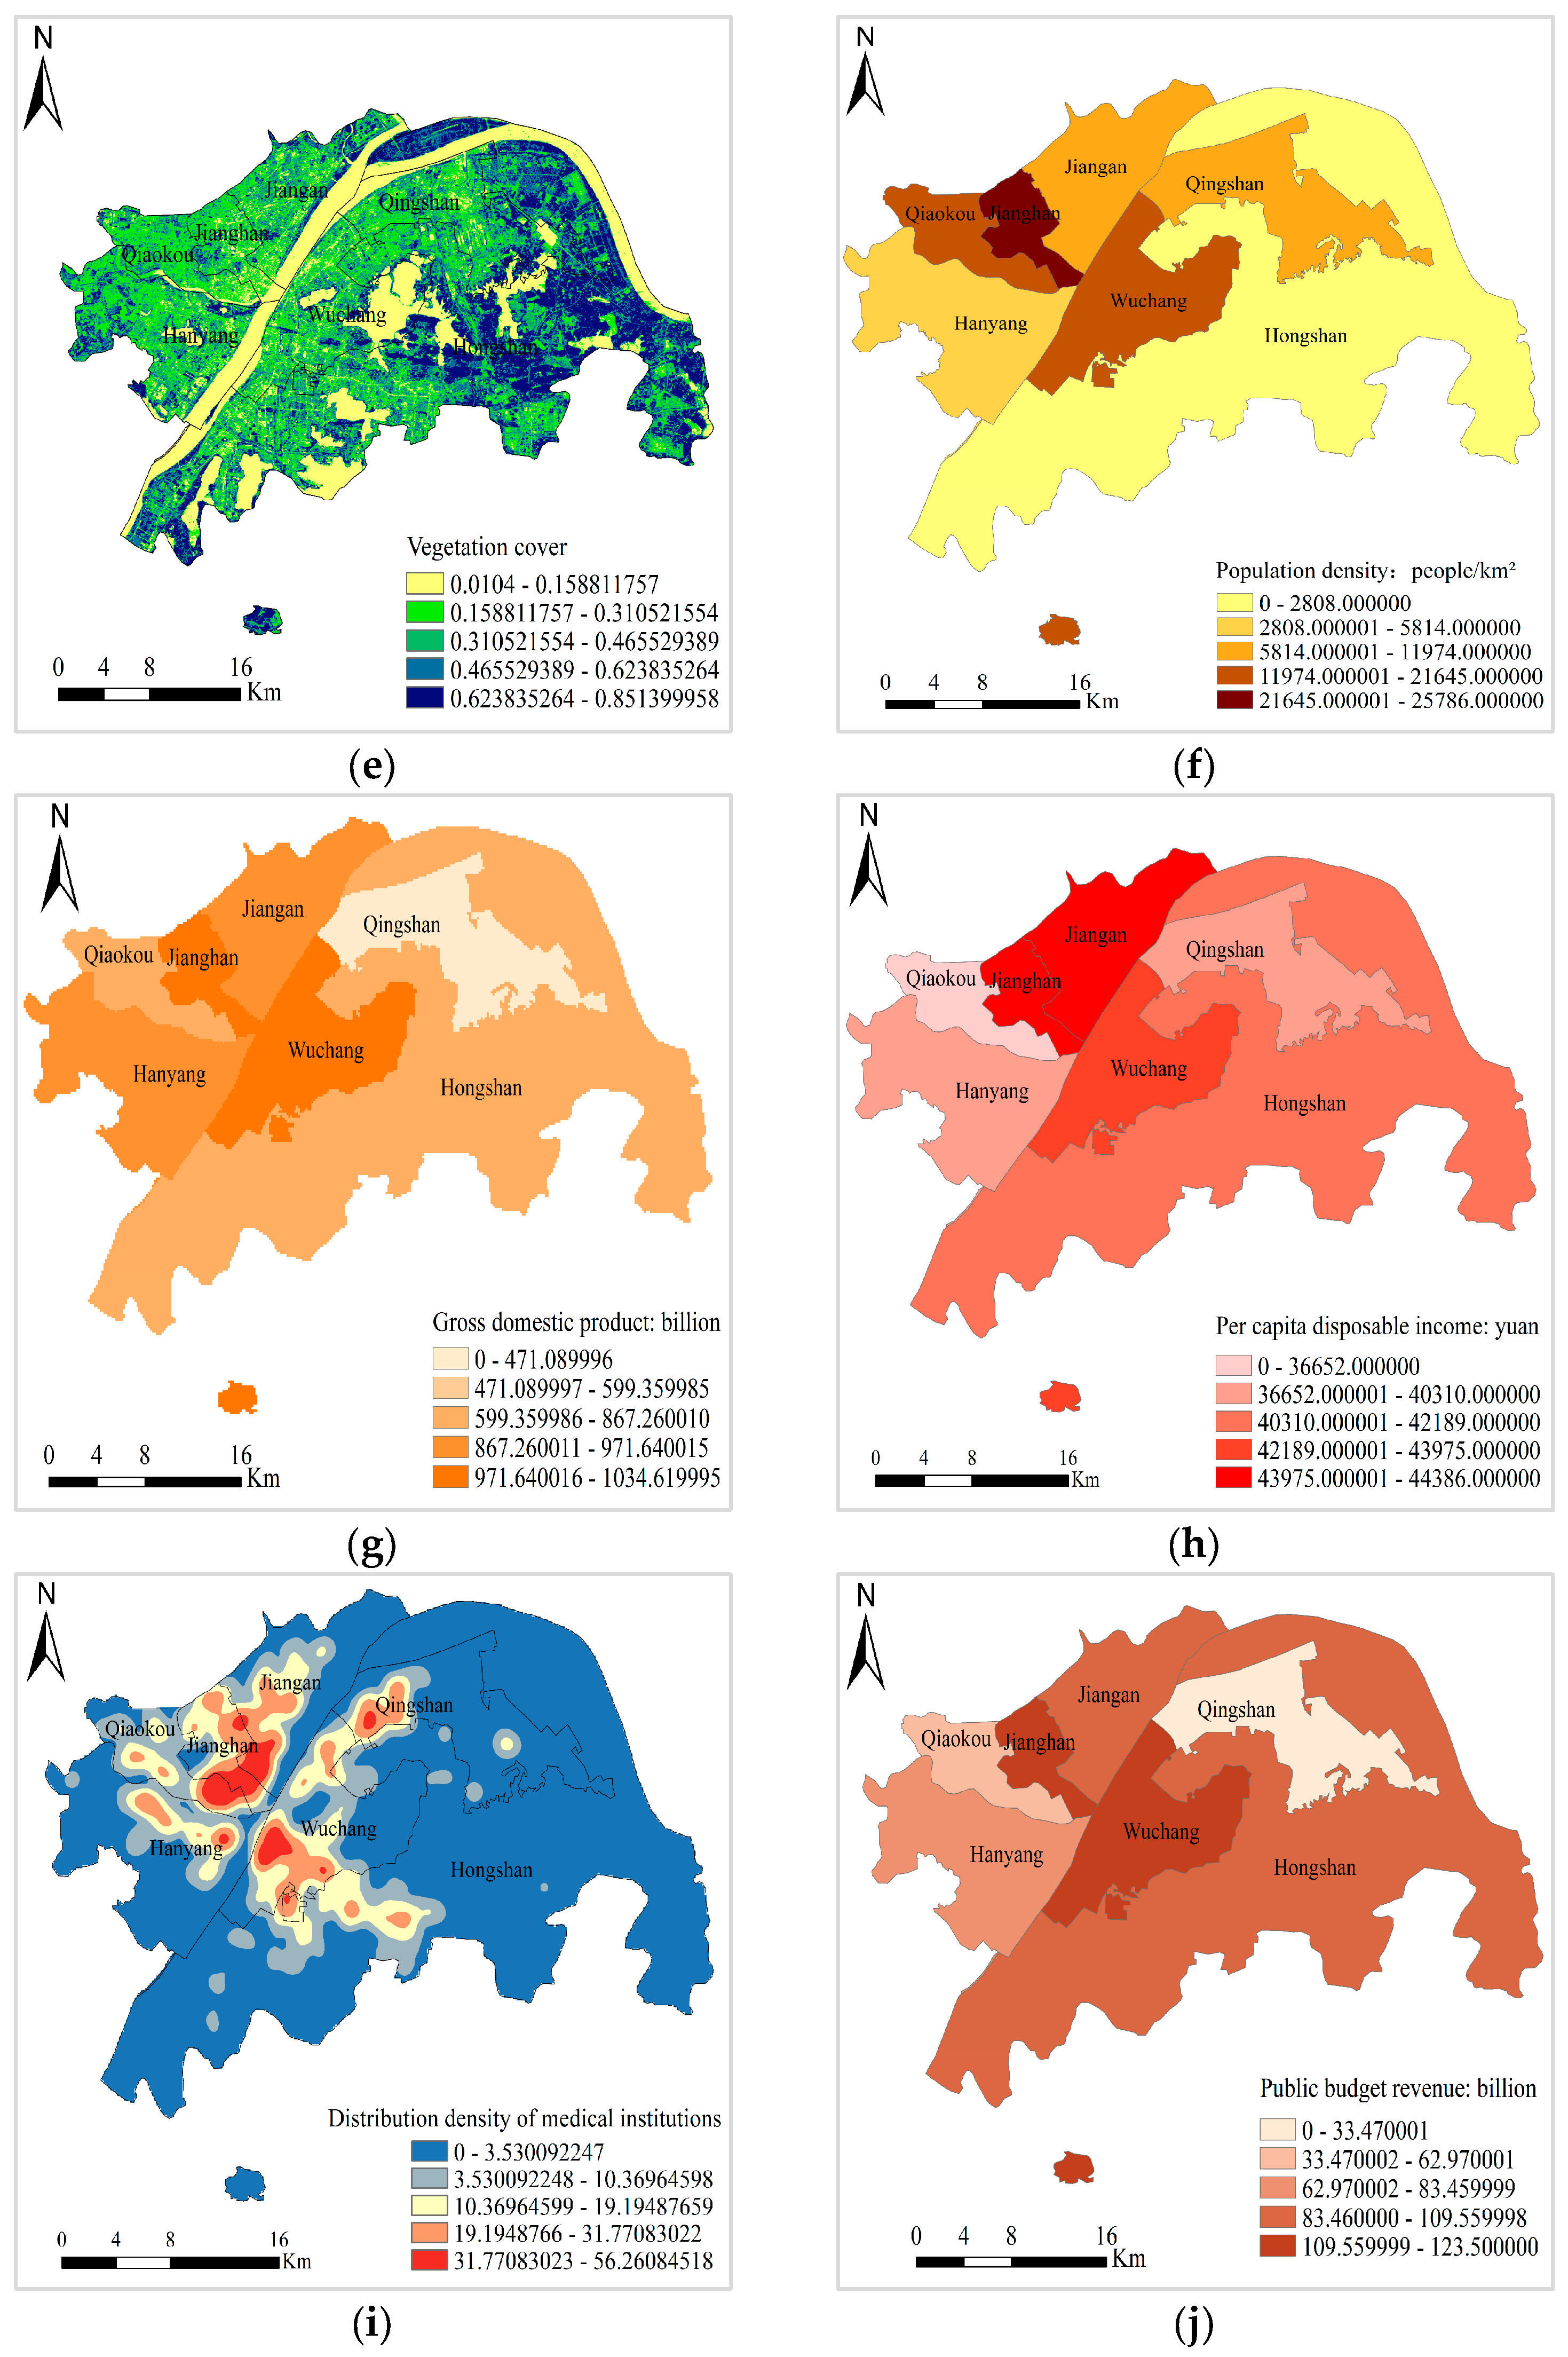
In this study, hazard, exposure, vulnerability and disaster prevention and mitigation capability related to risk assessment are decomposed into specific indicators. 10 factors are selected from existing studies, and the factors corresponding to the indicators in different dimensions are illustrated in Figure 2.
The hazard of flood disasters is defined as the unfavorable factors caused by extreme weather phenomena that affect the production and life of human society. In urban flood disasters, the hazard indicators include mean annual precipitation and the distance from the river [23,24]. Precipitation is widely recognized as the primary driver of flood disasters, with increased rainfall significantly elevating the likelihood of flood events. The distance from the river is also one of the important factors reflecting the hazard, the closer the distance from the river, the greater the probability of flood hazards.
The exposure degree of flood disasters refers to the environmental conditions that lead to the occurrence of flood disasters, mainly manifested through urban topographic conditions and underlying surface conditions. The exposure degree indicators include elevation, slope, and vegetation coverage [25]. Elevation and slope reflect the topographic conditions prone to flood disasters, while vegetation coverage reflects the ground conditions prone to flood disasters. An increase in elevation and slope, along with improved vegetation cover, contributes to reduced exposure, leading to a diminished risk of flooding.
The vulnerability to flood disasters refers to the severity of damage that a disaster area will suffer once a flood occurs. The vulnerability indicators include population density and economic output [26]. These two factors can reflect the impact of flood disasters on human life. The more densely populated and the more economically active a region is, the more susceptible it is to the influence of flood disasters. Because once a flood occurs, the areas with dense populations and high economic activities will suffer greater damage from the disaster.
The disaster prevention and mitigation capability denotes the capacity to respond to and manage flood events. The indicators of it include per capita disposable income, the density of medical institutions, and public budget revenue. These elements are indicative of the effectiveness of disaster preparedness and response [27]. The better people’s economic conditions are, the more complete the medical resources are, and the more the government invests in disaster prevention and mitigation, the greater the capacity to cope with flood disasters, the lower the likelihood of flood risks.

3.3. Research Method

3.3.1. Research Framework

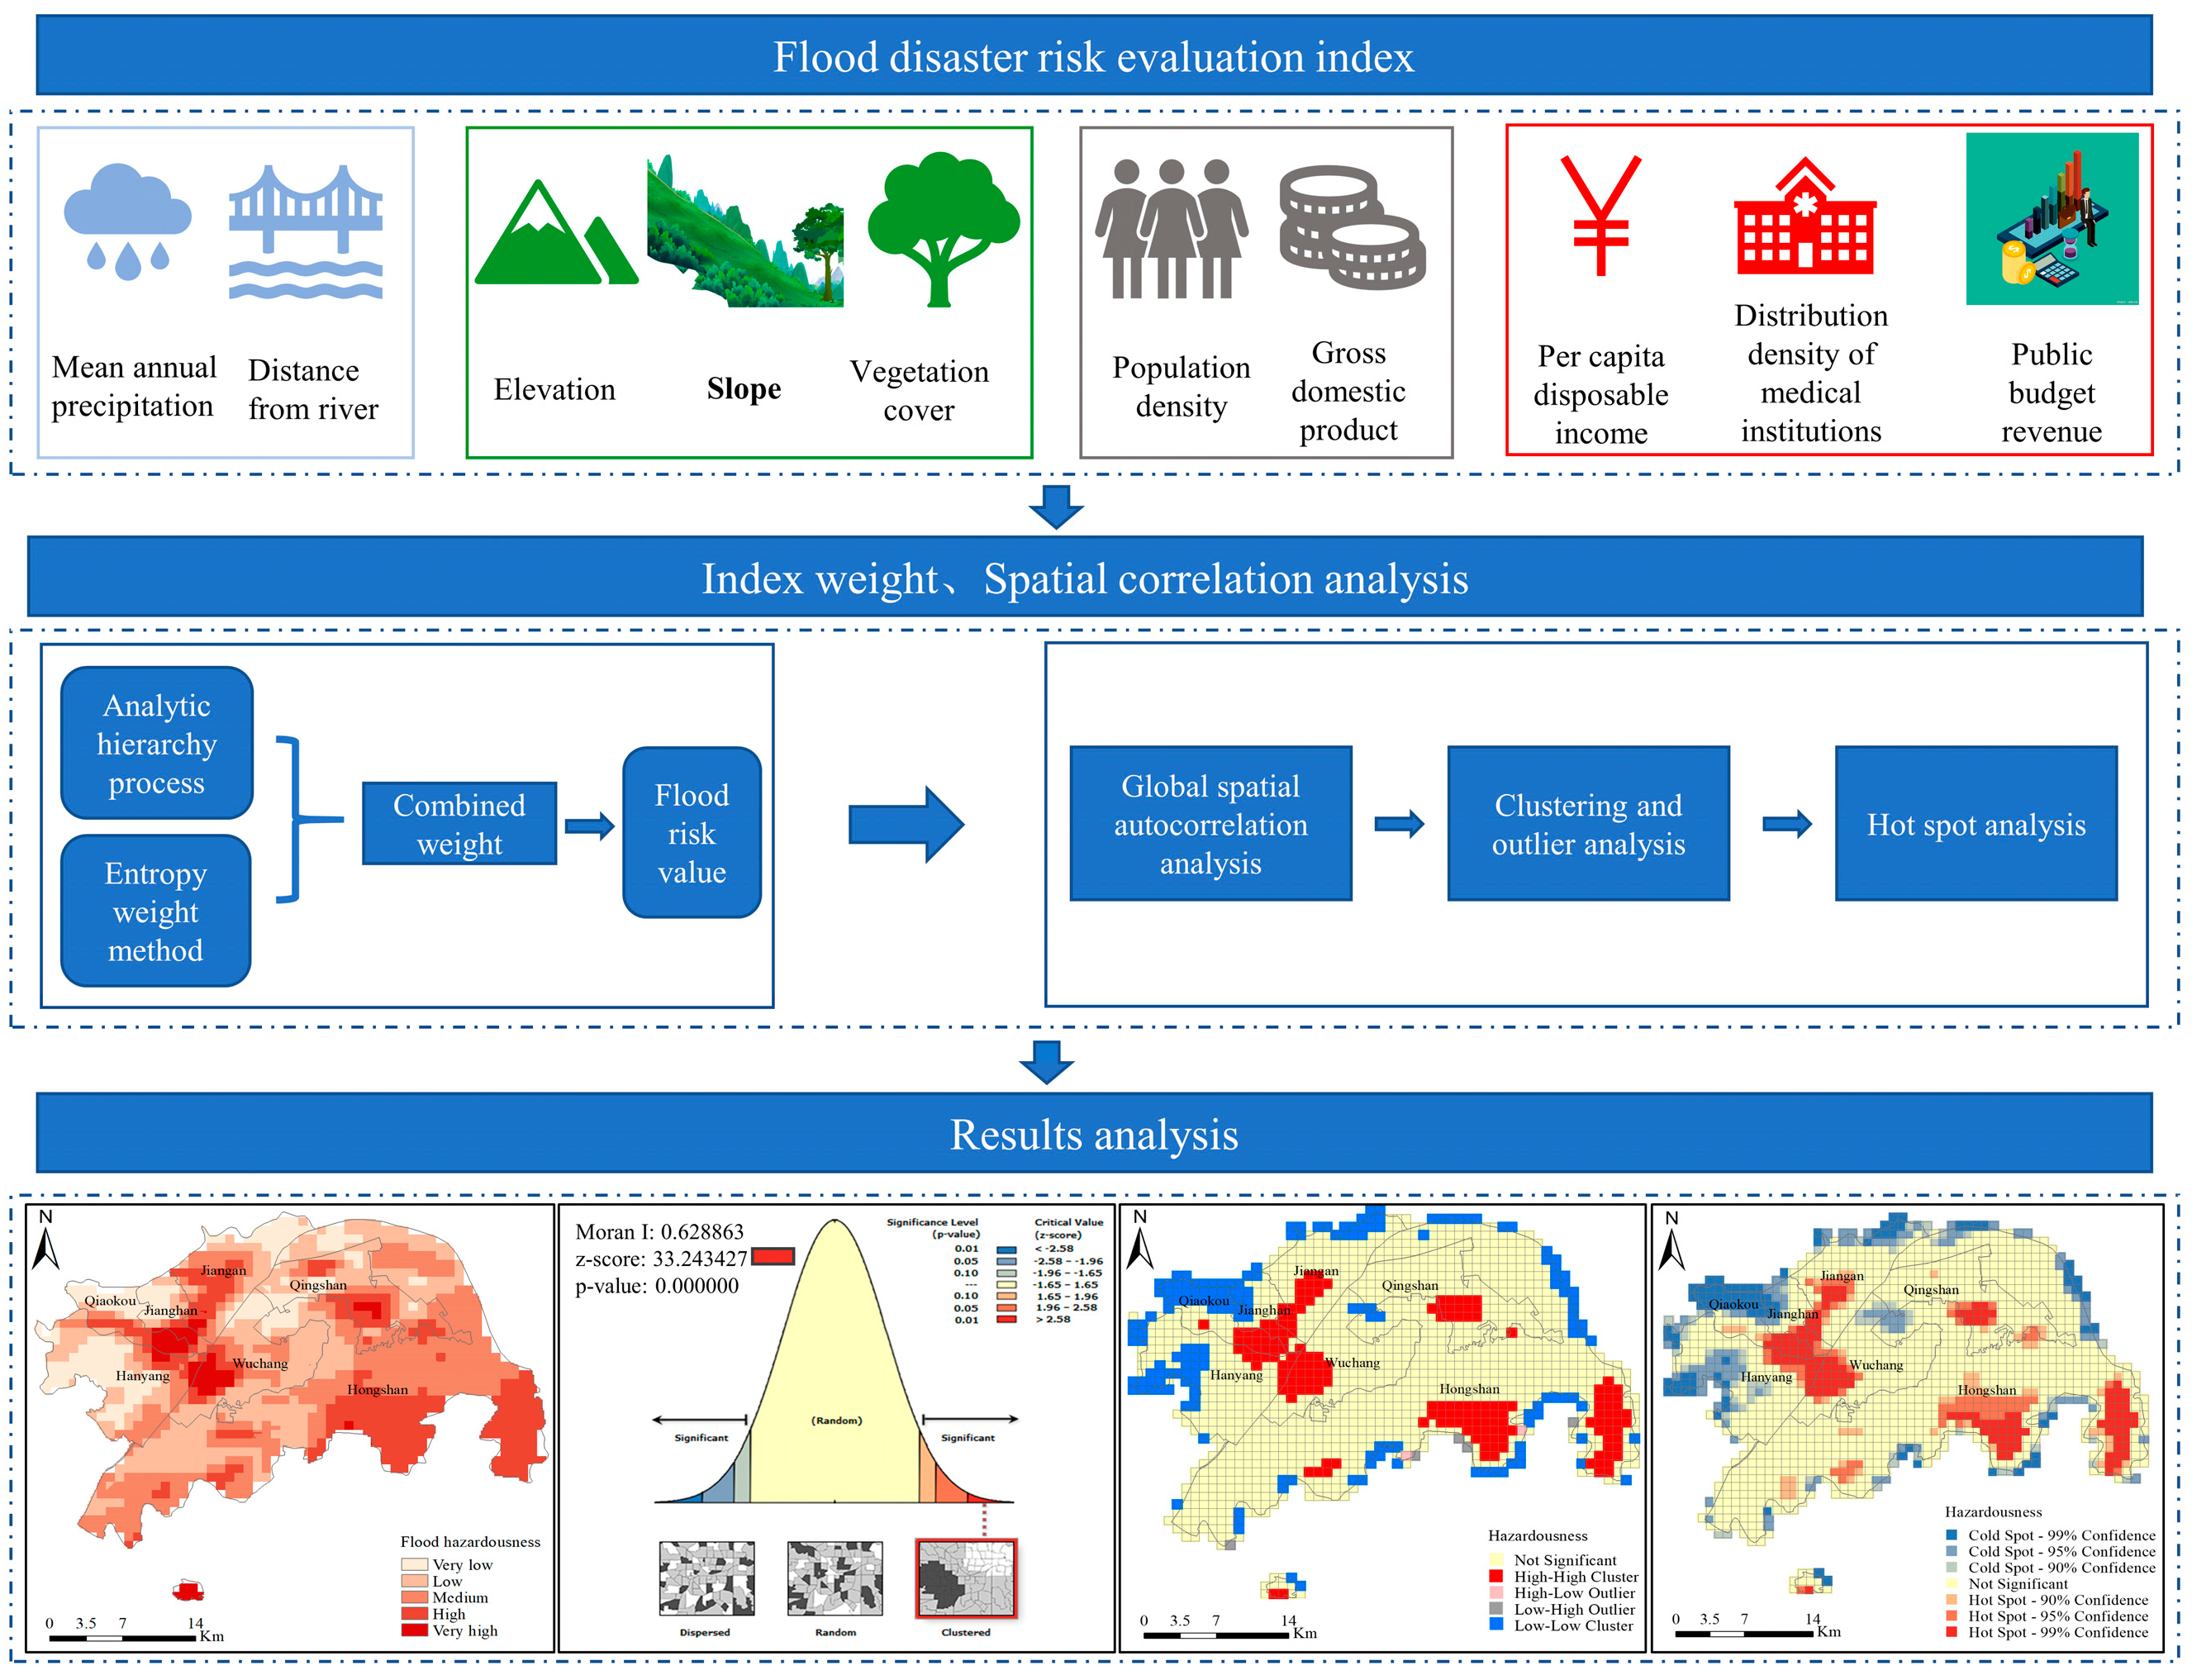
In this paper, Wuhan flood risk assessment framework is divided into three parts, as shown in Figure 3: (1) determination of flood risk indexes; (2) Flood risk assessment model with AHP and entropy weight method; (3) Spatial autocorrelation analysis of flood risk using GIS.
Firstly, an evaluation index system including four dimensions of flood hazard, exposure, vulnerability and disaster prevention and mitigation capacity was established. Then, the original data of the indicators were collected and their positive and negative attributes to the evaluation results were determined. Given the inconsistency in units among the indicators, normalization is essential to ensure comparability and reduce their influence on the assessment results. In addition, the weights of each indicator were calculated by AHP-EWM method, and the evaluation values of each dimension were obtained. Finally, based on these evaluation values, the spatial characteristics of each dimension were analyzed.

3.3.2. Data Standardization

Because the meaning and dimension of each evaluation index are different, these indexes can not be directly used in risk calculation. Therefore, these data are unified to 0~1 range by dimensionless standardization. There are two types of evaluation indexes, positive indexes and negative indexes. The index that has a strengthening effect on flood disaster is a positive indicator, that is, higher values are associated with more severe harm. The index that has mitigation effect on flood disaster is negative index, that is, the greater the value, the smaller the harm. According to the definition, the mean annual precipitation, population density and gross domestic product are positive indexes, while the distance from rivers, topographic elevation, ground slope, vegetation cover, per capita disposable income, distribution density of medical institutions and public budget revenue are negative indexes. The standardization process for each index is illustrated in Equations (1) and (2):
Positive indexes:
Y i j = X i X min / X max X min
Negative indexes:
Y i j = X max X i / X max X min
where: Y i j is the i value of the jth index; X i is the value of the original data; X m a x and X m i n are the maximum and minimum values of the jth index data, respectively.

3.3.3. Analytic Hierarchy Process

The Analytic Hierarchy Process (AHP) makes pairwise comparison of each evaluation index and estimates the contribution of each index to the evaluation target on the basis of expert scores, then constructs a judgment matrix and conducts consistency test on the judgment matrix. Finally, each evaluation indicator undergoes qualitative and quantitative assessment. To test consistency, the consistency index (CI) and randomness index (RI) are utilized. CI is obtained by calculating the maximum feature root, as shown in Equation (3). RI is determined by looking up the table. Finally, the consistency ratio RC is calculated. As shown in Equation (4), the smaller the RC value, the better the consistency. Generally, RC < 0.1 is considered to pass the conformance test. Through calculation, the weights of indexes selected in this paper are shown in Table 2.
C I = λ max n n 1
R C = C I / R I
where: λ m a x is the largest characteristic root; n is the order of judgment matrix; CI is the consistency index; RI is a randomness index.

3.3.4. Entropy Weight Method

Entropy was first used in thermodynamics to quantify system disorder, and later in information theory to evaluate the order of an index. The method uses the judgment matrix composed of the evaluation index values to determine the coefficient of each index. A higher weight indicates more information content and corresponds to lower entropy for the index. Assuming that the number of evaluation indexes is m and the number of pixels in the research area is n, the evaluation index matrix is X = x i j m × n , and the entropy of the ith index is defined as Equation (5):
H i = 1 ln n j = 1 n f i j ln f i j
where: H i is the entropy of the ith index; n is the number of pixels; f i j is the value under the jth index of i evaluation objects. When f i j = 0, let f i j l n f i j = 0; f i j is defined as Equation (6):
f i j = x i j i = 1 m x i j
The entropy weight of the ith index is defined as Equation (7):
W i = 1 H i i = 1 m 1 H i
where: W i is the entropy weight of the ith index, 0 ≤ W i ≤ 1; H i is the entropy of the ith index i = 1 m H i = 1; m is the number of evaluation indexes. Table 2 displays the weights of each indicator as determined by the entropy weight method.

3.3.5. Combination Method

The analytic hierarchy process (AHP) is simple and systematic, and can carry out quantitative and hierarchical analysis, but it is easy to be affected by people and has strong subjectivity. The entropy weight method is calculated by strict mathematical formula, and the calculation result is more objective and accurate, but it does not consider the importance of the index itself and the interaction between the indexes. Therefore, using either of these two methods alone cannot yield the optimal weights. In order to improve the scientificity of comprehensive evaluation, this paper combines the two methods to carry out risk assessment, so as to obtain a more reasonable index weight [28]. The formula for calculating the combined weight is shown in Equation (8):
W i * = V i W i V i W i
where: W i * represents the combined weight, V i represents the weight obtained by the analytic hierarchy process, and W i represents the weight obtained by the entropy weight method. The combined weights integrate expert experience with the objective data of the indicators, which not only mitigates the adverse impact of experts’ subjective judgments on the determination of indicator weights but also reduces the dependence of the entropy weight method on data correlation. Incorporating the actual study area’s characteristics strengthens the scientific rigor of the findings, thus enabling a more justified and robust approach to weight assignment for the overall evaluation. The final weight of the combination calculation is shown in Table 2.

3.4. Spatial Analysis

3.4.1. Global Spatial Autocorrelation Analysis

In order to further explore the spatial characteristics of flood disaster risk distribution, we will use spatial analysis to achieve this goal. There are two scales at which spatial autocorrelation can be analyzed: the global level and the local level. The global spatial autocorrelation analysis uses the Moran index to judge the spatial distribution model of flood disaster risk data in the region. When the Moran index is not equal to zero (that is, Moran’s ≠ 0), the spatial distribution model is random. When the Moran index is less than zero (that is, Moran’s < 0), the spatial distribution pattern is dispersed. When the Moran index is greater than zero (i.e., Moran’s > 0), the spatial distribution pattern is a clustered distribution. The calculation formula of the Moran index is shown in Equation (9).
M o r a n s   I = n i = 1 n j = 1 n w i j × i = 1 n j = 1 n w i j x i X ¯ x j X ¯ i = 1 n x i X ¯ 2
where: n refers to the total count of spatial units within the study region; x i and x j are the flood disaster risk values of the i region and the j region respectively. w i j is the spatial weight matrix; X ¯ is the average flood disaster risk of each region.

3.4.2. Local Spatial Autocorrelation Analysis

Global spatial autocorrelation analysis can only judge the spatial distribution pattern of flood disaster risk in the study area. If the distribution pattern is clustered distribution, the location and degree of clustering need to be further defined. To further investigate the spatial clustering characteristics of flood disaster risk, we adopt local spatial autocorrelation analysis. In this paper, the correlation between region i and neighboring regions is measured by clustering and outlier analysis. The calculation formula is shown in Equation (10). There are generally four distinct patterns, high-high clusters indicate that spatial units within a certain range all exhibit high values, low-low clusters indicate uniformly low values within the range, high-low outliers are high-value units in low-value surroundings, and low-high outliers mean that low-valued units are surrounded by high-valued neighbors.
I i = x i X ¯ S i 2 j = 1 , j i n w i j x i X ¯
where: S i 2 represents the sum of variances of flood disaster risk values throughout the research region.
Hot spot analysis was applied to more precisely locate areas with significant clustering of high- and low-value elements in the study region. Hot spot analysis calculates the G i * statistic of each factor to obtain the z score and p value of each factor, and uses them to judge which positions are cold spots or hot spots, and whether such aggregation is statistically significant. Its calculation formula is shown in Equations (11)–(13).
G i * = j = 1 n w i , j x j X ¯ j = 1 n w i , j S n j = 1 n w i , j 2 j = 1 n w i , j 2 n 1
X ¯ = j = 1 n x j n
S = j = 1 n x j 2 n X ¯ 2
where: n is the number of elements and x j is the attribute of element j.

4. Results

4.1. Results of Risk Analysis

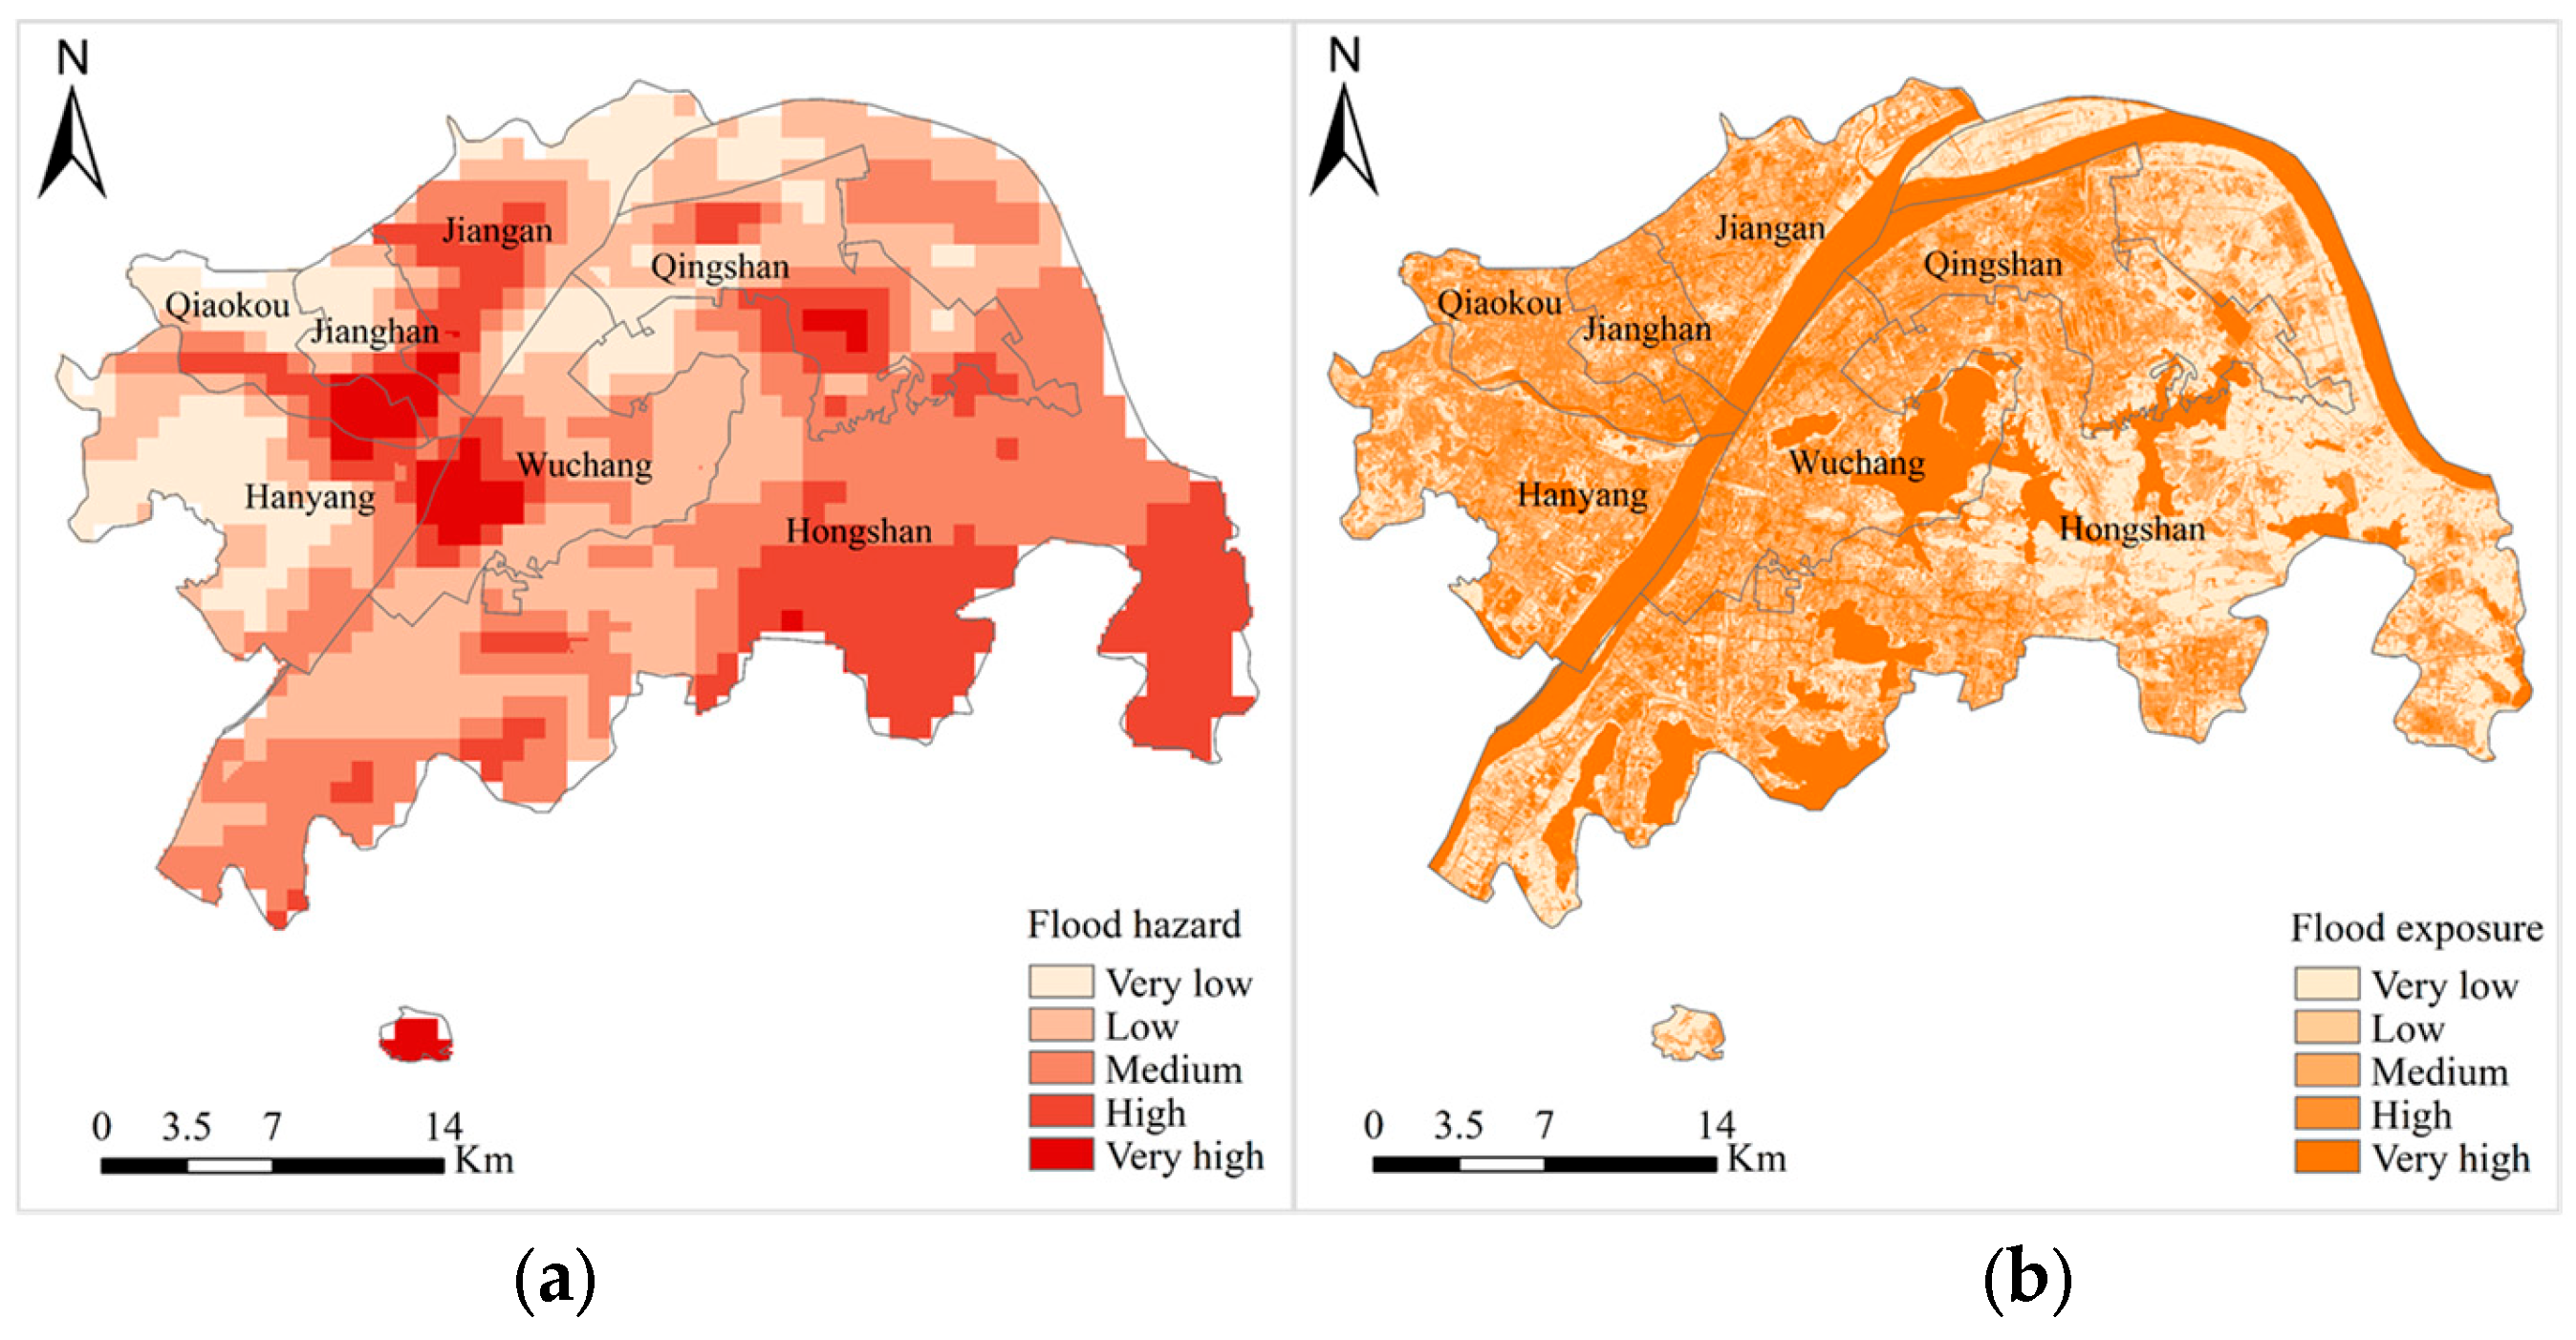
The risk assessment results of each indicator layer in the core city zone of Wuhan are shown in Figure 4. As shown in Figure 4a, the results showed that the proportions of flood hazard from low to high were 14.26%, 30.33%, 31.71%, 19.26% and 4.44%, respectively. The high-risk areas are distributed in patches, mainly in the east of Jianghan and Qiaokou, and the west of Wuchang. These areas are distributed along rivers and lakes and have high rainfall, so the risk is highest. The areas with the lowest risk are mainly the western parts of Hanyang, Qiaokou and Jianghan, the northern part of Jiangan and some central areas, which are far from rivers and have little rainfall.
As shown in Figure 4b, the exposure levels of flood disaster in the target region from low to high accounted for 21.07%, 22.29%, 19.96%, 17.49% and 19.19%, respectively. The areas with high exposure were mainly distributed in Hanyang, Qiaokou, Jianghan, Jiangan and Wuchang, and the eastern section of the study region had the lowest exposure to flood disasters. Regions with high exposure are typically located near rivers and lakes and are characterized by low elevation. These areas have active economic activities, dense buildings and low vegetation coverage, which make them highly exposed to flood disasters. The eastern region is characterized by higher elevation and dense vegetation cover, resulting in lower flood disaster exposure.
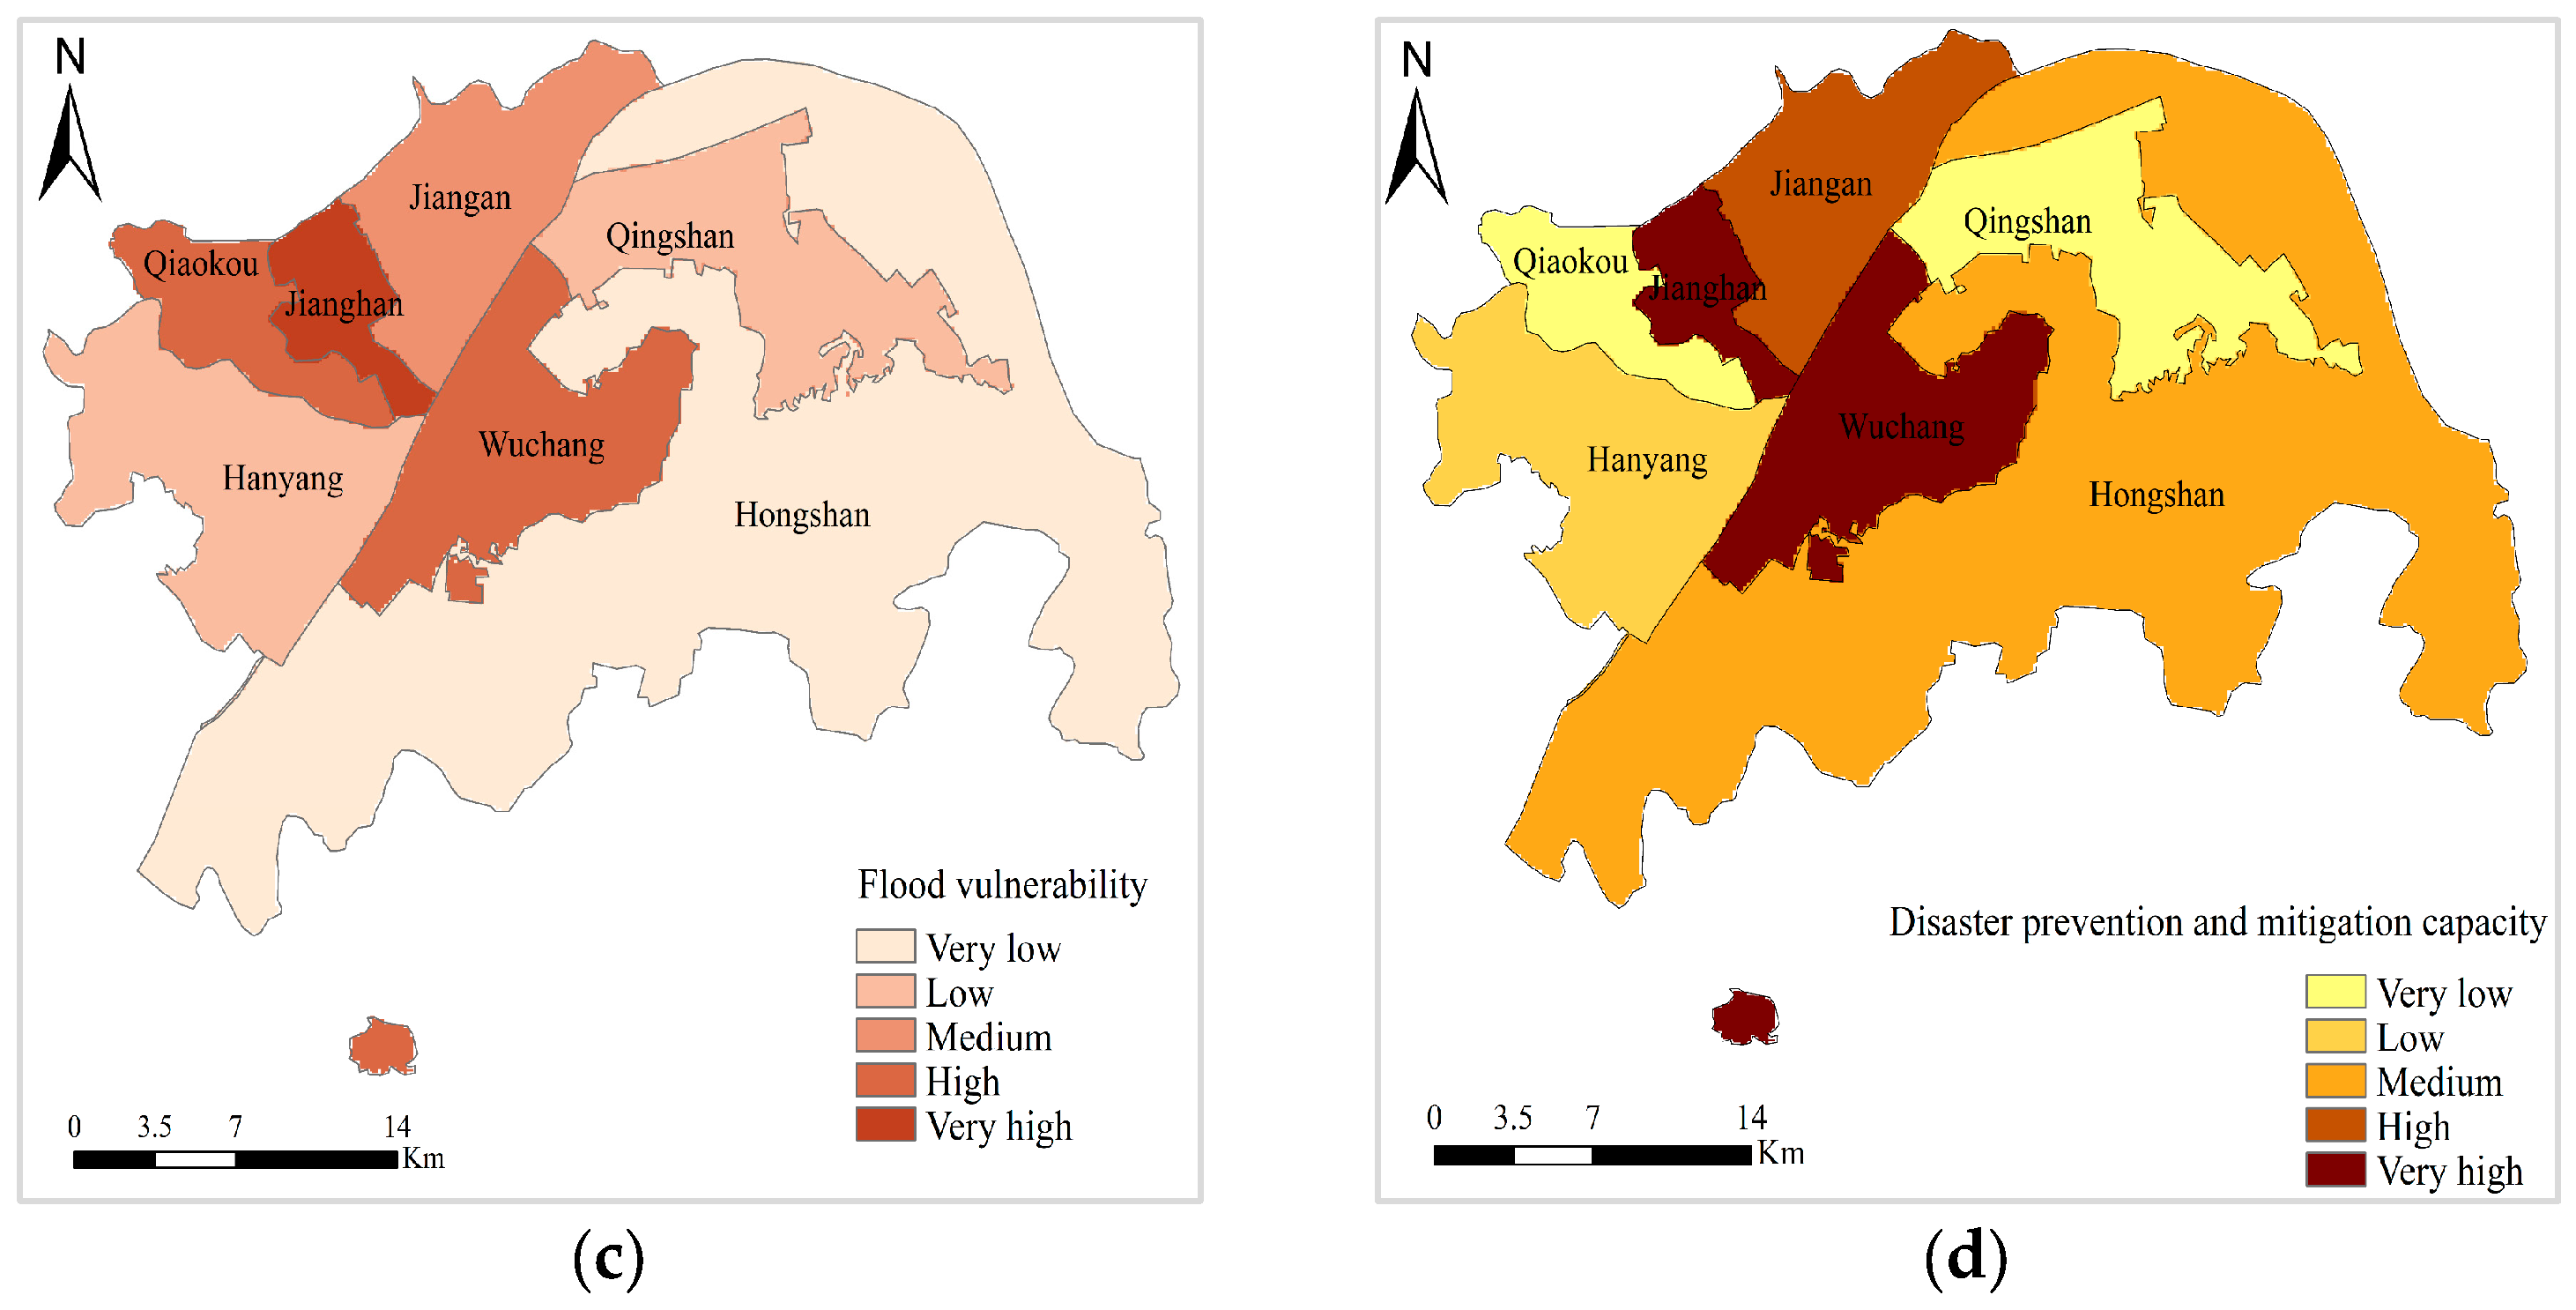
As shown in Figure 4c, flood disaster vulnerability levels in the study area from low to high accounted for 53.07%, 20.7%, 8.65%, 14.56% and 3.02%, respectively. High-vulnerability zones were primarily located in the districts of Jianghan, Qiaokou, and Wuchang, while the vulnerability was low in the eastern part of the study area. Areas of high vulnerability are densely populated, economically active, and close to rivers and lakes, making them vulnerable to flooding. In contrast, areas with low vulnerability are less densely populated and less economically active, and therefore less vulnerable to floods.
As shown in Figure 4d, the disaster prevention and mitigation capacity of flood in the region is 13.33%, 12.17%, 52.76%, 8.61% and 13.13%, respectively, in different levels from low to high. The region with the highest disaster prevention and mitigation capability is Jianghan, followed by Jiangan and Wuchang, and the weakest is Qiaokou and parts of Qingshan. Jianghan, Jiangan and Wuchang have high level of economic development, large public budget of the government, and relatively perfect medical facilities, so the disaster prevention and reduction capacity is relatively high in these regions, in contrast to areas where such capabilities are limited.

4.2. Result Verification

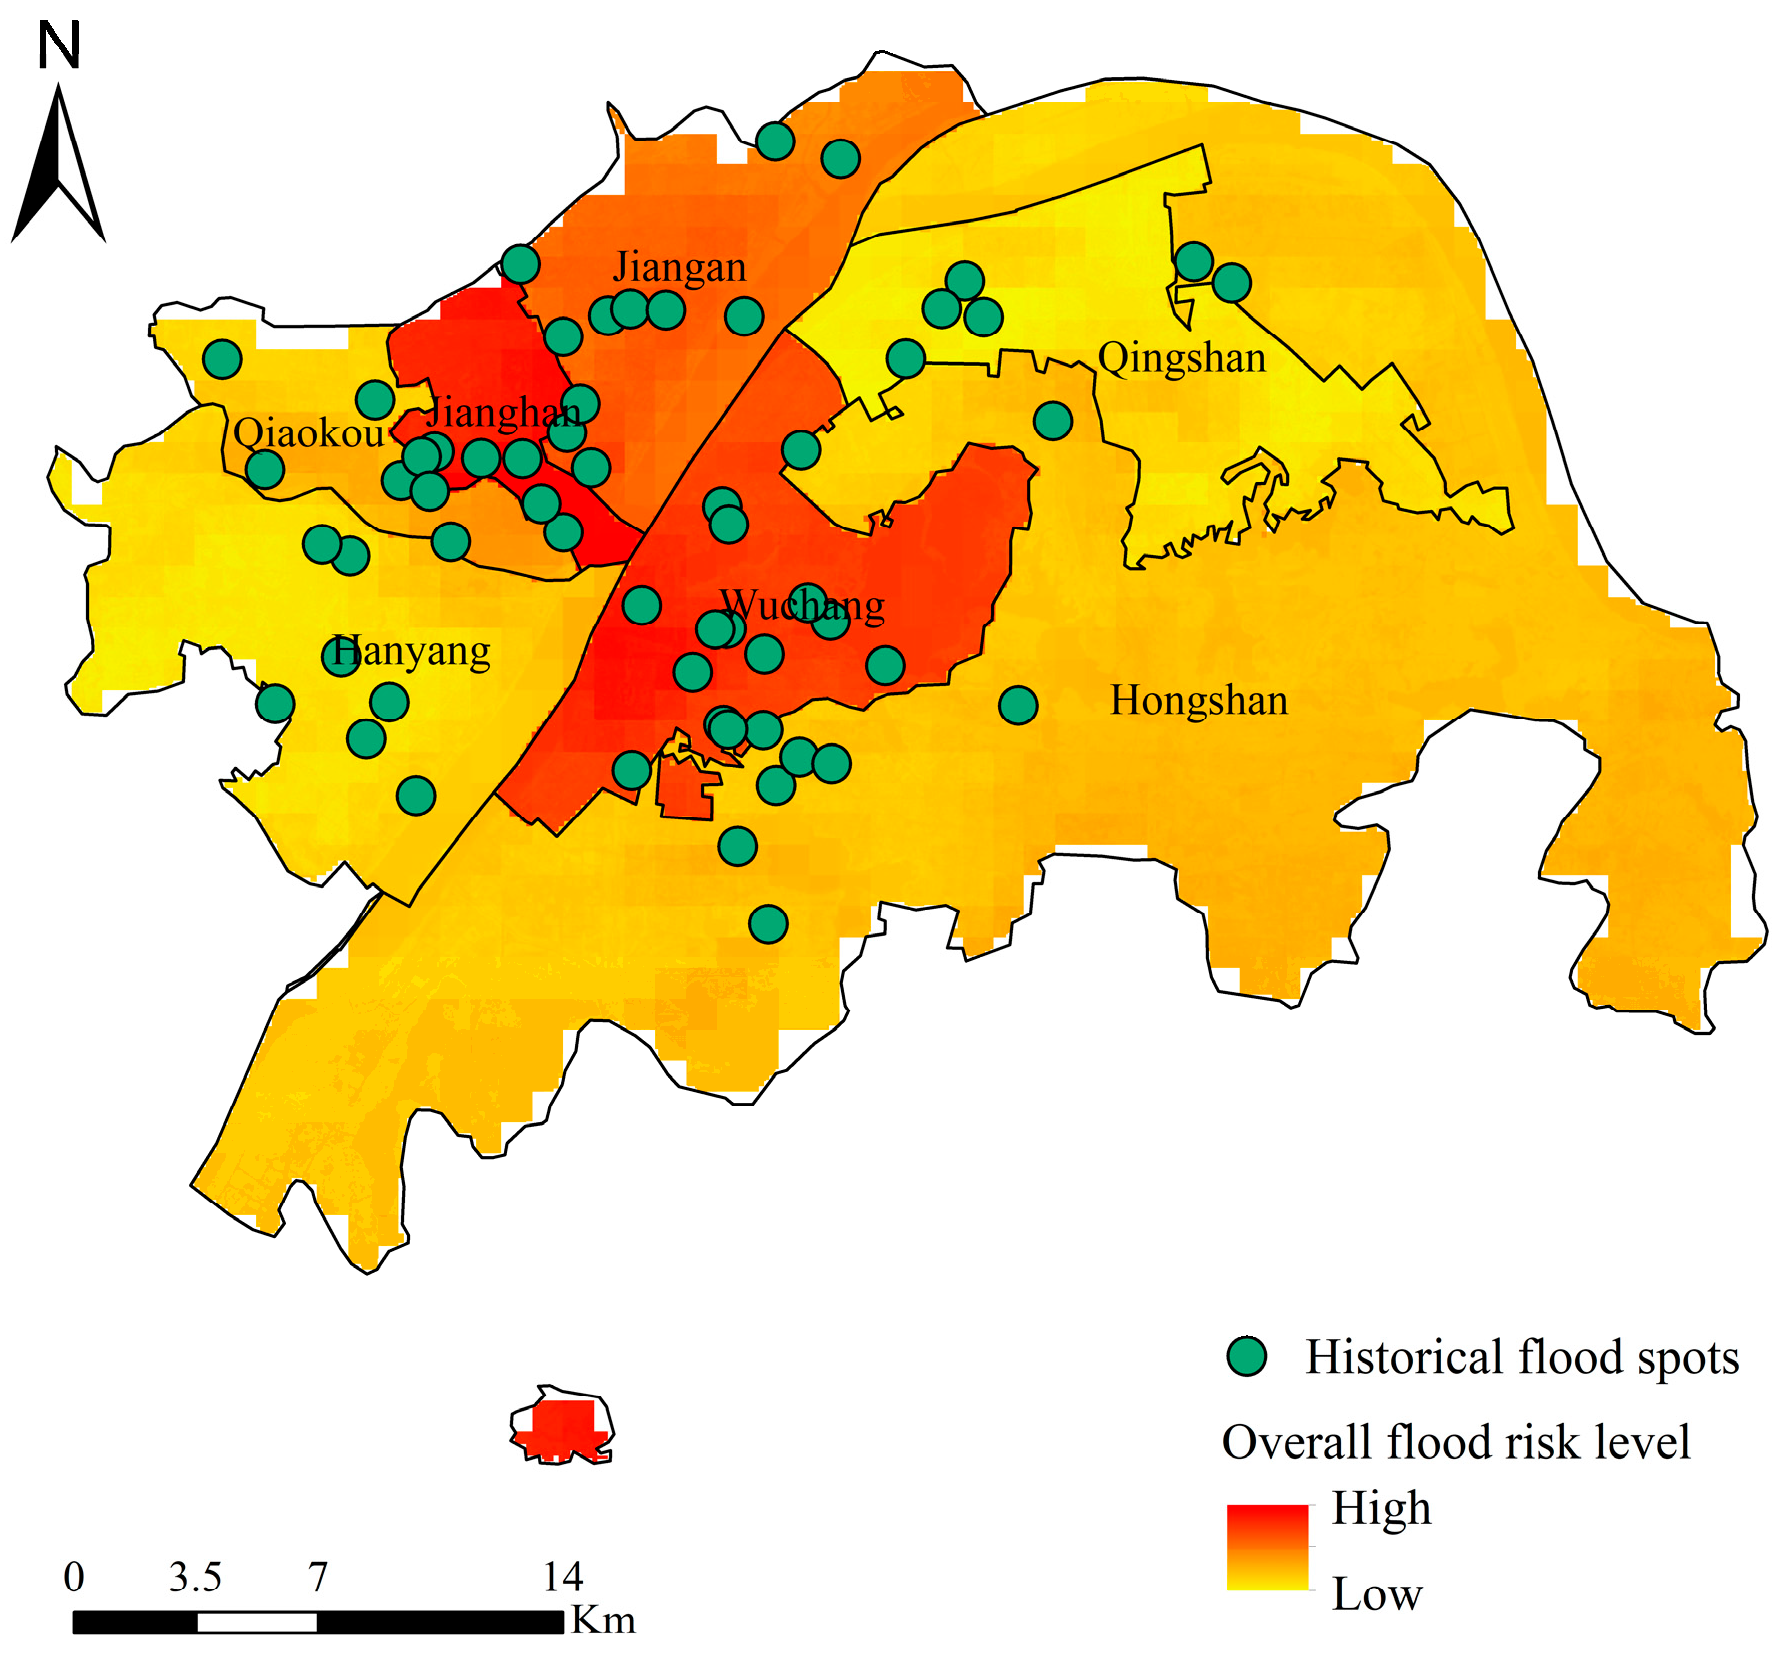
Accroding to the results of each of these dimensions, an overall flood risk map for the study area can be presented, as presented in Figure 5. The flood risk levels in Jianghan District and Wuchang District are the highest, followed by Jiangan and Qiaokou. Hongshan, Hanyang, and Qingshan have the lowest flood risk levels. To test the fidelity of the flood risk results, 58 historical flood sites data released by the Wuhan Water Affairs Bureau were collected. As can be seen from Figure 5, 65.52% of the flood sites are located in these areas: Jianghan, Wuchang, Jiang’an, and Qiaokou. This indicates that the flood disaster risks in these areas are greater, and further endorses the conformity of the risk assessment map with historical records. These areas have abundant precipitation, are located along rivers, have low terrain, and have a dense population and numerous economic activities. Therefore, the flood risk levels are high.

4.3. Global Spatial Analysis Results

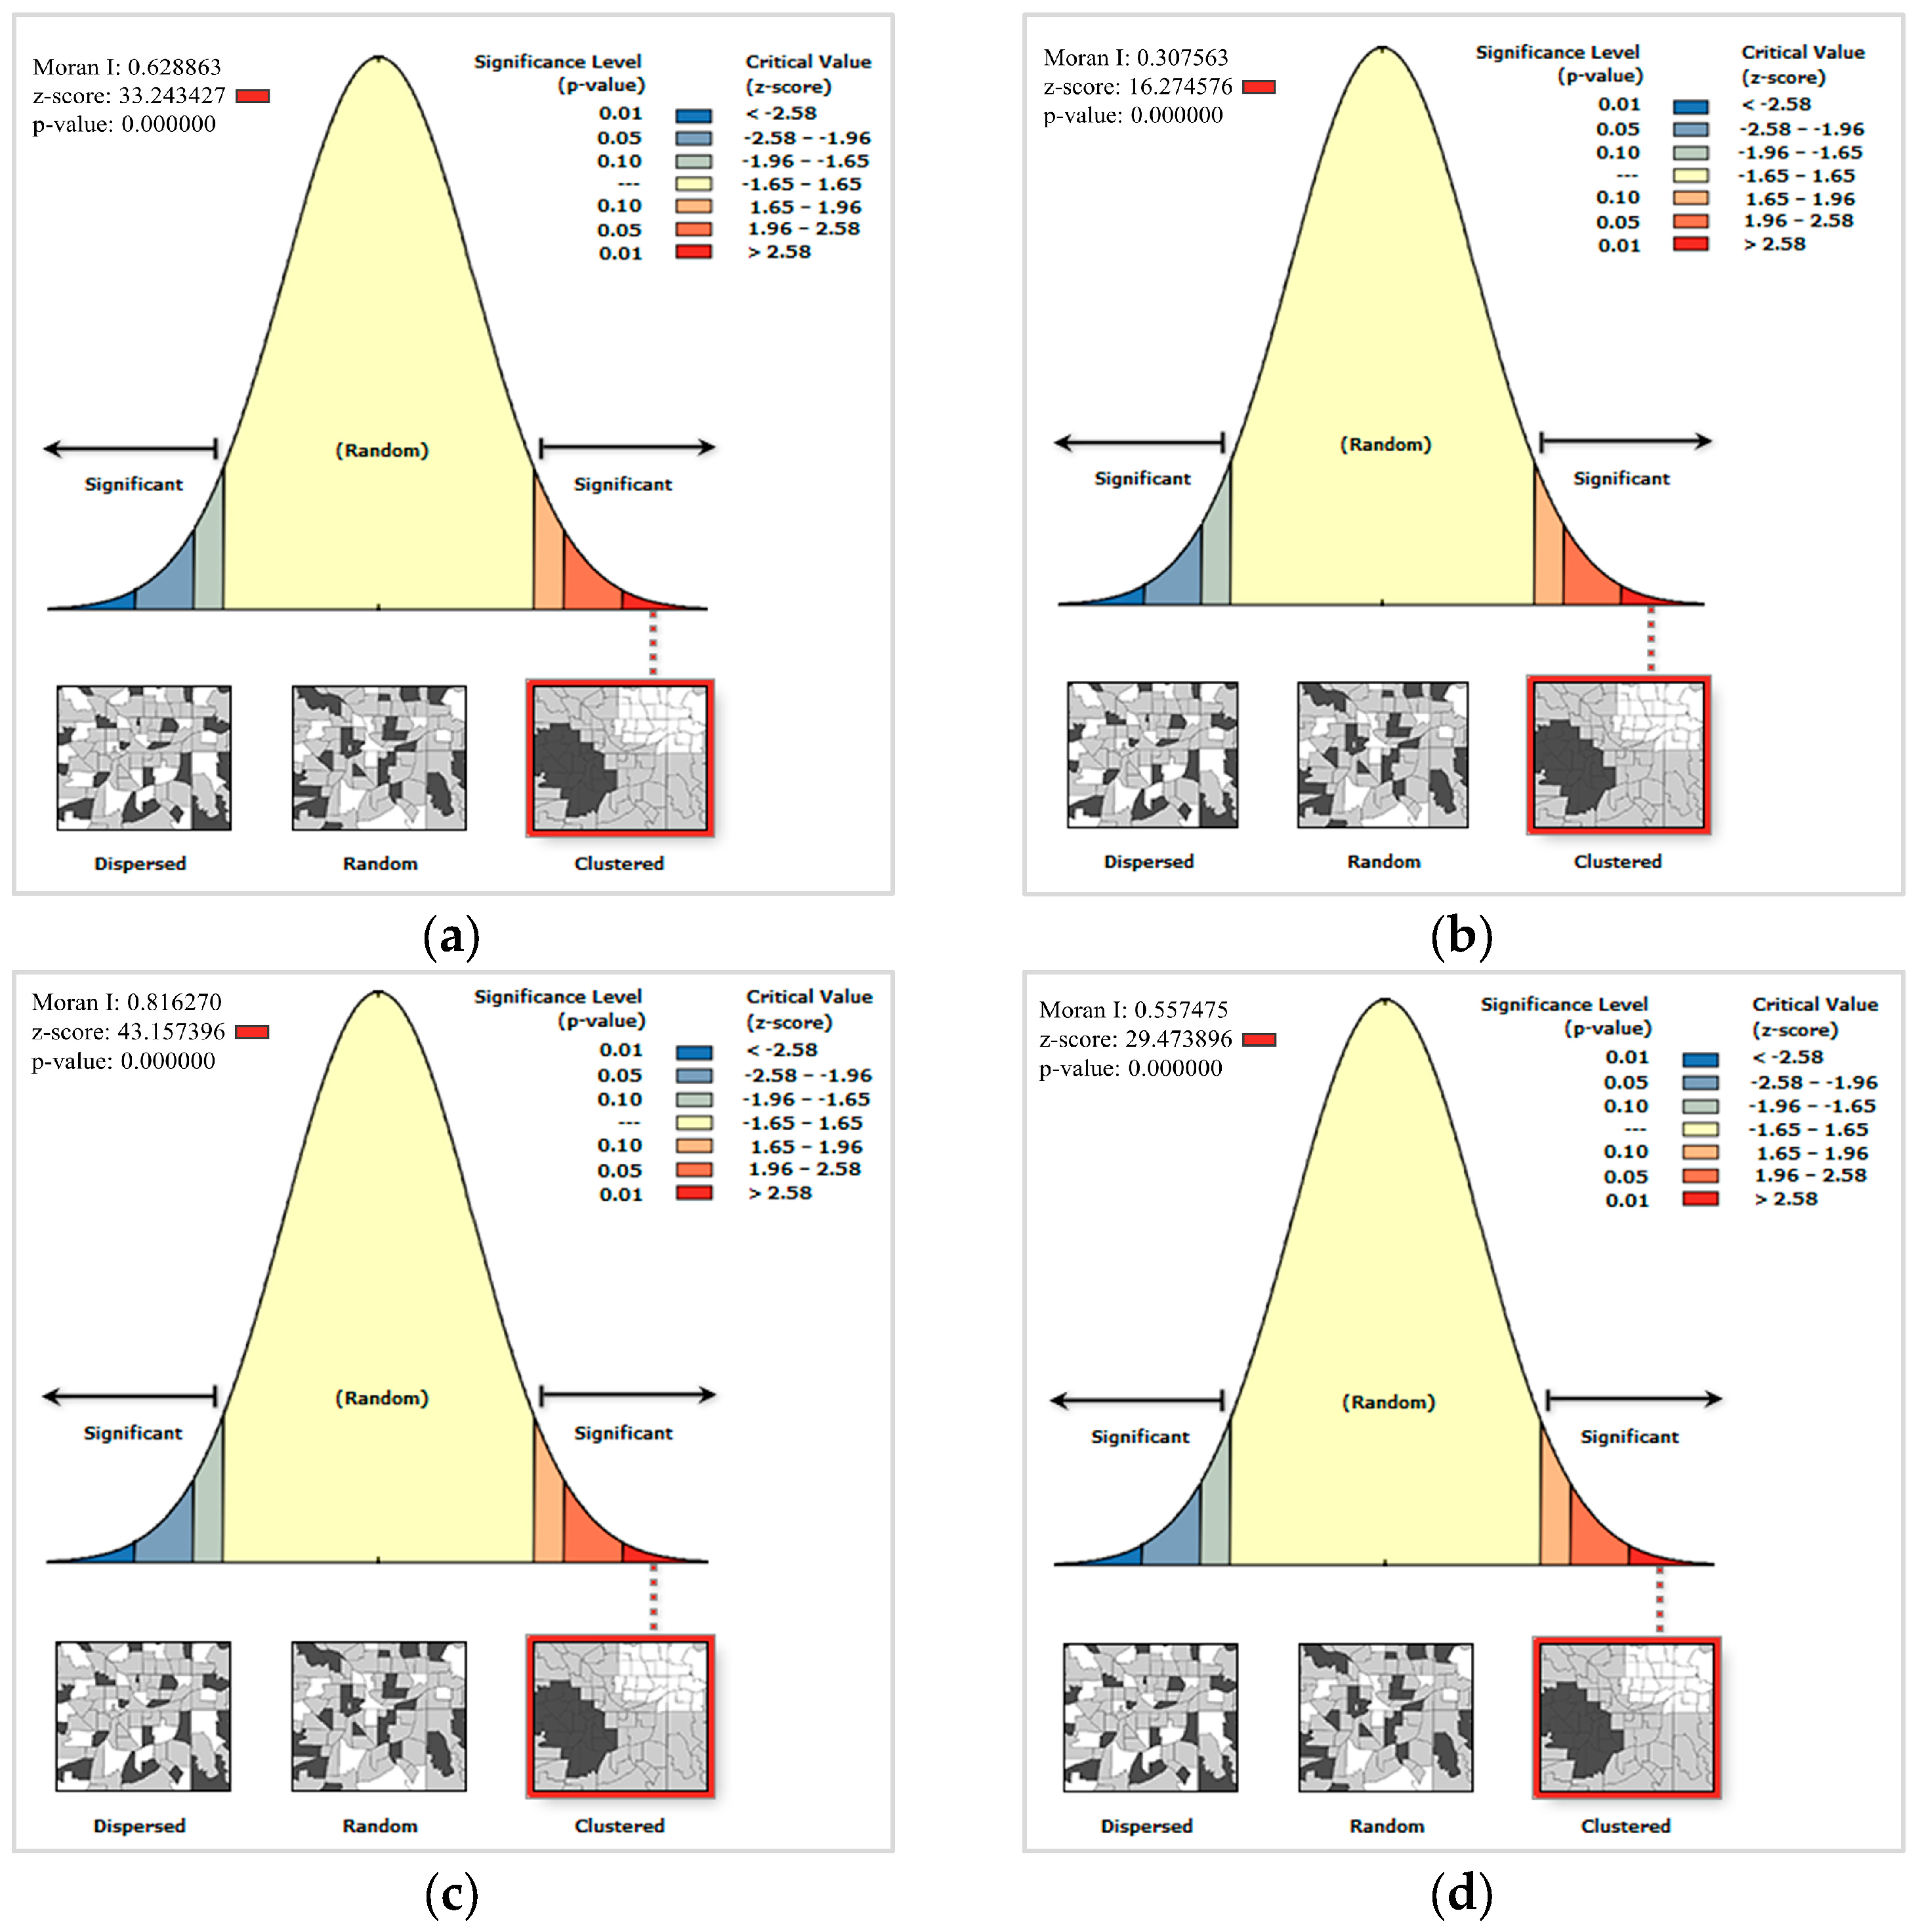
In order to further analyze the spatial distribution characteristics of flood disaster risk, on the basis of flood disaster risk value, global spatial autocorrelation analysis was conducted for each dimension index of flood disaster, and the outcomes are displayed in Figure 6a. The global Moran’s I index of flood disaster risk is 0.628863 > 0, indicating that the risk results are highly autocorrelated in space, and the z score is 33.243427 > 2.58, and the p value is 0.000000, which is less than 0.01 (99% confidence), indicating that the null hypothesis is completely rejected, indicating that the risk analysis results present a spatial aggregation pattern. It also indicates that certain regions have a higher risk tendency. When formulating flood prevention planning strategies, the government should give particular attention to these high-risk areas.
Similarly, this paper also analyzes the spatial correlation among flood exposure, flood vulnerability and flood prevention and mitigation capability. As depicted in Figure 6b–d, the z score of flood disaster exposedness is 16.274576, the z score of flood disaster vulnerability is 43.157396, and the z score of flood disaster prevention and mitigation capability is 29.473896. The p-values for all three dimensions are 0.000000, below the 0.01 threshold (99% confidence level), demonstrating a significant spatial correlation of flood disaster risk across these dimensions. This suggests that flood disaster management should consider not only natural factors but also social, economic conditions and the capacity for disaster prevention and mitigation. Considering the interdependent relationships among these dimensions is crucial for formulating comprehensive disaster prevention and mitigation plans. Such a strategy contributes to strengthening flood disaster response capacity and minimizing resulting losses.

4.4. Results of Local Spatial Analysis

4.4.1. Clustering and Outlier Analysis

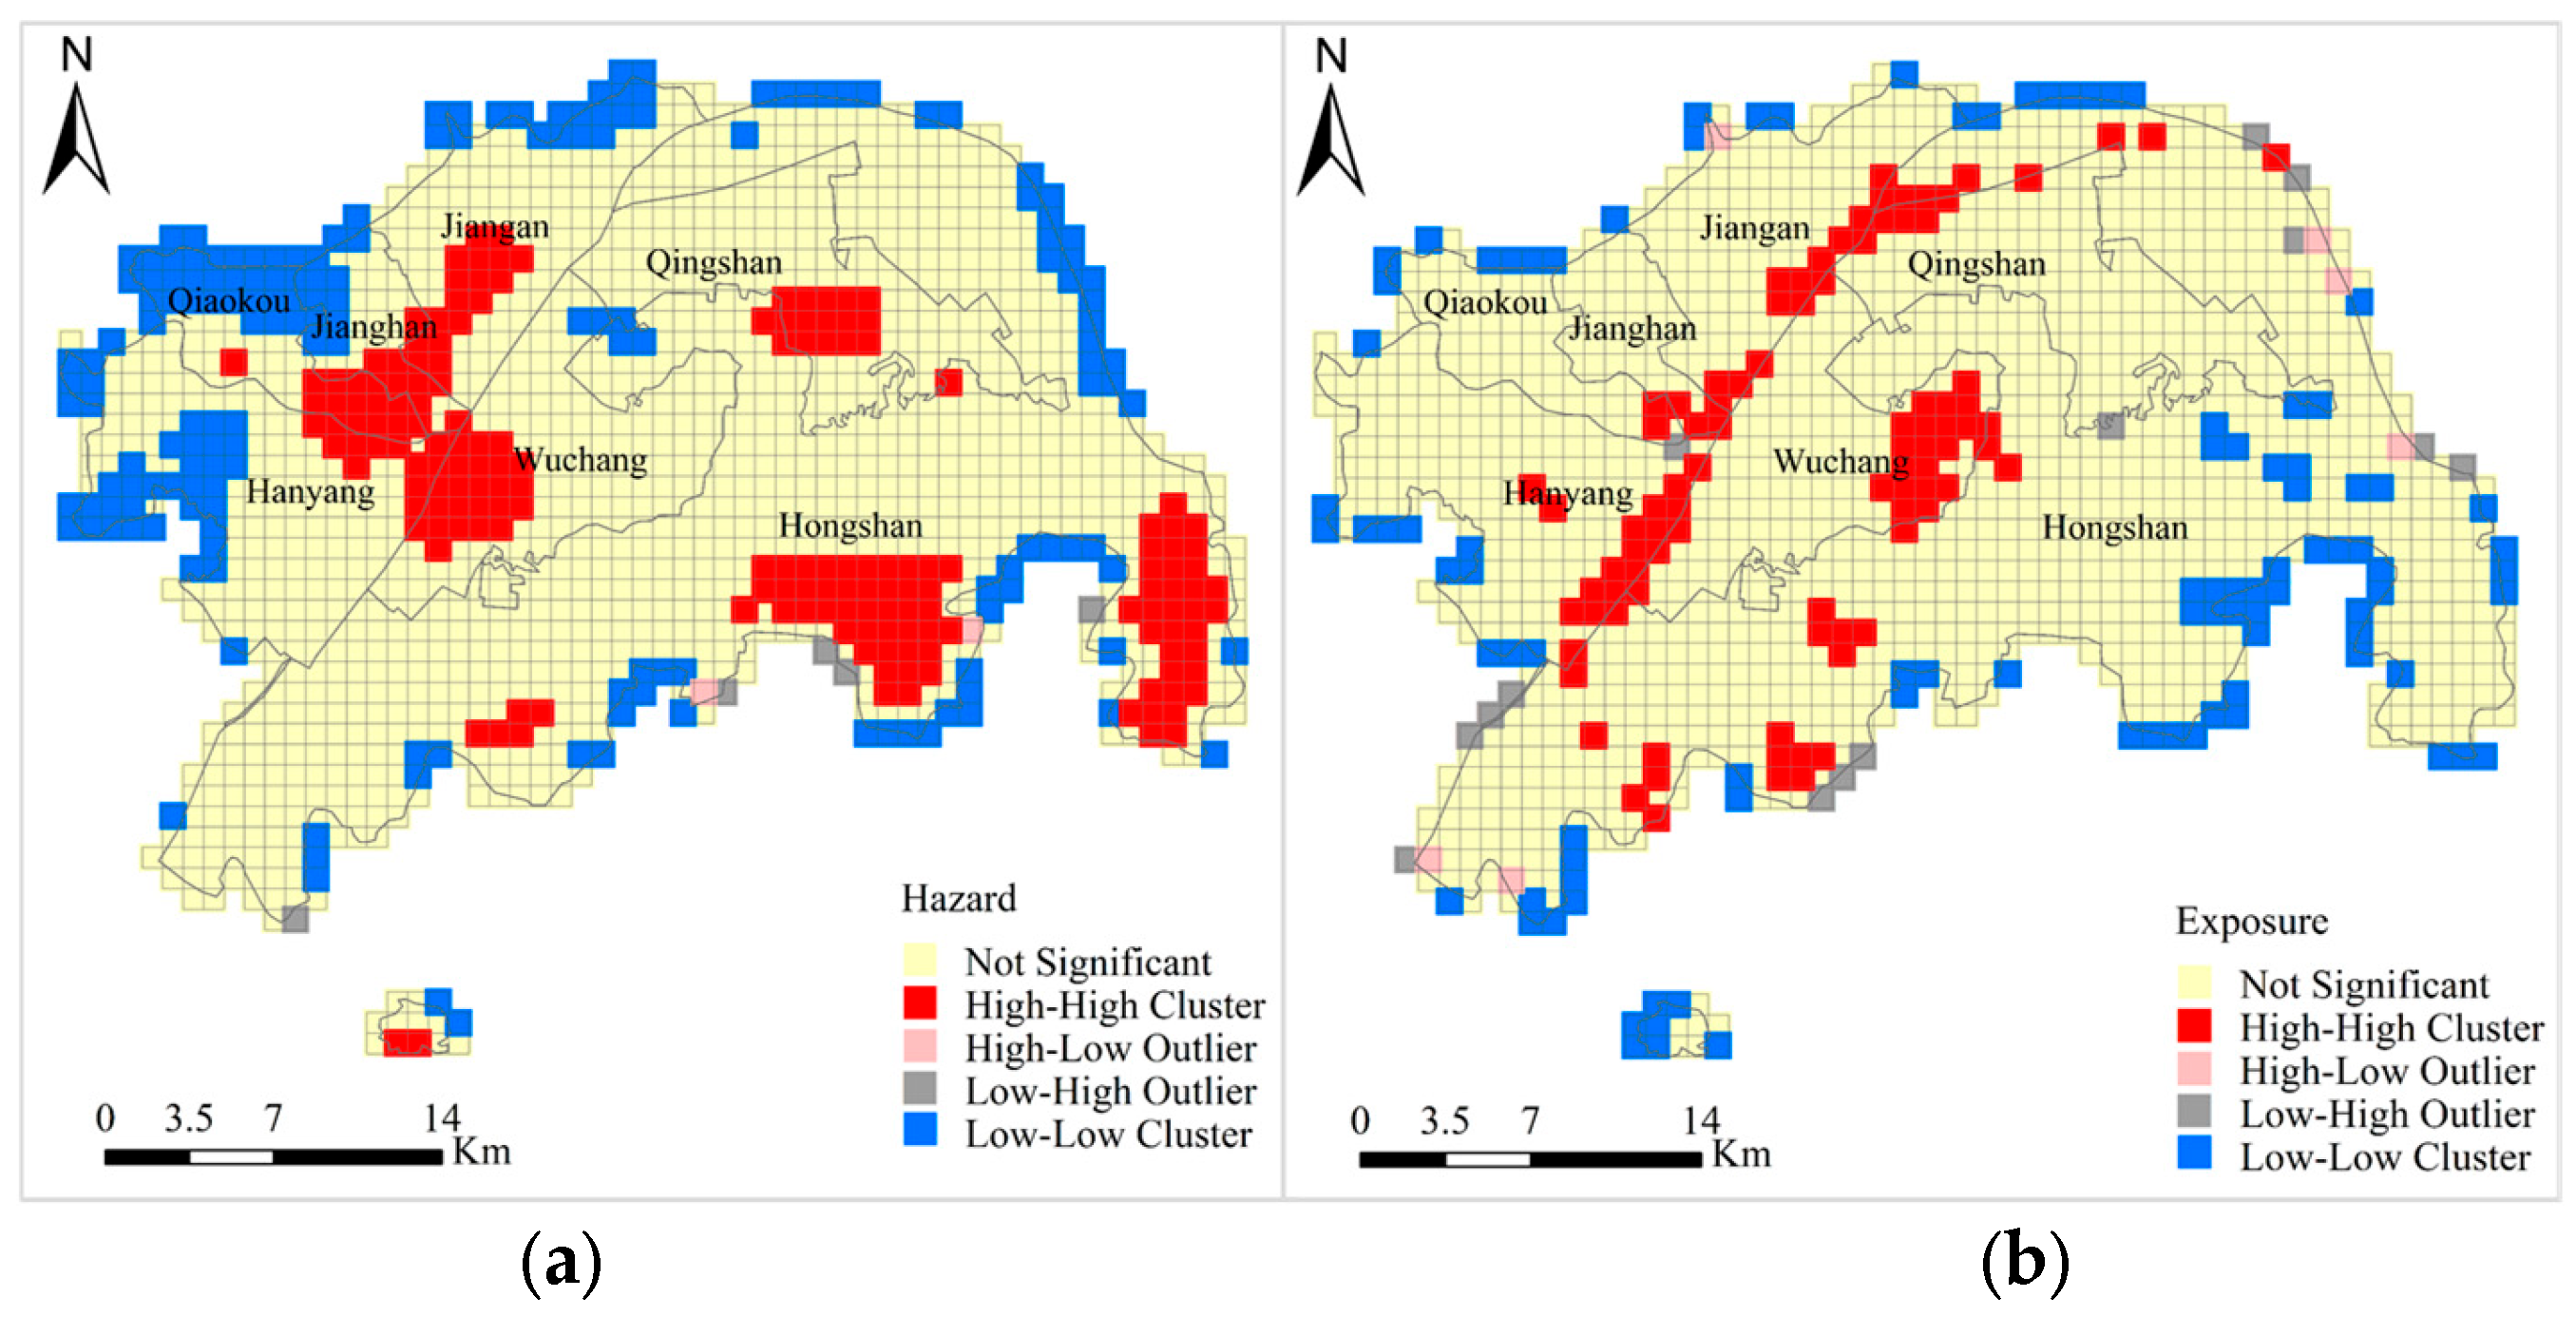
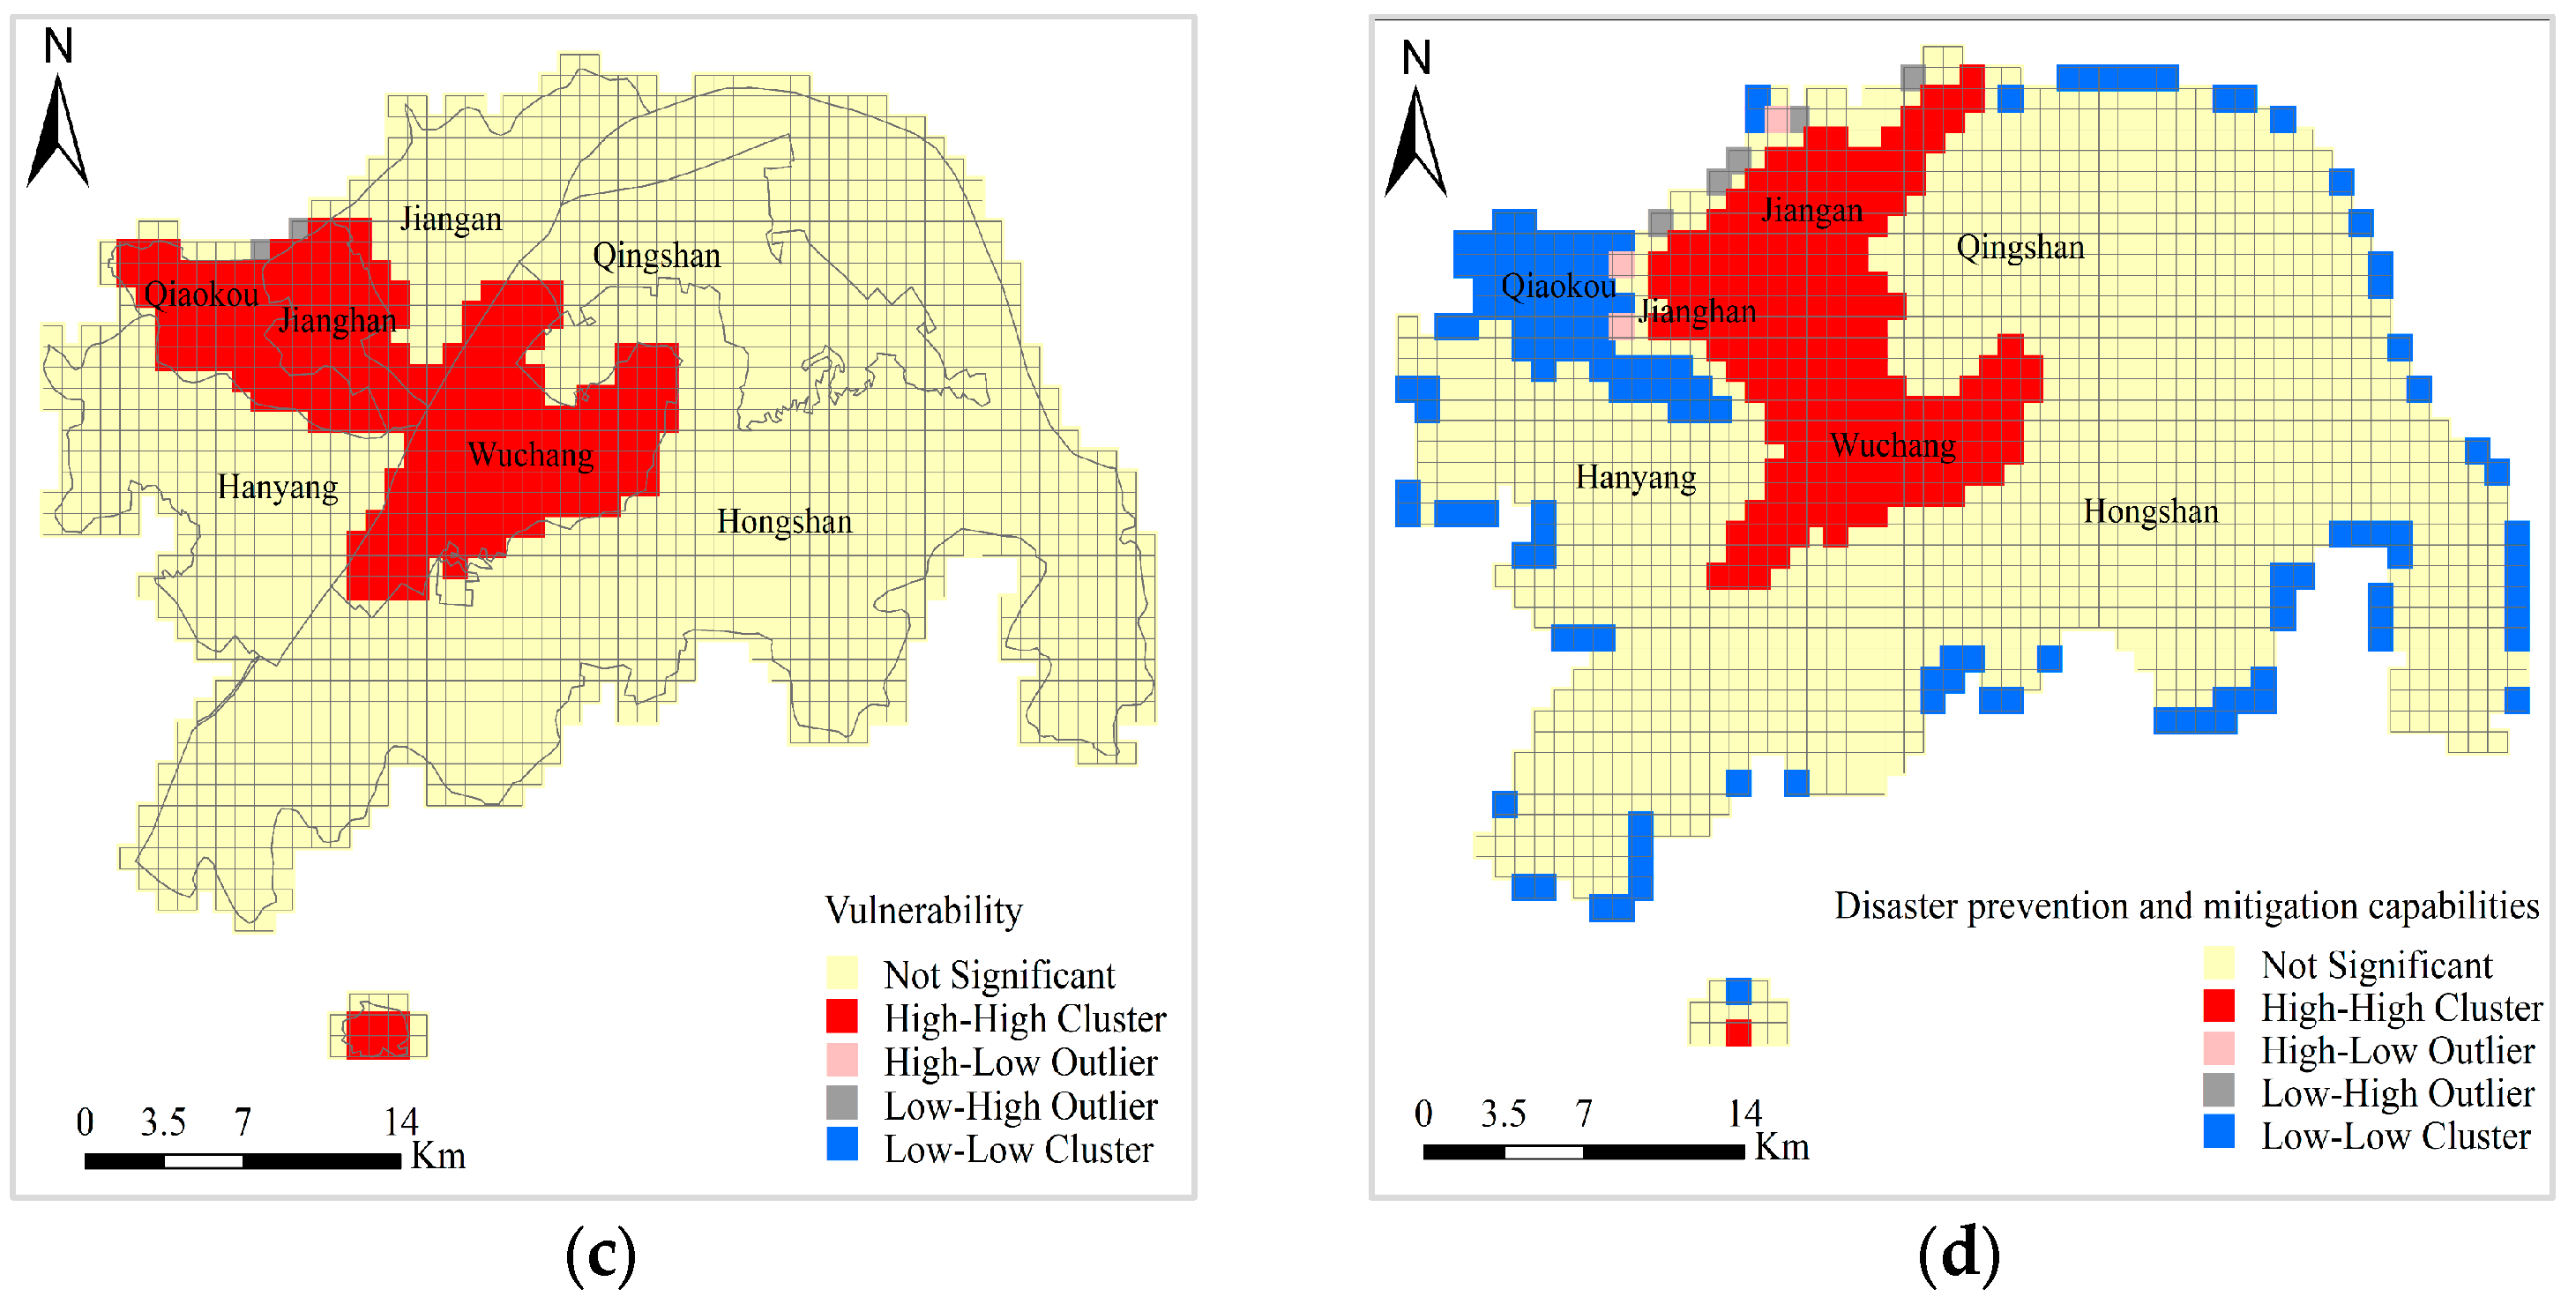
It is evident from the preceding analysis that the index layers involved in flood disaster risk assessment exhibit significant spatial correlation. To further identify the locations of risk clusters, clustering and outlier analyses were conducted to examine the spatial distribution of risks within the study area, with the results presented in Figure 6. It can be seen from Figure 7 that the outliers of the four indicator layers are all distributed in the edge area of the study area.
As depicted in Figure 7a, the major high-high risk clusters are concentrated in Jiangan, Jianghan, eastern Qiaokou, western Wuchang, and eastern Hongshan. These areas are greatly affected by natural conditions and have high risk levels. Low-low risk clusters are primarily found in the western and marginal zones within the study area, which have less precipitation and are far away from rivers and lakes, and the risk level is low.
Figure 7b revealed that the high-high clusters of exposure are banded in areas distributed along rivers and lakes, and some of them are clustered in patches. These areas are economically active and attract a large number of people to gather here, resulting in high building density and low vegetation coverage in this area. Coupled with the low topography of these areas and their proximity to rivers and lakes, there is a high likelihood of exposure to flooding. The low-low cluster of exposure is primarily located in the marginal areas, which has a low flood risk level due to high terrain and good vegetation coverage.
In Figure 7c, high clusters of vulnerability are concentrated in three regions, Qiaokou, Jianghan and Wuchang, which have high vulnerability due to high population concentration, active economic activities, high building density and high hardening of the ground surface. Other areas may benefit from the construction of drainage systems and sponge cities, making flood vulnerability low and scattered, and difficult to form low and low clustering.
As shown in Figure 7d, the high-high clustering of disaster prevention and reduction ability is mainly distributed in Jiangan, Jianghan and Wuchang. These areas are economically developed, the government has invested heavily in flood prevention and reduction, and the medical resources are relatively perfect. Therefore, the disaster prevention and reduction ability of these places presents a high-high clustering mode. Qiaokou and the marginal areas of the study region are characterized by low-low clusters of disaster prevention and mitigation capacity, primarily resulting from lower levels of economic development, insufficient flood preparedness investment, and a shortage of healthcare infrastructure.

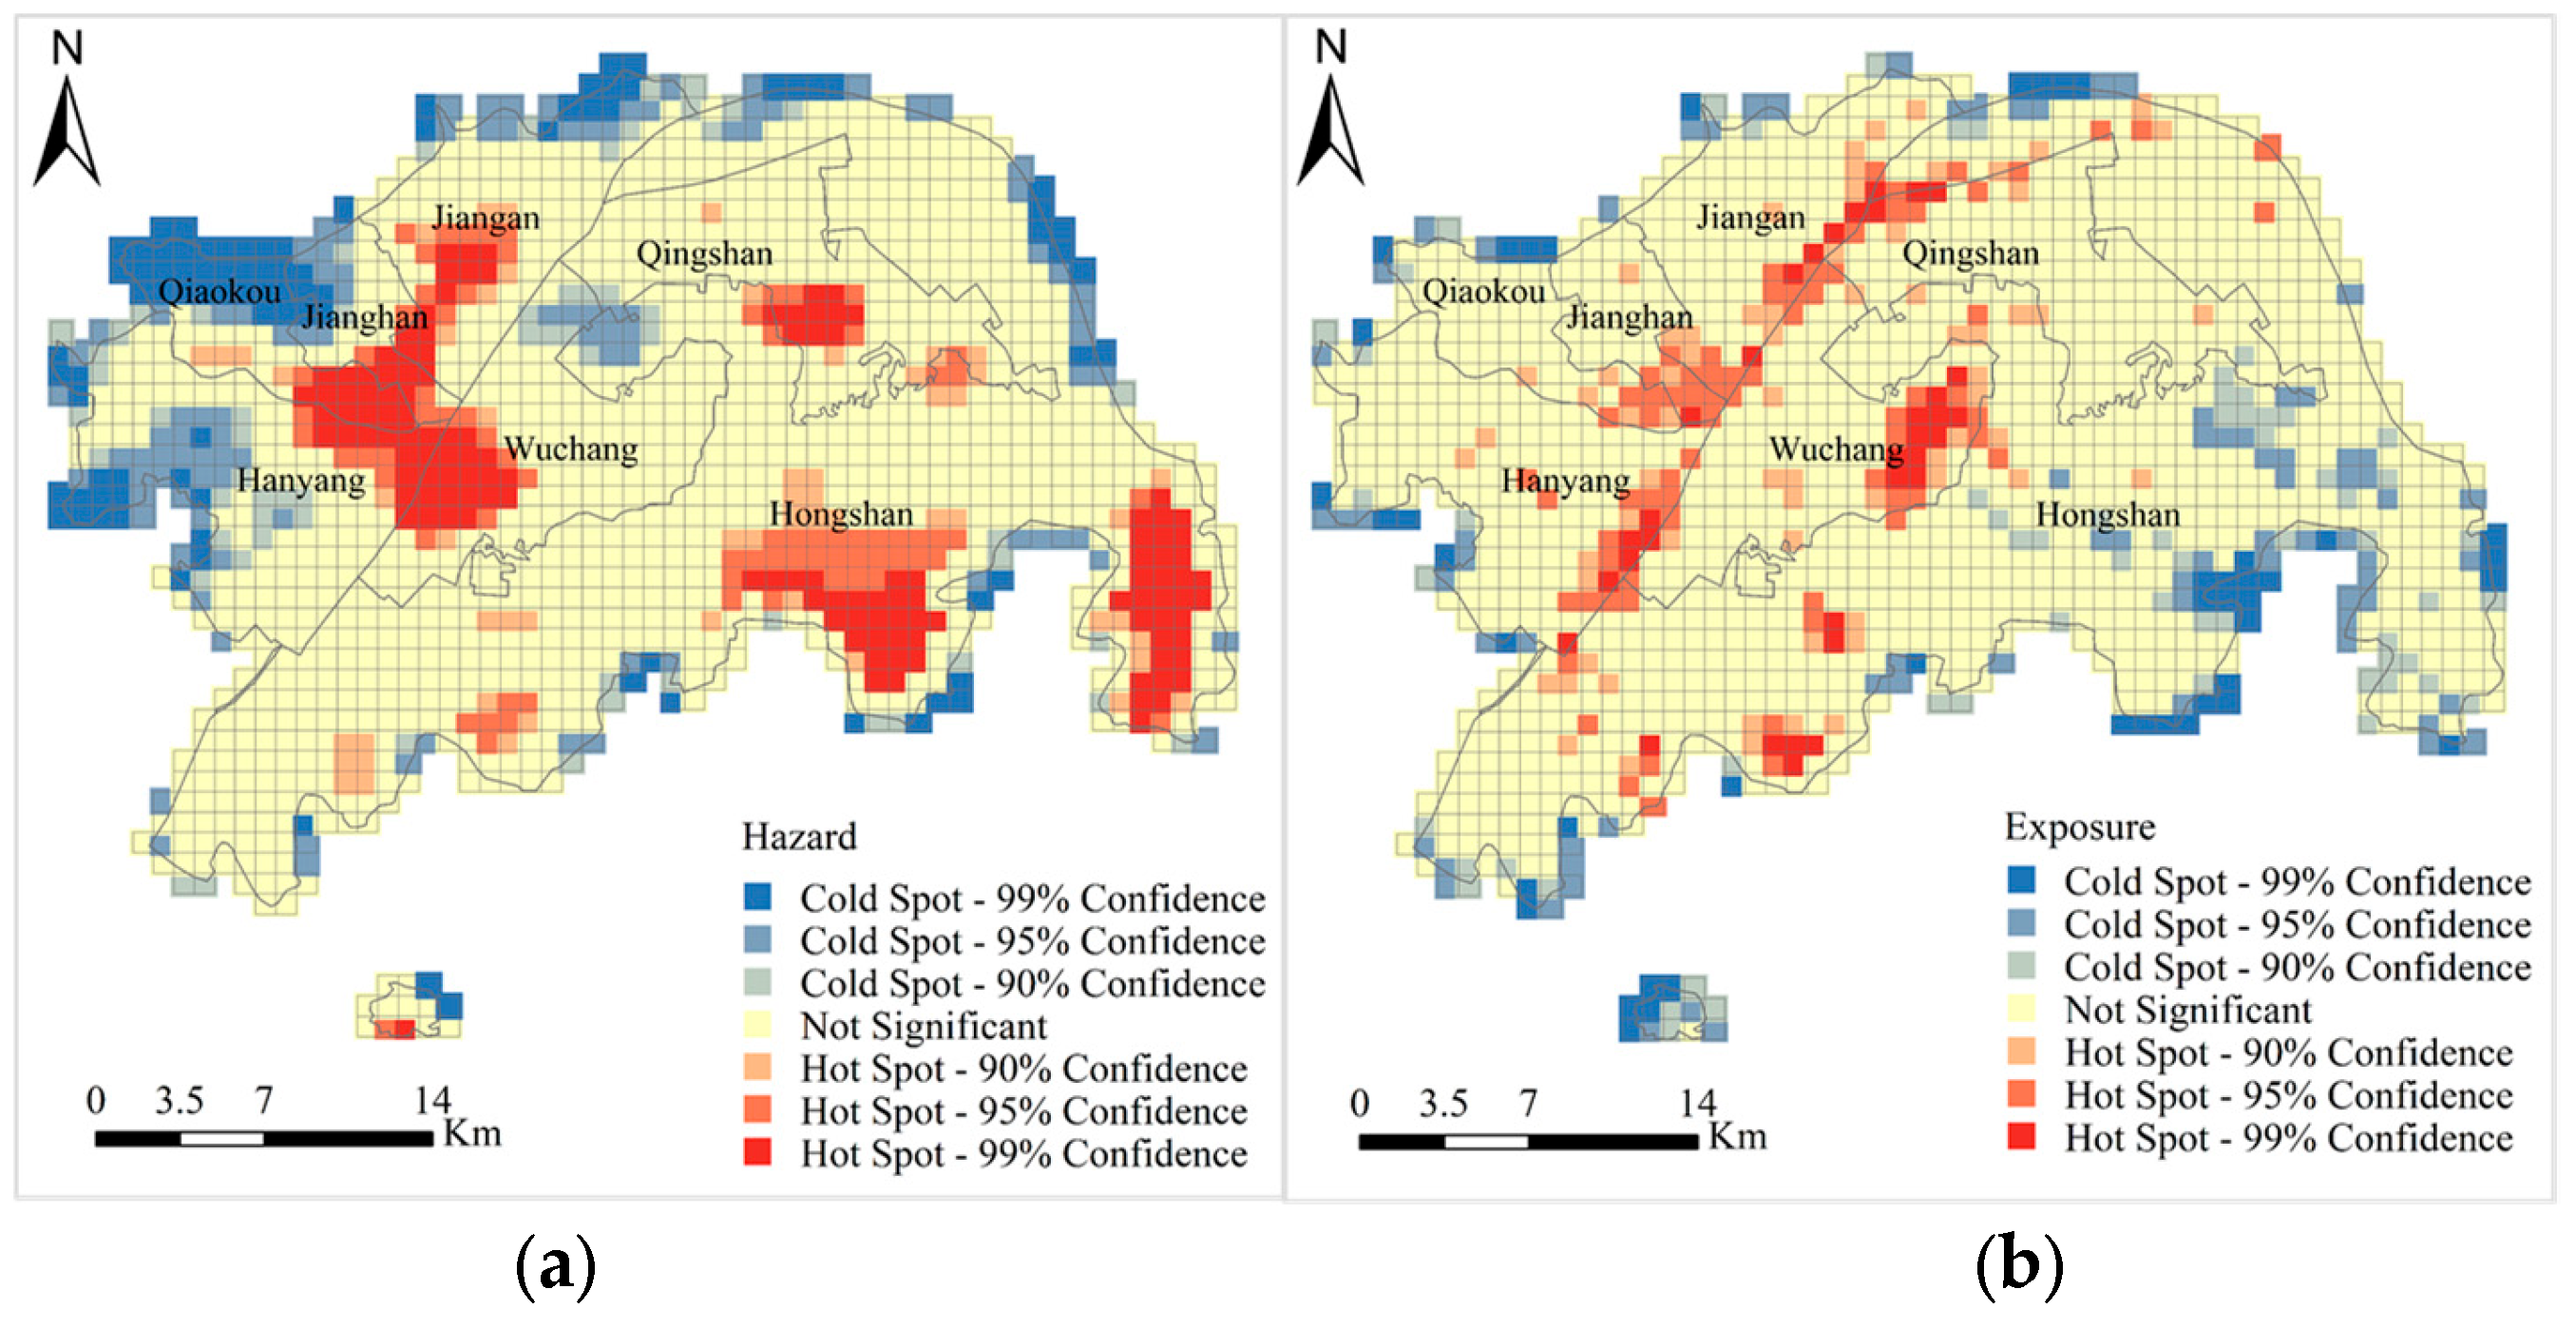
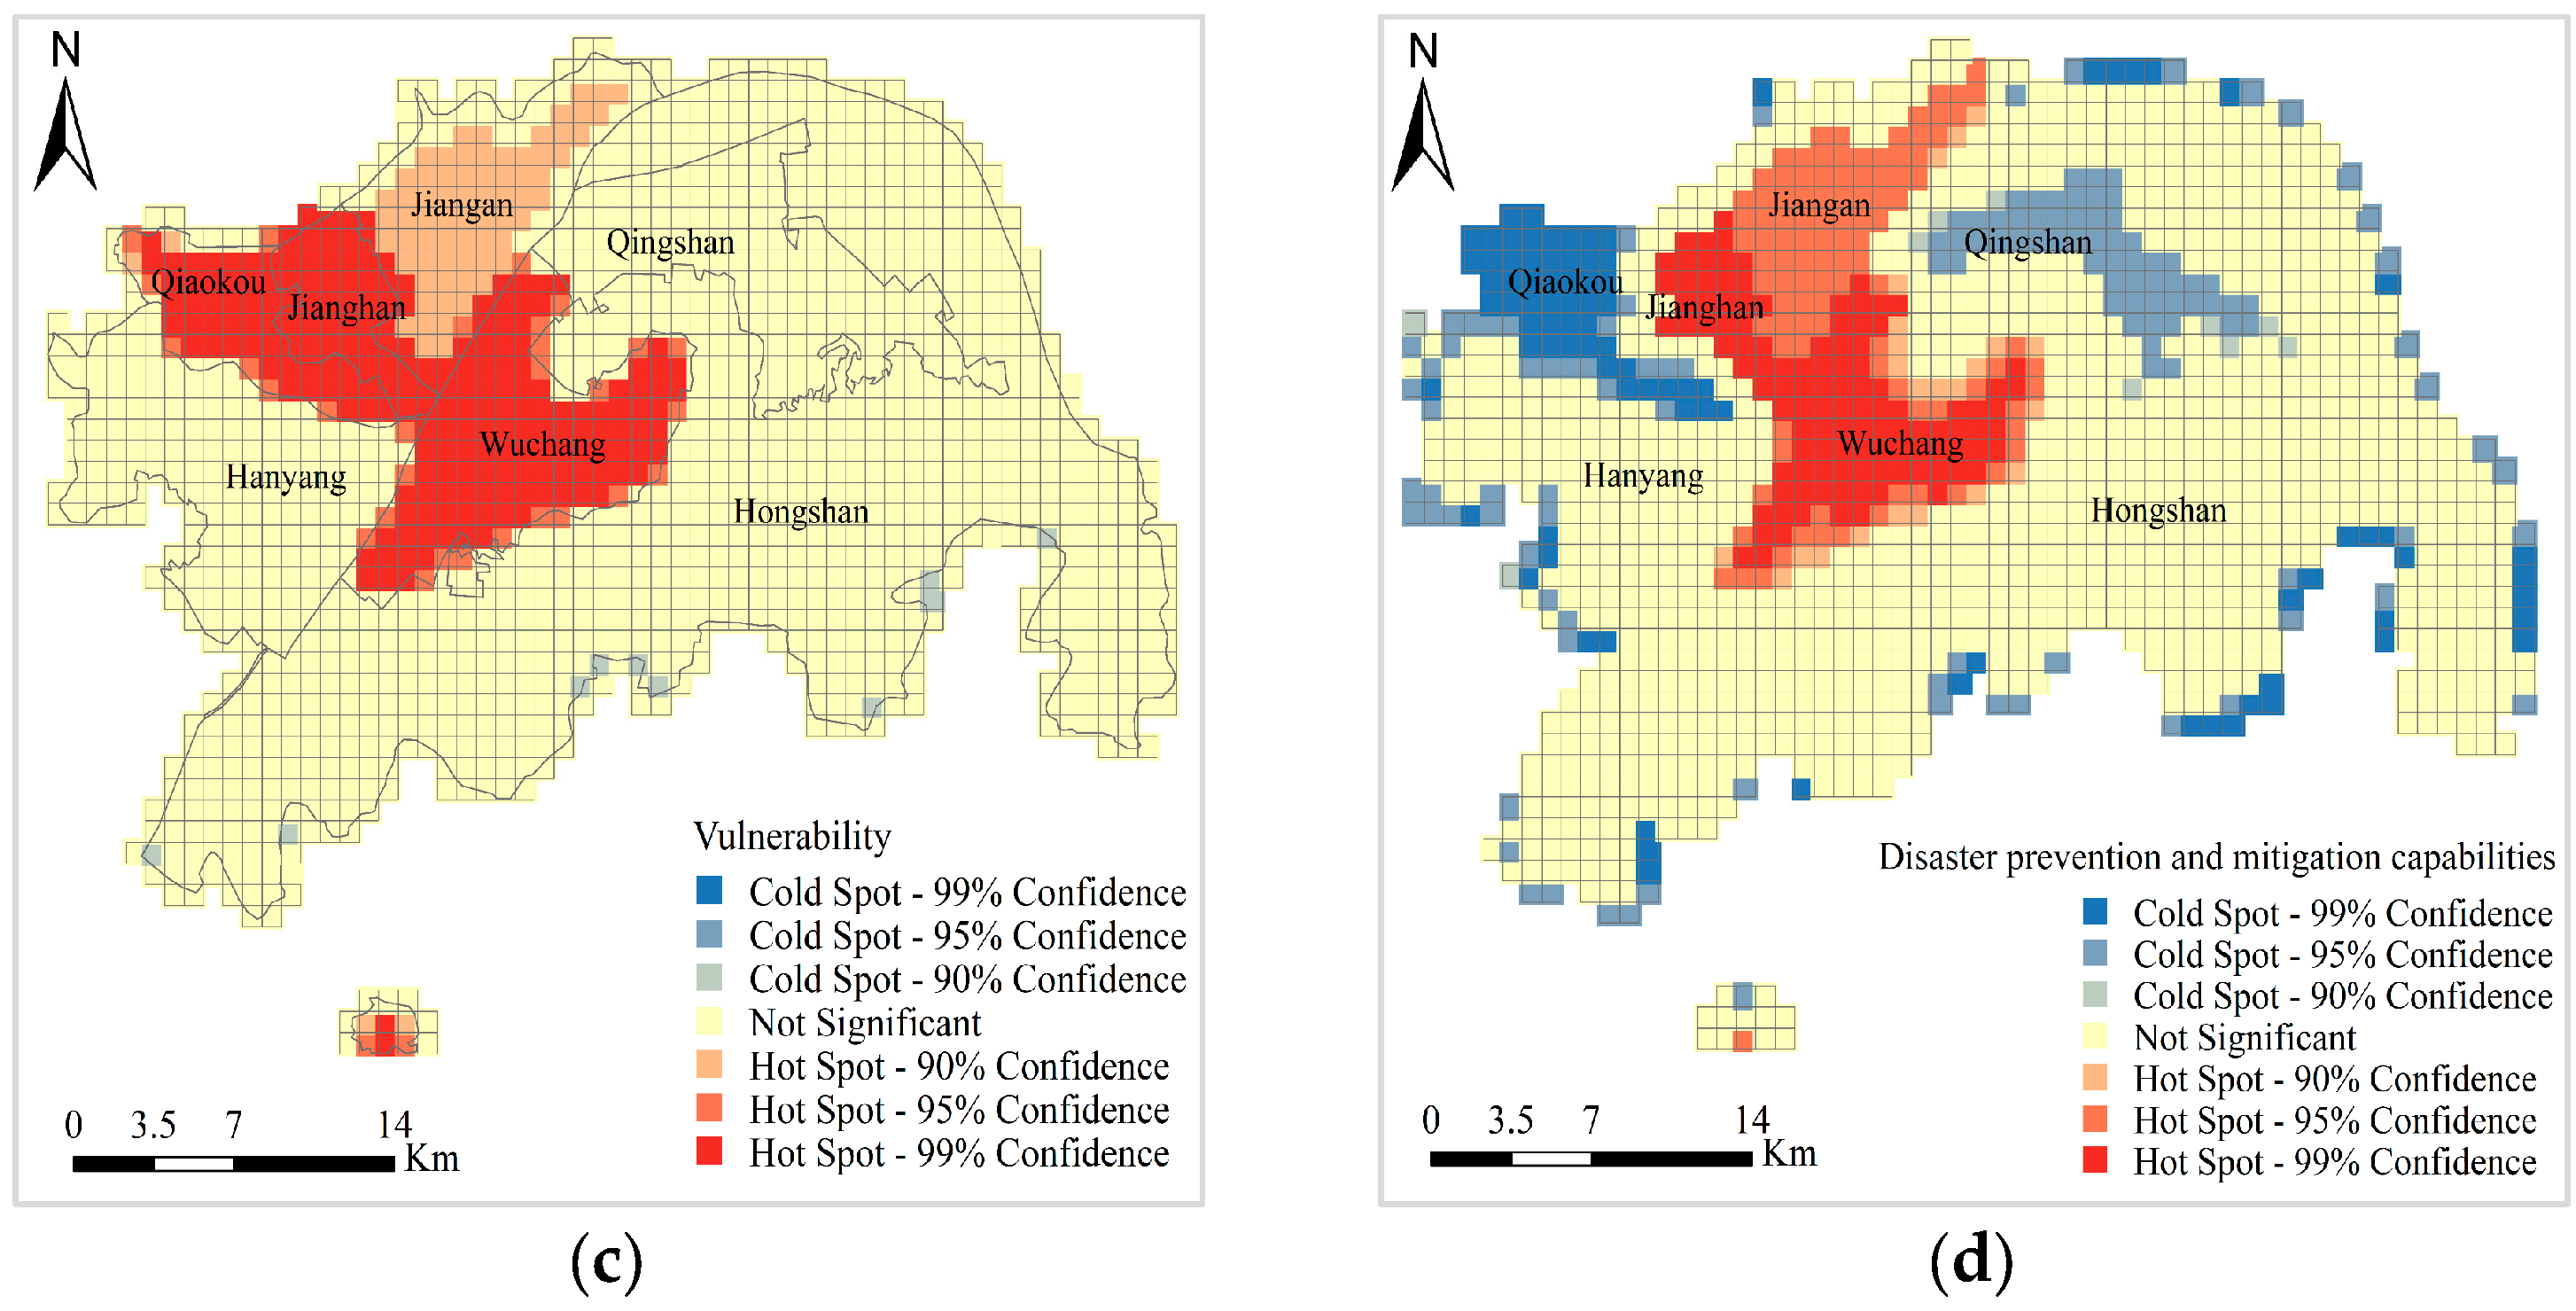
4.4.2. Hot Spot Analysis

To evaluate the clustering intensity of each indicator layer, hot spot analysis was performed on the risk values within the study area, and the resulting patterns are presented in Figure 8. As can be seen from Figure 8a–d, the hot spots of flood disaster risk index are predominantly found in Jianghan, Jiangan and the eastern Qiaokou, the western Wuchang District and some parts of Hongshan, and the cold spots are concentrated in the marginal areas of the study area. The hot spot area is more affected by natural environment factors, while the cold spot area is the opposite. The hot spots of flood disaster exposure are largely situated in the areas near rivers and lakes, while the cold spots are still distributed in the marginal areas of the study area. The vulnerability hotspots of flood disasters are mainly concentrated in densely populated areas with high economic level, such as Jianghan, Qiaokou and Wuchang. Other regions are relatively less affected by the natural and social environment and show no obvious vulnerability. The hot spots of flood disaster prevention and mitigation ability are distributed in Jianghan, Jiangan and Wuchang, while the cold spots are distributed in Qiaokou, Qingshan and the fringe areas of the research area. The regional economic development level of the hotspot distribution is high and the emergency resources are rich.

5. Discussion

A multi-dimensional flood risk assessment was conducted for Wuhan’s central urban area, incorporating hazard, exposure, vulnerability, and disaster mitigation capacity, with a subsequent analysis of the spatial distribution of each factor. From the visual representation of flood disaster risk (Figure 4), the overall assessment level of flood disaster risk and disaster prevention and mitigation ability in the study area is medium, while the overall assessment level of exposure and vulnerability is low. Therefore, it is suggested that future flood control planning and management should pay attention to the indicators associated with natural environment (hazard) and disaster recovery (ability to prevent and reduce disaster), and should not ignore the simultaneous development of urban construction (exposure) and social environment (vulnerability). Furthermore, by integrating the assessment results of each dimension, the overall risk level result for the targeted area was acquired (Figure 5). The accuracy of the risk identification was confirmed using historical flood data. The results showed that the risk assessment results were aligned well with the historical records, and the obtained risk assessment results were consistent with those reported by Wu et al. [2], DU et al. [15], and S Xiao et al. [21].
From the spatial pattern of each dimension index, the spatial aggregation effect is obvious (Figure 6). On the basis of the global spatial correlation analysis, the local spatial correlation analysis of each dimension index is carried out. The results show that the high clustering and hot spots of flood disaster risk, exposure, vulnerability and disaster prevention and reduction ability are all located in Jiangan, Jianghan and Wuchang. Although these areas have certain disaster prevention and reduction ability, the hazardousness of flood disasters is high, and they are located in high-exposedness areas. A large number of people and economic activities gather here, and thus are vulnerable to flood disasters. This finding aligns with the conclusions drawn by Fang et al. [29]. These areas have high rainfall, distribution along the river, low topography, population concentration, economic activity, and small vegetation coverage. Therefore, these areas may face greater risks of flooding. When conducting flood prevention planning and management, the government should strengthen flood prevention measures in these areas. For instance, prepare emergency supplies in advance in areas with high danger, high exposure, and high vulnerability; set up emergency shelters that can accommodate a sufficient number of affected people in these areas; and prioritize emergency rescue operations in high-risk areas prone to floods. Moreover, other areas should not be overlooked either. Their disaster prevention planning standards should at least reach the average level of cities.
There are shortcomings in this work: on the one hand, due to the limited historical disaster data available at present, this paper selects the data of typical flood years for analysis. We acknowledge that these data have an impact on the research results. However, as the flood disaster data continues to improve, subsequent studies will use updated data for analysis. On the other hand, this paper does not fully consider the impact of changing precipitation patterns on the risk assessment of future floods, especially on the dimension of flood hazard degree. Subsequent research will study different precipitation patterns to make the risk assessment results more reliable.

6. Conclusions

This study established a multi-level indicator system for flood disaster risk assessment with the assessment factors of “hazard, exposure, vulnerability and disaster prevention and mitigation capability”, evaluated the impact of each dimension index on flood disaster, and discussed the spatial differentiation characteristics of each dimension index. The key conclusions drawn from this research can be summarized as follows:
(1) Employing both AHP and entropy weights, the method leverages subjective and objective factors to improve the credibility of the flood risk assessment. The results of risk assessment showed that the overall risk and capacity of flood disaster prevention and mitigation were moderate, and the overall exposedness and vulnerability were low. Furthermore, the overall flood risk in the research region was evaluated. The findings revealed that Wuchang and Jianghan exhibited the greatest levels of risk, while some areas in Qingshan and Hanyang had the lowest risk levels.
(2) The hazards, exposure, vulnerability and disaster prevention and mitigation capabilities of flood disasters in the study area exhibit a strong spatial positive correlation clustering feature. If not controlled, these features will further cluster, intensifying the impact of flood disasters on the study area. The outliers of each dimension index are distributed in the peripheral areas of the target region. The high clustering of each dimension index is mainly observed in the localities of the riverbank, Jianghan, Wuchang and Qiaokou, which are also the hotspots. The above research results are useful for policy makers and stakeholders. Policy makers can strengthen flood warnings (including rainstorm warnings and water level warnings in hotspots) in these hotspots and promptly release these warning information through social media, and take preventive measures in advance (such as the establishment of shelters, the layout of emergency material reserves, and the planning of evacuation routes during flood disasters). In addition, the research results can help the public, especially those in hotspots, enhance their awareness of disaster prevention and escape.
(3) The data used in this study are static data, and dynamic risk assessment will be closer to the actual disaster change situation. Therefore, in future research, time data will be taken into account or dynamic simulations of the evolution of flood disaster scenarios will be conducted.

Author Contributions

Software, W.J.; validation, W.J. and W.L.; investigation, Y.S.; resources, J.Y.; writing—original draft preparation, W.J.; writing—review and editing, W.L. All authors have read and agreed to the published version of the manuscript.

Funding

This work was supported by the Henan Provincial Science and Technology Research Project, grant number 242102321033.

Data Availability Statement

All the data sources have been provided in Table 1.

Acknowledgments

The study is funded by the Henan Provincial Science and Technology Research Project (No. 242102321033). The authors thank the anonymous reviewers for their valuable comments. The authors declare that there is no conflict of interest regarding the publication of this paper.

Conflicts of Interest

The authors declare no conflict of interest.

References

  1. Kreibich, H.; Van Loon, A.F.; Schröter, K.; Ward, P.J.; Mazzoleni, M.; Sairam, N.; Abeshu, G.W.; Agafonova, S.; AghaKouchak, A.; Aksoy, H.; et al. The challenge of unprecedented floods and droughts in risk management. Nature 2022, 608, 80. [Google Scholar] [CrossRef]
  2. Wu, H.L.; Cheng, W.C.; Shen, S.L.; Lin, M.Y.; Arulrajah, A. Variation of hydro-environment during past four decades with underground sponge city planning to control flash floods in Wuhan, China: An overview. Undergr. Space 2020, 5, 184–198. [Google Scholar] [CrossRef]
  3. Wang, X.J.; Xia, J.Q.; Dong, B.L.; Li, Q.J.; Zhang, X. Hydrodynamics-based assessment of flood losses in an urban district under changing environments. Nat. Hazards 2024, 120, 14755–14783. [Google Scholar] [CrossRef]
  4. Diakakis, M.; Mavroulis, S.; Deligiannakis, G. Floods in Greece, a statistical and spatial approach. Nat. Hazards 2012, 62, 485–500. [Google Scholar] [CrossRef]
  5. Zhao, Y.; Gong, Z.W.; Wang, W.H.; Luo, K. The comprehensive risk evaluation on rainstorm and flood disaster losses in China mainland from 2004 to 2009: Based on the triangular gray correlation theory. Nat. Hazards 2014, 71, 1001–1016. [Google Scholar] [CrossRef]
  6. Newman, J.P.; Maier, H.R.; Riddell, G.A.; Zecchin, A.C.; Daniell, J.E.; Schaefer, A.M.; van Delden, H.; Khazai, B.; O’Flaherty, M.J.; Newland, C.P. Review of literature on decision support systems for natural hazard risk reduction: Current status and future research directions. Environ. Modell. Softw. 2017, 96, 378–409. [Google Scholar] [CrossRef]
  7. Gigovic, L.; Pamucar, D.; Bajic, Z.; Drobnjak, S. Application of GIS-Interval Rough AHP Methodology for Flood Hazard Mapping in Urban Areas. Water 2017, 9, 360. [Google Scholar] [CrossRef]
  8. Lyu, H.M.; Shen, S.L.; Zhou, A.N.; Zhou, W.H. Flood risk assessment of metro systems in a subsiding environment using the interval FAHP-FCA approach. Sustain. Cities Soc. 2019, 50, 101682. [Google Scholar] [CrossRef]
  9. Bhere, S.; Reddy, M.J. Flood risk assessment of suburban region in India by incorporating flood hazard, vulnerability and exposure. Nat. Hazards 2024, 121, 6625–6649. [Google Scholar] [CrossRef]
  10. Yin, Z.E.; Yin, J.; Xu, S.Y.; Wen, J.H. Community-based scenario modelling and disaster risk assessment of urban rainstorm waterlogging. J. Geogr. Sci. 2011, 21, 274–284. [Google Scholar] [CrossRef]
  11. Lin, T.; Liu, X.F.; Song, J.C.; Zhang, G.Q.; Jia, Y.Q.; Tu, Z.Z.; Zheng, Z.H.; Liu, C.L. Urban waterlogging risk assessment based on internet open data: A case study in China. Habitat. Int. 2018, 71, 88–96. [Google Scholar] [CrossRef]
  12. Wu, Z.N.; Shen, Y.X.; Wang, H.L. Assessing Urban Areas’ Vulnerability to Flood Disaster Based on Text Data: A Case Study in Zhengzhou City. Sustainability 2019, 11, 4548. [Google Scholar] [CrossRef]
  13. Xiao, Y.F.; Yi, S.Z.; Tang, Z.Q. Integrated flood hazard assessment based on spatial ordered weighted averaging method considering spatial heterogeneity of risk preference. Sci. Total Environ. 2017, 599, 1034–1046. [Google Scholar] [CrossRef] [PubMed]
  14. Prall, M.C.; Brandt, U.S.; Halvorsen, N.S.; Hansen, M.U.; Dahlberg, N.; Andersen, K.J. A comprehensive approach for assessing social flood vulnerability and social flood risk: The case of Denmark. Int. J. Disaster Risk Reduct. 2024, 111, 104686. [Google Scholar] [CrossRef]
  15. Du, W.Y.; Gong, Y.; Chen, N.C. PSO-WELLSVM: An integrated method and its application in urban waterlogging susceptibility assessment in the central Wuhan, China. Comput. Geosci. 2022, 161, 105079. [Google Scholar] [CrossRef]
  16. Wu, Y.N.; Zhong, P.A.; Xu, B.; Zhu, F.L.; Ma, B. Changing of flood risk due to climate and development in Huaihe River basin, China. Stoch. Environ. Res. Risk A 2017, 31, 935–948. [Google Scholar] [CrossRef]
  17. Cai, S.Y.; Fan, J.M.; Yang, W. Flooding Risk Assessment and Analysis Based on GIS and the TFN-AHP Method: A Case Study of Chongqing, China. Atmosphere 2021, 12, 623. [Google Scholar] [CrossRef]
  18. Gao, L.; Liu, X.X.; Liu, H. Spatiotemporal differentiation characteristics of flood risk based on spatial statistical analysis: A study of Jing-Jin-Ji region in China. Nat. Hazards 2025, 121, 1711–1736. [Google Scholar] [CrossRef]
  19. Zhang, Q.F.; Wu, Z.F.; Zhang, H.; Dalla Fontana, G.; Tarolli, P. Identifying dominant factors of waterlogging events in metropolitan coastal cities: The case study of Guangzhou, China. J. Environ. Manag. 2020, 271, 110951. [Google Scholar] [CrossRef]
  20. Wang, X.; Xia, J.; Zhou, M.; Deng, S.; Li, Q. Assessment of the joint impact of rainfall and river water level on urban flooding in Wuhan City, China. J. Hydrol. 2022, 613, 128419. [Google Scholar] [CrossRef]
  21. Xiao, S.; Zou, L.; Xia, J.; Dong, Y.; Yang, Z.Z.; Yao, T.C. Assessment of the urban waterlogging resilience and identification of its driving factors: A case study of Wuhan City, China. Sci. Total Environ. 2023, 866, 161321. [Google Scholar] [CrossRef]
  22. Liu, J.; Wang, S.Y.; Li, D.M. The Analysis of the Impact of Land-Use Changes on Flood Exposure of Wuhan in Yangtze River Basin, China. Water Resour. Manag. 2014, 28, 2507–2522. [Google Scholar] [CrossRef]
  23. Lyu, H.M.; Sun, W.J.; Shen, S.L.; Arulrajah, A. Flood risk assessment in metro systems of mega-cities using a GIS-based modeling approach. Sci. Total Environ. 2018, 626, 1012–1025. [Google Scholar] [CrossRef] [PubMed]
  24. Choubin, B.; Moradi, E.; Golshan, M.; Adamowski, J.; Sajedi-Hosseini, F.; Mosavi, A. An ensemble prediction of flood susceptibility using multivariate discriminant analysis, classification and regression trees, and support vector machines. Sci. Total Environ. 2019, 651, 2087–2096. [Google Scholar] [CrossRef] [PubMed]
  25. Chen, P.; Chen, X.L. Spatio-temporal variation of flood vulnerability at the Poyang Lake Ecological Economic Zone, Jiangxi Province, China. Water Sci. Technol. 2012, 65, 1332–1340. [Google Scholar] [CrossRef]
  26. Tanoue, M.; Hirabayashi, Y.; Ikeuchi, H. Global-scale river flood vulnerability in the last 50 years. Sci. Rep. 2016, 6, 36021. [Google Scholar] [CrossRef]
  27. Borowska-Stefanska, M. Conceptual Framework for Flood Vulnerability Assessment. Nat. Hazards Rev. 2024, 25, 05024003. [Google Scholar] [CrossRef]
  28. Xu, H.S.; Ma, C.; Lian, J.J.; Xu, K.; Chaima, E. Urban flooding risk assessment based on an integrated k-means cluster algorithm and improved entropy weight method in the region of Haikou, China. J. Hydrol. 2018, 563, 975–986. [Google Scholar] [CrossRef]
  29. Fang, J.; Hu, J.M.; Shi, X.W.; Zhao, L. Assessing disaster impacts and response using social media data in China: A case study of 2016 Wuhan rainstorm. Int. J. Disaster Risk Reduct. 2019, 34, 275–282. [Google Scholar] [CrossRef]
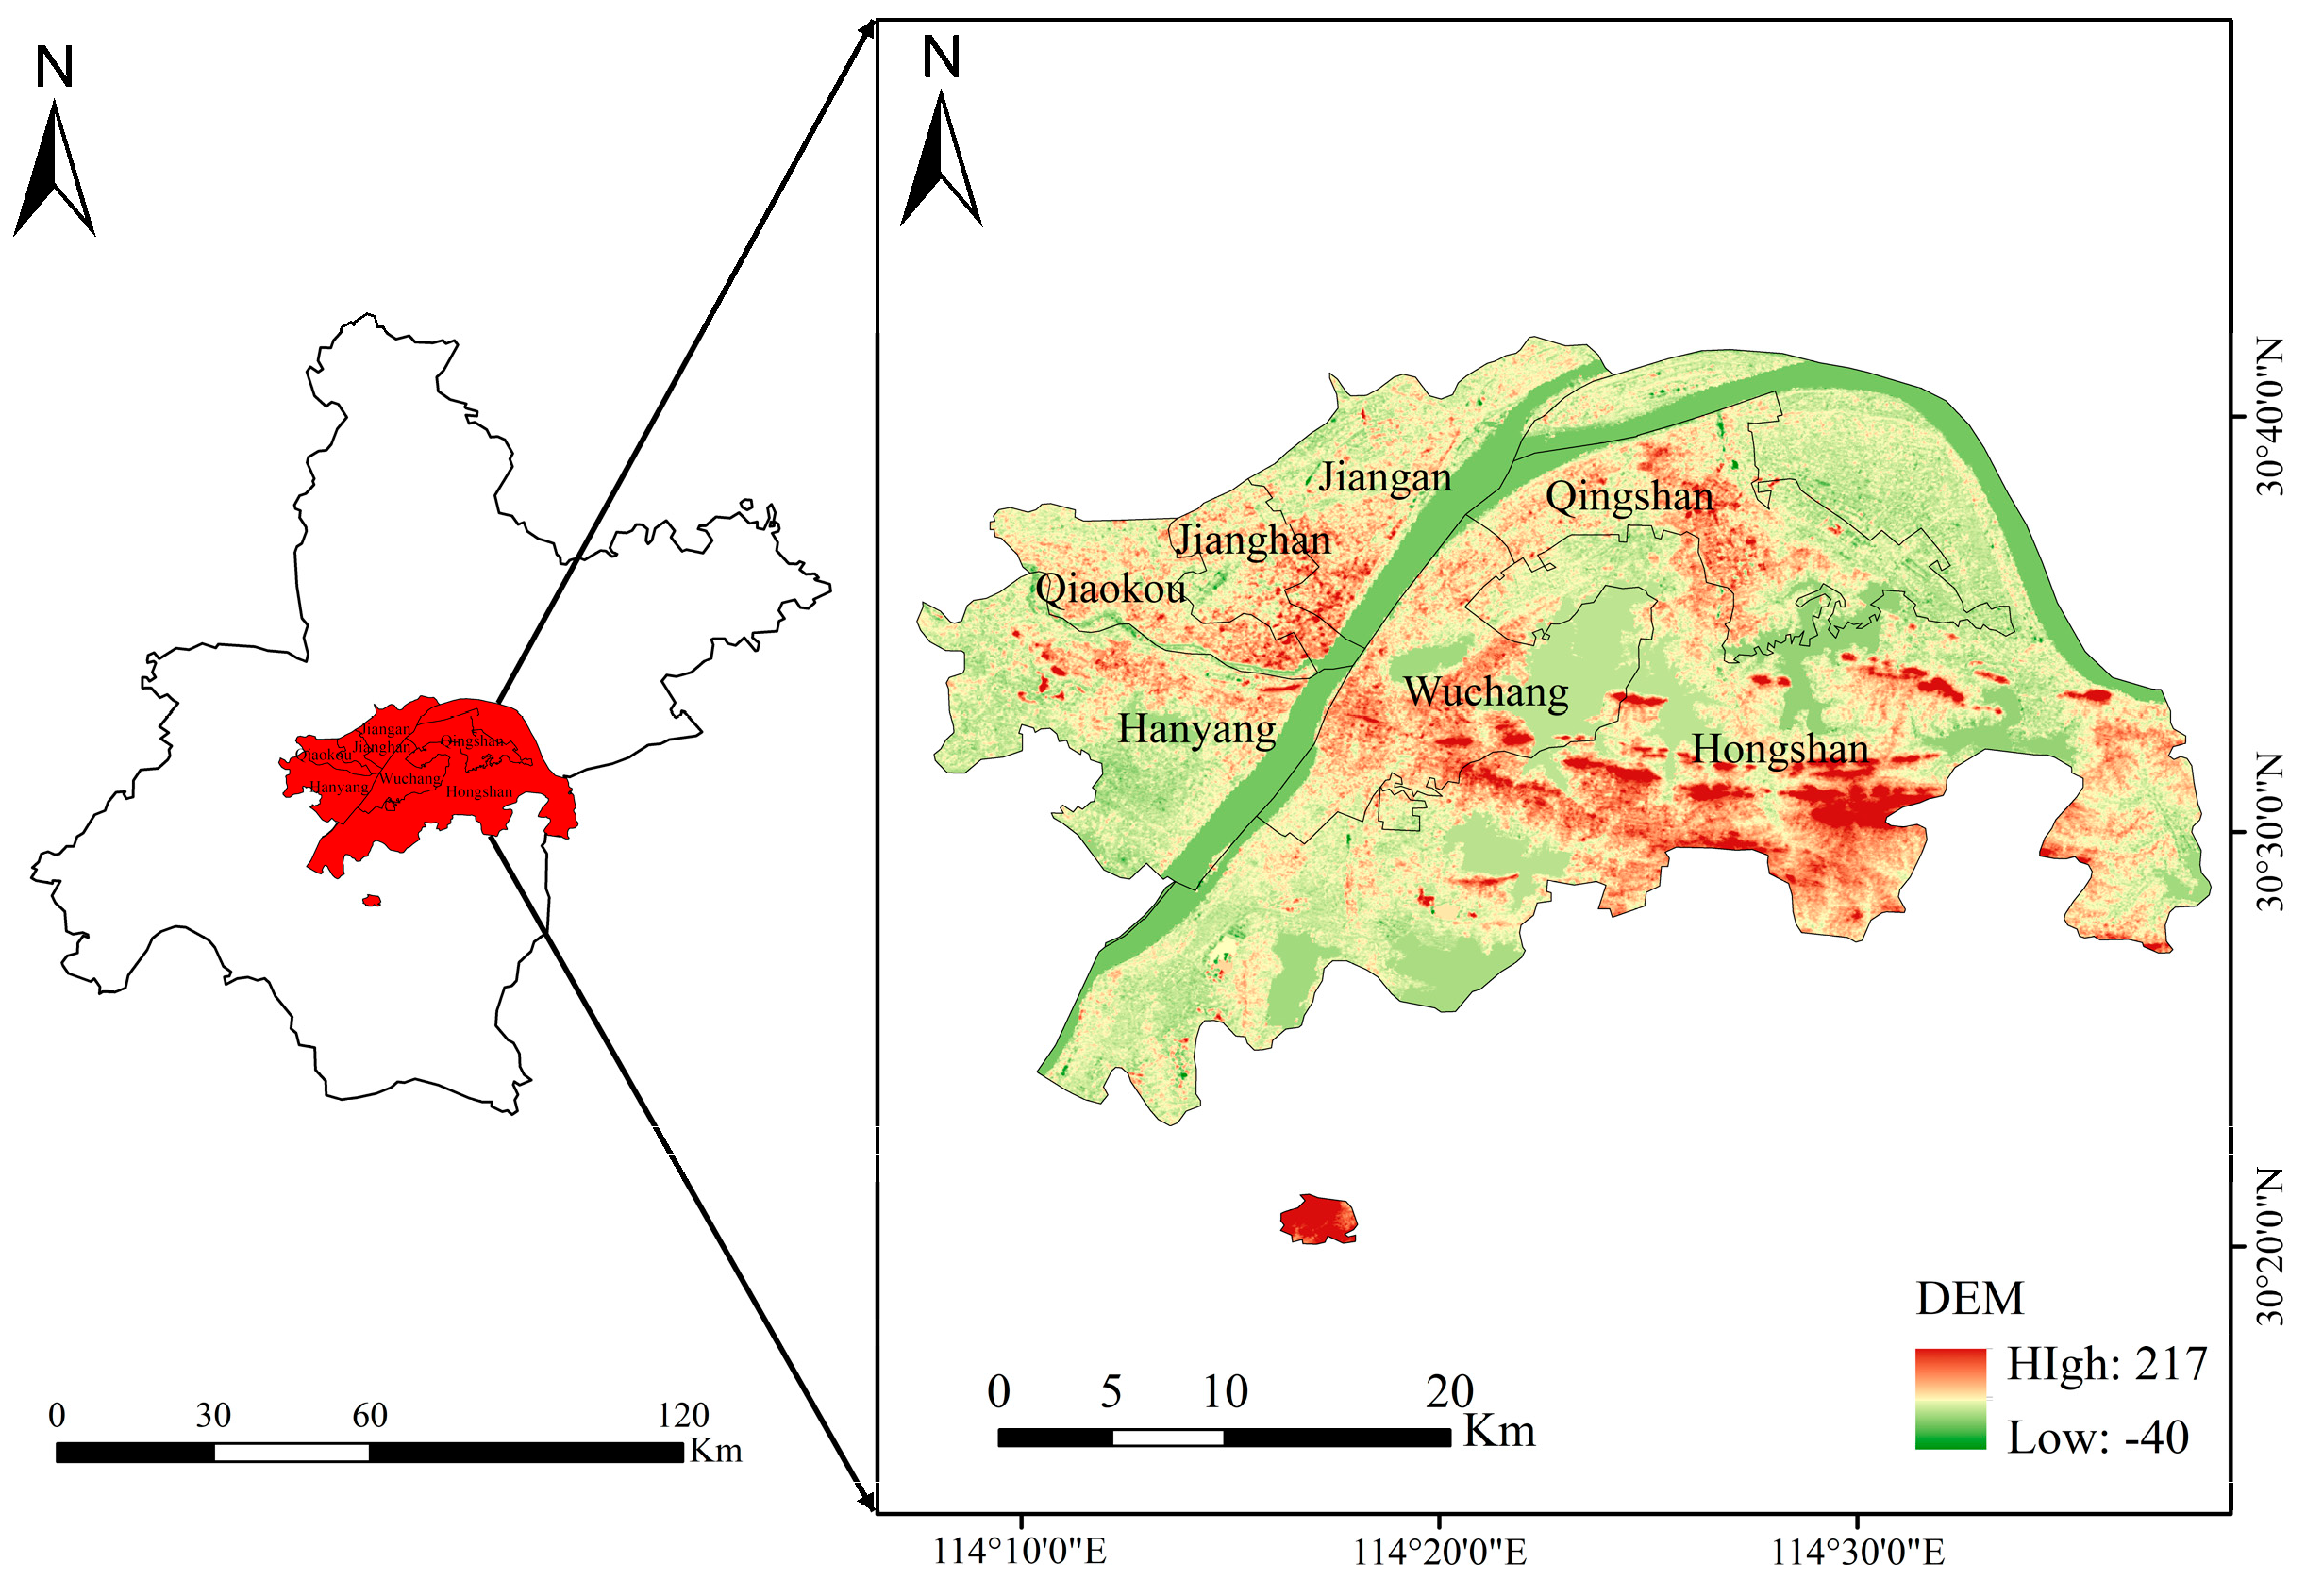
Figure 1. Geographical location of the study area.
Sustainability 17 07149 g001
Figure 2. Risk assessment factor diagram: (a) mean annual precipitation, (b) distance from river, (c) elevation, (d) slope, (e) vegetation cover, (f) population density, (g) gross domestic product, (h) per capita disposable income, (i) distribution density of medical institutions, (j) public budget revenue.
Sustainability 17 07149 g002aSustainability 17 07149 g002b
Figure 3. Flood risk assessment framework.
Sustainability 17 07149 g003
Figure 4. Flood disaster risk assessment results of each index layer: (a) hazardousness assessment results, (b) exposedness assessment results, (c) vulnerability assessment results, (d) results of disaster prevention and mitigation capacity assessment.
Sustainability 17 07149 g004aSustainability 17 07149 g004b
Figure 5. Overlay map of overall flood risk level and historical flood spots.
Sustainability 17 07149 g005
Figure 6. Spatial correlation analysis of each index layer: (a) Spatial correlation analysis of hazard, (b) Spatial correlation analysis of exposure, (c) Spatial correlation analysis of vulnerability, (d) Spatial correlation analysis regarding the capacity for disaster prevention and mitigation.
Sustainability 17 07149 g006
Figure 7. Clustering and hotspot analysis of each index layer: (a) hazard pattern identification through clustering and outlier detection, (b) exposure clustering and outlier analysis, (c) vulnerability clustering and outlier analysis, (d) disaster prevention and mitigation capabilities clustering and outlier analysis.
Sustainability 17 07149 g007aSustainability 17 07149 g007b
Figure 8. Hot spot analysis of each index layer: (a) hazardousness hot spot analysis, (b) exposedness hot spot analysis, (c) vulnerability hot spot analysis, (d) disaster prevention and mitigation capabilities hot spot analysis.
Sustainability 17 07149 g008aSustainability 17 07149 g008b
Table 1. Data used and evaluation indicators.
IndexesSub-IndexesIndex TypesData Source
HazardMean annual precipitation (2016)Positivehttps://loess.geodata.cn/ (accessed on 21 February 2025)
Distance from riverNegativehttps://loess.geodata.cn/ (accessed on 21 February 2025)
ExposureElevationNegativehttps://www.webmap.cn/commres.do?method=dataDownload (accessed on 27 August 2024)
SlopeNegativehttps://www.webmap.cn/commres.do?method=dataDownload (accessed on 27 August 2024)
Vegetation coverNegativehttps://www.resdc.cn/Datalist1.aspx?FieldTyepID=11,6 (accessed on 3 August 2024)
VulnerabilityPopulation density (2016)Positivehttps://tjj.wuhan.gov.cn/tjfw/tjnj/ (accessed on 16 December 2024)
Gross domestic product (2016)Positivehttps://tjj.wuhan.gov.cn/tjfw/tjnj/ (accessed on 3 August 2024)
disaster prevention and mitigation capabilityPer capita disposable income (2016)Negativehttps://tjj.wuhan.gov.cn/tjfw/tjnj/ (accessed on 3 August 2024)
Distribution density of medical institutions (2016)Negativehttps://wjw.hubei.gov.cn/ (accessed on 20 August 2024)
Public budget revenue (2016)Negativehttps://tjj.wuhan.gov.cn/tjfw/tjnj/ (accessed on 3 August 2024)
Table 2. Weight results of each index.
Primary IndexSecondary IndexWeight Results of Analytic Hierarchy ProcessThe Weight Result of Entropy Weight MethodCombined Weight
HazardMean annual precipitation (2016)0.32790.04970.1945
Distance from river0.10870.00270.0035
ExposureElevation0.10360.00400.0049
Slope0.06980.00700.0058
Vegetation cover0.05780.05770.0398
VulnerabilityPopulation density (2016)0.14280.19900.3391
Gross domestic product (2016)0.06070.05670.0411
prevention and mitigation capabilityPer capita disposable income (2016)0.05330.44850.2852
Distribution density of medical institutions (2016)0.02730.00610.0020
Public budget revenue (2016)0.04180.16860.0841
Disclaimer/Publisher’s Note: The statements, opinions and data contained in all publications are solely those of the individual author(s) and contributor(s) and not of MDPI and/or the editor(s). MDPI and/or the editor(s) disclaim responsibility for any injury to people or property resulting from any ideas, methods, instructions or products referred to in the content.