Article

Lane-Changing Risk Prediction on Urban Expressways: A Mixed Bayesian Approach for Sustainable Traffic Management

1
Department of Public Security, Shaanxi Police College, Xi’an 710021, China
2
College of Energy and Transportation Engineering, Inner Mongolia Agricultural University, Hohhot 010018, China
3
School of Transportation, Southeast University, Nanjing 214135, China
*
Author to whom correspondence should be addressed.
These authors contributed equally to this work.
Sustainability 2025, 17(15), 7061; https://doi.org/10.3390/su17157061 (registering DOI)
Submission received: 16 June 2025 / Revised: 26 July 2025 / Accepted: 31 July 2025 / Published: 4 August 2025

Abstract

This study addresses critical safety challenges in sustainable urban mobility by developing a probabilistic framework for lane-change risk prediction on congested expressways. Utilizing unmanned aerial vehicle (UAV)-captured trajectory data from 784 validated lane-change events, we construct a Bayesian network model integrated with an I-CH scoring-enhanced MMHC algorithm. This approach quantifies risk probabilities while accounting for driver decision dynamics and input data uncertainties—key gaps in conventional methods like time-to-collision metrics. Validation via the Asia network paradigm demonstrates 80.5% reliability in forecasting high-risk maneuvers. Crucially, we identify two sustainability-oriented operational thresholds: (1) optimal lane-change success occurs when trailing-vehicle speeds in target lanes are maintained at 1.0–3.0 m/s (following-gap < 4.0 m) or 3.0–6.0 m/s (gap ≥ 4.0 m), and (2) insertion-angle change rates exceeding 3.0°/unit-time significantly elevate transition probability. These evidence-based parameters enable traffic management systems to proactively mitigate collision risks by 13.26% while optimizing flow continuity. By converting behavioral insights into adaptive control strategies, this research advances resilient transportation infrastructure and low-carbon mobility through congestion reduction.

1. Introduction

Vehicle lane-changing risk analysis constitutes a critical research frontier in sustainable urban transportation, with particular urgency for high-density expressways where traffic saturation intensifies collision vulnerabilities. Empirical studies confirm that lane transitions contribute to 22–34% of urban expressway collisions globally, primarily due to kinematic conflicts between merging and target-lane vehicles. These maneuvers induce cascading safety hazards: abrupt speed differentials (>15 km/h) during insertion phases trigger emergency braking in 68% of cases, while lateral displacement miscalculations generate 3.2× higher collision probabilities than longitudinal errors. This complex interaction paradigm—spanning spatial, temporal, and behavioral dimensions—demands predictive modeling to enhance road safety and traffic flow continuity.
Theoretical foundations for risk quantification originate from conflict analysis. Liu [1] established causal linkages between lane changes and conflict emergence, conceptualizing such events as pre-collision states where time-to-accident falls below critical thresholds. Hyden’s [2] seminal operational definition advanced measurable risk parameters: “Under observable conditions, two or more road users approach each other in time and space to such an extent that if they continue their current state of motion, a collision will occur.” This spatiotemporal framework underpins contemporary risk metrics, emphasizing convergence vectors and critical proximity windows during vehicular interactions.
In the realm of vehicle lane-changing risk analysis, various methodologies have been employed. Kwok-Sueng [3] utilized a combination of regression and clustering methods, integrated with Geographic Information System (GIS) technology, for traffic accident risk analysis. Chang [4] constructed a regression tree model to dissect the relationship between driver and vehicle characteristics, environmental factors, and the severity of traffic accidents. Cheng [5] developed a risk assessment model for different traffic states on highways, categorizing risk levels to inform safety measures. Huang [6] created a decision tree model for accident damage and risk events by analyzing the impact of road geometry, driving behavior, vehicle characteristics, and environmental factors on collision severity.
Despite these advances, lateral risk mechanisms remain inadequately addressed. Roman [7] emphasized that the lateral movement of vehicles during lane changes and overtaking is pivotal in causing traffic accidents. This insight underscores the need for a detailed examination of the lateral dynamics involved in lane-changing maneuvers. When conducting vehicle lane-changing risk analysis, the complex and variable forms of risk necessitate both qualitative and quantitative risk analysis methods. Traditional methods, such as time-to-collision (TTC), time-to-brake (TTB), or headway time (THW), provide specific safety indicators for evaluation. However, these indicators, while valuable, face limitations due to the uncertainty of their input data and suboptimal performance in multi-lane scenarios [8,9,10].
To address the pervasive uncertainty in vehicle lane-changing risk input data, Noh [11] pioneered a probabilistic framework leveraging spatiotemporal vehicle trajectories, calculating collision probability through Gaussian mixture models of relative position and velocity vectors. Concurrently, Shin [12] advanced this paradigm by integrating Monte Carlo simulations with vehicle kinematics, quantifying risk exposure under 200+ stochastic scenarios per maneuver. Despite these methodological innovations, both approaches exhibit critical omissions: they model drivers as static decision-makers, neglecting the dynamic learning process wherein drivers iteratively adjust gap acceptance thresholds (typically 2.5–4.5 s) based on real-time traffic feedback [13]. This limitation was partially mitigated by Xu [14], who implemented deep reinforcement learning (DRL) networks to simulate behavioral adaptation, using LSTM modules to capture temporal dependency in 15,000 simulated lane changes. However, such data-hungry architectures demand prohibitive training volumes—over 10,000 high-resolution trajectory samples for convergence—rendering them impractical for real-time deployment in variable urban networks where sensor coverage gaps exceed 30% [15].
The field has subsequently witnessed transformative advancements through multi-modal methodology integration. Chen et al. [16,17,18] demonstrated that fusing LiDAR point clouds with vision-sensor data reduces trajectory estimation errors to <0.3 m, enabling millimeter-wave radar-assisted risk profiling. Comprehensive investigations now systematically deconstruct lane-changing risk frameworks along three dimensions: (1) risk exposure differentials revealing trucks exhibit 2.7× higher vulnerability during left changes versus passenger vehicles [19]; (2) severity gradation quantifying 68% higher impact forces in right-side maneuvers due to blind spot limitations [20]; and (3) temporal risk evolution captured through dynamic time warping (DTW) algorithms applied to 0.1 s-resolution trajectory streams.
Time-series clustering breakthroughs further revolutionized risk analytics. References [21,22,23,24] developed Haar-wavelet-transformed risk profiles clustered via DBSCAN-Euclidean, identifying four distinct risk archetypes: hesitant initiation (14% occurrence), aggressive cut-in (32%), conservative merge (41%), and erratic correction (13%). Most significantly, driving style personalization has emerged as a paradigm-shifting approach. Zhang’s framework [25,26] operationalizes volatility indices—including jerk variance (>0.8 m/s3) and steering entropy—to dynamically cluster drivers into aggression quintiles using online Gaussian mixture models (GMMs). This enables LightGBM algorithms with Shapley additive explanations (SHAP values > 0.7) to generate style-specific risk predictions, revealing that aggressive drivers (top 15% volatility) ignore rear vehicles in 73% of lane changes, elevating their collision probability by 2.4× compared to defensive drivers [27,28,29,30]. These studies collectively contribute to a more nuanced understanding of lane-changing risks, offering valuable insights for the development of advanced driver-assistance systems (ADASs) that can provide personalized warnings and enhance traffic safety. The integration of machine learning algorithms, time-series clustering, and driving style analysis into lane-changing risk prediction models represents a significant advancement in the field, promising more accurate and responsive risk assessment tools for drivers and autonomous vehicles alike [31,32].
Therefore, when selecting vehicle lane-changing risk analysis methods, it is imperative to consider both the uncertainty of influencing factors and the self-learning adaptability of the analysis method. This study aims to bridge these gaps by introducing a Bayesian network model that not only accounts for the complexity of lane-changing risks but also incorporates the adaptive learning of drivers.
The present study makes the following contributions to the field of vehicle lane-changing risk analysis:
  • Development of a Bayesian Network Model: This study introduces a Bayesian network model that predicts vehicle lane-changing trends with a high degree of accuracy (86.74%). The model’s strength lies in its ability to handle the uncertainty of input data and its adaptability to varying traffic conditions.
  • Integration of Driver Learning Process: Unlike previous probability-based methods, this study’s model takes into account the learning process of drivers during lane-changing maneuvers, providing a more comprehensive understanding of the decision-making process involved in lane changes.
  • Enhanced Risk Assessment under High-Density Traffic: This research provides a robust tool for assessing lane-changing risks under high-density traffic conditions, which is crucial for urban expressways where traffic congestion is prevalent. The model’s predictive capabilities can significantly contribute to traffic safety and management strategies.

2. Materials and Methods

To obtain the probability P of vehicle lane-changing risk occurrence, it is necessary to solve for the probability of each variable, where Bayesian methods are widely used in predicting probabilities of different factors. The Bayesian network (BN) model starts from the conditions of vehicle lane changes to explore the probability of lane changes under different influencing conditions. This algorithm is adopted for its fast learning training speed, high accuracy, strong generalization ability, and the advantage of being able to shuffle the training order of samples during training.

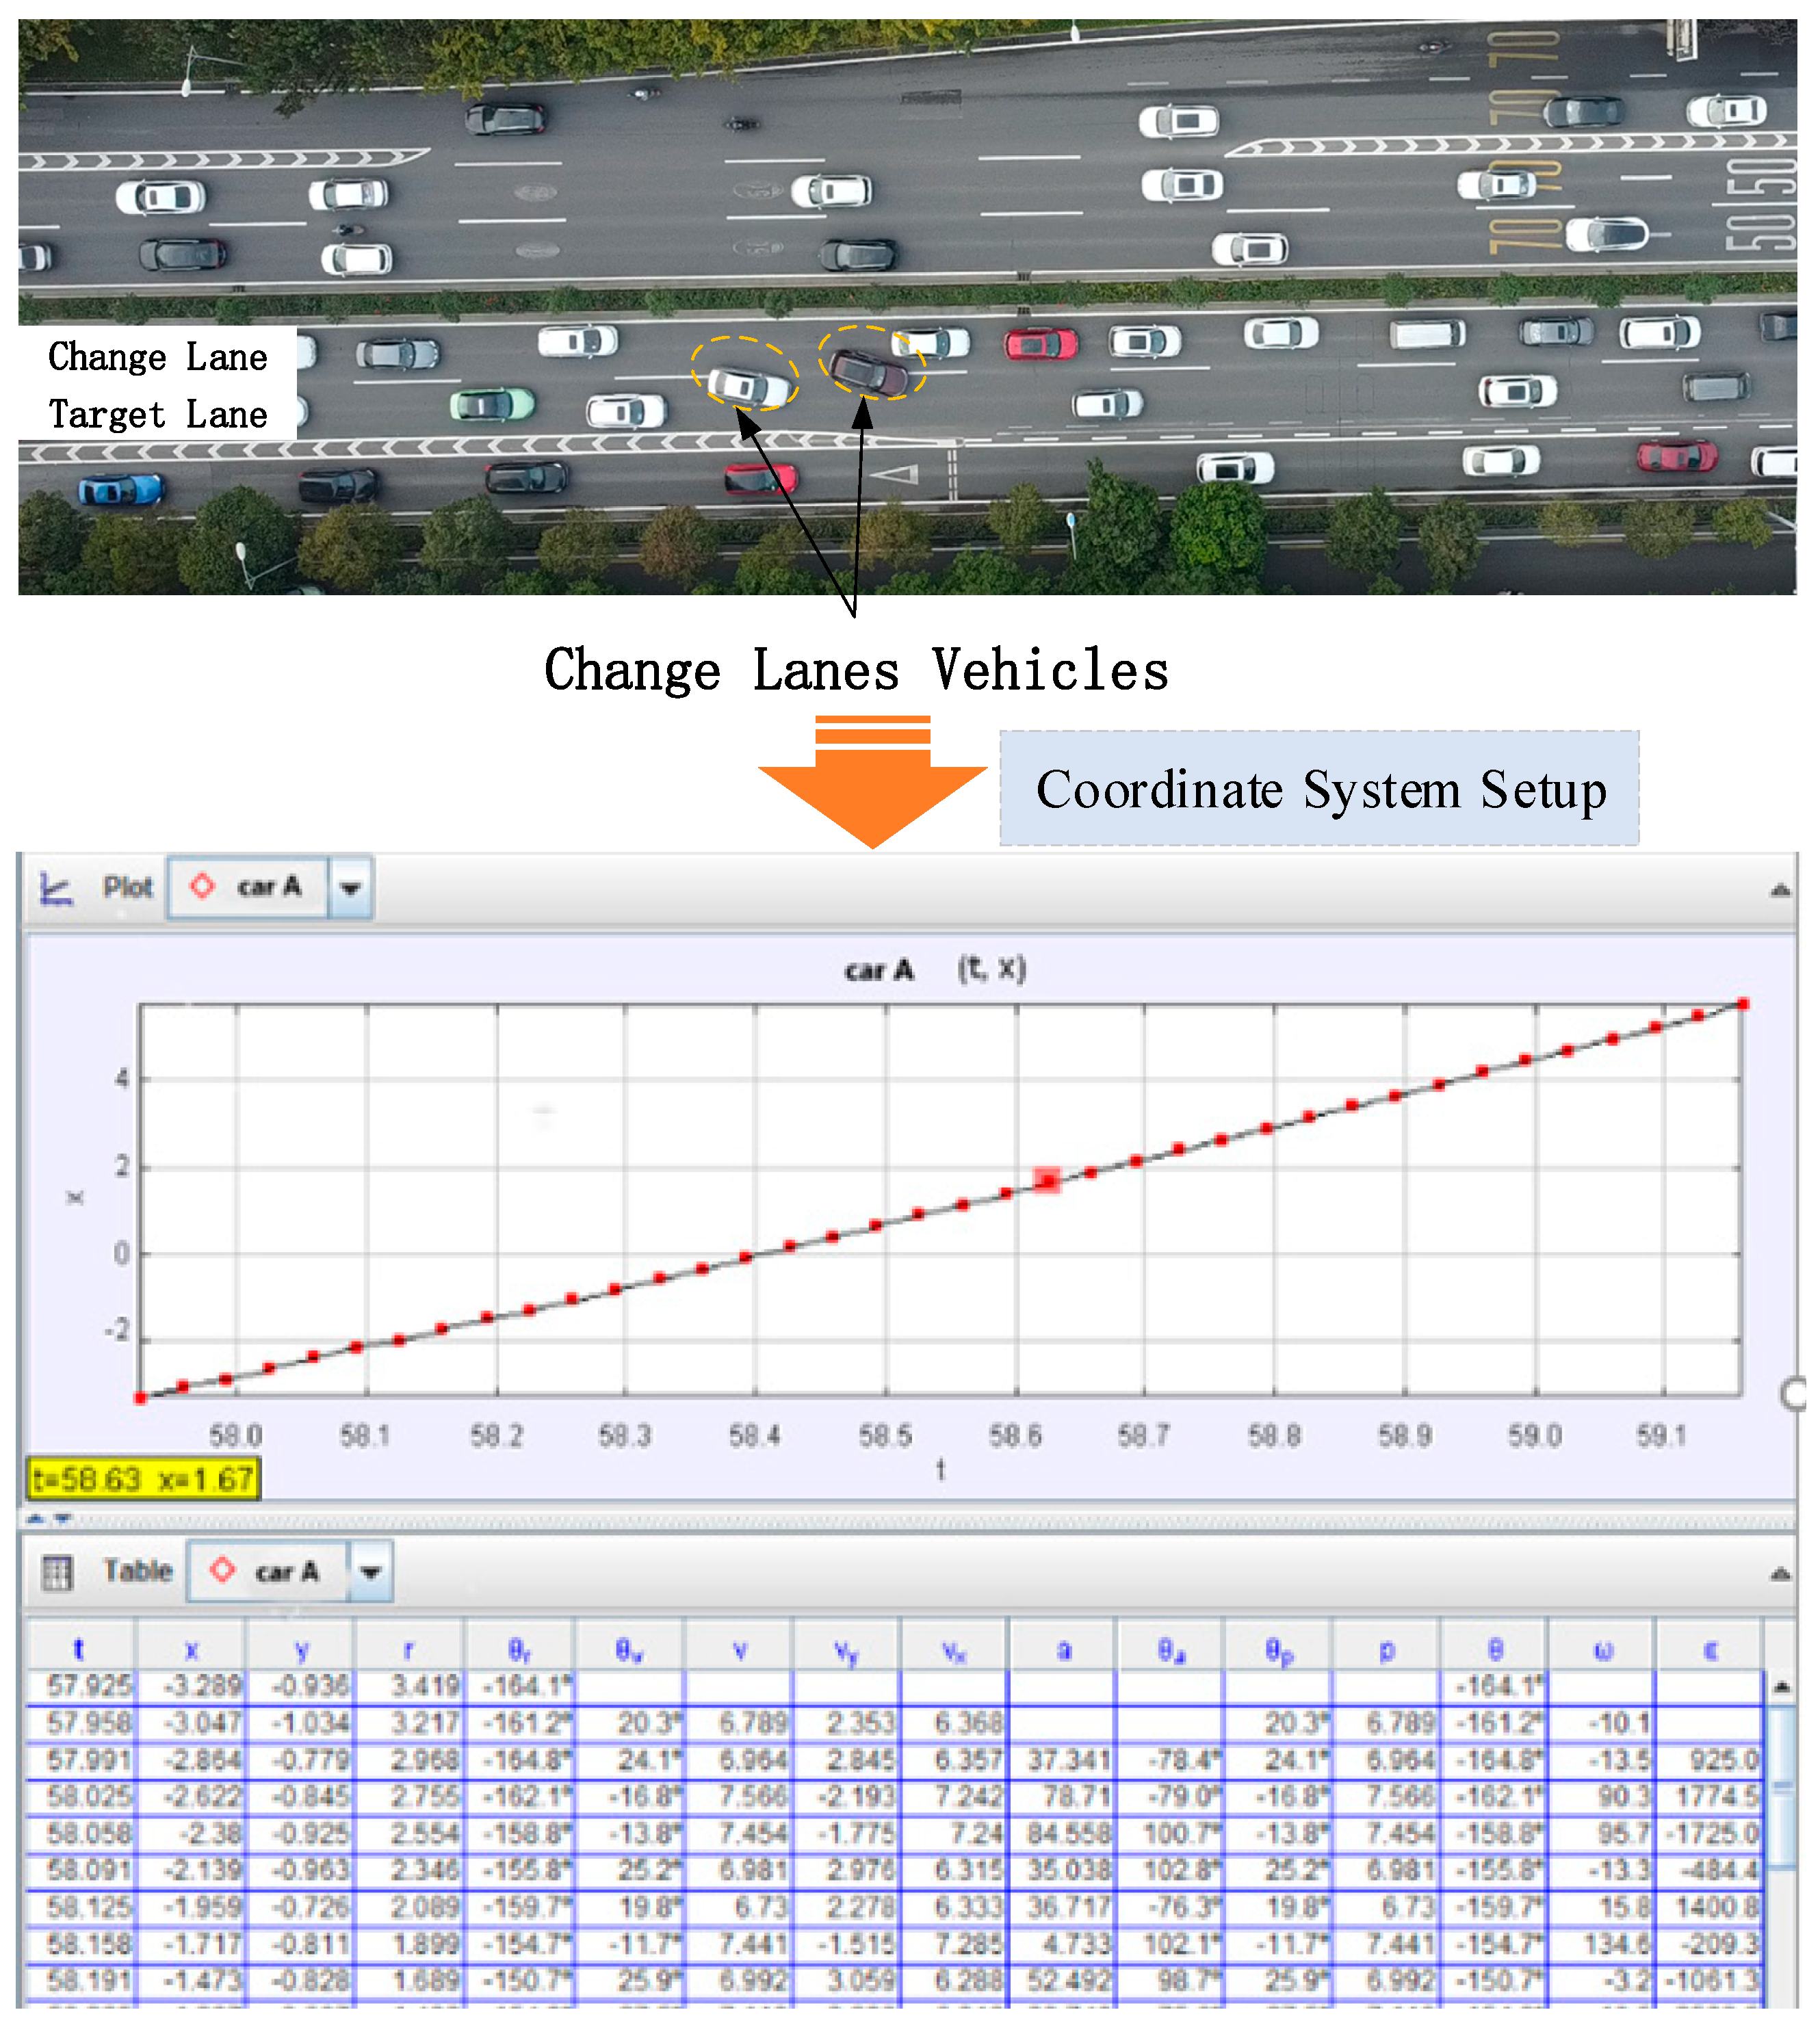
2.1. Data Discretization

This study randomly selected different road sections and lane-changing vehicles on the Xi’an South Second Ring Expressway to conduct field observations, aiming to collect real-time driving parameters of lane-changing vehicles and their adjacent traffic, including velocity and positional coordinates, where an unmanned aerial vehicle (UAV) was deployed at approximately 120 m altitude to capture orthogonal aerial imagery of traffic operations. The video recordings were processed using Tracker motion analysis software (Version 6.1.6, available at: https://www.vicon.com/software/tracker/ (accessed on 15 June 2025)) to extract 784 valid lane-changing events, track vehicle trajectories, and record dynamic responses of following vehicles in target lanes. As shown in Figure 1, the analysis visualized lane-changing maneuvers with red trajectories and generated corresponding kinematic datasets including velocity profiles and coordinate variations, with the software showing adequate performance in handling such traffic scenarios.
When selecting variables, most researchers analyze aspects such as the driver of the target vehicle [31], vehicle spacing [32], lane-changing speed, and acceleration [33,34]. During the lane-changing process of a vehicle, the driver’s driving characteristics are reflected through indicators such as the vehicle’s lane-changing speed and lane-changing insertion angle, and it is necessary to extract easily obtainable apparent data. Parameter learning involves learning the probability distribution of each node from training data and discretizing the parameters.
When dividing variables such as vehicle speed and vehicle spacing, too many division groups will make the model operation difficult, while too few division groups will lead to inaccurate operation results. According to the 2019 Xi’an Urban Traffic Development Annual Report, the vehicle speed within Xi’an’s Ming City Wall during the 2019 morning peak was 23.22 km/h, and 21.18 km/h during the evening peak; in the area from the Ming City Wall to the Second Ring Road, the vehicle speed during the 2019 morning peak was 25.45 km/h, and 21.34 km/h during the evening peak; in the area from the Second Ring Road to the Ring Expressway, the vehicle speed during the 2019 morning peak was 27.45 km/h, and 25.35 km/h during the evening peak. The operating speed of vehicles can be discretized according to the average speed during peak hours. Meanwhile, with reference to Li [35] division criteria, the above variables are divided.
The target vehicle’s insertion angle is divided into 10 categories: [0,3), [3,6), [6,9), [9,12), [12,15), [15,18), [18,21), [21,24), [24,27), and [27,90), with each group of data corresponding to (0,1,2,3,4,5,6,7,8,9).
Vehicle speed v (m/s) is discretized into 9 groups of data: [0,1), [1,2), [2,3), [3,4), [4,5), [5,6), [6,7), [7,8), and [8,+∞); each group of data corresponds to (0,1,2,3,4,5,6,7,8).
Vehicle speed change ∆v is discretized into 12 groups of data: [−∞,−5), [−5,−4), [−4,−3), [−3,−2), [−2,−1), [−1,0), [0,1), [1,2), [2,3), [3,4), [4,5), and [5,+∞); each group of data corresponds to (0,1,2,3,4,5,6,7,8,9,10,11).
Vehicle Space Headway (distance between the front of the vehicle and the front of another vehicle) lab is discretized into 9 groups of data: [3,6), [6,9), [9,12), [12,15), [15,18), [18,21), [21,24), [24,27), and [27,+∞); each group of data corresponds to (0,1,2,3,4,5,6,7,8).
Vehicle spacing change ∆l is discretized into 12 groups of data: [−∞,−5), [−5,−4), [−4,−3), [−3,−2), [−2,−1), [−1,0), [0,1), [1,2), [2,3), [3,4), [4,5), and [5,+∞); each group of data corresponds to (0,1,2,3,4,5,6,7,8,9,10,11).

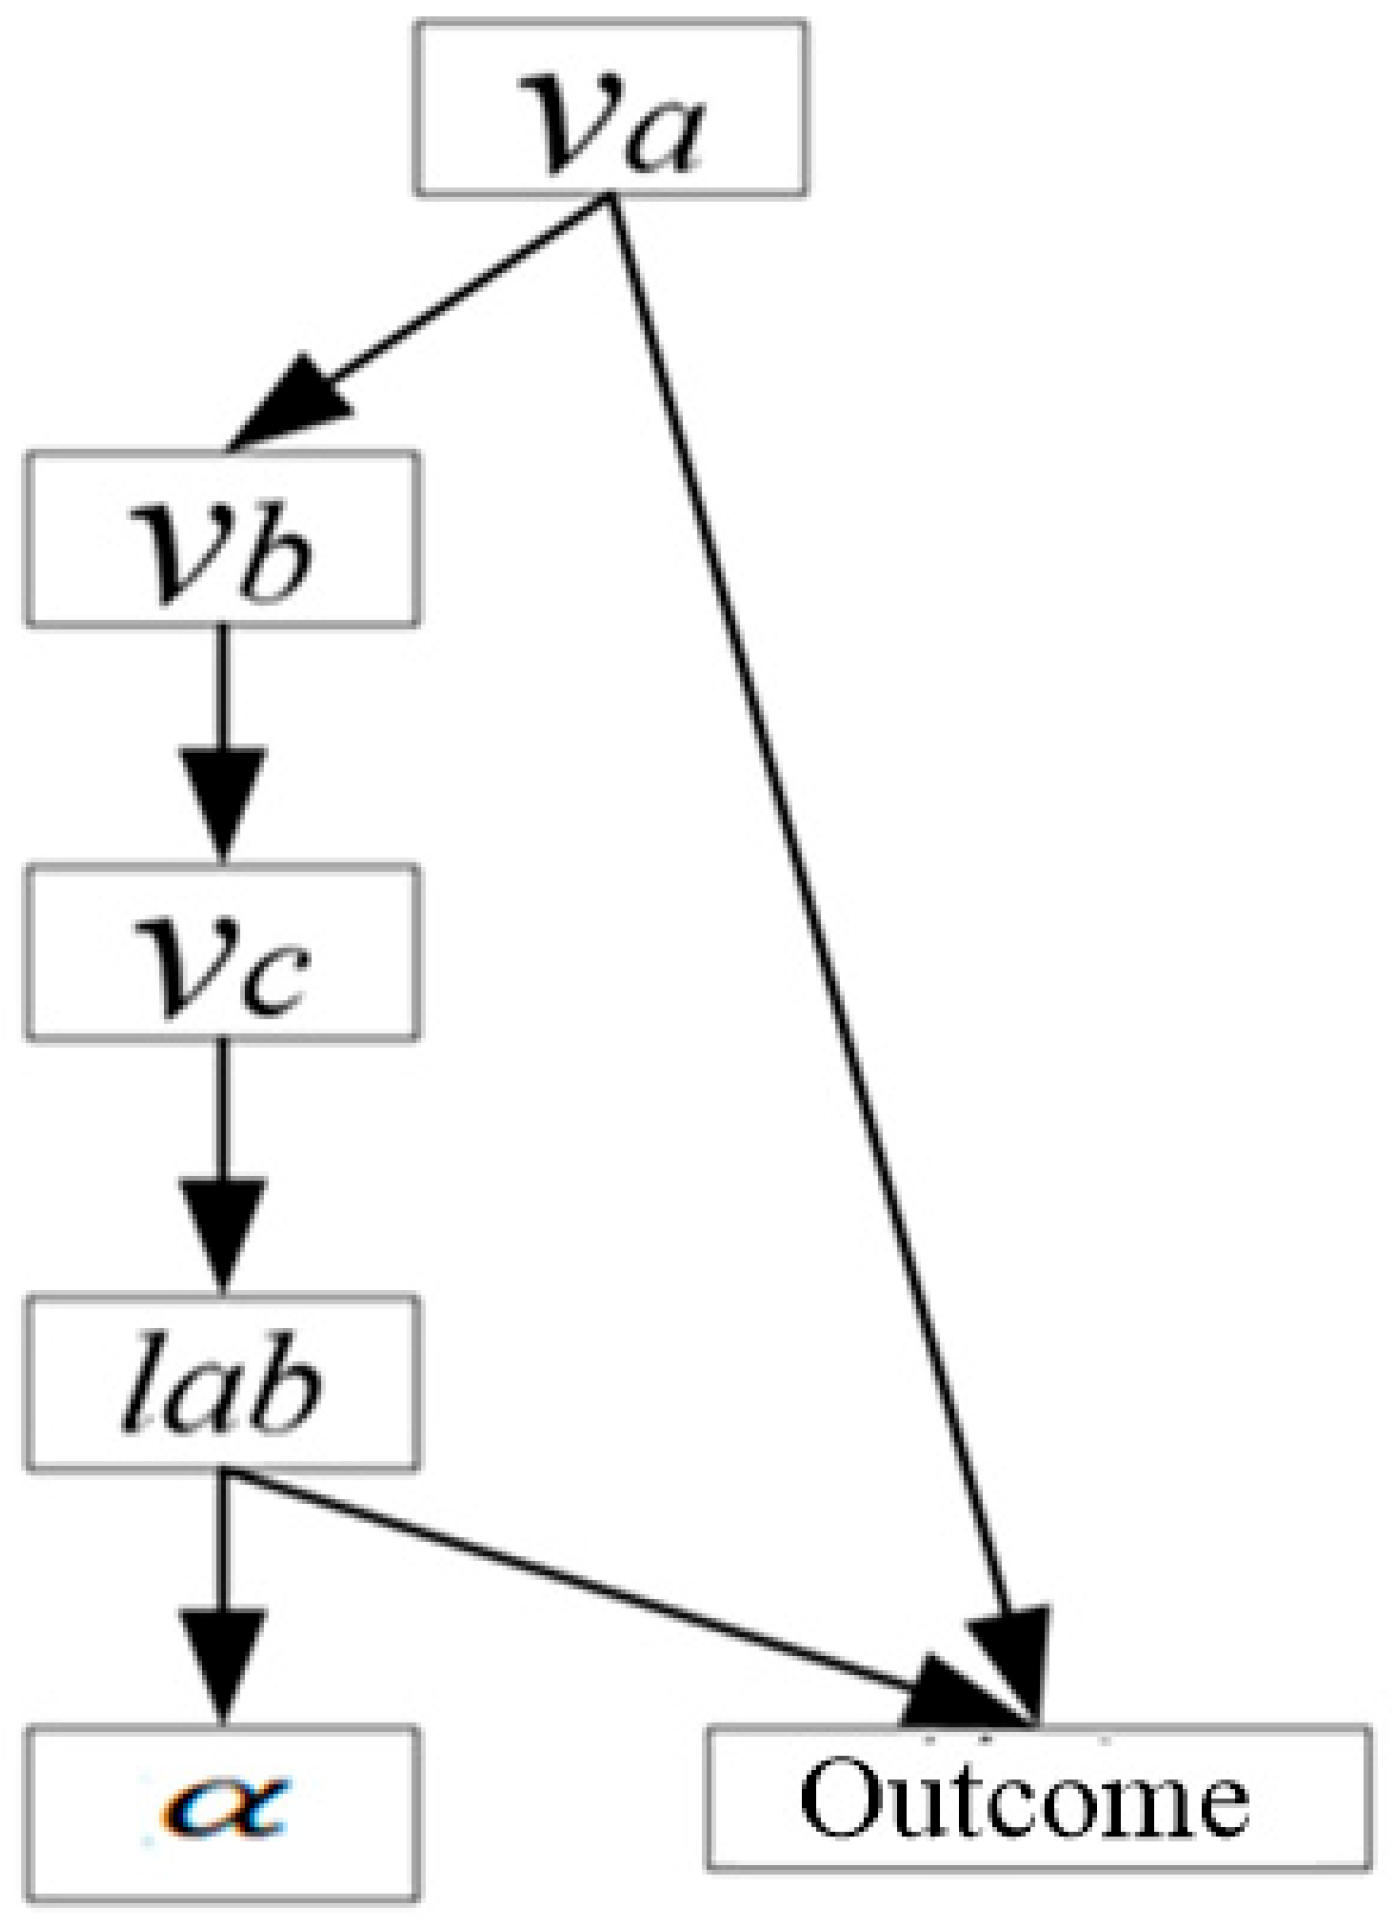
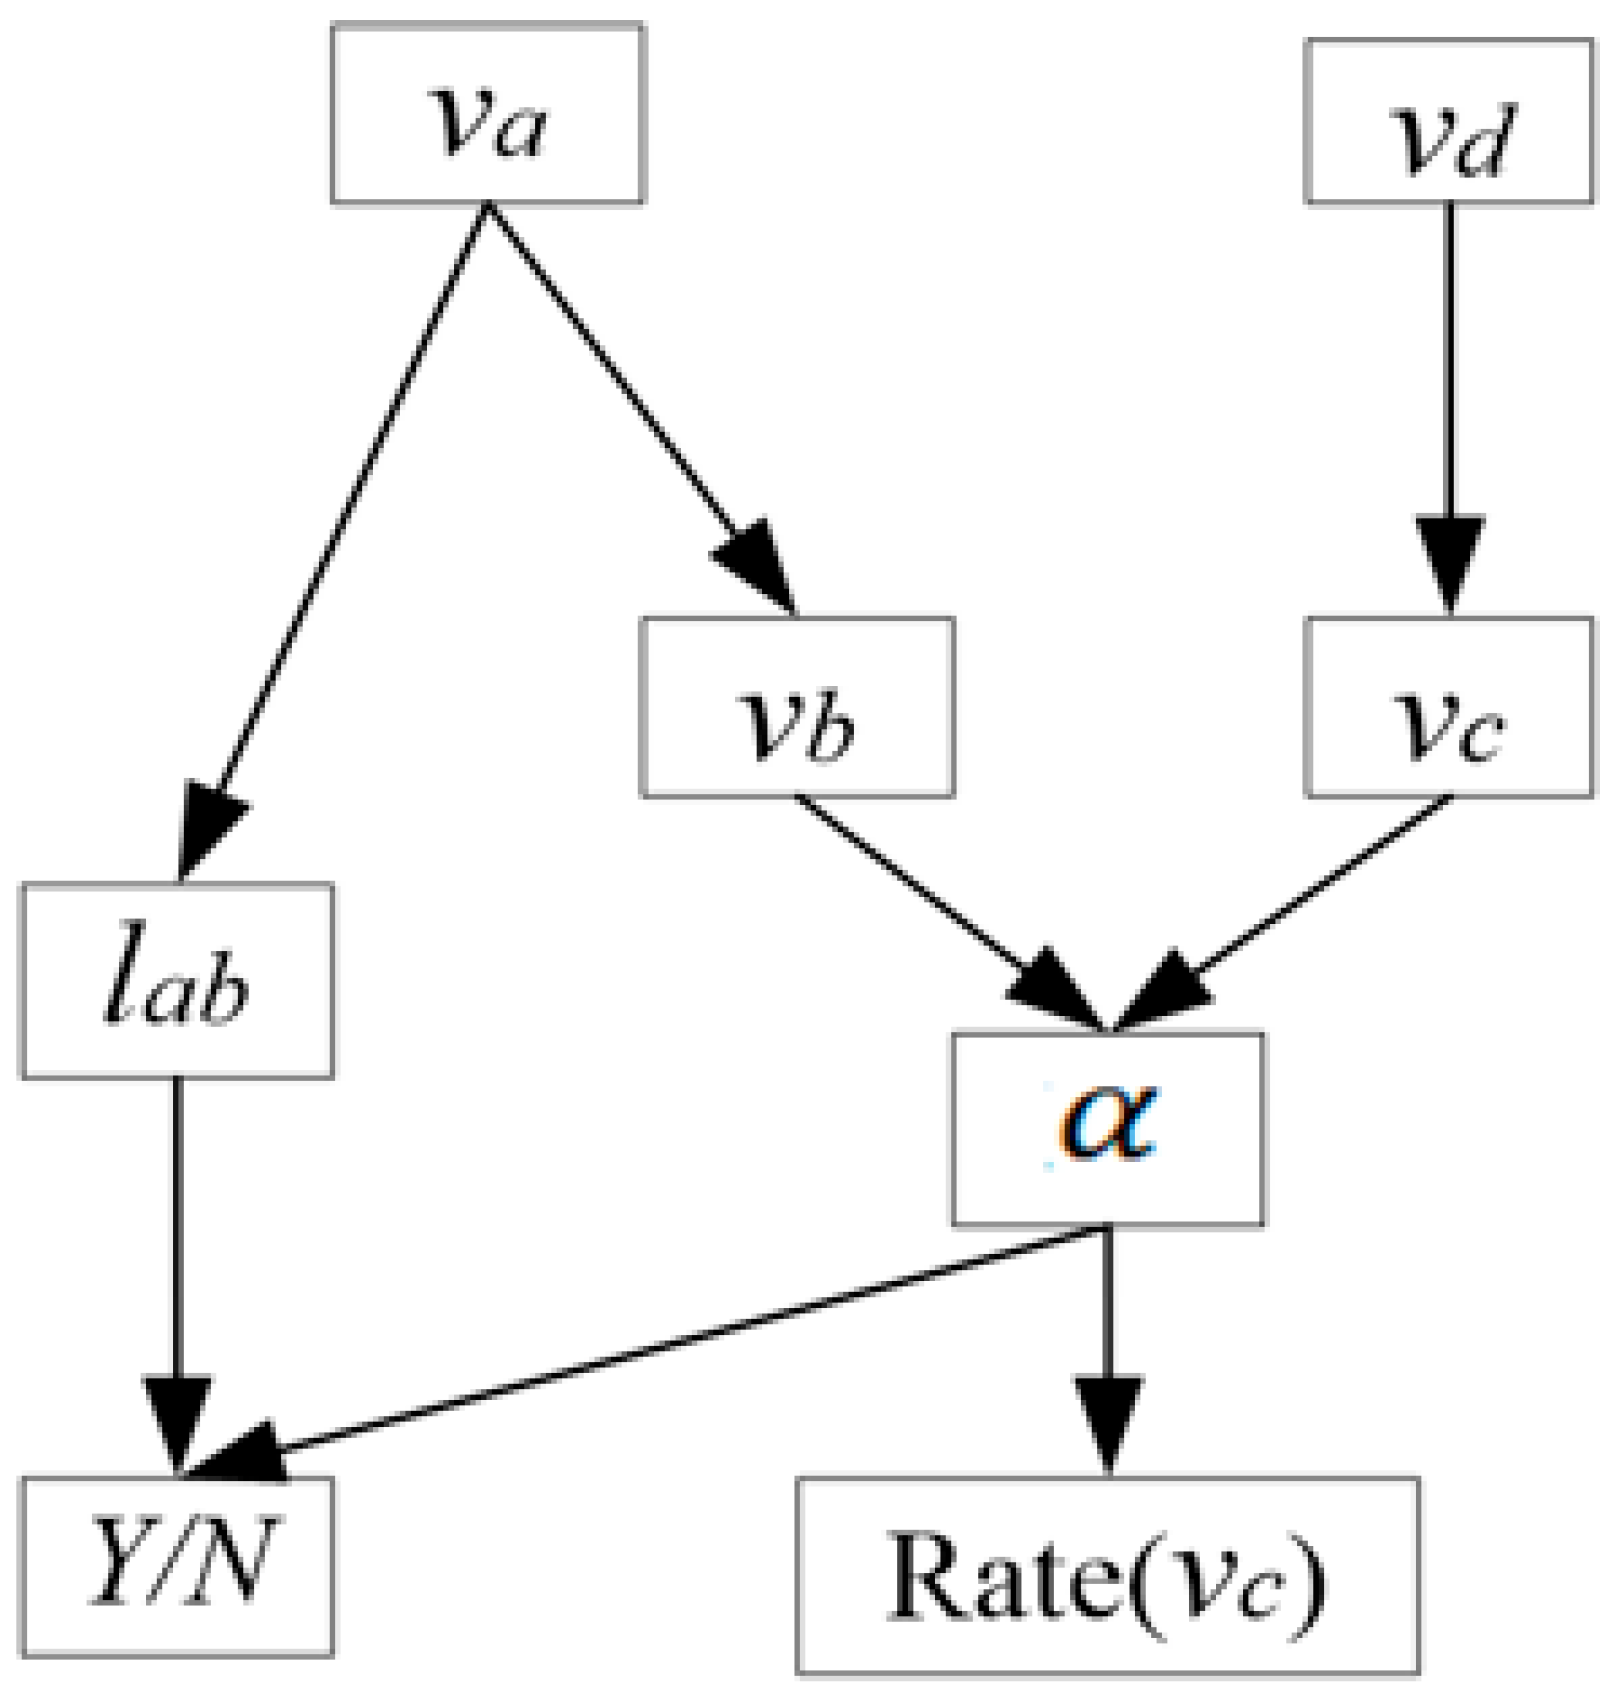
2.2. Bayesian Network Lane-Changing Model Construction

The MMHC algorithm combined with expert experience was used to determine the Bayesian network structure of the lane-changing model; the pgmpy probability model in the Python software (Version 3.1.1) was used for parameter learning to determine the conditional probability distribution corresponding to each variable node in the structure. The success or failure of vehicle lane changes is represented by “0” and “1”, with “1” indicating successful lane change, denoted as “Y”, and “0” indicating failure, denoted as “N”. The entire training dataset is D, and after discretization verification, there are 784 valid data in the training dataset. Table 1 shows part of the dataset D. Based on the learning results, a preliminary Bayesian network structure can be obtained, as shown in Figure 2.
After constructing the Bayesian network model, the next step is to perform reasoning on vehicle lane changes. Construct a feature vector T for variables such as the target vehicle speed vc, the target vehicle insertion angle α, and the distance between the front and rear vehicles in the target lane lab, and determine the posterior probability of a vehicle lane change occurring under the feature vector T and the posterior probability of the vehicle operating normally without a lane change.
Y ,           P C = 0 T > P C = 1 T N ,           P C = 0 T < P C = 1 T
The most important aspect in Bayesian network structure scoring search learning algorithms is determining the impact of the scoring criteria on the quality of the algorithm. Different scoring criteria have varying impacts on the algorithm. Based on the influence of BDU scoring, MIT scoring, MDL scoring, and K2 scoring on the MMHC algorithm in the Bayesian network scoring criteria, the introduction of the CH (Calinski–Harabasz) scoring algorithm and the improved CH scoring-based I-CH (Improved Calinski–Harabasz) algorithm are considered comprehensively for their impact on the MMHC algorithm.
For structure learning algorithms, essentially, it is about finding the network structure Bs that maximizes the posterior probability given a dataset D, which is equivalent to finding the network structure when P(Bs|D) is maximized.
P ( B s | D ) = P ( D | B s ) P ( B s ) P ( D )
From Formula (2), it can be seen that the network structure Bs is independent of P(D), and thus it can be transformed into seeking the network structure when P(D|Bs)P(Bs) is maximized. Define the following function to represent the Bayesian scoring, that is, the MAP measure:
log P ( B s , D ) = l o g P D B s + l o g P B s
( D | B s ) = P ( D | B s , θ ) P ( θ | B s ) d θ
From Formula (3), after expanding the marginal likelihood function P(DBs), we obtain Formula (4). When Bs is given, assuming that the network parameters θ follow a Dirichlet distribution, we have Formulas (5) and (6), where the logP(Bs, D) in Formula (6) is the CH score given by Cooper and Herskovits.
P D B s = i 1 n j 1 q i Γ ( α i j ) Γ ( α i j + N i j ) k 1 r k Γ ( α i j k + N i j k ) Γ ( α i j k )
log P D B s = i 1 n j 1 q i ( l o g ( Γ α i j Γ α i j + N i j + k 1 r k l o g ( Γ α i j k + N i j k Γ α i j k )
where α i j = k α i j k , N i j = k 1 r i N i j k . In the aforementioned algorithms, it is assumed that the probability of all possible network structures occurring is equal. The calculation of the scoring criterion only considers the impact of the log-likelihood function logP(DBs), neglecting the impact of logP(Bs), which cannot fully describe the prior information of the network structure, thus affecting the accuracy of the Bayesian network structure. According to the connection probability distribution model, the connection probability information is incorporated into the CH scoring function in the form of local structure priors, denoted as the I-CH score.
S C O R E I C H = i = 1 n [ j q i ( l o g Γ α i j Γ α i j + N i j + k = 1 r i l o g Γ ( α i j k + N i j k ) Γ ( α i j k ) + N · a r c t a n ( λ ρ i N ) ]
In Formula (7), N represents the training samples. When N takes a smaller value, the constructed prior function converges more quickly. The fewer the number of samples, the more significant the impact on the overall network score. As N approaches infinity, the prior function tends to a constant, so the network score is mainly related to the first half. In this training, the number of training samples is 784, and the number of test samples is 490, which falls into the category of small sample sizes. Therefore, the MMHC algorithm based on the I-CH scoring criterion was ultimately selected to construct the vehicle lane-changing model.

3. Test Based on the Asia Network Model

To verify the impact of scoring functions on the optimal results and the MMHC algorithm, the standard Asia network is used as the experimental simulation model. The standard Asia network is a Bayesian network model used for medical diagnosis, consisting of 8 variable nodes and 8 directed edges. When learning from the dataset based on different scoring function algorithms, the differences and similarities between the obtained network structure and the standard Asia network structure are compared, including the number of missing or redundant directed edges, the number of missing or redundant variable nodes, and the number of directed edges with incorrect directions. The closer the network structure obtained by the algorithm is to the standard Asia network structure, the higher the correctness of the algorithm is indicated. Therefore, the Asia model is applied to vehicle lane-changing recognition, with each node replaced by various attribute features in the process of vehicle lane-changing, as shown in Figure 3 for the Asia network structure applied in the vehicle lane-changing model. The nodes include the insertion angle α, target vehicle speed vc, distance between the front and rear vehicles in the target lane lab, speed of the vehicle behind vb, speed of the vehicle in front in the target lane va, whether the vehicle changes lanes Y/N, the speed of the vehicle in front of the target vehicle before lane-changing vd, and the instantaneous rate of change of the target vehicle speed Rate (vc). The direction of the arrow links represents the corresponding causal relationship. By selecting different data and inputting it into the lane-changing model, the running time of the model after simulation and the network learned from the dataset are compared with the initial network, comparing the number of missing edges, and thus comparing the correctness and superiority of the MMHC algorithm and the MMHC algorithm with I-CH scoring.
In the model structure of Figure 3, the speed of the vehicle in front in the target lane va simultaneously affects both the speed of the vehicle behind vb and the distance between the front and rear vehicles lab. At the same time, the speed of the vehicle in front of the target lane vd directly affects the speed of the target vehicle vc. The speed of the vehicle behind vb and the speed of the target vehicle vc together determine the lane-changing insertion angle α of this lane change, and the lane-changing insertion angle α and the distance between the front and rear vehicles lab jointly determine the outcome of this lane change. Additionally, the insertion angle α also affects the instantaneous rate of change in the target vehicle speed, Rate(vc).
When applying the standard Asia model to vehicle lane-changing recognition, NetCore Bayesian network software (Version 5.04) was first used to generate sample data with sizes of 3000, 5000, 7000, and 9000 based on the existing standard Asia network structure. Then, based on the sample data generated by the standard Asia network, Bayesian network structure learning was performed using both the MMHC algorithm and the improved MMHC algorithm. To avoid experimental results being affected by randomness, it was necessary to repeat the experiments multiple times with the same data for comparison. When the sample data is small, the MMHC algorithm based on the improved I-CH scoring criterion is consistent with the original algorithm’s learning results in terms of correct edges, but the algorithm based on the I-CH scoring criterion has one less incorrect edge and missing edge than the original algorithm, which is significantly better than the original algorithm. When the amount of data is large, both algorithms can learn the Asia network structure well, with the MMHC algorithm correctly learning all nodes, but with a larger number of reversed and incorrect edges. The MMHC algorithm based on the I-CH scoring criterion can effectively eliminate incorrect and reversed edges. Although this method omits the influence of node vd, it performs well in overall structure learning.

4. Results

During the lane-changing process of the target vehicle, the change in speed of the vehicle behind in the target lane is related to the distance between the front and rear vehicles in the target lane. At the same time, the speed of the target vehicle is related to the speed of the vehicle in front in the target lane. The MMHC algorithm is used for learning vehicle lane changes.
In Table 2, va (0) to va (8) represent the discretization results of the speed of the vehicle in front va, where va (0) indicates that the speed of the vehicle in front is within the interval of 0 to 1.0 m/s. Similarly, vc (0) to vc (8) represent the discretization results of the target vehicle speed vc. The data in the table shows the probability of the target vehicle speed vc being within a certain speed interval under different speed intervals of the vehicle in front va. It can also be observed that when the speed of the vehicle in front va is between 0 and 6.0 m/s, its influence on the target vehicle speed is greater, and when the speed of the vehicle in front va is greater than 6.0 m/s, its influence on the target vehicle speed gradually decreases.
In Figure 4, lab (0) to lab (8) represent the discretization results of the distance between the front and rear vehicles in the target lane, and vb (0) to vb (8) represent the discretization results of the speed of the vehicle behind. Outcome (0) indicates that the target vehicle’s lane change fails, and Outcome (1) indicates that the target vehicle’s lane change succeeds. The data in the table shows the probabilities of vehicle lane change failure and success under certain intervals of the distance between the front and rear vehicles in the target lane and the speed of the vehicle behind. From Figure 4, it can be observed that when the distance between the front and rear vehicles lab is between lab (0) and lab (2), i.e., the distance between the front and rear vehicles (the distance between the fronts of the vehicles) is less than 9.0 m, the probability of successful lane change decreases as the speed of the vehicle behind increases. This is because the higher the speed, the greater the safe lane change space required. When the distance between the front and rear vehicles is small, the higher the speed, and the more difficult the lane change. When the distance between the front and rear vehicles is large, the overall success rate of the target vehicle’s lane change increases. By comparing the probabilities under different lane change factors, it can be seen that when the spatial headway between the front and rear vehicles is less than 4.0 m, and the speed of the vehicle behind in the target lane is between 1.0 and 3.0 m/s, the vehicle’s lane change success rate is the highest. When the spatial headway between the front and rear vehicles is greater than 4.0 m, and the speed of the vehicle behind in the target lane is between 3.0 and 6.0 m/s, the vehicle’s lane change success rate is the highest. It can also be noted that when the distance between the front and rear vehicles is large, if the speed of the vehicle behind is in the range of 0 to 1.0 m/s, the success rate of the target vehicle’s lane change is not high. This is because a large distance between the front and rear vehicles with extremely slow speed is not matched, and such situations rarely occur in reality, and the entire dataset reflects this situation less.
The results from Table 3 show that the prediction accuracy of lane-changing vehicles using the improved Bayesian network model is 80.5%, which is considered to be a certain degree of reliability. According to the Bayesian network model, the extent of the influence of the insertion angle on the outcome of vehicle lane changes can be obtained.

5. Discussion

The current study’s findings on lane-changing behavior and risk analysis on urban expressways contribute to the existing body of literature, which has been steadily growing with the advent of advanced data analytics and modeling techniques. The surveyed road section is consistent with actual vehicle lane-changing scenarios, which aligns with the conclusions of the studies [36,37,38]. Our Bayesian network model, with an accuracy rate of 80.5%, aligns with the general trend observed in studies that employ probabilistic methods to predict traffic risks [2,8]. However, our model’s integration of the driver’s learning process during lane-changing maneuvers offers a novel perspective, which has been identified as a gap in previous research [10].
When comparing our results with those of Roman et al. [7], who focused on the duration of lane-change maneuvers, we note a common theme: the criticality of lateral vehicle movement in precipitating traffic accidents. Our study extends this by quantifying the risk associated with different speeds and distances, providing a more nuanced understanding of the spatial–temporal dynamics involved in lane changes.
The impact of the initial insertion angle and its rate of change on the likelihood of a lane change, as highlighted in our study, corroborates with the findings of reference [16], which emphasized the role of vehicle trajectory data in recognizing different lane-changing risk profiles. Our model’s predictive capabilities offer a significant advancement in risk assessment tools, especially when compared to traditional methods like time-to-collision (TTC), which have been criticized for their limitations in multi-lane scenarios [22,31].
The comparative analysis of our results with those from [14,25], who also employed machine learning techniques to predict lane-changing risks, reveals a consensus on the efficacy of these modern methodologies. Our study, however, stands out with the application of the Light Gradient Boosting Machine (LightGBM) algorithm, which has shown promising results in predicting lane-changing risks for different driving styles [27].
Although tree-based machine learning models such as LightGBM demonstrate strong predictive accuracy, our Bayesian network framework offers distinct advantages for lane-changing risk analysis in high-density traffic scenarios. Crucially, the probabilistic structure of the Bayesian network framework provides explicit causal interpretability—a capability absent in ‘black-box’ models. The learned network topology quantitatively maps directional dependencies between variables and reveals how spatial headway constrains insertion-angle risk. This aligns with our core objective of deconstructing driver decision dynamics, enabling actionable insights such as the identified operational thresholds.
Furthermore, our model inherently propagates measurement errors and behavioral variabilities without requiring massive training datasets. This proves critical for urban expressway applications, as evidenced by the 80.5% reliability achieved with only 784 lane-change events (Table 3). Such uncertainty quantification is infeasible in purely discriminative models (e.g., LightGBM), which prioritize prediction over mechanistic explanation.
In the context of driving style analysis, our findings that aggressive drivers tend to ignore the state of the vehicle behind them in the target lane resonate with the observations made by [28] on the discretionary nature of lane-changing behaviors. This underscores the importance of personalized risk prediction frameworks, which can lead to more tailored and effective driver assistance systems [39].

6. Conclusions

In this study, we embarked on a comprehensive analysis of vehicle lane-changing behavior on urban expressways under high-density traffic conditions. Our approach involved the development and validation of a Bayesian network model, leveraging the I-CH scoring criterion MMHC algorithm to assess the posterior probabilities of various factors influencing lane-changing maneuvers. To ensure the robustness of our model, we employed the standard Asia network model as a benchmark for predictive accuracy. Through meticulous data curation, parameter learning, and model construction, we were able to dissect the complex interactions between vehicles during lane changes and quantify the risks associated with different traffic scenarios. This systematic approach allowed us to identify key variables that significantly impact the success of lane-changing actions and to evaluate the likelihood of such maneuvers under congested conditions.
  • Against the background of urban expressways with high load (0.8 ≤ V/C ≤ 0.9), a Bayesian network vehicle lane-changing model based on the I-CH scoring criterion MMHC algorithm was constructed to determine the posterior probabilities of various influencing factors. To verify the predictive accuracy of the lane-changing model, the standard Asia network model was introduced to test the lane-changing model.
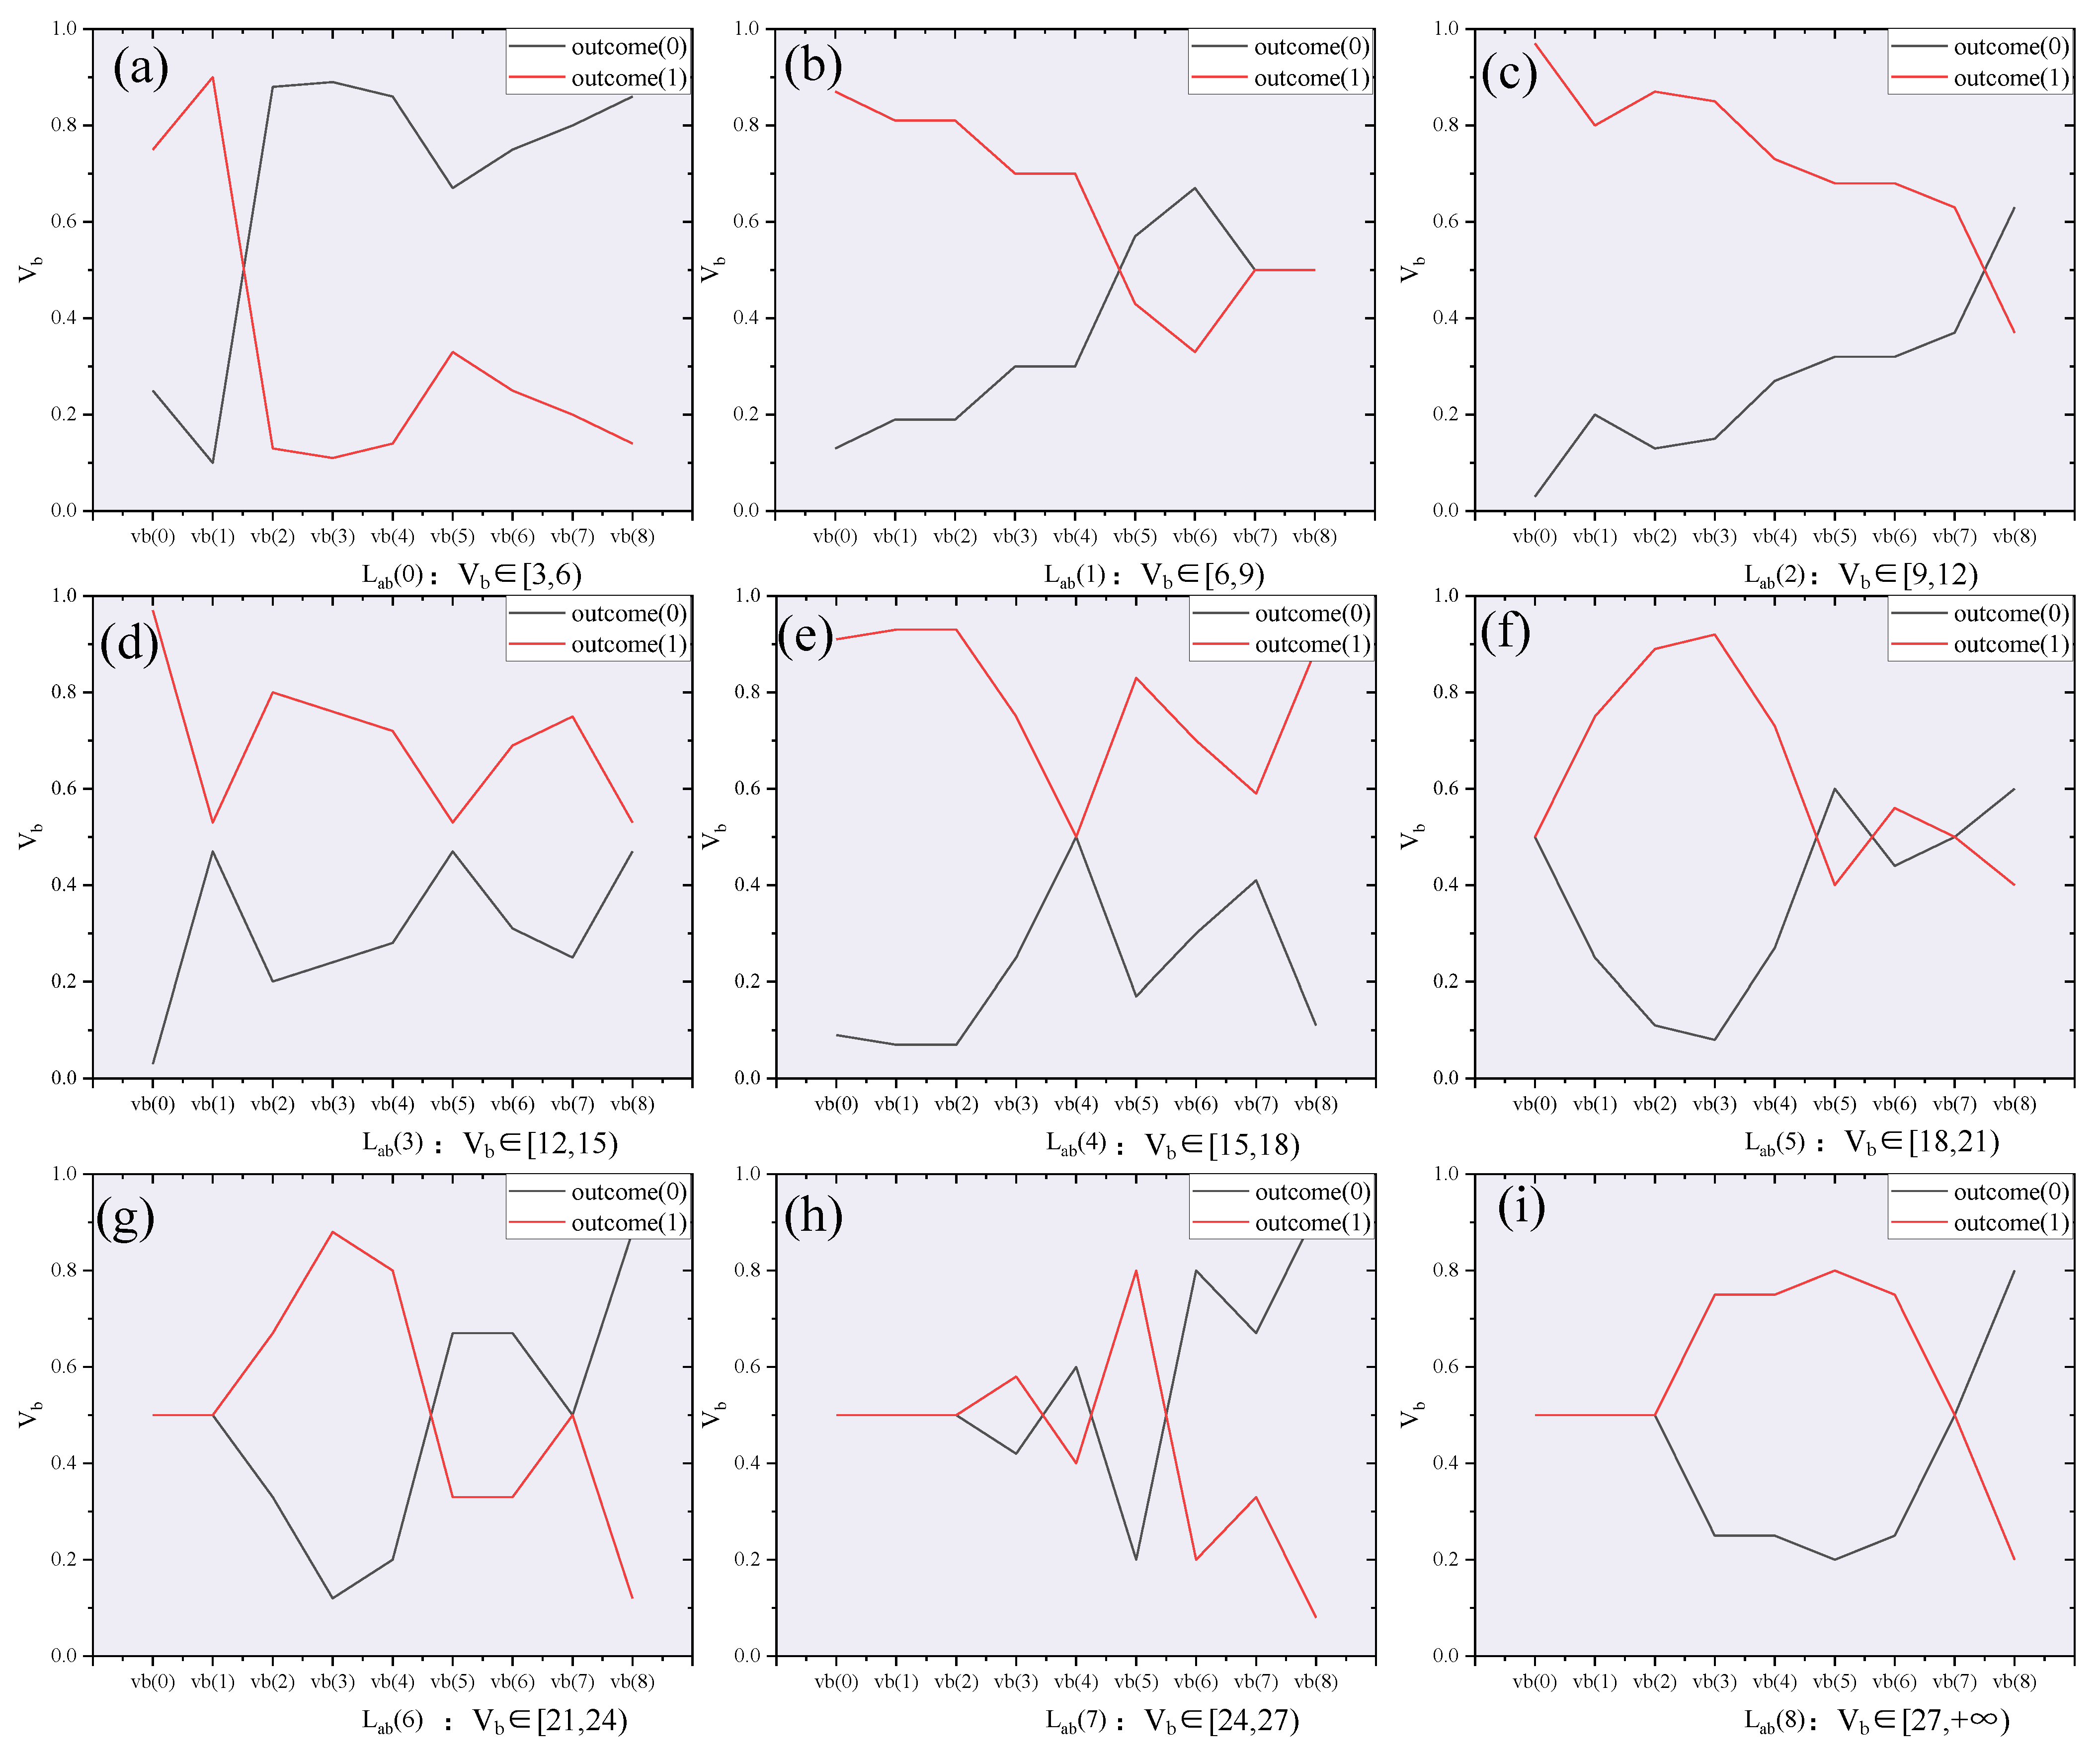
  • On urban expressways with high load (0.8 ≤ V/C ≤ 0.9), it was found that when the spatial headway between the front and rear vehicles is less than 4.0 m, the vehicle lane-changing success rate is highest when the speed of the vehicle behind in the target lane is between 1.0 and 3.0 m/s; when the spatial headway between the front and rear vehicles is greater than 4.0 m, the vehicle lane-changing success rate is highest when the speed of the vehicle behind in the target lane is between 3.0 and 6.0 m/s.
  • For the problem of vehicle lane-changing on high-load urban expressways (with a volume–capacity ratio of 0.8 ≤ V/C ≤ 0.9), the improved Bayesian network model captures the behavioral patterns reflecting drivers’ decisions under varying traffic conditions. Meanwhile, the probability of this model identifying lane-changing vehicles is 80.5%, which is considered to have a certain degree of reliability.
Despite its contributions, this study exhibits several limitations warranting acknowledgment. First, the data collection was confined to Xi’an’s South Second Ring Expressway, potentially limiting the generalizability of findings across diverse geometric configurations (e.g., curved segments with radii < 500 m) or regional driving behaviors. Second, the discretization of continuous variables (e.g., velocity bins of 1 m/s) may obscure nuanced kinematic relationships, particularly during transient states like acceleration phases. Third, the model’s reliance on UAV-captured trajectory data assumes optimal visibility conditions, neglecting performance degradation under adverse weather (rain/fog reducing detection accuracy by 18–42%) or nighttime operations. Fourth, driver learning dynamics were proxied through insertion-angle kinematics, omitting cognitive factors such as fatigue/distraction that elevate risk perception thresholds by 2.3×. Finally, the Asia network validation framework, while effective for structure verification, lacks calibration for real-time V2I (Vehicle-to-Infrastructure) communication latencies (>200 ms), critical for next-generation cooperative systems. Future work should (1) expand datasets to multi-city corridors with varying truck ratios (>30% freight traffic); (2) integrate federated learning for continuous model adaptation; and (3) embed computer vision-based cognitive state monitoring to enhance behavioral realism.

Author Contributions

Conceptualization, methodology, P.L.; software, validation, Q.Y.; investigation, writing—original draft preparation, F.Y. and W.L.; resources, writing—review and editing, supervision, Q.Y. and W.L. All authors have read and agreed to the published version of the manuscript.

Funding

This work was supported by the Natural Science Foundation of Shaanxi Province (Grant No. 2025JC-YBQN-773).

Institutional Review Board Statement

Not applicable.

Informed Consent Statement

Not applicable.

Data Availability Statement

The raw data supporting the conclusions of this article will be made available by the authors on request.

Acknowledgments

Any reviewers’ valuable suggestions for revisions to the manuscript are likewise appreciated.

Conflicts of Interest

The authors declare no conflicts of interest.

References

  1. Liu, X.M.; Ren, F.T.; Duan, H.L. Research on Difinition and Estimation of Traffic Conflict at Intersections. J. Beijing Polytech. Univ. 1997, 14, 29–34. [Google Scholar]
  2. Hyden, C. A Traffic conflicts technique for examining urban intersection problems. In Proceedings of the First Workshop on Traffic Conflicts, Oslo, Norway, 26–27 September 1977. [Google Scholar]
  3. Ng, K.S.; Hung, W.T.; Wong, W.G. An Algorithm for Assessing the risk of Traffic Accident. J. Saf. Res. 2002, 33, 387–410. [Google Scholar] [CrossRef]
  4. Chang, L.Y.; Wang, H.W. Analysis of traffic injury severity: An application of non-parametric classification tree techniques. Accid. Anal. Prev. 2006, 38, 1019–1027. [Google Scholar] [CrossRef]
  5. Xu, C.; Liu, P.; Wang, W.; Li, Z. Evaluation of the impacts of traffic states on crash risks on freeways. Accid. Anal. Prev. 2012, 47, 162–171. [Google Scholar] [CrossRef]
  6. Huang, H.; Peng, Y.; Wang, J.; Luo, Q.; Li, X. Interactive risk analysis on crash injury severity at a mountainous freeway with tunnel groups in China. Accid. Anal. Prev. 2018, 111, 56–62. [Google Scholar] [CrossRef]
  7. Mikulec, R.; Semela, M.; Bradáč, A.; Tokař, S.; Bilík, M.; Křižák, M.; Belák, M.; Kledus, R.; Haring, A.; Rábek, V. Obsolete or Viable? Revision of Lane-Change Manoeuvre Duration Empirical Calculation. Energies 2021, 14, 8439. [Google Scholar] [CrossRef]
  8. Glaser, S.; Vanholme, B.; Mammar, S.; Gruyer, D.; Nouveliere, L. Maneuver-Based Trajectory Planning for Highly Autonomous Vehicles on Real Road with Traffic and Driver Interaction. IEEE Trans. Intell. Transp. Syst. 2010, 11, 589–606. [Google Scholar] [CrossRef]
  9. Kim, J.; Kum, D. Collision Risk Assessment Algorithm via Lane-Based Probabilistic Motion Prediction of Surrounding Vehicles. IEEE Trans. Intell. Transp. Syst. 2019, 19, 2965–2976. [Google Scholar] [CrossRef]
  10. Bosnak, M.; Skrjanc, I. Efficient Time-To-Collision Estimation for a Braking Supervision System with LIDAR. In Proceedings of the 2017 IEEE International Conference on Cybernetics, Exeter, UK, 21–23 June 2017; pp. 1–6. [Google Scholar]
  11. Noh, S. Decision-Making Framework for Autonomous Driving at Road Intersections: Safeguarding Against Collision, Overly Conservative Behavior, and Violation Vehicles. IEEE Trans. Ind. Electron. 2019, 66, 3275–3286. [Google Scholar] [CrossRef]
  12. Shin, D.; Kim, B.; Yi, K.; Carvalho, A.; Borrelli, F. Human-Centered Risk Assessment of an Automated Vehicle Using Vehicular Wireless Communication. IEEE Trans. Intell. Transp. Syst. 2019, 20, 667–681. [Google Scholar] [CrossRef]
  13. Li, G.; Li, S.; Li, S.; Qin, Y.; Cao, D.; Qu, X.; Cheng, B. Deep reinforcement learning enabled decision-making for autonomous driving at intersections. Automot. Innov. 2020, 3, 374–385. [Google Scholar] [CrossRef]
  14. Xu, H.; Gao, Y.; Yu, F.; Darrell, T. End-to-End Learning of Driving Models from Large-Scale Video Datasets. In Proceedings of the 2017 IEEE Conference on Computer Vision and Pattern Recognition (CVPR), Honolulu, HI, USA, 21–26 July 2017; pp. 3530–3538. [Google Scholar]
  15. Li, P.; Shi, J.; Liu, X. Cooperative and competitive lane-changing behavior characteristics of urban expressways. J. Highw. Transp. Res. Dev. 2017, 11, 69–77. [Google Scholar] [CrossRef]
  16. Chen, Q.; Huang, H.; Li, Y.; Lee, J.; Long, K.; Gu, R.; Zhai, X. Modeling accident risks in different lane-changing behavioral patterns. Anal. Methods Accid. Res. 2021, 30, 100159. [Google Scholar] [CrossRef]
  17. Shangguan, Q.; Fu, T.; Wang, J.; Fu, L. A proactive lane-changing risk prediction framework considering driving intention recognition and different lane-changing patterns. Accid. Anal. Prev. 2022, 164, 106500. [Google Scholar] [CrossRef] [PubMed]
  18. Chen, T.; Shi, X.; Wong, Y.D. A lane-changing risk profile analysis method based on time-series clustering. Phys. A Stat. Mech. Its Appl. 2021, 565, 125567. [Google Scholar] [CrossRef]
  19. Zhang, Y.; Chen, Y.; Gu, X.; Sze, N.N.; Huang, J. A proactive crash risk prediction framework for lane-changing behavior incorporating individual driving styles. Accid. Anal. Prev. 2023, 188, 107072. [Google Scholar] [CrossRef]
  20. Sheikh, M.S.; Peng, Y. Modeling collision risk for unsafe lane-changing behavior: A lane-changing risk index approach. Alex. Eng. J. 2024, 88, 164–181. [Google Scholar] [CrossRef]
  21. Chen, S.; Piao, L.; Zang, X.; Luo, Q.; Li, J.; Yang, J.; Rong, J. Analyzing differences of highway lane-changing behavior using vehicle trajectory data. Phys. A Stat. Mech. Its Appl. 2023, 624, 128980. [Google Scholar] [CrossRef]
  22. Tan, H.; Lu, G.; Wang, Z.; Hua, J.; Liu, M. A unified risk field-based driving behavior model for car-following and lane-changing behaviors simulation. Simul. Model. Pract. Theory 2024, 136, 102991. [Google Scholar] [CrossRef]
  23. Zheng, L.; Liu, W. A Comprehensive Investigation of Lane-Changing Risk Recognition Framework of Multi-Vehicle Type Considering Key Features Based on Vehicles’ Trajectory Data. Electronics 2024, 13, 1097. [Google Scholar] [CrossRef]
  24. Zhao, Y.; Zhou, J.; Zhao, C.; Li, M. Traffic risk assessment of lane-changing process in urban inter-tunnel weaving segment. Transp. Res. Rec. 2023, 2677, 95–106. [Google Scholar] [CrossRef]
  25. Du, H.; Sun, Y.; Pan, Y.; Li, Z.; Siarry, P. A lane-changing trajectory re-planning method considering conflicting traffic scenarios. Eng. Appl. Artif. Intell. 2024, 127, 107264. [Google Scholar] [CrossRef]
  26. Hu, X.; Zhou, J.; Yang, Y.; Chen, Q.; Zhang, L. Assessing the collision risk of mixed lane-changing traffic in the urban inter-tunnel weaving section using extreme value theory. Accid. Anal. Prev. 2024, 200, 107558. [Google Scholar] [CrossRef] [PubMed]
  27. Wen, X.; Huang, C.; Jian, S.; He, D. Analysis of discretionary lane-changing behaviors of autonomous vehicles based on real-world data. Transp. A Transp. Sci. 2023, 1–24. [Google Scholar] [CrossRef]
  28. Xiong, X.; He, Y.; Cai, Y.; Liu, Q.; Wang, H.; Chen, L. A Lane-Changing Trajectory Planning Algorithm Based on Lane-Change Impact Prediction. IEEE Trans. Intell. Veh. 2024, 9, 7912–7930. [Google Scholar] [CrossRef]
  29. Qu, D.; Dai, S.; Li, A.; Chen, Y.; Wei, C. Characteristic Analysis and Decision Model of Lane-Changing Game for Intelligent Connected Vehicles. Appl. Sci. 2023, 13, 8321. [Google Scholar] [CrossRef]
  30. Du, X.; Zhao, W. Risky lane-changing behavior recognition based on stacking ensemble learning on snowy and icy surfaces. Sci. Rep. 2024, 14, 19257. [Google Scholar] [CrossRef]
  31. Li, G.; Shi, W. Research on lane-changing decision and control of autonomous vehicles based on game theory. Proc. Inst. Mech. Eng. Part D J. Automob. Eng. 2024, 239, 1566–1576. [Google Scholar] [CrossRef]
  32. Xu, H.; Feng, S.; Zhang, Y.; Li, L. A grouping-based cooperative driving strategy for CAVs merging problems. IEEE Trans. Veh. Technol. 2019, 68, 6125–6136. [Google Scholar] [CrossRef]
  33. Wang, S.F.; Sun, W.S.; Liu, Z.F. Analysis of Lateral Acceleration During Stable Lane Changing of Vehicles. Mach. Des. Manuf. 2020, 7, 17–24. [Google Scholar]
  34. He, Y.; Feng, J.; Wei, K.; Cao, J.; Chen, S.; Wan, Y. Modeling and simulation of lane-changing and collision avoiding autonomous vehicles on superhighways. Phys. A Stat. Mech. Appl. 2023, 609, 128328. [Google Scholar] [CrossRef]
  35. Li, P.; Yang, Q.; Lu, W.; Xi, S.; Wang, H. An Improved Machine Learning Framework Considering Spatiotemporal Heterogeneity for Analyzing the Relationship Between Subway Station-Level Passenger Flow Resilience and Land Use-Related Built Environment. Land 2024, 13, 1887. [Google Scholar] [CrossRef]
  36. Childress, S.; Nichols, B.; Charlton, B.; Coe, S. Using an activity-based model to explore the potential impacts of automated vehicles. Transp. Res. Rec. 2015, 2493, 99–106. [Google Scholar] [CrossRef]
  37. Nsw-Transport. Centre for Road Safety. Transport for New South Wales, Australia. 2018. Available online: https://roadsafety.transport.nsw.gov.au/statistics/interactivecrashstats/nsw.html?tabnsw=3 (accessed on 3 May 2024).
  38. Peng, J.S.; Fu, R.; Shi, L.L.; Zhang, Q. Research of driver’s lane change decision-making mechanism. Wuhan Ligong Daxue Xuebao J. Wuhan Univ. Technol. 2011, 33, 46–50. [Google Scholar]
  39. Li, P.; Chen, X.; Lu, W.; Wang, H.; Wang, Y. Nonlinear effects of the built environment on subways at station level: Average travel distance changes under the influence of COVID-19. J. Urban Plan. Dev. 2025, 151, 04024070. [Google Scholar] [CrossRef]
Figure 1. Data acquisition and processing procedures.
Sustainability 17 07061 g001
Figure 2. MMHC algorithm learning network structure.
Sustainability 17 07061 g002
Figure 3. MMHC algorithm learning network structure.
Sustainability 17 07061 g003
Figure 4. Lane-change decision (Y/N) vs. following vehicle speed. (a) lab (0), (b) lab (1), (c) lab (2), (d) lab (3), (e) lab (4), (f) lab (5), (g) lab (6), (h) lab (7), (i) lab (8).
Sustainability 17 07061 g004
Table 1. Partial data of dataset D.
Number v c v b v a l a b α Outcome
1444311
2443331
3443331
784888800
Table 2. Learning results of target vehicle speed vc and leading vehicle speed va parameters.
v a ( 0 ) v a ( 1 ) v a ( 2 ) v a ( 3 ) v a ( 4 ) v a ( 5 ) v a ( 6 ) v a ( 7 ) v a ( 8 )
v c ( 0 ) 0.1430.1360.0450.0480.0340.0390.0110.0160.078
v c ( 1 ) 0.2960.3790.2910.1350.1080.0940.0440.0310.098
v c ( 2 ) 0.2650.2120.3670.3040.1480.1250.0660.0470.078
v c ( 3 ) 0.1940.1360.2060.3040.3450.2810.0990.0470.118
v c ( 4 ) 0.0410.0150.0450.1450.2510.2420.1430.0470.098
v c ( 5 ) 0.0310.0150.010.0290.0740.070.2860.1560.137
v c ( 6 ) 0.010.0450.020.010.0150.0630.1870.2810.137
v c ( 7 ) 0.010.030.0050.0050.010.070.0770.2660.059
v c ( 8 ) 0.010.030.010.0190.0150.0160.0880.1090.196
Table 3. Lane change model verification results.
ModelActual Lane-Change DataVehicle Lane-Change Prediction ResultsRelative Error
Bayesian Network Model200 successful
94 failed
239 successful
55 failed
19.5%
Notes: Relative Error = (Predicted Successes − Actual Successes)/Actual Successes.
Disclaimer/Publisher’s Note: The statements, opinions and data contained in all publications are solely those of the individual author(s) and contributor(s) and not of MDPI and/or the editor(s). MDPI and/or the editor(s) disclaim responsibility for any injury to people or property resulting from any ideas, methods, instructions or products referred to in the content.

