1. Introduction
The siphon effect, rooted in physics, describes how liquid flows from a high-pressure area to a low-pressure area owing to gravitational and potential energy differences under equal atmospheric pressure. Subsequently, its significance has been extended to other fields, such as urban economy [
1] and railway transportation [
2]. The siphon effect is commonly observed in airport clusters in Mainland China. An airport cluster refers to a spatial aggregation within a defined region, centered around one or more major airports, where airports and cities within the region are interconnected through ground transportation systems based on air travel demand. The defined region is typically a metropolitan area or urban agglomeration, within which the airport cluster comprises at least three airports. The siphon effect typically occurs when a primary airport in a cluster concentrates disproportionately on resources, flights, and facilities. This concentration can negatively impact regional or secondary airports, as passengers are drawn to the primary airport, leading to a decline in passenger volume and reduced service levels at the smaller airports. This study defines a siphon effect index for this phenomenon, which is used to quantify the attractiveness of regional hub airports to passengers from neighboring cities. Through the analysis of intercity passenger movements, the index effectively captures the agglomeration effect of hub airports on surrounding passenger sources and their spatial reach.
In 2018 passenger travel data, a study revealed the travel choices of residents on shared routes between four major airports in Beijing, Tianjin, and Hebei [
3]. A survey revealed that approximately 65% of passengers from Hebei chose to fly out of airports in Beijing and Tianjin. In contrast, only approximately 0.5% of passengers from Beijing and Tianjin chose to fly from airports in Hebei. This demonstrates a significant difference in the attractiveness of airports within the Beijing–Tianjin–Hebei airport cluster and a siphon effect. Without intervention, resources gradually shift toward the hub airport, exacerbating the gap in passenger throughput. For example, in 2006, the throughput of Beijing Capital Airport was 38.8 million more than that of Tianjin Binhai Airport, and in 2019, this difference reached 76 million. After obtaining resources, hub airports show greater advantages, widening the gap between them and the surrounding airports [
4,
5,
6]. From a passenger transport perspective, hub airports become overloaded while surrounding airports remain underutilized, creating a vicious cycle [
7].
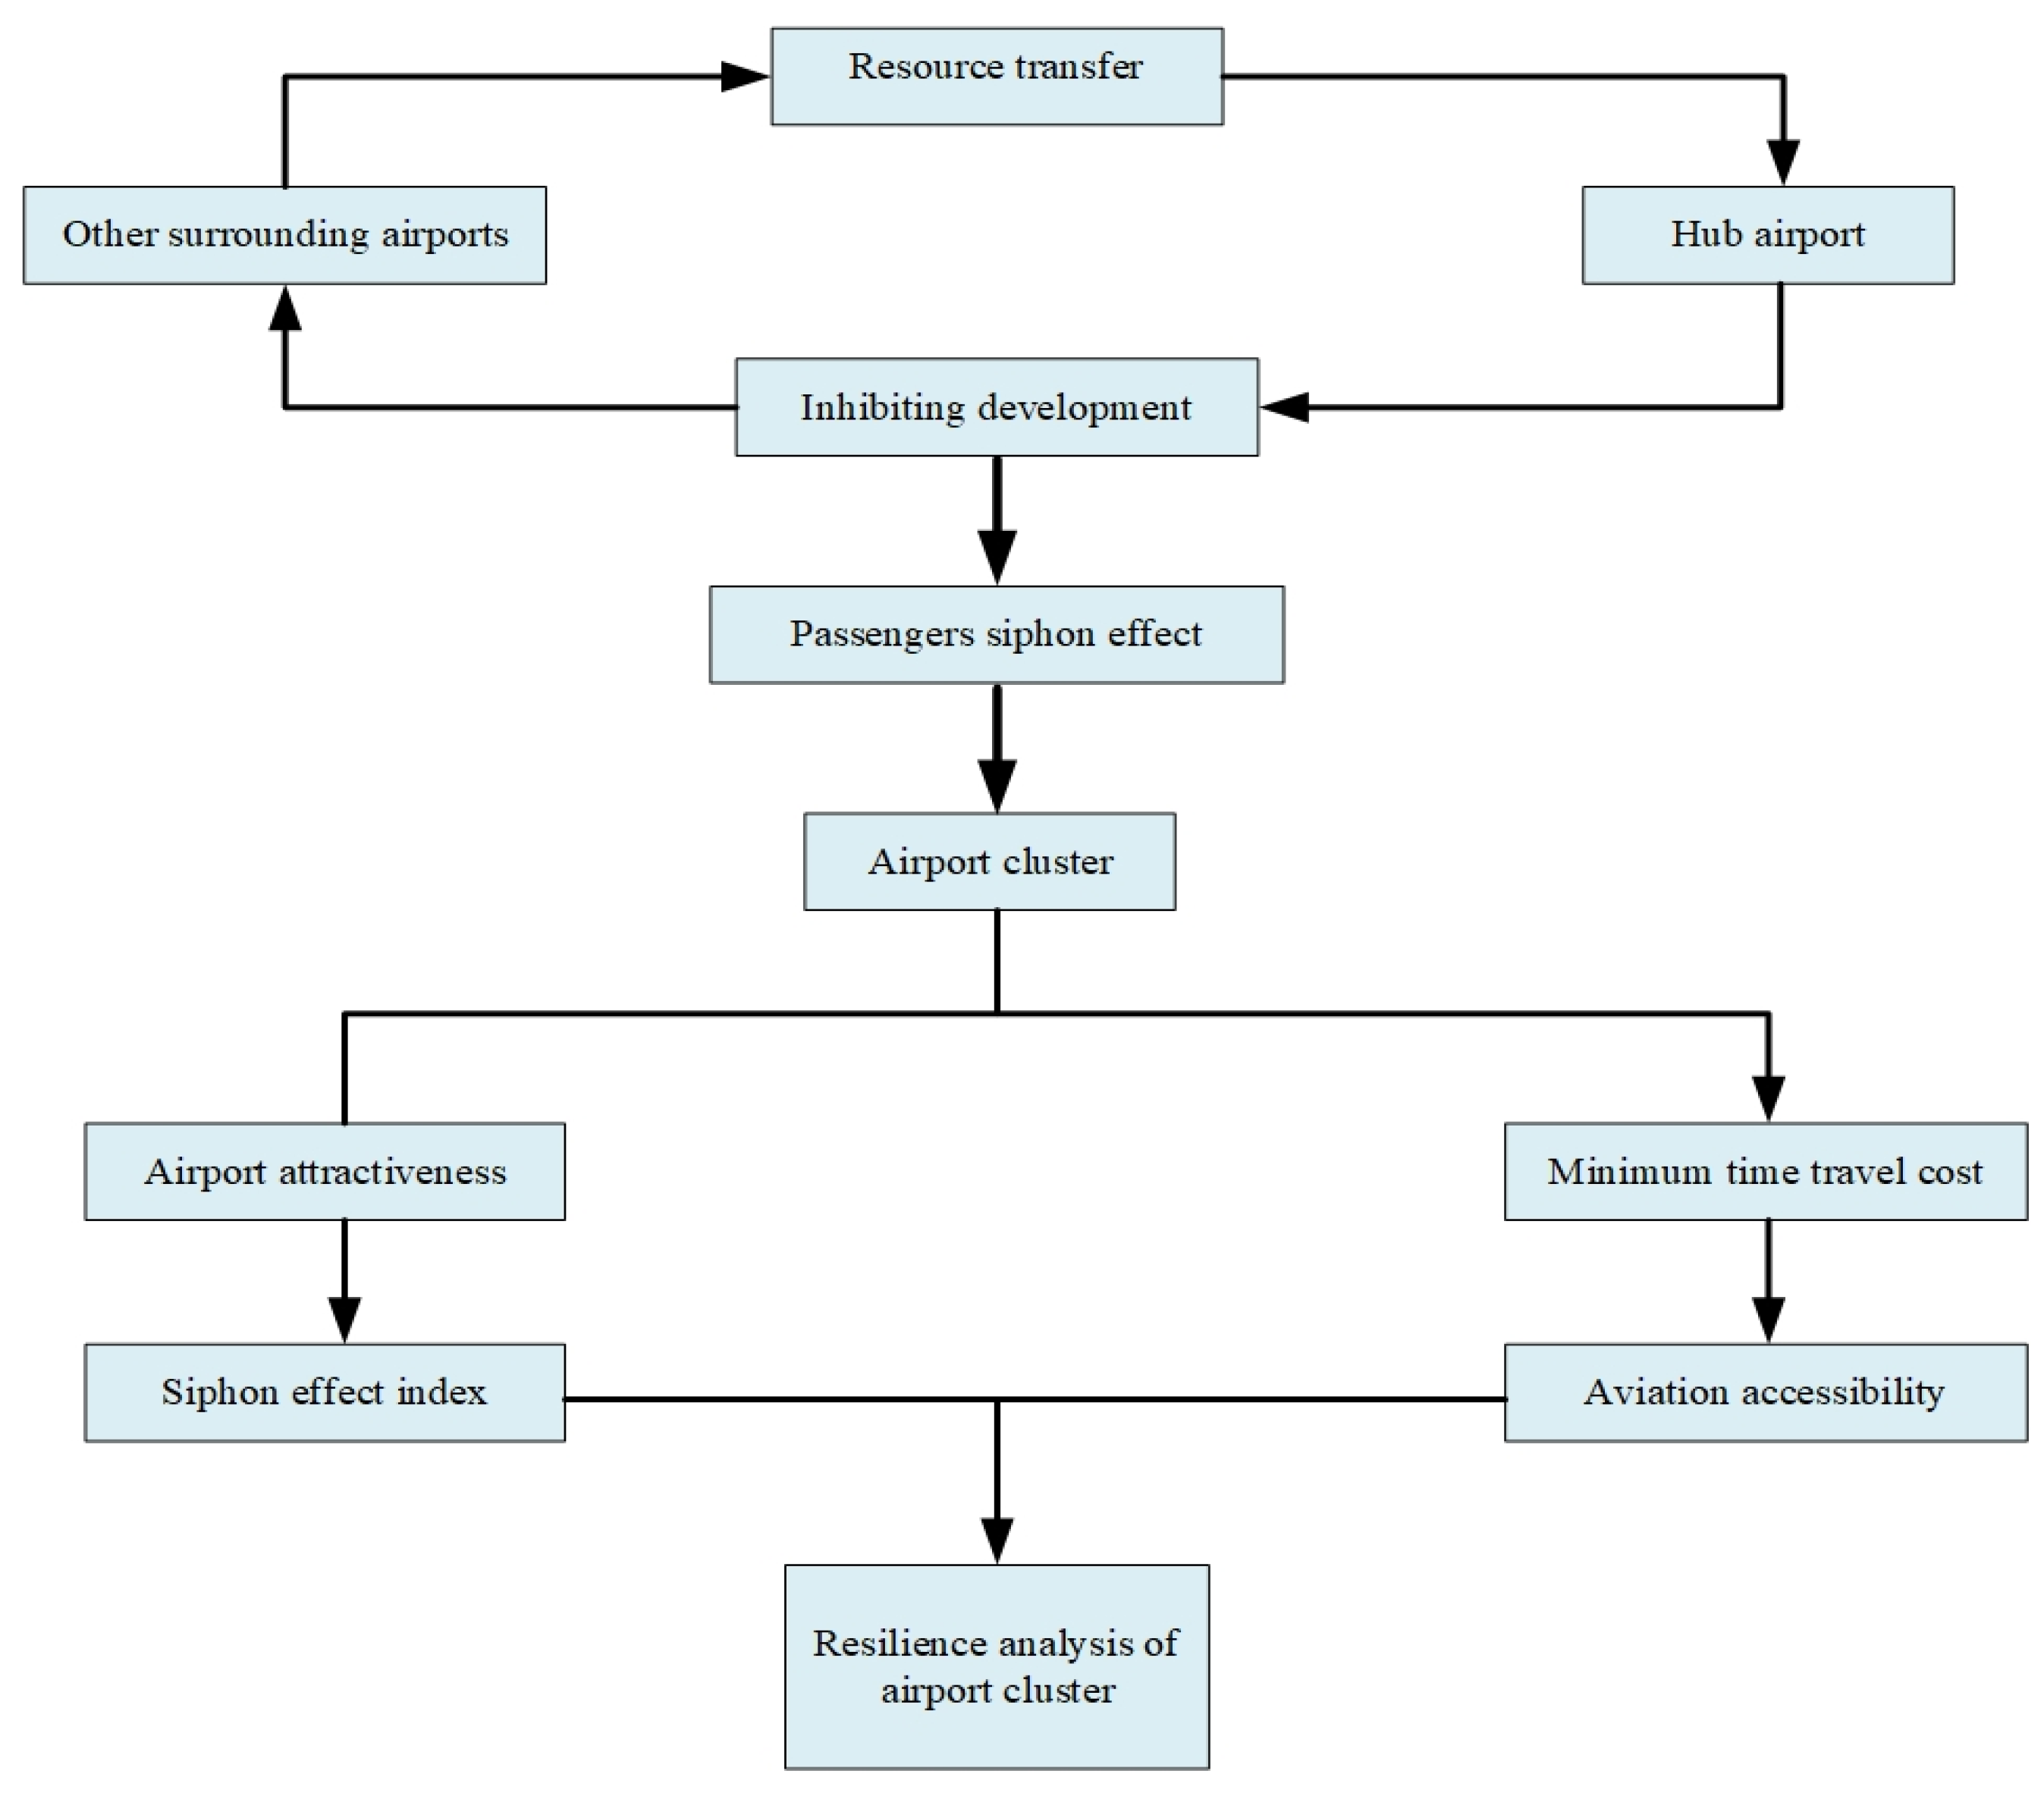
Figure 1 shows the basic framework of this study.
Most studies on the siphon effect in civil aviation focus on its existence between airports, with limited attention given to its impact on transportation resilience. Resilience generally refers to the ability of a system, community, or society to effectively and promptly resist, adapt to, and recover from the impacts of hazards when exposed to them [
8]. Disruptive events such as adverse weather, natural disasters [
9,
10], public health events [
11], and terrorist attacks [
12] can lead to airport closures or flight cancellations. If a hub airport in an airport cluster exerts a significant siphon effect on smaller airports, disruptions from unforeseen events could severely impact the cluster’s resilience. For example, on 16 September 2018, Shenzhen Bao’an Airport was forced to close due to the failure of navigation equipment caused by Typhoon “Shanzhu.” Since Shenzhen Bao’an Airport is the hub airport within the Pearl River Delta airport cluster, it exerts a significant siphon effect on surrounding airports. As a result, on the day of closure, more than 100,000 passengers were affected, with many stranded at the airport and in surrounding areas and no large-scale passenger stranding occurred at nearby airports. Therefore, studying the characteristics of the siphon effect and quantifying its impact on airport cluster resilience are crucial.
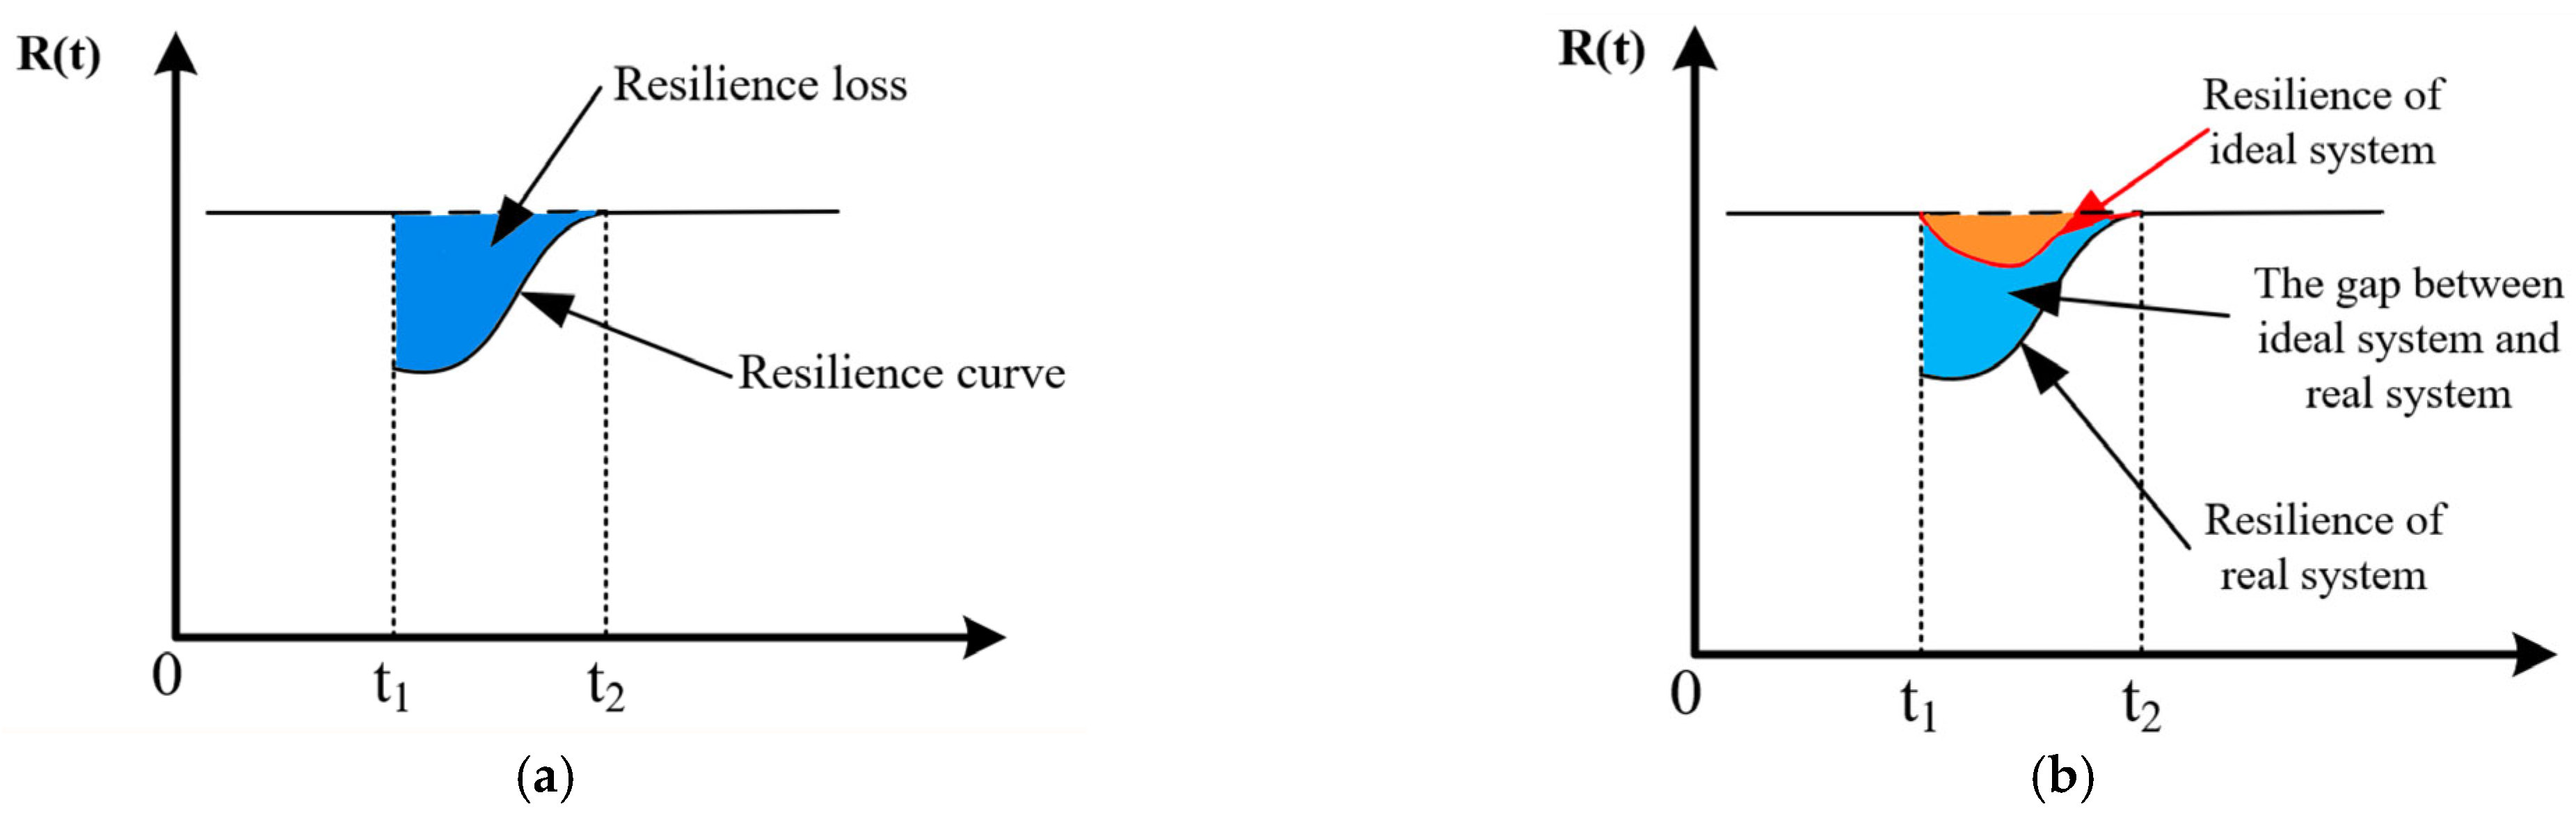
Figure 2a illustrates the schematic diagram of the system resilience triangle. The black solid line represents the resilience curve, while the dark blue area indicates the resilience loss after the system is disrupted by unexpected events. In an airport cluster system, this loss consists of two components: one resulting from internal factors such as equipment, personnel, and management, and the other caused by the siphon effect within the airport cluster. To quantify the impact of the siphon effect on the resilience of airport clusters, it is essential to establish a benchmark system that is unaffected by the siphon effect—the zero-siphon system. The ideal system provides a reference for assessing how siphon influences the resilience of the real airport cluster system. As shown in
Figure 2b, the black curve represents the resilience performance of the real system under the same conditions, while the red curve represents the resilience performance of the ideal system under disruptive events. The orange area indicates the resilience loss in the ideal system due to factors such as equipment, personnel, and management. The blue area represents the resilience performance gap between the ideal system and the real system caused by the siphon effect. A key objective of this study is to conduct a quantitative analysis of the resilience difference attributed to the siphon effect, as represented by the blue area.
To address the above issues, this study makes the following contributions:
Firstly, this paper defines a siphon index to describe the attraction of different airports within an airport cluster to passengers in the region. This index is calculated based on the difference between the inflow and outflow of passengers in the cities where the airports are located. By calculating the passenger inflow and outflow differences between cities, the index reflects the attraction of each airport to passengers within the airport cluster.
Secondly, the resilience index of an airport cluster is quantified through accessibility. Therefore, it is necessary to calculate the accessibility of each airport within the cluster. A critical aspect in the calculation involves determining the accessibility time from the city center to the departure airport via ground transportation. In Sun’s study [
14], she only considered car driving as the sole ground transportation mode. However, in China, high-speed rail (HSR) plays a crucial role in the ground transportation network. Compared to cars, HSR can cover a much wider area within the same time and serve a larger population. With the integration of airports and the advancement of HSR, many passengers now consider HSR as their preferred mode of ground transportation when traveling to the airport. Therefore, considering the current state of ground transportation in China, we expand Sun’s study by incorporating HSR into the scope of ground transportation.
Lastly, a zero-siphon system is established to characterize the impact of the siphon effect on the resilience of real airport cluster systems. As shown in
Figure 2b, the red line represents the resilience curve of the zero-siphon system, which avoids the impact of the siphon effect on the airport cluster. The zero-siphon system refers to an airport cluster system where flight allocations are based on the resident population of the local cities. Under this system, airports no longer excessively attract passengers from other cities, allowing local airports to adequately meet travel demands without passengers needing to use airports in other cities. Although in reality, flight allocations are influenced by factors such as initial airport design and airline profitability of traffic concentration, the zero-siphon system serves as an idealized model. Its primary purpose is to provide a benchmark for comparison with real systems, enabling the analysis of the siphon effect’s impact on the resilience of airport clusters.
Taking China’s four major airport clusters as case studies, the results reveal that the Pearl River Delta cluster exhibits the most pronounced siphon effect. Several airports within this cluster have a siphon index below −0.5, whereas those in other clusters generally remain above this threshold. This phenomenon is primarily due to the concentration of flight resources at Guangzhou Baiyun Airport and Shenzhen Bao’an Airport, which significantly contribute to the overall accessibility of the Pearl River Delta cluster. The accessibility analysis shows that these two hub airports dominate the cluster’s connectivity, exerting substantial influence on surrounding airports. Resilience analysis further demonstrates that if both core airports are disrupted simultaneously, the system’s resilience could drop to as low as 13% of its normal level. Such a loss would critically impair the airport cluster’s overall functioning. Based on these findings, we can make several recommendations to airports, airlines, and other stakeholders—such as redistributing flight resources more proportionally across the cluster—to promote balanced development and enhance the resilience of the entire system.
The remainder of this paper is organized as follows:
Section 2 reviews the relevant literature.
Section 3 presents the methods for identifying the lowest cost time for journeys and delineating areas affected by the airport siphon effect.
Section 4 describes the data preparation for the case studies and presents the results of the siphon effect and aviation accessibility.
Section 5 discusses the resilience of the Pearl River Delta airport cluster. Finally,
Section 6 summarizes the findings and interprets their implications and limitations.
3. Modeling
In this section, we define a siphon index, an accessibility index and establish a zero-siphon system. We introduce a method to quantify the impact of the airport siphon effect on the resilience of airport clusters.
3.1. Definition of the Siphon Index
It is known that airport clusters emerge to serve urban clusters [
34]. For an airport cluster
C (including airports
a,
b,
c…), which is served urban cluster
UC (including cities
A,
B,
C…). For an airport
is located in a specific city
, denote
as the attraction of airport
a to city
B at time
t, it indicates the number of passengers from city
B to take flights in airport
a. The siphon index of airport
a (located in city
A) at time
t is denoted as
, which is defined as the total number of passengers traveling from other cities within the airport cluster and its served urban cluster to airport
a (i.e., inflow), minus the number of passengers departing from the city
A where airport
a is located to use other airports in the cluster (i.e., outflow), it reflects the degree to which the airport attracts passengers from all other cities in the city cluster except its own.
is calculated as follows:
A positive value of indicates that airport a is siphoning passengers from other cities, exhibiting a positive siphon effect. A negative value of indicates that passengers from city A are instead being attracted to airports in other cities, indicating a negative siphon effect. It is stipulated that if there is no airport in the city B, then . This siphon index helps in understanding the impact of airport attractiveness and the distribution of passenger traffic within the airport cluster.
3.2. Airport Cluster Accessibility Index
Resilience is the ability of the system to “plan and prepare for, absorb, respond to, and recover from disasters and adapt to new conditions.” [
35]. The assessment of resilience in this study is conducted by evaluating changes in airport cluster accessibility under disruptive events. Therefore, it is necessary to calculate the accessibility of each airport within the cluster. In Wang’s study [
13], the performance of an airport is assessed based on the average efficiency between any two airports, and Sun [
14] investigated the accessibility conditions between cities. Due to the fact that airports within an airport cluster serve the surrounding urban cluster, it is essential to investigate how airport clusters influence the accessibility performance of population travel within these cities. This study requires calculating the accessibility of each individual airport within the airport cluster in order to evaluate the overall accessibility of the cluster. Therefore, based on the research by two scholars, we use the shortest travel time as the criterion; its value is determined as shown in Equation (3). The accessibility of an airport is calculated according to Equation (4). After calculating the accessibility of all airports, the average of these values is taken to obtain the overall accessibility of the airport cluster, as shown in Equation (5). The definitions of the symbols used in the equations can be found in
Appendix A.
In Equation (3), it calculates the total travel time for passengers departing from city
B to the destination airport
. It includes both ground and air travel times. The ground travel time refers to the duration required for a passenger to reach airport
a from the city center. The air travel time refers to the duration from airport
a to the destination airport
. If the optimal path for passengers traveling from the city center to the destination airport does not pass through airport
a, the passenger’s travel time is set to infinity. The travel time involving an airport primarily consists of three components (taking airport
a as an example): the time required to travel from city
B to airport
a, the waiting time at airport
a, and the flight time. The first component belongs to ground transportation. Traditionally, this segment has been considered only in terms of car driving [
14]. Given the realities of the transportation system in China, HSR constitutes a vital part of the ground transport infrastructure. Based on it, this study expands the scope of previous research by considering both car driving and HSR as viable ground transportation options for airport access. For passengers, although they have more flexibility in terms of time, most of them choose HSR as the ground vehicle to arrive airport. For cities without airports, such as Baoding in Hebei Province, most people go to the airport by HSR, and only a few people drive to the airport. Using a combination of driving and HSR for airport access better reflects passengers’ actual travel behavior.
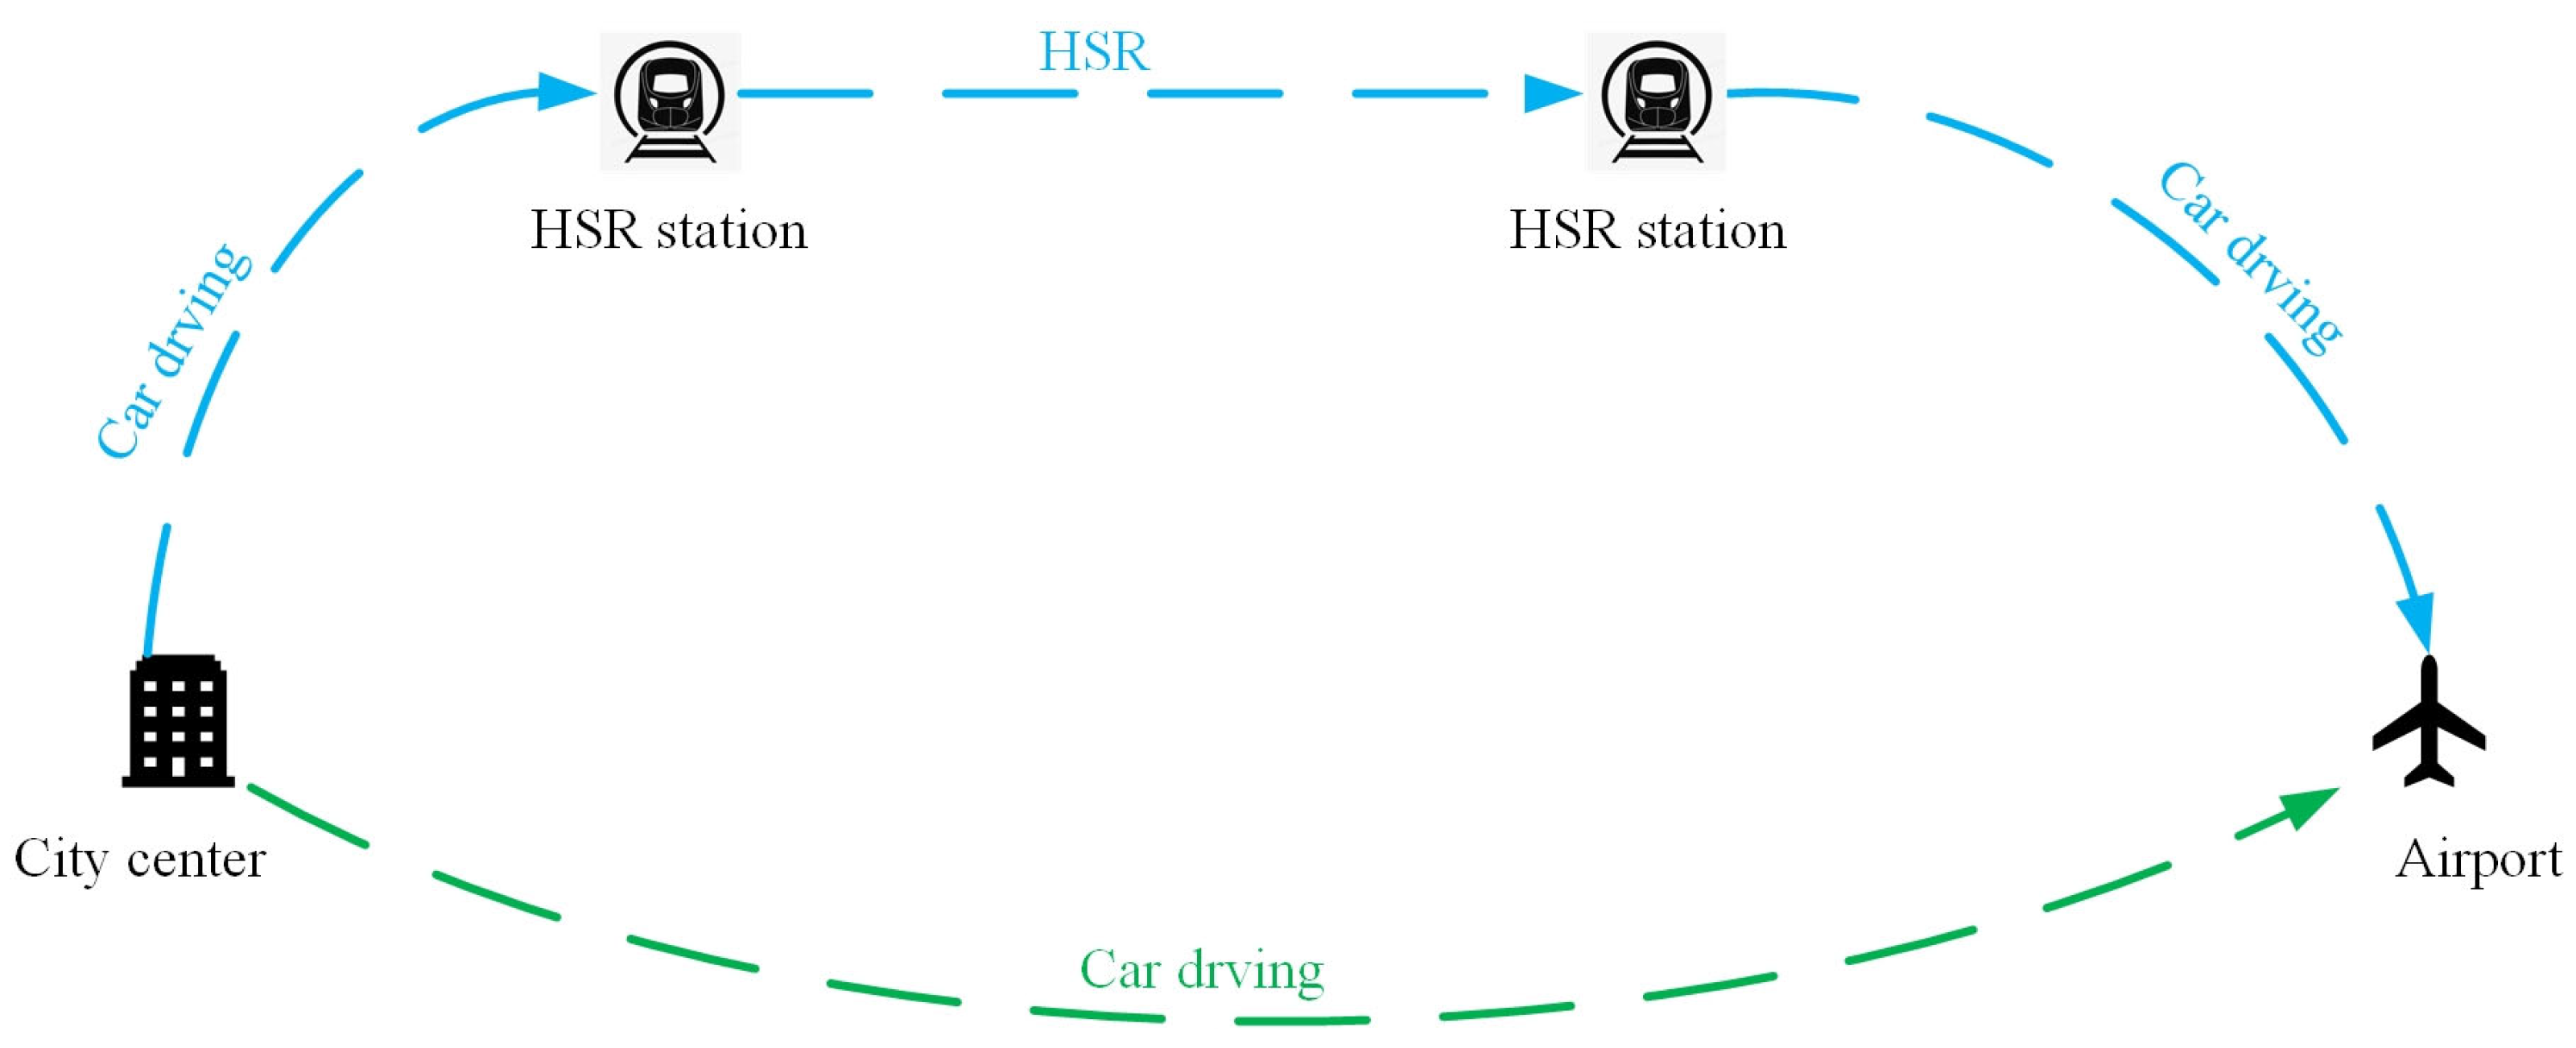
In this study, we consider the connection between HSR and airports, which ground travel time is divided into three segments: traveling by car from the city center to the departure train station, taking the train from the departure station to the arrival station, and traveling by car from the arrival station to the departure airport, as shown in
Figure 3. The travel time for the segments between the city center and departure station and between the arrival station and departure airport can be obtained from OpenStreetMap. According to the “123 Travel Transportation Circles for the Construction of a Transportation Powerhouse” mentioned in the Guidelines for the Construction of a Transportation Powerhouse issued by the State Council in 2019.
To reduce passengers’ waiting time upon arrival at an airport, this study prioritizes selecting the HSR service closest to the departure flight as the primary option. In compiling passenger HSR itineraries, passengers must have sufficient time to complete the necessary procedures upon arrival at the airport and continue to catch their flights. We define
as the departure time of flight
K,
as the security check time (restricted to 40 min in this study), and
as the arrival time of HSR
i. The constraints are as follows:
by incorporating the necessary constraints into the algorithm, we can determine the journey with the minimum total time cost by considering HSR options within a 2-h window.
Flight schedules on the same route have fixed departure and arrival times in a seasonal schedule. This means airborne travel time stays mostly consistent. Similarly, without disruptions (e.g., traffic jams, floods, or road controls), ground travel time from the city center to the airport remains stable. Therefore, this study evaluates the accessibility provided by airports to passengers from the perspective of minimizing passenger travel time.
3.3. Analyzing the Resilience Between the Real Systems and the Zero-Siphon Systems
In this study, one of the reasons for the siphon effect is the unbalanced distribution of flights between hub airports and other airports. A way to reduce the siphon effect is to reallocate flights to airports within the airport cluster. It is observed that not all cities in the airport cluster have airports. If passengers need to travel but there is no airport in their city, they must first reach a nearby city with an airport to take a plane. The inflow of passengers from non-airport cities increases the number of travelers in airport cities, which reshapes the spatial pattern of travel demand. Therefore, the population must be considered when redistributing flights, rather than a simple and equal distribution of flights within the airport cluster.
To analyze the resilience gap between the real system and the zero-siphon system, it’s necessary to build a zero-siphon system. Since cities differ in economic development and airports vary in operational classifications, factors such as population, urban economic level (measured by GDP), and airport classification are taken into consideration during the flight assignment process. The population, GDP, and airport classification of each city are weighted and converted to obtain the final weight of each airport within the airport cluster. Based on these weights, the number of flights at each airport can be reallocated accordingly. The formula for calculating the flight allocation weight of each airport is as follows (the symbol definitions are in
Appendix A):
The population of each city is weighted, and the flights are redistributed based on the number of people. When there are multiple flights to the same destination, the original departure airport may change. It is observed that the destination airport remains unchanged. It can make passengers have several options for departure airports to reach the same destination. For passengers from cities without airports, we select departure airports that can be reached within two hours of travel time. If a city can access multiple airports, its population is equally divided among the cities where those airports are located. This approach ensures that the population and GDP of each city in the airport cluster are appropriately allocated to cities with airports. The allocation algorithm can be found in Algorithm 1, and the definitions of the symbols used in the equations can be found in
Appendix A.
| Algorithm 1 Building a zero siphon system |
| Input: , , , , , ; |
| Output: : for all and |
| 1: Initialize updated_population = for each |
| 2: for |
| 3: if city has no airport |
4: for each airport do
5: if is reachable within 2 hours from city I then |
6:
7:
8: end if |
| 9: end for |
| 10: end if |
| 11: end for |
| 12: for each |
| 13: |
14:
15:
|
| 16: for each |
17:
18:
19:
20:
21:
22: |
23:
24:
25: end for |
| 26: |
| 27: end for |
After establishing the zero-siphon system, the accessibility model developed in
Section 3.2 is used to assess the resilience performance of both systems under the same disruptive event scenario. We use accessibility to define
as the resilience index of the airport cluster under event
, the equation is as follows:
where
t1 indicates the moment at which the disruptive event starts,
t2 indicates the moment at which the disruptive event ends, and
x indicates the type of disruptive event (see
Section 5 for specific types).
indicates the accessibility of airport cluster
C with event type
x at time
t, the cluster’s accessibility is computed as the mean value of the accessibility indices of all constituent airports. The types of disruptive events are primarily classified into the following three categories:
- (1)
Randomly destroy an airport in a siphon area.
- (2)
Destroy the airport with the highest passenger throughput in the siphon area.
- (3)
Destroy the top two airports in terms of passenger throughput in the siphon area.
The occurrence time of the disruptive event is taken from the period when more passengers travel, without considering the early morning and late-night periods when only a few passengers travel. The current aviation accessibility is provided by flights in the coming hours because it takes time for passengers to travel from the city center to the airport. Therefore, the occurrence time of destructive events is taken between 9:00–13:00 and 14:00–18:00. Under the same disruptive event, the difference in resilience performance between the real system and the zero-siphon system can be quantified by Equation (9).
It reflects the extent to which the resilience of the airport cluster is affected by the siphon effect.
4. Case Study and Results
4.1. Data Source and Building a Zero-Siphon System
We explored a method for identifying the lowest-cost travel routes and defined various performance indicators. To investigate the impact of hub airports on smaller surrounding airports in an airport cluster, the previous section proposed a zero-siphon system to facilitate a comparative analysis of the siphon effect and resilience of the current system. This section focuses on the data sources relevant to the study and presents an extensive analysis of the experimental components.
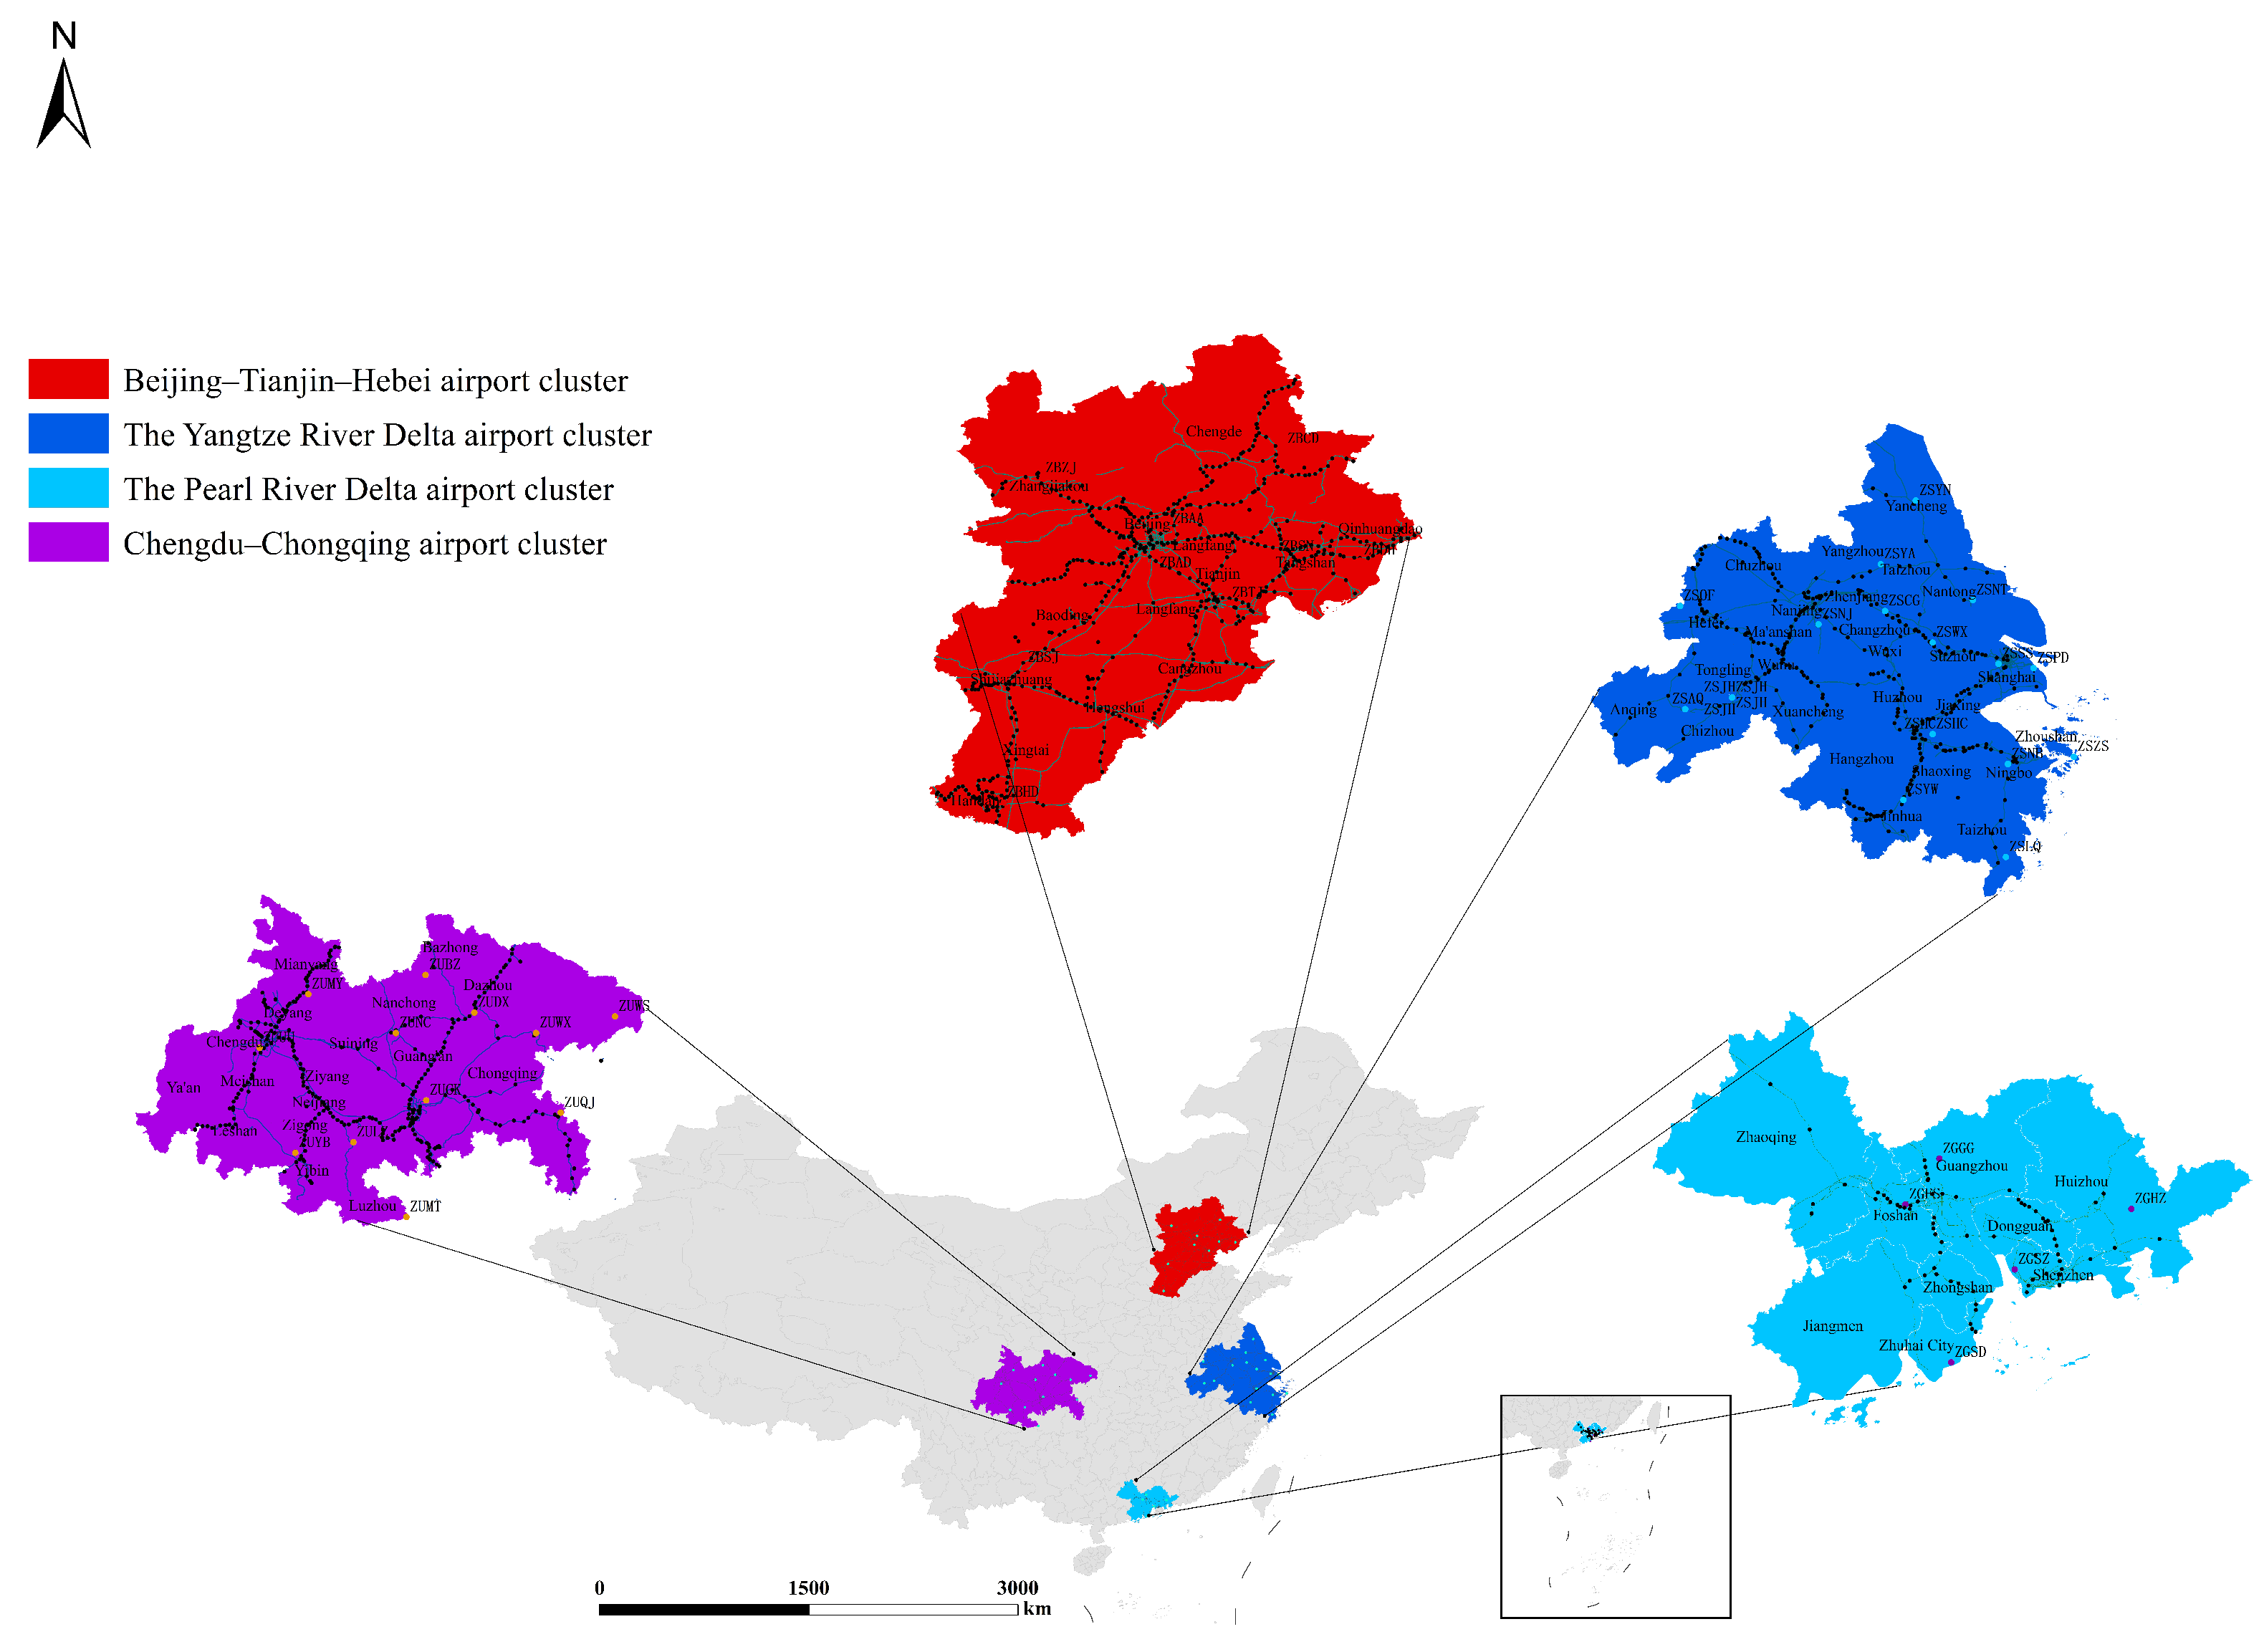
As illustrated in
Figure 4, China has four major airport clusters: Beijing–Tianjin–Hebei cluster, the Yangtze River Delta cluster, the Pearl River Delta cluster, and the Chengdu–Chongqing cluster. The location of the airport and the HSR station is shown in
Figure 4, with the black dots representing the HSR station and the colored dots representing the airport. These clusters are situated within economically developed urban agglomerations with strong demand for air travel. Owing to the unbalanced development between cities, a significant airport siphon effect exists within these clusters. This study focuses on Mainland China, which encompasses 352 cities, 235 airports, and 3020 train stations. The data required for this study included city population, geographic coordinates, flight schedules, train schedules, and geographic locations of airports and train stations. Our study utilizes six months of data from 27 October 2019, to 28 March 2020, obtained from the pre-flight planning management system, covering the winter flight schedule. Flight schedules follow a weekly cycle with stable volumes. And experiments show no major weekday accessibility differences. Therefore, we use Monday flight plans (excluding international flights) as the baseline. This avoids weekends, holidays, pandemics, or Spring Festival travel effects. This ensures the data avoid potential biases in the experimental results. Geographical locations for cities and train stations were sourced from Baidu, while population, GDP, and other demographic information were obtained from city-published “Statistical Yearbooks.” Airport grades were classified according to annual passenger throughput. Train schedule data are available from the official China Railway website.
Table 1 presents a sample of flight schedules, including flight numbers, departure airports, destination airports, departure times, and arrival times. In the search for the lowest-cost journey, the departure and destination airports listed in this table are used to define the passengers’ air travel routes, whereas the departure and arrival times help identify flights with the shortest travel duration. By filtering for minimal air travel time, passengers can more conveniently select flights with the shortest duration.
Table 2 presents a sample of train schedules obtained from the official China Railway website, which were primarily used to identify the ground routes with the shortest travel times. These data include the number of trains, intermediate stations, arrival times, departure times, stopping durations, and total travel time. Passengers can use information on train stops, city names, and airports to select trains that reach airport cities. Departure and arrival times allow passengers to coordinate their travel schedules, whereas travel-time data are crucial for selecting the shortest ground travel routes.
Before conducting the study, several assumptions were made regarding the variables. We assumed that flight schedules have minimal daily variation; therefore, only Monday’s schedule was selected for the analysis. The train schedules were the same every day, and we set the observation period from 6 a.m. to midnight, with departures occurring at 15-min intervals. Additionally, we assumed a check-in processing time of 40 min for passengers at airports and a maximum waiting time of 120 min.
4.2. Analysis of the Siphon Effect of Airport Clusters
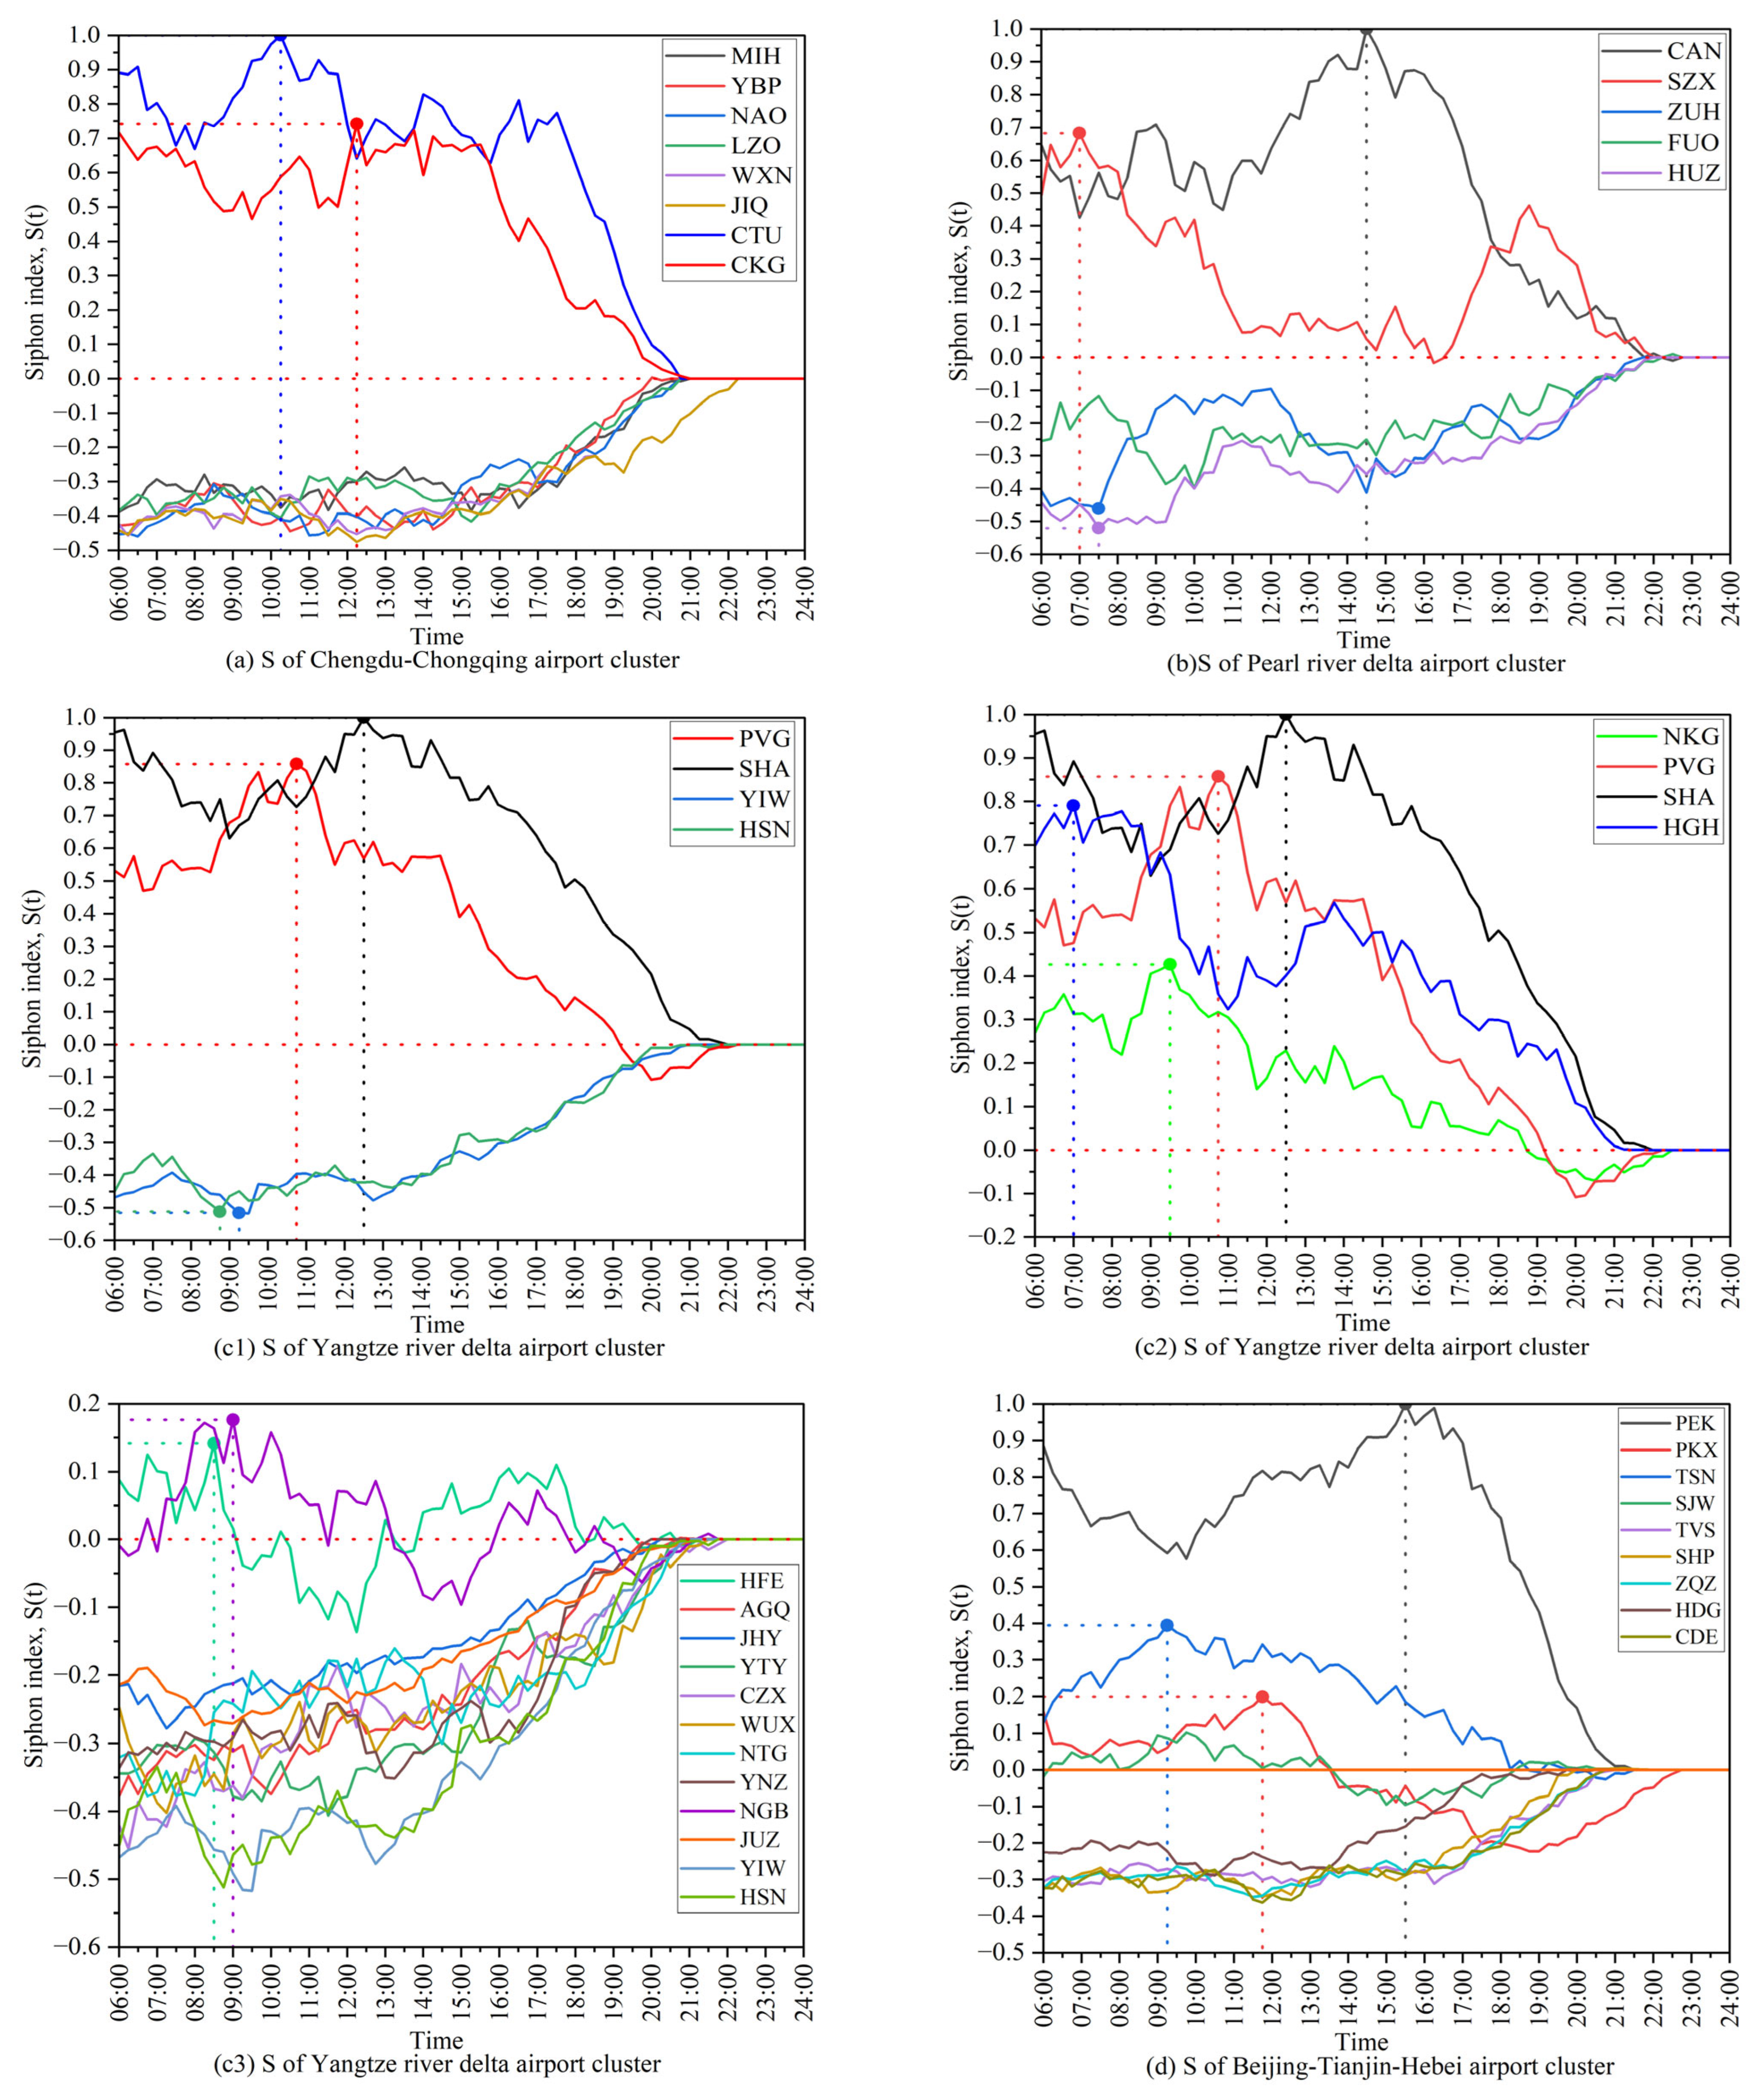
In the airport siphon effect area, the siphon index S represents the influence of an airport on its surrounding area. A higher S value indicates a stronger siphon effect exerted by the airport on neighboring airports within the airport group. This study investigates the siphon index based on four major airport clusters in China. The experimental data were sorted, and
Figure 5 shows the airport siphon effect index.
Figure 5 illustrates the siphon index of four airport clusters in China at different times. Each of the four airport clusters has at least one hub airport; however, the siphon effect of hub airports on regional and small airports shows variation across distinct airport clusters. In the Chengdu–Chongqing airport cluster, Chengdu Shuangliu International Airport (CTU) and Chongqing Jiangbei International Airport (CKG) showed obvious positive siphon effects on other airports. The two curves representing these airport siphon indices remain largely distinct throughout the day, indicating that CTU exerts a stronger siphon effect than CKG. Conversely, the siphon indices for the other airports in the cluster are negative, with Qianjiang Wulingshan Airport (JIQ) experiencing the most significant negative siphon effect. This suggests that passengers in the region prefer CKG to their local airport JIQ, as a departure point. In the Beijing–Tianjin–Hebei region, both Beijing Capital International Airport (PEK) and Tianjin Binhai International Airport (TSN) demonstrate significant siphon effects throughout the entire day, while Beijing Daxing International Airport (PKX) exhibits this phenomenon specifically before 13:30. PEK leads in terms of passenger traffic, policies, and infrastructure, resulting in the highest siphon index within the group for most days, followed by TSN. However, except for PEK, the positive siphon indices of these airports do not exceed 0.4. The siphon effect trend chart shows that PEK reaches its peak siphon index at approximately 15:30, indicating that most passengers prefer this flight as their first option. The negative siphon effects on other airports begin to subside around 17:00, indicating that the differences in flight volumes among airports are gradually narrowing and the siphon effect is also weakening.
In the Yangtze River Delta region, which is characterized by numerous large-scale airports with some of the highest domestic throughput, six airports predominantly exhibit positive siphon effects during most operating periods, while Ningbo Lishe International Airport (NGB) and Hefei Xinqiao International Airport (HEF) demonstrate alternating patterns of both positive and negative siphon effects throughout the day. This phenomenon is closely associated with passenger travel behavior patterns during corresponding flight schedules, where business travelers predominantly follow morning-departure and evening-return itineraries while leisure travelers tend toward flexible trip arrangements. Shanghai Hongqiao Airport (SHA) displays the strongest impact. Pudong Airport (PVG) follows closely behind. Since international flights are excluded from the selected flight schedules for this analysis, SHA exhibits better performance in terms of the siphon effect compared to PVG. Meanwhile, Nanjing Lukou Airport (NKG) benefits from its strategic geographical position in the northwest Yangtze River Delta, serving as the primary air travel hub for numerous surrounding cities (including Zhenjiang, Yangzhou, and Chuzhou) where local airports are either absent or offer limited flight options. As a result, NKG shows positive siphon effects in the Yangtze River Delta. The negative siphon indices for other airports remain between 0 and −0.5, like the Chengdu–Chongqing cluster. The siphon effect peaks of SHA are approximately at noon and then gradually diminishes. When multiple airports have positive siphon indices, the travel choices of passengers also increase; therefore, the Yangtze River Delta region has become one of the busiest areas for civil aviation passenger transport in China. In the Pearl River Delta region, CAN and SZX demonstrate positive siphon effects. However, a marked difference is observed in daily siphon index performance. SZX reaches its peak siphon index at approximately 7:00 a.m., indicating a higher passenger preference for SZX as a morning departure airport. CAN maintains a siphon index above 0.5 for most of the day, gradually decreasing from its peak around 15:30 time. As shown in the figure, during the 11:00–18:00 period, the siphon effect of SZX gradually weakens as CAN’s siphon effect intensifies. As two core hubs within the airport cluster, their siphon effect patterns indicate a strong direct competitive relationship between CAN and SZX during operations. However, Foshan Shadi Airport (FUO), Zhuhai Jinwan Airport (ZUH) and Huizhou Pingtan Airport (HUZ) experience significant negative siphon effects, with indices ranging between −0.1 and −0.5, making them the most severely affected airports among the four major airport groups. The performance of the siphon indices across the four airport clusters shows that wherever a hub airport exists, a siphon effect will occur, and its intensity varies based on the significance of the hub airport in that region. The greater the local importance of the hub airport, the more pronounced the siphon effect on the surrounding regional and small airports.
4.3. Analysis of Accessibility of Airport Clusters
Within an airport cluster, the siphon index S of each airport reflects its influence on the overall cluster. A higher S value indicates that airports contribute significantly to the air accessibility of cities within a region.
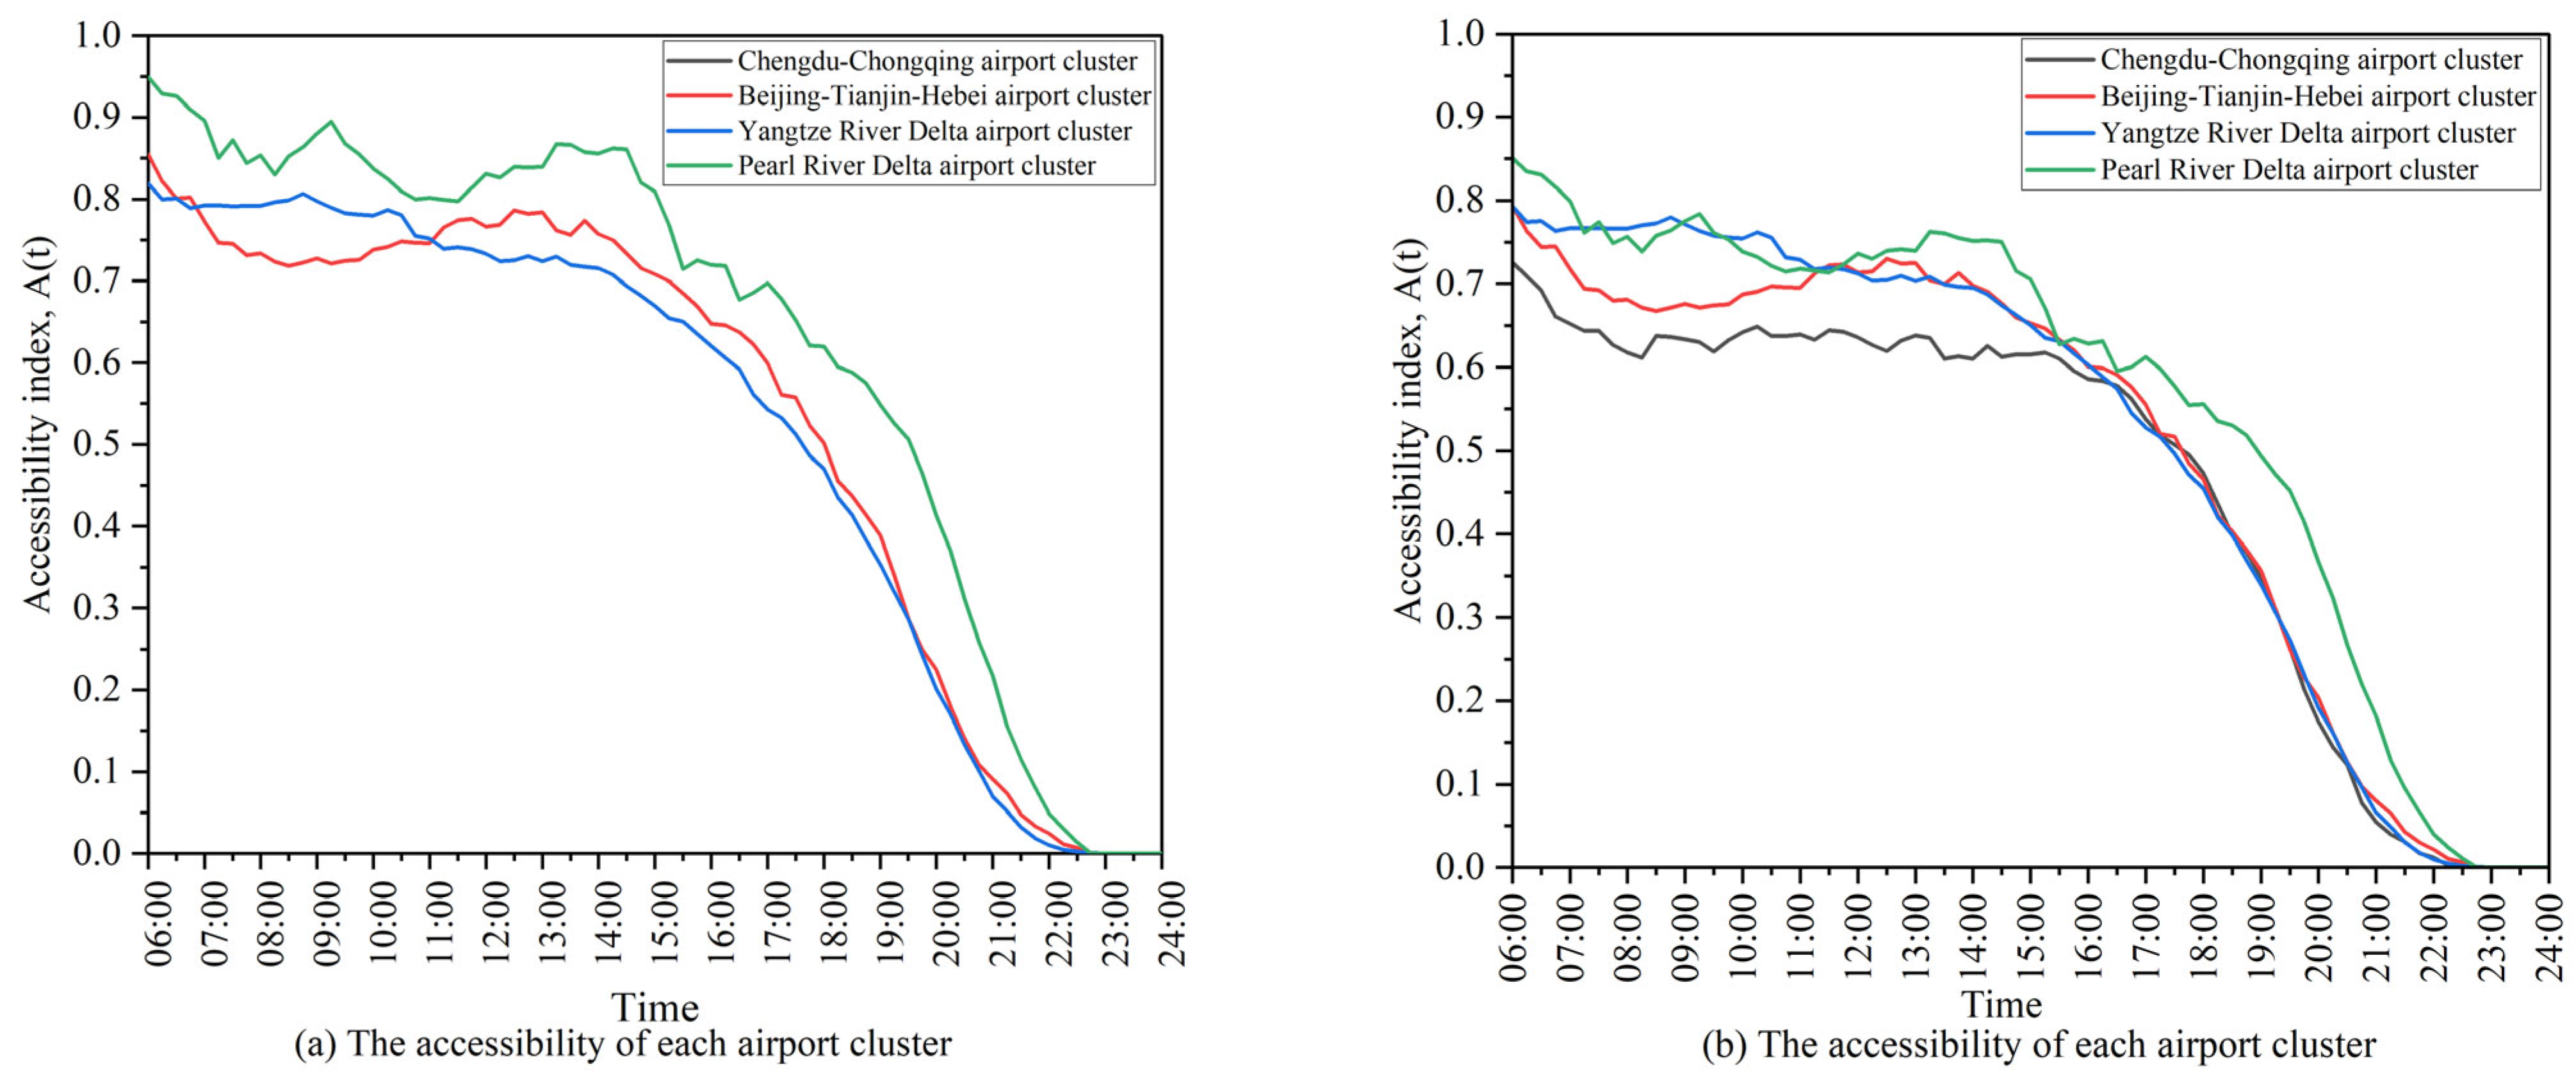
Figure 6 illustrates the changes in air accessibility over time for the four airport clusters under normal conditions and in the event of an airport attack.
Figure 6a shows the accessibility of each airport cluster under normal conditions, and
Figure 6b shows the accessibility of each airport cluster under disruptive time attack conditions. Air accessibility of an airport cluster is the average air accessibility of all airports within the cluster during a given period. Hub airports influence air accessibility to airport clusters. Generally, higher air accessibility at the hub airport leads to higher air accessibility for the entire airport cluster. As shown in
Figure 6a, the air accessibility of the Pearl River Delta airport cluster is the highest among the four clusters. The other three airport clusters show advantages in terms of accessibility at different times. The Beijing–Tianjin–Hebei and Yangtze River Delta regions intersect at 11:00, indicating that their accessibility is similar at that time. However, the Chengdu–Chongqing cluster shows the lowest performance owing to the differences in the scale and throughput of its hub airports compared to those in other clusters. After the disruptive events, the Pearl River Delta cluster experiences the most significant decline in accessibility, decreasing from approximately 0.85 to 0.75 (approximately 10% decrease). In contrast, the Yangtze River Delta cluster, with its multiple hub airports, experiences a smaller impact on overall accessibility from such events. The Beijing–Tianjin–Hebei and Chengdu–Chongqing clusters exhibit a slight change before and after the disruption. However, owing to the smaller scale of airports in the Chengdu–Chongqing region, its air accessibility remains the lowest at approximately 0.63. Therefore, the relevant units must ensure normal operations in this region in similar incidents. Overall, the air accessibility of airport clusters decreases to varying degrees after the disruptive events. From the cluster performance perspective, regions with multiple similarly sized airports have stronger resilience to sudden incidents than clusters with only a single hub airport. This is because when one airport is affected, passengers can quickly choose an alternative airport near the same destination, minimizing disruption to their travel plans.
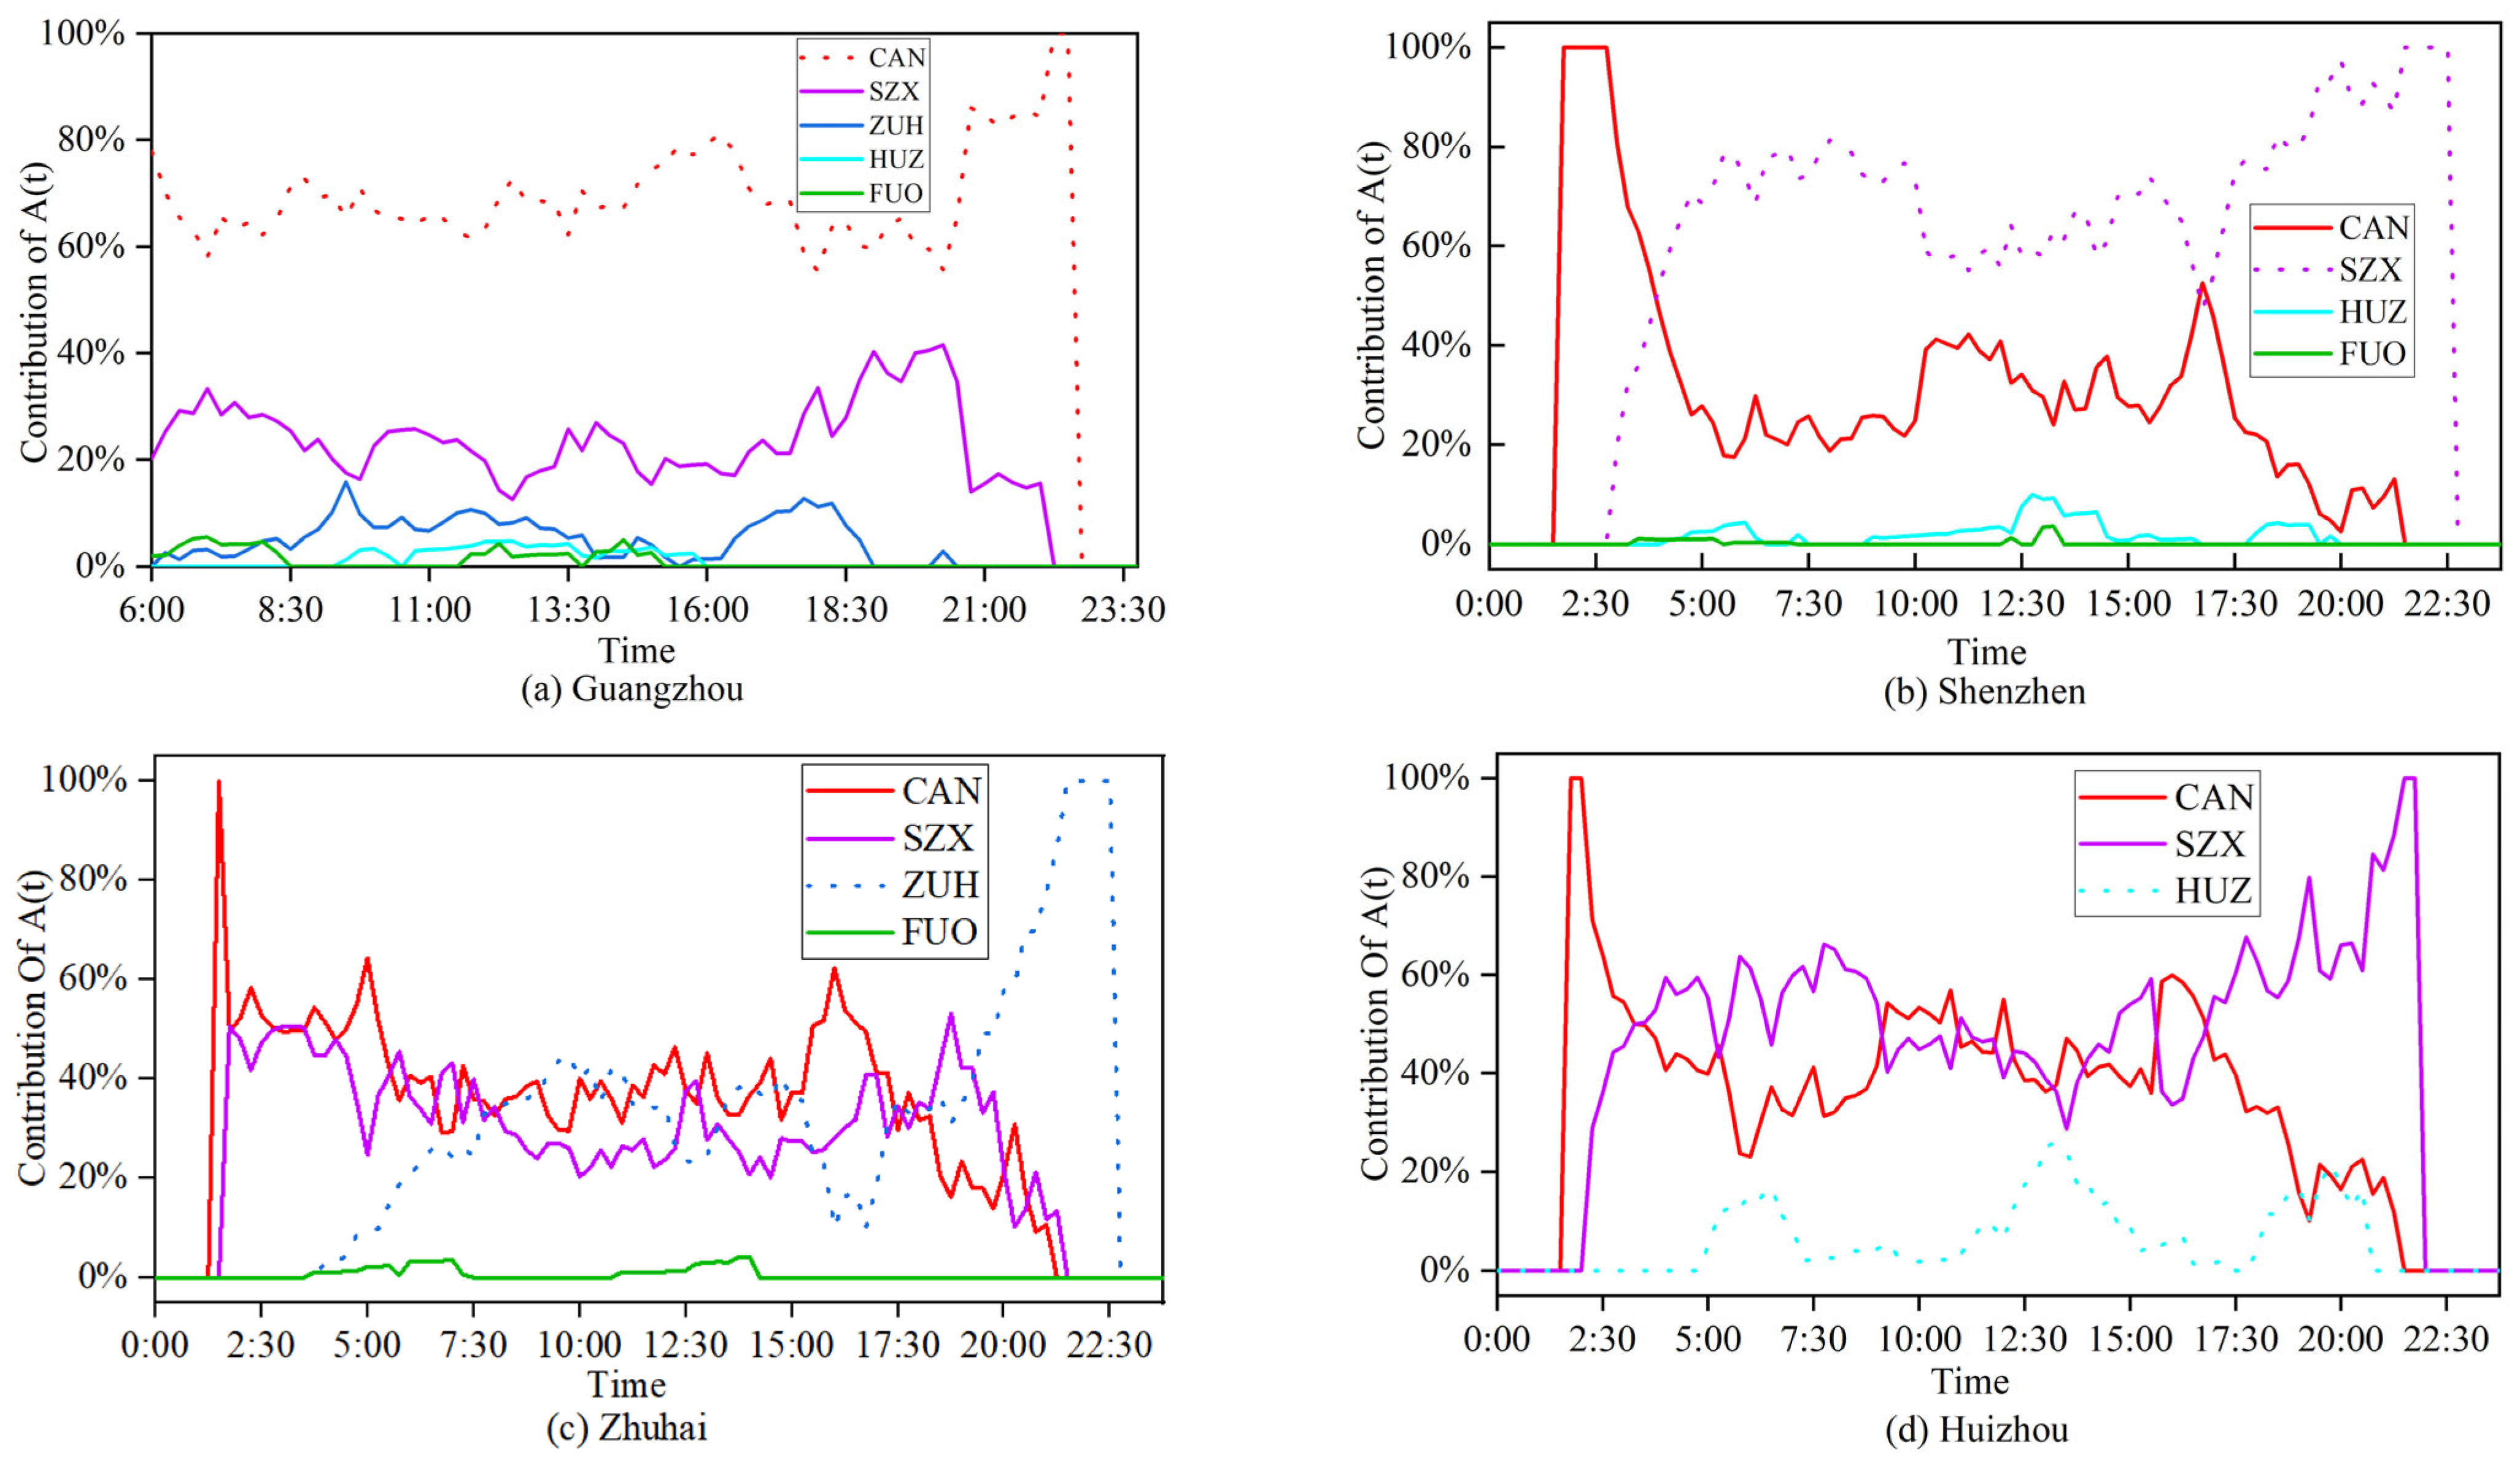
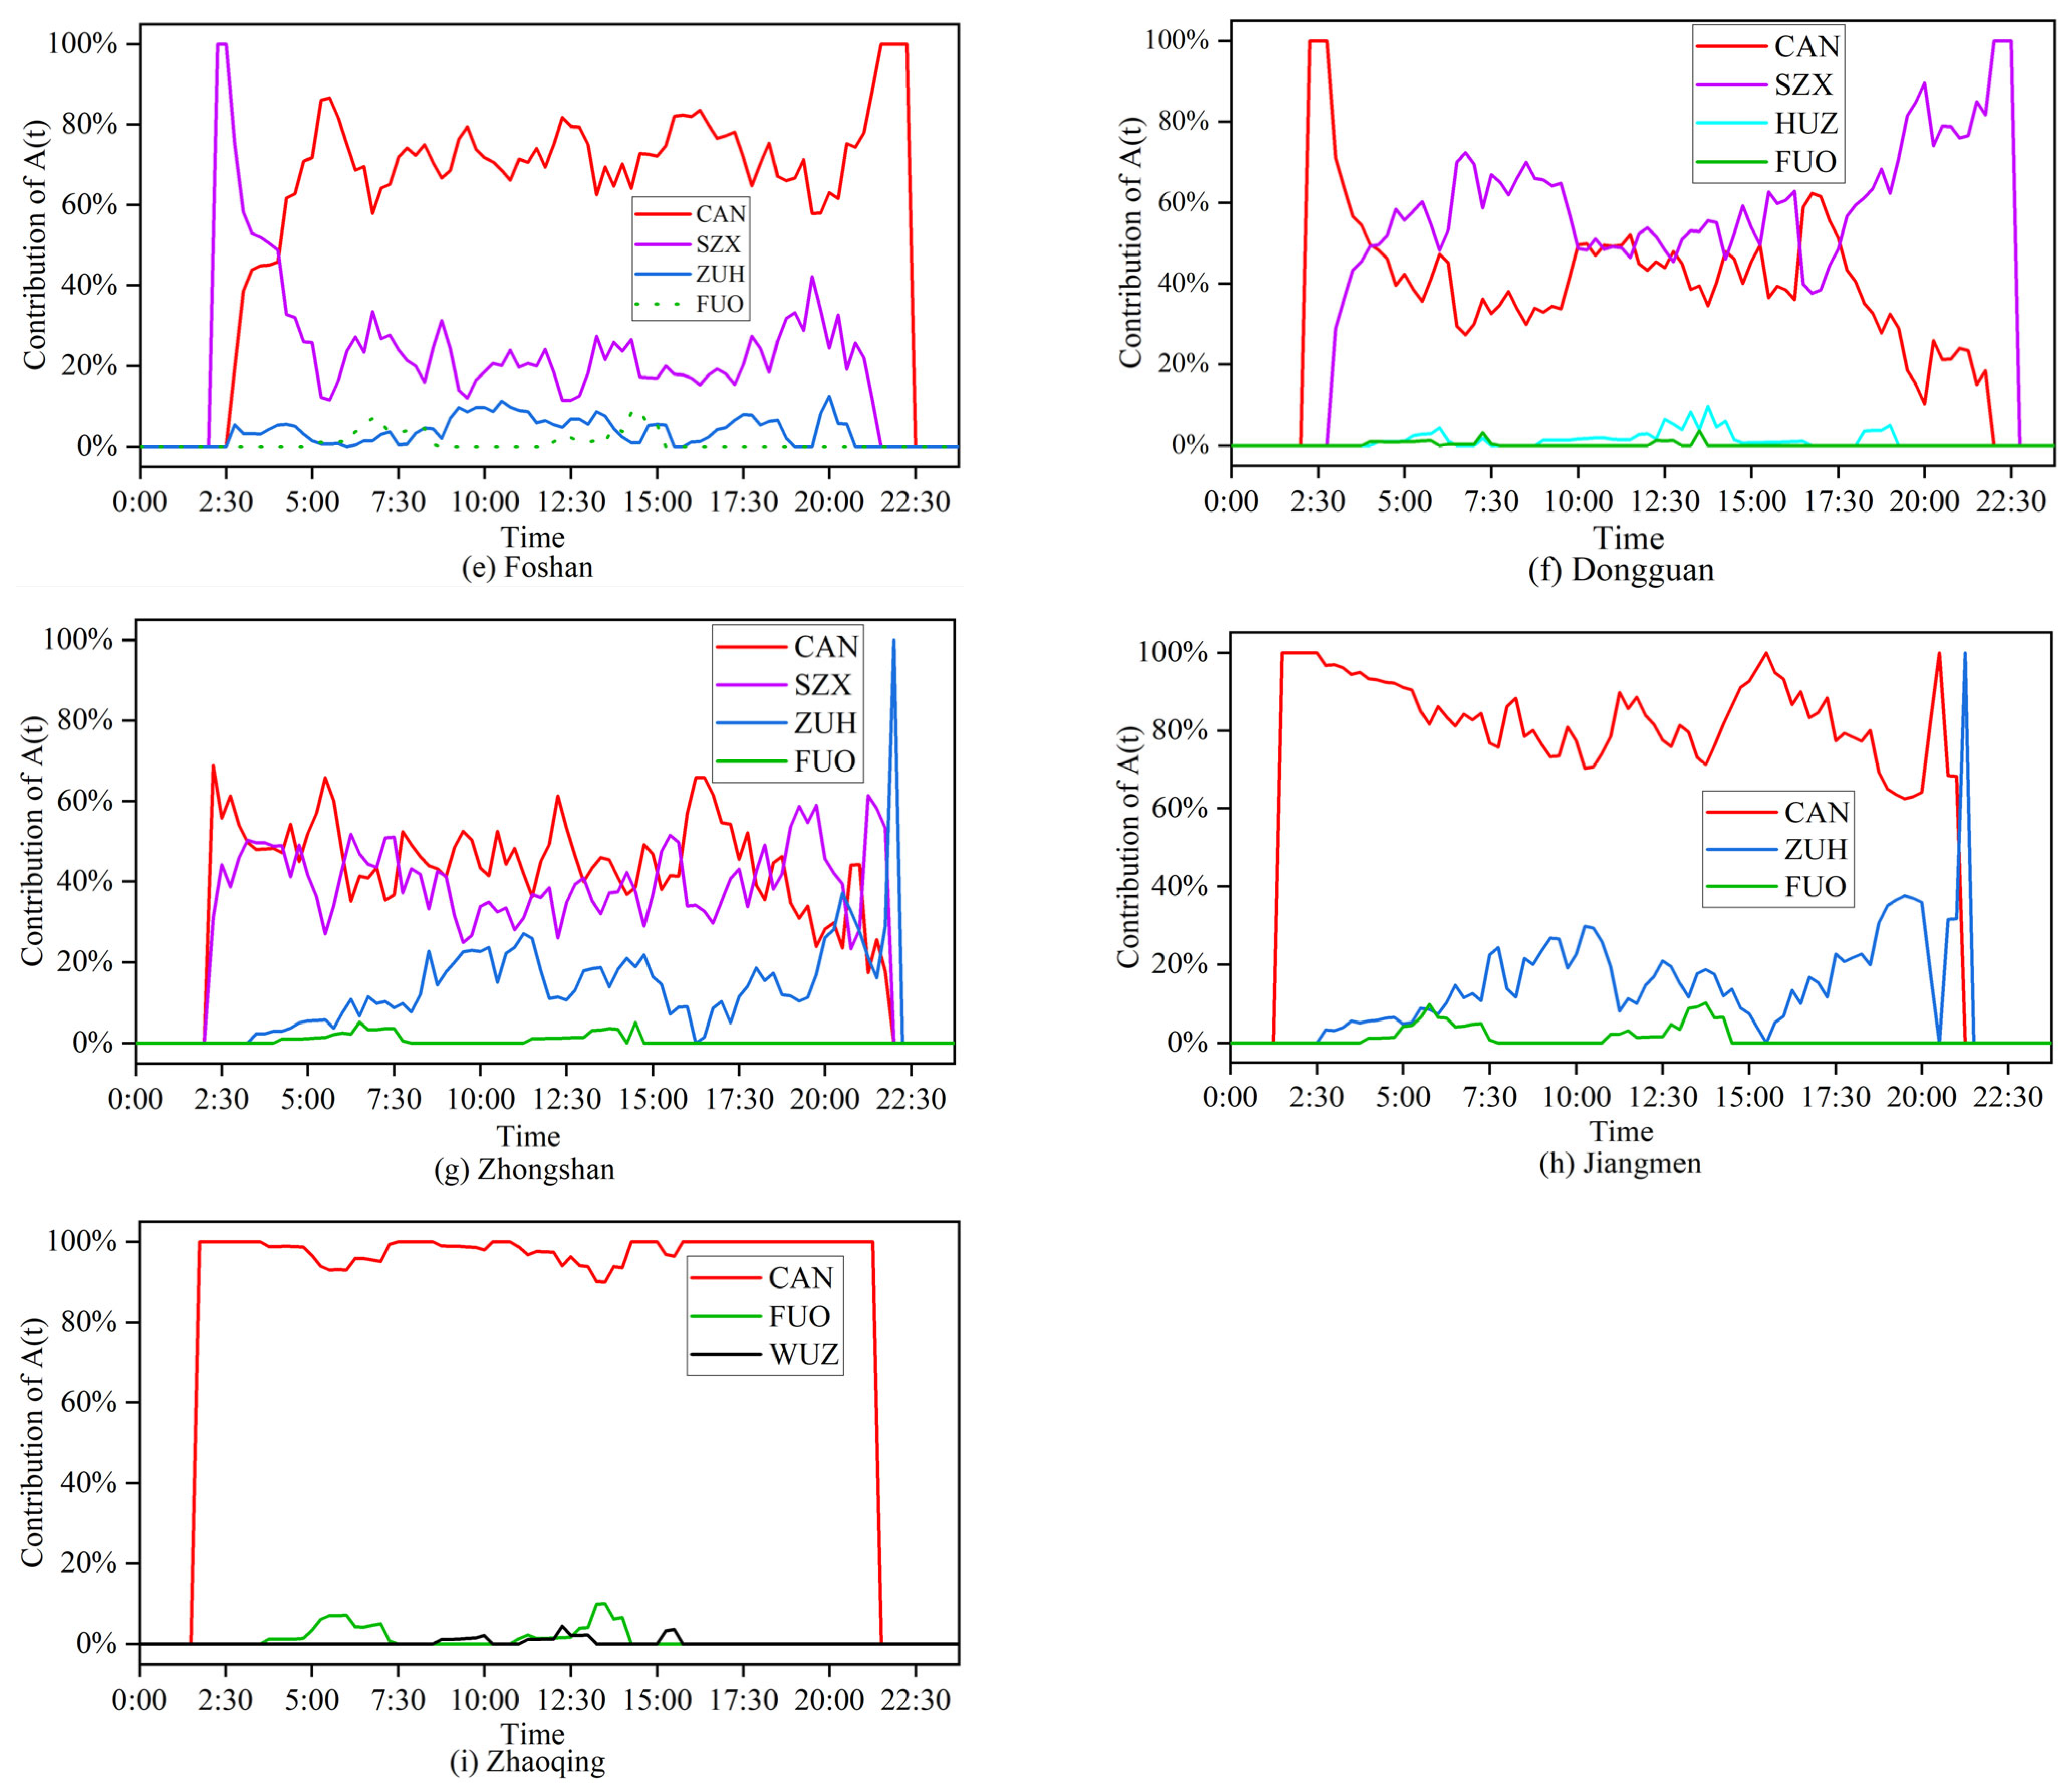
We evaluated the contribution rate of each airport to air accessibility in the cities to assess the significance of each airport within the Pearl River Delta airport cluster in various cities in the region.
Figure 7 shows the results.
As illustrated in
Figure 7, CAN and SZX are the primary contributors to air accessibility in the nine cities within the airport cluster for most of the day. Among the five cities with their own airports (
Figure 7a–e), only Guangzhou and Shenzhen consistently provide the majority of air accessibility. In contrast, HUZ and FUO contribute the least to the air accessibility of their respective cities, often showing negligible or even zero contribution rates at various departure times. This indicates that numerous passengers flow out of these cities, and most travelers choose flights from larger hub airports rather than from local airports. Compared with other cities, the loss of passenger flow in Zhuhai is relatively low. Before 18:30, air accessibility provided by ZUH in Zhuhai is comparable to that of CAN and SZX, after which ZUH becomes the main provider. For the four cities without airports (
Figure 7f–i), air connectivity is largely provided by airports in other cities within the region, with CAN being the dominant provider. However, FUO and HUZ contribute less than 10% of air access in these cities. The air accessibility of Dongguan is primarily supported by CAN and SZX, with SZX playing a more significant role before 10:00 and after 18:00. Zhongshan stands out because of its proximity to the ZUH, which influences its air accessibility more than the contributions from CAN and SZX.
Although ZUH is the smallest of the three airports, it still contributes significantly to Zhongshan’s air accessibility. Jiangmen and Zhaoqing rely heavily on CAN for air connectivity. Jiangmen’s situation is similar to Zhongshan; however, because it is closer to ZUH and farther from both CAN and SZX, SZX is not a feasible option for departing Jiangmen passengers. Despite its smaller size, CAN’s larger capacity makes its contribution to Zhongshan’s air accessibility greater than that of the ZUH. Zhaoqing, close to CAN, depends almost entirely on CAN for air connectivity.
5. Resilience Analysis
The contribution rate of airports to cities in the region indicates that passengers prefer CAN and SZX as departure airports, resulting in a pronounced negative siphon effect on other airports, specifically ZUH, HUZ, and FUO. The primary reason for this negative siphon effect is the unequal distribution of airport flight resources, which are heavily concentrated in CAN and SZX. This concentration affects both the accessibility and resilience of the entire airport cluster. To address these issues, a resilience analysis is conducted using the methods outlined in
Section 3.3 to create a zero-siphon effect system. The Pearl River Delta airport cluster consists of nine cities and five airports: CAN, SZX, ZUH, HUZ, and FUO, located in Guangzhou, Shenzhen, Zhuhai, Foshan, and Huizhou, respectively. The remaining cities—Zhaoqing, Jiangmen, Zhongshan, and Dongguan—do not have their own airports. For Zhaoqing, coverage by CAN and FUO ensures that the population is evenly distributed between Guangzhou and Foshan. Similarly, Zhongshan, covered by CAN, SZX, ZUH, and FUO, sees its population spread among Guangzhou, Shenzhen, Zhuhai, and Foshan. According to the statistical yearbooks released by each city, the resident populations and GDP in the Pearl River Delta airport cluster are in
Table 3, and the distribution of resident population in the Pearl River Delta airport cluster is in
Table 4:
There are 1710 flights involving the Pearl River Delta airport cluster in the original flight schedule, and the original flight schedule is redistributed based on the airport throughput. A new flight schedule is obtained, and the proportion of the flight volume of each airport in the Pearl River Delta airport cluster in the new flight schedule is in
Table 5:
This study uses the Pearl River Delta airport cluster as a case study to examine the impact of the airport siphon effect on the air accessibility of airport clusters. The following three cases are established to simulate disruptive events, considering both timing and intensity.
Case i: Random disruption between 9:00 and 13:00;
Case i: Random disruption between 14:00 and 18:00;
Case ii: CAN disruption between 9:00 and 13:00;
Case ii: CAN disruption between 14:00 and 18:00;
Case iii: CAN and SZX disruptions between 9:00 and 13:00;
Case iii: CAN and SZX disruptions between 14:00 and 18:00.
In these cases, an airport disruption is defined as the removal of flights from the airport’s schedule.
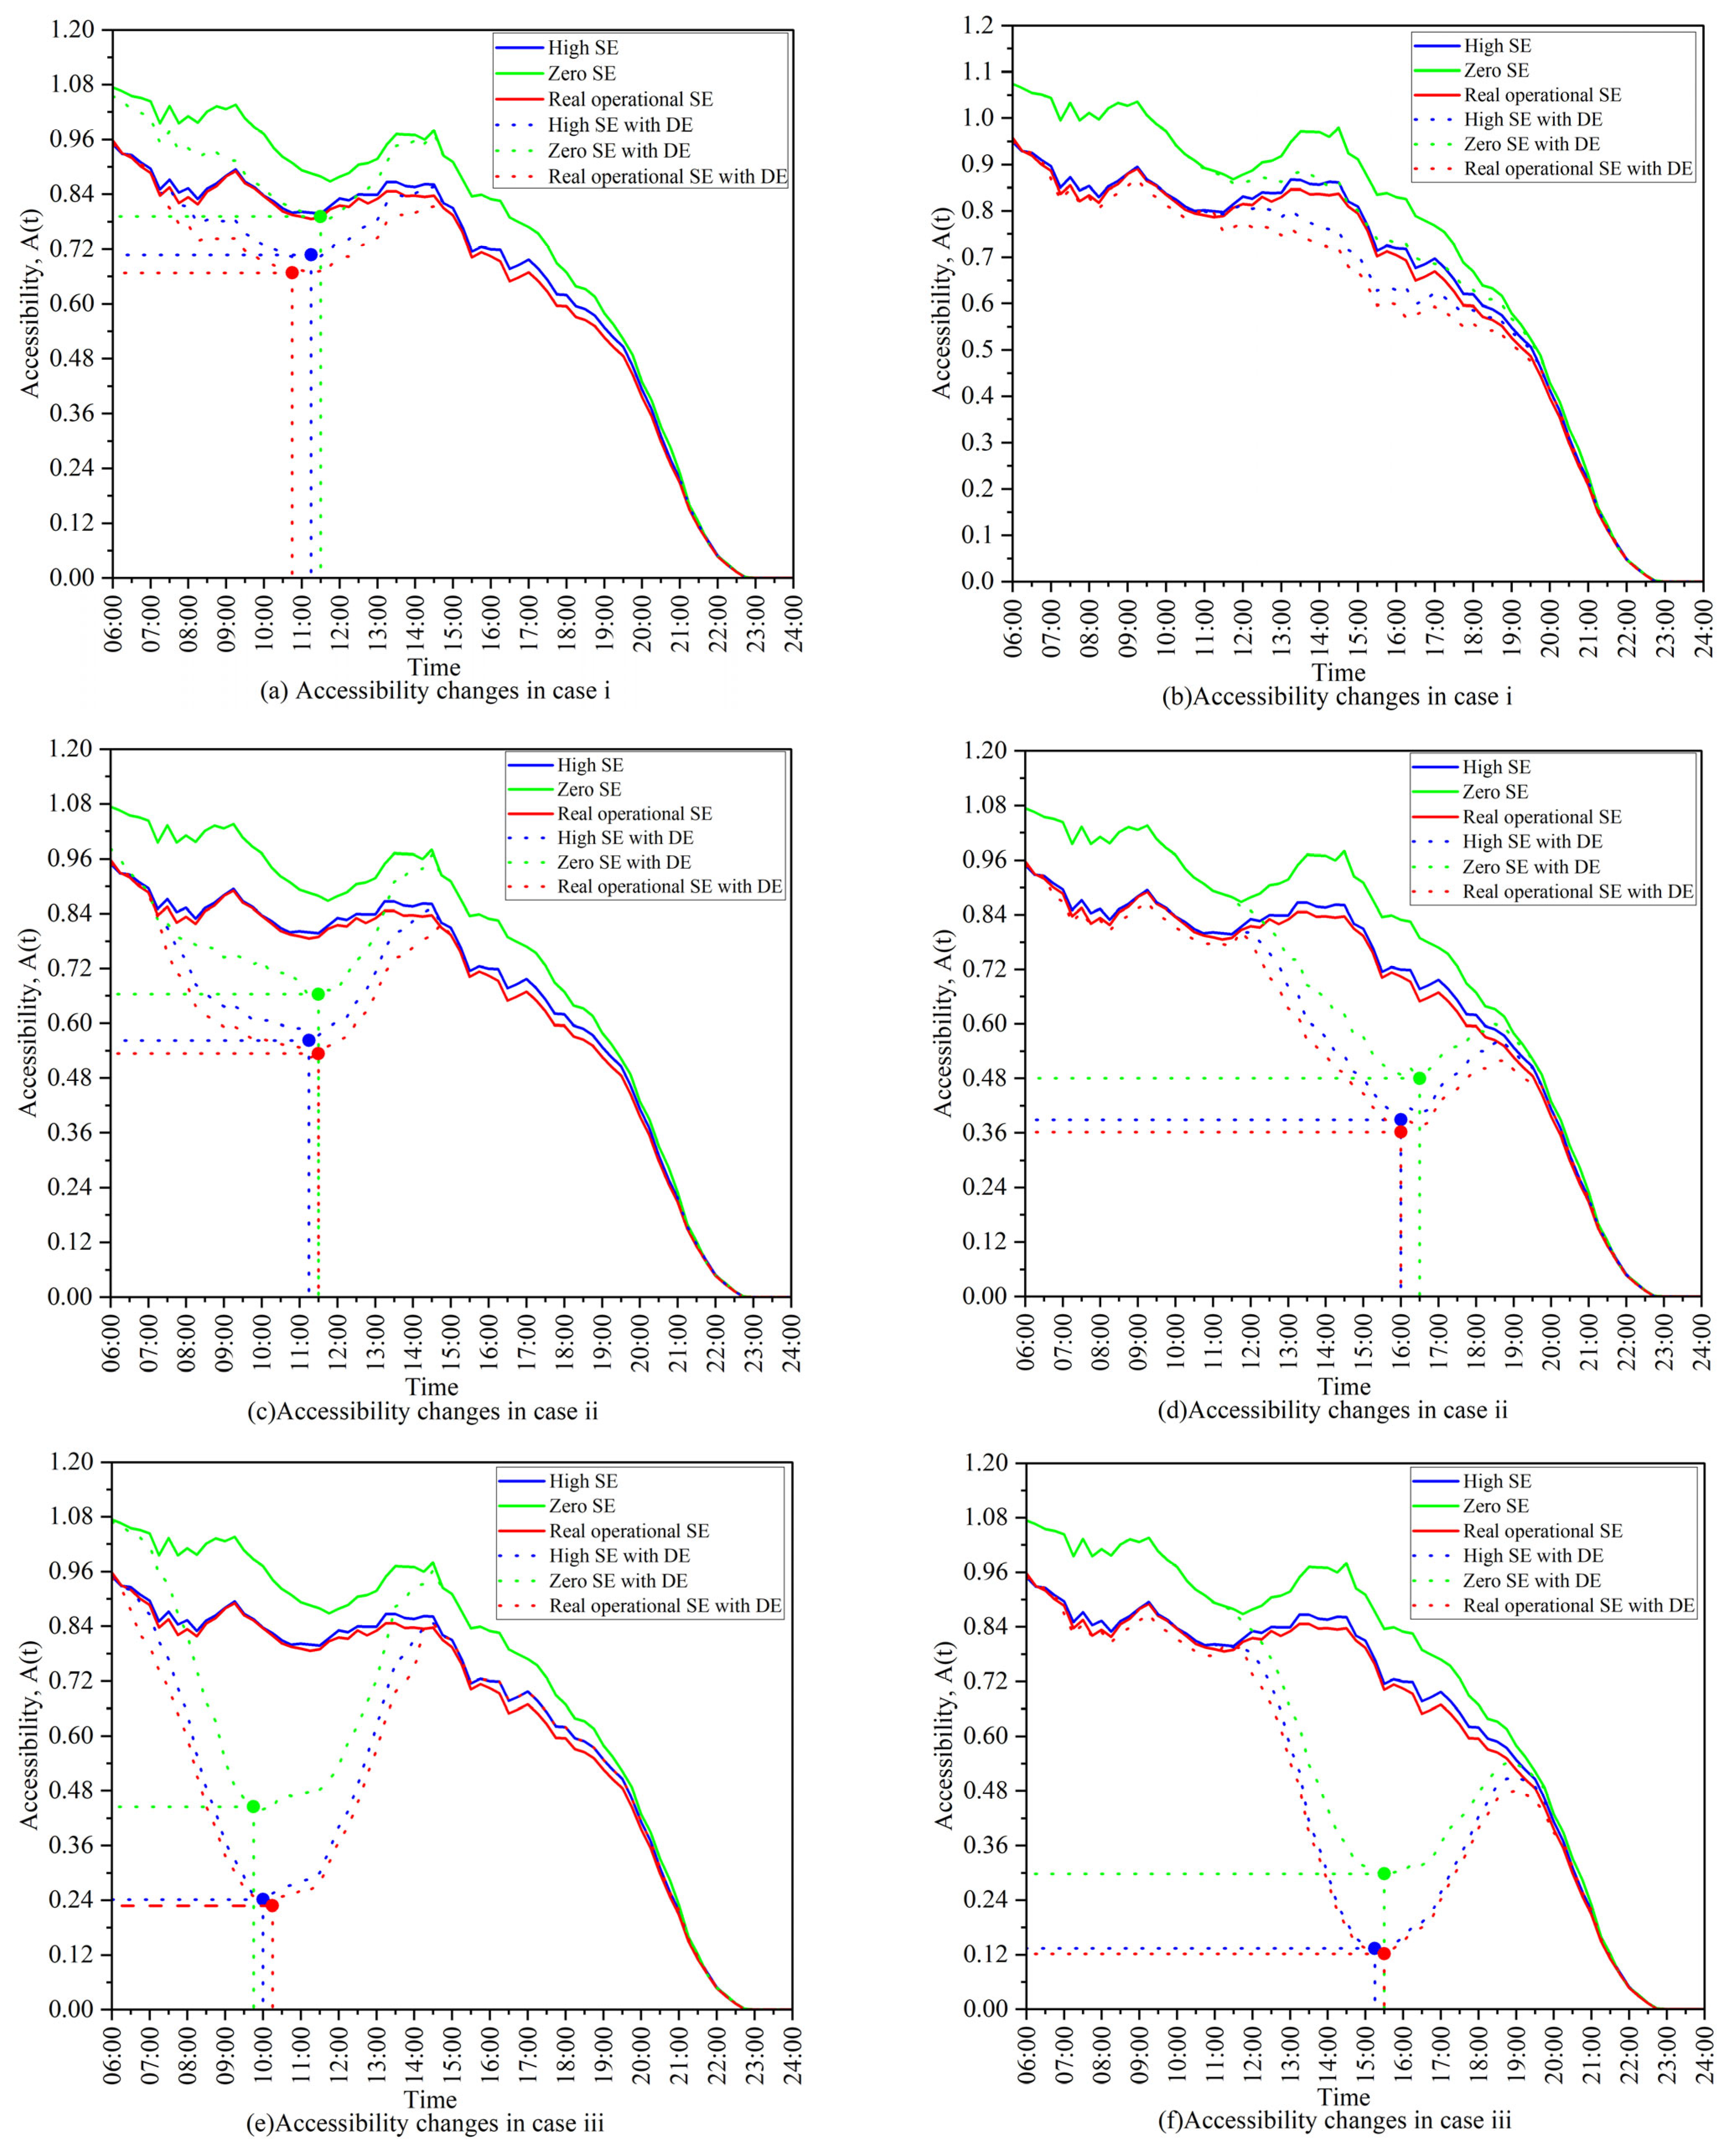
Figure 8 shows the variation in average travel time-based air accessibility for cities in the Guangzhou siphon area under three cases.
Figure 8 shows the air accessibility of the Pearl River Delta airport cluster for different periods when subjected to disruptive events. In the optimized flight schedule, while the number of flights, destination airports, departure times, and arrival times remain unchanged, alterations in the departure airports result in notable differences from the original schedule. The graph illustrates that the overall air accessibility of the airport cluster has improved compared to the original schedule. Furthermore, this accessibility trend gradually stabilizes as the number of flights decreases throughout the day.
According to the analysis of the real operational siphon system, its accessibility shows minimal difference compared to the high siphon system. In Case i, the air accessibility of the zero-siphon system is maintained at almost the normal level of the original system after experiencing an attack, both the high siphoning system and the real operational system experience a decline in accessibility, but the decrease in air accessibility is minimal, there is an approximate 6% gap in accessibility between the two systems. Under Case ii conditions, when the primary airfields within an airport cluster are attacked, the three system’s air accessibility declines substantially. The accessibility gap between the high siphon system and the real operational system has narrowed. When both CAN and SZX are closed simultaneously, the accessibility loss between the two systems becomes nearly identical. It indicates that in the historical flight execution records of the Pearl River Delta region, operational flights are predominantly associated with CAN and SZX, which confirms that CAN and SZX serve as the primary providers of regional accessibility. Notably, during the attack period from 14:00 to 18:00, the reduction in air accessibility is significantly greater than that during the period from 9:00 to 13:00. When both major airports sustain damage, air accessibility decreases to its lowest point at approximately 0.14. The contribution rate of the airport siphon effect (
Figure 7) further highlights the dominant role of hub airports in influencing the siphon effect across the entire airport cluster.
An analysis of the accessibility curves for Case iii reveals that when the optimized flight plan is disrupted by the shutdown of two major airports, the resulting loss in air accessibility is less severe compared to the original flight plan under equivalent conditions. The results of the resilience analysis indicate that the airport siphon effect diminishes regional resilience, and the impact becomes more pronounced as the intensity of destructive events increases.
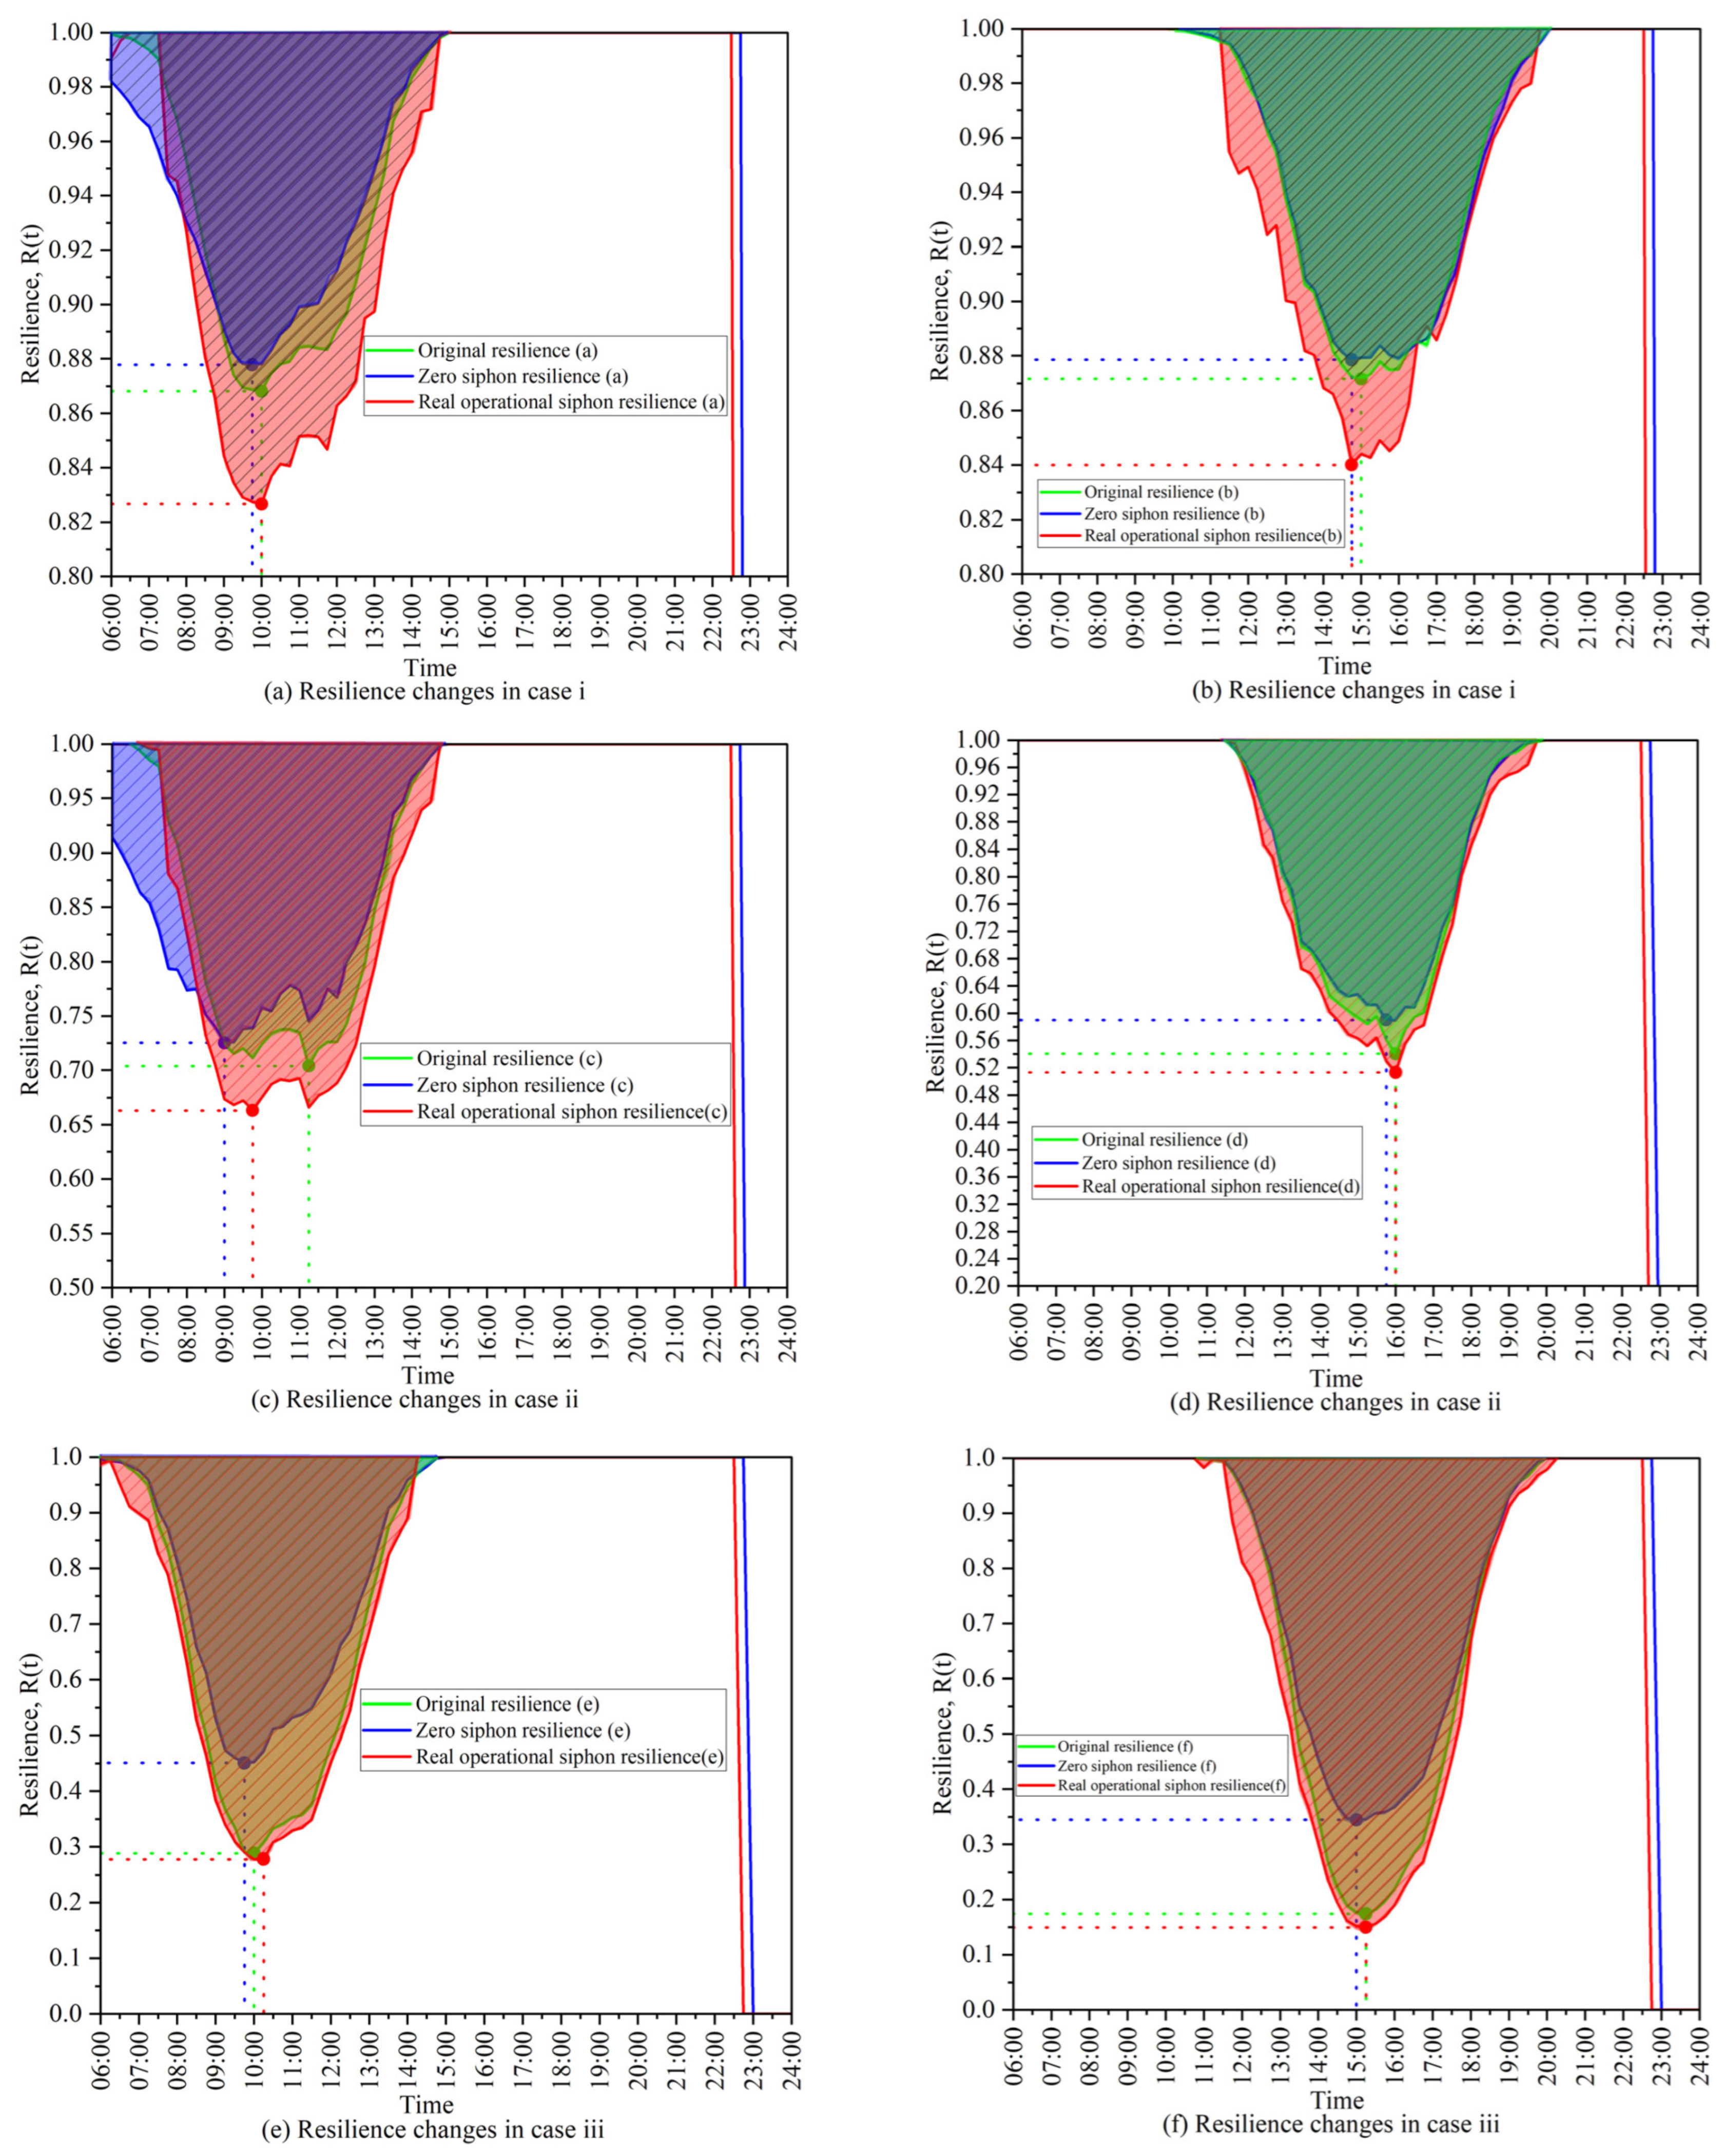
Resilience maps of airport clusters were generated for three distinct cases to examine the variations in resilience across different cases.
Figure 9 illustrates the resilience performance of three systems for the different cases. The shaded areas indicate resilience losses following disruptive events, and the smaller shaded areas signify a lower resilience loss, reflecting a stronger resilience performance of the airport cluster. In the case of random attack, the real operational system experiences greater resilience loss compared to the other two systems. During the period of highest resilience loss, the real operational system’s resilience degradation is 3% more severe than the high siphon system. A key factor is that in real operational flight schedule, certain scheduled flights may be canceled due to weather conditions, airline operational factors (such as seat occupancy rates or aircraft maintenance), etc. These cancellations can reduce airport accessibility and influence the overall resilience of the airport system.
When CAN is damaged and closed, the optimized flight plan shows better recovery resilience than the other two systems. If all hub airports within an airport cluster are closed, the resilience of the optimized flight plan significantly surpasses that of the original flight plan and real operational plan.
Figure 9 shows the resilience changes in Case iii; the performance varies depending on the time and extent of the attacks. For example, when CAN and SZX are attacked between 9:00 and 13:00, the original flight plan exhibits only approximately 28% of its worst-case resilience performance compared with normal conditions. In contrast, the optimized plan maintained approximately 45% of its worst-case resilience under similar conditions, showing a 17% improvement. During the attack window from 14:00 to 18:00, the resilience loss is more pronounced, with the performance in Case iii (f) being 10% worse than that in Case iii (e). Specifically, the resilience in Case iii (e) remains nearly the same at 98% under normal conditions, whereas in Case iii (f), it declines to 85% under the same conditions. However, the real operational flight schedule shows minimal differences in resilience performance compared to the original flight schedule, further manifesting the central role of CAN and SZX in airport operations.
Under all three cases, the system’s resilience loss mainly consists of two parts. The first part occurs during the airport’s regular daytime operating hours, while the second part happens after 22:30. These two types of resilience loss have different causes. During normal hours, the loss is mainly due to airport closures caused by unexpected events. In all cases, the resilience loss of the real system, which is affected by the siphon effect, is greater than that of the zero-siphon system. The other part of system’s resilience loss is after 22:30. Most flights in the airport cluster have already ended for the day; this leads to a sharp drop in flight accessibility, and the system’s resilience also declines rapidly. However, this negative impact can be alleviated through the strategic redistribution of flights within airport clusters. Such measures enhance resilience and create development opportunities for smaller and medium-sized airports within the region, potentially transforming a vicious cycle into a virtuous cycle.
6. Conclusions
This paper introduces a new framework for assessing the impact of the airport siphon effect, and proposes a method for determining the lowest-cost journey by accounting for variations in departure times. Then, we define an airport siphon effect index based on the attractiveness of airports to passengers and select four airport clusters based on the distribution characteristics of this index. We extensively analyze the Pearl River Delta airport cluster based on its strong airport siphon effect and suggest an ideal strategy for reducing this effect. To evaluate the resilience of the Pearl River Delta airport cluster, we set up three cases simulating disruptive events and analyzed variations in resilience varies under high and low airport siphon effects.
The concept of the lowest-cost journey encompasses the origin airport, and passengers opting for this journey inherently favor the original airport. During the search for the lowest-cost journey, passengers select airports of different origins depending on their departure time. An airport’s ability to provide greater aviation accessibility affects passenger choices, causing its attractiveness to vary with departure times. For instance, while SHA and PVG show positive siphon effect indices, they briefly drop below zero between approximately 19:00 and 22:00. In contrast, NKG and HGH maintain positive siphon indices throughout the day, although their values fluctuate with departure times.
Furthermore, we investigate the impact of the airport siphon effect on the Pearl River Delta airport cluster. Under the airport siphon effect, for HUZ and FUO, their flight volumes are much smaller than local demand, which causes the main source of air accessibility for HUZ and FUO to be CAN and SZX rather than their own airports. This reduces the resilience of travel time-based aviation accessibility. As the intensity of the disruptive events increases, the impact of the airport siphon effect on resilience reduction becomes more apparent.
This study has implications for scholars and policymakers. First, the optimization of the airport siphon area should be examined to reduce the impact of the airport siphon effect because the airport siphon effect reduces the resilience of airport clusters. Researchers should also consider the airport siphon effect when optimizing airport flight schedules. In regions experiencing severe airport siphon effects, flight schedule allocations should incorporate strategies to mitigate these effects. Otherwise, these areas will fall into a vicious cycle of hub airports operating while being overloaded and other surrounding airports becoming increasingly idle. To minimize the impact of regional hub airports on the development of surrounding airports, the government should financially support airlines that allocate capacity to smaller airports. By offering targeted route subsidies, this approach would alleviate operational pressures on hub airports and promote a more equitable distribution of flights. Furthermore, inspired by relevant research [
36], small airports’ functional departments should engage in discussions with other stakeholders that benefit from air transport services, including chambers of commerce, hotel groups, travel agencies, foreign investment offices, and local government agencies. Such cross-sector collaboration can provide comprehensive support for airline operations, enhance the attractiveness of small airports to carriers, and ultimately incentivize airlines to allocate more capacity to regional airports. This would help smaller airports grow without impacting airline profitability.
This study has some limitations that indicate avenues for future work. First, although our model has a good scalability, the case study only considered travel time when considering travel costs. Thus, only travel time is considered when quantifying the attractiveness of airports to passengers. Considering more factors or using real passenger data can improve the accuracy of measuring an airport’s attractiveness. Second, when simulating disruptions, the possibility of replacing short-distance journeys with HSR after flight cancellations is not considered. This solution reduces accessibility loss under both high and low siphon effects, leaving our previous conclusions unaffected. Exploring the airport siphon effect from diverse perspectives and minimizing its impact as a goal in flight schedule optimization may prove beneficial.


