
A Text-Mining-Based Evaluation of Data Element Policies in China: Integrating the LDA and PMC Models in the Context of Green Development

Abstract
1. Introduction
2. Literature Review
2.1. Research on Data Elements in the Context of Green Development
2.2. Research on Data Element Policies
2.3. Research on Public Policy Evaluation
3. Research Design
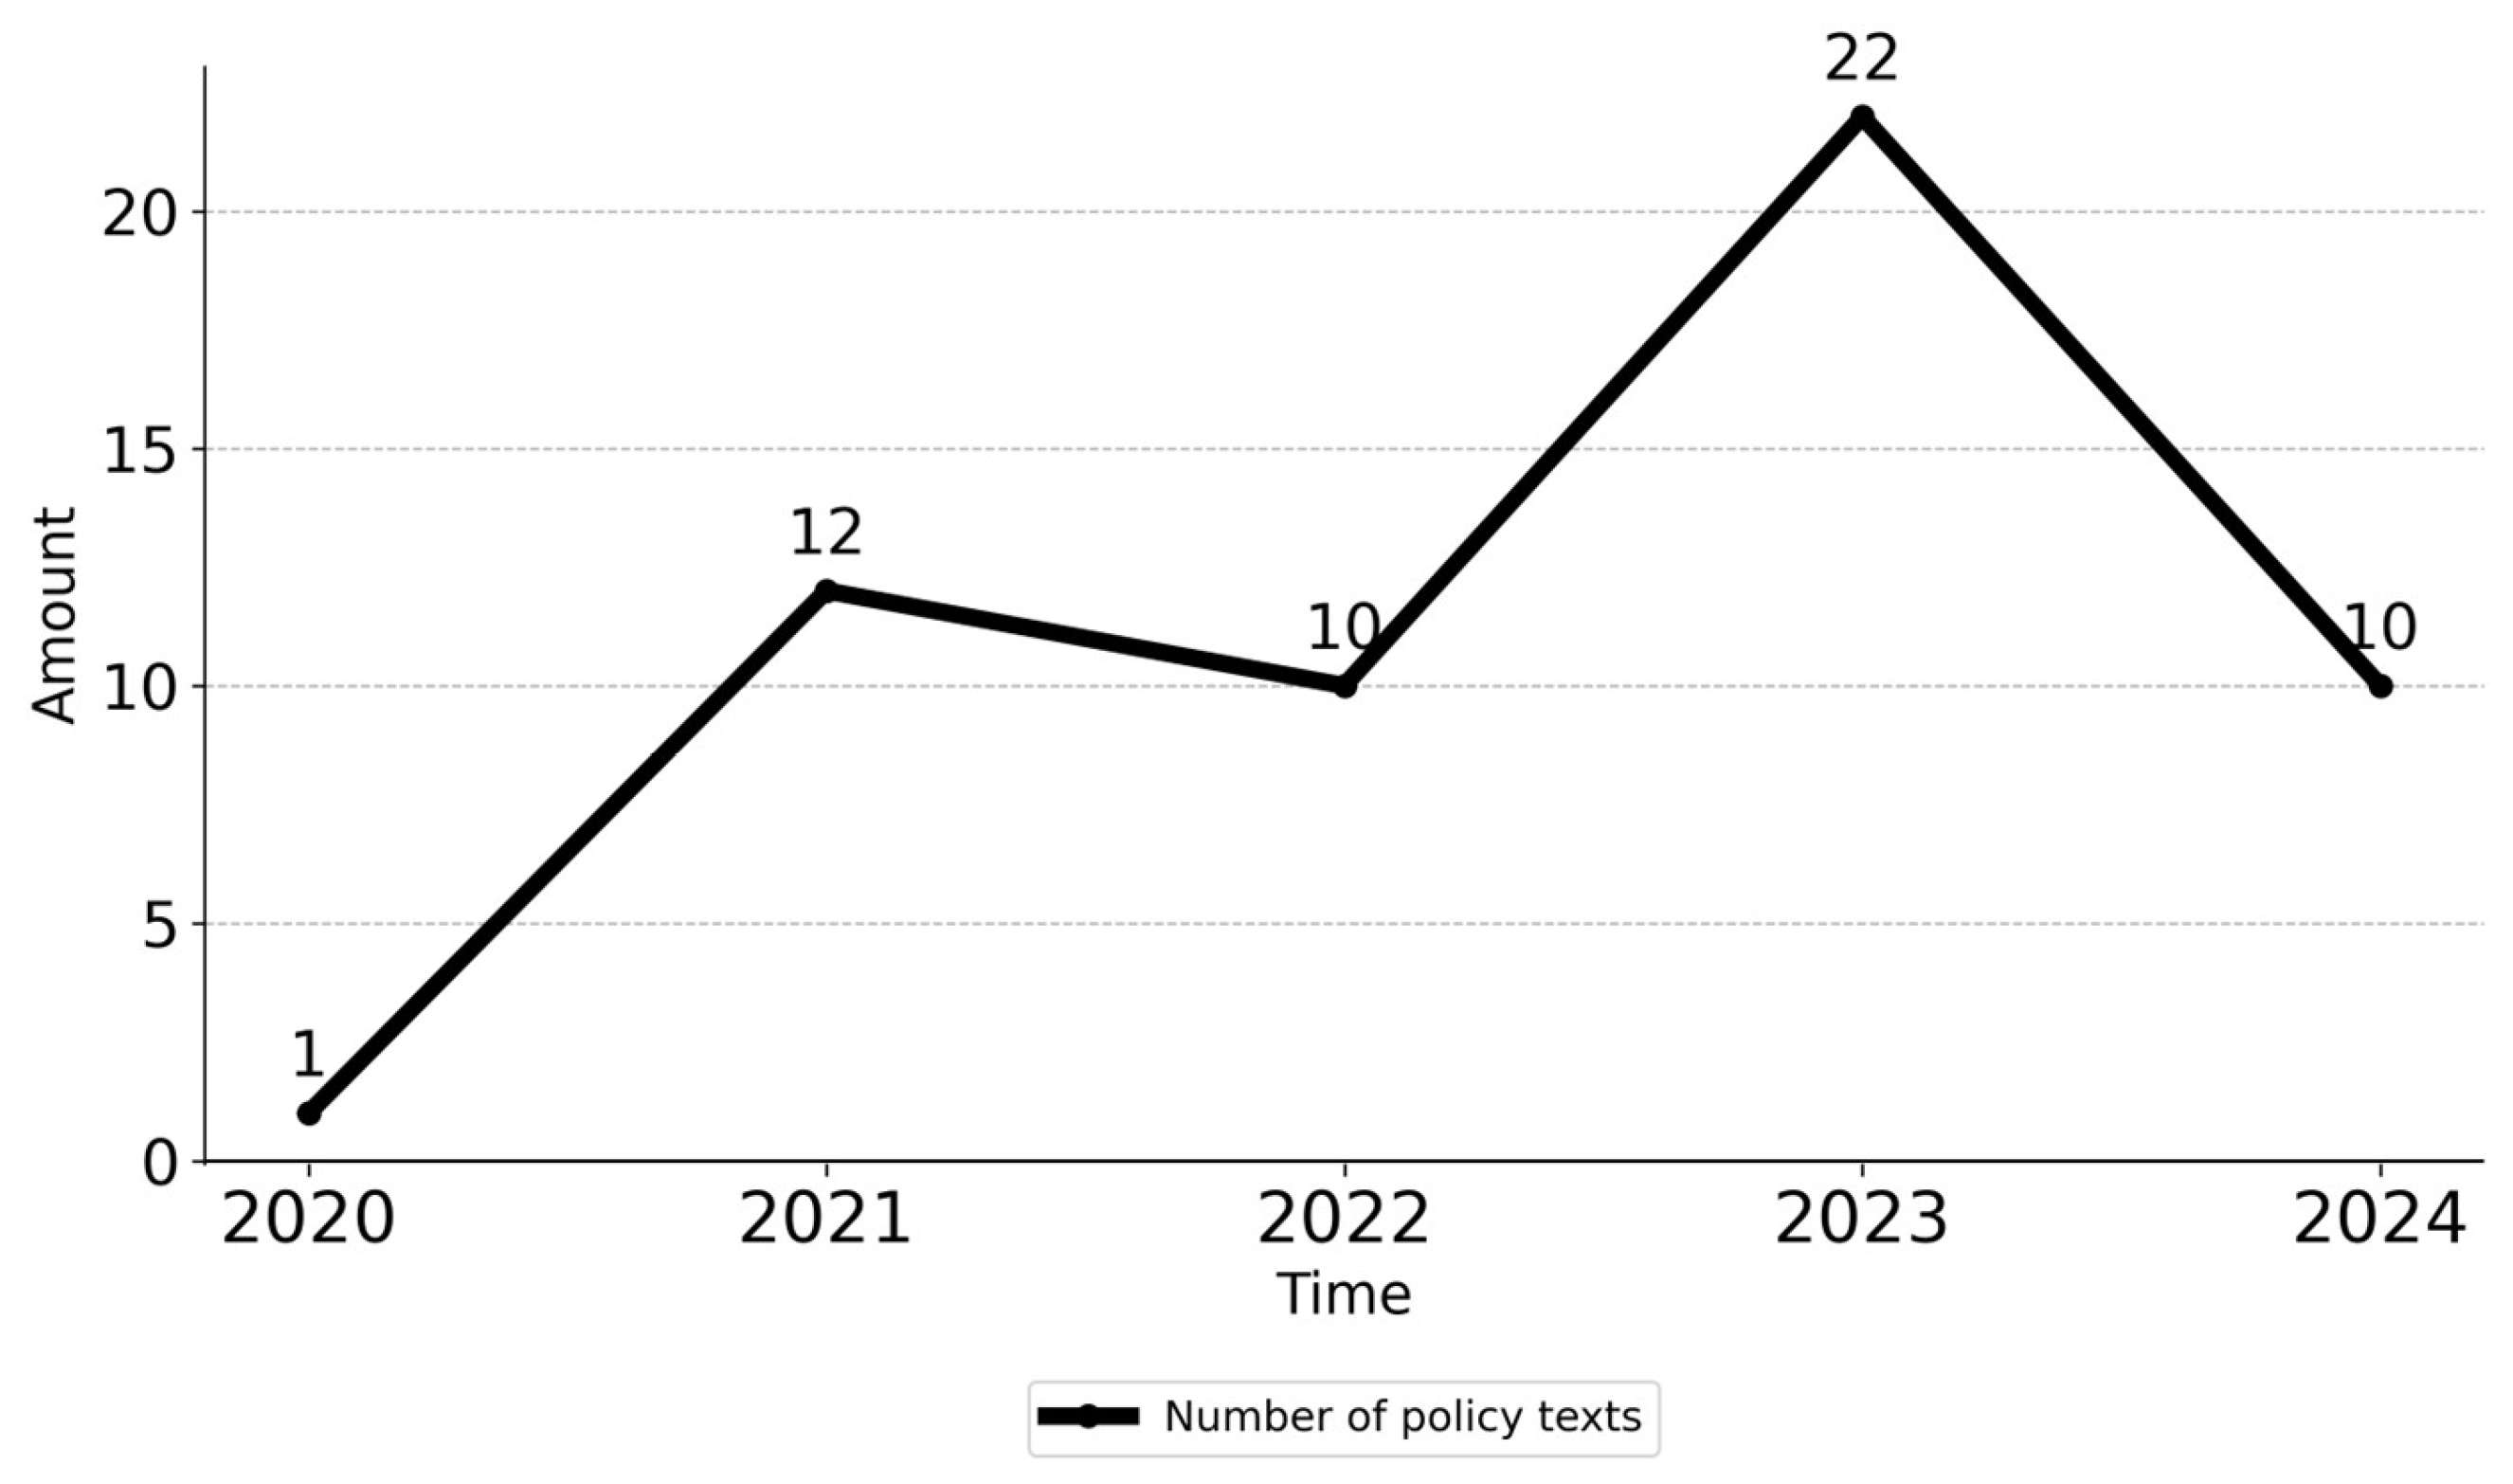
3.1. Data Sources
3.2. Word Frequency Analysis of Policy Texts
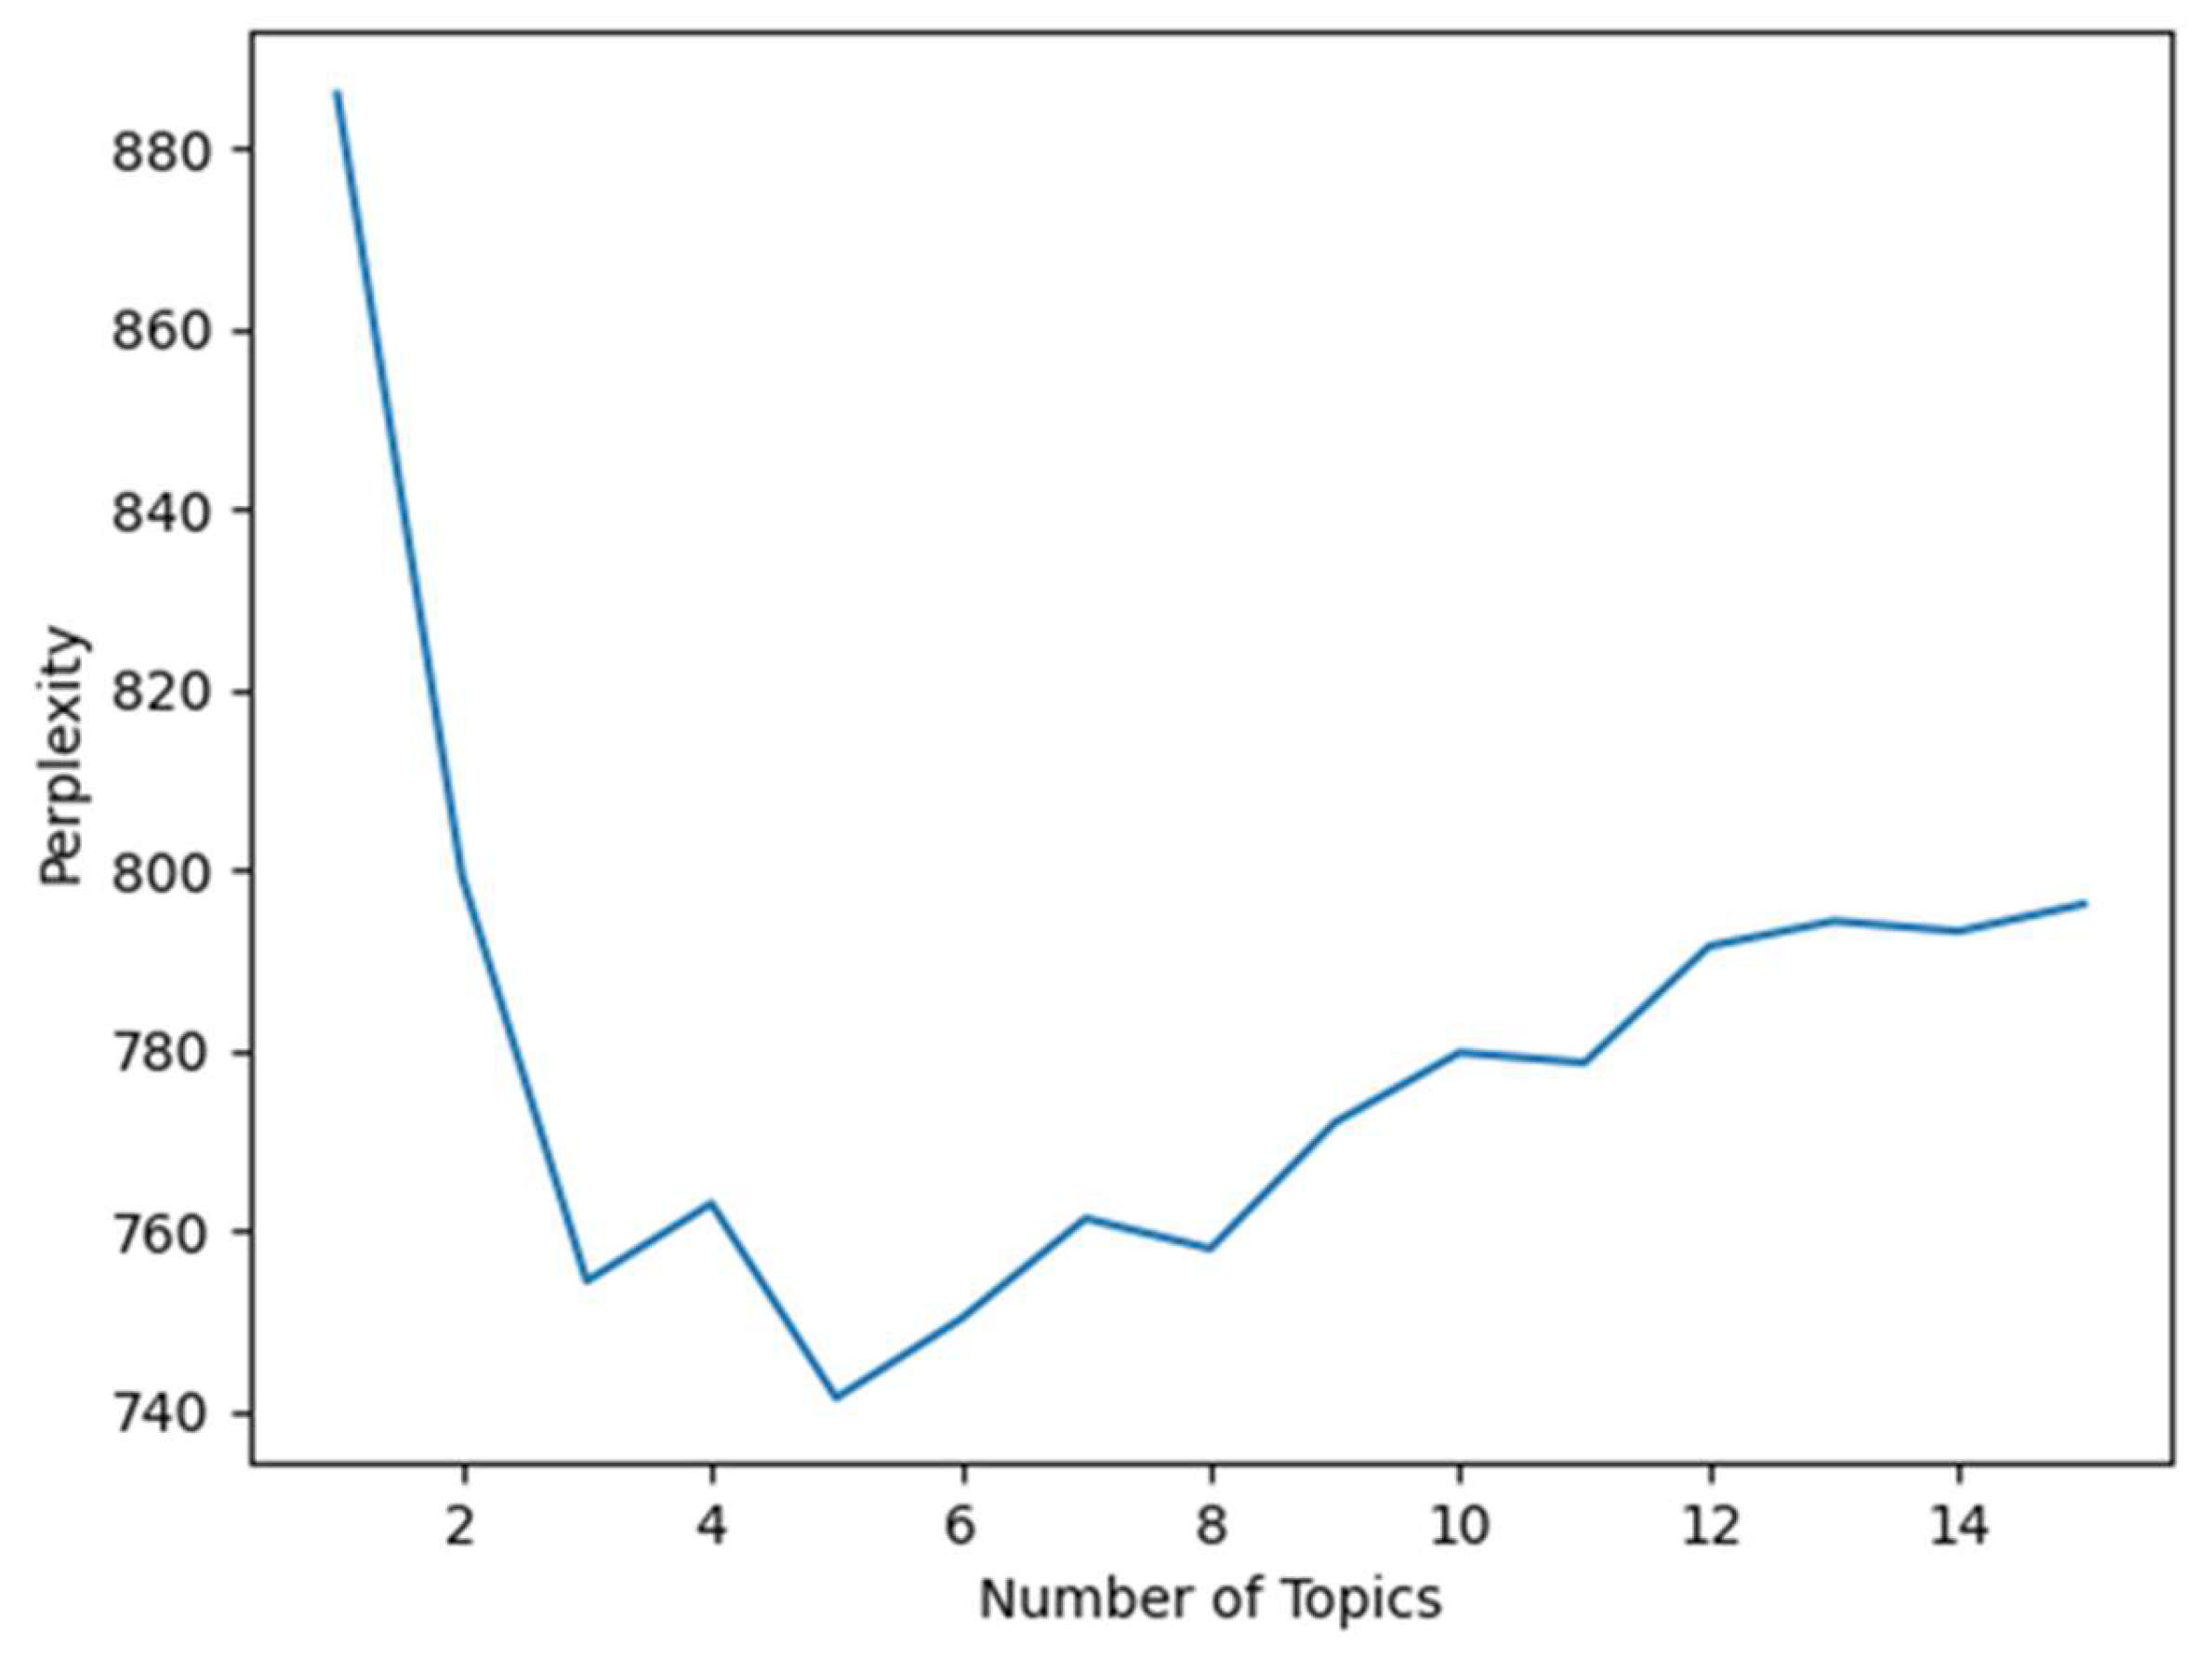
3.3. Identification of Core Policy Themes
3.4. Construction of the PMC-Index Model
3.4.1. Selection of Representative Policies
3.4.2. Variable Setting and Parameter Identification
3.4.3. Construction of a Multi-Input–Output Table
3.4.4. PMC-Index Calculation
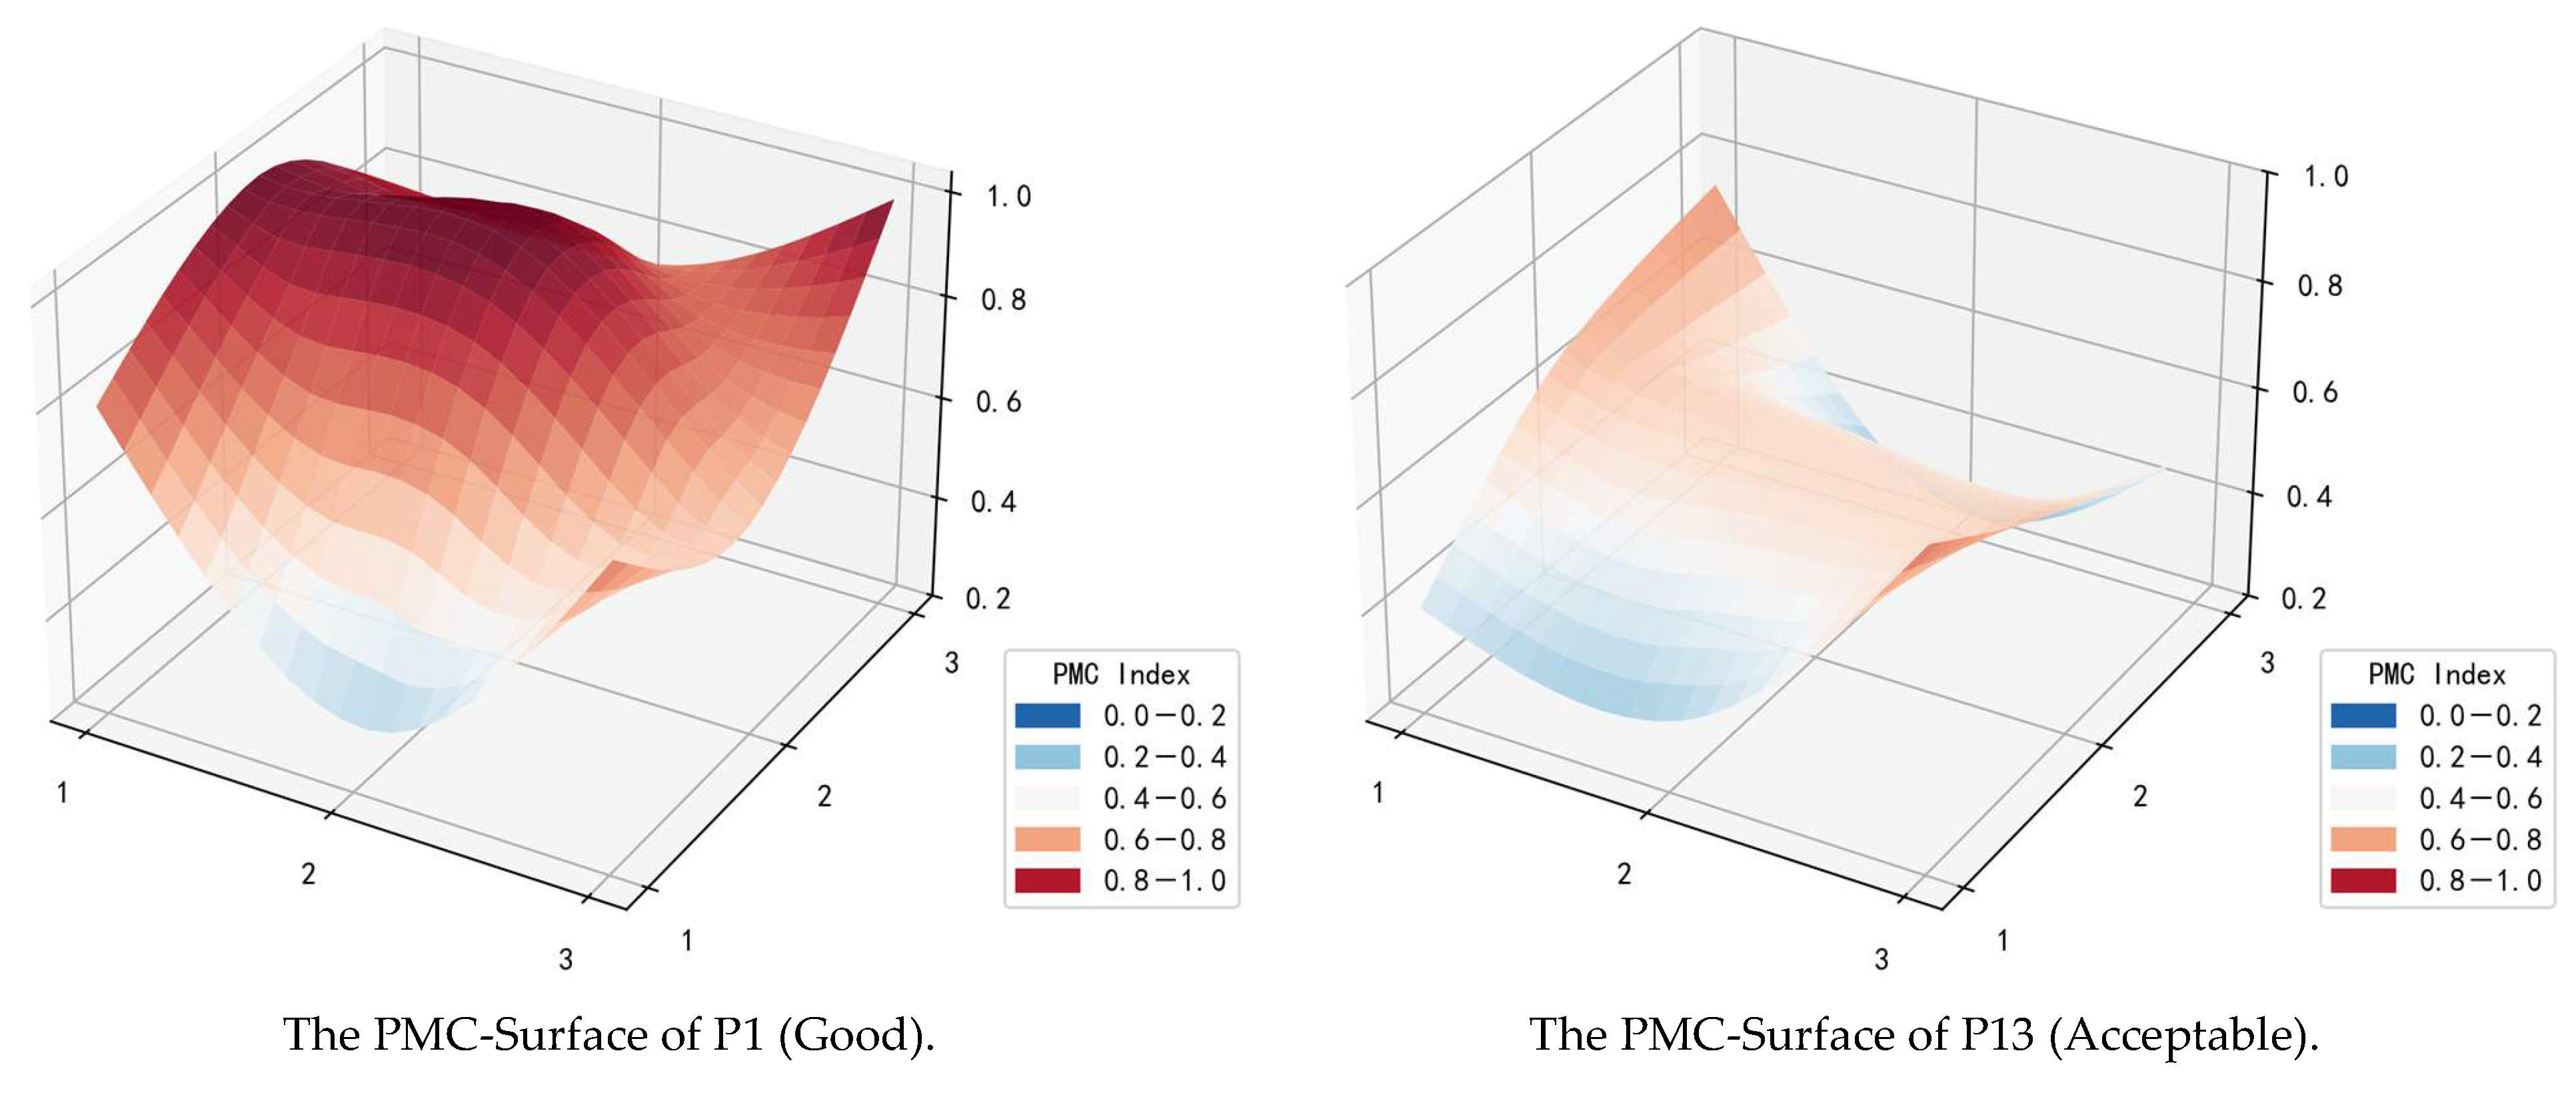
3.4.5. PMC Surface Generation
4. Empirical Results and Analysis
4.1. The PMC-Index of the Policies
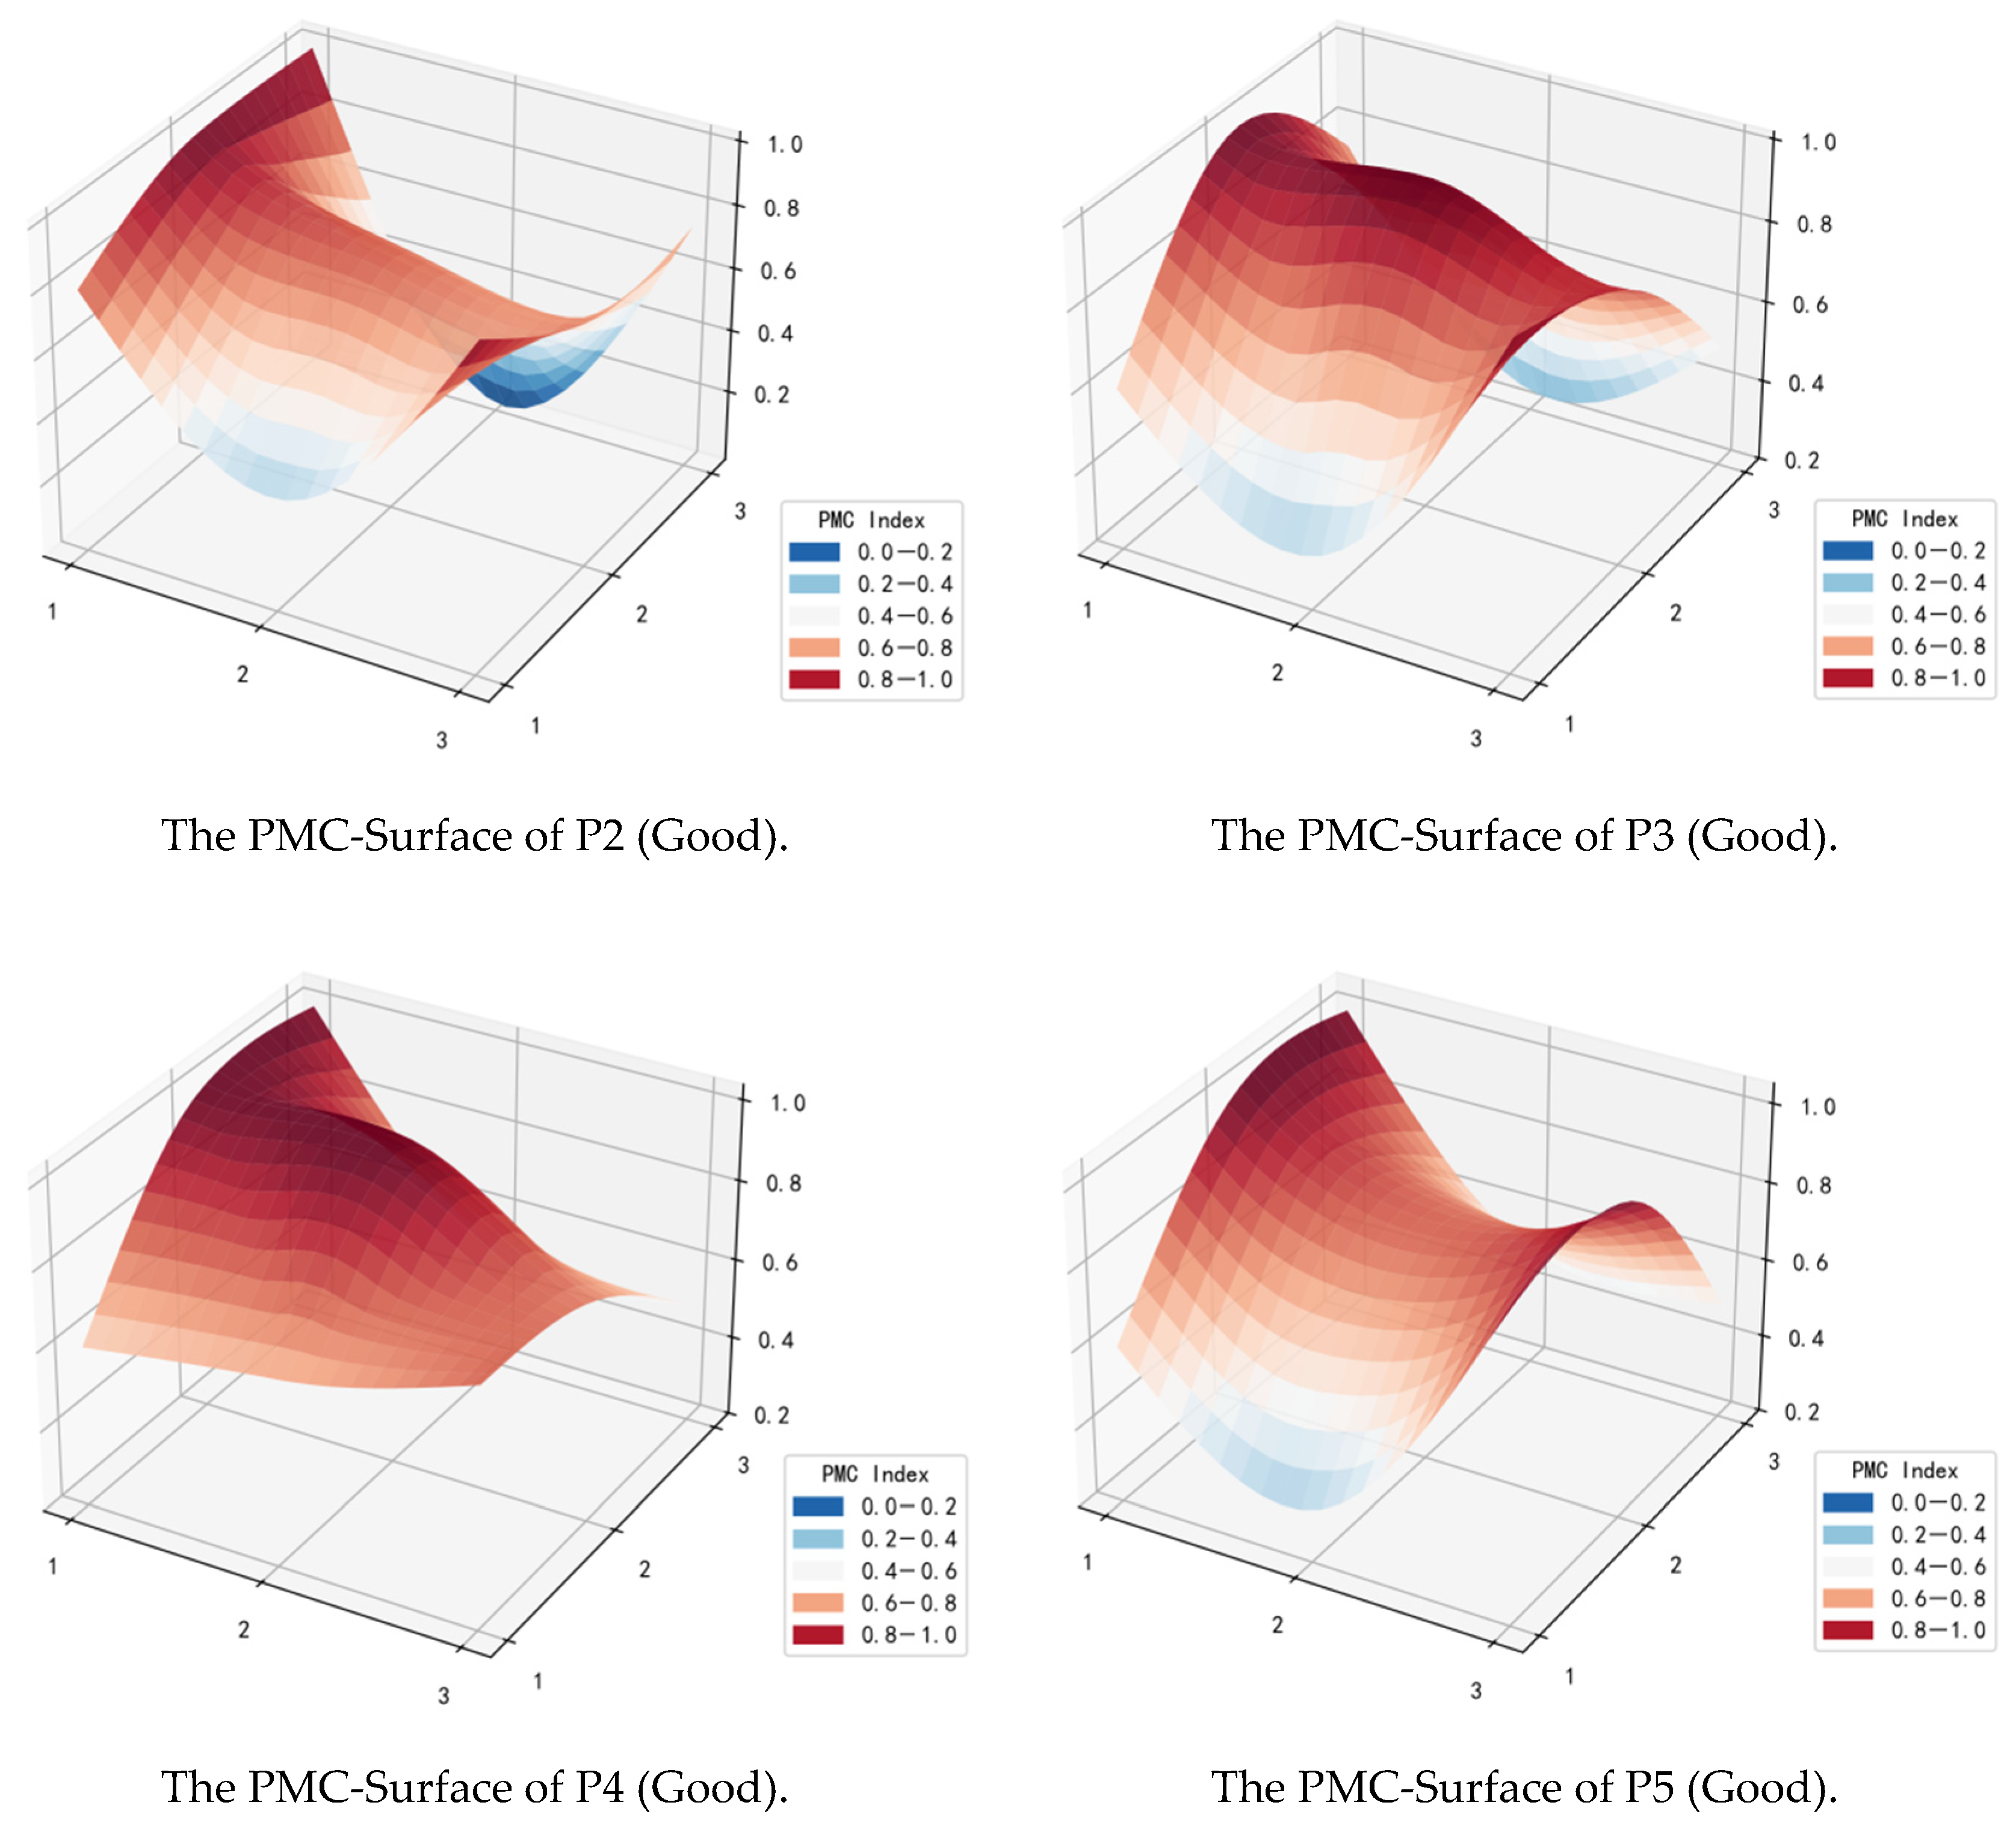
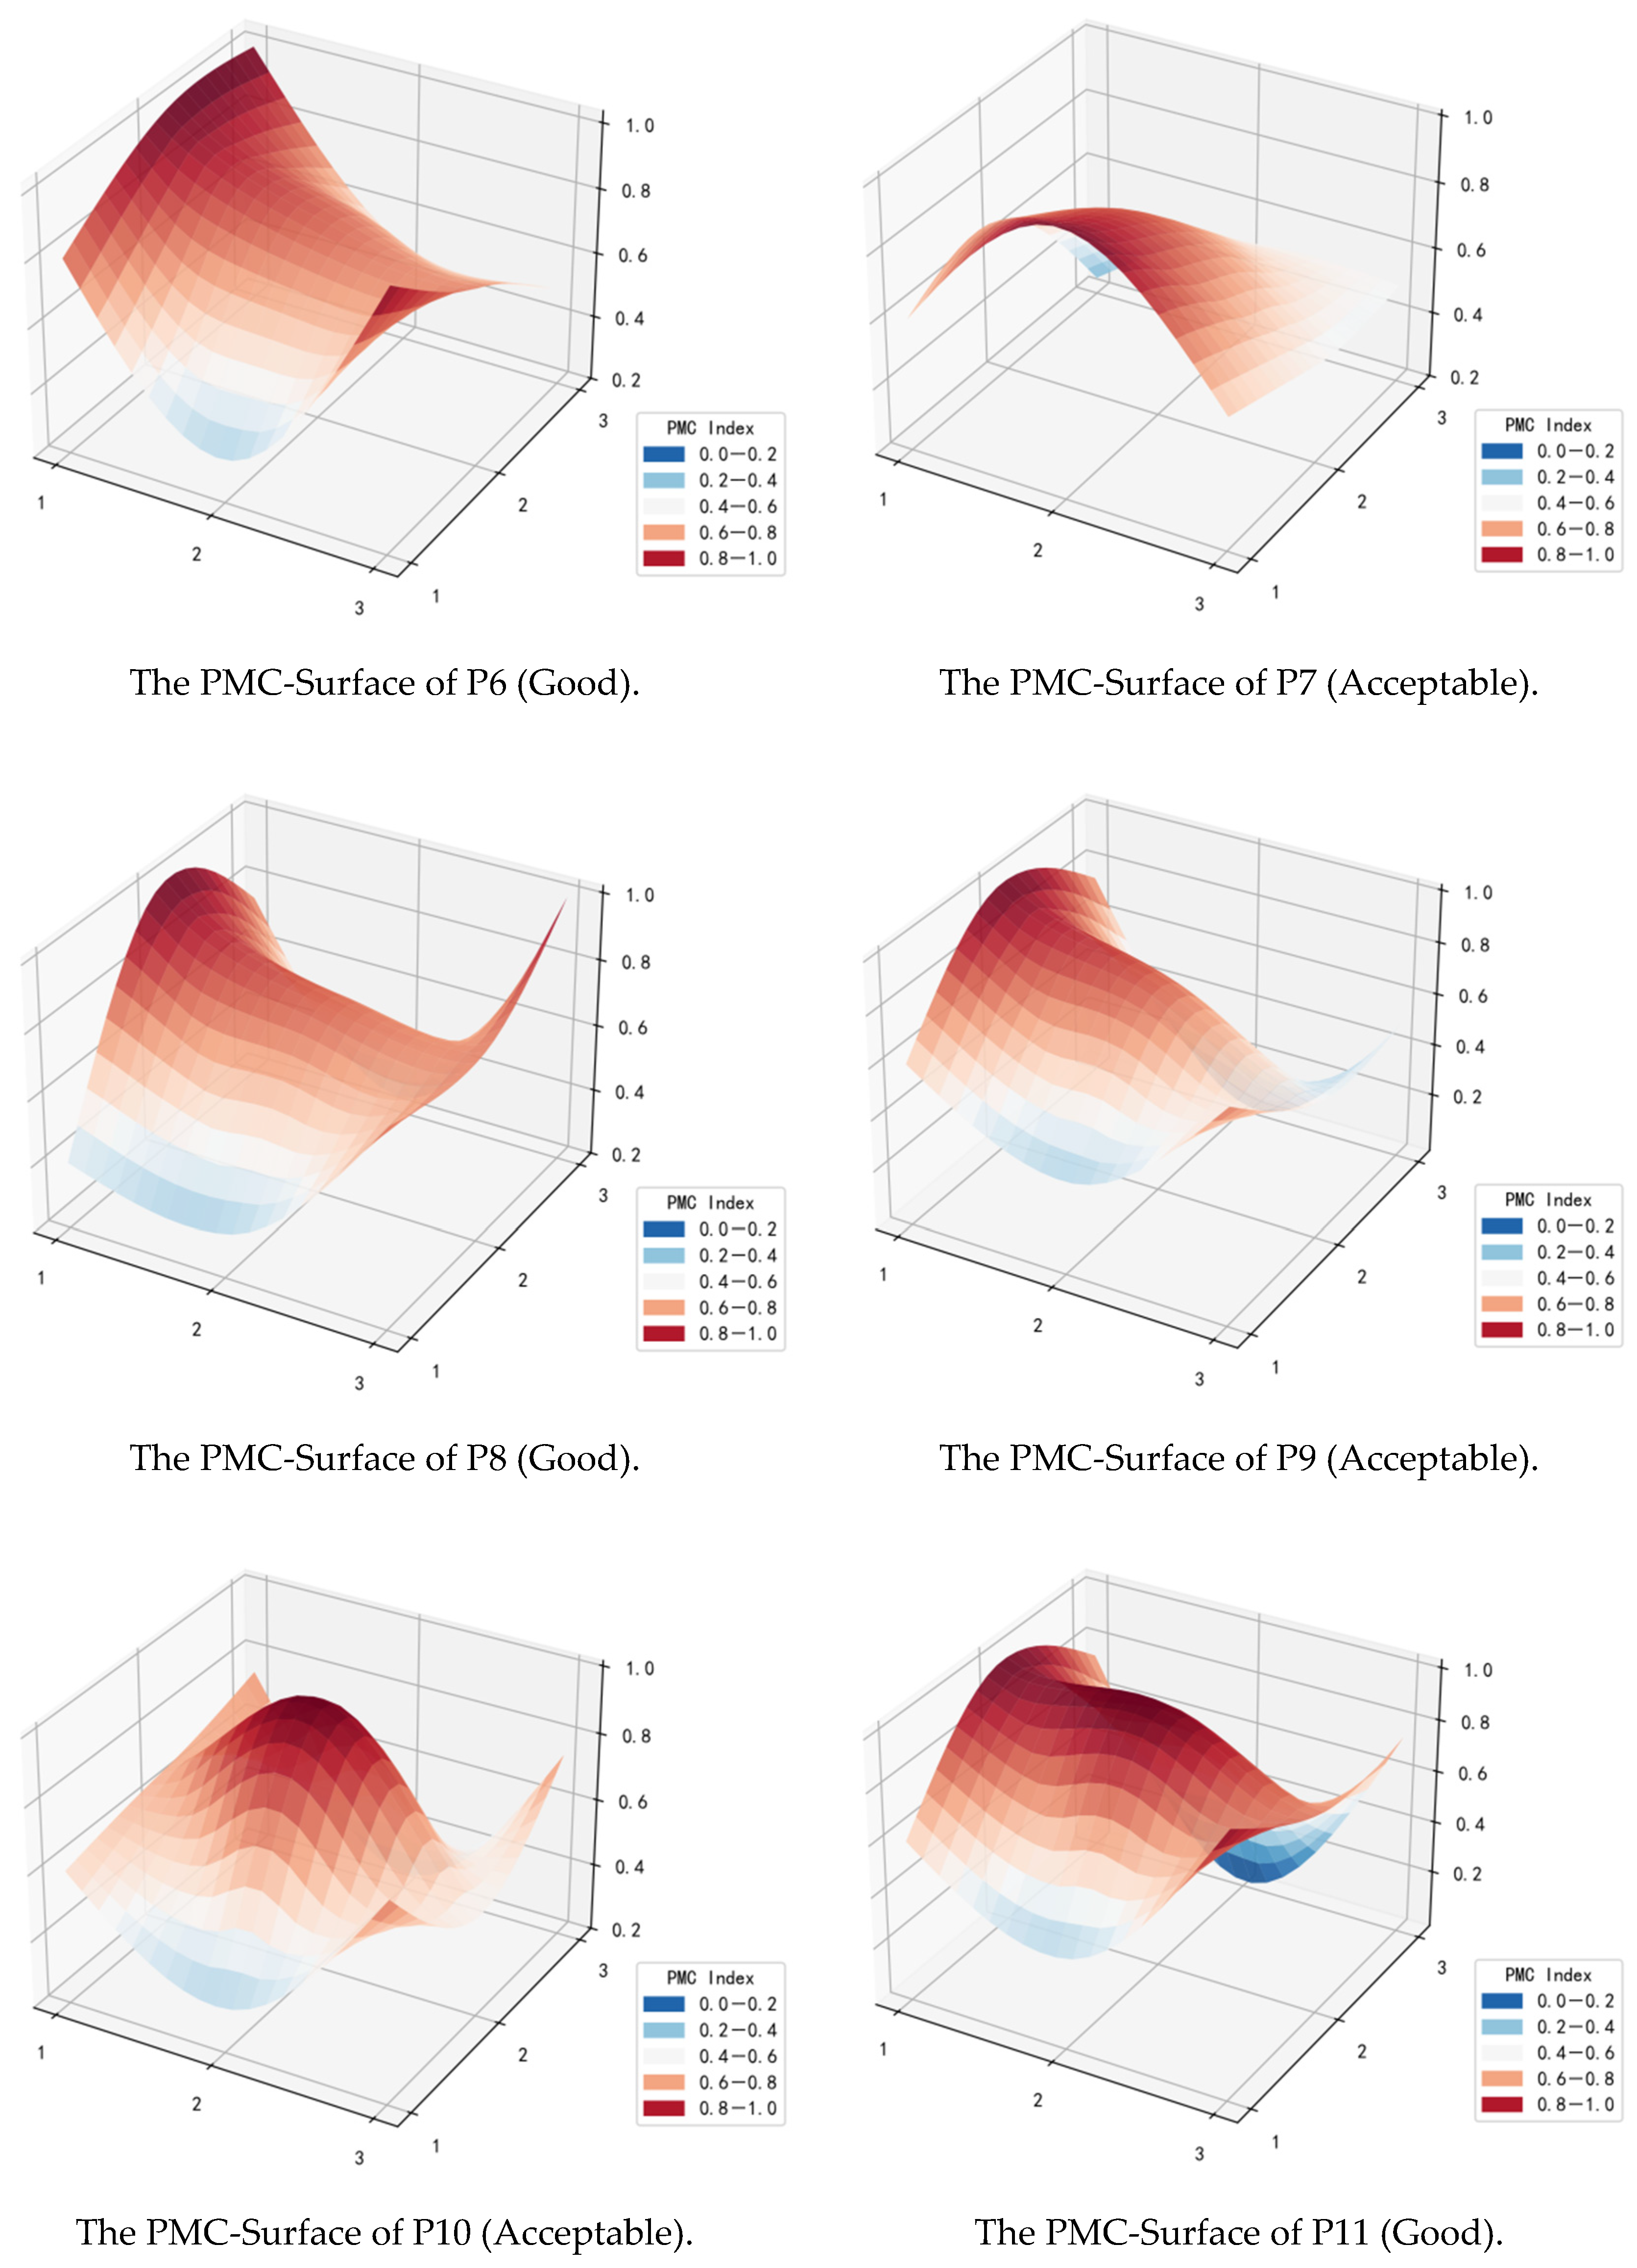
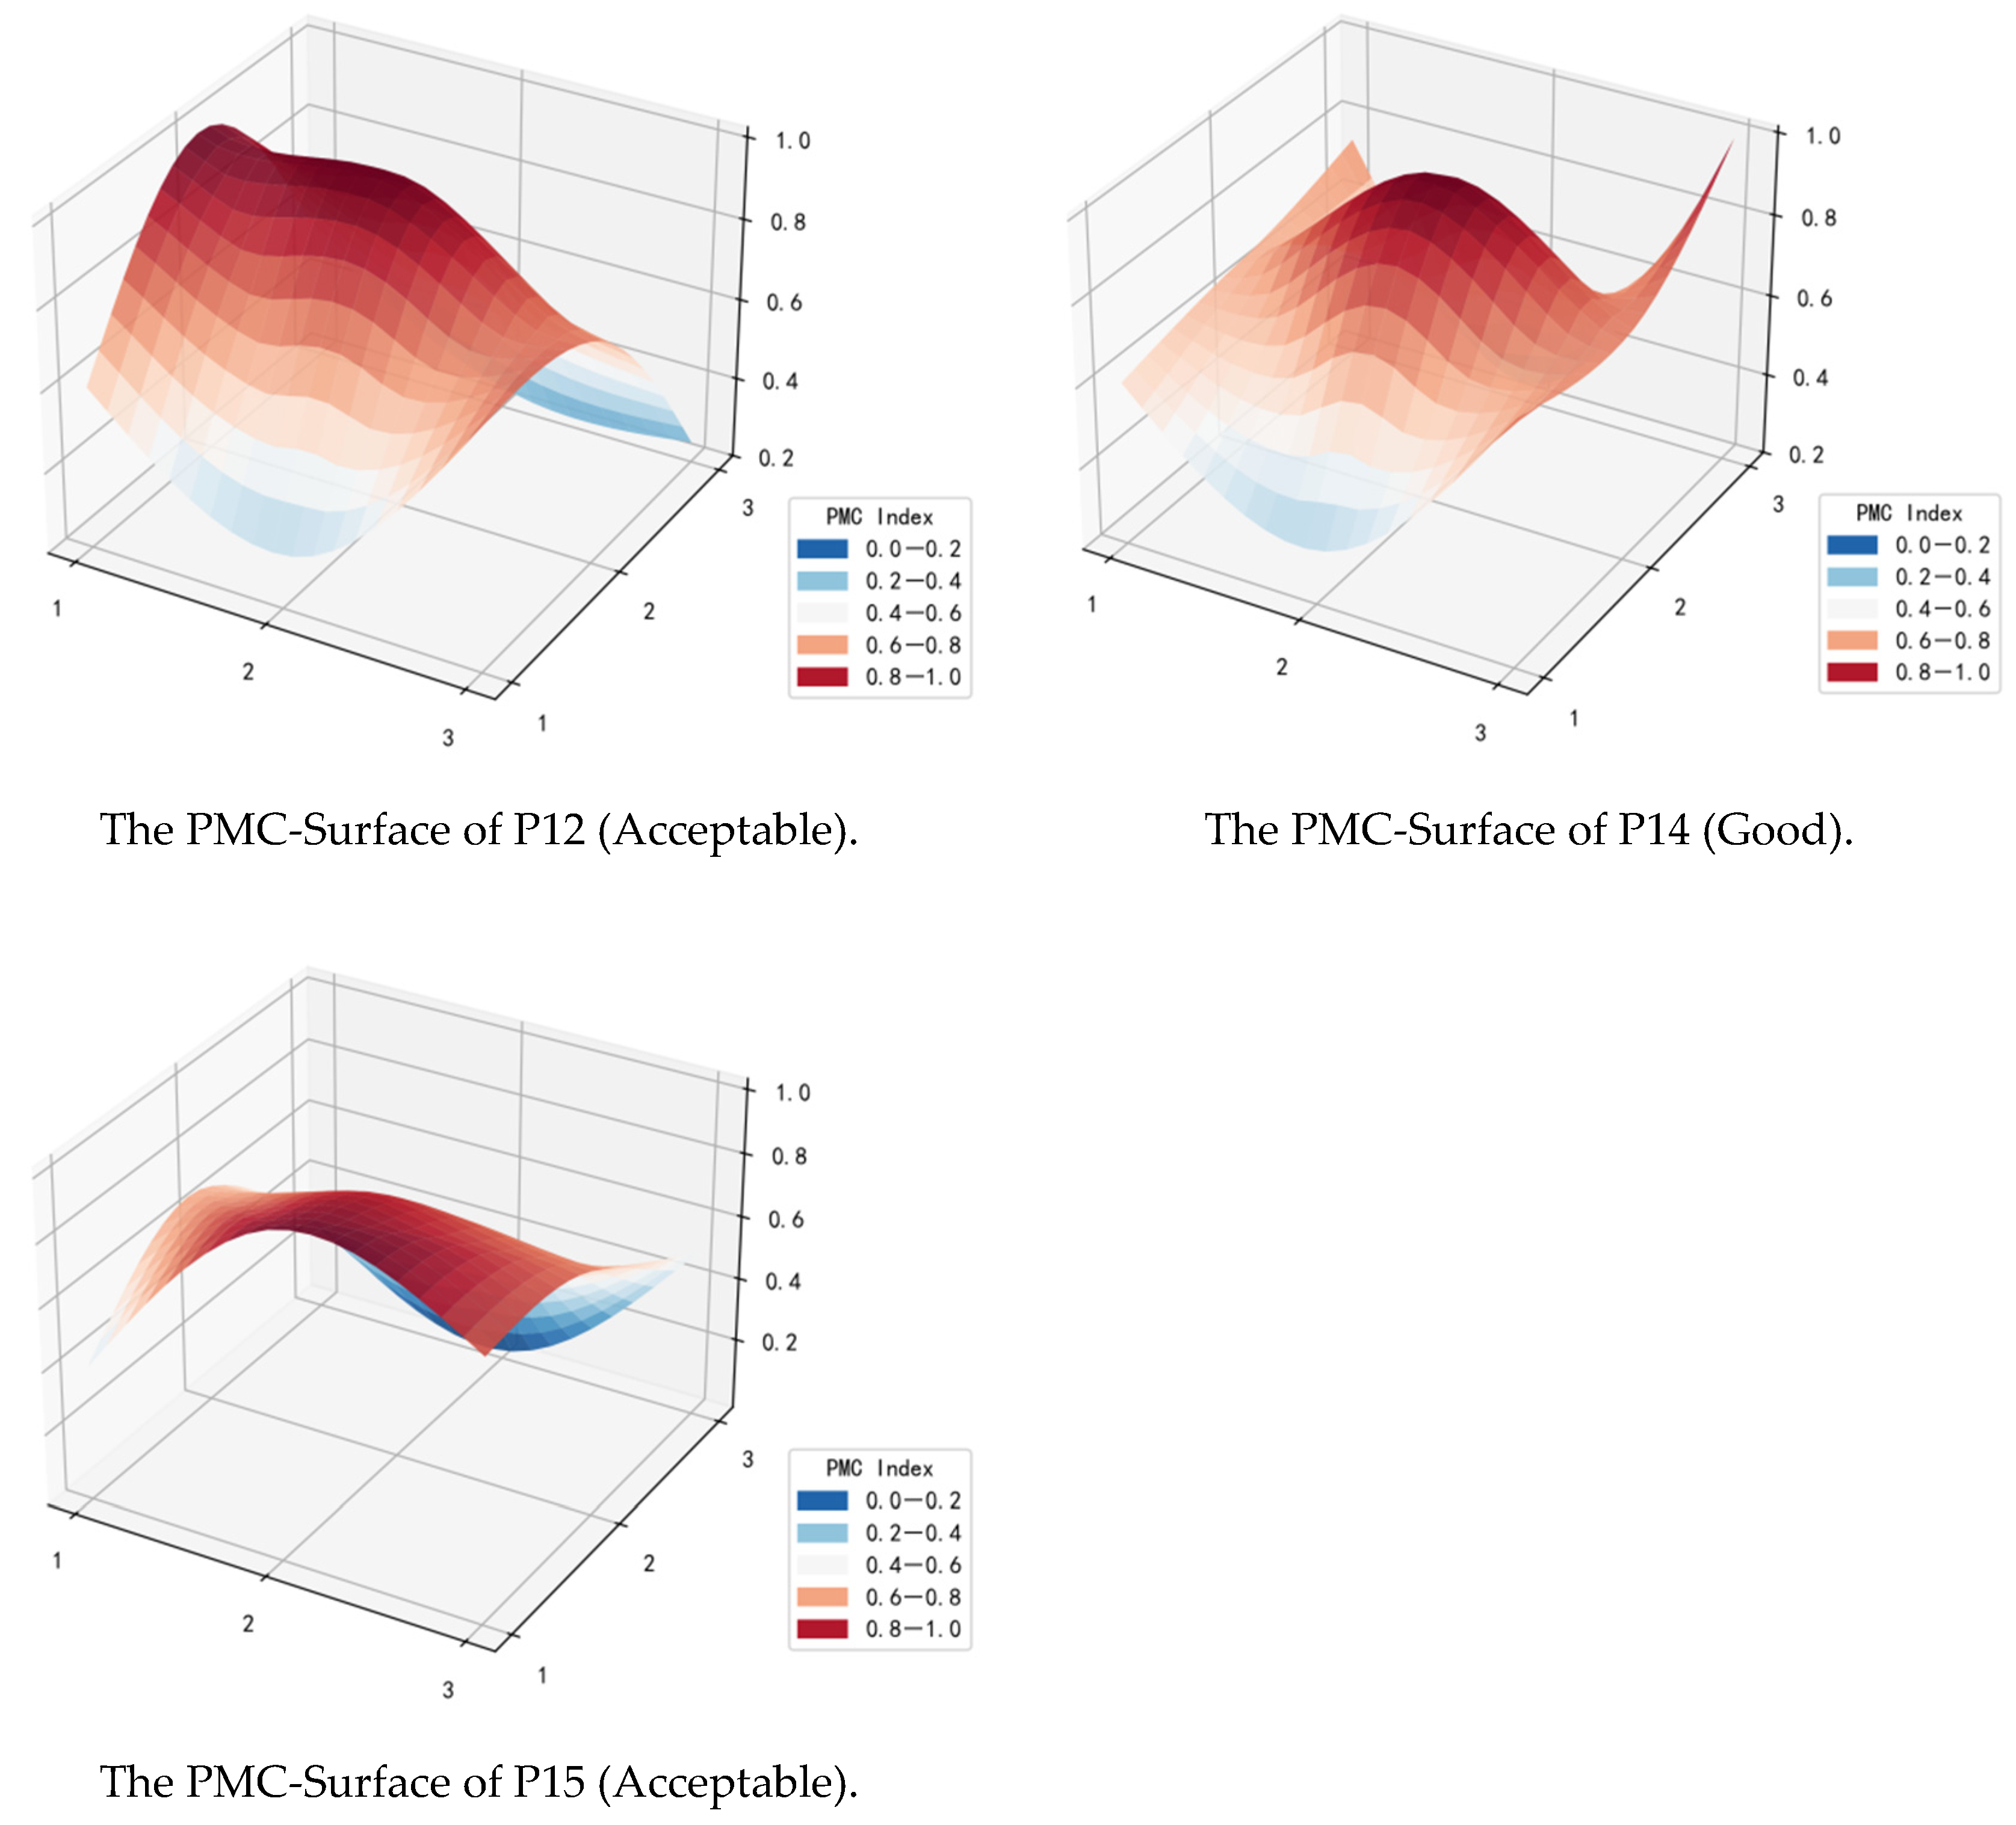
4.2. The PMC-Surface of the Policies
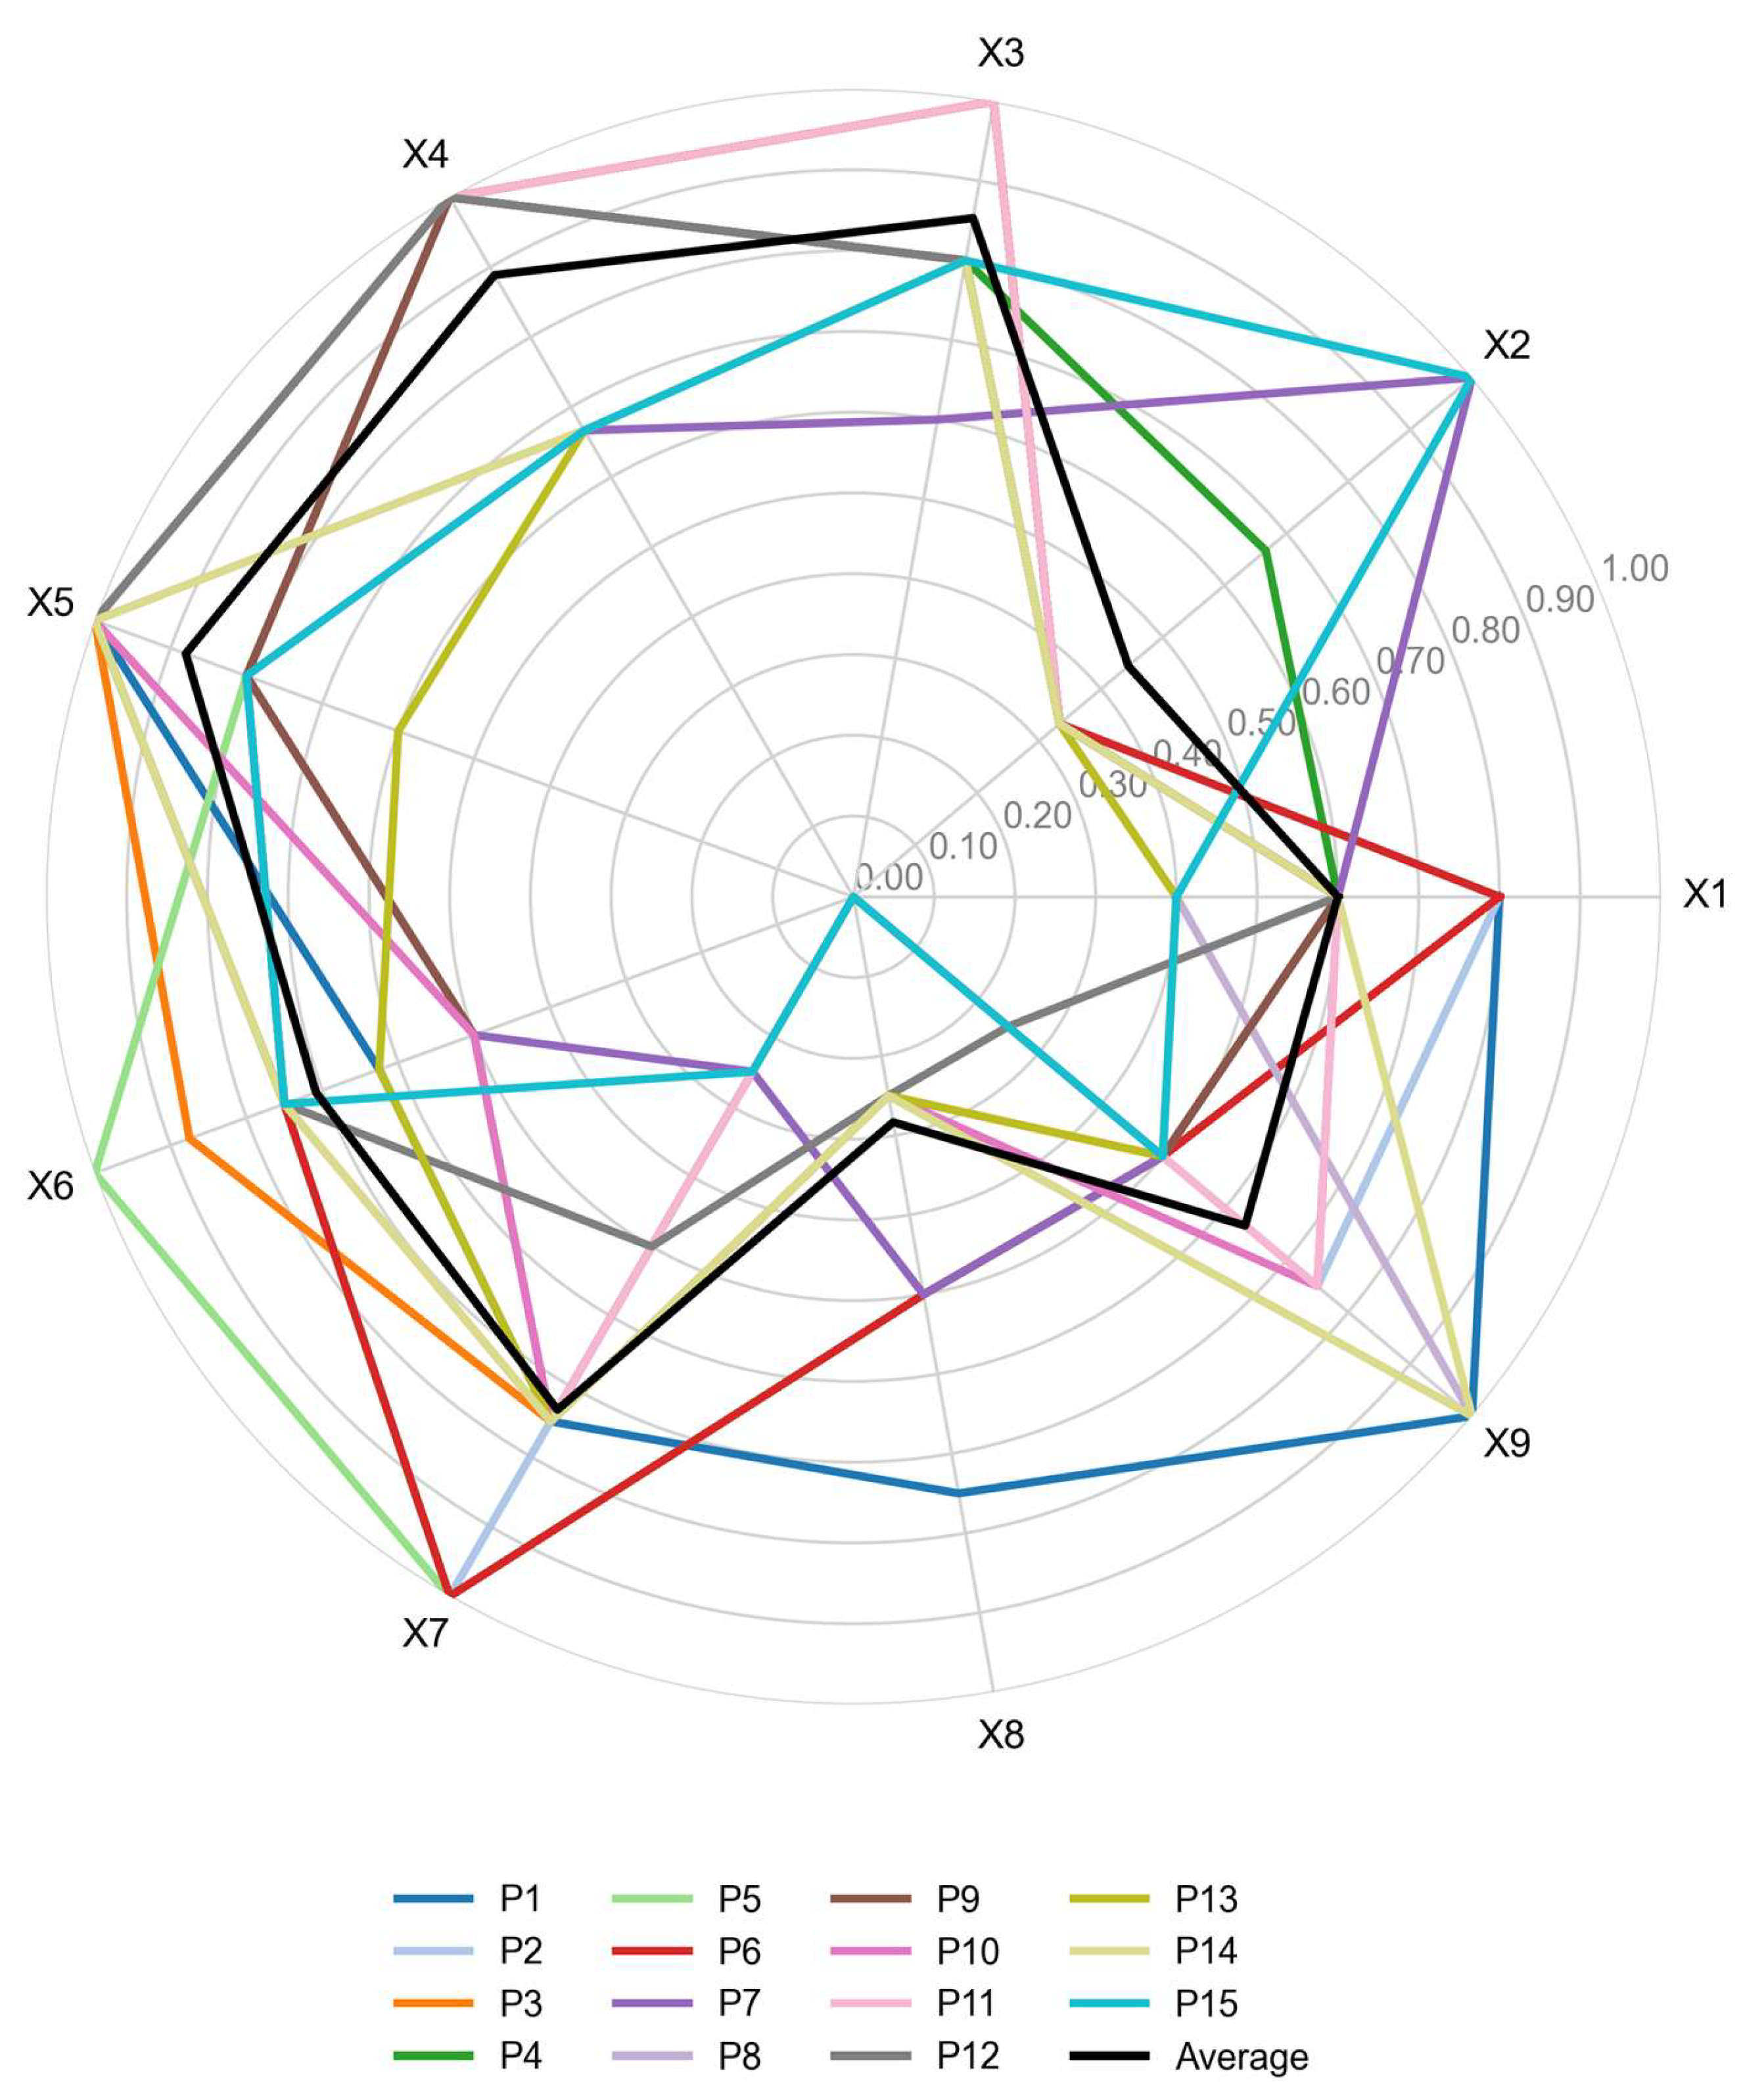
4.3. Overall Result Analysis
4.4. Analysis of Policy Groups by Grade
4.4.1. “Good” Grade Policy Group
4.4.2. “Acceptable” Grade Policy Group
5. Discussion and Conclusions
5.1. Discussion
5.2. Implications for Public Policy
5.3. Conclusions
5.3.1. Contributions of the Paper
5.3.2. Limitations and Future Prospects
Author Contributions
Funding
Institutional Review Board Statement
Informed Consent Statement
Data Availability Statement
Acknowledgments
Conflicts of Interest
Appendix A

| Primary Variables | Secondary Variables | P1 | P2 | P3 | P4 | P5 | P6 | P7 | P8 | P9 | P10 | P11 | P12 | P13 | P14 | P15 |
|---|---|---|---|---|---|---|---|---|---|---|---|---|---|---|---|---|
| X1 | X1-1 | 1 | 1 | 1 | 1 | 1 | 1 | 0 | 0 | 1 | 1 | 1 | 1 | 0 | 1 | 0 |
| X1-2 | 1 | 0 | 1 | 1 | 1 | 1 | 0 | 1 | 1 | 1 | 0 | 1 | 1 | 1 | 1 | |
| X1-3 | 1 | 1 | 1 | 0 | 0 | 1 | 1 | 1 | 1 | 1 | 1 | 0 | 1 | 1 | 1 | |
| X1-4 | 1 | 1 | 0 | 1 | 1 | 1 | 1 | 0 | 0 | 0 | 1 | 1 | 0 | 0 | 0 | |
| X1-5 | 0 | 1 | 0 | 0 | 0 | 0 | 1 | 0 | 0 | 0 | 0 | 0 | 0 | 0 | 0 | |
| X2 | X2-1 | 0 | 0 | 0 | 0 | 0 | 0 | 1 | 0 | 0 | 0 | 0 | 0 | 0 | 0 | 1 |
| X2-2 | 0 | 0 | 0 | 1 | 0 | 0 | 1 | 0 | 0 | 0 | 0 | 1 | 0 | 0 | 1 | |
| X2-3 | 1 | 1 | 1 | 1 | 1 | 1 | 1 | 1 | 1 | 1 | 1 | 0 | 1 | 1 | 1 | |
| X3 | X3-1 | 1 | 1 | 1 | 1 | 1 | 1 | 1 | 1 | 1 | 1 | 1 | 1 | 1 | 1 | 1 |
| X3-2 | 1 | 1 | 1 | 1 | 1 | 1 | 1 | 1 | 1 | 1 | 1 | 1 | 1 | 1 | 1 | |
| X3-3 | 0 | 1 | 1 | 1 | 1 | 1 | 1 | 0 | 0 | 0 | 1 | 1 | 1 | 0 | 0 | |
| X3-4 | 1 | 1 | 1 | 0 | 1 | 1 | 0 | 1 | 1 | 1 | 1 | 0 | 1 | 1 | 1 | |
| X3-5 | 1 | 1 | 1 | 1 | 1 | 1 | 0 | 1 | 1 | 1 | 1 | 1 | 0 | 1 | 1 | |
| X4 | X4-1 | 1 | 1 | 1 | 1 | 1 | 1 | 0 | 1 | 1 | 0 | 1 | 1 | 0 | 0 | 0 |
| X4-2 | 1 | 1 | 1 | 1 | 1 | 1 | 1 | 1 | 1 | 1 | 1 | 1 | 1 | 1 | 1 | |
| X4-3 | 1 | 1 | 1 | 1 | 1 | 1 | 1 | 1 | 1 | 1 | 1 | 1 | 1 | 1 | 1 | |
| X5 | X5-1 | 1 | 1 | 1 | 1 | 1 | 1 | 1 | 1 | 1 | 1 | 1 | 1 | 0 | 1 | 1 |
| X5-2 | 1 | 1 | 1 | 1 | 1 | 1 | 1 | 1 | 1 | 1 | 1 | 1 | 1 | 1 | 1 | |
| X5-3 | 1 | 1 | 1 | 1 | 1 | 1 | 1 | 1 | 1 | 1 | 1 | 1 | 0 | 1 | 1 | |
| X5-4 | 1 | 1 | 1 | 1 | 1 | 1 | 1 | 1 | 1 | 1 | 1 | 1 | 1 | 1 | 1 | |
| X5-5 | 1 | 0 | 1 | 1 | 0 | 0 | 0 | 0 | 0 | 1 | 1 | 1 | 1 | 1 | 0 | |
| X6 | X6-1 | 0 | 0 | 1 | 0 | 1 | 0 | 0 | 0 | 1 | 1 | 1 | 0 | 0 | 1 | 1 |
| X6-2 | 0 | 0 | 0 | 0 | 1 | 0 | 0 | 0 | 0 | 0 | 0 | 1 | 0 | 0 | 1 | |
| X6-3 | 1 | 1 | 1 | 1 | 1 | 1 | 1 | 1 | 1 | 0 | 0 | 1 | 1 | 1 | 0 | |
| X6-4 | 1 | 1 | 1 | 1 | 1 | 1 | 0 | 1 | 0 | 0 | 1 | 1 | 0 | 0 | 0 | |
| X6-5 | 0 | 1 | 1 | 1 | 1 | 1 | 1 | 1 | 0 | 0 | 1 | 0 | 1 | 1 | 1 | |
| X6-6 | 1 | 1 | 1 | 1 | 1 | 1 | 1 | 1 | 0 | 1 | 1 | 1 | 1 | 1 | 1 | |
| X6-7 | 1 | 1 | 1 | 1 | 1 | 1 | 1 | 1 | 1 | 1 | 1 | 1 | 1 | 1 | 1 | |
| X6-8 | 1 | 1 | 1 | 1 | 1 | 1 | 0 | 1 | 1 | 1 | 1 | 1 | 1 | 1 | 1 | |
| X7 | X7-1 | 0 | 1 | 1 | 1 | 1 | 1 | 0 | 1 | 1 | 0 | 0 | 0 | 0 | 1 | 0 |
| X7-2 | 1 | 1 | 1 | 1 | 1 | 1 | 0 | 0 | 1 | 1 | 1 | 0 | 1 | 1 | 0 | |
| X7-3 | 1 | 1 | 1 | 1 | 1 | 1 | 1 | 1 | 1 | 1 | 1 | 1 | 1 | 1 | 0 | |
| X7-4 | 1 | 1 | 0 | 1 | 1 | 1 | 0 | 1 | 0 | 1 | 1 | 1 | 1 | 0 | 1 | |
| X8 | X8-1 | 0 | 0 | 0 | 1 | 0 | 0 | 1 | 1 | 0 | 1 | 0 | 1 | 1 | 1 | 0 |
| X8-3 | 1 | 0 | 0 | 0 | 1 | 1 | 0 | 0 | 0 | 0 | 0 | 0 | 0 | 0 | 0 | |
| X8-4 | 1 | 0 | 0 | 0 | 0 | 0 | 0 | 0 | 0 | 0 | 0 | 0 | 0 | 0 | 0 | |
| X8-5 | 1 | 0 | 1 | 1 | 1 | 1 | 1 | 0 | 0 | 0 | 0 | 0 | 0 | 0 | 0 | |
| X9 | X9-1 | 1 | 1 | 0 | 1 | 1 | 1 | 0 | 1 | 1 | 1 | 1 | 0 | 0 | 1 | 1 |
| X9-2 | 1 | 0 | 0 | 0 | 0 | 0 | 0 | 1 | 0 | 0 | 0 | 1 | 0 | 1 | 0 | |
| X9-3 | 1 | 1 | 1 | 1 | 1 | 0 | 1 | 1 | 1 | 1 | 1 | 0 | 1 | 1 | 1 | |
| X9-4 | 1 | 1 | 1 | 0 | 0 | 1 | 1 | 1 | 0 | 1 | 1 | 0 | 1 | 1 | 0 |
Appendix B
References
- Webb, J.; de Silva, H.N.; Wilson, C. The Future of Coal and Renewable Power Generation in Australia: A Review of Market Trends. Econ. Anal. Policy 2020, 68, 363–378. [Google Scholar] [CrossRef]
- Tanaka, K.; Wilson, C.; Managi, S. Impact of Feed-in Tariffs on Electricity Consumption. Environ. Econ. Policy Stud. 2022, 24, 49–72. [Google Scholar] [CrossRef]
- Ghobakhloo, M. Industry 4.0, Digitization, and Opportunities for Sustainability. J. Clean. Prod. 2020, 252, 119869. [Google Scholar] [CrossRef]
- Machado, C.G.; Winroth, M.P.; Ribeiro da Silva, E.H.D. Sustainable Manufacturing in Industry 4.0: An Emerging Research Agenda. Int. J. Prod. Res. 2020, 58, 1462–1484. [Google Scholar] [CrossRef]
- Research Report on the Development of China’s Digital Economy (2024)—China’s Business Environment Monitoring Service Platform. Available online: http://www.chbeo.org.cn/article_view.aspx?id=6486 (accessed on 14 July 2025).
- Energy Economics | Home. Available online: https://www.bp.com/en/global/corporate/energy-economics.html (accessed on 14 July 2025).
- Deng, Z.; Zhu, B.; Davis, S.J.; Ciais, P.; Guan, D.; Gong, P.; Liu, Z. Global Carbon Emissions and Decarbonization in 2024. Nat. Rev. Earth Environ. 2025, 6, 231–233. [Google Scholar] [CrossRef]
- Chen, L.; Zhao, J.; Wang, J.; Ren, Q.; Liu, W.; Liu, Q. Measuring and Optimizing Pathways for Regional Economic and Low-Carbon Coordination Effects: A Case Study of the Yangtze River Economic Belt. Energy Strategy Rev. 2025, 59, 101725. [Google Scholar] [CrossRef]
- Usman, A.; Ozturk, I.; Hassan, A.; Maria Zafar, S.; Ullah, S. The Effect of ICT on Energy Consumption and Economic Growth in South Asian Economies: An Empirical Analysis. Telemat. Inform. 2021, 58, 101537. [Google Scholar] [CrossRef]
- Chang, H.; Ding, Q.; Zhao, W.; Hou, N.; Liu, W. The Digital Economy, Industrial Structure Upgrading, and Carbon Emission Intensity—Empirical Evidence from China’s Provinces. Energy Strategy Rev. 2023, 50, 101218. [Google Scholar] [CrossRef]
- Zhao, Z.; Zhao, Y.; Shi, X.; Zheng, L.; Fan, S.; Zuo, S. Green Innovation and Carbon Emission Performance: The Role of Digital Economy. Energy Policy 2024, 195, 114344. [Google Scholar] [CrossRef]
- Mueller, M.; Grindal, K. Data Flows and the Digital Economy: Information as a Mobile Factor of Production. Digit. Policy Regul. Gov. 2018, 21, 71–87. [Google Scholar] [CrossRef]
- Dubey, R.; Gunasekaran, A.; Childe, S.J.; Papadopoulos, T.; Luo, Z.; Wamba, S.F.; Roubaud, D. Can Big Data and Predictive Analytics Improve Social and Environmental Sustainability? Technol. Forecast. Soc. Change 2019, 144, 534–545. [Google Scholar] [CrossRef]
- Dong, L.; Zhu, X.; Yang, L.; Jiang, G. Unleashing the Power of Data Element Markets: Driving Urban Green Growth through Marketization, Innovation, and Digital Finance. Int. Rev. Econ. Financ. 2025, 99, 104070. [Google Scholar] [CrossRef]
- Balogun, A.-L.; Marks, D.; Sharma, R.; Shekhar, H.; Balmes, C.; Maheng, D.; Arshad, A.; Salehi, P. Assessing the Potentials of Digitalization as a Tool for Climate Change Adaptation and Sustainable Development in Urban Centres. Sustain. Cities Soc. 2020, 53, 101888. [Google Scholar] [CrossRef]
- Wang, W.; Xiao, D. Marketization of Data Elements and Enterprise Green Governance Performance: A Quasi-Natural Experiment Based on Data Trading Platforms. Manag. Decis. Econ. 2025, 46, 1686–1700. [Google Scholar] [CrossRef]
- Linjia, T.; Chenyang, Z. Green Data Elements: Connotation Characteristics, Impact Effects, and Research Prospects. J. Technol. Econ. 2025, 44, 1–16. [Google Scholar]
- Jacobs, M. The Green Economy: Environment, Sustainable Development and the Politics of the Future; UBC Press: Vancouver, BC, Canada, 1991. [Google Scholar]
- Tao, C.-Q.; Yi, M.-Y.; Wang, C.-S. Coupling Coordination Analysis and Spatiotemporal Heterogeneity between Data Elements and Green Development in China. Econ. Anal. Policy 2023, 77, 1–15. [Google Scholar] [CrossRef]
- Bianchini, S.; Damioli, G.; Ghisetti, C. The Environmental Effects of the “Twin” Green and Digital Transition in European Regions. Environ. Resource Econ. 2023, 84, 877–918. [Google Scholar] [CrossRef]
- Xiao, Y.; Wu, S.; Liu, Z.Q.; Lin, H.J. Digital Economy and Green Development: Empirical Evidence from China’s Cities. Front. Environ. Sci. 2023, 11, 1124680. [Google Scholar] [CrossRef]
- Yaoteng, Z.; Xin, L. Research on Green Innovation Countermeasures of Supporting the Circular Economy to Green Finance under Big Data. J. Enterp. Inf. Manag. 2021, 35, 1305–1322. [Google Scholar] [CrossRef]
- Jia, K.; Chen, Y. Research on the Impact of Data Factors on Enterprise Green Innovation—Evidence from Chinese Manufacturing Enterprises. Sustainability 2025, 17, 2184. [Google Scholar] [CrossRef]
- Moşteanu, N.R. Green Sustainable Regional Development and Digital Era. In Green Buildings and Renewable Energy: Med Green Forum 2019—Part of World Renewable Energy Congress and Network; Sayigh, A., Ed.; Springer International Publishing: Cham, Switzerland, 2020; pp. 181–197. ISBN 978-3-030-30841-4. [Google Scholar]
- Wu, L.; Sun, L.; Qi, P.; Ren, X.; Sun, X. Energy Endowment, Industrial Structure Upgrading, and CO2 Emissions in China: Revisiting Resource Curse in the Context of Carbon Emissions. Resour. Policy 2021, 74, 102329. [Google Scholar] [CrossRef]
- Liu, G.; Liu, Y.; Lee, C.-C. Growth Sources of Green Economy and Energy Consumption in China: New Evidence Accounting for Heterogeneous Regimes. Energy J. 2020, 41, 33–64. [Google Scholar] [CrossRef]
- Li, J.; Quan, T.; Han, Q. Open Government Data and Green Economic Growth. Econ. Anal. Policy 2025, 85, 2207–2218. [Google Scholar] [CrossRef]
- Jetzek, T.; Avital, M.; Bjorn-Andersen, N. Data-Driven Innovation through Open Government Data. J. Theor. Appl. Electron. Commer. Res. 2014, 9, 15–16. [Google Scholar] [CrossRef]
- Jetzek, T.; Avital, M.; Bjorn-Andersen, N. The Sustainable Value of Open Government Data. J. Assoc. Inf. Syst. 2019, 20, 702–734. [Google Scholar] [CrossRef]
- Chen, K.; Zhang, S. How Does Open Public Data Impact Enterprise Digital Transformation? Econ. Anal. Policy 2024, 83, 178–190. [Google Scholar] [CrossRef]
- Wu, D.; Xie, Y. Unveiling the Impact of Public Data Access on Collaborative Reduction of Pollutants and Carbon Emissions: Evidence from Open Government Data Policy. Energy Econ. 2024, 138, 107822. [Google Scholar] [CrossRef]
- Lange, S.; Pohl, J.; Santarius, T. Digitalization and Energy Consumption. Does ICT Reduce Energy Demand? Ecol. Econ. 2020, 176, 106760. [Google Scholar] [CrossRef]
- Kunkel, S.; Tyfield, D. Digitalisation, Sustainable Industrialisation and Digital Rebound—Asking the Right Questions for a Strategic Research Agenda. Energy Res. Soc. Sci. 2021, 82, 102295. [Google Scholar] [CrossRef]
- Masanet, E.; Shehabi, A.; Lei, N.; Smith, S.; Koomey, J. Recalibrating Global Data Center Energy-Use Estimates. Science 2020, 367, 984–986. [Google Scholar] [CrossRef]
- Danish; Khan, N.; Baloch, M.A.; Saud, S.; Fatima, T. The Effect of ICT on CO2 Emissions in Emerging Economies: Does the Level of Income Matters? Environ. Sci. Pollut. Res. 2018, 25, 22850–22860. [Google Scholar] [CrossRef]
- Khan, H.; Weili, L.; Khan, I. Examining the Effect of Information and Communication Technology, Innovations, and Renewable Energy Consumption on CO2 Emission: Evidence from BRICS Countries. Environ. Sci. Pollut. Res. 2022, 29, 47696–47712. [Google Scholar] [CrossRef] [PubMed]
- Wu, Q.; Li, S. Decarbonization by Digits: How Data Factors Drive Nonlinear Sustainable Dynamics in Manufacturing. Appl. Energy 2024, 374, 123967. [Google Scholar] [CrossRef]
- Lennerfors, T.T.; Fors, P.; Rooijen, J.v. ICT and Environmental Sustainability in a Changing Society: The View of Ecological World Systems Theory. Inf. Technol. People 2015, 28, 758–774. [Google Scholar] [CrossRef]
- Echegaray, F.; Hansstein, F.V. Assessing the Intention-Behavior Gap in Electronic Waste Recycling: The Case of Brazil. J. Clean. Prod. 2017, 142, 180–190. [Google Scholar] [CrossRef]
- Dias, P.; Bernardes, A.M.; Huda, N. Waste Electrical and Electronic Equipment (WEEE) Management: An Analysis on the Australian e-Waste Recycling Scheme. J. Clean. Prod. 2018, 197, 750–764. [Google Scholar] [CrossRef]
- Hu, X.; Jiang, Y.; Guo, P.; Li, M. How Does China’s Big Data Policy Affect the Digital Economy of Cities? Evidence from National Big Data Comprehensive Pilot Zones. Heliyon 2024, 10, e24638. [Google Scholar] [CrossRef]
- Casanovas, P.; De Koker, L.; Mendelson, D.; Watts, D. Regulation of Big Data: Perspectives on Strategy, Policy, Law and Privacy. Health Technol. 2017, 7, 335–349. [Google Scholar] [CrossRef]
- Hashem, I.A.T.; Chang, V.; Anuar, N.B.; Adewole, K.; Yaqoob, I.; Gani, A.; Ahmed, E.; Chiroma, H. The Role of Big Data in Smart City. Int. J. Inf. Manag. 2016, 36, 748–758. [Google Scholar] [CrossRef]
- McNeely, C.L.; Hahm, J. The Big (Data) Bang: Policy, Prospects, and Challenges. Rev. Policy Res. 2014, 31, 304–310. [Google Scholar] [CrossRef]
- Wang, W.; Zhang, H.; Sun, Z.; Wang, L.; Zhao, J.; Wu, F. Can Digital Policy Improve Corporate Sustainability? Empirical Evidence from China’s National Comprehensive Big Data Pilot Zones. Telecommun. Policy 2023, 47, 102617. [Google Scholar] [CrossRef]
- Bodó, B.; Irion, K.; Janssen, H.; Giannopoulou, A. Personal Data Ordering in Context: The Interaction of Meso-Level Data Governance Regimes with Macro Frameworks. Internet Policy Rev. 2021, 10, 2–31. [Google Scholar] [CrossRef]
- Wei, J.; Zhang, X. The Role of Big Data in Promoting Green Development: Based on the Quasi-Natural Experiment of the Big Data Experimental Zone. Int. J. Environ. Res. Public Health 2023, 20, 4097. [Google Scholar] [CrossRef] [PubMed]
- Broeders, D.; Cristiano, F.; Kaminska, M. In Search of Digital Sovereignty and Strategic Autonomy: Normative Power Europe to the Test of Its Geopolitical Ambitions. J. Common Mark. Stud. 2023, 61, 1261–1280. [Google Scholar] [CrossRef]
- Mac Síthigh, D.; Siems, M. The Chinese Social Credit System: A Model for Other Countries? Mod. Law Rev. 2019, 82, 1034–1071. [Google Scholar] [CrossRef]
- Bertot, J.C.; Gorham, U.; Jaeger, P.T.; Sarin, L.C.; Choi, H. Big Data, Open Government and e-Government: Issues, Policies and Recommendations. Inf. Polity 2014, 19, 5–16. [Google Scholar] [CrossRef]
- Osifo, O.C. A Study of Coordination Challenges in Digital Policy Implementation and Evaluation in Finland. In Proceedings of the 2020 43rd International Convention on Information, Communication and Electronic Technology (MIPRO), Opatija, Croatia, 28 September–2 October 2020; pp. 1402–1409. [Google Scholar]
- Zhao, J.; Liu, H.; Zhang, S.; Shu, K.; Fang, Q.; Zhang, W.; Tan, C.; Zhang, X.; Wang, Y.; Qi, Y. A “Five Rights Separation” Framework for Data Rights Confirmation in Data Element Circulation. Humanit. Soc. Sci. Commun. 2025, 12, 205. [Google Scholar] [CrossRef]
- Mahrenbach, L.; Mayer, K.; Pfeffer, J. Policy Visions of Big Data: Views from the Global South. Third World Q. 2018, 39, 1861–1882. [Google Scholar] [CrossRef]
- Jung, K.; Park, H.W. A Semantic (TRIZ) Network Analysis of South Korea’s “Open Public Data” Policy. Gov. Inf. Q. 2015, 32, 353–358. [Google Scholar] [CrossRef]
- Custers, B.; Uršič, H. Big Data and Data Reuse: A Taxonomy of Data Reuse for Balancing Big Data Benefits and Personal Data Protection. Available online: https://papers.ssrn.com/sol3/papers.cfm?abstract_id=3046774 (accessed on 21 July 2025).
- Spiekermann, S.; Acquisti, A.; Böhme, R.; Hui, K.-L. The Challenges of Personal Data Markets and Privacy. Electron Mark. 2015, 25, 161–167. [Google Scholar] [CrossRef]
- Kwon, T.H.; Kwak, J.H.; Kim, K. A Study on the Establishment of Policies for the Activation of a Big Data Industry and Prioritization of Policies: Lessons from Korea. Technol. Forecast. Soc. Change 2015, 96, 144–152. [Google Scholar] [CrossRef]
- Zuiderwijk, A.; Janssen, M. Open Data Policies, Their Implementation and Impact: A Framework for Comparison. Gov. Inf. Q. 2014, 31, 17–29. [Google Scholar] [CrossRef]
- Davies, P. The State of Evidence-Based Policy Evaluation and Its Role in Policy Formation. Natl. Inst. Econ. Rev. 2012, 219, R41–R52. [Google Scholar] [CrossRef]
- Head, B.W. Toward More “Evidence-Informed” Policy Making? Public Adm. Rev. 2016, 76, 472–484. [Google Scholar] [CrossRef]
- Sanderson, I. Evaluation, Policy Learning and Evidence-Based Policy Making. Public Adm. 2002, 80, 1–22. [Google Scholar] [CrossRef]
- Wollmann, H. Policy Evaluation and Evaluation Research. In Handbook of Public Policy Analysis; Routledge: London, UK, 2017; pp. 419–428. [Google Scholar]
- Nugroho, R.P.; Zuiderwijk, A.; Janssen, M.; de Jong, M. A Comparison of National Open Data Policies: Lessons Learned. Transform. Gov. People Process Policy 2015, 9, 286–308. [Google Scholar] [CrossRef]
- Zhou, M.; Wang, Y.; Huang, X.; Li, G. Can Open Government Data Policy Improve Firm Performance? Evidence from Listed Firms in China. Manag. Decis. Econ. 2023, 44, 2593–2603. [Google Scholar] [CrossRef]
- Ma, X.; Ruan, Y. How to Evaluate Green Development Policy Based on the PMC Index Model: Evidence from China. Int. J. Environ. Res. Public Health 2023, 20, 4249. [Google Scholar] [CrossRef]
- Turnpenny, J.; Radaelli, C.M.; Jordan, A.; Jacob, K. The Policy and Politics of Policy Appraisal: Emerging Trends and New Directions. J. Eur. Public Policy 2009, 16, 640–653. [Google Scholar] [CrossRef]
- Koura, A.; Abdeslam, B.; Mohamed, O. Assessing Public Policies: A Comprehensive Review of Evaluation Methods. 2024. Available online: https://zenodo.org/records/14035228 (accessed on 21 July 2025).
- Livermore, M.A.; Revesz, R.L. (Eds.) The Globalization of Cost-Benefit Analysis in Environmental Policy; Oxford University Press: Oxford, UK, 2013; ISBN 978-0-19-993438-6. [Google Scholar]
- Dehnhardt, A.; Grothmann, T.; Wagner, J. Cost-Benefit Analysis: What Limits its Use in Policy Making and How to Make it More Usable? A Case Study on Climate Change Adaptation in Germany. Environ. Sci. Policy 2022, 137, 53–60. [Google Scholar] [CrossRef]
- Tol, R.S.J. A Cost–Benefit Analysis of the EU 20/20/2020 Package. Energy Policy 2012, 49, 288–295. [Google Scholar] [CrossRef]
- Løken, E. Use of Multicriteria Decision Analysis Methods for Energy Planning Problems. Renew. Sustain. Energy Rev. 2007, 11, 1584–1595. [Google Scholar] [CrossRef]
- Browne, D.; O’Regan, B.; Moles, R. Use of Multi-Criteria Decision Analysis to Explore Alternative Domestic Energy and Electricity Policy Scenarios in an Irish City-Region. Energy 2010, 35, 518–528. [Google Scholar] [CrossRef]
- EvalCommunity. Logic Model: A Comprehensive Guide to Program Planning, Implementation, and Evaluation. Available online: https://www.evalcommunity.com/career-center/logic-models/ (accessed on 21 July 2025).
- Langley, T.; Gillespie, D.; Lewis, S.; Eminson, K.; Brennan, A.; Docherty, G.; Young, B. Developing Logic Models to Inform Public Health Policy Outcome Evaluation: An Example from Tobacco Control. J. Public Health 2020, 43, 639–646. [Google Scholar] [CrossRef] [PubMed]
- Petticrew, M.; Eastmure, E.; Mays, N.; Knai, C.; Bryden, A. The Public Health Responsibility Deal: How Should Such a Complex Public Health Policy be Assessed? Lancet 2012, 380, S11. [Google Scholar] [CrossRef]
- Ruiz Estrada, M.A. The Policy Modeling Research Consistency Index (PMC-Index). SSRN J. 2010. [Google Scholar] [CrossRef]
- Li, Y.; He, R.; Liu, J.; Li, C.; Xiong, J. Quantitative Evaluation of China’s Pork Industry Policy: A PMC Index Model Approach. Agriculture 2021, 11, 86. [Google Scholar] [CrossRef]
- Zhang, C.; Zhang, J.; Zhang, B. Quantitative Evaluation of Budget Performance Management Policy: Evidence from China. J. Econ. Surveys 2025. Early View. [Google Scholar] [CrossRef]
- Kuang, B.; Han, J.; Lu, X.; Zhang, X.; Fan, X. Quantitative Evaluation of China’s Cultivated Land Protection Policies Based on the PMC-Index Model. Land Use Policy 2020, 99, 105062. [Google Scholar] [CrossRef]
- Dai, S.; Zhang, W.; Zong, J.; Wang, Y.; Wang, G. How Effective is the Green Development Policy of China’s Yangtze River Economic Belt? A Quantitative Evaluation Based on the PMC-Index Model. Int. J. Environ. Res. Public Health 2021, 18, 7676. [Google Scholar] [CrossRef]
- Xu, L.; Xi, M. Quantitative Evaluation of Policies for Combining Medical and Nursing Care Based on the LDA–PMC Model: A Comparative Analysis of Typical Chinese Provinces. Public Organ. Rev. 2024, 24, 693–713. [Google Scholar] [CrossRef]
- Kherwa, P.; Bansal, P. Topic Modeling: A Comprehensive Review. EAI Endorsed Trans. Scalable Inf. Syst. 2019, 7, 159623. [Google Scholar] [CrossRef]
- Shen, H.; Xiong, P.; Yang, L.; Zhou, L. Quantitative Evaluation of Science and Technology Financial Policies Based on the PMC-AE Index Model: A Case Study of China’s Science and Technology Financial Policies since the 13th Five-Year Plan. PLoS ONE 2024, 19, e0307529. [Google Scholar] [CrossRef]
- Provan, G. Toward Explainable AutoEncoder-Based Diagnosis of Dynamical Systems. Algorithms 2023, 16, 178. [Google Scholar] [CrossRef]
- Griffiths, T.L.; Steyvers, M. Finding Scientific Topics. Proc. Natl. Acad. Sci. USA 2004, 101, 5228–5235. [Google Scholar] [CrossRef] [PubMed]
- Hong, S.; Wang, T.; Fu, X.; Li, G. Research on Quantitative Evaluation of Digital Economy Policy in China Based on the PMC Index Model. PLoS ONE 2024, 19, e0298312. [Google Scholar] [CrossRef] [PubMed]
- Landis, J.R.; Koch, G.G. The Measurement of Observer Agreement for Categorical Data. Biometrics 1977, 33, 159–174. [Google Scholar] [CrossRef] [PubMed]
- Liu, Y.; Li, J.; Xu, Y. Quantitative Evaluation of High-Tech Industry Policies Based on the PMC-Index Model: A Case Study of China’s Beijing-Tianjin-Hebei Region. Sustainability 2022, 14, 9338. [Google Scholar] [CrossRef]
- Geng, R.; Wu, J. Assess the Efficacy of China’s Inter-Provincial Government Services Policy: A Quantitative Evaluation Based on PMC-Index Model. PLoS ONE 2024, 19, e0310491. [Google Scholar] [CrossRef]
- Zhang, Y.; Jin, Y.; Xue, X. Evaluation of Construction Industrialization Policy Based on PMC Index Model. In Proceedings of the International Conference on Construction and Real Estate Management 2018, Charleston, SC, USA, 9–10 August 2018; pp. 192–201. [Google Scholar]
- Ruiz Estrada, M.A. Policy Modeling: Definition, Classification and Evaluation. J. Policy Model. 2011, 33, 523–536. [Google Scholar] [CrossRef]
- Acemoglu, D.; Aghion, P.; Bursztyn, L.; Hemous, D. The Environment and Directed Technical Change. Am. Econ. Rev. 2012, 102, 131–166. [Google Scholar] [CrossRef]
- Xie, B.; Liu, R.; Dwivedi, R. Digital Economy, Structural Deviation, and Regional Carbon Emissions. J. Clean. Prod. 2024, 434, 139890. [Google Scholar] [CrossRef]
- Lah, O. Breaking the Silos: Integrated Approaches to Foster Sustainable Development and Climate Action. Sustain. Earth Rev. 2025, 8, 1. [Google Scholar] [CrossRef]

| No. | High-Frequency Words | Frequency | No. | High-Frequency Words | Frequency |
|---|---|---|---|---|---|
| 1 | service | 2303 | 16 | collaboration | 641 |
| 2 | platform | 1701 | 17 | openness | 641 |
| 3 | industry | 1360 | 18 | network | 601 |
| 4 | innovation | 1334 | 19 | infrastructure | 598 |
| 5 | digitalization | 1323 | 20 | sector | 583 |
| 6 | government affairs | 1141 | 21 | product | 554 |
| 7 | public data | 1091 | 22 | system | 551 |
| 8 | big data | 1063 | 23 | industrial | 509 |
| 9 | sharing | 835 | 24 | internet | 504 |
| 10 | supervision | 776 | 25 | data resources | 500 |
| 11 | integration | 756 | 26 | model | 479 |
| 12 | information | 725 | 27 | data center | 464 |
| 13 | transaction | 708 | 28 | scenario | 460 |
| 14 | cultivation | 699 | 29 | data security | 455 |
| 15 | governance | 681 | 30 | ecology | 411 |
| Topic Code | Topic Name | Topic Top 10 High Probability Feature Words |
|---|---|---|
| T-1 | Data Element Industry | industrial park, e-commerce, terminal, equipment, high-end, digital commerce, agricultural products, satellite, materials, satellite |
| T-2 | Data Resource Management | collection, acquisition, application, administration, public data sharing, data processing, review, materials, regulatory management, legal benefits |
| T-3 | Data Element Trading System | data trading platform, data authorization operation, profit, data vendor, profit distribution, rights, data infrastructure system, pricing, data property rights, standardization |
| T-4 | Service Platform Construction | cyberspace administration, one-stop, community, law enforcement, handle affairs, construction project, online services, command, handle, licenses and permits |
| T-5 | E-Government | administration, public affairs, assessment, grassroots, licenses and permits, iteration, agency, approval, prevention and control, official |
| No. | Province | Region | Policy Title | Issue Date |
|---|---|---|---|---|
| P1 | Guangdong | East China | Guangdong Province Action Plan for Market-Oriented Allocation Reform of Data Elements | July 2021 |
| P2 | Zhejiang | East China | Zhejiang Province Pilot Plan for Advancing the Value Realization of Industrial Data | November 2022 |
| P3 | Jiangsu | East China | Opinions of the General Office of the Jiangsu Provincial Government on Accelerating the Release of Data Element Value and Cultivating a Thriving Data Industry | November 2024 |
| P4 | Tianjin | East China | Tianjin’s Implementation Plan for Deepening the Reform of Market-Oriented Allocation of Data Elements | September 2024 |
| P5 | Shanghai | East China | Shanghai Action Plan for Promoting the Innovation and Development of the Data Element Industry (2023–2025) | August 2023 |
| P6 | Hubei | Central China | Implementation Plan for the Construction of the Data Element Market in Hubei Province | August 2023 |
| P7 | Jiangxi | Central China | Jiangxi Province Data Application Regulations | November 2023 |
| P8 | Henan | Central China | Henan Province Big Data Industry Development Action Plan (2022–2025) | September 2022 |
| P9 | Guizhou | West China | Implementation Plan for the Market-oriented Allocation of Data Elements in Guizhou Province | August 2023 |
| P10 | Sichuan | West China | Implementation Plan for the Comprehensive Reform of the Market-oriented Allocation of Data Elements in Sichuan Province | January 2024 |
| P11 | Chongqing | West China | Chongqing Action Program for Reform of Market-based Allocation of Data Elements | December 2023 |
| P12 | Ningxia | West China | Implementation opinions of Ningxia Hui Autonomous Region on promoting the development of data element market | May 2024 |
| P13 | Xinjiang | West China | Measures for Public Data Management in Xinjiang Uygur Autonomous Region | May 2024 |
| P14 | Jilin | Northeast China | Guiding Opinions on the Development of the Big Data Industry in Jilin Province | February 2024 |
| P15 | Liaoning | Northeast China | Regulations on the Development of Big Data in Liaoning Province | May 2022 |
| LDA-Identified Topic Name | Corresponding PMC Secondary Variable |
|---|---|
| T-1: Data Element Industry | X5-1: Data Element Industry |
| T-2: Data Resource Management | X5-2: Data Resource Management |
| T-3: Data Element Market Trading Rules | X5-3: Data Element Trading Rules |
| T-4: Service Platform Construction | X5-4: Service Platform Construction |
| T-5: E-Government | X5-5: E-Government |
| Code | Primary Variable | Sub-Code | Secondary Variable | Reference Standard |
|---|---|---|---|---|
| X1 | Policy Nature | X1-1 | Prediction | Whether the policy includes predictive content (1: Yes, 0: No) |
| X1-2 | Recommendation | Whether the policy contains recommendations (1: Yes, 0: No) | ||
| X1-3 | Supervision | Whether the policy reflects supervision (1: Yes, 0: No) | ||
| X1-4 | Guidance | Whether the policy provides guidance (1: Yes, 0: No) | ||
| X1-5 | Description | Whether the policy describes the current development status (1: Yes, 0: No) | ||
| X2 | Policy Timeliness | X2-1 | Long-Term | Whether the policy covers more than 5 years (1: Yes, 0: No) |
| X2-2 | Medium-Term | Whether the policy covers 3–5 years (1: Yes, 0: No) | ||
| X2-3 | Short-Term | Whether the policy covers less than 3 years (1: Yes, 0: No) | ||
| X3 | Policy Receptors | X3-1 | Government Departments | Whether the policy applies to government departments (1: Yes, 0: No) |
| X3-2 | Enterprises | Whether the policy applies to enterprises (1: Yes, 0: No) | ||
| X3-3 | Public | Whether the policy applies to the public (1: Yes, 0: No) | ||
| X3-4 | Universities & Research Institutes | Whether the policy applies to universities and research institutes (1: Yes, 0: No) | ||
| X3-5 | Service Agencies & Platforms | Whether the policy applies to service agencies and platforms (1: Yes, 0: No) | ||
| X4 | Policy Perspective | X4-1 | Macro-Level | Whether the policy focuses on a macro level (1: Yes, 0: No) |
| X4-2 | Meso-Level | Whether the policy focuses on a meso level (1: Yes, 0: No) | ||
| X4-3 | Micro-Level | Whether the policy focuses on a micro level (1: Yes, 0: No) | ||
| X5 | Policy Focus | X5-1 | Data Element Industry | Whether the policy involves the development of the data element industry (1: Yes, 0: No) |
| X5-2 | Data Resource Management | Whether the policy involves data resource management (1: Yes, 0: No) | ||
| X5-3 | Data Element Trading System | Whether the policy involves the trading rules for data elements (1: Yes, 0: No) | ||
| X5-4 | Service Platform Construction | Whether the policy involves the construction of service platforms (1: Yes, 0: No) | ||
| X5-5 | E-Government | Whether the policy involves e-government (1: Yes, 0: No) | ||
| X6 | Policy Tool | X6-1 | Financial Support | Whether the policy involves financial support (1: Yes, 0: No) |
| X6-2 | Tax Incentives | Whether the policy involves tax incentives (1: Yes, 0: No) | ||
| X6-3 | Talent Development | Whether the policy involves talent development (1: Yes, 0: No) | ||
| X6-4 | Technical Support | Whether the policy involves technical support (1: Yes, 0: No) | ||
| X6-5 | Promotion and Publicity | Whether the policy involves promotion and publicity (1: Yes, 0: No) | ||
| X6-6 | Regulatory Control | Whether the policy involves regulatory control (1: Yes, 0: No) | ||
| X6-7 | Technical Standards | Whether the policy involves technical standards (1: Yes, 0: No) | ||
| X6-8 | Resource Integration | Whether the policy involves resource integration (1: Yes, 0: No) | ||
| X7 | Content Evaluation | X7-1 | Clear Goals | Whether the policy sets specific goals (1: Yes, 0: No) |
| X7-2 | Sufficient Basis | Whether the policy is based on real-world practice (1: Yes, 0: No) | ||
| X7-3 | Scientific Planning | Whether the implementation plan of the policy is scientific (1: Yes, 0: No) | ||
| X7-4 | Detailed Roadmap | Whether the policy includes a detailed timeline (1: Yes, 0: No) | ||
| X8 | Green Development Assessment | X8-1 | Ecological Governance Enhancement | Whether the policy involves using data elements to improve ecological governance (1: Yes, 0: No) |
| X8-2 | Energy Efficiency Improvement | Whether the policy involves using data elements to improve energy utilization efficiency (1: Yes, 0: No) | ||
| X8-3 | Waste Resource Utilization | Whether the policy involves using data elements to improve the efficiency of waste resource utilization (1: Yes, 0: No) | ||
| X8-4 | Carbon Emissions Management | Whether the policy involves using data elements to improve carbon emissions management (1: Yes, 0: No) | ||
| X9 | Policy Guarantee | X9-1 | Pilot Construction | Whether the policy involves pilot construction (1: Yes, 0: No) |
| X9-2 | Collaboration and Division of Labor | Whether the policy involves collaboration and division of labor (1: Yes, 0: No) | ||
| X9-3 | Overall Leadership | Whether the policy involves overall leadership (1: Yes, 0: No) | ||
| X9-4 | Supervision and Evaluation | Whether the policy involves supervision and evaluation (1: Yes, 0: No) |
| Primary Variable | Secondary Variable |
|---|---|
| X1 | X1-1, X1-2, X1-3, X1-4, X1-5 |
| X2 | X2-1, X2-2, X2-3 |
| X3 | X3-1, X3-2, X3-3, X3-4, X3-5 |
| X4 | X4-1, X4-2, X4-3 |
| X5 | X5-1, X5-2, X5-3, X5-4, X5-5 |
| X6 | X6-1, X6-2, X6-3, X6-4, X6-5, X6-6, X6-7, X6-8 |
| X7 | X7-1, X7-2, X7-3, X7-4 |
| X8 | X8-1, X8-2, X8-3, X8-4 |
| X9 | X9-1, X9-2, X9-3, X9-4 |
| PMC-Index | 0–3.9 | 4.0–5.9 | 6.0–7.9 | 8.0–9.0 |
|---|---|---|---|---|
| Evaluation grades | Poor | Acceptable | Good | Perfect |
| X1 | X2 | X3 | X4 | X5 | X6 | X7 | X8 | X9 | PMC-Index | Grade | Rank | |
|---|---|---|---|---|---|---|---|---|---|---|---|---|
| P1 | 0.80 | 0.33 | 0.80 | 1.00 | 1.00 | 0.63 | 0.75 | 0.75 | 1.00 | 7.06 | Good | 1 |
| P2 | 0.80 | 0.33 | 1.00 | 1.00 | 0.80 | 0.75 | 1.00 | 0.00 | 0.75 | 6.43 | Good | 5 |
| P3 | 0.60 | 0.33 | 1.00 | 1.00 | 1.00 | 0.88 | 0.75 | 0.25 | 0.50 | 6.31 | Good | 6 |
| P4 | 0.60 | 0.67 | 0.80 | 1.00 | 1.00 | 0.75 | 1.00 | 0.50 | 0.50 | 6.82 | Good | 2 |
| P5 | 0.60 | 0.33 | 1.00 | 1.00 | 0.80 | 1.00 | 1.00 | 0.50 | 0.50 | 6.73 | Good | 3 |
| P6 | 0.80 | 0.33 | 1.00 | 1.00 | 0.80 | 0.75 | 1.00 | 0.50 | 0.50 | 6.68 | Good | 4 |
| P7 | 0.60 | 1.00 | 0.60 | 0.67 | 0.80 | 0.50 | 0.25 | 0.50 | 0.50 | 5.42 | Acceptable | 12 |
| P8 | 0.40 | 0.33 | 0.80 | 1.00 | 0.80 | 0.75 | 0.75 | 0.25 | 1.00 | 6.08 | Good | 9 |
| P9 | 0.60 | 0.33 | 0.80 | 1.00 | 0.80 | 0.50 | 0.75 | 0.00 | 0.50 | 5.28 | Acceptable | 13 |
| P10 | 0.60 | 0.33 | 0.80 | 0.67 | 1.00 | 0.50 | 0.75 | 0.25 | 0.75 | 5.65 | Acceptable | 10 |
| P11 | 0.60 | 0.33 | 1.00 | 1.00 | 1.00 | 0.75 | 0.75 | 0.00 | 0.75 | 6.18 | Good | 7 |
| P12 | 0.60 | 0.33 | 0.80 | 1.00 | 1.00 | 0.75 | 0.50 | 0.25 | 0.25 | 5.48 | Acceptable | 11 |
| P13 | 0.40 | 0.33 | 0.80 | 0.67 | 0.60 | 0.63 | 0.75 | 0.25 | 0.50 | 4.93 | Acceptable | 15 |
| P14 | 0.60 | 0.33 | 0.80 | 0.67 | 1.00 | 0.75 | 0.75 | 0.25 | 1.00 | 6.15 | Good | 8 |
| P15 | 0.40 | 1.00 | 0.80 | 0.67 | 0.80 | 0.75 | 0.25 | 0.00 | 0.50 | 5.17 | Acceptable | 14 |
| Average | 0.60 | 0.44 | 0.85 | 0.89 | 0.88 | 0.71 | 0.73 | 0.28 | 0.63 | 6.03 | / | / |
Disclaimer/Publisher’s Note: The statements, opinions and data contained in all publications are solely those of the individual author(s) and contributor(s) and not of MDPI and/or the editor(s). MDPI and/or the editor(s) disclaim responsibility for any injury to people or property resulting from any ideas, methods, instructions or products referred to in the content. |
© 2025 by the authors. Licensee MDPI, Basel, Switzerland. This article is an open access article distributed under the terms and conditions of the Creative Commons Attribution (CC BY) license (https://creativecommons.org/licenses/by/4.0/).
Share and Cite
Hu, S.; Wang, X. A Text-Mining-Based Evaluation of Data Element Policies in China: Integrating the LDA and PMC Models in the Context of Green Development. Sustainability 2025, 17, 6758. https://doi.org/10.3390/su17156758
Hu S, Wang X. A Text-Mining-Based Evaluation of Data Element Policies in China: Integrating the LDA and PMC Models in the Context of Green Development. Sustainability. 2025; 17(15):6758. https://doi.org/10.3390/su17156758
Chicago/Turabian StyleHu, Shuigen, and Xianbo Wang. 2025. "A Text-Mining-Based Evaluation of Data Element Policies in China: Integrating the LDA and PMC Models in the Context of Green Development" Sustainability 17, no. 15: 6758. https://doi.org/10.3390/su17156758
APA StyleHu, S., & Wang, X. (2025). A Text-Mining-Based Evaluation of Data Element Policies in China: Integrating the LDA and PMC Models in the Context of Green Development. Sustainability, 17(15), 6758. https://doi.org/10.3390/su17156758