1. Introduction
The global energy transition has intensified pressure on fossil fuel-dependent economies to balance economic growth with environmental sustainability. Among them, the Gulf Cooperation Council (GCC) countries—Bahrain, Kuwait, Oman, Qatar, Saudi Arabia, and the United Arab Emirates—stand out. Their economies remain anchored in hydrocarbon exports, yet domestically, natural gas and energy intensity dynamics have become increasingly central to electricity, desalination, and industrial use, placing it at the heart of the region’s energy–environment trade-off.
Although natural gas is promoted as a cleaner bridge fuel, its climate advantage is conditional. Without institutional reform and greater energy efficiency, expanded gas use may continue driving carbon dioxide (CO2) emissions, jeopardizing climate goals. This raises a key question: Can natural gas support decarbonization, or does it require complementary governance and efficiency improvements to avoid worsening environmental outcomes?
Energy efficiency—commonly measured by energy intensity (energy use per unit of GDP)—is a cornerstone of emission mitigation. However, in weak governance contexts, its impact may be diluted by rebound effects, poor implementation, or persistent market distortions like subsidies. Institutional quality thus becomes a key enabler. Effective institutions—those reducing corruption, enforcing regulations, and coordinating policies—can amplify the gains from efficiency measures. This suggests a moderating role: strong institutions may improve the environmental benefits of energy policies.
More specifically, institutional strength—particularly in areas such as corruption control, regulatory enforcement, and administrative coordination—can support policy coherence, ensure compliance, and reduce inefficiencies in energy markets. This supports the hypothesis that better institutional environments enhance the environmental payoff of energy efficiency reforms.
Despite growing literature on the energy–growth–emissions nexus, gaps remain. First, few studies examine natural gas consumption as an independent driver of CO2 emissions in hydrocarbon-heavy economies like the GCC. Second, while governance is often treated as a control variable, its interaction with technical factors like efficiency is underexplored. Third, the GCC is underrepresented in cross-country empirical studies, despite its relevance to global energy reform.
In response, we develop a panel model for six GCC countries (2000–2023) to estimate the effects of natural gas consumption and energy efficiency on CO2 emissions. We explicitly test whether institutional quality—proxied by the Control of Corruption Index—modifies the emissions impact of energy inefficiency. Additionally, we evaluate how the emissions effect of natural gas has shifted before and after 2014, a period of major subsidy reform and regulatory change in the GCC. The finding that gas’s emissions impact turned negative post-2014 highlights how institutional evolution and policy design can reshape the environmental profile of fossil fuels. These results provide timely insights for policy strategies in resource-rich economies navigating energy and institutional transitions.
To strengthen the analysis, we conduct robustness checks using two additional institutional indicators—Regulatory Quality and Government Effectiveness—from the Worldwide Governance Indicators. These confirm the moderating role of governance and reinforce the broader claim: institutional context is critical in shaping the environmental outcomes of gas use and efficiency strategies in fossil fuel-based economies.
Accordingly, this study addresses the following research question:
To what extent do natural gas consumption and energy efficiency drive CO2 emissions in GCC countries, and how does institutional quality—particularly Control of Corruption—moderate these relationships, especially following the 2014 energy reforms?
To investigate this question, we construct a panel dataset covering six GCC countries over the period 2000–2023. We estimate a fixed-effects panel model with interaction terms, allowing us to capture cross-country variation, temporal policy shifts, and institutional dynamics. The empirical strategy explicitly tests multiple hypotheses regarding the emissions effects of energy intensity, natural gas consumption, and institutional moderation. Robustness is assessed through alternative governance proxies and advanced estimators, including Two-Stage Least Squares (2SLS), Driscoll–Kraay regressions, and System Generalized Method of Moments (GMM).
In addressing this question, the study offers four novel contributions to the literature:
It introduces institutional quality as a moderator in the energy–emissions nexus—specifically examining how governance influences the environmental effects of natural gas consumption and energy inefficiency.
It provides a GCC-specific empirical assessment, moving beyond generic MENA or developing-country samples and accounting for regional governance structures.
It embeds natural gas emissions analysis within a post-reform governance framework, highlighting the evolving role of institutions in fossil-fuel-based economies.
It applies a multi-method econometric design to ensure robust and internally valid findings.
Taken together, this research contributes a governance-centered approach to energy–environment analysis in resource-rich contexts, offering new insights into how institutional quality shapes the carbon trajectory of gas-based energy systems.
2. Literature Review
The relationship between energy consumption, economic growth, and environmental sustainability has long been a central concern in energy economics. A substantial body of literature has investigated the drivers of carbon dioxide (CO
2) emissions, with an emphasis on aggregate energy use, economic development, and renewable energy adoption A substantial body of literature has investigated this relationship [
1,
2,
3,
4,
5]. However, natural gas consumption—despite its rising prominence as a so-called “transition fuel”—remains underexplored in empirical emissions modeling, particularly in natural gas-dependent regions such as the Gulf Cooperation Council (GCC). Its perceived advantage as a “bridge fuel” is rooted in its lower CO
2 intensity compared to coal and oil [
6].
2.1. Natural Gas and Environmental Impact
Natural gas is frequently promoted as a cleaner alternative to coal and oil due to its lower carbon intensity. However, its environmental advantage is conditional on full lifecycle emissions and institutional oversight. Studies show that upstream and midstream activities—such as extraction, processing, and liquefaction—can significantly increase emissions and air pollutants, including methane and volatile organic compounds [
7,
8]. Lifecycle assessments also show that production methods, such as enhanced recovery or CO
2 sequestration, significantly influence the environmental footprint of gas use [
9]. In cases of weak regulatory enforcement, unconventional gas development poses additional environmental and health risks, and public perception becomes an important factor influencing sustainability outcomes [
10,
11]. Even at the power generation stage, the efficiency and environmental impact of natural gas technologies differ significantly, suggesting that technical performance is not uniform [
12].
While studies such as [
13,
14] confirm that natural gas emits less CO
2 than other fossil fuels, they typically do not examine how institutional quality or energy efficiency influence those outcomes. Similarly, policy reports on GCC energy transitions for example [
15] often emphasize the role of natural gas descriptively, but without embedding it into formal econometric models. Empirical analyses consistently show a positive correlation between increased natural gas consumption and CO
2 emissions in GCC nations—even when switching from oil to gas [
16,
17]. This reveals that although natural gas is cleaner per unit, its large-scale use remains environmentally significant. Recent studies such as [
18] argue that if managed through proper policy and rent reallocation, fossil-based economies like the GCC can use oil and gas revenues to finance renewable investments and transition measures—though this remains more of a strategic opportunity than an empirically confirmed outcome. As a result, the emissions impact of natural gas remains insufficiently tested in empirical frameworks that consider institutional or efficiency dynamics—particularly in gas-intensive, resource-rich economies like the GCC.
These empirical insights are consistent with theoretical frameworks such as the Environmental Kuznets Curve (EKC), which suggests emissions rise with industrialization but decline as economies mature and adopt cleaner technologies—conditional on governance capacity. Similarly, the Energy Ladder Hypothesis posits a shift from high- to low-emission fuels as countries develop. However, in fossil-fuel-dependent economies like the GCC, the transition to cleaner outcomes is not automatic. Our study contributes by embedding these theoretical ideas into an empirical framework that considers how institutional quality and efficiency interact with natural gas use to shape CO2 outcomes.
2.2. Energy Efficiency as a Carbon Mitigation Strategy
Energy efficiency—commonly measured as energy intensity (energy use per unit of output)—is widely recognized as a cost-effective strategy for reducing emissions. Several studies have shown that efficiency improvements reduce total energy consumption and thereby CO
2 emissions [
19,
20,
21]. However, this effect is not guaranteed. Rebound effects, where increased efficiency leads to increased energy use through behavioral or economic responses, have been documented [
22]. Moreover, most empirical models treat energy efficiency as a standalone technical variable, ignoring the institutional context that may influence its success [
23,
24]. Sector-specific evidence from China, for example, shows that regulatory enforcement in the building sector played a key role in turning efficiency gains into emissions reductions [
25]. Among GCC countries, the UAE has recorded stronger energy efficiency gains than its peers, possibly reflecting broader energy reforms [
26], while Bahrain and Kuwait show weaker performance over time, consistent with persistent efficiency challenges. This trend is further supported by recent analysis confirming a GCC-wide decline in total-factor energy efficiency from 2000 to 2019, largely attributed to technological stagnation and institutional inertia [
27].
2.3. The Role of Institutions and Regulatory Quality
Institutional quality—especially regulatory capacity—is increasingly viewed as a key driver of energy and environmental outcomes. Research confirms that stronger institutions can improve environmental governance, facilitate clean energy transitions, and enforce efficiency standards [
28,
29,
30]. In both developed and developing contexts, high-quality institutions are linked to better emissions outcomes and more effective policy delivery [
31,
32]. For instance, ref. [
33] shows that Regulatory Quality not only enhances domestic energy efficiency but also produces positive spillover effects on neighboring countries. In G7 economies, institutional quality moderates the link between innovation, efficiency, and sustainability [
34]. In the context of the GCC, empirical evidence suggests notable variation across countries. In ref. [
26], the authors find that the UAE has made measurable progress in energy efficiency—likely aided by regulatory enforcement—while other countries lag. Similarly, in ref. [
35], the authors show that institutional quality significantly affects economic efficiency in the GCC, reinforcing the role of governance structures in shaping energy and climate outcomes. Despite this, few empirical studies test how institutional strength might amplify the emissions-reducing effect of energy efficiency. Most studies use institutional indicators only as control variables (e.g., [
36]), thereby overlooking important interaction mechanisms. This oversight limits understanding of how governance quality can enhance the environmental effectiveness of technical interventions.
Newer empirical evidence further supports this link. In ref. [
37], the authors find that stronger institutions, particularly through Control of Corruption, significantly reduce climate vulnerability across GCC states. This aligns with [
38], who show that corruption has an especially detrimental effect on emissions performance at early pollution levels, delaying reform momentum in resource-dependent economies.
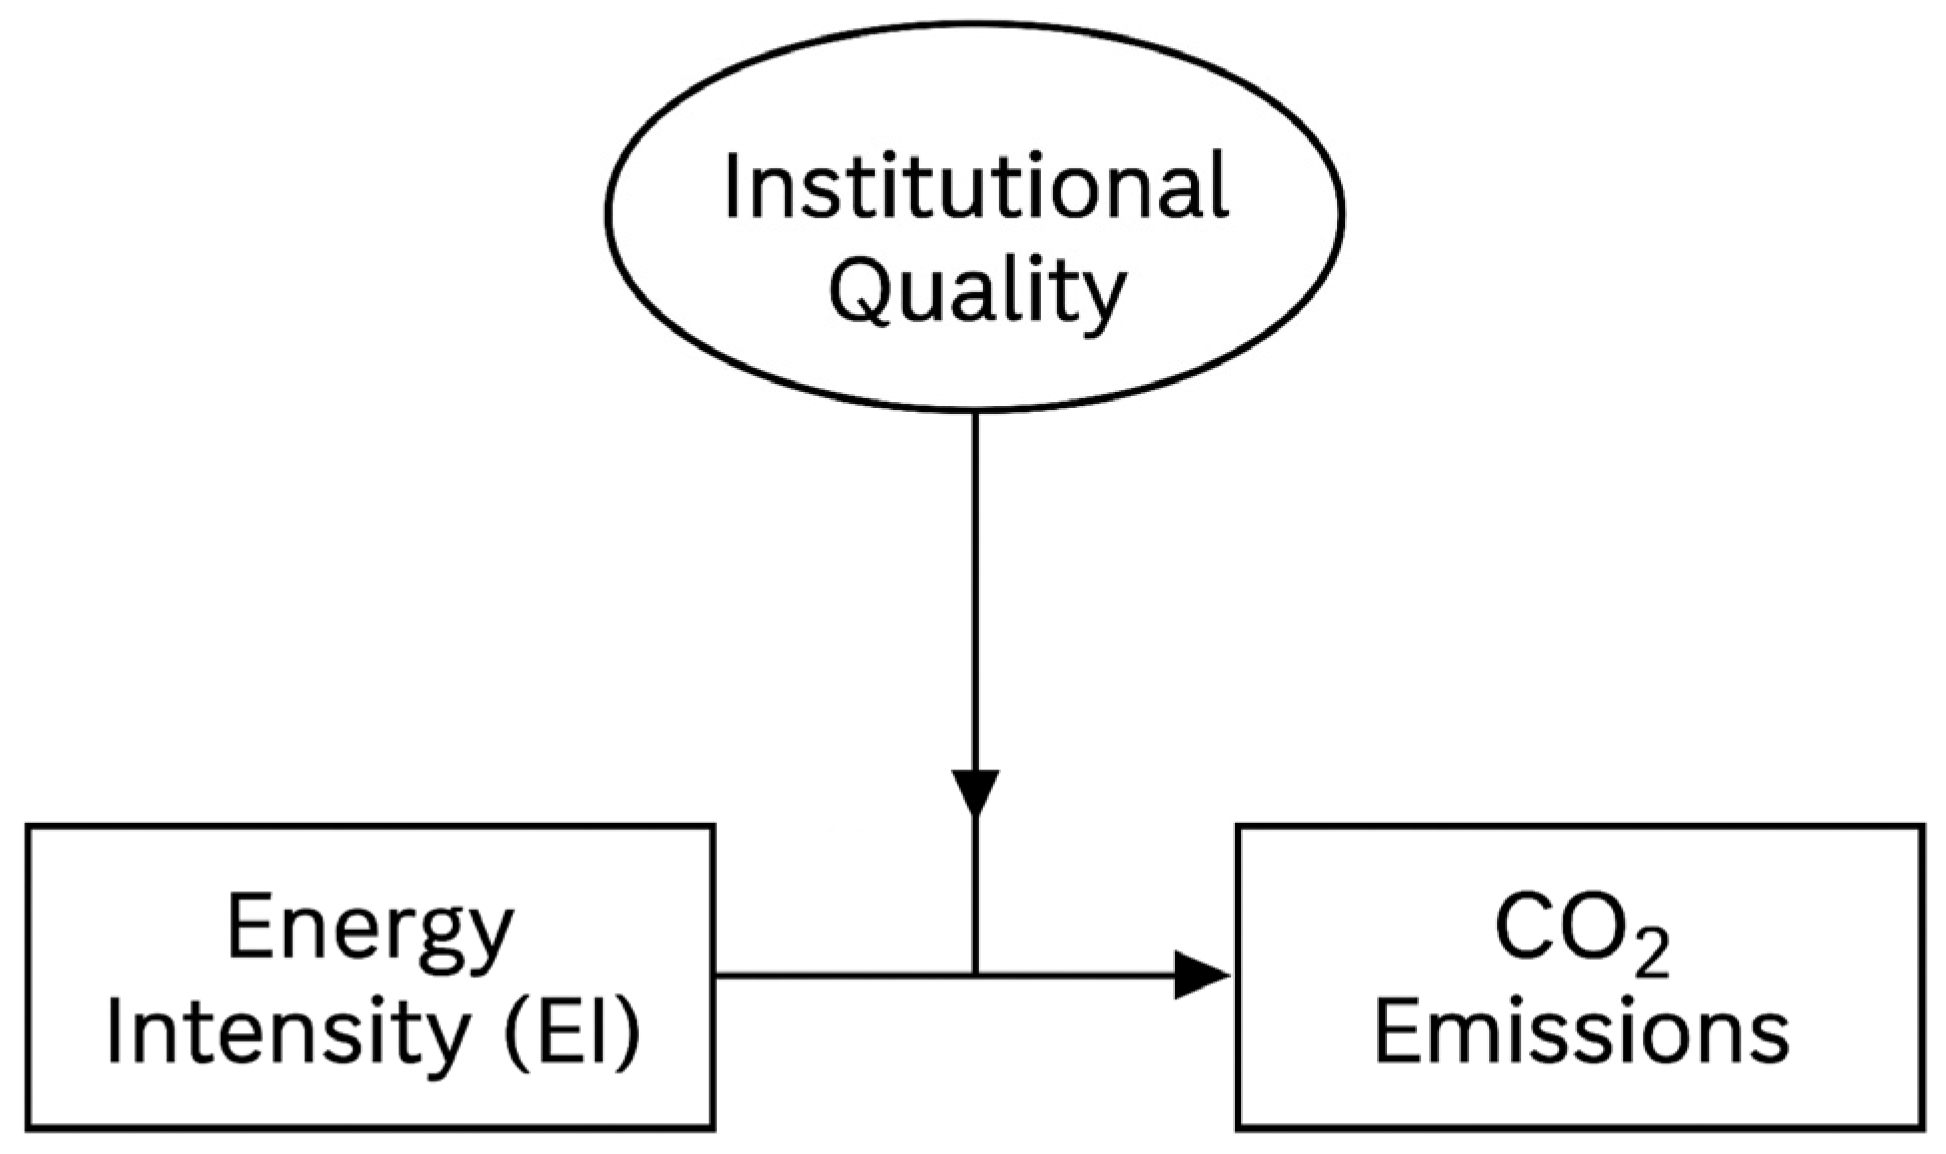
The interaction between energy intensity and institutional quality (EI × INST) captures how the governance environment influences the emissions impact of energy use. Theoretically, stronger institutions can mitigate inefficiencies in energy systems, enforce environmental standards, and channel investments into cleaner technologies. For example, countries with more effective governance are likely to implement energy regulations that reduce waste and enforce industrial compliance. Thus, we expect that the marginal effect of energy intensity on CO2 emissions diminishes as institutional quality improves. Conversely, in weaker institutional settings, high energy intensity may lead to unchecked emissions due to regulatory failure or rent-seeking behavior. This interaction term allows us to assess whether better institutions condition the environmental outcomes of energy consumption.
This relationship is visualized in
Figure 1, which presents a conceptual framework illustrating how institutional quality moderates the effect of energy intensity on CO
2 emissions. It highlights the theoretical pathway through which stronger institutions attenuate the emissions impact of inefficient energy use, guiding our empirical modeling strategy.
2.4. Study Contribution, Objectives and Hypotheses
Despite growing attention to the energy–environment nexus, key empirical gaps remain—particularly in hydrocarbon-dependent economies like the Gulf Cooperation Council (GCC) countries. Prior studies often aggregate fossil fuels, overlooking the distinct environmental footprint of natural gas, which plays a central role in the region’s energy mix. Furthermore, while energy efficiency is widely endorsed as a cost-effective mitigation tool, most models treat its effect as purely technical, without considering how institutional conditions may shape its effectiveness. The GCC countries, undergoing parallel energy and governance transitions, offer a compelling context to investigate these interactions.
This study contributes to the literature in three main ways. First, it isolates natural gas consumption as a standalone explanatory variable of CO2 emissions, moving beyond the use of composite fossil fuel metrics. Second, it introduces a moderated panel model to assess whether institutional quality conditions the effectiveness of energy efficiency, using the Control of Corruption index as a baseline proxy. Third, it examines temporal shifts in the gas–emissions relationship before and after 2014—a year of major energy pricing and regulatory reforms across the GCC.
To this end, the study pursues five specific objectives:
(i) To estimate the emissions impact of natural gas consumption in the GCC;
(ii) To test the effect of energy intensity as a proxy for energy efficiency;
(iii) To evaluate whether institutional quality moderates this relationship;
(iv) To verify robustness using alternative governance proxies—Regulatory Quality and Government Effectiveness;
(v) To assess whether the emissions effect of natural gas shifted after the 2014 energy reforms.
Building on the prior literature but extending it through interaction modeling, institutional context, and policy reform sensitivity, this study revisits six well-established relationships through a governance-centered lens. In doing so, it applies a robust multi-method design—including 2SLS, Driscoll–Kraay, and System GMM estimators—tailored to the underexplored GCC context.
Hypotheses
This study formulates and empirically tests six main hypotheses. First, it examines whether natural gas consumption increases CO2 emissions in the GCC (H1), with particular attention to how this relationship may evolve across the 2014 reform boundary, reflecting the influence of changing policy and regulatory environments. Second (H2), it assesses whether higher energy intensity contributes to greater CO2 emissions, and whether this relationship is shaped by governance quality, thereby capturing how institutional conditions affect efficiency-performance outcomes. Third (H3), the study re-evaluates the environmental impact of economic growth, hypothesizing that GDP per capita is positively associated with emissions, while also considering the moderating role of institutional structures and natural resource dependency. Fourth (H4), it explores the classic rentier-state hypothesis that oil rents as a percentage of GDP are positively linked to CO2 emissions, contextualized within recent fiscal reforms and governance changes in the region. Fifth (H5), the research investigates whether governance quality can moderate the environmental effects of energy inefficiency, testing this through multiple institutional proxies. Finally (H6), the study hypothesizes that the emissions impact of natural gas underwent a significant shift after 2014, aligning with broader energy pricing and institutional reforms across the GCC.
H1. Natural gas consumption increases CO2 emissions in the GCC.
We assess how this relationship evolves across the 2014 reform boundary to capture the influence of changing policy and regulatory environments.
H2. Higher energy intensity leads to greater CO2 emissions.
Beyond direct effects, we test whether this relationship is moderated by governance quality, thereby capturing efficiency-performance variation under different institutional settings.
H3. Economic growth (GDP per capita) contributes positively to emissions.
This hypothesis is re-examined in light of institutional structures and resource dependency, using techniques to address potential endogeneity.
H4. Oil rents (% of GDP) are positively associated with CO2 emissions.
We revisit this classic rentier-state relationship within the context of fiscal reform and evolving governance practices in the GCC.
H5. Governance quality moderates the emissions impact of energy inefficiency.
We test whether stronger institutions help mitigate the environmental cost of high energy intensity, validated using multiple institutional proxies.
H6. The emissions impact of natural gas changed significantly after 2014.
This structural break hypothesis captures the shifting environmental profile of natural gas use in the post-reform era.
While grounded in prior theory, these hypotheses are applied within a governance-sensitive, reform-aware, and GCC-specific empirical framework, offering a novel contribution to the energy–environment literature.
Finally, this study advances the governance–energy–emissions nexus by examining how institutional quality modifies the environmental effects of natural gas consumption and energy inefficiency in the GCC. Prior studies often treat governance as a passive control factor, overlooking how institutions actively shape emissions outcomes [
36]. Our moderated interaction approach builds on the Environmental Kuznets Curve (EKC) and adapts it for fossil-fuel economies undergoing institutional reform. Recent evidence by [
39] confirms that Government Effectiveness significantly conditions the CO
2 impacts of renewable investment, while the authors of [
15] show how post-reform energy strategies in the GCC are reshaping transition trajectories. By integrating natural gas dynamics and post-2014 governance reforms into a multi-method empirical framework, this study offers a more nuanced, institutionally grounded view of emissions pathways in fossil-reliant economies.
2.5. Control Variables and Rationale
To ensure the robustness of our model and minimize omitted variable bias, we include several control variables commonly found in the emissions literature. GDP per capita is a standard variable in Environmental Kuznets Curve (EKC) studies, reflecting the scale and structural effects of economic growth on emissions [
40,
41]. Oil rents (% of GDP) are particularly relevant for the GCC context, capturing the influence of resource dependence and rent-driven economic cycles on carbon intensity [
6,
16]. Renewable energy share is included to account for the clean energy transition, which can mitigate emissions even in hydrocarbon-based economies [
42]. Consumer Price Index (CPI) is used as a proxy for inflation and macroeconomic pressures, which may indirectly affect energy consumption and emissions through pricing and demand shifts [
43]. Lastly, energy intensity (EI) serves as both a key explanatory variable and a control in some specifications, reflecting the efficiency with which economies use energy relative to output. The inclusion of these controls ensures a theoretically grounded and empirically comprehensive model suited to the energy–environment nexus in resource-rich settings.
3. Methodology
3.1. Empirical Framework
This study employs a balanced panel dataset of six Gulf Cooperation Council (GCC) countries from 2000 to 2023 to examine whether institutional quality moderates the emissions effects of natural gas consumption and energy inefficiency. The dependent variable is the natural logarithm of CO2 emissions per capita. Key explanatory variables include energy intensity (MJ per USD 2017 PPP GDP), natural gas consumption (exajoules), and institutional quality, proxied by the Control of Corruption Index from the Worldwide Governance Indicators (WGI). Control variables comprise log-transformed GDP per capita, oil rents (as a share of GDP), renewable energy share, and the Consumer Price Index (CPI). Additional indicators of institutional strength—Regulatory Quality and Government Effectiveness—are used in robustness checks. The panel design allows us to capture cross-country variation in institutional quality and time-specific shocks, such as global price volatility, thereby facilitating interaction testing and addressing potential omitted variable bias through fixed-effects estimation.
3.2. Variable Transformations and Data Coverage
To correct for skewness and allow for elasticity-based interpretation, we applied natural logarithmic transformations to two variables:
All other variables were retained in levels due to their scale, distribution, or interpretability. These transformations are consistently reflected in model specifications, tables, and regression outputs to ensure clarity and replicability.
While most variables were available through 2023 via the World Bank and IEA, two regressors—energy intensity and renewable energy share—were only available through 2021. To preserve the integrity and consistency of the panel, we estimated the values for 2022 and 2023 using a 3-year centered moving average based on their historical trends. These estimates were limited to independent variables with stable behavior over time, introducing minimal risk of bias. Importantly, no estimation was applied to the dependent variable (CO2 emissions) or to institutional indicators.
Table 1 summarizes all variables, definitions, transformations, and data sources.
3.3. Model Specification
We estimated a fixed-effects panel model with year dummies and clustered standard errors. The baseline model is
where
LnCO2it: Log of CO2 emissions per capita (metric tons), excluding LULUCF.
NGCit: Natural gas consumption (exajoules).
EIit: Energy intensity (MJ per $2017 PPP GDP).
CCit: Control of Corruption Index (−2.5 to +2.5).
EIit × CCit: Interaction term testing if governance strengthens the emissions-reducing impact of energy efficiency.
lnGDPpcit: Log of GDP per capita (constant 2021 PPP).
OilRentit: Oil rents (% of GDP)
CPIit is the Consumer Price Index (2010 = 100).
R_Energyit: Renewable energy consumption as % of total energy use.
Country fixed effects (μᵢ) accounts for time-invariant heterogeneity across countries, and year fixed effects (λt) control for time-specific shocks. Robust standard errors clustered at the country level are used to correct for heteroskedasticity and autocorrelation.
This specification allows us to test whether higher institutional quality amplifies the emissions-reducing effect of energy efficiency.
We initially tested two additional regressors—Gross Capital Formation and Manufacturing Value Added—to address concerns of omitted industrial effects. However, these introduced multicollinearity (VIF > 10) and were statistically insignificant. Their exclusion did not alter the stability of the main results (see
Table A1 in
Appendix A).
3.4. Robustness and Estimation Strategy
To address endogeneity concerns—particularly for variables such as GDP per capita and the interaction term capturing the moderating effect of institutional quality (mod4)—we conducted several robustness checks:
Two-Stage Least Squares (2SLS): We instrument the potentially endogenous interaction term (mod4) with its lagged value (L.mod4). The first-stage regression confirms instrument strength (F = 675.09, p < 0.001), and the second-stage retains statistical significance for key variables (e.g., mod4 coefficient = 4.31, p = 0.03).
System GMM: This estimator addresses dynamic endogeneity. While diagnostic tests confirm instrument validity (Hansen J = 1.000; Sargan p = 0.101), results should be interpreted cautiously due to the small number of cross-sectional units (N = 6). Still, the model yields significant and directionally consistent estimates for key regressors (mod4, EE, GDP, NGCEJ), supporting the robustness of the findings.
Driscoll–Kraay standard errors: Applied to correct for heteroskedasticity and cross-sectional dependence in panels with large T and small N. These estimates remain consistent in direction and magnitude with the baseline fixed-effects model.
In sum, while fixed effects serve as the primary specification, these additional estimators reinforce the robustness of our results and address concerns related to endogeneity, reverse causality, and omitted variable bias.
3.5. Preliminary Diagnostic Tests and Model Validity
Before estimating the main panel regression models, we conducted a series of preliminary diagnostic tests to assess the validity of the model assumptions and the suitability of the panel data methodology.
We applied the Levin–Lin–Chu (LLC) and Im–Pesaran–Shin (IPS) unit root tests. The results indicate that all core variables are stationary at level or first difference, supporting the use of panel regression techniques.
To examine long-run relationships among the variables, we used the Pedroni cointegration test. The results suggest statistically significant cointegration across dimensions, justifying the use of level-based panel estimators for long-run inference.
Variance inflation factors (VIFs) were calculated to check for multicollinearity among regressors. All VIF values were below the commonly accepted threshold of 5, indicating no severe multicollinearity.
These tests validate the use of panel estimators and confirm model integrity.
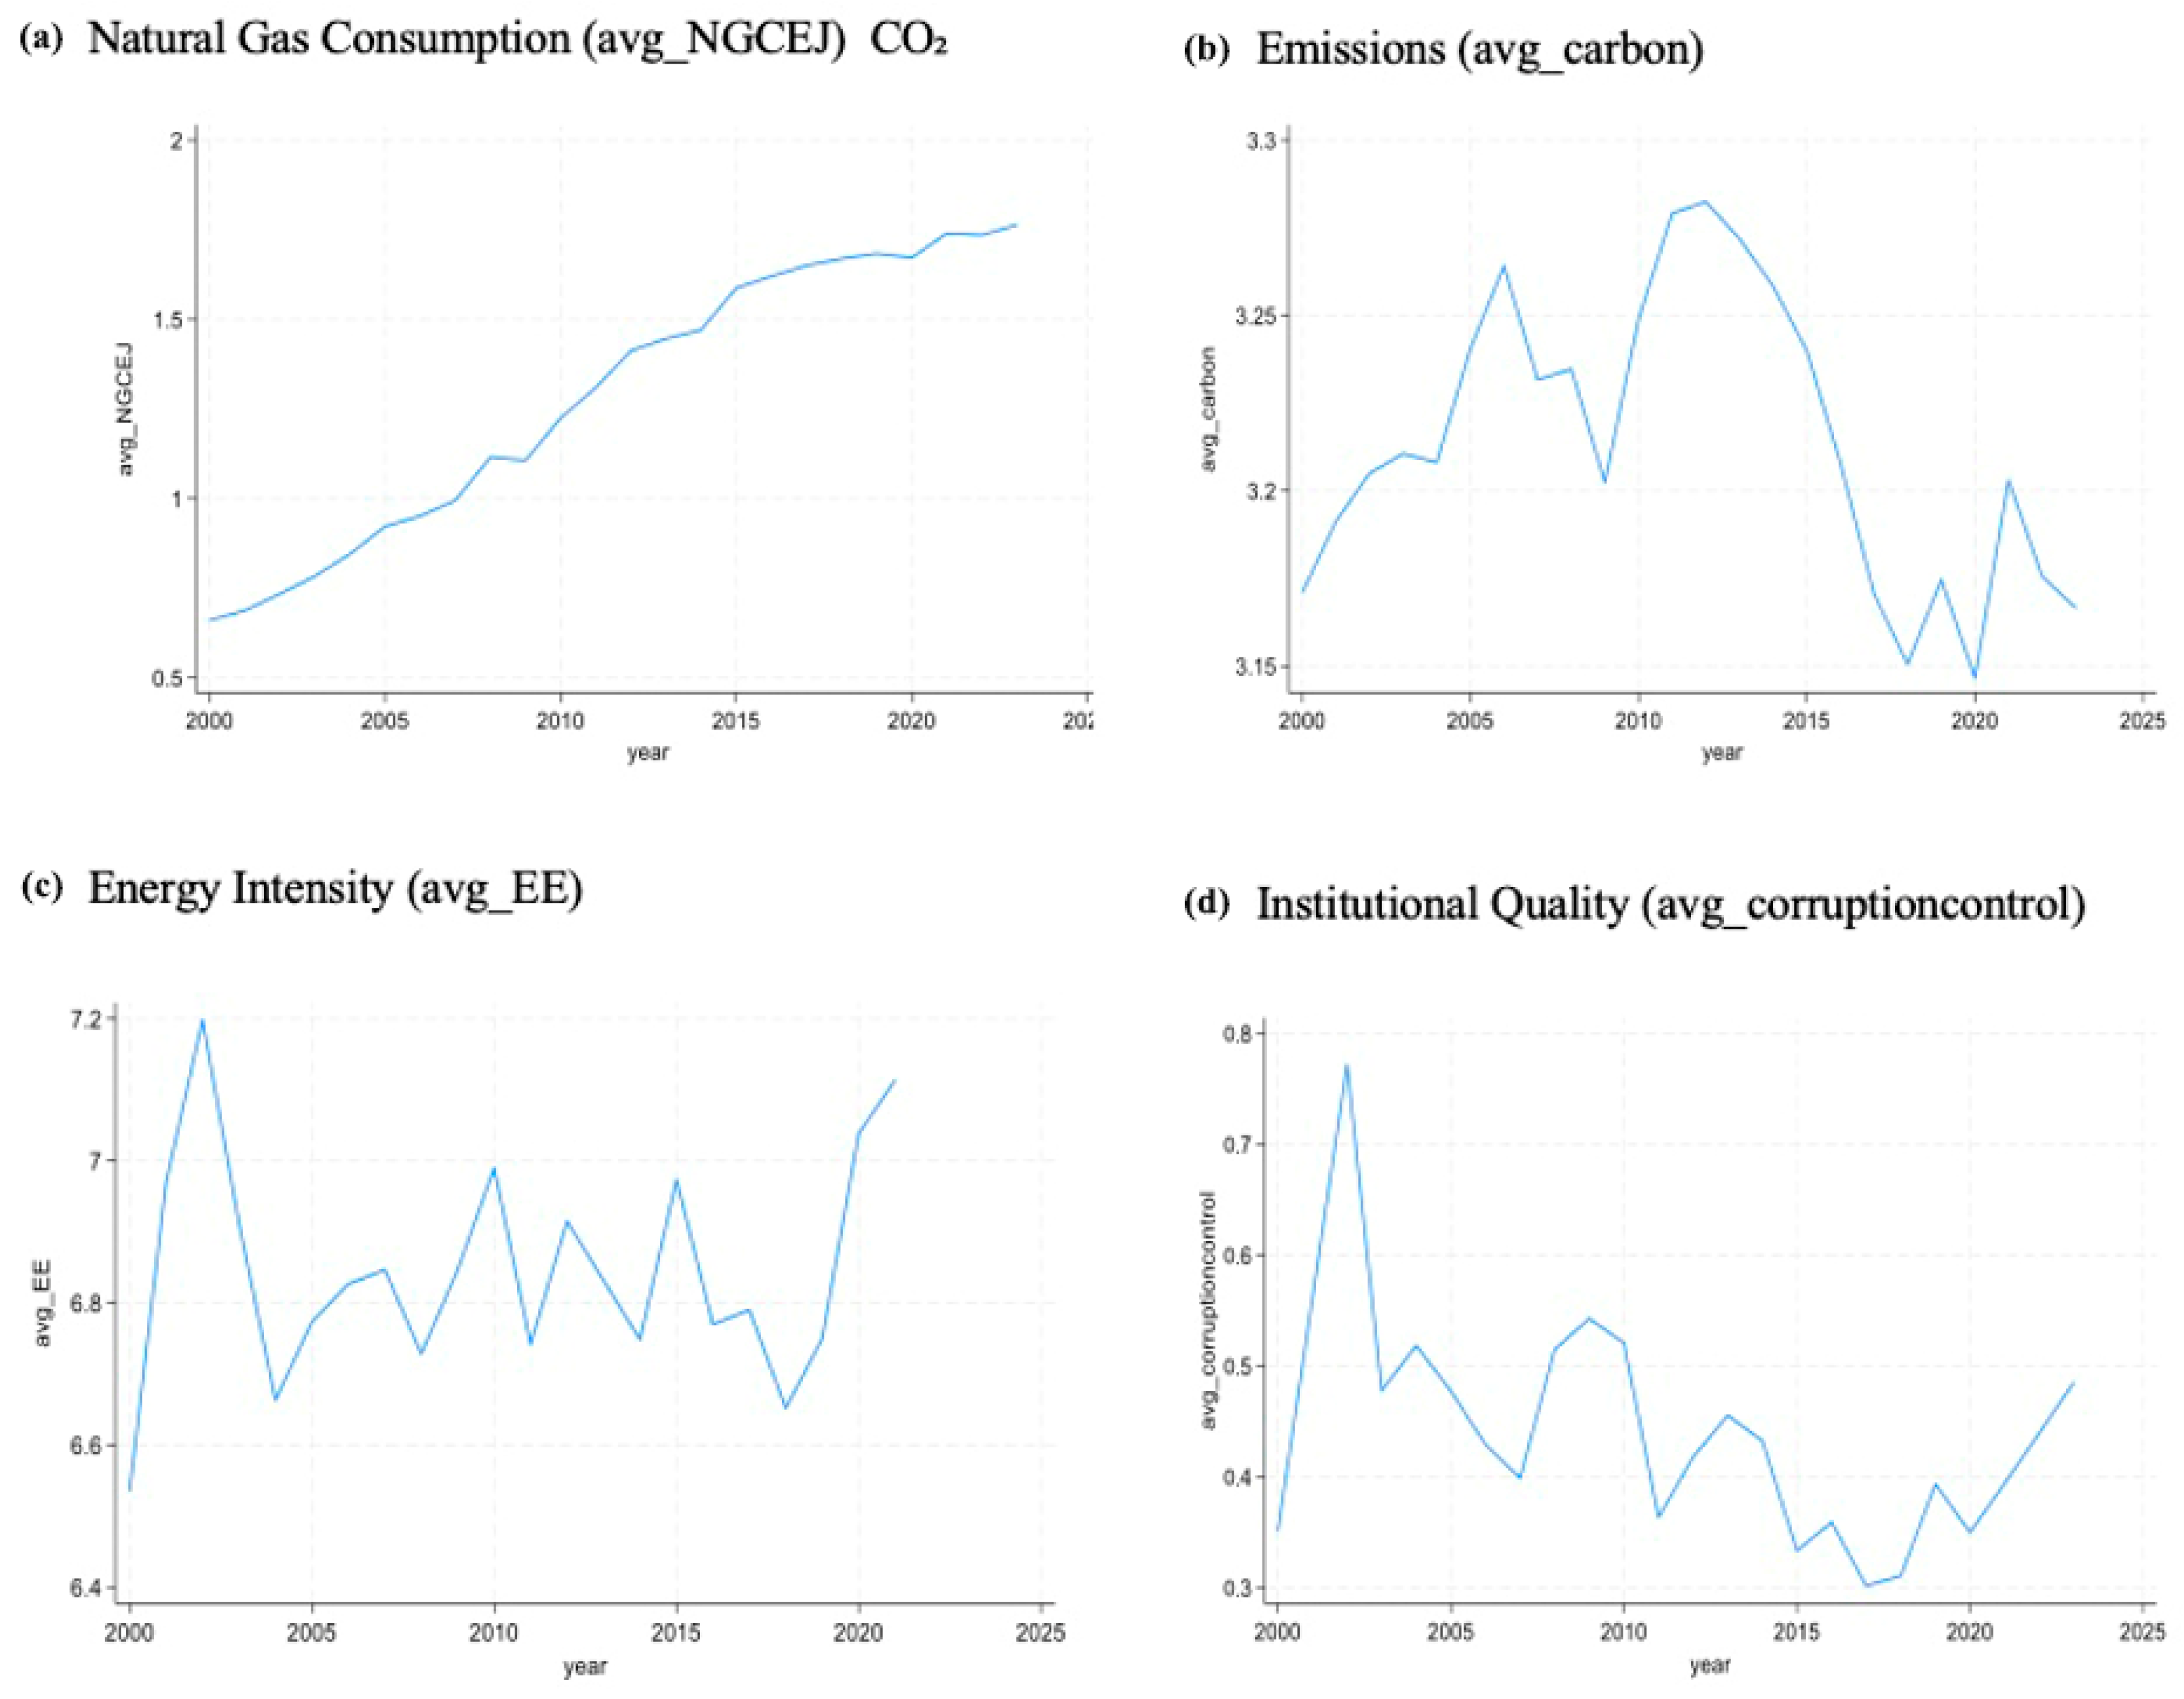
3.6. Descriptive Trends of Key Variables
Figure 2 illustrates annual average trends for (a) natural gas consumption (NGCEJ), (b) CO
2 emissions per capita (excluding LULUCF), (c) energy intensity (EI, MJ per USD 2017 PPP GDP), and (d) institutional quality (proxied by the Control of Corruption Index) across six GCC countries from 2000 to 2023.
Shaded areas reflect major regional reform periods (post-2014), and trend lines help illustrate key inflection points. Notably, CO2 emissions begin to decouple from gas use after 2014, institutional quality shows modest improvement, and energy intensity declines over time—reinforcing the rationale for our empirical interaction models. Annual averages are for (a) natural gas consumption (NGCEJ), (b) CO2 emissions per capita, (c) energy intensity (MJ per USD 2017 PPP GDP), and (d) institutional quality (Control of Corruption Index).
4. Results
4.1. Descriptive Statistics
Table 2 presents the descriptive statistics for the key variables used in the analysis. The dependent variable, CO
2 emissions per capita, shows substantial variation across countries and time, with a mean of 26.58 and a standard deviation of 10.55.
Energy intensity, used as a proxy for energy efficiency, has a mean of 6.85 and a standard deviation of 1.64, supporting its inclusion in log form due to skewness.
Natural gas consumption, measured in exajoules, shows notable variation (mean = 1.28; SD = 1.11), reflecting differing reliance across the GCC states.
The Control of Corruption Index ranges from −0.36 to 1.56 (mean = 0.436; SD = 0.440), indicating institutional heterogeneity within the region.
GDP per capita averages USD 66,700 (PPP-adjusted, constant), with a standard deviation of 25,290, consistent with the high-income profile of GCC economies.
Oil rents, expressed as a share of GDP, average 28.8%, reinforcing the rent-based structure of these economies.
Renewable energy consumption remains minimal, with a mean share of just 0.05%, underscoring the early stage of energy transition.
Finally, the Consumer Price Index (CPI) shows moderate inflationary dynamics, with an average of 99.79 (base year 2010) and a standard deviation of 19.67.
Overall, the variables display sufficient variation and scale consistency, justifying their use in panel regression analysis.
4.2. Correlation Matrix
Table 3 presents Pearson correlation coefficients for the key variables in the study. As expected, CO
2 emissions per capita are strongly and positively correlated with GDP per capita (r = 0.88,
p < 0.01), consistent with early-stage Environmental Kuznets Curve dynamics. Emissions also show a moderate positive correlation with energy intensity (r = 0.38), highlighting the link between inefficiency and environmental degradation.
Natural gas consumption shows negative correlations with both emissions (r = −0.23) and energy intensity (r = −0.46), suggesting its potential role in displacing more carbon-intensive fuels. Institutional quality, proxied by Control of Corruption, is positively associated with both emissions (r = 0.39) and income (r = 0.60), reflecting governance structures in high-income, resource-exporting economies.
Other controls exhibit expected patterns: oil rents show modest negative links with GDP and efficiency, while renewable energy—though limited in uptake—is positively associated with gas use and institutional quality. Variance inflation factors (all < 2) confirm that multicollinearity is not a concern in the regression model.
4.3. Preliminary Tests and Diagnostics
4.3.1. Stationarity Tests
To assess the time-series properties of the panel data, we conducted Levin–Lin–Chu (LLC) and Im–Pesaran–Shin (IPS) unit root tests. The null hypothesis assumes the presence of a unit root, while the alternative suggests stationarity. Results, presented in
Table 4, indicate that most variables—including CO
2 emissions per capita, natural gas consumption, GDP per capita, Control of Corruption, oil rents, renewable energy share, and CPI—are non-stationary in levels but stationary in first differences. The exception is energy intensity, which appears stationary in both levels and differences.
These results suggest that most series are integrated of order one, I(1). Since the final model uses log-transformed variables and fixed-effects estimation with time dummies, stationarity concerns are addressed through transformation and specification.
All variables except energy intensity (lnEI) are non-stationary in levels but stationary in first differences, suggesting they are integrated of order one, I(1).
The coefficient on energy intensity is positive and statistically significant, indicating that higher energy intensity (i.e., lower energy efficiency) is associated with increased CO2 emissions. This confirms that improved energy efficiency—reflected in lower energy intensity—helps reduce emissions.
4.3.2. Multicollinearity (VIF)
To verify the reliability of the estimates, we assess multicollinearity using variance inflation factors (VIFs). All VIF values as reported in
Table 5 are well below the conventional threshold (mean VIF ≈ 1.82), indicating no multicollinearity concern. Furthermore, when testing alternate proxies for institutional quality—Regulatory Quality and Government Effectiveness—the interaction terms remain statistically significant. This reinforces Hypotheses 4 and 5, confirming that the moderating effect of institutional quality on the energy intensity–emissions link holds across institutional dimensions.
4.3.3. Cointegration Tests
To assess the existence of long-run equilibrium relationships among the key panel variables, we apply both Kao and Pedroni cointegration tests. The Kao test results (Modified DF t = −1.5806, p = 0.057; Augmented DF t = −0.0267, p = 0.0489) indicate marginal rejection of the null hypothesis of no cointegration. The Pedroni test provides stronger confirmation, with multiple statistics (e.g., Modified PP t = 3.2952, p = 0.0005; ADF t = −3.2921, p = 0.0005) rejecting the null at the 1% level.
Table 6 presents the full summary of both Kao and Pedroni test results, confirming the existence of stable long-run relationships among CO
2 emissions, energy intensity, natural gas consumption, and institutional quality within the GCC sample.
4.4. Estimation Results
4.4.1. Baseline Regression
Table 7 reports the estimation results from the baseline fixed-effects model examining the relationship between carbon emissions and the key explanatory variables: energy intensity, natural gas consumption, institutional quality (measured by Control of Corruption), economic development (GDP per capita), oil rents (% of GDP), renewable energy consumption, and consumer prices (CPI). An interaction term between EI and institutional quality measured by Control of Corruption (CC) is also included to test the moderating effect of governance capacity on energy intensity outcomes.
The coefficient on energy intensity (EI) is positive and statistically significant (β = 0.057, p < 0.01), indicating that a 1-unit increase in EI leads to approximately 5.7% higher CO2 emissions, holding other factors constant. However, this effect is moderated by institutional quality: the interaction term (EI × Control of Corruption) is also positive but smaller (β = 0.037, p < 0.05), implying that higher corruption levels intensify the emissions impact of inefficient energy use. In contrast, better governance dampens this relationship. Natural gas consumption (NGC) has a small but significant negative effect, suggesting a potential substitution effect away from more carbon-intensive fuels.
These results confirm that energy inefficiency, institutional quality, and natural gas consumption significantly shape CO2 emissions across the GCC.
To better interpret the interaction between energy intensity and institutional quality, we computed the marginal effects of energy intensity on CO
2 emissions across observed levels of institutional quality using the coefficients reported in
Table 4. For example, when the Control of Corruption Index is at a low value of −0.5 (typical of weaker institutional environments in the sample), the marginal effect of energy intensity on CO
2 emissions is positive and statistically significant, indicating that higher energy intensity is associated with increased emissions. In contrast, when the Control of Corruption score increases to 0.5 (reflecting stronger institutional quality), the marginal effect of energy intensity is markedly reduced and becomes statistically insignificant. This pattern suggests that stronger institutions are effective in moderating the environmental impact of energy intensity, likely through improved policy implementation, regulatory enforcement, and incentives for clean energy adoption.
4.4.2. Interpretation of Key Findings
The fixed-effects estimation results show that energy intensity has a strong positive coefficient (β ≈ 0.057, p < 0.001), indicating that lower energy efficiency significantly increases CO2 emissions. This finding confirms Hypothesis H2, supporting the premise that economies with higher energy intensity—reflecting inefficient energy use—tend to emit more CO2.
Institutional quality, proxied by Control of Corruption, enters with a statistically significant negative coefficient (β ≈ −0.237, p = 0.038). This supports Hypothesis H3, suggesting that stronger governance mechanisms and oversight reduce emissions. Effective Control of Corruption likely promotes cleaner production practices, better regulatory compliance, and improved investment in sustainable technologies.
The interaction term between energy intensity and Control of Corruption is positive and significant (β ≈ 0.037, p = 0.037). While the sign may initially seem counterintuitive, it confirms Hypothesis H4 by indicating that the marginal effect of energy intensity on CO2 emissions diminishes as institutional quality improves. Stronger governance environments appear to mitigate the emissions impact of inefficient energy use—perhaps through better monitoring, enforcement, or policy support mechanisms.
Natural gas consumption shows a statistically significant negative effect on CO2 emissions (β ≈ −0.043, p < 0.001), supporting Hypothesis H1. This suggests that gas, although a fossil fuel, has served as a cleaner substitute for more carbon-intensive fuels (e.g., crude oil and heavy fuel oil) during the post-reform years—thereby lowering the emissions trajectory in gas-abundant GCC economies.
GDP per capita is positively associated with emissions (β ≈ 0.946, p < 0.001), consistent with Hypothesis H6 and early-stage Environmental Kuznets Curve (EKC) dynamics. This implies that emissions tend to rise with income, especially in economies that are still transitioning from fossil-dependent growth to low-carbon models.
Oil rents also have a positive and statistically significant effect (β ≈ 0.003, p = 0.013), indicating that hydrocarbon dependence continues to exert upward pressure on emissions. This reinforces the importance of economic diversification and decoupling fiscal policy from volatile fossil revenues.
The Consumer Price Index (CPI) is significantly positive (β ≈ 0.002, p < 0.001), which may reflect two effects: higher inflation increasing energy-related production costs (leading to greater emissions) or CPI acting as a proxy for elevated economic activity levels.
Renewable energy share has a negative coefficient (β ≈ −0.024) but is not statistically significant (p = 0.601). This is likely due to the still-limited deployment of large-scale renewable energy infrastructure across the GCC during most of the study period. Despite recent gains, the renewable share remains low in historical terms, reducing its detectable statistical impact in the model.
Overall, the control variables behave in expected directions. GDP per capita has the largest positive effect (β ≈ 0.946), reinforcing the role of income-driven emissions growth in resource-dependent economies. Oil rents also exhibit a modest but statistically significant contribution to emissions, indicating that hydrocarbon revenues continue to fuel carbon-intensive activities. The significant CPI coefficient suggests that either higher inflation contributes to greater energy use (through input cost pass-through) or proxies for unobserved macroeconomic activity. Renewable energy share, while negative as expected, is not statistically significant—likely due to its historically low penetration in the GCC, where most clean energy projects reached scale only after 2020. These results highlight that traditional economic variables remain key drivers of environmental pressure, but their effects can be modulated through improved institutional quality and targeted reforms.
4.5. Temporal Dynamics of Natural Gas Consumption and Emissions
We further examine the role of natural gas via a split-sample regression as shown in
Table 8 before and after 2014, a period of major energy subsidy reforms in the GCC. Before 2014, natural gas consumption positively drove emissions (coef ≈ +0.101,
p < 0.001), likely reflecting that cheap gas was used inefficiently. After 2014, the coefficient flips to −0.094 (
p = 0.029). This inversion of the sign suggests a policy-induced shift enabled natural gas to act as a cleaner substitute, supporting decarbonization. These findings are consistent with Hypothesis 1, which posits that natural gas consumption has a time-dependent effect on emissions—initially contributing to environmental harm, but supporting decarbonization once embedded within effective regulatory and pricing frameworks. The improved model fit in the post-2014 sample (R
2 = 0.9754) underscores the growing alignment between energy use and climate objectives in the region.
Figure 3 visually illustrates this turning point. While natural gas consumption steadily increased throughout the period, the emissions trend shifted downward after 2014—highlighting the role of institutional and policy reforms in altering the emissions impact of fuel use.
4.6. Model Selection and Classical Diagnostics
To ensure the robustness of the panel regression estimates, a series of diagnostic and specification tests were conducted, including cointegration analysis, model selection (fixed vs. random effects), and standard regression diagnostics.
4.6.1. Hausman Test
To identify the appropriate estimation approach, we conducted a Hausman test comparing fixed and random effects. The test statistic (χ
2(8) = 119.38,
p < 0.0001) as shown in
Table 9 strongly rejects the null hypothesis, indicating that fixed effects are preferred due to potential correlation between regressors and unobserved heterogeneity. Additionally, the non-positive definiteness of the covariance difference matrix further supports this choice.
We also tested the joint significance of time fixed effects using the testparm i.year command. The F-test result (F (20, 97) = 2.99, p = 0.0002) confirms that year dummies are jointly significant, justifying their inclusion to control for time-specific shocks such as global oil price fluctuations, policy shifts, or technological changes.
4.6.2. Time Effects Test
To assess whether time-specific effects influence the dependent variable, we conducted a joint F-test on the year dummies included in the panel regression model. The results, reported in
Table 10, reveal that the year fixed effects are jointly significant (F (20, 97) = 2.99,
p = 0.0002). This provides strong statistical justification for their inclusion. As they help control for unobserved temporal shocks—such as fluctuations in global oil prices, regional reforms, or external macroeconomic trends—that may otherwise confound the estimated relationships. Including year dummies enhances model specification and isolates the cross-sectional variation of interest.
4.6.3. Classical Assumptions Diagnostics
To validate the underlying assumptions of the panel regression model, we conducted tests for heteroskedasticity, autocorrelation, and cross-sectional dependence. Results are summarized in
Table 11. The Breusch–Pagan test indicates that residuals are homoscedastic (χ
2 = 0.45,
p = 0.5028). However, the Wooldridge test detects first-order autocorrelation (F (1, 5) = 32.21,
p = 0.0024), which we address by using robust standard errors clustered by year. The Pesaran CD test shows no evidence of cross-sectional dependence (CD = −1.253,
p = 0.210), supporting the panel’s suitability for fixed-effects analysis. Together, these diagnostics affirm the model’s internal statistical reliability.
The Breusch–Pagan test confirms that residuals are homoscedastic (χ2 = 0.45, p = 0.5028), indicating no violation of the constant variance assumption. The Wooldridge test, however, detects significant first-order autocorrelation (F (1, 5) = 32.21, p = 0.0024). To address this, all reported standard errors are robust and clustered by year to ensure valid inference. Finally, the Pesaran CD test shows no evidence of strong cross-sectional dependence (CD = −1.253, p = 0.210), suggesting that error terms across countries are sufficiently independent.
These diagnostics support the statistical reliability of the fixed-effects estimates used in the main regression analysis.
4.7. Robustness and Endogeneity Checks
To validate the robustness of our core findings, we conduct a series of robustness tests using alternative estimation strategies and model specifications. These checks confirm the reliability and internal validity of our findings.
4.7.1. Addressing Endogeneity with 2SLS Estimation
To mitigate potential endogeneity in the moderating variable (mod4: EI × Institutional Quality), we estimate a Two-Stage Least Squares (2SLS) model [
Table 12]. We use the lag of mod4 as an instrument, assuming past institutional configurations influence current interactions without being simultaneously correlated with current error terms.
The first-stage regression confirms strong instrument relevance (F = 675.09, p < 0.001), while the second-stage results demonstrate consistent and statistically significant estimates for mod4, natural gas consumption, and GDP per capita.
This approach enhances causal interpretation by reducing simultaneity bias, strengthening the empirical basis of our mediation claims.
Instrumenting the interaction term confirms the direction and significance of our results. The interaction term (mod4) remains positively associated with emissions (p = 0.03), reinforcing the moderating role of governance. The first-stage F-statistic exceeds conventional thresholds (F = 675.09), confirming instrument strength and mitigating endogeneity bias.
4.7.2. Robustness to Cross-Sectional Dependence: Driscoll–Kraay Estimates
We further estimate a pooled OLS model with year fixed effects and Driscoll–Kraay standard errors, which adjust for heteroskedasticity, autocorrelation, and cross-sectional dependence in panels with small N and large T.
Table 13 reports result from Driscoll–Kraay pooled regressions with year fixed effects. The results remain consistent in sign and significance compared to the baseline fixed-effects model, providing further assurance of the robustness of our findings.
Accounting for cross-sectional dependence and heteroskedasticity, the Driscoll–Kraay results confirm that energy intensity and governance interaction significantly affects emissions. The elasticity of ln GDP per capita is around 0.94 across models, suggesting emissions scale nearly proportionally with economic growth.
4.7.3. Robustness to Institutional Moderator Choice
To test whether the observed moderating effect of institutional quality is robust to different governance dimensions, we substitute Control of Corruption with two alternative WGI indicators: Regulatory Quality and Government Effectiveness.
In the baseline model, the interaction term (EI × Control of Corruption) is positive and statistically significant (β = 0.037, p < 0.05). Although the sign is positive, it implies a dampening effect: as Control of Corruption improves, the marginal effect of energy intensity on CO2 emissions is weakened. In other words, higher corruption control softens the environmental harm caused by low energy efficiency, making efficiency policies more effective. This result highlights that even in the presence of higher energy intensity, strong anti-corruption governance helps reduce its negative environmental impact.
Consistent with Hypothesis 5, the interaction terms remain significant when Control of Corruption is replaced by Regulatory Quality and Government Effectiveness. Specifically, the interaction between energy intensity and Regulatory Quality is negative and highly significant (β = −0.060,
p < 0.01;
Table 14), while the interaction with Government Effectiveness is also negative and statistically significant (β = −0.049,
p < 0.05). These results confirm that stronger regulatory frameworks and administrative capacities not only reduce the negative externalities of inefficiency but also amplify the emissions-reducing benefits of energy efficiency improvements.
These results demonstrate the moderating role that institutions hold across different governance indicators, adding confidence to the policy implications of our findings.
4.7.4. System GMM Estimation (Supplemental Robustness Check)
To further test for potential endogeneity—especially dynamic effects—we estimate a System GMM model. The model omits the lagged dependent variable and constant term due to weak identification in small panels (N = 6), but key regressors remain statistically significant and directionally consistent. The Hansen J-test (p = 1.000) and Sargan test (p = 0.101) support instrument validity. However, results are interpreted cautiously due to risks of instrument proliferation and omitted dynamics.
The System GMM estimates (
Table 15) are directionally consistent with the baseline fixed-effects model, reinforcing the robustness of the governance–energy–emissions nexus. Key coefficients—including those on mod4, GDP per capita, and energy intensity—remain stable in both sign and magnitude. Although the lagged dependent variable is excluded due to degrees of freedom constraints, the overall model demonstrates statistical reliability. Diagnostic tests, notably the Hansen J-test (
p = 1.000) and Sargan test (
p = 0.101), confirm instrument strength and the absence of overidentification concerns. These findings enhance the credibility of the interaction effects and strengthen confidence in the derived policy implications.
5. Discussion
The results offer strong empirical support for the core proposition that institutional quality enhances the emissions-reducing impact of energy efficiency in hydrocarbon-dependent economies. The positive and significant coefficient on energy intensity (β = 0.057,
p < 0.001) reaffirms the expectation that lower energy efficiency contributes to greater CO
2 emissions. This finding is consistent with Hypothesis 2 and aligns with prior studies [
19,
20,
21] that underscore the central role of efficiency in decarbonization strategies.
The positive and statistically significant interaction term between energy intensity and Control of Corruption (β = 0.037,
p < 0.05) confirms a moderating effect, as anticipated in Hypothesis 4. Although the positive sign may seem counterintuitive, it reflects that in countries with stronger anti-corruption frameworks, the marginal environmental harm of energy inefficiency is reduced. These results support arguments from New Institutional Economics and are consistent with [
34], who emphasize that institutional design shapes the effectiveness of mitigation tools.
Beyond its moderating role, institutional quality also has a direct effect on emissions. The negative and statistically significant coefficient on Control of Corruption (β = −0.237,
p < 0.05) supports Hypothesis 3, suggesting that stronger governance systems are associated with lower CO
2 emissions even without improvements in energy efficiency. This is in line with findings by [
29,
30], who highlight the importance of institutional strength in environmental performance.
Further support for Hypothesis 5 comes from the robustness checks using Regulatory Quality and Government Effectiveness as alternative proxies for institutional quality. In both models, the interaction terms between energy intensity and the institutional variables are negative and statistically significant. This indicates that institutions with higher regulatory and administrative capacity not only reduce the damage caused by inefficiency but also enhance the benefits of efficiency policies. These findings align with [
33,
37], who argue that capable institutions are critical enablers of effective environmental strategies.
Natural gas consumption enters the baseline model with a negative and highly significant coefficient (β = −0.043,
p < 0.001), indicating that, on average, greater reliance on gas contributes to lower emissions—likely due to substitution for more carbon-intensive fuels. This supports Hypothesis 1, especially when considered alongside the split-sample analysis. Before 2014, natural gas consumption was positively associated with emissions (β = +0.101,
p < 0.001), but after 2014—a period marked by major subsidy reform and institutional restructuring across the GCC—the relationship reversed (β = −0.094,
p = 0.029). This policy-induced shift supports the view that the environmental impact of gas is conditional on governance and market design, as emphasized by [
16,
18].
GDP per capita, positively associated with emissions (β ≈ 0.946,
p < 0.001), supports Hypothesis 6 and is consistent with Environmental Kuznets Curve dynamics in early development phases [
45]. Meanwhile, oil rents also show a positive effect, albeit smaller (β = 0.003), reinforcing the rentier hypothesis that fossil fuel dependence contributes to environmental stress.
Taken together, these findings highlight the central role of institutional quality and fuel-specific policy design in shaping emissions outcomes. They not only confirm theoretical expectations but also provide an empirical basis for targeted interventions. Building on this evidence, the following section outlines practical policy recommendations for GCC countries navigating the intersection of natural gas expansion, governance reform, and decarbonization goals.
6. Policy Implications
This study presents a number of policy implications that are especially relevant for the Gulf Cooperation Council (GCC) countries as they navigate energy transitions amid evolving institutional environments.
First, the strong positive link between energy intensity and CO2 emissions highlights the urgent need for energy efficiency improvements across key sectors. In industry, this can be achieved through mandatory audits, infrastructure upgrades, and technology adoption. The buildings sector would benefit from stricter energy codes, public-sector retrofits, and the expansion of smart metering systems. In transport, fuel economy standards and investment in mass transit systems are essential to curb emissions growth.
Second, the findings affirm the central role of institutional quality—particularly Control of Corruption—in enhancing the environmental effectiveness of energy policy. Anti-corruption safeguards should be built into energy subsidy reforms and infrastructure procurement to prevent rent-seeking and misallocation. Strengthening the capacity and independence of regulatory authorities will be essential to ensure credible emissions reporting, corporate disclosure verification, and policy enforcement. Investments in training and staffing within environmental ministries and data agencies will further support evidence-based policymaking.
This is consistent with recent cross-country research by [
46], who finds that institutional quality significantly improves environmental sustainability outcomes in developing countries, even after accounting for structural economic differences.
Third, the reversal of natural gas’s emissions profile after 2014 suggests that energy reforms, such as price rationalization and subsidy removal, are only successful when matched by improved institutional governance. Transparent implementation and oversight mechanisms must accompany such reforms to ensure they are both effective and socially accepted. Similarly, any future carbon pricing or emissions trading schemes will require institutional credibility to prevent market distortions or elite capture.
Recognizing the heterogeneity across GCC states, energy, and climate policies should be tailored to country-specific institutional readiness. Countries like Saudi Arabia and Kuwait, which are still strengthening governance frameworks, may focus on transparency initiatives and digital public-sector tools. In contrast, UAE and Qatar—already performing relatively well on governance metrics—are better positioned to lead on market-based instruments like emissions trading or sovereign green bonds.
This institutional divergence mirrors findings from other regional contexts, such as in Europe, where [
47] highlight that structural institutional gaps can constrain the realization of sustainability goals, reinforcing development dualisms.
Greater regional cooperation can also play a catalytic role. Shared platforms for emissions tracking, harmonized regulatory standards, and joint investment mechanisms (e.g., a GCC clean energy fund) would promote efficiency, avoid duplication, and amplify collective impact.
Finally, these insights are highly relevant to the national net-zero ambitions underway across the region. Whether through the UAE’s Net Zero by 2050 Initiative, Saudi Arabia’s Green Initiative, or Oman’s National Energy Strategy, institutional quality emerges as a key enabler of successful climate policy. Recent findings, such as [
48], support this view by highlighting how renewable energy development, combined with innovation and supportive institutional environments, can significantly mitigate emissions—especially in middle-income, resource-constrained economies.
Our results suggest that institutional reform—specifically stronger regulatory oversight, anti-corruption mechanisms, and policy transparency—should be seen as integral to decarbonization, rather than a separate agenda.
7. Limitations and Future Research
While this study offers robust empirical insights, it is not without limitations. First, although the dataset spans the period from 2000 to 2023, certain variables—particularly energy intensity and renewable energy consumption—were unavailable for the final two years. To address this, a three-year centered moving average was applied to extrapolate values for 2022 and 2023. While methodologically defensible, this approach introduces potential estimation bias that may influence the accuracy of inference during the extended period.
Second, the analysis is conducted at the national level using country-level averages, which limits our ability to capture within-country variation. Emissions dynamics and institutional quality may differ significantly across subnational jurisdictions such as cities or provinces. Furthermore, detailed sectoral data—especially on natural gas consumption disaggregated by end use (e.g., power generation, industry, residential)—are not consistently available across GCC countries. This prevents us from exploring how gas usage affects emissions in specific sectors. As such, our analysis focuses on aggregate-level patterns. Future studies could improve policy precision by incorporating sector-specific data to estimate emissions elasticities more accurately for key sectors like utilities, manufacturing, and buildings.
Third, the methodological framework relies primarily on fixed-effects panel regression, which assumes linear and additive relationships. While appropriate for controlling unobserved heterogeneity, this technique may overlook potential nonlinearities, threshold effects, or dynamic feedback between emissions, institutional reforms, and energy transitions. Future work could apply more advanced econometric methods—such as dynamic panel estimators or structural equation modeling—to explore these dimensions more fully.
Fourth, institutional quality is proxied primarily through the World Bank’s Control of Corruption Index. While widely used, this measure may not fully capture the nuances of regulatory effectiveness, environmental enforcement, or administrative performance that are relevant to emissions outcomes. Incorporating more granular, sector-specific governance indicators in future studies would help offer a richer institutional analysis.
Fifth, the theoretical framing is grounded in the Environmental Kuznets Curve (EKC) and institutional moderation perspectives, which provide useful insights but do not fully engage with emerging themes such as climate justice, political economy, or behavioral change in energy transitions. Interdisciplinary approaches could uncover additional pathways and social mechanisms influencing environmental performance, particularly in resource-dependent states.
Finally, external validity remains a consideration. The study’s findings are rooted in the GCC context—marked by high income, fossil fuel dependence, and evolving governance. While this makes the conclusions highly relevant for comparable economies, caution should be exercised in generalizing the results to low-income or non-rentier settings with different institutional and energy profiles.
8. Conclusions
This study provides new empirical evidence that institutional quality significantly shapes the environmental effectiveness of energy efficiency in fossil fuel–dependent economies. We find that higher energy intensity—reflecting lower energy efficiency—is strongly associated with increased CO2 emissions in the GCC. However, this negative effect is moderated by stronger institutional conditions. Specifically, the interaction between energy intensity and Control of Corruption indicates that governance improvements weaken the emissions impact of inefficiency, highlighting the enabling role of institutional quality in enhancing technical mitigation strategies.
A key finding is the observed shift in the emissions profile of natural gas consumption after 2014. While natural gas use contributed to higher emissions in the earlier period, its relationship with CO2 reversed post-2014—becoming significantly negative. This suggests that structural reforms in energy pricing and regulatory enforcement may have improved the environmental performance of natural gas, reinforcing the importance of aligning fuel-switching strategies with broader governance reforms.
Robustness checks using 2SLS, Driscoll–Kraay, and System GMM confirm the stability of results. Importantly, different governance dimensions—Control of Corruption, Regulatory Quality, and Government Effectiveness—play distinct roles. While corruption control mitigates emissions from inefficiency, the other two enhance policy performance directly.
Methodologically, the study contributes a governance-sensitive interaction framework tailored to the GCC, accounting for structural breaks. This advances energy–institution–environment literature by empirically demonstrating the conditional impact of governance on mitigation success—particularly in rentier economies.
To our knowledge, this is the first study to apply such a governance-sensitive interaction framework—using dynamic panel estimators such as 2SLS, Driscoll–Kraay, and System GMM—to assess the conditional effect of institutional quality on energy efficiency and natural gas emissions within the GCC context.
Taken together, these findings show that institutional quality is not merely a background factor, but a central determinant of climate outcomes. For fossil-fuel-reliant economies, improving governance may be just as crucial as technical or market-based reforms.


