Abstract
In 2022, the Russia–Ukraine conflict has severely impacted the EU’s energy supply chain, and the EU’s natural gas import pattern has begun to reconstruct, and exploring the spatiotemporal differentiation of EU natural gas trade and its driving factors is the basis for improving the resilience of its supply chain and ensuring the stable supply of energy resources. This paper summarizes the law of the change of its import volume by using the complex network method, constructs a multi-dimensional index system such as demand, economy, and security, and uses the geographic detector model to mine the driving factors affecting the spatiotemporal evolution of natural gas imports in EU countries and propose different sustainable development paths. The results show that from 2000 to 2023, Europe’s natural gas imports generally show an upward trend, and the import structure has undergone great changes, from pipeline gas dominance to LNG diversification. After the conflict between Russia and Ukraine, the number of import source countries has increased, the market network has become looser, France has become the core hub of the EU natural gas market, the importance of Russia has declined rapidly, and the status of countries in the United States, North Africa, and the Middle East has increased rapidly; natural gas consumption is the leading factor in the spatiotemporal differentiation of EU natural gas imports, and the influence of import distance and geopolitical risk is gradually expanding, and the proportion of energy consumption is significantly higher than that of other factors in the interaction with other factors. Combined with the driving factors, three different evolutionary directions of natural gas imports in EU countries are identified, and energy security paths such as improving supply chain control capabilities, ensuring export stability, and using location advantages to become hub nodes are proposed for different development trends.
1. Introduction
In recent years, the evolution of global energy resource supply-demand patterns and trade networks has been significantly influenced by multiple factors, including resource endowment, industrial development, and geopolitical dynamics. Since February 2022, the Russia–Ukraine conflict has severely disrupted the EU’s energy supply chains, plunging its socio-economic development into recession and fundamentally altering the Union’s developmental trajectory [1]. Against the backdrop of climate change and geopolitical uncertainties, the EU has accelerated its energy transition. Within this transition, natural gas serves as a critical bridging fuel that enables renewable integration through its unique operational advantages [2,3,4]. Refined through multiple evolutionary cycles, gas infrastructure provides unique functional support for clean energy systems by balancing intermittency, providing reliable energy, offering affordable investments, and maintaining consumer prices [3]. This transition occurs within the strict constraints of the EU’s climate governance framework, particularly the European Green Deal’s carbon neutrality target (2050) and the ‘Fit for 55’ package mandating 55% emission reductions by 2030, which collectively are reshaping gas demand trajectories and import strategies [5,6,7].
However, global natural gas resources exhibit extreme geographical disparity, with significant demand-supply spatial mismatch. Three countries—Russia, Iran, and Qatar—dominate global supply, collectively controlling 50% of proven reserves [8]. The EU, with limited domestic gas resources, maintains approximately 94% import dependence, historically relying heavily on Russian pipeline gas [9,10]. Since 2022, escalating geopolitical conflicts, volatile energy markets, and rapidly evolving climate policies—notably the RePowerEU plan to make Europe independent from Russian fossil fuels well before 2030—have substantially heightened import risks while imposing stringent sustainability criteria on alternative supplies [11]. The European Union has implemented stringent methane emission regulations requiring its natural gas, oil, and coal sectors to measure, monitor, report, and verify (MMRV) emissions according to the highest monitoring standards, while mandating concrete actions to reduce emissions [12]. This regulatory framework creates complex trade-offs between ensuring short-term supply security and achieving long-term climate objectives. The objective of this study is to investigate the spatiotemporal differentiation patterns and driving factors of EU natural gas imports and to propose corresponding safeguard pathways based on these factors. The research questions are: (1) How do geopolitical shocks reconfigure the topological structure of the EU natural gas trade network at the member-state level? (2) What are the dominant spatial driving factors (geopolitics, economics, import distance) that influence the differentiation of import patterns?
2. Brief Review of the Literature
In recent years, research on EU energy has primarily focused on supply chain stability and security. For the EU, the security of natural gas supply is mainly influenced by geopolitical factors [13,14,15,16]. From the perspective of supply security assessment, scholars have continuously pointed out that supply risks mainly stem from over-reliance on Russia, emphasizing the need to evaluate the supply stability of Russia and Algeria. They have proposed three disruption scenarios: market-induced disruptions, politically induced disruptions, and gradual decline [13,17]. Regarding measures to ensure natural gas supply security, many scholars argue that the EU’s heavy dependence on Russian gas increases energy supply risks. They propose that the EU can expand import sources to reduce reliance on Russia while improving energy efficiency, accelerating the replacement of natural gas with clean energy, and increasing gas storage capacity—a series of measures that align with the EU’s 2022 REPowerEU roadmap [14,18,19]. After the 2022 Russia–Ukraine conflict, scholars examined changes in import patterns and found that the EU’s natural gas imports underwent significant adjustments [20]. Various policies to ensure energy security quickly took effect, securing supply through diversified import sources and product types [21,22,23].
In studies on the factors influencing EU natural gas imports, Letife Özdemir et al. highlight geopolitics as a particularly significant factor [24]. Qin et al. selected GDP, geographical distance matrices, common language matrices, land adjacency matrices, and alternative energy effect difference matrices as key factors to examine the structural characteristics of energy trade networks and their determinants, concluding that distance is the primary influencing factor [25]. Ma et al. used per capita GDP, urbanization levels, population, per capita CO2 emission differences, land adjacency matrices, and common language matrices to analyze the structure and influencing factors of natural gas trade networks, finding that per capita CO2 emission differences and land adjacency had positive effects [16]. Wang et al. applied a grey prediction model to analyze the impact of GDP, urbanization rate, energy consumption structure, and population on natural gas demand in eastern, central, and western China, concluding that dominant factors vary by region [26,27]. Zhang et al. used a gravity model to study seven factors—economic conditions, supply and demand, prices, R&D investment as a percentage of GDP, energy consumption structure, distance, and political risk—to identify the main drivers of global LNG trade [28].
Existing research primarily treats the EU as a whole, analyzing its supply stability and countermeasures. However, as geopolitical dynamics evolve, divergent trends have emerged within the EU, with few studies examining differences in natural gas imports across member states. Moreover, most current research relies on qualitative analysis or traditional econometric models, lacking in-depth spatial heterogeneity analysis of energy patterns. The selection of driving factors has mostly been limited to GDP and distance. Therefore, this study takes the natural gas imports of EU member states as its research subject, examining spatiotemporal differentiation patterns. Using complex network methods, it analyzes spatial evolution trends and topological relationships in inter-country trade, assessing each country’s control over supply chains. On this basis, a multi-indicator evaluation system is constructed, employing a geographical detector to quantify the spatial explanatory power of factors such as resource endowment and geopolitical risk. The study further analyzes the driving factors influencing natural gas imports and their interactions, delving into synergistic effects among these factors. The aim is to provide methodological and empirical support for further research on enhancing supply chain resilience and energy supply stability in individual countries. Such research provides a scientific basis for the following: (1) evaluating the EU’s energy transition pathways, (2) assessing supply chain resilience, and (3) formulating regional cooperation policies. The findings will contribute to understanding how geopolitical shocks reshape energy trade architectures and inform strategic decision-making in energy security management.
3. Methodology and Data
3.1. Construction of the Natural Gas Trade Network
This study establishes a directed and weighted natural gas trade network for the EU, formally defined as a graph G = (N, E), where N denotes the set of nodes (representing countries) and E signifies the set of directed edges (characterizing bilateral trade volumes) [29,30,31,32,33]. The network’s structural parameters are defined as follows: N = |N| represents the cardinality of the node set (i.e., the number of participating nations), while E = |E| indicates the total number of trade linkages [34,35]. To analyze the system’s topological characteristics, we employ a suite of complex network metrics, including but not limited to (Table 1):

Table 1.
Indicators of the natural gas trading network.
3.2. Geodetector Model
3.2.1. Model Construction
The Geodetector is a modern spatial statistical method designed to measure and uncover spatial heterogeneity. It quantifies the explanatory power of different factors on spatial differentiation and reveals interaction effects among variables [36].
In this study, we employ the Geodetector model to analyze the influence of economic factors, resource endowments, and demand factors on the EU natural gas market, aiming to identify key driving forces. The computational model for detecting the driving factors of EU natural gas imports is as follows:
L represents the stratification (strata) of variable Y or factor X, i.e., classification or partitioning. Nₕ and N denote the number of units in stratum h and the entire region, respectively. σₕ2 and σ2 are the variances of Y values in stratum h and the entire region. SSW (Sum of Squares Within) and SST (Total Sum of Squares) represent the within-stratum variance and the total variance of the entire region, respectively.
The value of q ranges between [0, 1]. A higher q value indicates stronger spatial heterogeneity of Y. If the stratification is generated by independent variable X, a larger q means X has a stronger explanatory power over Y, while a smaller q suggests a weaker influence. Extreme cases:
q = 1: Factor X completely controls the spatial distribution of Y.
q = 0: No relationship exists between X and Y. Interpretation: q indicates that X explains 100 × q% of Y.
3.2.2. Selection of Driving Factors
Under the Russia–Ukraine conflict, the dynamics of EU natural gas imports have undergone significant changes, driven by complex factors. Taking into account resource availability, socio-economic development, import distance, and geopolitical risks—while also referencing previous research—we constructed an indicator system to analyze the influencing factors of EU natural gas imports. The selected indicators include the following: GDP, Population, Natural gas production, Natural gas consumption, Share of natural gas in total energy consumption, Import distance, and Geopolitical risk [37,38,39]. Using the Geodetector method, we examined the spatiotemporal drivers of EU natural gas imports and the interactions between these factors.
3.3. Data
The natural gas import data for the 27 EU countries in this study are sourced from the United Nations Commodity Trade Statistics Database (UN Comtrade), with the sample study period spanning 2000–2023. The analysis covers import data for liquefied natural gas (HS: 271111) and pipeline natural gas (HS: 271121). For cases where a small number of importing countries exhibit large import volumes but unclear source information, export data are employed for supplementation. Additionally, due to data limitations, UN Comtrade data include intra-EU trade and cannot differentiate the overall landscape; therefore, BP’s European trade data are used as a substitute for analyzing the overall trend.
Furthermore, data on natural gas production, consumption, and share of energy consumption referenced in this paper are derived from the BP Statistical Review of World Energy. Notably, the BP database only contains natural gas production data for four EU countries, which are supplemented by data from the International Energy Agency (IEA). Population and GDP data are obtained from the World Bank, country-to-country distance data from the CEPII database, and geopolitical risk indicators from the WDI Global Governance Indicators.
4. Results and Discussion
4.1. Temporal Evolution Characteristics of Natural Gas Imports in the EU
In terms of the overall trend, the natural gas imports of the European Union (EU) have exhibited an upward trend from 2000 to 2023, with the import scale expanding continuously. The evolution of imports can be categorized into four distinct phases: (a) Steady Growth Phase (2000–2008), (b) Fluctuating Decline Phase (2009–2014), (c) Rapid Recovery Phase (2015–2019), and (d) Conflict-Induced Decline Phase (2020–2023) (Figure 1).
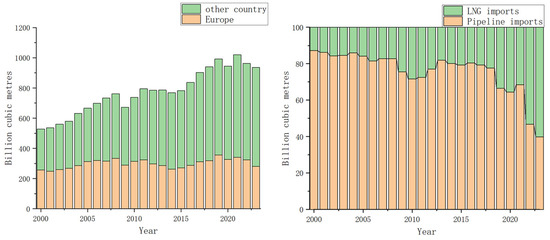
Figure 1.
Changes in European natural gas import volume and import structure (2000–2023).
In stage a, during this period, the EU’s economy maintained continuous growth momentum. As a clean energy source, the demand for natural gas kept increasing steadily. The import volume grew from 256.2 billion cubic meters to 333.5 billion cubic meters, reflecting the growing importance of natural gas in the EU’s energy consumption structure.
In stage b, affected by the global financial crisis, the overall demand for natural gas in the EU showed a downward trend. In 2009, the import volume dropped sharply to 288.8 billion cubic meters, representing a decrease of approximately 15.5% compared to the previous peak. Meanwhile, influenced by the U.S. shale gas revolution, the EU significantly increased its LNG imports. The proportion of LNG in total natural gas imports rose from 13% to 28% at its highest, indicating a notable adjustment in the import structure.
In stage c, after the significant decline in imports during the previous phase, in order to reduce the risks associated with single-source dependence, the EU began to emphasize import diversification. At the same time, the EU accelerated its energy transition process, with natural gas replacing part of coal consumption. Under these circumstances, the import volume increased rapidly, rising from 271.0 billion cubic meters to a peak of 356.3 billion cubic meters, demonstrating the effectiveness of the EU’s energy policies.
In stage d, due to the impact of the COVID-19 pandemic, economic activities came to a halt, resulting in a sharp drop in energy demand and a short-term trough in import volume. After 2022, the Russia–Ukraine conflict had a profound impact on European natural gas imports. The import volume decreased rapidly from 323.6 billion cubic meters to 280.7 billion cubic meters in 2023. Moreover, the import structure underwent a dramatic transformation. LNG imports surged and quickly exceeded pipeline gas imports, with LNG accounting for a larger share than pipeline gas in 2023, highlighting the far-reaching influence of geopolitical events on the EU’s energy supply.
4.2. Spatial Differentiation Characteristics of EU Natural Gas Imports
Based on the analysis of temporal patterns and structural changes in EU natural gas imports, where the pre- and post-Russia–Ukraine conflict periods exhibit distinctive characteristics in both import composition and total volumes, this study selects 2021 and 2023 as representative years to examine the spatial dynamics of EU natural gas imports.
Table 2 demonstrates the evolving characteristics of the EU natural gas import scale and patterns in 2021 and 2023. The data reveals an overall increasing trend in terms of participating trading nations, number of trade relationships, and average weighted degree, indicating the EU’s continuous efforts to expand supply sources and reduce reliance on individual countries. Notably, the growth in LNG trade relationships significantly outpaces the overall increase in trade connections, while pipeline gas trade relationships show a slight downward trend. This pattern is further corroborated by the average weighted degree metrics, with LNG experiencing a substantial rise from 58.009 to 179.841, accompanied by a modest increase for pipeline gas as well.

Table 2.
Overall characteristics of trade networks in 2021 and 2023.
The graph density reflects the degree of connectivity and intensity of trade relationships among countries in the EU’s natural gas trade network. A higher graph density indicates closer trade connections and more frequent trade activities. As shown in Table 2, the graph density exhibited varying degrees of decline between 2021 and 2023, decreasing overall from 0.071 to 0.057. This suggests the network structure transitioned from being “tightly coupled” to more loosely connected, with pipeline gas experiencing a more pronounced decrease in graph density from 0.068 to 0.043. The average clustering coefficient measures the agglomeration level of the natural gas trade network, where higher values indicate stronger inter-node correlations. Table 2 reveals an upward trend in the overall average clustering coefficient, signaling enhanced trade clustering among nations. Notably, LNG’s average clustering coefficient rose rapidly from 0.161 to 0.193, while pipeline gas showed some decline. The average path length reflects flow efficiency within the EU’s natural gas trade network. Data in Table 2 demonstrate a decreasing trend in average path length, indicating more direct trade relationships between countries and improved trade efficiency. Collectively, the increasing average clustering coefficient coupled with decreasing average path length suggests the gradual emergence of “small-world” characteristics in EU natural gas trade patterns.
4.2.1. Region Analysis Results
To gain deeper insights into the spatial evolution patterns of EU natural gas trade and uncover the topological relationships among trading nations, we performed community detection analysis on import data from 2021 and 2023. In the constructed trade networks, node sizes correspond to each country’s weighted in-degree (reflecting import volumes), while edge widths represent the magnitude of bilateral trade flows, with arrows indicating the direction of trade (from exporters to importers) and different colors distinguishing distinct communities (Figure 2, Figure 3 and Figure 4).
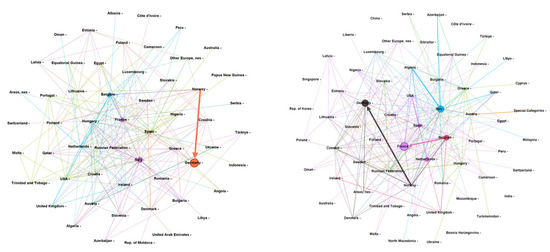
Figure 2.
EU gas trading network in 2021 and 2023. Note: nes stands for not elsewhere specified; the same applies below.
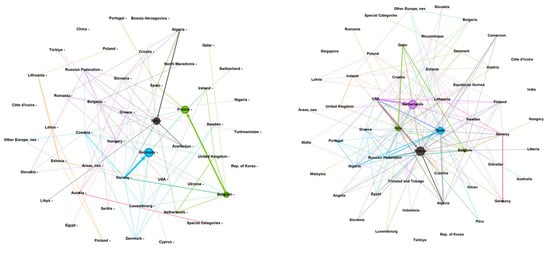
Figure 3.
EU pipeline gas trade network in 2021 and 2023.
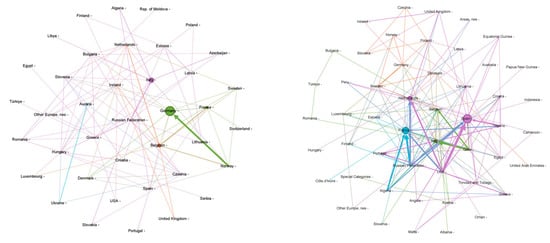
Figure 4.
EU LNG natural gas trading network in 2021 and 2023.
In 2021, the trade network was primarily divided into five distinct communities. Communities 1 and 2 were dominated by pipeline gas trade, with Community 1 centered around Germany and Denmark, characterized by their bilateral pipeline gas exchanges. Community 2, the largest in the network, included Russia, Italy, France, Algeria, Qatar, and Azerbaijan, reflecting a heavy reliance on pipeline gas imports. Communities 3 and 4 comprised nations engaged in mixed pipeline and LNG trade, serving as critical transit hubs. Community 5, the second-largest, was LNG-driven and included the United States, Spain, and Nigeria (Figure 2, Figure 3 and Figure 4).
In 2023, the network remained divided into five communities, but the Russia–Ukraine conflict triggered a significant restructuring, fragmenting previously large communities into smaller clusters. Community 1, now led by Norway, Germany, and Belgium, maintained stable pipeline gas flows between Norway and Germany. Belgium pivoted toward Norwegian pipeline gas imports while strategically integrating its domestic pipeline network with the expanded LNG infrastructure at the Zeebrugge terminal. Following a major upgrade completed in December 2019, the terminal’s throughput capacity reached approximately 9 bcm per year, with its total storage capacity increasing from 0.39 mcm to 0.57 mcm [40]. This transformation elevated Belgium from a transit nation to a core hub state capable of balancing pipeline gas and LNG flows across Northwestern Europe. Community 2, consisting of Italy, Algeria, Azerbaijan, Spain, Qatar, and Nigeria, represented key members of the former 2021 Community 2, shifting their import reliance from Russian pipeline gas to suppliers in North Africa and the Middle East. Community 4, comprising Russia, Hungary, Greece, and Romania, continued to depend on Russian pipeline gas, albeit with significantly reduced influence. Meanwhile, Community 5, dominated by the United States and comprising France, the Netherlands, Lithuania, and other nations, rapidly expanded to become the largest cluster in the network. These countries possessed well-established LNG regasification systems prior to 2022. Following strategic infrastructure enhancements through terminal expansions or new constructions, the Netherlands increased regasification capacity by 13 bcm, and France added 6.5 bcm [41] (Figure 2, Figure 3 and Figure 4).
The post-2022 geopolitical shock precipitated a fundamental network reorganization, characterized by three key phenomena: (1) the fragmentation of Russia-centric pipeline blocs into smaller regional groupings, with the Nordic (Norway–Germany–Belgium) axis emerging as a new pipeline core; (2) the dramatic expansion of the US-led LNG supercluster, which absorbed multiple Northwest European states to become the network’s dominant community; and (3) the strategic repositioning of transit states like Belgium into integrated gateway hubs. These structural shifts demonstrate how crisis-driven diversification has spatially reconfigured European gas flows, replacing hierarchical, pipeline-dependent architectures with a more modular, LNG-anchored network topology. The evolving community distribution reflects both deliberate policy interventions and emergent market adaptations in response to supply security imperatives.
4.2.2. Analysis of Complex Network Metrics
To further investigate the spatial evolution patterns and influencing factors of the EU natural gas imports, this paper builds upon the analysis of the overall EU natural gas import network and community evolution. It further analyzes network indicators for major countries, including weighted indegree, weighted outdegree, betweenness centrality, and closeness centrality.
Weighted indegree represents the import intensity of a node in the trade network, reflecting the total influence of a country’s imports within the network. Examining the weighted indegree of EU countries in 2021 and 2023, the main consumption countries generally show an upward trend. Among them, France and the Netherlands experienced a significant increase, with a surge in import volumes of both LNG and pipeline gas. Italy, Belgium, the Netherlands, Spain, and Denmark also saw increases in their import volumes. Germany, as the EU’s largest natural gas consumer and the largest importer before the Russia–Ukraine conflict, saw a rapid decline in its weighted indegree due to the conflict, primarily because of a sharp drop in pipeline gas imports. Other countries, with relatively smaller import volumes, maintained a stable weighted indegree (Figure 5).
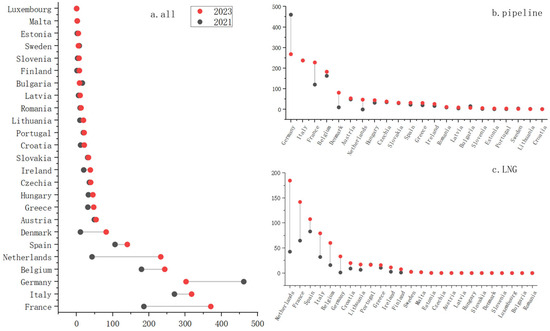
Figure 5.
Changes in the weighted indegree of the EU natural gas trading network in 2021 and 2023.
Weighted outdegree represents the export intensity of a node in the trade network, reflecting a country’s export capacity within the network. From 2021 to 2023, the weighted out-degree of major countries generally showed an upward trend, with varying degrees of growth in export volumes. Norway has consistently maintained its position as the top exporter to the EU. The United States, Algeria, Belgium, the United Kingdom, Qatar, and Azerbaijan rapidly increased their weighted outdegree by boosting LNG and pipeline gas exports. The weighted out-degree of Ukraine and Russia declined, mainly due to sanctions on pipeline gas trade, which restricted Russian natural gas exports and halted transit through Ukraine. However, their LNG exports still saw a slight increase (Figure 6).
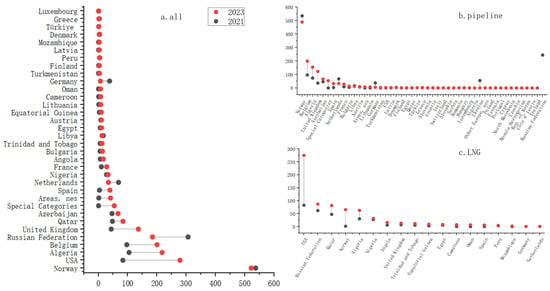
Figure 6.
Changes in the weighted outdegree of the EU natural gas trading network in 2021 and 2023.
Betweenness centrality represents a node’s ability to regulate or control the entire network. A higher betweenness centrality indicates a stronger control capability of that country within the network. As shown in Figure 7, the betweenness centrality of all countries shows a downward trend. This indicates that the network structure has undergone significant changes. Combined with the aforementioned increase in the number of trading countries and trade relationships in the trade network, it can be concluded that the EU’s natural gas imports are experiencing decentration, path diversification, and the failure of key nodes. Looking at individual countries, France has consistently maintained the highest level of betweenness centrality, acting as a major hub node. This is due to its proactive construction of LNG receiving terminals; its five terminals account for 17% of the EU’s total capacity, giving it an important position in trade. In contrast, Spain and Hungary, which rely heavily on pipeline gas, have been significantly affected by geopolitics, leading to a rapid decline in their betweenness centrality.
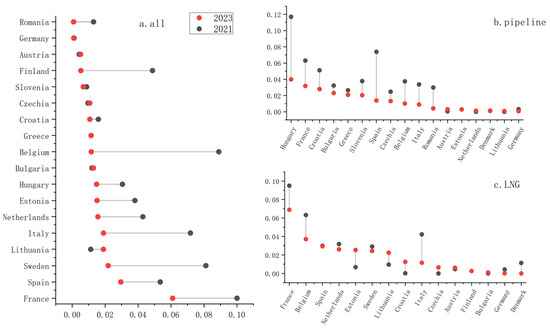
Figure 7.
Changes in the betweenness centrality of the EU natural gas trading network in 2021 and 2023.
Closeness centrality represents how close a node is to all other nodes in the network. A higher closeness centrality indicates that the country holds a more central position in the network and has stronger anti-control ability. Based on the changes in the closeness centrality index for various countries, Russia’s closeness centrality is the highest in the trade network, indicating its significant influence and core export position in the EU’s natural gas import network, although it decreased in 2023. Romania, Croatia, and Bulgaria experienced a rapid increase in closeness centrality, enhancing their global connectivity within the network and becoming more critical hub nodes. This is mainly because these three countries are located on the Balkan Peninsula, a key corridor connecting Southeast, Central, and Eastern Europe. Croatia has traditionally been a transit country for Russian gas exports to Southern Europe. Its closeness centrality increased rapidly as the EU shifted imports to Azerbaijani gas. Romania and Bulgaria also became key nodes for alternative routes due to the construction of natural gas pipeline facilities, which enhanced their discourse power in regional energy matters. The United States’ closeness centrality rose quickly to fifth place, with its share of the EU’s LNG imports increasing rapidly. Norway’s closeness centrality improved; it is a highly stable source of natural gas for the EU and is directly connected to the European continent via a pipeline network. Hungary is highly dependent on Russian pipeline gas and is one of the few countries not sanctioning Russian energy. Therefore, it was generally thought that this would lead to “marginalization”, but its closeness centrality still increased. This is mainly because the remaining flow of Russian pipeline gas to the EU is still concentrated through Hungary, and it is also the only path for LNG from Southeast Europe to enter Central Europe, making it a double hub node. Albania’s closeness centrality shows a gradually rising trend. Algeria is an important energy partner for the EU, with clear geographical advantages. In recent years, the EU has continuously increased its investment in Algeria’s natural gas sector, enhancing Algeria’s export capacity through pipeline expansion and LNG facilities to ensure a stable supply to the EU. France’s closeness centrality also remains at a high level due to its comprehensive LNG receiving terminal infrastructure, which allows it to receive imports from multiple sources like Norway, Algeria, and Russia, and connect with core countries in multiple directions. Nigeria’s closeness centrality has also increased, becoming an important alternative to Russian gas due to its regional advantages (Figure 8).
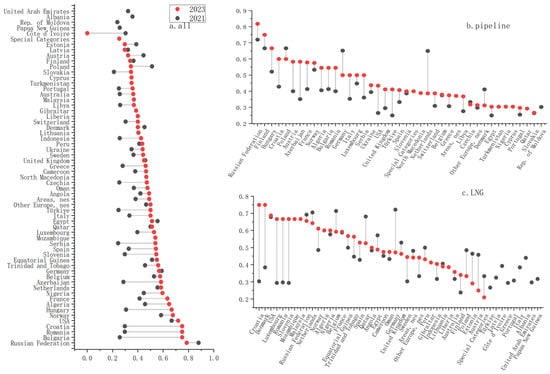
Figure 8.
Changes in the closeness centrality of the EU’s natural gas trading network in 2021 and 2023.
Through the analysis of the above indicators, it was found that among the main EU natural gas importing countries, Germany has the largest import volume but low betweenness centrality, indicating weak control over the import supply chain, a non-diversified supply chain, and high risk. France’s weighted indegree has surged, and both its betweenness and closeness centrality are at high levels, indicating that its import volume and hub status have improved in tandem. Thanks to the construction of LNG infrastructure, France is gradually becoming a core hub node in the EU’s natural gas trade. Although the import volumes of Spain, Belgium, and Italy have increased significantly, their control over the supply chain has weakened after the shock, and they have not yet become stable trading centers. The export volumes of the United States, Algeria, Qatar, and Azerbaijan have increased rapidly, replacing the reduced trade volume from Russia. Their closeness centrality also shows an upward trend, highlighting their growing importance in the EU’s natural gas trade.
4.3. Analysis of Driving Factors
4.3.1. Factor Detection Results
This paper uses the natural fracture method to discretize the index factors and employs the geographical detector model to detect the contribution rate and significance level of the driving factors, thereby revealing the driving forces behind the differences and spatiotemporal evolution of its imports.
Based on the combined results for 2021 and 2023, the most significant factor affecting the spatiotemporal evolution of EU natural gas imports is natural gas consumption, followed by population, with q-values for both greater than 0.6. The influence of natural gas consumption on imports is significantly higher than other factors, with detected explanatory power (q-values) of 0.7435 and 0.7313, respectively. On the one hand, after the Russia–Ukraine conflict, the natural gas trade between Russia and the EU decreased significantly, forcing a rapid decline in EU natural gas demand. On the other hand, the impacted EU economy has remained sluggish, with manufacturing activity continuously contracting. The energy crisis has exacerbated the outflow of manufacturing, which has also reduced the demand for natural gas. Under the influence of multiple factors, EU natural gas demand decreased by about 20% in 2023. Population is a fundamental driving factor affecting natural gas import volume, with detected explanatory power (q-values) of 0.6299 and 0.6201 in 2021 and 2023, respectively (Table 3). Population represents the degree of dependence of EU residents on energy imports; a larger population size leads to greater natural gas demand, thus driving an increase in import volume. It is worth noting that the influence of import distance and geopolitical risk on import volume has rapidly increased. This is mainly because the pipeline gas market is highly constrained by geography and relies on fixed infrastructure, whereas the LNG market is more flexible and not limited by region. Compared to 2021, the EU continuously increased its LNG imports in 2023 to replace Russian pipeline gas, and the import distance increased accordingly. With the development of the geopolitical situation between Russia and the EU, LNG will become the main import method in the future. Therefore, the influence of import distance on import volume will continue to expand, and the uncertainty of future geopolitical risks will become an important factor affecting import volume.

Table 3.
Single-factor detection results of driving factors in 2021 and 2023.
4.3.2. Interaction Detection
To further study the changes in the contribution of different driving factors to EU natural gas import volumes when they interact, the interaction factors produced by pairwise interactions were detected. The spatiotemporal evolution of EU natural gas imports is a complex process, driven not by a single factor but by the interplay of multiple factors. The detection results show that the driving force of the interaction between two factors is higher than that of a single factor, indicating that the factors are closely related and not independent of each other.
In 2021, among the 21 factor pairs, 12 showed bifactor enhancement, with an average q-value of 0.91, indicating that the explanatory power of the interaction between two driving factors is greater than that of a single factor. The other 9 pairs showed non-linear enhancement, with an average q-value of 0.88, meaning the explanatory power of the interaction of two driving factors is greater than the sum of their individual effects. In 2023, there were 17 pairs with bifactor enhancement and 4 pairs with non-linear enhancement (Figure 9).
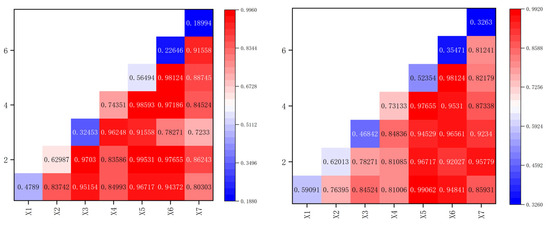
Figure 9.
Heat maps of the cross-detection of natural gas drivers in the EU in 2021 and 2023.
Overall, the q-values of the interactions between Population (X2), Natural Gas Consumption (X4), and other factors are significantly higher than other combinations. This indicates that the interaction of population and natural gas consumption with other factors significantly enhances the explanatory power of the single factors. The role of Proportion of Energy Consumption (X5) is not prominent as a single factor, but in interaction with other factors, its effect is significantly higher than others. In 2021, the interaction value between Population (X2) and Proportion of Energy Consumption (X5) was the highest. In 2023, the interaction q-value between GDP (X1) and Proportion of Energy Consumption (X5) was the highest. This suggests that the proportion of natural gas in energy consumption has a significant impact on natural gas import volumes and is more vulnerable to disruptions in natural gas imports. Taking Italy as an example, in 2021, natural gas accounted for about 40% of its energy consumption, the largest share in the EU. Due to import restrictions, the high proportion of natural gas in energy consumption led to a rapid decline in import volumes by 2023, with its share in energy consumption falling to 35%. Hungary and the Netherlands, which also rely heavily on natural gas, faced similar situations. Countries with a relatively smaller share, such as France and Belgium, were less affected by the import shock.
4.3.3. Analysis of Natural Gas Sustainable Development Paths
Based on the discussion of driving factors and combined with complex network indicators such as weighted indegree, weighted outdegree, betweenness centrality, and closeness centrality, the EU’s natural gas sustainable development paths can be divided into the following three types:
(1) Demand- and Economy-Dominated Countries: This category is represented by countries like Germany and Italy. They rank high within the EU in terms of population, industrialization level, economic conditions, and energy demand. While they have some domestic natural gas production capacity, their demand far exceeds supply, necessitating large-scale imports with high concentration. Their betweenness centrality is low, indicating insufficient control over the supply chain. For such countries, it is imperative to accelerate the renewable energy transition, develop solar and other renewable sources, reduce dependence on single-energy sources, and enhance energy demand-side substitutability. On the supply side, they need to expedite the construction of LNG receiving terminals, expand import sources, and increase supply diversification to avoid reliance on a single import source, reduce supply risks, and improve supply chain control.
(2) Trade Transit Countries: This group includes countries such as France, Spain, the Netherlands, Belgium, and Hungary. In most of these countries, natural gas accounts for less than 20% of their energy mix, and they have diverse energy structures with a lower dependence on natural gas. An exception is the Netherlands, where natural gas has a higher share in the energy structure due to its domestic production being the highest in the EU. These countries possess geographical advantages and are vigorously developing natural gas infrastructure, accelerating the construction of LNG receiving terminals and gas pipelines. While meeting their own needs, they export natural gas to neighboring countries, gradually becoming regional trade hubs. For these nations, it is important to stabilize existing natural gas infrastructure, optimize the utilization efficiency of LNG receiving terminals, and expand both import sources and export partners.
(3) Lower-Demand Countries: This group includes countries like Portugal and Slovenia. These nations have a low dependence on and consumption of natural gas, but their imports heavily rely on one or two countries, and their natural gas infrastructure is relatively weak. Slovenia has no LNG receiving terminals and depends solely on pipeline supplies from neighboring countries, facing significant supply risks. For countries with relatively small demand, it is essential to stabilize existing import sources, strengthen regional cooperation, accelerate the expansion of natural gas infrastructure, and leverage geographical advantages to build LNG receiving terminals and pipelines, ensuring domestic demand is met while transforming into a regional hub. At the same time, it is necessary to assess the costs of infrastructure construction to avoid financial deficits and increased fiscal burdens.
5. Discussion
5.1. Impact of Other Factors on EU Natural Gas Imports
Natural gas prices represent an important influencing factor for EU energy imports. As a primary energy commodity, gas price fluctuations are shaped by a complex interplay of supply-side factors, demand dynamics, and geopolitical developments, while simultaneously exerting ripple effects on production outputs, GDP performance, and energy demand patterns [42]. This study examines import drivers across all 27 EU member states individually. Due to data availability constraints regarding country-specific price indicators, we employed the World Bank’s European natural gas price index alongside aggregate import volume data for our analysis [43]. Our findings reveal dramatic price volatility surrounding the 2022 Russia–Ukraine conflict, with benchmark prices surging from $16/mmBtu in 2021 to a short-term peak of $40/mmBtu. It is clear evidence of geopolitical shocks’ pricing impacts. By 2023, coordinated EU measures, including strategic storage buildup and demand reduction initiatives, facilitated gradual price stabilization at $13/mmBtu. This demonstrates that while geopolitical disruptions exert acute impacts on trade volumes through price mechanisms, systemic supply-demand rebalancing eventually restores market equilibrium (Figure 10).
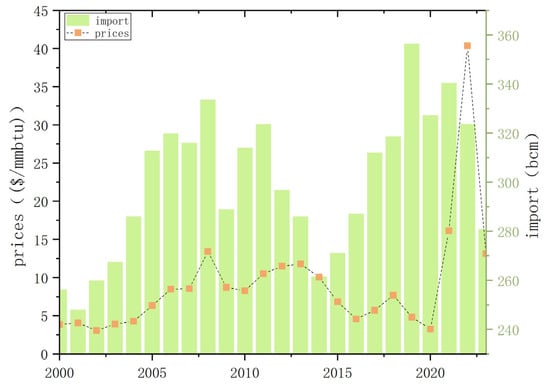
Figure 10.
European natural gas import volumes and prices (2000–2023).
5.2. Limitations and Future Research Directions
This study analyzes changes in import volumes to identify key drivers of EU natural gas imports and assess their explanatory power. While this approach provides valuable insights, it has certain limitations. The natural gas trade is a complex system closely tied to economic conditions, social welfare, and industrial development, with numerous interconnected influencing factors. In selecting explanatory variables, we prioritized data availability and indicator relevance, focusing on seven representative metrics. As a result, several potentially significant factors—such as price mechanisms, inventory levels, pipeline construction costs, and LNG terminal development costs—were not included in this analysis. Future research could employ a wider range of modeling approaches and methodologies to holistically account for multiple influencing factors. By incorporating additional quantifiable drivers, particularly the mutual interactions with price mechanisms, we can achieve a deeper analysis of the intrinsic patterns governing market evolution. This approach will establish a more comprehensive and precise methodological foundation for studying EU natural gas supply security.
6. Conclusions
This paper, focusing on the natural gas trade situation of EU countries, employs complex network methods to analyze the spatiotemporal evolution of EU natural gas imports. It further uses the geographical detector model to analyze the main driving factors and their changes influencing the EU’s natural gas import pattern before and after the Russia–Ukraine conflict. The conclusions are as follows:
(1) From a temporal perspective, from 2000 to 2023, European natural gas imports showed an overall upward trend, with the import scale continuously expanding. This can be divided into four stages: a period of steady growth, a period of fluctuating decline, a period of rapid recovery, and a period of conflict-induced decline. Simultaneously, the natural gas import structure has been continuously adjusted, shifting from being dominated by pipeline gas to a diversified LNG structure, resulting in a dramatic change in the import composition.
(2) From a spatial perspective, the number of trading countries, the number of trade relationships, and the average weighted degree have continuously increased, but the network graph density has decreased, indicating a looser network structure. Through the complex network analysis of individual countries, it was found that Germany is the largest importer among EU countries but has low betweenness centrality, a non-diversified supply chain, and high risk. France’s import volume has grown rapidly, and its betweenness and closeness centrality are both at high levels, making it a core hub in the EU’s natural gas trade. After the Russia–Ukraine conflict, Russia’s pipeline gas exports plummeted, and its importance as an exporter has gradually declined. The weighted outdegree and closeness centrality of the United States, Algeria, Qatar, and Azerbaijan have increased rapidly, and they will become major import sources in the future.
(3) From the perspective of driving factors, natural gas consumption is the dominant factor in the spatial-temporal differentiation of EU natural gas imports, followed by population. As the EU’s import trend evolves, the influence of import distance and geopolitical risk will continue to expand in the future. In the interaction identification, the driving force of the interaction between two factors is higher than that of a single factor, and the factors are closely related. The interaction of Population (X2) and Natural Gas Consumption (X4) with other factors has a significantly higher explanatory power than single factors. The role of the Proportion of Energy Consumption (X5) is not prominent as a single factor, but in interaction with other factors, its effect is significantly higher.
(4) The EU’s natural gas trade pattern is still undergoing adjustment. Based on the development trends of different countries, natural gas sustainable development paths for different types of countries have been derived. Demand- and economy-dominated countries like Germany and Italy should accelerate infrastructure construction, improve supply chain control, and master import autonomy. Trade transit countries like France and Spain should maintain the stability of existing infrastructure and continuously expand sources to ensure export stability. Lower-consumption countries, such as Portugal and Slovenia, should fully utilize their geographical advantages to become regional hubs.
Author Contributions
X.R.: Methodology, Validation, Formal analysis, Investigation, Resources; Q.C. and G.Z.: Formal analysis, Writing—Reviewing and Editing; K.W. and Y.Z.: Resources, Writing—Reviewing and Editing; C.S.: Software, Methodology. D.S.: Methodology, Software. All authors have read and agreed to the published version of the manuscript.
Funding
This research was funded by the following programs: National Science and Technology Major Project of Deep Earth (No. 2024ZD1002006), Second-level Geological Survey Project of China Geological Survey (No. DD20230040), National Natural Science Foundation of China (No. 4227012037).
Institutional Review Board Statement
Not applicable.
Informed Consent Statement
Not applicable.
Data Availability Statement
All data generated or analyzed for this study are included in this published article.
Conflicts of Interest
The authors declare that they have no competing interests.
References
- Ding, C.; Sun, L.; Ji, H.N. European economy since the Russia-Ukraine conflict: Performance, causes, policy responses and prospects. J. Tongji Univ. (Soc. Sci. Sect.) 2024, 35, 24–35. (In Chinese) [Google Scholar]
- Zou, C.N.; Zhao, Q.; Zhang, G.S.; Xiong, B. Energy revolution: From fossil energy to new energy. Nat. Gas Ind. 2016, 36, 1–10. (In Chinese) [Google Scholar]
- Gürsan, C.; de Gooyert, V. The systemic impact of a transition fuel: Does natural gas help or hinder the energy transition? Renew. Sustain. Energy Rev. 2021, 138, 110552. [Google Scholar] [CrossRef]
- McGlade, C.; Pye, S.; Ekins, P.; Bradshaw, M.; Watson, J. The future role of natural gas in the UK: A bridge to nowhere? Energy Policy 2018, 113, 454–465. [Google Scholar] [CrossRef]
- European Commission. Communication from the Commission to the European Parliament, the European Council, the Council, the European Economic and Social Committee and the Committee of the Regions the European Green Deal; European Commission: Brussels, Belgium, 2019.
- European Council. Fit for 55 [EB/OL]; European Council: Brussels, Belgium, 2025. Available online: https://www.consilium.europa.eu/en/policies/fit-for-55/ (accessed on 3 July 2025).
- Jensen, G.E.A.L. Fit for 55 Package; European Parliamentary Research Service: Brussels, Belgium, 2022.
- BP. BP Energy Outlook; BP: London, UK, 2024. [Google Scholar]
- Tong, X.G.; Zhang, G.Y.; Wang, Z.M.; Tian, Z.J.; Niu, J.Y.; Wen, Z.X. Global oil and gas resource potential and distribution. Earth Sci. Front. 2014, 21, 1–9. (In Chinese) [Google Scholar] [CrossRef]
- Huang, W.H.; Zhou, S.H.; Wang, J. Changes in global natural gas supply-demand pattern and implications for China’s supply security. Pet. New Energy 2023, 35, 1–12+20. (In Chinese) [Google Scholar]
- European Commission. REPowerEU [EB/OL]; European Commission: Brussels, Belgium, 2025. Available online: https://commission.europa.eu/topics/energy/repowereu_en#roadmap-to-fully-end-dependency-on-russian-energy (accessed on 1 July 2025).
- European Parliament and Council. Regulation (EU) 2024/1787 of the European Parliament and of the Council of 13 June 2024 on the Reduction of Methane Emissions in the Energy Sector and Amending Regulation (EU) 2019/942; European Union: Brussels, Belgium, 2024.
- Correlj, A.; van der Linde, C. Energy supply security and geopolitics: A European perspective. Energy Policy 2006, 34, 532–543. [Google Scholar] [CrossRef]
- Ruble, I. European Union energy supply security: The benefits of natural gas imports from the Eastern Mediterranean. Energy Policy 2017, 105, 341–353. [Google Scholar] [CrossRef]
- He, Z.; Yang, Y.; Liu, Y.; Jin, F.J. Evolution characteristics of global energy trade network and energy competition-cooperation relationships. Prog. Geogr. 2019, 38, 1621–1632. (In Chinese) [Google Scholar] [CrossRef]
- Ma, Y.; Xu, L.L. Structure and influencing factors of natural gas trade network in Belt and Road countries. World Econ. Stud. 2017, 2017, 109–122+136. (In Chinese) [Google Scholar]
- Egging, R.; Holz, F. Risks in global natural gas markets: Investment, hedging and trade. Energy Policy 2016, 94, 468–479. [Google Scholar] [CrossRef]
- Gao, S.Q.; Duncan, P. Energy game between EU and Russia: Energy monopoly, market liberalization and multilateral governance. World Econ. Stud. 2014, 2, 81–86+89. (In Chinese) [Google Scholar]
- Eser, P.; Chokani, N.; Abhari, R. Impact of Nord Stream 2 and LNG on gas trade and security of supply in the European gas network of 2030. Appl. Energy 2019, 238, 816–830. [Google Scholar] [CrossRef]
- Zeng, F.; Li, J. Research on EU natural gas security and countermeasures based on two-dimensional cloud model. Energy 2024, 305, 132196. [Google Scholar] [CrossRef]
- Lian, B. Securitization and its dilemma of EU’s energy strategy towards Russia. Ger. Stud. 2022, 37, 25–47+113–114. (In Chinese) [Google Scholar]
- Wang, S.C.; Chen, Z.Y.; Lin, S.Y. Russia-Europe natural gas game in the context of Russia-Ukraine conflict. Russ. East Eur. Cent. Asian Stud. 2022, 5, 81–101+168. (In Chinese) [Google Scholar]
- Xing, J.Y.; Chen, Q.S.; Zhang, Y.F.; Long, T.; Zheng, G.D.; Wang, K.; Ren, X.; Zhang, Y. EU energy resource strategy under the Russia-Ukraine conflict. China Min. Mag. 2025, 34, 1–8. (In Chinese) [Google Scholar]
- Özdemir, L.V.N.S.; Ozen, E.S.B.G. Volatility Modeling of the Impact of Geopolitical Risk on Commodity Markets. Economies 2025, 13, 88. [Google Scholar] [CrossRef]
- Qin, J. Structural Characteristics and Influencing Factors of Global Energy Trade Network; Hunan University: Changsha, China, 2014. (In Chinese) [Google Scholar]
- Wang, J.; Li, N. Influencing factors and future trends of natural gas demand in the eastern, central and western areas of China based on the grey model. Nat. Gas Ind. B 2020, 7, 473–483. [Google Scholar] [CrossRef]
- Song, M.; Wang, Z.; Chi, L.; Wang, R.; Zhu, M. Study on short-term natural gas system resilience under import shortage shocks. Energy 2025, 328, 136643. [Google Scholar] [CrossRef]
- Zhang, H.; Xi, W.; Ji, Q.; Zhang, Q. 2018. Exploring the driving factors of global LNG trade flows using gravity modelling. J. Clean. Prod. 2018, 172, 508–515. [Google Scholar] [CrossRef]
- Su, J.; Wang, W.; Bai, Y.; Zhou, P. Measuring the natural gas price features of the Asia-Pacific market from a complex network perspective. Energy 2025, 314, 134133. [Google Scholar] [CrossRef]
- Chen, W.; Xiong, S.; Chen, Q. Characterizing the dynamic evolutionary behavior of multivariate price movement fluctuation in the carbon-fuel energy markets system from complex network perspective. Energy 2022, 239, 121896. [Google Scholar] [CrossRef]
- Wang, M.; Chen, Y.; Tian, L.; Jiang, S.; Tian, Z.; Du, R. Fluctuation behavior analysis of international crude oil and gasoline price based on complex network perspective. Appl. Energy 2016, 175, 109–127. [Google Scholar] [CrossRef]
- Wang, W.; Li, Z.; Cheng, X. Evolution of the global coal trade network: A complex network analysis. Resour. Policy 2019, 62, 496–506. [Google Scholar] [CrossRef]
- Geng, J.; Ji, Q.; Fan, Y. A dynamic analysis on global natural gas trade network. Appl. Energy 2014, 132, 23–33. [Google Scholar] [CrossRef]
- He, Q.; Cao, X. Pattern and Influencing Factors of Foreign Direct Investment Networks between Countries along the “Belt and Road” Regions. Sustainability 2019, 11, 4724. [Google Scholar] [CrossRef]
- Zhang, S.; Chen, Z.; Chen, Y.; Yang, S. The Structure and Influencing Mechanisms of the Global Palm Oil Trade: A Complex Network Perspective. Sustainability 2025, 17, 3062. [Google Scholar] [CrossRef]
- Wang, J.F.; Xu, C.D. Geodetector: Principle and prospective. Acta Geogr. Sin. 2017, 72, 116–134. (In Chinese) [Google Scholar]
- Zhang, X.L.; Zhao, Y.; Xu, X.; Wang, C.J. 2016. Spatiotemporal evolution of natural gas resource flow advantage in China. Geogr. Res. 2016, 35, 1457–1469. (In Chinese) [Google Scholar]
- Zhu, M.; Dong, P.; Ju, Y.; Fu, Z. Assessing economies’ resilience of international liquefied natural gas trade network in the presence of the ripple effect. Energy 2024, 313, 133491. [Google Scholar] [CrossRef]
- Ma, Y.; Wang, M.; Li, X. Analysis of the characteristics and stability of the global complex nickel ore trade network. Resour. Policy 2022, 79, 103089. [Google Scholar] [CrossRef]
- IEA. Belgium Natural Gas Security Policy [EB/OL]; IEA: Paris, France, 2025; Available online: https://www.iea.org/articles/belgium-natural-gas-security-policy (accessed on 7 July 2025).
- IEEFA. European LNG Tracker [EB/OL]; IEEFA: Valley City, OH, USA, 2025; Available online: https://ieefa.org/european-lng-tracker (accessed on 2 July 2025).
- Kowalska, A.; Hałka, M.; Budzyńska, A.; Kicia, M.; Terpiłowski, K. Fertilizer Price Surge in Poland and Beyond: Seeking the Way Forward towards Sustainable Development. Sustainability 2024, 16, 6943. [Google Scholar] [CrossRef]
- Makarenko, P.A. Global Natural Gas Market Outlook: European Supply Challenges and Regional Demand Dynamics [EB/OL]. 2025. Available online: https://blogs.worldbank.org/zh/opendata/global-natural-gas-market-outlook--european-supply-challenges-an (accessed on 9 July 2025).
Disclaimer/Publisher’s Note: The statements, opinions and data contained in all publications are solely those of the individual author(s) and contributor(s) and not of MDPI and/or the editor(s). MDPI and/or the editor(s) disclaim responsibility for any injury to people or property resulting from any ideas, methods, instructions or products referred to in the content. |
© 2025 by the authors. Licensee MDPI, Basel, Switzerland. This article is an open access article distributed under the terms and conditions of the Creative Commons Attribution (CC BY) license (https://creativecommons.org/licenses/by/4.0/).