Article

Understanding Farmers’ Knowledge, Perceptions, and Adaptation Strategies to Climate Change in Eastern Rwanda

1
African Institute for Mathematical Sciences, Research and Innovation Centre, Kigali P.O. Box 6428, Rwanda
2
Department of Physics, School of Science, College of Science and Technology, University of Rwanda, Kigali P.O. Box 3900, Rwanda
3
Department of Computational Engineering, School of Engineering Sciences, Lappeenranta-Lahti University of Technology, P.O. Box 20, FI-53851 Lappeenranta, Finland
4
Meteorological Research Unit, Finnish Meteorological Institute, P.O. Box 503, FI-00101 Helsinki, Finland
*
Author to whom correspondence should be addressed.
Sustainability 2025, 17(15), 6721; https://doi.org/10.3390/su17156721
Submission received: 16 May 2025 / Revised: 14 June 2025 / Accepted: 23 June 2025 / Published: 24 July 2025

Abstract

This study investigates farmers’ knowledge, perceptions, and adaptation strategies to climate change in Rwanda’s Eastern Province, integrating social and physical science approaches. Analyzing meteorological data (1981–2021) and surveys from 204 farmers across five districts, we assessed climate trends and adaptation behaviors using statistical methods (descriptive statistics, Chi-square, logistic regression, Regional Kendall test, dynamic linear state-space model). Results show that 85% of farmers acknowledge climate change, with 54% observing temperature increases and 37% noting rainfall declines. Climate data confirm significant rises in annual minimum (+0.76 °C/decade) and mean temperatures (+0.48 °C/decade), with the largest seasonal increase (+0.86 °C/decade) in June–August. Rainfall trends indicate a non-significant decrease in March–May and a slight increase in September–December. Farmers report crop failures, yield reductions, and food shortages as major climate impacts. Common adaptations include agroforestry, crop diversification, and fertilizer use, though financial limitations, information gaps, and input scarcity impede adoption. Despite limited formal education (53.9% primary, 22.3% no formal education), indigenous knowledge aids seasonal prediction. Farm location, group membership, and farming goal are key adaptation enablers. These findings emphasize the need for targeted policies and climate communication to enhance rural resilience by strengthening smallholder farmer support systems for effective climate adaptation.

Graphical Abstract

1. Introduction

Increasing greenhouse gases in the Earth’s atmosphere owing to human activities such as the burning of fossil fuels and deforestation, together with natural activities since the mid-20th century, have resulted in a global average temperature increase [1,2]. The rise in the Earth’s temperature, known as global warming, influences climate and weather patterns from global to local scales. The existing consequences of climate change that have been identified include frequent and intense droughts, downpours, floods, hurricanes, storms, water scarcity, severe wildfires, melting polar ice, sea level rise, and declining biodiversity [3]. Those consequences have impacted most of the critical sectors of life, ranging from agriculture, food production, water resources, energy, health and public health systems, transportation, infrastructure, ecosystems, and biodiversity [4].
People worldwide experience climate change impacts in various ways, with varying severity based on geographic location and primary economic activities. Agriculture remains a crucial sector supporting a significant portion of the population in Africa, a continent with many developing nations. Most agricultural activities are rain-dependent, increasing their vulnerability to climate change effects [5,6]. Changes in temperature and rainfall patterns owing to climate change have posed significant challenges for agricultural communities across the African continent, with the severity of these challenges varying from region to region and country to country.
In East Africa, many people in this region, especially those in the agriculture sector, are impacted by climate change through protracted droughts, floods, and water scarcity, which put them at risk of food insecurity [7]. Rwanda, one of the East African nations, has been previously studied, revealing changes in temperature and rainfall during important seasons over the years. These changes include the observed decline in seasonal and annual total rainfall [8,9,10,11] and increasing temperature [12,13,14] in many parts of the country. In studies including those by Sebaziga et al. [10] and Rwema et al. [15], focusing on Rwanda’s Eastern Province, which is the largest under agricultural production, scholars have noted a decrease in seasonal rainfall, while a high increase in temperature was also recorded over this region [16].
Increased temperatures and decreased rainfall often resulted in diminished water availability for rainfed agriculture, increasing the likelihood of droughts and intensifying pressure on agricultural water resources [17]. Over the past few decades, Eastern Rwanda has experienced recurring deficits in rainfall, leading to severe and prolonged droughts. Consequently, water scarcity and food insecurity have escalated in this area [18,19], leading to diverse experiences among farmers.
Repeated exposure to climate-related hazards influences individuals’ perceptions [20], prompting the development of various adaptation and mitigation strategies to address the perceived impacts. Factors including knowledge, beliefs, and perceptions play a crucial role in developing and adopting adaptation strategies. It is imperative to understand climate change comprehensively by exploring its physical mechanisms and considering individual behaviors in response to the occurring changes.
Previous studies conducted in Eastern Rwanda have predominantly centered on climatic mechanisms, particularly analyzing trends and variabilities in annual and seasonal temperature and rainfall patterns [8,10,15]. Studying the climate aspect is very important for several reasons: it promotes a better understanding of patterns and dynamics of climate systems. It also reveals long-term trends in climate variables, which further explain significant implications for vital sectors such as agriculture, water resources, and health. Furthermore, analyzing historical data enables the construction of models and projections for future climate conditions, which is crucial for decision-makers to take appropriate actions to adapt to and mitigate the potential impact of climate change. However, very little attention has been paid to exploring the variations in behaviors among individuals, particularly farmers, concerning their perceptions, experiences, and knowledge of climate change across the Eastern Province. This information helps identify the knowledge gaps and misconceptions, allowing for tailored educational efforts [21] in vulnerable communities.
Studying how individuals perceive and experience climate change is also instrumental in assessing their behavioral responses and identifying barriers to adaptation and sustainable behaviors [22]. Additionally, engaging with local and indigenous knowledge provides valuable insights into climate change impacts at local and regional levels. This knowledge complements historical data, informs policy decisions, and contributes to more context-specific responses.
This study aims to explore farmers’ knowledge and perceptions of climate change, its impacts, and the adaptation strategies employed in the Eastern Province of Rwanda. Additionally, it seeks to identify the key factors influencing farmers’ decisions to adopt specific adaptation measures. To accomplish this, we analyzed data gathered from interviews with farmers across five districts in Eastern Rwanda. To guide this investigation, we address the following research questions:
  • To what extent do farmers in Eastern Rwanda perceive and respond to climate change?
  • What are the key socioeconomic determinants of their adaptation strategies?
These questions help frame the study’s focus on understanding both the perceptions and adaptive responses of farmers, providing insights that are relevant for policy and practice.
The remaining part of this manuscript is structured as follows: The Section 2 gives details of the methods used for data collection and analysis in the study. The Section 3 presents the findings, which are discussed further in the Section 4. Lastly, the Section 5 provides conclusions and offers recommendations.

2. Materials and Methods
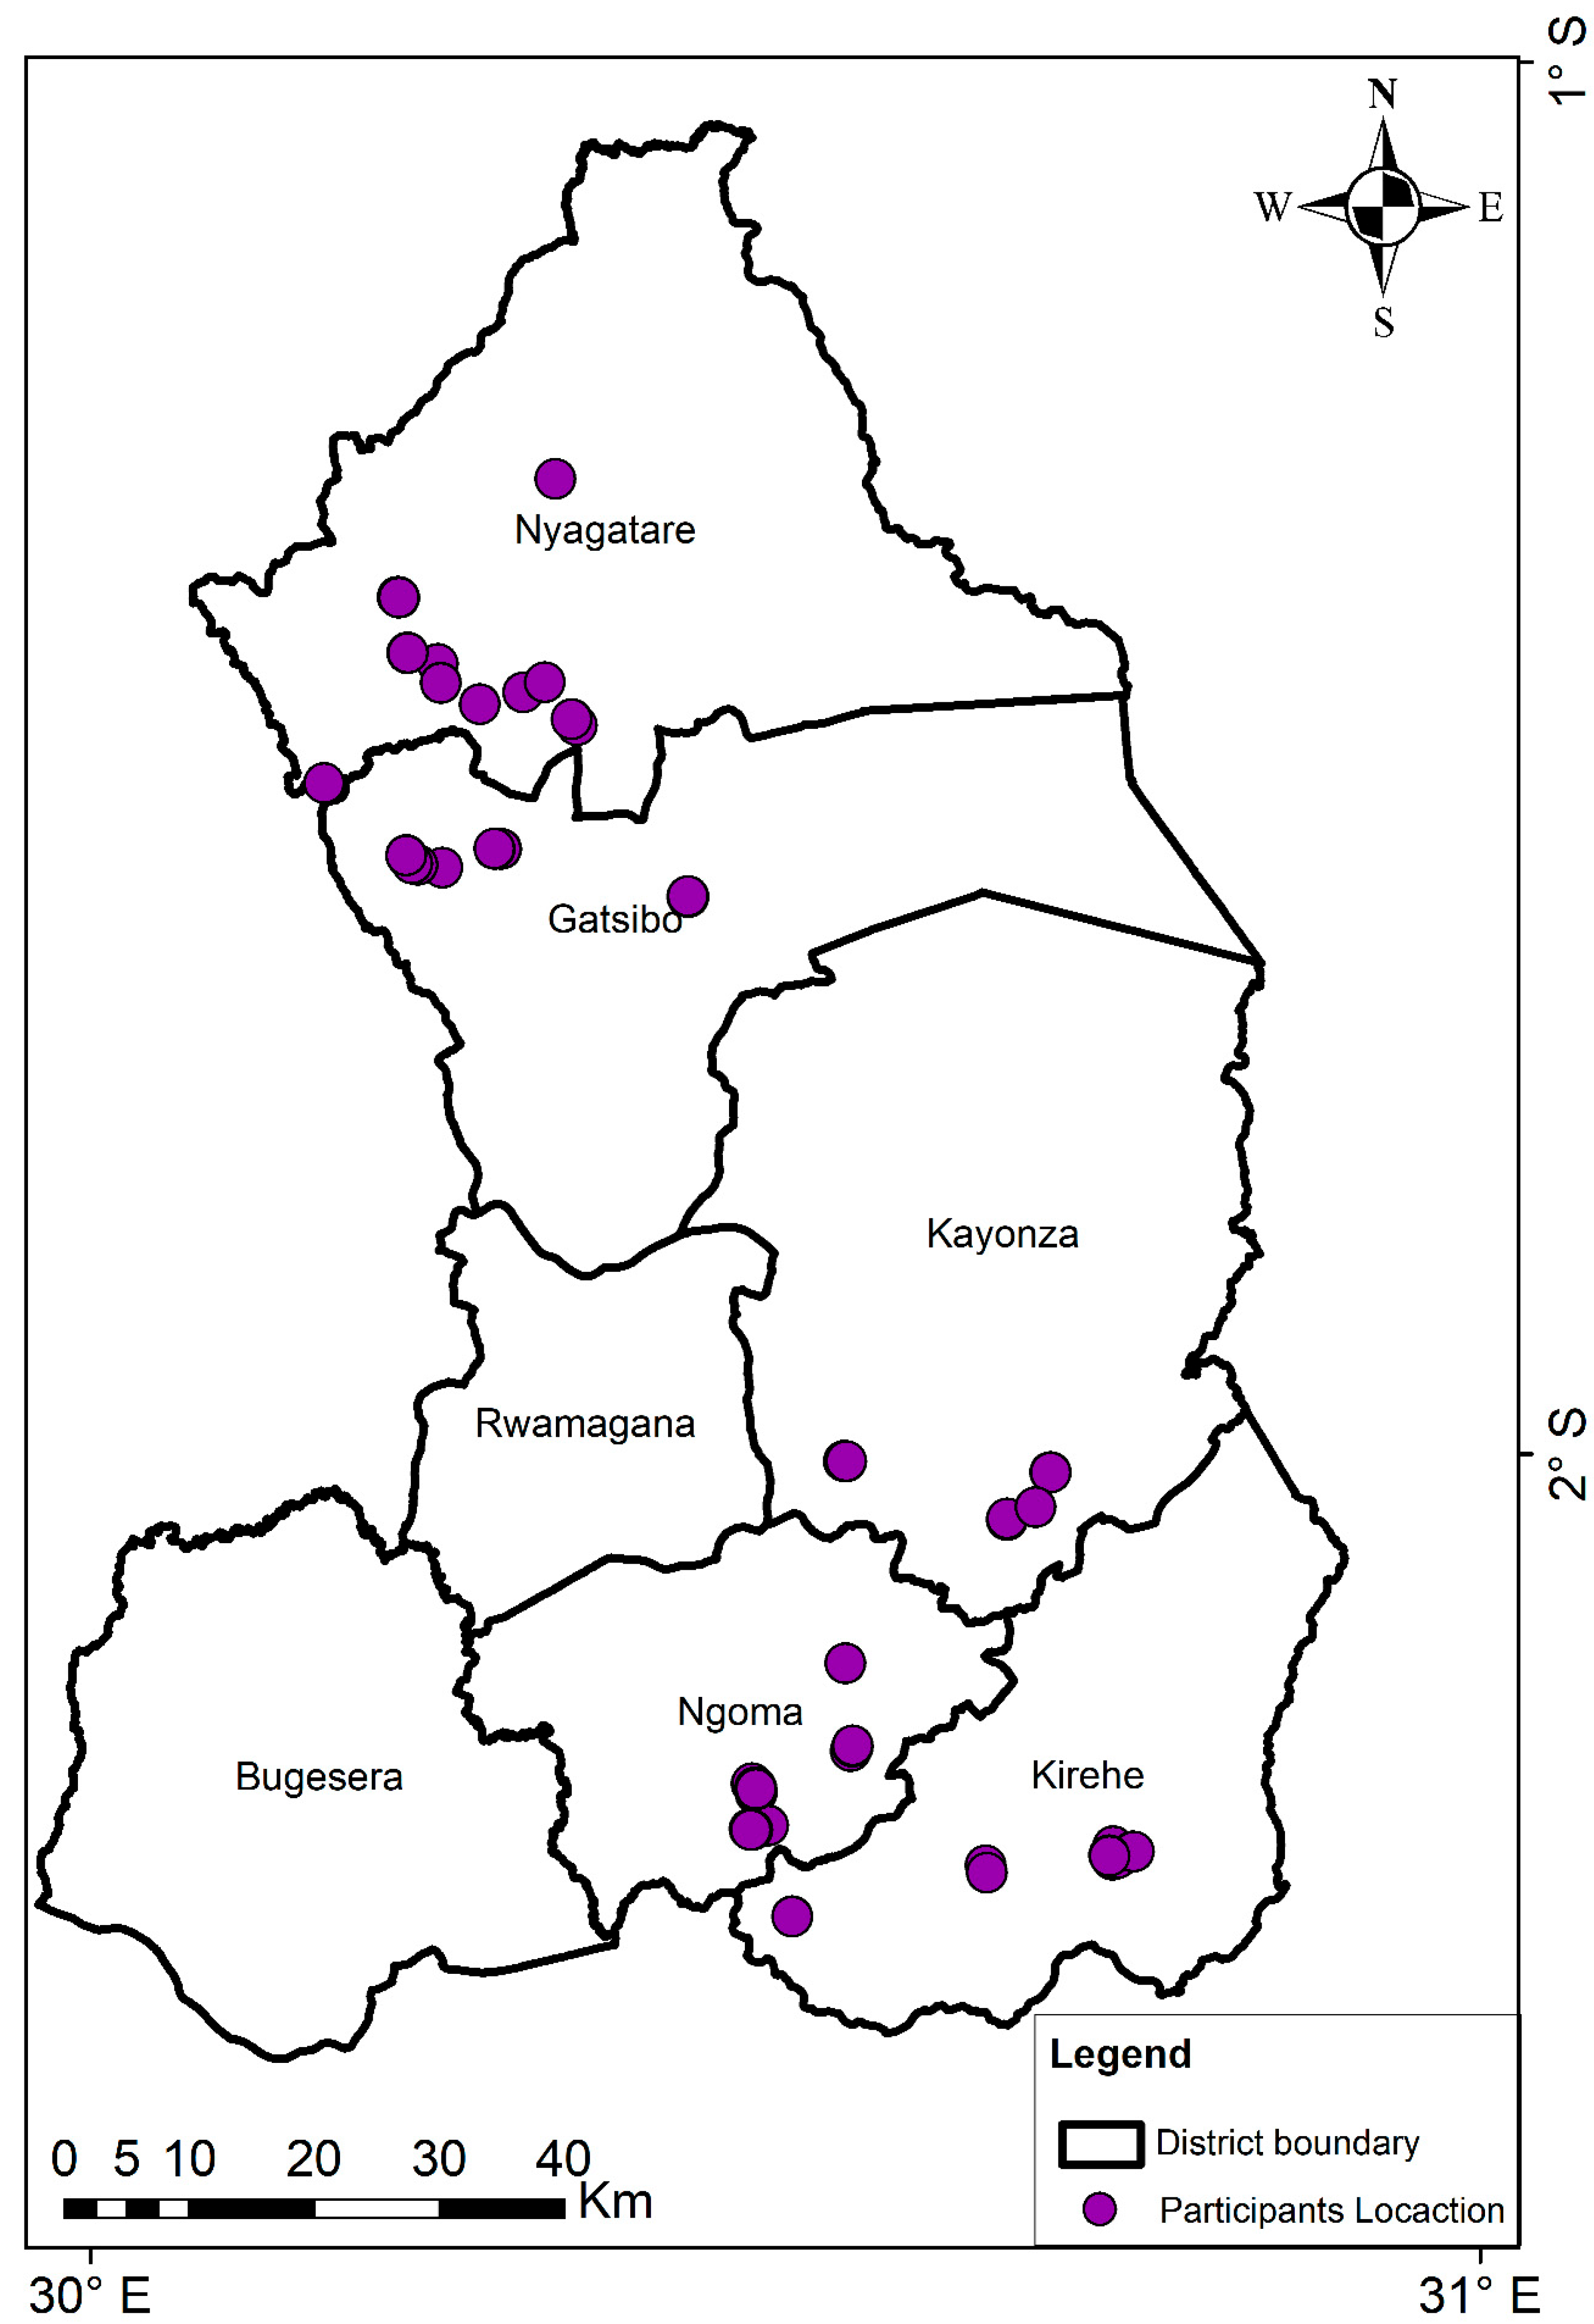
2.1. Study Area

This study is conducted in the Eastern Province of Rwanda, the largest (9,813,000,000 m2) of the five provinces. Its administrative borders connect this province to three countries: Uganda to the North, Tanzania to the East, and Burundi to the South. It is subdivided into seven districts: Bugesera, Gatsibo, Kayonza, Kirehe, Ngoma, Nyagatare, and Rwamagana (see Figure 1). Geographically, the Eastern Province is located approximately between longitudes 29.9° and 30.9° E and latitudes 1.1° and 2.3° S. The region’s topography features lowland areas with altitudes below 1500 m, characterized by a high annual mean temperature exceeding 293.15 K and low annual rainfall of less than 1000 mm. With the largest population (i.e., 3,563,145), the region’s economy mainly relies on agriculture and livestock. The Eastern region experiences four seasons throughout the year, including two rainy seasons and two dry seasons. The primary rainy seasons occur from March to May (MAM) and from September to December (SOND), with April and November serving as the peak months for these seasons, respectively. Conversely, the dry seasons take place from January to February (JF) and from June to August [23].
Most agricultural practices in this area rely on rainfall and align with the two rainy seasons [24,25]. The main crops in Eastern Rwanda include maize, beans, sorghum, rice, cassava, and bananas. As in other parts of the country, the high dependence on rainfall increases vulnerability to the adverse impacts of changes and variability in rainfall and temperature [17]. Over the past few decades, drought has emerged as a significant challenge in this region, leading to decreased agricultural and livestock production, exacerbating food insecurity among a substantial portion of the population [18,19]. From the Northern to the Southern regions of the Eastern Province, farmers have extensive insights to share, particularly about climate change, its impacts, and various adaptation strategies. The farmers participating in this study were recruited from five of the seven districts in the Eastern Province: Nyagatare, Gatsibo, Kayonza, Ngoma, and Kirehe (see Figure 1).

2.2. Sample(s)

The total number of 638,806 agricultural households from seven districts of the Eastern Province [26] was considered to be the population size. With Yamane’s formula [27], we estimated the size of the sample to be 204 heads of households at a 93% confidence level, which implies allowing a margin error of 7%.
n = N 1 + N e 2 ,
where n = Sample size, N = Total population, and e = Margin of error.
While a 95% confidence level would have necessitated a substantially larger sample of approximately 400 farmers, practical constraints related to time and resources required adjustment. Although this reduction in confidence level may marginally affect estimate precision, the final sample of 204 respondents was deemed sufficient to yield robust and meaningful findings within the study’s logistical parameters.
Multistage sampling was used to select respondent farmers from the Eastern Province. Five of the seven districts in the Eastern Province were chosen purposely to ensure representation from the North, Central, and Southern regions. In the North, we included the Nyagatare and Gatsibo districts; in the Central area, we included the Kayonza district; and in the South, we included the Ngoma and Kirehe districts (See Figure 1). Sectors from each district were selected systematically, mainly based on agricultural activities, farmers’ availability, and accessibility. From each sector, with the assistance of sector agronomists, we purposely selected cells based on farmers’ availability. In each cell, the Executive Secretary or Socio-Economic Development Officer (SEDO) assisted in identifying exemplary farmers who, due to their extensive knowledge of and active participation in local farmer groups, were able to provide a comprehensive and prompt list of potential respondents. To reduce selection bias, respondents were then randomly selected from this list, ensuring a representative sample of the farming community within each cell.
The distribution of respondent farmers from the districts to cells, as shown in Table 1, indicates the number of respondent farmers per district as follows: Nyagatare (33), Gatsibo (35), Kayonza (36), Ngoma (74), and Kirehe (26). The higher number of respondents from the Ngoma district reflects a proportional allocation based on the relative size of agricultural households in each district, with districts having larger agricultural populations receiving a correspondingly larger share of the sample. This approach was used to ensure that the sample accurately represents the population distribution across the study area and helps reduce sampling bias that could arise if all districts were sampled equally, regardless of their size.

2.3. Data Type and Data Collection Approach

The meteorological data analyzed included rainfall through derived seasonal rainfall variables such as seasonal rainfall amount, onset and cessation, and seasonal duration, along with minimum (Tn), maximum (Tx), and average (T) temperatures at both annual and seasonal levels. The rainfall and temperature datasets were obtained from the Rwanda Meteorology Agency (Meteo Rwanda) [28].
To define the onset and cessation of the rainy season, we adopted established agroclimatic criteria originally proposed by Stern et al. [29], Omotosho et al. [30], and others, as applied and adapted by Rwema et al. [15]. Specifically, the onset of rain was identified as the first day when a total rainfall of at least 20 mm accumulated over a 5-day period, with at least 3 consecutive rainy days (≥1 mm/day), and no dry spell exceeding 7 consecutive days within the subsequent 21 days. The cessation of rain was defined as the first day after which precipitation remained below 0.5 times the evapotranspiration for at least 10 consecutive days. The season duration was calculated as the difference in days between the cessation and onset dates.
The farmers’ data were based on recorded responses from interviews conducted in November 2023 with farmers from the Eastern Province of Rwanda. A semi-structured questionnaire featuring a combination of open-ended and closed-ended questions was prepared and used for data collection. While some sections, such as socioeconomic characteristics, primarily used closed-ended questions (e.g., gender, group membership), other sections employed a mix of both closed-ended and open-ended questions to capture richer information. For example, in the knowledge of weather and climate change section, respondents were first asked closed-ended questions (e.g., “Have you heard about weather and climate?”), followed by open-ended questions to explore their understanding in more detail. Similarly, sections on perceptions, adaptation strategies, and barriers to adaptation included mainly open-ended questions, often allowing multiple responses to better capture the complexity of farmers’ experiences. Below are example questions and measurement scales used for each section:
  • Section 1: Socioeconomic characteristics
    Example questions:
    o
    “How old are you?” (Open numerical response)
    o
    “What is your gender?” (Male/Female)
    o
    “Do you belong to any farmer group/cooperative?” (Yes/No)
  • Section 2: Knowledge of weather and climate change
    Example questions:
    o
    “Have you heard about the weather and climate?” (Yes/No)
    o
    “If yes, what do you know about weather and climate?” (Open-ended)
  • Section 3: Perceptions regarding climate change and its impacts
    Example questions:
    o
    “Do you agree when they say the climate has changed?” (Yes/No)
    o
    “What change have you observed?” (Open-ended)
  • Section 4: Adaptation strategies
    Example questions:
    o
    “What do you do to adapt to the impacts of climate change?” (Open-ended, multiple responses)
    o
    “What adaptation strategies have you found to be most effective?” (Open-ended)
  • Section 5: Barriers to adaptation
    Example question:
    o
    “What are the main barriers/challenges you have faced in implementing adaptation strategies?” (Open-ended, multiple responses)
This structured questionnaire design ensures comprehensive coverage of key topics relevant to farmers’ experiences with climate change and adaptation. The questionnaire was refined and incorporated into smartphones and tablets using the Open Data Kit (ODK) Collect (GetODK, San Diego, CA, USA), version v2023.3.0 [31] for efficient field data collection. We applied an in-depth interview technique involving intensive individual interviews with 204 farmers from the Eastern Province. Depending on the respondent’s understanding, the interview lasted between 3600 and 5400 s. Informed consent was obtained verbally from all participants.
To further clarify the research approach, a conceptual framework (Figure 2) has been included to visually represent the logical flow of the study. This framework outlines how farmers’ socioeconomic characteristics and knowledge inform their perceptions and observed impacts of climate change, which in turn influence their adaptation strategies and the barriers they face. By linking each section of the questionnaire to the broader research objectives, the diagram enhances the clarity and structure of the paper. This approach aligns with established frameworks in climate change research that emphasize the progression from exposure and knowledge to perception, response, and constraints, thereby facilitating a comprehensive understanding of adaptation processes.

2.3.1. Climate Data Analysis

To analyze rainfall events, we applied the non-parametric Regional Kendall test [32]. This test enhances the Mann–Kendall test [33,34] by enabling the simultaneous analysis of trends across multiple locations while accounting for spatial correlation among datasets. It is robust against non-normal distributions and is less influenced by missing data and outliers [35]. This enhanced capacity allows for the identification of region-wide patterns and trends, considering the interrelationships among different monitoring stations or regions. The Regional Kendall test has been widely employed to determine whether there is an increasing or decreasing trend over time in environmental and climatic data [36,37]. The magnitude of the trend was quantified using the non-parametric Sen’s Slope estimator, which is reliable and resistant to the influence of outliers [10,15,38]. Seasonal and annual changes in minimum, maximum, and mean temperatures are calculated using a dynamic linear state-space model. This model effectively captures overall changes and temporal patterns by connecting hidden states that evolve over time to observed measurements while accounting for random fluctuations [39,40,41,42]. The construction procedure for a DLM model and estimations of model states and parameters can be found in Rwema et al. [43], which utilizes a similar DLM model to investigate trends in air temperature across nearly homogeneous zones of the Eastern Province of Rwanda.

2.3.2. Farmers’ Field Data Analysis

After collecting field data, we processed and analyzed the dataset using Microsoft Excel 2016 (Microsoft Corporation, Redmond, WA, USA), version 16.0.4266.1001, 64-bit and IBM SPSS Statistics (IBM Corp., Armonk, NY, USA), version 28.0.0 [44] for a comprehensive statistical evaluation. All responses were anonymized to protect participants’ identities. The analysis primarily employed descriptive statistics, including frequencies, means, and percentages. A Chi-square test was conducted to explore whether a significant association exists between gender and adaptation strategies. The binary logistic model was used to examine how socioeconomic factors influence farmers’ choice of adaptation strategies. As farmers utilized multiple adaptation strategies in combination, it was recommended to use a logistic regression approach to identify the determinants of farmers’ choices regarding adaptation strategies [45]. This approach allows for the assessment of adoption choices by categorizing the dependent variables into a binary choice: either adopted or not adopted. The binary logistic model can be expressed as:
Y i j * = a + k β k X k + ε i j ,
where Y i j * is the dependent variable (hidden) for a farmer i who adopts strategy j . The X k represents independent variables (k factors that influence the farmer’s decision). The a and β k are, respectively, the intercept and the coefficient of the model, while ε i j is the error term. From Equation (2), the condition for Y i j is set to be
Y i j = 1   i f   Y i j * > 0 0   otherwise ,
where Y i j is the dependent variable (observed), indicating that the farmer i will (will not) adopt strategy j as Y i j = 1 . Therefore, the conditional probability that Y i j = 1 is defined as:
Pr Y i j = 1 x = Pr Y i j * > 0 x = e x p ( β k X k ) 1 + e x p ( β k X k ) = G β k X k ,
here, x denotes the particular value of the independent variable X k for a specific observation being evaluated for its conditional probability, and where G is the binomial distribution [46].
To obtain the marginal effects that explain the significance and the magnitude of the relationship between dependent variables (i.e., adaptation strategies) and independent variables (i.e., factors influencing farmers’ choices), the derivative of Equation (4) with respect to X k is required.
G ( β k X k ) X k = Pr Y i j = 1 x . 1 Pr Y i j = 1 x . β k .
Then, the coefficients in Equation (5) are explained concerning marginal effects on odds ratios [47]. With p i = P r ( Y i j = 1 | x ) as the probability that a farmer i adopts the adaptation strategy j , the odds ratio is p i 1 p i , the ratio of the probability of adopting to the probability of not adopting [48].
O d d s = p i 1 p i = e x p ( β k X k ) 1 + e x p ( β k X k ) 1 e x p ( β k X k ) 1 + e x p ( β k X k ) = exp β k X k ; ln p i 1 p i = β k X k ,
Various scholars, including Acquah-de Graft [49], Asekun-Olarinmoye et al. [50], Kabir et al. [51], Mubalama et al. [52], Balasha et al. [53], and Batungwanayo et al. [45], have employed this approach to examine the factors influencing farmers’ decisions regarding adaptation measures.
The model was validated using the Omnibus and Hosmer and Lemeshow tests, which assess its robustness by comparing the predictors with a model that includes only an intercept. Accordingly, it follows an asymptotic Chi-square distribution, with degrees of freedom determined by the difference between the number of variables in the predictor model and the intercept-only model [54]. The Omnibus test should yield a significant p-value (<0.05), while the Hosmer and Lemeshow test should produce an insignificant p-value (>0.05). To evaluate the model’s accuracy, we utilize the classification method, which compares the predicted scores from the model’s independent variables against their actual responses recorded in the data. Consequently, the model’s accuracy reflects the proportion of correctly estimated positive and negative events relative to the total number of events [48]. Higher percentages indicate effective performance.

3. Results

3.1. Changes in Temperature and Rainfall Events in Eastern Province

The investigation of temperature trends has revealed a significant positive increase in annual mean temperature over Eastern Rwanda (Table 2). The mean annual maximum temperature showed no significant change. The mean seasonal minimum temperature demonstrated a notable positive change across all seasons, suggesting that the observed rise in both seasonal and annual mean temperatures is mainly attributed to increasing minimum temperatures.
Rainfall amounts in the Eastern Rwanda region exhibit non-significant decreasing and increasing trends during the March to May and September to December seasons, respectively (Table 3). The onset of the rainy season has changed significantly, starting earlier than in the past. The length of the seasons indicates an increase across the region in both periods, with a significant change noted for the September to December season.

3.2. Socioeconomic Characteristics of Respondent Farmers

Table 4 presents the socioeconomic characteristics of 204 respondent farmers (heads of household) in the Eastern Province of Rwanda. A total of 57% of the respondents were male and 43% were female. The mean age of the respondents was 44 years, and they had a mean farming experience of 22 years. The mean duration of working on a farm per day was 20,160 s. The respondents exhibited a low level of education, with the majority (61%) having attended only primary school, and 17% reporting no formal education.
The farm sizes ranged from 200 to 10,000 m2 for 71% of respondents, from 11,000 to 20,000 m2 for 20%, and from 21,000 m2 and above for 10% of respondents, with an average size of 13,000 m2. Of the respondents, 48% exclusively farm on hillsides, 15% solely farm in wetlands, and 38% engage in farming activities in both hillsides and wetlands. The majority (53%) of respondents utilized inherited land for agriculture, while 17% relied on privately rented land, and 30% of respondents utilized both inherited and rented land.
The primary farming objective for the majority (68%) of the respondents was to generate income while meeting home consumption needs. Meanwhile, 30% focused solely on home consumption, and 2% aimed solely at generating income. Most respondents primarily cultivated maize (90%) and beans (89%) as their main crops. While carrying out agricultural practices, 64% of respondents are also engaged in livestock breeding, while 36% do not engage in livestock activities.
A total of 37% of respondents were members of at least one farmer group, while 63% did not belong to any group. A total of 79% of respondents reported exchanging agricultural information with fellow farmers, while 21% did not. The majority (51%) of respondents lacked access to weather information, while 49% primarily accessed it through radio broadcasts. More than half (58%) of the respondents had access to banking services and had bank accounts, while 42% were not linked to any banking institution. The average household size was five people.

3.3. Farmers’ Knowledge of Weather and Climate Change

The climate variables linked to farmers’ indigenous knowledge of critical agricultural indicators, such as the onset and cessation of rainy seasons, are presented in Table 5. As many as 35% of respondent farmers reported that they could predict/forecast the seasonal onset based on cloud features. For example, one farmer explained: “As the onset of rainy season approaches, we begin to observe dark clouds circulating in the sky and experience very cold mornings while the nights grow warmer” (farmer number 178). A total of 19% of respondent farmers claimed to have knowledge linked to the wind direction and patterns prevalent over the region. For instance, one farmer stated: “We recognize that the onset of the rainy season is near when, around the 5th of September, we begin to experience strong winds, which we interpret as a precursor to rainfall, and we use to say that the wind is going to fetch rain, when these winds return around the 5th to 10th of October, they bring rain” (farmer number 181). A total of 13% of respondents claim to possess knowledge related to temperature patterns. For instance, one respondent mentioned: “One of the signs of the onset of the rainy season is that we begin to experience warmer nights, accompanied by observable changes in cloud formations in the sky” (farmer number 84).
The farmer’s knowledge regarding the rainy seasonal cessation (Table 5) was mainly linked to rainfall patterns, including rainfall distribution, rainfall amount, rainfall frequency, and rainfall duration in the region. Of the respondent farmers, 46% reported that they could predict/forecast the cessation of a rainy season based on rainfall distribution. One respondent explained: “We can tell that the rain is about to stop when we start experiencing reduced rainfall, often localized to some part of our region without extending to the whole region” (farmer number 116). A total of 18% of respondent farmers claimed to have knowledge linked to the quantity of rainfall. For instance, one respondent noted: “We know that the cessation of the rainy season is near when we start experiencing reduced rainfall, which is not equivalent to the number of clouds we observed before. Sometimes, we even observe cloud formations in the sky, but they do not result in rainfall” (farmer number 13). A total of 17% of farmers surveyed asserted that they knew about the rainfall duration. For example, one farmer explained: “We can tell that the rain is about to stop when it starts falling for a short duration and becomes localized. It may rain in one area for a brief period, then move to another part of the region in a similar manner” (farmer number 176). Knowledge related to rainfall frequency was reported by 11% of respondent farmers. For instance, one respondent farmer explained: “When the seasonal rainfall is about to cease, its frequency starts to decrease. For example, it might rain on a Tuesday and then not rain again until Sunday. After Sunday, there might be another week-long gap before it rains again, continuing like this until it stops completely” (farmer number 43).
Figure 3 illustrates the participants’ perspectives on the causes of climate change. The majority (55%) attributed climate change to deforestation, 16% cited industrial effluents, and another 16% pointed to carbon emissions by developed countries. Additionally, 10% associated climate change with the black smoke of vehicles, while 9% linked it to the destruction of the environment. A smaller percentage (2%) attributed climate change to natural causes or ‘God’s Plan,’ and another 2% mentioned the ocean as a factor. Notably, 32% of respondents indicated uncertainty about the cause of climate change.

3.4. Respondent Farmers’ Perceptions of Climate Change

The perceived changes in temperature and drought among farmers are shown in Figure 4. Of the respondent farmers, 54% reported perceiving an increase in temperature, 47% noticed an increase in the frequency of droughts, and 41% observed an increase in the duration of droughts.
Figure 5 presents the farmers’ perceptions of changes in the MAM season rainfall pattern. The majority (53%) of the respondent farmers perceived a delayed onset of the MAM rainy season and an early cessation (58%), leading to a reduction in the length of the rainy season (53%) and a decrease in the amount of seasonal rainfall (49%). Figure 6 shows the perceived changes in the SOND season’s rainfall pattern. Similarly, to the perceived change in the MAM season, as many as 39% of respondents perceived a delayed onset of the SOND rainy season and early cessation (39%), resulting in a reduction in the length of the rainy season (41%) and a decrease in the amount of seasonal rainfall (37%).

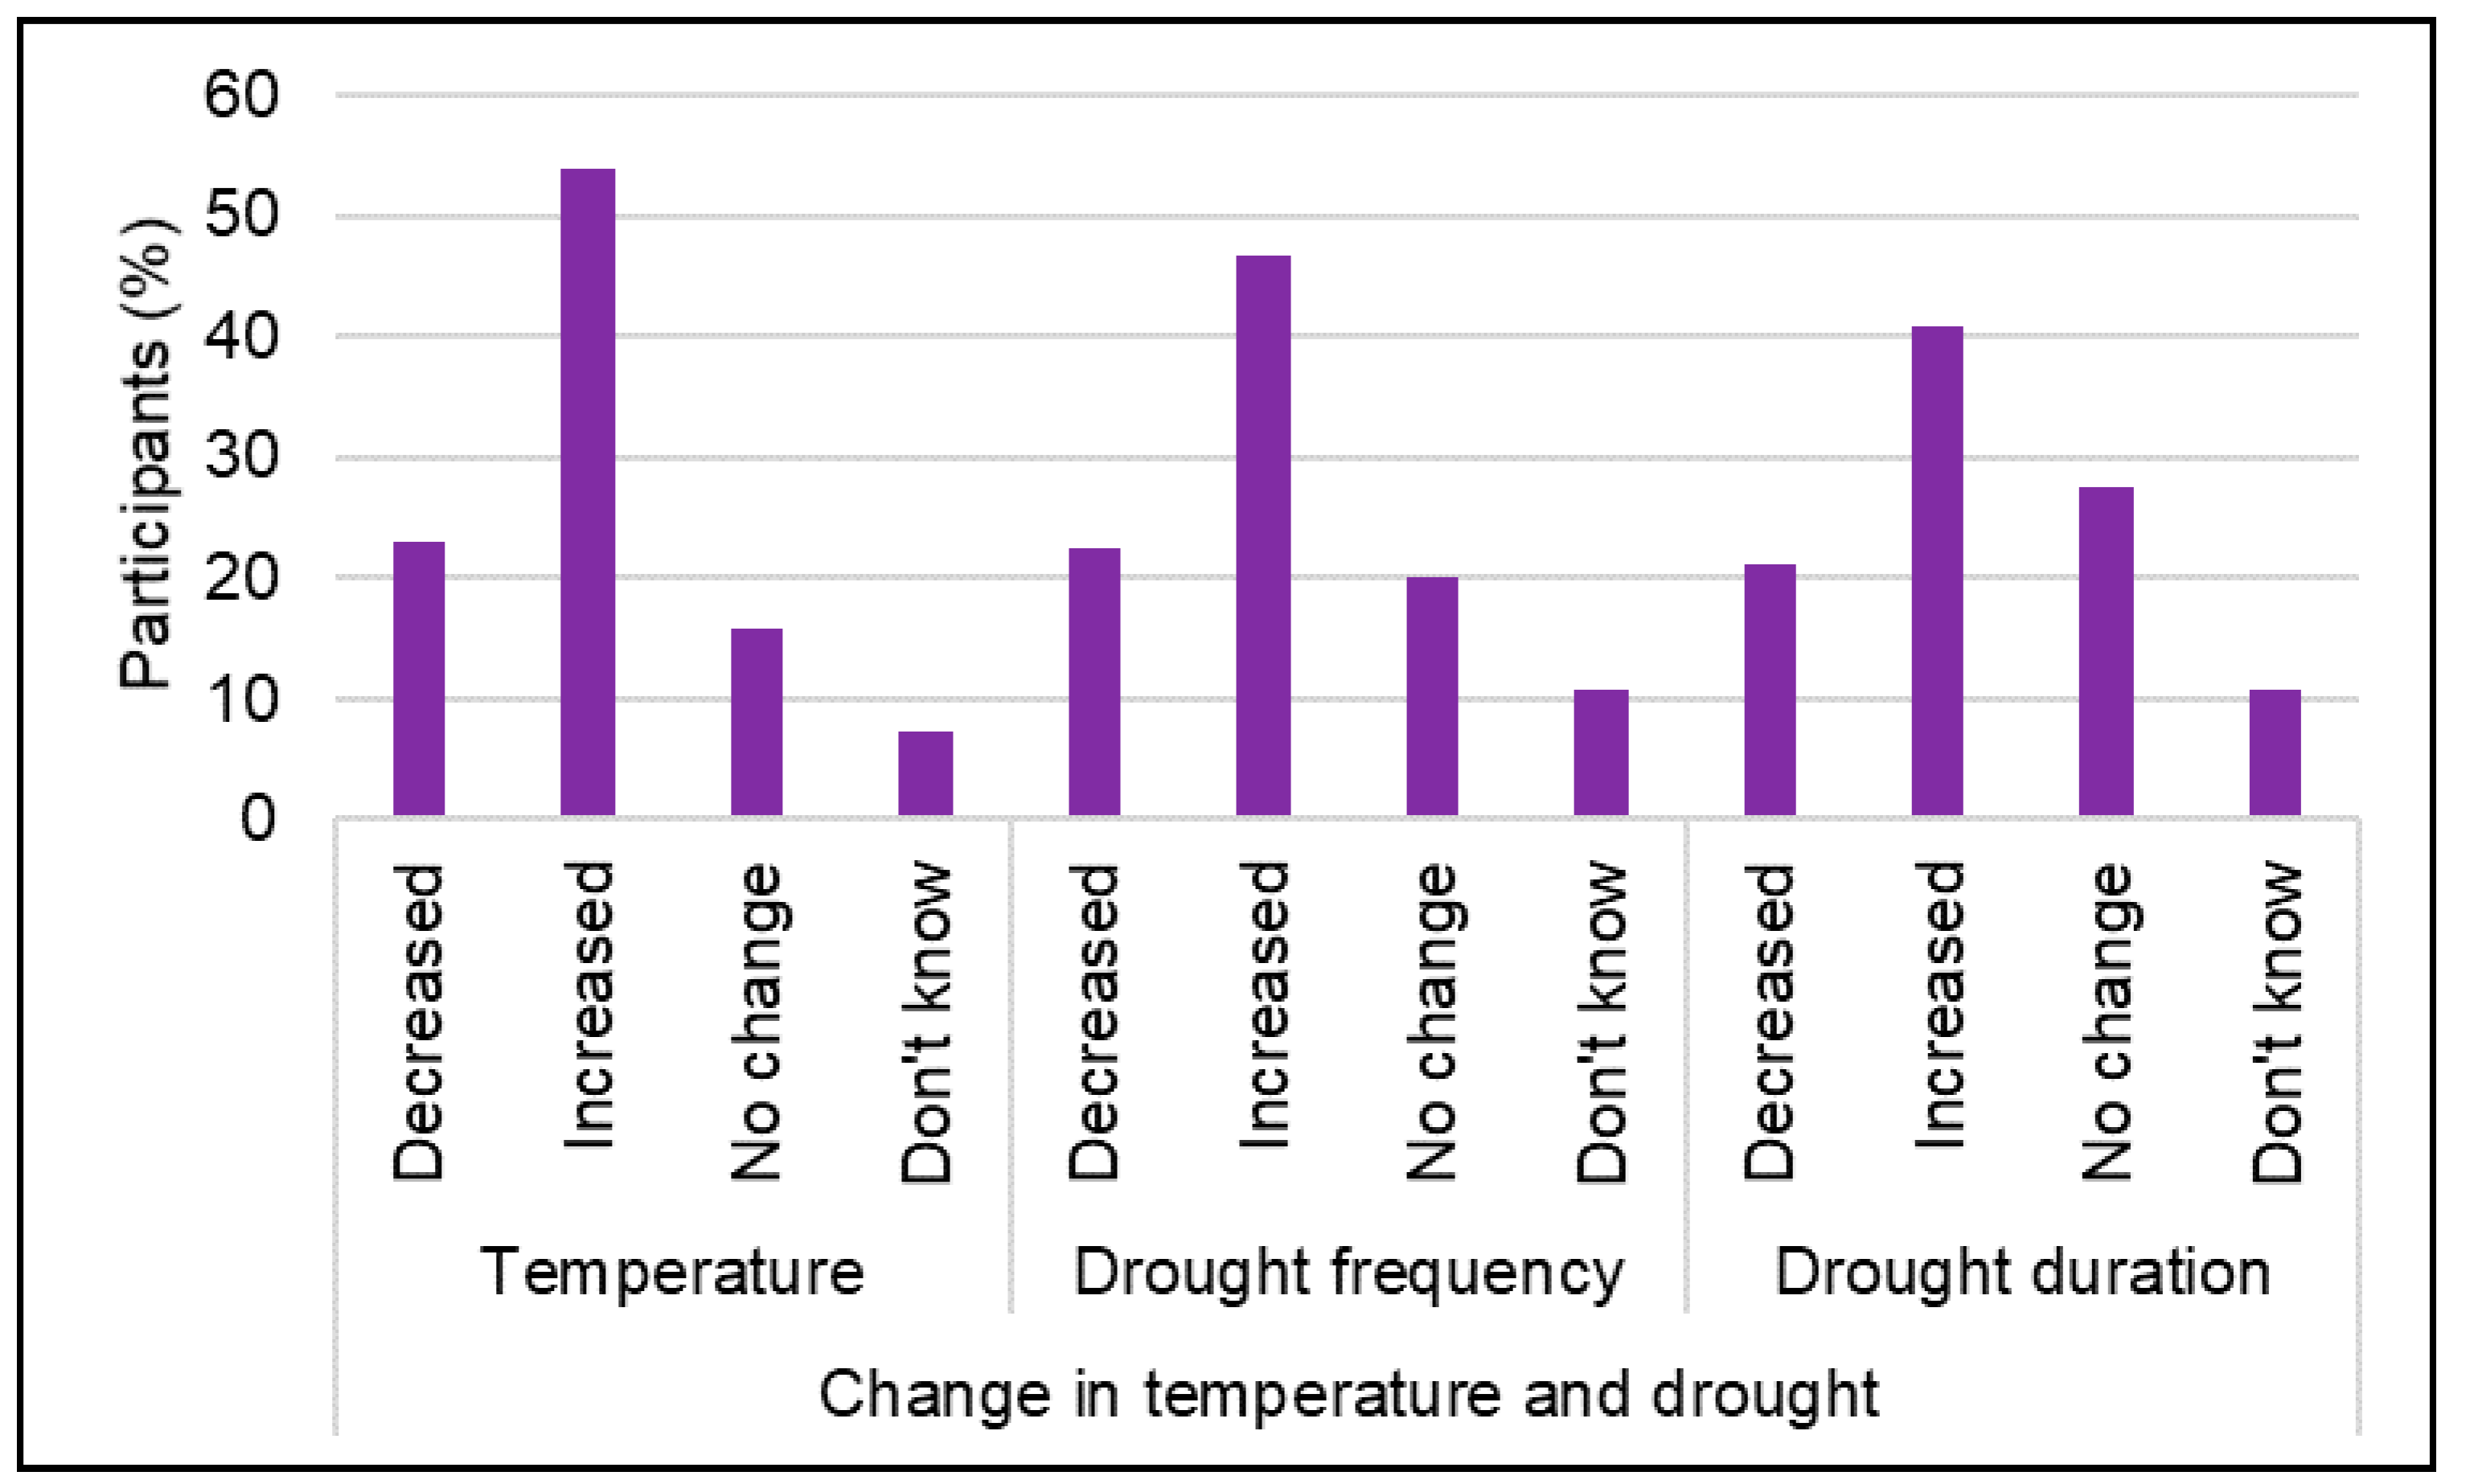
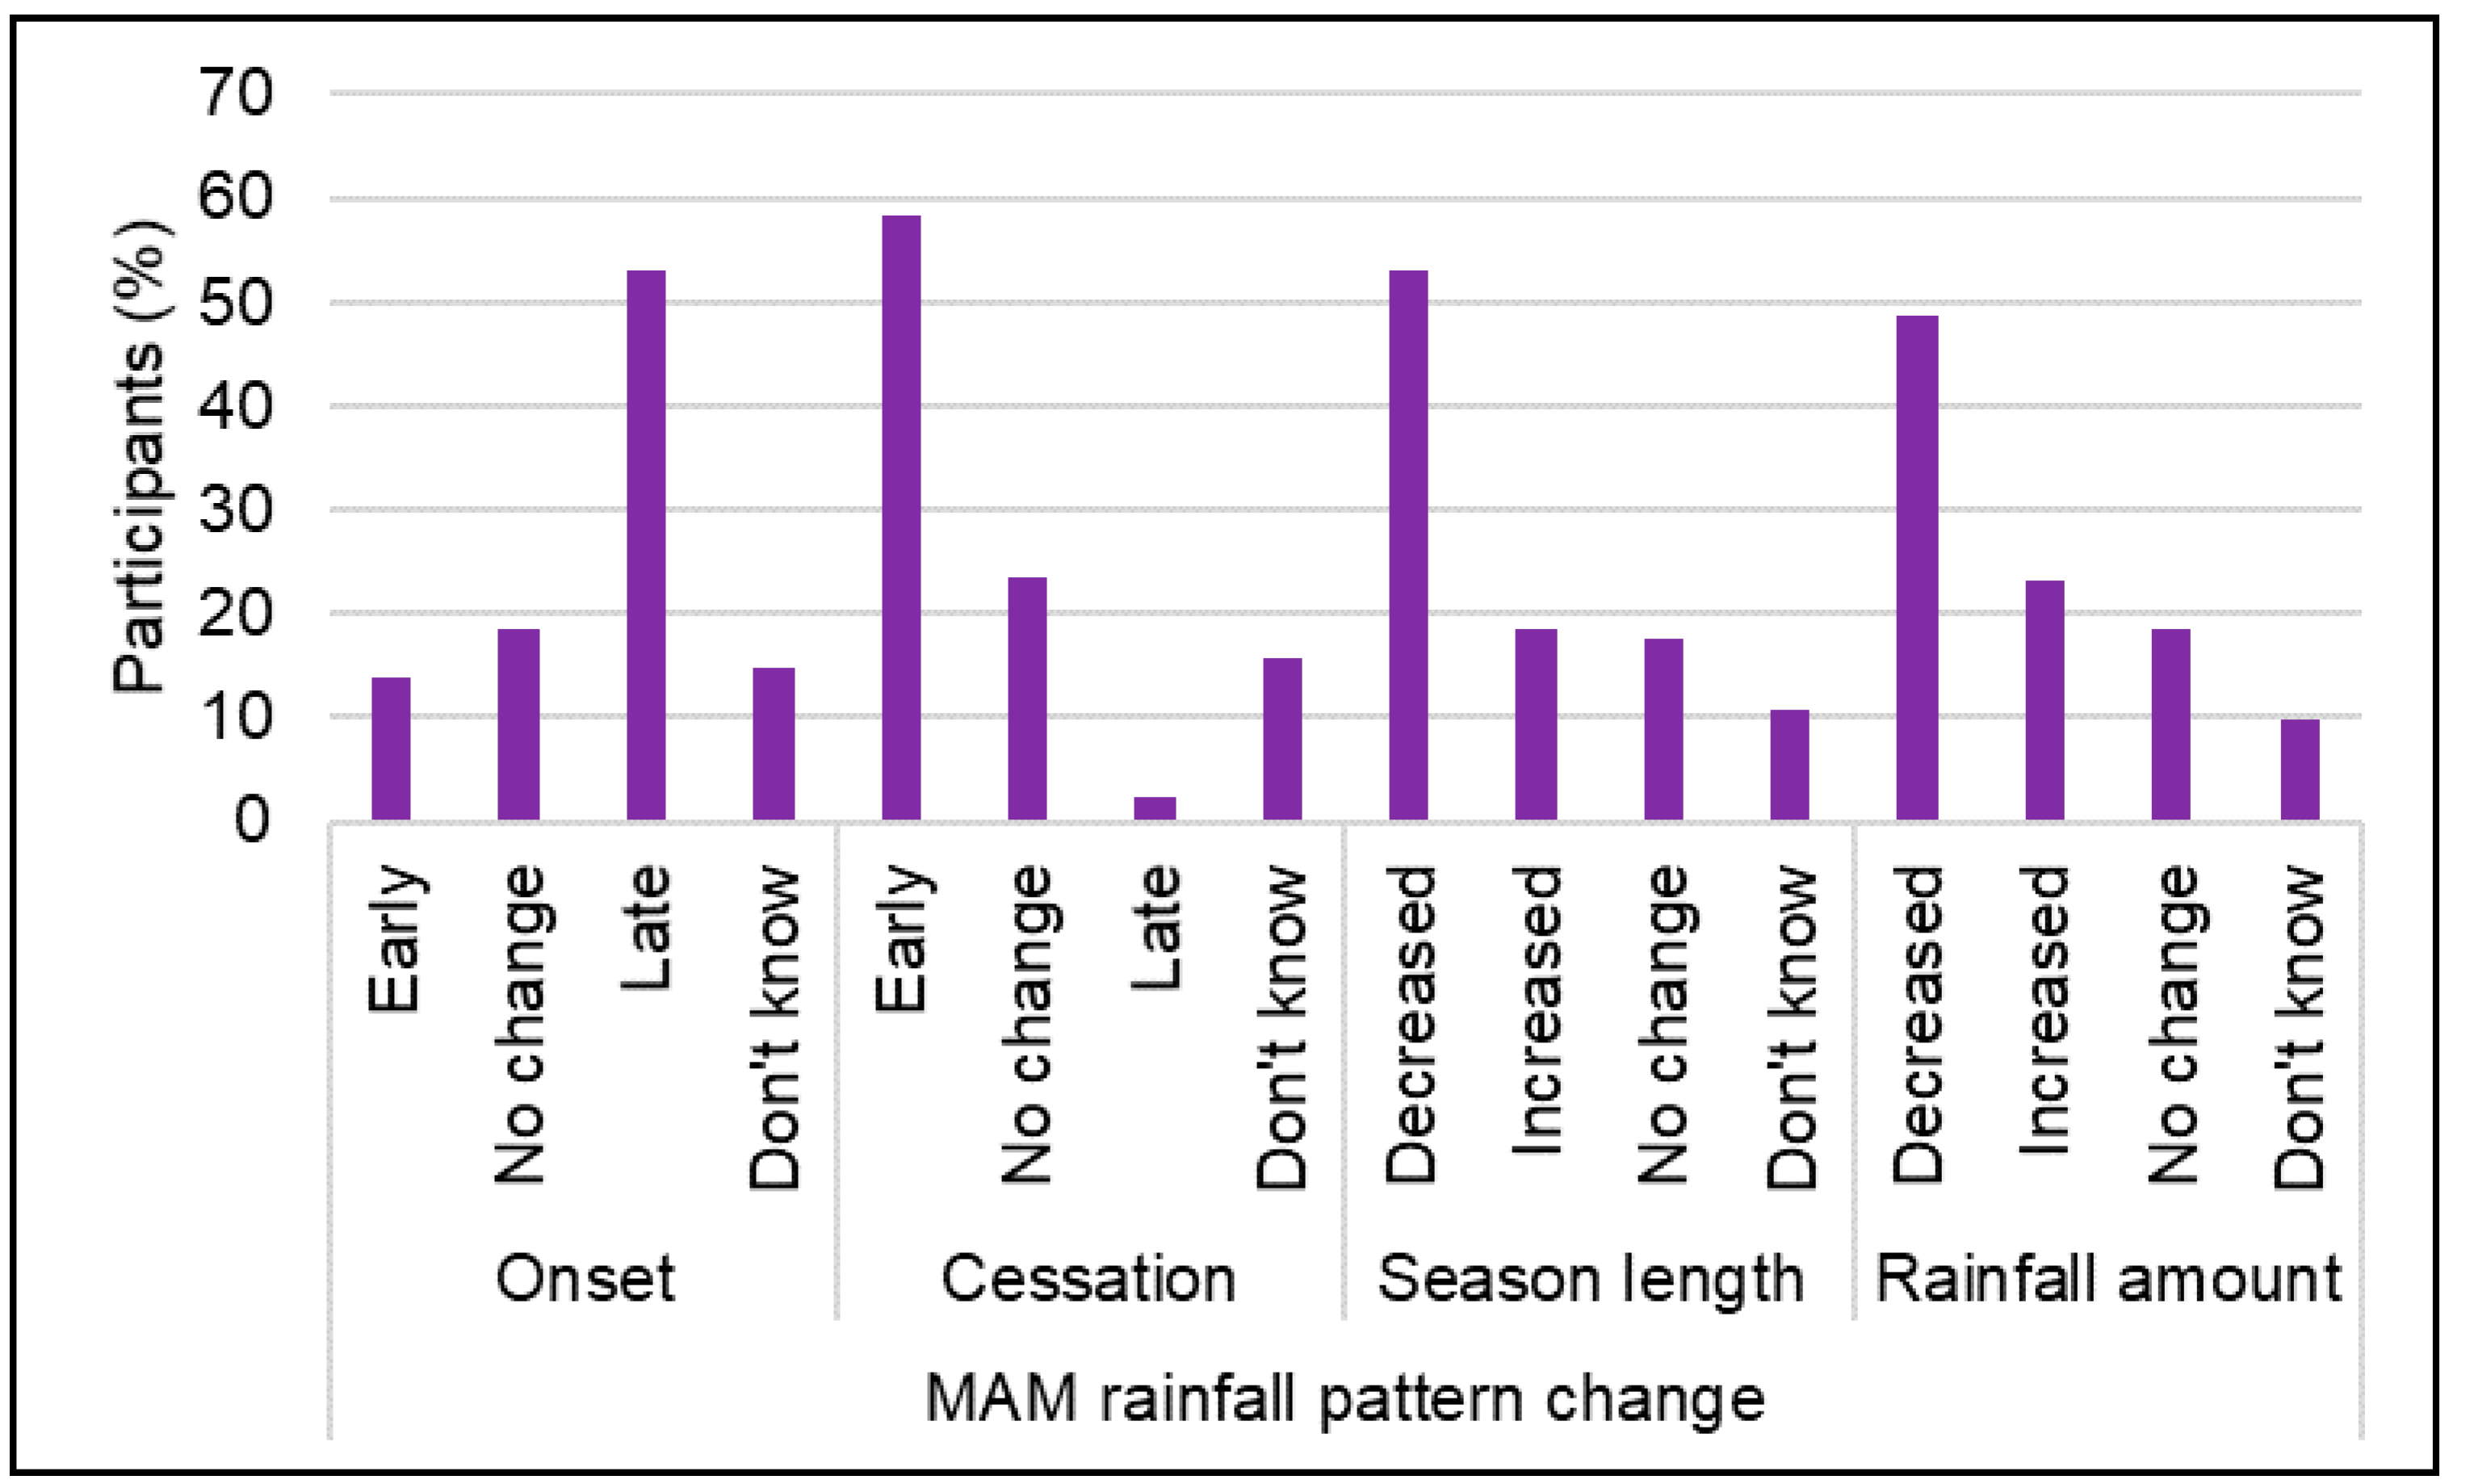
3.5. Respondent Farmers’ Perceptions of the Impacts of Climate Change

Figure 7 illustrates the perceived impacts of climate change among the respondent farmers. The most commonly reported impact was crop failure, experienced by 56% of farmers. Other significant impacts included reduced crop yields (20%), food shortages affecting families (24%) and livestock (7%), income loss (6%), increased poverty (11%), migration (2%), and higher food costs (1%). Additionally, 2% of farmers reported that climate variability disrupted their agricultural calendars.

3.6. Climate Change Adaptation Strategies

Various adaptation strategies that were applied by the respondent farmers in response to the perceived impact of climate change are presented in Table 6. As many as 40% of respondents reported agroforestry/planting trees, changing crop varieties (23%), application of fertilizers (23%), and changing planting dates (26%). The adoption of soil conservation (25%), use of irrigation (21%), focusing on wetlands (10%), mulching (4%), and use of pesticides (7%) were also the measures employed among the farmers.

3.7. Barrier to the Effective Adaptation to Climate Change

Table 7 presents the farmers’ responses when they were asked about barriers hindering their adaptation to climate change. Of the farmer respondents, 28% cited insufficient financial capacity, 18% reported inadequate agricultural skills, and 21% indicated a lack of appropriate material for adaptation. Additionally, 12% mentioned the absence of timely weather information, 20% reported shortages of farm inputs when needed, and 2% noted challenges linked to the location of their farm. Moreover, 7% reported a lack of water sources near their farms, while 3% and 2% cited the high cost of agricultural inputs and materials, respectively.

3.8. Socioeconomic Factors Influencing Farmers’ Choice of Adaptation Strategies

Binary logistic models were used to identify the relationship between socioeconomic factors and the three most essential adaptation strategies that the farmers highlighted to be the most effective: agroforestry/planting trees (PT), changing crop varieties (CCV), and application of fertilizer (AF). The validation diagnostics of the regression logistic models are presented in Table 8. In general, with the Omnibus test of the model coefficients (test of model fit), all the models indicated good fits, confirming their ability to make predictions. It indicated chi-square values ranging between 29.940 and 45.219 and significant p-values (<α = 5%). The results from the Hosmer and Lemeshow test (test of model fit) also confirmed how goodness-of-fit the models were, with the Chi-square values varying between 2.590 and 9.611 and no significant p-values (>α = 5%). Furthermore, Nagelkerke’s R-squared values varying between 0.208 and 0.301 were observed. Overall, the accuracy rate of all the models was reasonable (>66%). All these confirm how models were able to correctly determine how socioeconomic factors influence the farmers’ choice of particular adaptation strategies for dealing with climate change impacts.
The binary logistic regression results are presented in Table 9. The table presents the relationship between socioeconomic factors (predictors) and selected adaptation strategies using odds ratios (OR) with a 95% confidence interval (Table 9). While there were notable positive correlations among various variables examined, only those that showed statistical significance were interpreted. Engaging in farming activities in both hillsides and wetlands indicated a positive relationship with adaptation strategies of changing crop varieties and applying fertilizer. Notably, a significant positive relationship was observed in the adaptation strategy of applying fertilizer with OR of 1.926 and a 95% confidence interval ranging from 1.225 to 3.028, meaning that farmers engaged in both hillside and wetland farming are approximately 1.9 times more likely to apply fertilizer as an adaptation strategy compared to those who do not farm in both areas.
Farming to fulfill home consumption needs and generate an income from the market exhibited a positive correlation with adopting agroforestry/planting trees and changing crop varieties as adaptation strategies. Remarkably, farmers aiming to meet home consumption and generate a market income were significantly more motivated to adopt the agroforestry/planting trees adaptation strategy compared to others, with an observed OR of 1.668 and a 95% confidence interval of 1.099–2.531.
Membership in farmer groups/cooperatives showed a positive correlation with all adaptation strategies, significantly influencing the changing of crop varieties and the application of fertilizer as measures for adaptation. Farmers belonging to a group or cooperative were 2.740 times more likely to change crop varieties as an adaptation strategy than those not affiliated with any farmer group, with a 95% confidence interval ranging from 1.206 to 6.226. Similarly, farmers belonging to a group or cooperative were 3.926 times more likely to apply fertilizer as an adaptation strategy than those not affiliated with any farmer group, with a 95% confidence interval of 1.556–9.906. Access to bank services is significantly associated with lower odds of fertilizer application (OR = 0.286, with a 95% confidence interval of 0.116–0.706), suggesting that farmers with bank access are less likely to use fertilizer as an adaptation strategy compared to those without bank access.

4. Discussion

In this discussion, both male and female farmers in this study have on average over 22 years of farming experience, indicating that both genders have been equally exposed to the adverse effects of climate change in Eastern Rwanda over the past two decades. This shared experience highlights the widespread and long-term impact of climate change on farming communities in the region. Moreover, the predominance of small-scale mixed farming, which combines crop cultivation and livestock rearing on plots averaging less than 1.3 hectares, reflects the structural constraints typical of Rwandan agriculture, as also documented by NISR [26]. Such land fragmentation may limit the adoption of resource-intensive adaptation measures, reinforcing the need for strategies tailored to smallholder realities. Additionally, the low educational attainment observed, with most respondents having only primary education or none, aligns with national statistics [26] but raises critical concerns about the capacity to engage with complex adaptation interventions that require technical knowledge or access to extension services [55]. This educational limitation likely constrains the effectiveness of climate adaptation strategies. Taken together, these socioeconomic characteristics highlight the multifaceted challenges facing farmers and suggest that adaptation policies must consider gender inclusivity, land size constraints, and educational support to enhance resilience effectively.
Turning to the knowledge systems, the reliance of respondent farmers on indigenous knowledge to predict local weather patterns highlights the enduring importance of traditional ecological understanding in agricultural decision-making. Their specific indicators, such as dark clouds, wind direction, and nocturnal lightning, reflect a nuanced, place-based knowledge system shaped by long-term observation and experience. This finding aligns with numerous studies across East Africa that document how farmers continue to use indigenous knowledge as a critical tool for agricultural planning and climate adaptation [56,57]. However, while indigenous knowledge remains valuable, its accuracy in forecasting weather is increasingly challenged by the unpredictability introduced by climate change, which disrupts historical patterns and reduces the reliability of traditional indicators [58]. This uncertainty underscores the need for integrating indigenous knowledge with scientific meteorological data, combining the contextual sensitivity of local observations with the predictive power of modern technology. Such integration has been shown to enhance farmers’ adaptive capacity by providing more reliable and timely climate information, thereby improving resilience to environmental variability [59,60,61,62]. Consequently, this study not only confirms the persistence and value of indigenous knowledge but also emphasizes the importance of developing hybrid knowledge systems tailored to the evolving challenges faced by smallholder farmers.
Building on the previous findings, farmers demonstrated a clear awareness of the drivers of climate change, with deforestation identified as the most frequently cited cause, followed by industrial effluents and carbon emissions from developed countries. In addition, further factors such as vehicle emissions, environmental degradation, natural causes, and oceanic influences were also mentioned, reflecting a multifaceted understanding of climate change origins. This level of awareness suggests that farmers recognize the critical role of environmental conservation, particularly forest protection, in mitigating climate impacts. Such knowledge is significant because it can influence local engagement in sustainable practices and community-led conservation efforts. These findings align with studies from Bangladesh [51] and Nigeria [50], which similarly report that small-scale farmers possess meaningful, if sometimes partial, knowledge about climate change causes. Together, these insights underscore the potential for leveraging existing farmer awareness in designing targeted climate education and mitigation programs that build on local perceptions to enhance effectiveness.
Furthermore, a substantial majority (85%) of respondent farmers acknowledged that the climate has changed, reflecting a widespread awareness of shifting environmental conditions. However, their ability to articulate the underlying causes or mechanisms of these changes varied, suggesting differences in climate literacy or access to information. Many farmers specifically reported increases in temperature, as well as greater frequency and duration of droughts, which are critical stressors for rainfed agriculture. Concurrently, perceptions of declining rainfall amounts and fewer rainy days during key seasons, along with shifts in the timing of rainy season onset and cessation for both the March–May (MAM) and September–December (SOND) seasons, highlight a nuanced understanding of seasonal variability. Importantly, these farmers’ perceptions are strongly supported by multiple climatological studies in Rwanda that document rising temperatures and declining rainfall trends over recent decades [12,13,14,16]. In particular, research focused on the Eastern Province confirms a marked decrease in seasonal rainfall [10], especially during the MAM season in southern areas [15], alongside a pronounced upward trend in temperature [16]. Similar evidence from Butera et al. [63], who studied rice farmers in the same region, further corroborates the observed temperature increases reported by participants. The combined effect of rising temperatures and diminishing rainfall has been linked to the intensification of severe and prolonged drought events in Eastern Rwanda [18,19,64], thereby underscoring the tangible impacts of climate change on local agroecosystems. While the majority of farmers demonstrated awareness and willingness to adopt adaptation measures, a minority who did not perceive any climate change represents a critical group requiring targeted education and outreach to improve their understanding of climate risks and adaptive options.
Given the study’s focus on farmers in the Eastern Province, a region highly vulnerable to climate change impacts such as drought [19], it is unsurprising that participants consistently reported experiencing crop failures, reduced yields, and food shortages. Moreover, these observations, coupled with reports of increased crop diseases, decreased land fertility, and disrupted farming calendars, underscore the multifaceted and tangible challenges climate change poses to agricultural livelihoods in this region. While these impacts align with documented consequences of changing temperatures and rainfall patterns at local and regional scales [45,53,65,66], the convergence of farmer perceptions with scientific findings highlights the value of local knowledge as a reliable indicator of climate stress. However, the farmers’ heavy reliance on seasonal rainfall [67] further amplifies their vulnerability, emphasizing the urgent need for adaptive strategies that can sustain agricultural productivity amid climatic uncertainty [53,68].
Turning to the question of responsibility for adaptation, the finding that only 5% of farmers viewed themselves as solely responsible, 19% assigned responsibility to the government, and the majority (75%) perceived it as a shared obligation reveals a nuanced understanding of the collective nature of climate adaptation. This distribution likely reflects recognition that effective adaptation requires both individual initiative and systemic support, especially given the high costs associated with technologies like irrigation. Such a shared responsibility perspective aligns with the broader literature emphasizing the critical role of policy and institutional support in empowering smallholder farmers to adapt effectively. Furthermore, the reported adoption of agroforestry, changing crop varieties, and fertilizer application as key adaptation strategies demonstrates farmers’ proactive engagement with climate challenges. The prominence of changing crop varieties and fertilizer use is expected, given their direct impact on the productivity of staple crops like maize and beans, which dominate the Eastern Province’s agricultural landscape [52,69,70]. Notably, the recognition of agroforestry as the most sustainable adaptation strategy reflects farmers’ awareness of its long-term benefits for soil conservation, biodiversity, and socioeconomic well-being, reinforcing findings from Murthy et al. [71] and supporting the promotion of ecosystem-based adaptation approaches.
Consistent with findings from other regions where climate change threatens agriculture, smallholder farmers in the study area employed multiple adaptation strategies simultaneously to mitigate climate impacts [45,53,72]. This multifaceted approach reflects the recognition that combining different strategies enhances overall effectiveness and resilience, as supported by the adaptation literature advocating for integrated practices rather than isolated interventions [73]. Nevertheless, farmers face significant barriers that constrain their adaptive capacity. Key challenges identified include limited financial resources, inadequate access to climate and agricultural information, and shortages of appropriate technology and farm inputs. Moreover, the high cost of these inputs and technologies further exacerbates these constraints, limiting farmers’ ability to implement necessary adaptations. These barriers are consistent with those reported at both the Eastern Province level and nationally in Rwanda [63,74], and mirror common obstacles encountered by smallholder farmers across Sub-Saharan Africa [52,72,75,76,77].
Despite these challenges, Rwanda’s government has demonstrated political commitment to enhancing agricultural resilience through targeted programs such as “Nkunganire” and “Hinga Urishingiwe”, which support farmers cultivating key crops including tea, coffee, maize, and beans [55,74,78]. Specifically, the Nkunganire program facilitates access to essential inputs for vulnerable populations while improving supply chain coordination [55], whereas Hinga Urishingiwe provides insurance coverage against climate-induced crop losses caused by extreme weather events [74]. Encouraging farmer participation in these initiatives is crucial to leverage available resources and interventions aimed at sustainably strengthening resilience. This highlights the importance of aligning policy support with on-the-ground adaptation needs to overcome persistent barriers and promote effective climate-smart agriculture.
Regarding the factors influencing farmers’ choice of adaptation strategies, we found that farmers working simultaneously in challenging environments such as hillsides and wetlands tend to adopt more adaptive practices, like changing crop types and increasing fertilizer use. The significant odds ratio for fertilizer application suggests that this strategy is particularly important and more commonly used among these farmers to cope with environmental or climatic challenges. Moreover, having the goal of meeting family needs and generating a market income positively and significantly influenced agroforestry/planting trees as an adaptation strategy. This finding agrees with studies indicating different socioeconomic benefits of agroforestry at farm and household levels [71]. Additionally, farmer group membership was also discovered to positively influence farmers to implement all three adaptation strategies, particularly changing crop variety and applying fertilizers, which showed a significant correlation. This is likely because group meetings provide farmers with opportunities to exchange information and share their experiences, enabling them to advise each other on the most effective adaptation measures implemented on their farms [71,79,80,81].
Broadly, this study analyzes farmers’ indigenous knowledge, perceptions of climate change impacts, adaptation strategies, barriers to adaptation, and socioeconomic factors influencing adaptation in Rwanda’s Eastern Province. Notably, the indigenous knowledge held by farmers, including observations of cloud formations, wind patterns, and rainfall characteristics, constitutes an invaluable resource for climate adaptation. Leveraging this knowledge alongside scientific data could enhance the timeliness and accuracy of weather forecasts and adaptation advice. Therefore, integrating indigenous knowledge into climate services and extension programs presents a promising pathway to strengthen farmers’ resilience to climate variability and change. Future research should focus on validating indigenous knowledge for seasonal prediction and exploring its integration with scientific methods to enhance forecasting accuracy. Additionally, studies are needed to quantify losses from perceived impacts and assess the effectiveness of adaptation strategies. Prioritizing the incorporation of indigenous knowledge into farmers’ decision-making processes, while considering the full range of adaptation strategies in relation to socioeconomic factors, will be critical for future research.
While our study included a substantial number of both male and female farmers, it was not specifically designed or powered to conduct detailed statistical comparisons between gender groups. Consequently, gender-differentiated analyses were beyond the scope of this research. However, we acknowledge that exploring differences in perceptions and adaptation strategies by gender could provide valuable insights. Therefore, we recommend that future studies with larger and more targeted samples investigate gender-specific experiences and responses to climate change in greater depth.
In a similar vein, our analytical approach modeled each adaptation strategy independently using separate binary logistic regressions, which assumes that farmers’ choices are uncorrelated. Nevertheless, adaptation decisions are often interdependent, with farmers adopting multiple complementary or substitutive strategies simultaneously. Ignoring these correlations may lead to biased estimates and limit the understanding of the complexity of farmers’ decision-making processes. Hence, future research should consider joint modeling approaches, such as multivariate probit or count-based models, to better capture the interplay among adaptation strategies and provide more comprehensive insights into farmers’ adaptive behavior.

5. Conclusions

In summary, the present study examined farmers’ indigenous knowledge, perceptions of changes in the climate system, impacts of perceived changes, adaptation strategies employed by farmers, barriers constraining these adaptation strategies, and the socioeconomic determinants of adaptations to climate change in the Eastern Province of Rwanda. Specifically, data collected at the household level from interviews with farmers in five districts of Eastern Rwanda were analyzed, along with meteorological data from 1981 to 2021.
Notably, it was observed that farmers have indigenous knowledge regarding meteorological indicators, which they use for predicting/forecasting important agricultural events such as rainy seasonal onset and cessation. Furthermore, most farmers were aware of climate change and perceived an increase in temperature and a decrease in seasonal rainfall, which corresponded to the observed change in meteorological data. Moreover, farmers identified deforestation as the most significant cause of climate change. In terms of impacts, respondent farmers reported that the most significant consequences were crop failures, reduced yield, and food shortages.
Regarding adaptation, farmers were adopting various adaptation strategies such as agroforestry/planting trees, changing crop varieties and planting dates, application of fertilizers, soil conservation, and use of irrigation. Among these strategies, the most valuable strategies identified by farmers were agroforestry, changing crop varieties, and application of fertilizers, and their adoption was highly influenced by socioeconomic factors, including farm location, farming goal, and farmer group membership. However, findings also showed that the significant barriers that hindered farmers from adapting to climate change included limited financial capacity, lack of information (both climate and agriculture), and lack of technology and farm inputs when needed.
Recommendations drawn from this study include the following:
  • Climate research highlights significant shifts in temperature and rainfall patterns across the Eastern Province. While many farmers accurately recognize these changes in alignment with scientific findings, a considerable portion of them remain unaware or misinformed. This lack of awareness can impede the successful adoption of adaptation strategies, as understanding the nature of climate change and its implications is critical for fostering resilience. To address this challenge, it is essential for stakeholders, including government authorities, farmers, and community organizations, to take concerted action to mitigate the impacts of climate change in Eastern Rwanda. Priority should be given to capacity-building programs that educate farmers on the observed climatic shifts, their consequences, and the importance of adopting effective adaptation, mitigation, and prevention strategies. Enhancing farmers’ knowledge and awareness will contribute to building resilience and promoting sustainable agricultural practices in the region.
  • We recommend that stakeholders establish a participatory framework that actively involves farmers in decision-making processes. This study reveals that farmers not only recognize climate change but also possess a deep understanding of their local climate conditions, which is vital for strengthening their resilience. Their localized knowledge is an invaluable resource that must be integrated into adaptation planning. Excluding farmers from these discussions could lead to the development of strategies that fail to address their most critical needs, thereby undermining the effectiveness and sustainability of adaptation efforts.
  • The study highlights that farmers encounter numerous challenges, particularly those linked to financial constraints. To address this, stakeholders must strengthen their collaboration with farmers to gain a deeper understanding of these difficulties. This approach will enable the development of support programs and solutions that are both cost-effective and aligned with farmers’ financial realities. Efforts to improve the financial capacity of farmers are especially crucial for fostering resilience and sustainable agricultural practices in Eastern Rwanda.
  • Since adaptation methods like agroforestry have been widely embraced by farmers, it is vital for the government and other stakeholders to prioritize selecting tree species that are best suited to the soil and climatic conditions of Eastern Rwanda. Adopting this targeted approach can maximize the benefits of agroforestry, strengthening farmers’ resilience by improving health, nutrition, and financial stability, all of which are influenced by the choice of tree species planted.
Beyond the scope of this study, further research endeavors could focus on validating indigenous knowledge for seasonal prediction and investigating its integration with scientific methodologies to bolster forecasting precision. Additionally, there is a need for studies to quantify the losses incurred due to perceived impacts and evaluate the efficacy of implemented adaptation strategies. Exploring the incorporation of indigenous knowledge into farmers’ decision-making processes within the study area would also yield valuable insights. Given that the examination of the relationship between socioeconomic factors and adaptation strategies did not encompass all available options, future studies may seek to expand upon this investigation by exhaustively documenting the full spectrum of adaptation strategies as reported by farmers.

Author Contributions

Conceptualization, M.R., B.S. and M.B.S.; methodology, M.R., B.S., M.B.S., L.R. and M.L.; software, M.R. and M.L.; validation, M.R., B.S., M.B.S., L.R. and M.L.; formal analysis, M.R., B.S. and M.B.S.; investigation, M.R. and B.S.; resources, L.R.; data curation, M.R., B.S. and M.B.S.; writing—original draft preparation, M.R., B.S., M.B.S., L.R. and M.L.; writing—review and editing, M.R., B.S., M.B.S., L.R. and M.L.; visualization, M.R., B.S., M.B.S., L.R. and M.L.; supervision, B.S., M.B.S., L.R. and M.L.; project administration, B.S. and L.R.; funding acquisition, L.R. and M.B.S. All authors have read and agreed to the published version of the manuscript.

Funding

This work was funded by a grant from the African Institute for Mathematical Sciences, www.nexteinstein.org, with financial support from the Government of Canada provided through Global Affairs Canada, www.international.gc.ca, and the International Development Research Centre, www.idrc.ca: IDRC Grant No: 108246-001. LR and ML were funded by the Research Council of Finland (project numbers 353083, 353095, 321890).

Institutional Review Board Statement

The study was conducted in accordance with the Declaration of Helsinki and approved by the Institutional Review Board of the University of Rwanda (Reference letter no: UR/CST/SoS/720/2023 and 20 September 2023).

Informed Consent Statement

Informed consent was obtained from all subjects involved in the study. We confirm that verbal informed consent was obtained from all participants before each interview. This approach was carefully considered and approved by the relevant Institutional Review Board (IRB) due to the specific local context and characteristics of the study population. Many participants have limited literacy, making written consent forms difficult to understand or complete. Additionally, in certain cultural contexts, signing formal documents may cause discomfort or be inappropriate. Therefore, verbal consent provided a respectful and accessible means to ensure participants fully understood the study’s purpose, procedures, confidentiality, and their rights, including the right to withdraw at any time. Before starting the questionnaire, the interviewer read a standardized verbal consent script aloud, which explained the study objectives, confidentiality assurances, voluntary participation, and contact information for follow-up or withdrawal requests. Participants were then asked if they agreed to proceed on this basis.

Data Availability Statement

Climate datasets were provided by the Rwanda Meteorology Agency (Meteo Rwanda). The data can be accessed through the online portal at https://www.meteorwanda.gov.rw. The field survey data that support the findings of this study are available from the corresponding author upon reasonable request.

Acknowledgments

The authors are grateful to the Rwanda Meteorology Agency (Meteo-Rwanda) for providing climate data used in this study.

Conflicts of Interest

The authors declare no conflicts of interest.

References

  1. Intergovernmental Panel on Climate Change (IPCC). Climate Change 2013—The Physical Science Basis: Working Group I Contribution to the Fifth Assessment Report of the Intergovernmental Panel on Climate Change; Cambridge University Press: Cambridge, UK, 2014. [Google Scholar] [CrossRef]
  2. Mind’je, R.; Li, L.; Amanambu, A.C.; Nahayo, L.; Nsengiyumva, J.B.; Gasirabo, A.; Mindje, M. Flood susceptibility modeling and hazard perception in Rwanda. Int. J. Disaster Risk Reduct. 2019, 38, 101211. [Google Scholar] [CrossRef]
  3. Intergovernmental Panel on Climate Change (IPCC). Climate Change 2021—The Physical Science Basis: Working Group I Contribution to the Sixth Assessment Report of the Intergovernmental Panel on Climate Change, 1st ed.; Cambridge University Press: Cambridge, UK, 2023. [Google Scholar] [CrossRef]
  4. Pecl, G.T.; Araújo, M.B.; Bell, J.D.; Blanchard, J.; Bonebrake, T.C.; Chen, I.-C.; Clark, T.D.; Colwell, R.K.; Danielsen, F.; Evengård, B.; et al. Biodiversity redistribution under climate change: Impacts on ecosystems and human well-being. Science 2017, 355, eaai9214. [Google Scholar] [CrossRef]
  5. Christian, E. Climate Change and Global Warming: Implications for Sub-Saharan Africa. Lwati J. Contemp. Res. 2010, 7, 405–415. [Google Scholar] [CrossRef]
  6. Zougmoré, R.B.; Partey, S.T.; Ouédraogo, M.; Torquebiau, E.; Campbell, B.M. Facing climate variability in sub-Saharan Africa: Analysis of climate-smart agriculture opportunities to manage climate-related risks. Cah. Agric. 2018, 27, 34001. [Google Scholar] [CrossRef]
  7. Nahayo, L.; Nsengiyumva, J.B.; Mupenzi, C.; Mind’je, R.; Nyesheja, E.M. Climate Change Vulnerability in Rwanda, East Africa. Int. J. Geogr. Geol. 2019, 8, 1–9. [Google Scholar] [CrossRef]
  8. Rwanyiziri, G.; Rugema, J. Climate Change Effects on Food Security in Rwanda: Case Study of Wetland Rice Production in Bugesera District. Rwanda J. Agric. Sc. 2013, 1, 35–51. [Google Scholar]
  9. Ntirenganya, F. Analysis of Rainfall Variability in Rwanda for Small-scale Farmers Coping Strategies to Climate Variability. East. Afr. J. Sci. Technol. 2018, 8, 75–96. [Google Scholar]
  10. Sebaziga, N.J.; Ntirenganya, F.; Tuyisenge, A.; Iyakaremye, V. A Statistical Analysis of the Historical Rainfall Data Over Eastern Province in Rwanda. East. Afr. J. Sc. Technol. 2020, 10, 33–52. [Google Scholar]
  11. Jonah, K.; Wen, W.; Shahid, S.; Ali, M.A.; Bilal, M.; Habtemicheal, B.A.; Iyakaremye, V.; Qiu, Z.; Almazroui, M.; Wang, Y.; et al. Spatiotemporal variability of rainfall trends and influencing factors in Rwanda. J. Atmospheric Sol.-Terr. Phys. 2021, 219, 105631. [Google Scholar] [CrossRef]
  12. Safari, B. Trend Analysis of the Mean Annual Temperature in Rwanda during the Last Fifty Two Years. J. Environ. Prot. 2012, 3, 538–551. [Google Scholar] [CrossRef]
  13. Mohammed, H.; Jean, C.K.; Ahmad, W.A. Projections of precipitation, air temperature and potential evapotranspiration in Rwanda under changing climate conditions. Afr. J. Environ. Sci. Technol. 2016, 10, 18–33. [Google Scholar] [CrossRef]
  14. Ngarukiyimana, J.P.; Fu, Y.; Sindikubwabo, C.; Nkurunziza, I.F.; Ogou, F.K.; Vuguziga, F.; Ogwang, B.A.; Yang, Y. Climate Change in Rwanda: The Observed Changes in Daily Maximum and Minimum Surface Air Temperatures during 1961–2014. Front. Earth Sci. 2021, 9, 619512. [Google Scholar] [CrossRef]
  15. Rwema, M.; Sylla, M.B.; Safari, B.; Roininen, L.; Laine, M. Trend analysis and change point detection in precipitation time series over the Eastern Province of Rwanda during 1981–2021. Theor. Appl. Climatol. 2025, 156, 98. [Google Scholar] [CrossRef]
  16. Safari, B.; Sebaziga, J.N. Trends and Variability in Temperature and Related Extreme Indices in Rwanda during the Past Four Decades. Atmosphere 2023, 14, 1449. [Google Scholar] [CrossRef]
  17. Kew, S.F.; Philip, S.Y.; Hauser, M.; Hobbins, M.; Wanders, N.; Van Oldenborgh, G.J.; Van Der Wiel, K.; Veldkamp, T.I.E.; Kimutai, J.; Funk, C.; et al. Impact of precipitation and increasing temperatures on drought trends in eastern Africa. Earth Syst. Dyn. 2021, 12, 17–35. [Google Scholar] [CrossRef]
  18. Muneza, L. Droughts and Floodings Implications in Agriculture Sector in Rwanda: Consequences of Global Warming. In The Nature, Causes, Effects and Mitigation of Climate Change on the Environment; Harris, S.A., Ed.; IntechOpen: London, UK, 2022. [Google Scholar] [CrossRef]
  19. Uwimbabazi, J.; Jing, Y.; Iyakaremye, V.; Ullah, I.; Ayugi, B. Observed Changes in Meteorological Drought Events during 1981–2020 over Rwanda, East Africa. Sustainability 2022, 14, 1519. [Google Scholar] [CrossRef]
  20. Wolfe, J.M.; Kluender, K.R.; Levi, D.M.; Bartoshuk, L.M.; Herz, R.S.; Klatzky, R.L.; Lederman, S.J.; Merfeld, D.M. Sensation & Perception; Sinauer: Sunderland, MA, USA, 2006; Available online: https://scholar.google.com/citations?user=QO9ARccAAAAJ&hl=en&oi=sra (accessed on 23 June 2024).
  21. Adomah Bempah, S.; Olav Øyhus, A. The role of social perception in disaster risk reduction: Beliefs, perception, and attitudes regarding flood disasters in communities along the Volta River, Ghana. Int. J. Disaster Risk Reduct. 2017, 23, 104–108. [Google Scholar] [CrossRef]
  22. Messner, F.; Meyer, V. Flood damage, vulnerability and risk perception—challenges for flood damage research. In Flood Risk Management: Hazards, Vulnerability and Mitigation Measures; Schanze, J., Zeman, E., Marsalek, J., Eds.; Springer: Dordrecht, The Netherlands, 2006; Volume 67, pp. 149–167. [Google Scholar] [CrossRef]
  23. Meteo Rwanda Climatology of Rwanda. Available online: https://www.meteorwanda.gov.rw/ (accessed on 4 June 2023).
  24. Ntwali, D.; Ogwang, B.A.; Ongoma, V. The Impacts of Topography on Spatial and Temporal Rainfall Distribution over Rwanda Based on WRF Model. Atmospheric Clim. Sci. 2016, 6, 145–157. [Google Scholar] [CrossRef]
  25. Nicholson, S.E. The ITCZ and the Seasonal Cycle over Equatorial Africa. Bull. Am. Meteorol. Soc. 2018, 99, 337–348. [Google Scholar] [CrossRef]
  26. NISR. 5th Population and Housing Census, Main Indicators Report; National Institute of Statistics Rwanda: Kigali, Rwanda, 2023. Available online: http://www.statistics.gov.rw (accessed on 1 September 2024).
  27. Slovin, M.B.; Sushka, M.E.; Polonchek, J.A. The Value of Bank Durability: Borrowers as Bank Stakeholders. J. Finance 1993, 48, 247–266. [Google Scholar] [CrossRef]
  28. Meteo Rwanda Dataset Documentation. Available online: http://maproom.meteorwanda.gov.rw/maproom/Summary/index.html#tabs-2 (accessed on 31 July 2024).
  29. Stern, R.D.; Dennett, M.D.; Garbutt, D.J. The start of the rains in West Africa. J. Climatol. 1981, 1, 59–68. [Google Scholar] [CrossRef]
  30. Omotosho, J.B.; Balogun, A.A.; Ogunjobi, K. Predicting monthly and seasonal rainfall, onset and cessation of the rainy season in West Africa using only surface data. Int. J. Climatol. 2000, 20, 865–880. [Google Scholar] [CrossRef]
  31. Tikito, I.; Souissi, N. ODK-X: From A Classic Process To A Smart Data Collection Process. Int. J. Interact. Mob. Technol. IJIM 2021, 15, 28. [Google Scholar] [CrossRef]
  32. Helsel, D.R.; Frans, L.M. Regional Kendall Test for Trend. Environ. Sci. Technol. 2006, 40, 4066–4073. [Google Scholar] [CrossRef] [PubMed]
  33. Mann, H.B. Nonparametric Tests Against Trend. Econometrica 1945, 13, 245. [Google Scholar] [CrossRef]
  34. Kendall, M.G. Rank Correlation Methods, 4th ed.; Charles Griffin Co., Ltd.: London, UK, 1975; Available online: http://refhub.elsevier.com/S1364-6826(21)00091-2/opt98UiitOxCu (accessed on 19 July 2022).
  35. Partal, T.; Kahya, E. Trend analysis in Turkish precipitation data. Hydrol. Process. 2006, 20, 2011–2026. [Google Scholar] [CrossRef]
  36. Chen, T.; Xia, G.; Wilson, L.T.; Chen, W.; Chi, D. Trend and Cycle Analysis of Annual and Seasonal Precipitation in Liaoning, China. Adv. Meteorol. 2016, 2016, 1–15. [Google Scholar] [CrossRef]
  37. Margaritidis, A.K. Site and Regional Trend Analysis of Precipitation in Central Macedonia, Greece. Comput. Water Energy Environ. Eng. 2021, 10, 49–70. [Google Scholar] [CrossRef]
  38. Xu, Z.X.; Takeuchi, K.; Ishidaira, H. Monotonic trend and step changes in Japanese precipitation. J. Hydrol. 2003, 279, 144–150. [Google Scholar] [CrossRef]
  39. Gamerman, D.; Lopes, H.F. Markov Chain Monte Carlo: Stochastic Simulation for Bayesian Inference, 2nd ed.; Texts in statistical science series; Taylor & Francis: Boca Raton, FL, USA, 2006; ISBN 978-1-58488-587-0. [Google Scholar]
  40. Petris, G. An R. Package for Dynamic Linear Models. J. Stat. Softw. 2010, 36, 1–16. [Google Scholar] [CrossRef]
  41. Durbin, T.J.; Koopman, S.J. Time Series Analysis by State Space Methods by Durbin and Koopman|PDF|Normal Distribution|Estimation Theory. Available online: https://www.scribd.com/doc/55179464/Time-Series-Analysis-by-State-Space-Methods-by-Durbin-and-Koopman (accessed on 1 May 2025).
  42. Laine, M.; Latva-Pukkila, N.; Kyrölä, E. Analysing time-varying trends in stratospheric ozone time series using the state space approach. Atmospheric Chem. Phys. 2014, 14, 9707–9725. [Google Scholar] [CrossRef]
  43. Rwema, M.; Safari, B.; Laine, M.; Sylla, M.B.; Roininen, L. Trends and Variability of Temperatures in the Eastern Province of Rwanda. Int. J. Climatol. 2025, 45, e8793. [Google Scholar] [CrossRef]
  44. IBM. SPSS Statistics for Windows. 2021. Available online: https://www.ibm.com/docs/en/spss-statistics/28.0.0 (accessed on 1 April 2023).
  45. Batungwanayo, P.; Habarugira, V.; Vanclooster, M.; Ndimubandi, J.; Koropitan, A.F.; Nkurunziza, J.D.D. Confronting climate change and livelihood: Smallholder farmers’ perceptions and adaptation strategies in northeastern Burundi. Reg. Environ. Change 2023, 23, 47. [Google Scholar] [CrossRef]
  46. Fernihough, A. Simple Logit and Probit Marginal Effects in R; Working Paper Series; UCD Center for economic research; University of Dublin: Dublin, Republic of Ireland, 2024; Available online: https://www.ucd.ie/t4cms/WP11_22.pdf (accessed on 17 March 2024).
  47. Funk, C.; Raghavan Sathyan, A.; Winker, P.; Breuer, L. Changing climate—Changing livelihood: Smallholder’s perceptions and adaption strategies. J. Environ. Manage. 2020, 259, 109702. [Google Scholar] [CrossRef] [PubMed]
  48. Lever, J.; Krzywinski, M.; Altman, N. Logistic regression. Nat. Methods 2016, 13, 541–542. [Google Scholar] [CrossRef]
  49. Acquah, H.D.-G. Farmers Perception and Adaptation to Climate Change: A Willingness to Pay Analysis. 2011. Available online: https://ir.ucc.edu.gh/xmlui/handle/123456789/4312 (accessed on 13 June 2025).
  50. Asekun-Olarinmoye, E.O.; Bamidele, J.O.; Odu, O.O.; Olugbenga-Bello, A.I.; Abodurin, O.L.; Adebimpe, W.O.; Oladele, E.A.; Adeomi, A.A.; Adeoye, O.A.; Ojofeitimi, E.O. Public perception of climate change and its impact on health and environment in rural southwestern Nigeria. Res. Rep. Trop. Med. 2014, 5, 1–10. [Google Scholar] [CrossRef]
  51. Kabir, M.I.; Rahman, M.B.; Smith, W.; Lusha, M.A.F.; Azim, S.; Milton, A.H. Knowledge and perception about climate change and human health: Findings from a baseline survey among vulnerable communities in Bangladesh. BMC Public. Health 2016, 16, 266. [Google Scholar] [CrossRef]
  52. Mubalama, L.K.; Masumbuko, D.M.; Mweze, D.R.; Banswe, G.T.; Mirindi, P.A. Farmers’ Perceptions towards Climate Change, and Meteorological Data in Kahuzi-Biega National Park Surroundings, Eastern DR. Congo. Int. J. Innov. Res. Dev. 2020, 9, 20. [Google Scholar] [CrossRef]
  53. Balasha, A.M.; Munyahali, W.; Kulumbu, J.T.; Okwe, A.N.; Fyama, J.N.M.; Lenge, E.K.; Tambwe, A.N. Understanding farmers’ perception of climate change and adaptation practices in the marshlands of South Kivu, Democratic Republic of Congo. Clim. Risk Manag. 2023, 39, 100469. [Google Scholar] [CrossRef]
  54. Abid, M.; Scheffran, J.; Schneider, U.A.; Ashfaq, M. Farmers’ perceptions of and adaptation strategies to climate change and their determinants: The case of Punjab province, Pakistan. Earth Syst. Dyn. 2015, 6, 225–243. [Google Scholar] [CrossRef]
  55. IRDP. Determinants of Inorganic Fertilizers and Improved Seeds Along with Extension Services Support for Agricultural Productivity in Rwanda. Final Policy Issues and Recommendations; Institute of Research and Dialogue for Peace: Brussels, Belgium, 2020; Available online: https://irdp.rw/wp-content/uploads/IRDP%20Agri%20Final%20Policy%20brief%20Final.pdf (accessed on 11 January 2023).
  56. Kijazi, A.L.; Chang’a, L.B.; Liwenga, E.T.; Nindi, S.J. The use of indigenous knowledge in weather and climate prediction in Mahenge and Ismani wards, Tanzania. J. Geogr. Reg. Plan. 2013, 6, 274–279. [Google Scholar] [CrossRef]
  57. Radeny, M.; Desalegn, A.; Mubiru, D.; Kyazze, F.; Mahoo, H.; Recha, J.; Kimeli, P.; Solomon, D. Indigenous knowledge for seasonal weather and climate forecasting across East Africa. Clim. Change 2019, 156, 509–526. [Google Scholar] [CrossRef]
  58. Nkomwa, E.C.; Joshua, M.K.; Ngongondo, C.; Monjerezi, M.; Chipungu, F. Assessing indigenous knowledge systems and climate change adaptation strategies in agriculture: A case study of Chagaka Village, Chikhwawa, Southern Malawi. Phys. Chem. Earth Parts ABC 2014, 67–69, 164–172. [Google Scholar] [CrossRef]
  59. Ziervogel, G.; Opere, A. Integrating Meteorological and Indigenous Knowledge-Based Seasonal Climate Forecasts for the Agricultural Sector: Lessons From Participatory Action Research in Sub-Saharan Africa. Available online: https://idl-bnc-idrc.dspacedirect.org/items/a4b47199-a1ba-4047-a1e4-32ef2bc48c00 (accessed on 20 July 2024).
  60. Kalanda-Joshua, M.; Ngongondo, C.; Chipeta, L.; Mpembeka, F. Integrating indigenous knowledge with conventional science: Enhancing localised climate and weather forecasts in Nessa, Mulanje, Malawi. Phys. Chem. Earth Parts ABC 2011, 36, 996–1003. [Google Scholar] [CrossRef]
  61. Kolawole, O.D.; Wolski, P.; Ngwenya, B.; Mmopelwa, G. Ethno-meteorology and scientific weather forecasting: Small farmers and scientists’ perspectives on climate variability in the Okavango Delta, Botswana. Clim. Risk Manag. 2014, 4–5, 43–58. [Google Scholar] [CrossRef]
  62. Nkuba, M.R.; Chanda, R.; Mmopelwa, G.; Kato, E.; Mangheni, M.N.; Lesolle, D. Influence of Indigenous Knowledge and Scientific Climate Forecasts on Arable Farmers’ Climate Adaptation Methods in the Rwenzori region, Western Uganda. Environ. Manage. 2020, 65, 500–516. [Google Scholar] [CrossRef] [PubMed]
  63. Butera, T.; Kim, T.K.; Choi, S.H. Determinant Factors of Rice Farmers’ Selection of Adaptation Methods to Climate Change in Eastern Rwanda. Korean J. Org. Agric. 2022, 30, 241–253. [Google Scholar]
  64. Sarkodie, S.; Rufangura, P.; Jayaweera, H.M.P.; Owusu, P.A. Situational Analysis of Flood and Drought in Rwanda. Int. J. Sci. Eng. Res. 2016, 6, 960–970. [Google Scholar] [CrossRef]
  65. Brevik, E. The Potential Impact of Climate Change on Soil Properties and Processes and Corresponding Influence on Food Security. Agriculture 2013, 3, 398–417. [Google Scholar] [CrossRef]
  66. Bele, M.Y.; Sonwa, D.J.; Tiani, A.M. Local Communities Vulnerability to Climate Change and Adaptation Strategies in Bukavu in DR Congo. J. Environ. Dev. 2014, 23, 331–357. [Google Scholar] [CrossRef]
  67. Harvey, C.A.; Rakotobe, Z.L.; Rao, N.S.; Dave, R.; Razafimahatratra, H.; Rabarijohn, R.H.; Rajaofara, H.; MacKinnon, J.L. Extreme vulnerability of smallholder farmers to agricultural risks and climate change in Madagascar. Philos. Trans. R. Soc. B Biol. Sci. 2014, 369, 20130089. [Google Scholar] [CrossRef] [PubMed]
  68. Menike, L.M.C.S.; Arachchi, K.A.G.P.K. Adaptation to Climate Change by Smallholder Farmers in Rural Communities: Evidence from Sri Lanka. Procedia Food Sci. 2016, 6, 288–292. [Google Scholar] [CrossRef]
  69. Abera, T.; Debele, T.; Wegary, D. Effects of Varieties and Nitrogen Fertilizer on Yield and Yield Components of Maize on Farmers Field in Mid Altitude Areas of Western Ethiopia. Int. J. Agron. 2017, 2017, 1–13. [Google Scholar] [CrossRef]
  70. Azeem, K. The Impact of Different P Fertilizer Sources on Growth, Yield and Yield Component of Maize Varieties. Agric. Res. Technol. Open Access J. 2018, 13, 555881. [Google Scholar] [CrossRef]
  71. Murthy, I.K.; Dutta, S.; Varghese, V.; Kumar, P. Impact of Agroforestry Systems on Ecological and Socio-Economic Systems: A Review. Glob. J. Sci. Front. Res. 2016, 16, 15–28. [Google Scholar]
  72. Olana Jawo, T.; Teutscherová, N.; Negash, M.; Sahle, K.; Lojka, B. Smallholder coffee-based farmers’ perception and their adaptation strategies of climate change and variability in South-Eastern Ethiopia. Int. J. Sustain. Dev. World Ecol. 2023, 30, 533–547. [Google Scholar] [CrossRef]
  73. Rajan, P.; Manjet, P.; Solanke, K. Organic Mulching—A Water Saving Technique to Increase the Production of Fruits and Vegetables—Current Agriculture Research Journal. Available online: http://www.agriculturejournal.org/volume5number3/organic-mulching-a-water-saving-technique-to-increase-the-production-of-fruits-and-vegetables/ (accessed on 1 May 2025).
  74. World Bank. Climate-Smart Agriculture in Rwanda. CSA Country Profiles for Africa, Asia, and Latin America and the Caribbean Series; World Bank: Washington, DC, USA, 2015; Available online: https://climateknowledgeportal.worldbank.org/sites/default/files/2019-06/CSA%20RWANDA%20NOV%2018%202015.pdf (accessed on 10 May 2023).
  75. Bryan, E.; Deressa, T.T.; Gbetibouo, G.A.; Ringler, C. Adaptation to climate change in Ethiopia and South Africa: Options and constraints. Environ. Sci. Policy 2009, 12, 413–426. [Google Scholar] [CrossRef]
  76. Juana, J.; Kahaka, Z.; Okurut, F. Farmers’ Perceptions and Adaptations to Climate Change in Sub-Sahara Africa: A Synthesis of Empirical Studies and Implications for Public Policy in African Agriculture. J. Agric. Sci. 2013, 5, p121. [Google Scholar] [CrossRef]
  77. Sani, S. Farmers’ Perception, Impact and Adaptation Strategies to Climate Change among Smallholder Farmers in Sub-Saharan Africa: A Systematic Review. J. Resour. Dev. Manag. 2016, 26, 1. [Google Scholar]
  78. MoE. Strategic Programme for Climate Resilience (SPCR) Rwanda; Republic of Rwanda Ministry of Environment: Kigali, Rwanda, 2017; Available online: https://greenfund.rw/sites/default/files/2021-06/SPCR.pdf (accessed on 23 June 2024).
  79. Verhofstadt, E.; Maertens, M. Smallholder cooperatives and agricultural performance in Rwanda: Do organizational differences matter? Agric. Econ. 2014, 45, 39–52. [Google Scholar] [CrossRef]
  80. Manda, J.; Khonje, M.G.; Alene, A.D.; Tufa, A.H.; Abdoulaye, T.; Mutenje, M.; Setimela, P.; Manyong, V. Does cooperative membership increase and accelerate agricultural technology adoption? Empirical evidence from Zambia. Technol. Forecast. Soc. Change 2020, 158, 120160. [Google Scholar] [CrossRef]
  81. Habiyaremye, N.; Mtimet, N.; Ouma, E.A.; Obare, G.A. Cooperative membership effects on farmers’ choice of milk marketing channels in Rwanda. Food Policy 2023, 118, 102499. [Google Scholar] [CrossRef]
Figure 1. Eastern Province map with the surveyed participants’ location highlighted with purple dots.
Sustainability 17 06721 g001
Figure 2. Conceptual framework illustrating the process of farmers’ climate change adaptation. The framework shows how socioeconomic characteristics and knowledge of weather and climate change influence farmers’ perceptions and observed impacts, which in turn shape adaptation strategies. Barriers to adaptation are also depicted as factors that constrain or modify the effectiveness of these strategies.
Sustainability 17 06721 g002
Figure 3. Farmers’ knowledge about causes or reasons for climate change (n = 204).
Sustainability 17 06721 g003
Figure 4. Respondent farmers’ perception of change in temperature and drought pattern (n = 204).
Sustainability 17 06721 g004
Figure 5. Respondent farmers’ perceptions of change in the MAM season rainfall pattern.
Sustainability 17 06721 g005
Figure 6. Respondent farmers’ perceptions of change in the SOND season rainfall pattern.
Sustainability 17 06721 g006
Figure 7. Percentage (%) of respondent farmers who perceived the impacts of climate change (n = 204).
Sustainability 17 06721 g007
Table 1. Farmers’ distribution in districts, sectors, and cells.
ZoneDistrictSectorCell
NorthNyagatare (33)Nyagatare (1)Nyagatare (1)
Gatunda (9)Nyamirembe (9)
Mukama (6)Gihengeri (1), Rugarama (5)
Mimuri (4)Mimuri (2), Rugari (2)
Katabagemu (13)Barija (3), Nyakigando (9), Ryaruganzu (1)
Gatsibo (35)Ngarama (10)Nyarubungo (9), Cyigashi (1)
Nyagihanga (14)Gitinda (14)
Kabarore (11)Nyabikiri (10), Nyabikenke (1)
CentralKayonza (36)Ndego (10)Byimana (7), Kiyovu (3)
Kabare (12)Rubumba (10), Cyarubare (1), Karubimba (1)
Kabarondo (14)Cyabajwa (14)
SouthNgoma (74)Mutenderi (24)Karwema (19), Kibare (5)
Kazo (29)Kinyonzo (29)
Murama (21)Sakara (19), Rurenge (1), Mvumba (1)
Kirehe (26)Nyamugali (10)Nyamugali (7), Kiyanzi (3)
Kigina (11)Gatarama (11)
Musaza (5)Mubuga (4), Nganda (1)
Table 2. Displays changes (in °C/decade) with a 95% confidence interval in brackets [] for the averaged seasonal and annual means of Tx, Tn, and T in the Eastern Province of Rwanda from 1983 to 2021.
1983–2021
SeasonTxTnT
JF0.22 [−0.26–0.70]0.44 [0.17–0.73]0.38 [0.07–0.67]
MAM0.04 [−0.41–0.51]0.61 [0.27–0.94]0.433 [0.06–0.75]
JJA0.22 [−0.07–0.51]0.86 [0.45–1.23]0.61 [0.24–0.94]
SOND−0.09 [−0.56–0.36]0.70 [0.28–1.14]0.30 [−0.05–0.63]
Annual0.08 [−0.34–0.44]0.76 [0.42–1.14]0.48 [0.16–0.82]
Table 3. Slope value of identified trends for rainfall events at the Eastern regional scale. The * in the results indicates that significant regional trends are observed at a 95% confidence level.
1981–2021
SeasonRainfall Amount mm/Day/YearOnset
Days/Year
Cessation
Days/Year
Season Duration
Days/Year
MAM−0.01−0.210.000.21
SOND0.00−0.21 *0.000.23 *
Table 4. Socioeconomic characteristics of respondents (n = 204).
VariablesCategoryFrequencyPercentage (%)Mean
GenderFemale8843
Male11657
Age20–34482443.66
35–499848
50–644824
65–80105
Farming Experience (years)1–20964722.18
21–409748
41–60105
Time on farm per day (unit is s)≤14,400211020,880
18,000–28,80016782
≥32,400168
EducationNone3417
Primary12461
Secondary_level_1_(Senior_3)2211
Secondary_level_2_(Senior_6)178
Technical_vocation63
University10.5
Farm size (unit is m2)0–10,0001447113,000
11,000–20,0004020
>20,0002010
Farm locationHillside9748
Wetland3015
Both 7738
Farm ownership statusOwner10853
Tenant3417
Both 6230
Farming goalsHome consumption6230
Income42.0
Both (Income and home consumption)13868
Main cropsMaize18490
Beans18189
Cassava6331
Livestock ownershipYes13164
No7336
Group membershipYes7637
No12863
Exchanging infoYes16179
No4321
Access to weather infoYes9949
No10551
Access to bank servicesYes11958
No8542
Household size1–5136675
6–106532
11–1531.5
Table 5. Climate indicators associated with farmers’ knowledge about rainy season onset and cessation (n = 204).
Onset Skills Cessation Skills
FrequencyPercentage FrequencyPercentage
Cloud7235Rainfall distribution9346
Wind3819Rainfall amount3618
Temperature2713Rainfall duration3517
Lightning126Rainfall frequency2211
Do not know3216Cloud168
Temperature136
Wind42
Do not know2512
Table 6. Climate change adaptation strategies adopted by respondent farmers (n = 204).
Adaptation StrategiesFrequencyPercentage
Agroforestry/Planting trees (PT)8140
Changing crop varieties (CCV)4723
Application of fertilizer (organic and inorganic) (AF)4723
Changing planting dates (CPD)5426
Soil conservation (SC)5025
Focus on wetland (FWL)2110
Use irrigation (UI)4321
Mulching (M)94
Use of pesticides (UP)157
Planting grass (PG)115
Table 7. Barriers to the effective adaptation of climate change by respondent farmers (n = 204).
BarriersFrequencyPercentage
Lack of finance5828
Inadequate info3919
Lack of material4321
Lack of weather info2412
Shortage of farm inputs4020
Lack of water147
High cost of input73
Land location42
High cost of material42
Table 8. Analysis of the models’ significance and goodness of fit.
Omnibus Tests of Model Coefficients
ModelsChi-squareDegree of freedom(df)p-value
Agroforestry/Planting trees (PT)34.026150.003
Changing crop varieties (CCV)29.94150.012
Application of fertilizer
(Organic and inorganic) (AF)
45.219150.000
Hosmer and Lemeshow Test
Chi-squareDegree of freedom(df)p-value
Agroforestry/Planting trees (PT)5.31680.723
Changing crop varieties (CCV)2.5980.957
Application of fertilizer
(organic and inorganic) (AF)
9.61180.293
Model Summary
−2 Log likelihoodCox and Snell R SquareNagelkerke R SquareModel correctness (%)
Agroforestry/Planting trees (PT)240.0680.1540.20866.7
Changing crop varieties (CCV)190.2780.1370.20777.5
Application of fertilizer
(Organic and inorganic) (AF)
174.9990.1990.30182.4
Table 9. Logistic regression results: odds ratio (OR) and 95% confidence interval showing socioeconomic factors influencing farmers’ choice of selected adaptation strategies.
VariablesPTCCVAF
Gender0.700 [0.345–1.418]0.477 [0.205–1.109]0.408 [0.167–1.000]
Age0.965 [0.915–1.017]0.963 [0.904–1.026]1.009 [0.951–1.070]
Education level1.037 [0.717–1.502]0.963 [0.629–1.474]1.013 [0.635–1.616]
Farmer experience(years)1.019 [0.969–1.072]1.036 [0.977–1.099]1.002 [0.946–1.061]
Time spent/day (Hours)1.007 [0.810–1.252]0.843 [0.647–1.099]0.751 [0.553–1.020]
Farm size (ha)0.885 [0.690–1.134]1.013 [0.780–1.314]0.773 [0.498–1.201]
Farm location0.739 [0.513–1.064]1.052 [0.697–1.587]1.926 * [1.225–3.028]
Land-holding status1.158 [0.803–1.670]1.324 [0.867–2.022]1.008 [0.638–1.591]
Farming goal1.668 * [1.099–2.531]1.245 [0.745–2.083]0.770 [0.460–1.288]
Livestock ownership1.979 [0.965–4.060]1.250 [0.530–2.948]1.674 [0.679–4.128]
Farmer group membership1.587 [0.776–3.245]2.740 * [1.206–6.226]3.926 * [1.556–9.906]
Exchanging info2.024 [0.770–5.320]3.167 [0.810–12.375]1.118 [0.321–3.895]
Access to weather info (Radio)1.234 [0.639–2.384]1.272 [0.592–2.732]2.271 [0.978–5.276]
Access to bank services0.703 [0.344–1.437]0.494 [0.216–1.127]0.286 * [0.116–0.706]
Household size (Individuals)1.043 [0.893–1.218]1.009 [0.846–1.205]0.994 [0.818–1.208]
Constant0.2610.2030.403
* shows significant levels at 0.05.
Disclaimer/Publisher’s Note: The statements, opinions and data contained in all publications are solely those of the individual author(s) and contributor(s) and not of MDPI and/or the editor(s). MDPI and/or the editor(s) disclaim responsibility for any injury to people or property resulting from any ideas, methods, instructions or products referred to in the content.

