
Eco-Sensitive Minds: Clustering Readiness to Change and Environmental Sensitivity for Sustainable Engagement


Abstract
1. Introduction
1.1. Research Background
1.1.1. Climate Change and Human Health: A Self-Perpetuating Cycle of Risk
1.1.2. The Dual Role of Eco-Anxiety: Psychological Distress and Pro-Environmental Engagement
1.1.3. The Central Role of Pro-Environmental Behaviors
1.1.4. Readiness to Change: A Conceptual Overview Within Environmental Applications
- (a)
- (b)
- (c)
- (d)
- Effectiveness of the proposed solution: conceptualized as response efficacy, refers to the belief that one’s actions can meaningfully reduce environmental harm and it is an essential predictor of adaptive behavior [65].
- (e)
- (f)
- (g)
1.2. Literature Review and Research Gap: Readiness to Change and Sensitivity
1.3. Aims of the Study: An Innovative Perspective
2. Materials and Methods
2.1. Data Collection
2.2. Instruments
2.3. Data Analysis
3. Results
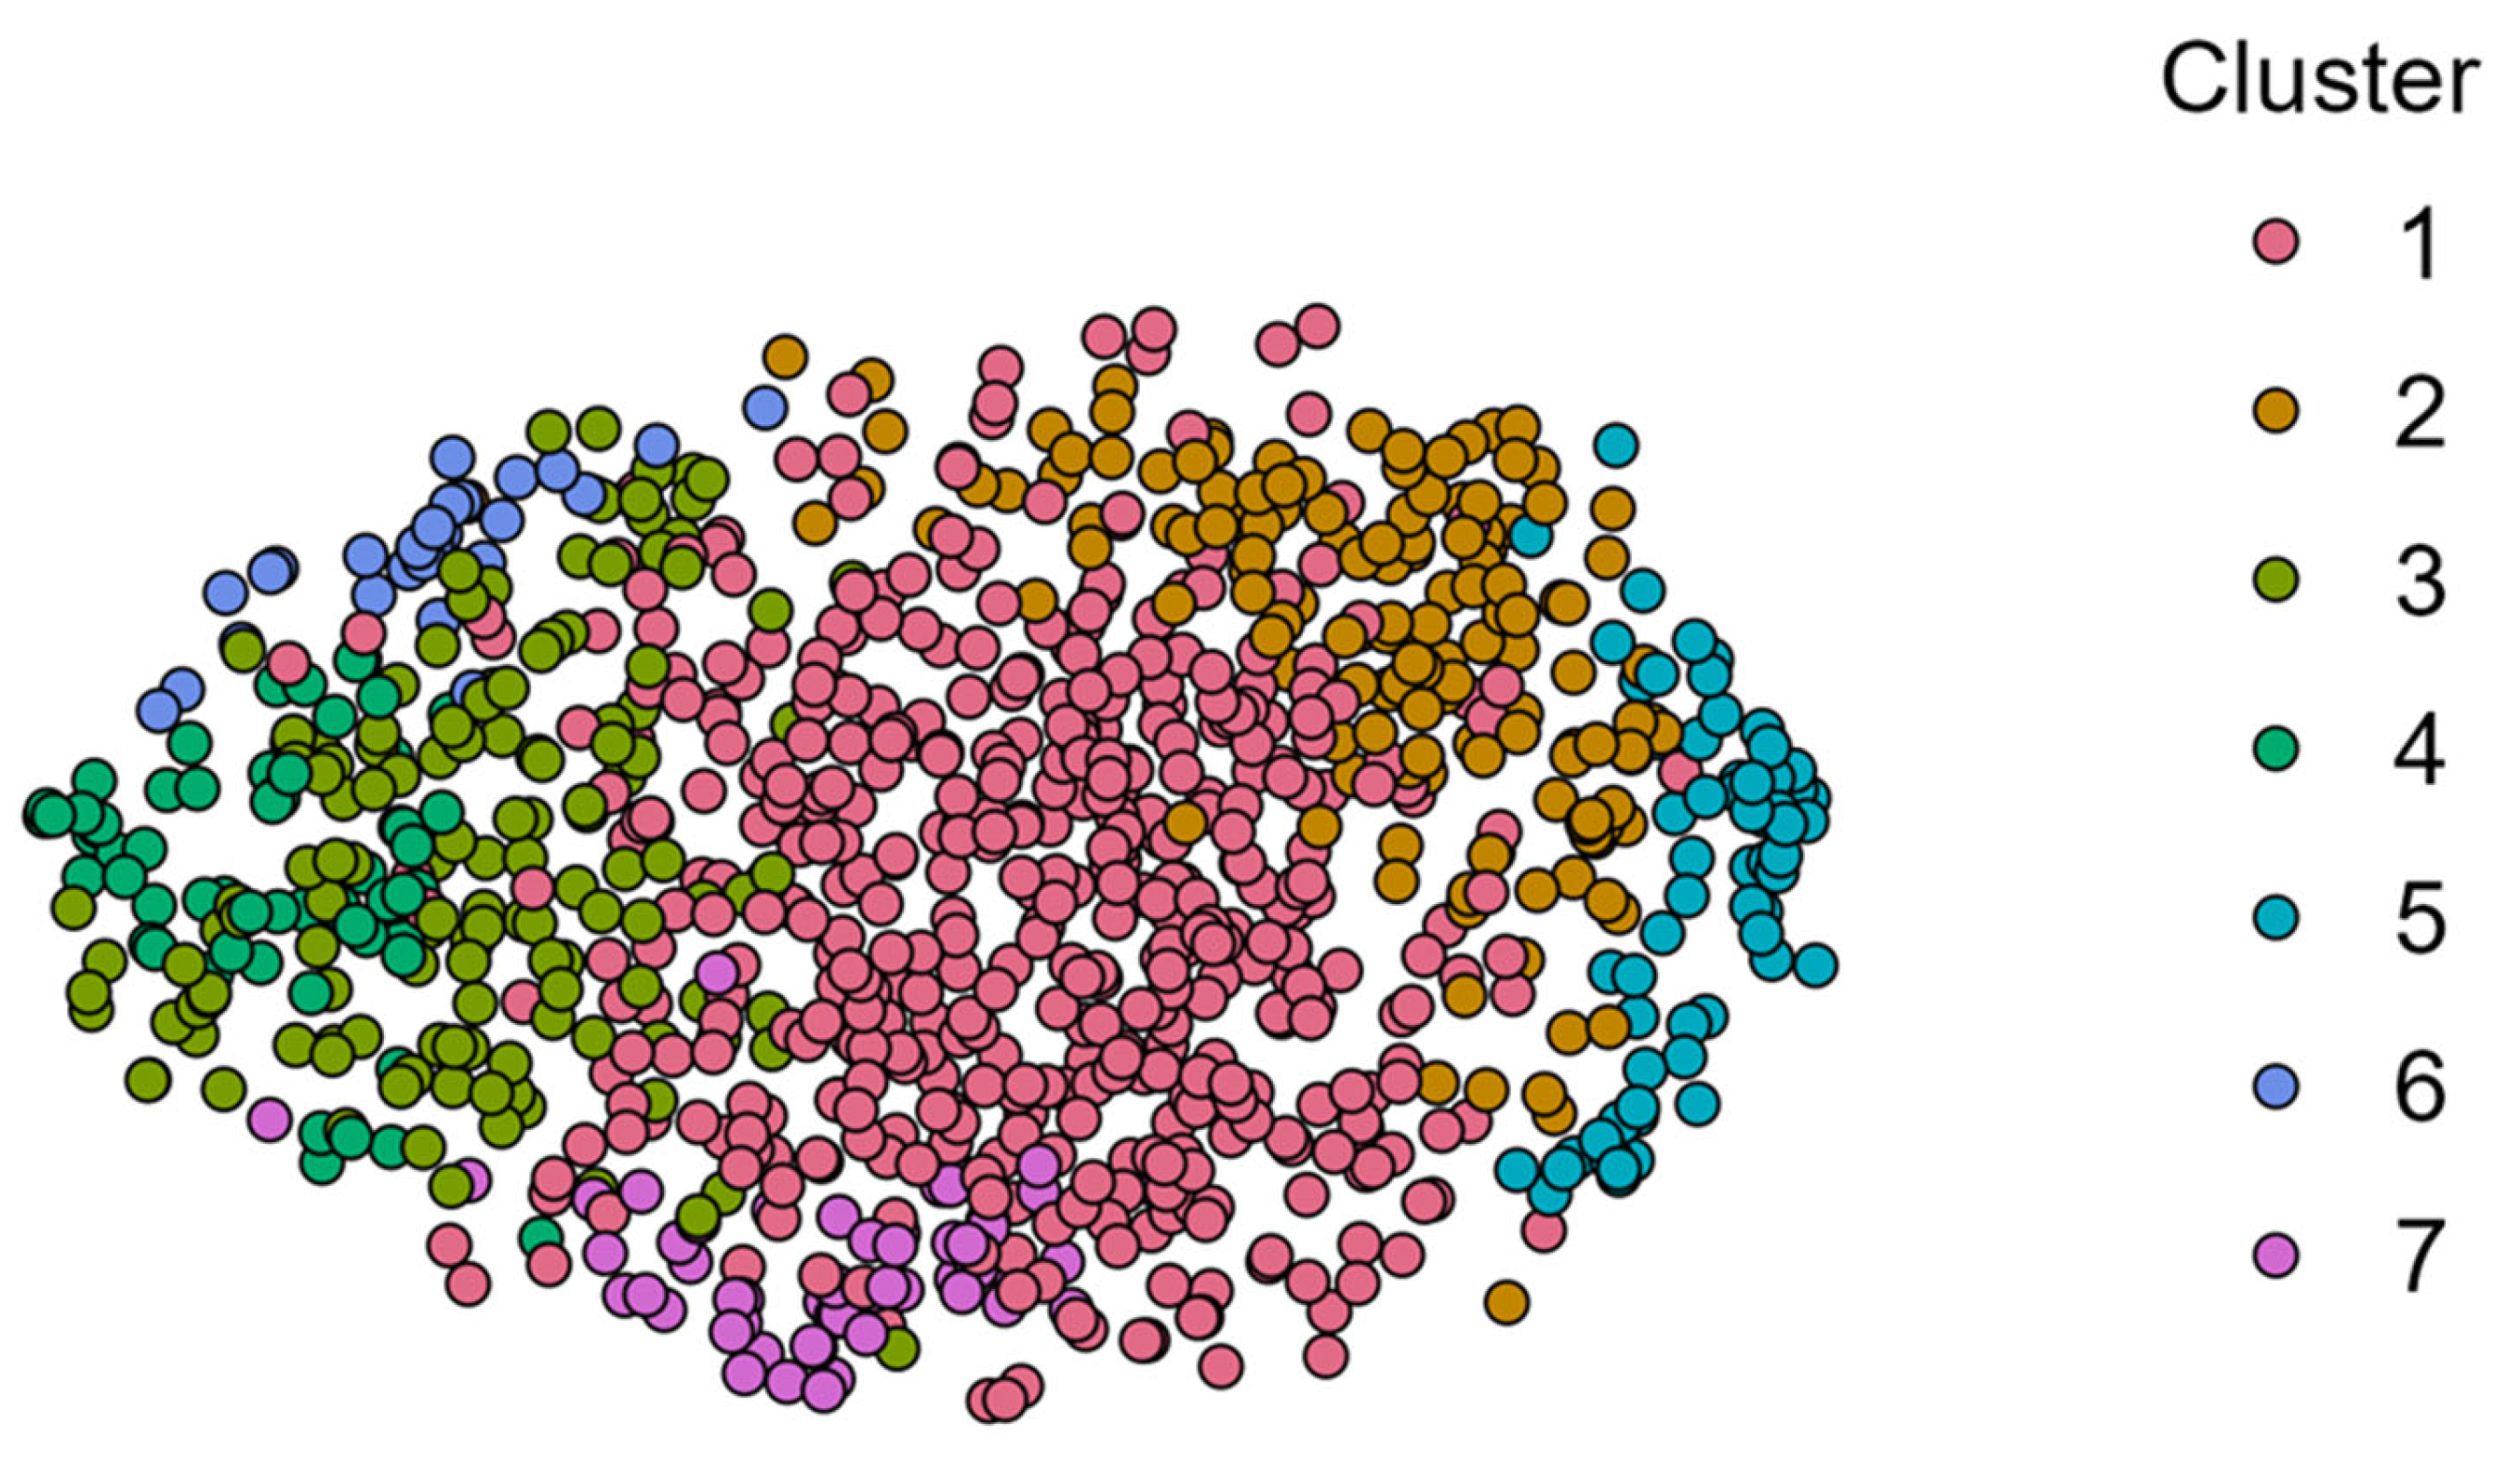
3.1. Random Clustering Model: Results
3.2. ANOVA: Results
3.3. Multiple Stepwise Regression Analysis: Results
3.3.1. Readiness to Change and Pro-Environmental Behaviors
3.3.2. Readiness to Change and Eco-Anxiety
3.3.3. Sensitivity and Pro-Environmental Behaviors
3.3.4. Sensitivity and Eco-Anxiety
4. Discussion
4.1. Readiness to Change and Sensitivity and Their Role in the Engagement of Sustainable Behaviors and Eco-Anxiety
4.2. Future Implications
5. Strengths and Limitations
6. Conclusions
Author Contributions
Funding
Institutional Review Board Statement
Informed Consent Statement
Data Availability Statement
Acknowledgments
Conflicts of Interest
Appendix A

| Clusters | N | Mean | SD | SE | Coefficient of Variation |
|---|---|---|---|---|---|
| 1 | 448 | 27.788 | 3.433 | 0.162 | 0.124 |
| 2 | 145 | 29.145 | 3.140 | 0.261 | 0.108 |
| 3 | 139 | 26.396 | 3.789 | 0.321 | 0.144 |
| 4 | 59 | 25.593 | 4.363 | 0.568 | 0.170 |
| 5 | 60 | 30.300 | 3.021 | 0.390 | 0.100 |
| 6 | 28 | 26.536 | 3.133 | 0.592 | 0.118 |
| 7 | 54 | 27.481 | 3.918 | 0.533 | 0.143 |
| 95% CI for Mean Difference | 95% CI for Cohen’s d | |||||||||
|---|---|---|---|---|---|---|---|---|---|---|
| Mean Difference | Lower | Upper | SE | t | Cohen’s d | Lower | Upper | ptukey | ||
| 1 | 2 | −1.357 | −2.347 | −0.367 | 0.335 | −4.049 | −0.387 | −0.679 | −0.095 | 0.001 |
| 3 | 1.392 | 0.386 | 2.398 | 0.341 | 4.089 | 0.397 | 0.100 | 0.694 | <0.001 | |
| 4 | 2.195 | 0.759 | 3.630 | 0.486 | 4.518 | 0.626 | 0.201 | 1.050 | <0.001 | |
| 5 | −2.512 | −3.937 | −1.087 | 0.482 | −5.210 | −0.716 | −1.138 | −0.294 | <0.001 | |
| 6 | 1.252 | −0.767 | 3.271 | 0.683 | 1.833 | 0.357 | −0.237 | 0.951 | 0.526 | |
| 7 | 0.306 | −1.186 | 1.799 | 0.505 | 0.607 | 0.087 | −0.352 | 0.526 | 0.997 | |
| 2 | 3 | 2.749 | 1.519 | 3.979 | 0.416 | 6.603 | 0.784 | 0.418 | 1.150 | <0.001 |
| 4 | 3.552 | 1.951 | 5.152 | 0.542 | 6.557 | 1.013 | 0.537 | 1.488 | <0.001 | |
| 5 | −1.155 | −2.746 | 0.436 | 0.538 | −2.146 | −0.329 | −0.798 | 0.139 | 0.327 | |
| 6 | 2.609 | 0.470 | 4.748 | 0.724 | 3.604 | 0.744 | 0.113 | 1.375 | 0.006 | |
| 7 | 1.663 | 0.011 | 3.316 | 0.559 | 2.975 | 0.474 | −0.013 | 0.961 | 0.047 | |
| 3 | 4 | 0.802 | −0.808 | 2.413 | 0.545 | 1.472 | 0.229 | −0.245 | 0.702 | 0.761 |
| 5 | −3.904 | −5.505 | −2.303 | 0.542 | −7.206 | −1.113 | −1.590 | −0.636 | <0.001 | |
| 6 | −0.140 | −2.287 | 2.007 | 0.727 | −0.193 | −0.040 | −0.671 | 0.591 | 1.000 | |
| 7 | −1.086 | −2.748 | 0.576 | 0.562 | −1.931 | −0.310 | −0.799 | 0.179 | 0.460 | |
| 4 | 5 | −4.707 | −6.607 | −2.807 | 0.643 | −7.319 | −1.342 | −1.909 | −0.775 | <0.001 |
| 6 | −0.942 | −3.321 | 1.436 | 0.805 | −1.171 | −0.269 | −0.968 | 0.431 | 0.905 | |
| 7 | −1.888 | −3.840 | 0.064 | 0.661 | −2.859 | −0.538 | −1.113 | 0.037 | 0.065 | |
| 5 | 6 | 3.764 | 1.392 | 6.136 | 0.803 | 4.689 | 1.073 | 0.372 | 1.775 | <0.001 |
| 7 | 2.819 | 0.875 | 4.763 | 0.658 | 4.284 | 0.804 | 0.229 | 1.378 | <0.001 | |
| 6 | 7 | −0.946 | −3.359 | 1.468 | 0.817 | −1.158 | −0.270 | −0.979 | 0.440 | 0.910 |
| Clusters | N | Mean | SD | SE | Coefficient of Variation |
|---|---|---|---|---|---|
| 1 | 430 | 14.919 | 3.523 | 0.170 | 0.236 |
| 2 | 137 | 15.891 | 3.918 | 0.335 | 0.247 |
| 3 | 135 | 13.578 | 3.672 | 0.316 | 0.270 |
| 4 | 57 | 11.947 | 3.517 | 0.466 | 0.294 |
| 5 | 56 | 18.536 | 4.204 | 0.562 | 0.227 |
| 6 | 26 | 12.192 | 2.593 | 0.508 | 0.213 |
| 7 | 52 | 13.654 | 3.597 | 0.499 | 0.263 |
| 95% CI for Mean Difference | 95% CI for Cohen’s d | |||||||||
|---|---|---|---|---|---|---|---|---|---|---|
| Mean Difference | Lower | Upper | SE | t | Cohen’s d | Lower | Upper | ptukey | ||
| 1 | 2 | −0.972 | −2.026 | 0.082 | 0.357 | −2.725 | −0.267 | −0.567 | 0.032 | 0.093 |
| 3 | 1.341 | 0.281 | 2.401 | 0.359 | 3.738 | 0.369 | 0.067 | 0.671 | 0.004 | |
| 4 | 2.971 | 1.457 | 4.486 | 0.512 | 5.798 | 0.817 | 0.384 | 1.251 | <0.001 | |
| 5 | −3.617 | −5.143 | −2.091 | 0.517 | −7.003 | −0.995 | −1.434 | −0.556 | <0.001 | |
| 6 | 2.726 | 0.557 | 4.896 | 0.734 | 3.713 | 0.750 | 0.132 | 1.368 | 0.004 | |
| 7 | 1.265 | −0.313 | 2.842 | 0.534 | 2.369 | 0.348 | −0.100 | 0.796 | 0.213 | |
| 2 | 3 | 2.313 | 1.010 | 3.616 | 0.441 | 5.246 | 0.636 | 0.264 | 1.008 | <0.001 |
| 4 | 3.943 | 2.250 | 5.637 | 0.573 | 6.881 | 1.085 | 0.598 | 1.571 | <0.001 | |
| 5 | −2.645 | −4.349 | −0.941 | 0.577 | −4.587 | −0.728 | −1.214 | −0.241 | <0.001 | |
| 6 | 3.698 | 1.400 | 5.996 | 0.778 | 4.755 | 1.017 | 0.361 | 1.673 | <0.001 | |
| 7 | 2.237 | 0.487 | 3.987 | 0.592 | 3.777 | 0.615 | 0.117 | 1.113 | 0.003 | |
| 3 | 4 | 1.630 | −0.067 | 3.327 | 0.574 | 2.839 | 0.448 | −0.034 | 0.931 | 0.069 |
| 5 | −4.958 | −6.666 | −3.250 | 0.578 | −8.580 | −1.364 | −1.858 | −0.869 | <0.001 | |
| 6 | 1.385 | −0.916 | 3.686 | 0.779 | 1.779 | 0.381 | −0.272 | 1.034 | 0.562 | |
| 7 | −0.076 | −1.830 | 1.677 | 0.593 | −0.128 | −0.021 | −0.518 | 0.476 | 1.000 | |
| 4 | 5 | −6.588 | −8.610 | −4.567 | 0.684 | −9.631 | −1.812 | −2.400 | −1.224 | <0.001 |
| 6 | −0.245 | −2.788 | 2.298 | 0.860 | −0.285 | −0.067 | −0.788 | 0.654 | 1.000 | |
| 7 | −1.706 | −3.767 | 0.354 | 0.697 | −2.448 | −0.469 | −1.055 | 0.116 | 0.180 | |
| 5 | 6 | 6.343 | 3.794 | 8.893 | 0.863 | 7.352 | 1.745 | 1.011 | 2.479 | <0.001 |
| 7 | 4.882 | 2.813 | 6.951 | 0.700 | 6.973 | 1.343 | 0.748 | 1.938 | <0.001 | |
| 6 | 7 | −1.462 | −4.042 | 1.119 | 0.873 | −1.674 | −0.402 | −1.134 | 0.330 | 0.634 |
| Clusters | N | Mean | SD | SE | Coefficient of Variation |
|---|---|---|---|---|---|
| 1 | 452 | 9.912 | 4.888 | 0.230 | 0.493 |
| 2 | 145 | 11.745 | 4.422 | 0.367 | 0.376 |
| 3 | 141 | 8.645 | 5.106 | 0.430 | 0.591 |
| 4 | 59 | 5.915 | 4.057 | 0.528 | 0.686 |
| 5 | 60 | 12.733 | 3.922 | 0.506 | 0.308 |
| 6 | 28 | 8.571 | 4.788 | 0.905 | 0.559 |
| 7 | 54 | 8.778 | 4.832 | 0.658 | 0.550 |
| 95% CI for Mean Difference | 95% CI for Cohen’s d | |||||||||
|---|---|---|---|---|---|---|---|---|---|---|
| Mean Difference | Lower | Upper | SE | t | Cohen’s d | Lower | Upper | ptukey | ||
| 1 | 2 | −1.833 | −3.171 | −0.496 | 0.453 | −4.051 | −0.387 | −0.679 | −0.095 | 0.001 |
| 3 | 1.266 | −0.086 | 2.618 | 0.457 | 2.768 | 0.267 | −0.027 | 0.561 | 0.083 | |
| 4 | 3.996 | 2.057 | 5.936 | 0.656 | 6.088 | 0.843 | 0.417 | 1.269 | <0.001 | |
| 5 | −2.822 | −4.747 | −0.896 | 0.652 | −4.331 | −0.595 | −1.016 | −0.174 | <0.001 | |
| 6 | 1.340 | −1.389 | 4.069 | 0.924 | 1.451 | 0.283 | −0.311 | 0.876 | 0.774 | |
| 7 | 1.134 | −0.884 | 3.151 | 0.683 | 1.660 | 0.239 | −0.200 | 0.678 | 0.643 | |
| 2 | 3 | 3.099 | 1.442 | 4.757 | 0.561 | 5.526 | 0.654 | 0.290 | 1.017 | <0.001 |
| 4 | 5.830 | 3.666 | 7.993 | 0.732 | 7.960 | 1.229 | 0.751 | 1.708 | <0.001 | |
| 5 | −0.989 | −3.140 | 1.162 | 0.728 | −1.358 | −0.208 | −0.676 | 0.259 | 0.824 | |
| 6 | 3.173 | 0.281 | 6.066 | 0.979 | 3.242 | 0.669 | 0.039 | 1.300 | 0.021 | |
| 7 | 2.967 | 0.733 | 5.201 | 0.756 | 3.924 | 0.626 | 0.138 | 1.113 | 0.002 | |
| 3 | 4 | 2.730 | 0.557 | 4.903 | 0.735 | 3.713 | 0.576 | 0.102 | 1.050 | 0.004 |
| 5 | −4.088 | −6.248 | −1.928 | 0.731 | −5.592 | −0.862 | −1.336 | −0.389 | <0.001 | |
| 6 | 0.074 | −2.825 | 2.973 | 0.981 | 0.075 | 0.016 | −0.615 | 0.646 | 1.000 | |
| 7 | −0.132 | −2.375 | 2.110 | 0.759 | −0.174 | −0.028 | −0.515 | 0.460 | 1.000 | |
| 4 | 5 | −6.818 | −9.387 | −4.249 | 0.869 | −7.841 | −1.438 | −2.005 | −0.870 | <0.001 |
| 6 | −2.656 | −5.872 | 0.560 | 1.088 | −2.441 | −0.560 | −1.260 | 0.140 | 0.183 | |
| 7 | −2.863 | −5.502 | −0.224 | 0.893 | −3.205 | −0.604 | −1.179 | −0.028 | 0.024 | |
| 5 | 6 | 4.162 | 0.955 | 7.369 | 1.085 | 3.835 | 0.878 | 0.178 | 1.578 | 0.003 |
| 7 | 3.956 | 1.327 | 6.584 | 0.890 | 4.447 | 0.834 | 0.260 | 1.409 | <0.001 | |
| 6 | 7 | −0.206 | −3.470 | 3.057 | 1.104 | −0.187 | −0.044 | −0.753 | 0.666 | 1.000 |
| Clusters | N | Mean | SD | SE | Coefficient of Variation |
|---|---|---|---|---|---|
| 1 | 450 | 12.013 | 2.516 | 0.119 | 0.209 |
| 2 | 144 | 12.764 | 2.575 | 0.215 | 0.202 |
| 3 | 141 | 11.355 | 3.017 | 0.254 | 0.266 |
| 4 | 59 | 10.424 | 3.344 | 0.435 | 0.321 |
| 5 | 60 | 12.300 | 2.520 | 0.325 | 0.205 |
| 6 | 28 | 11.571 | 2.235 | 0.422 | 0.193 |
| 7 | 54 | 10.778 | 3.196 | 0.435 | 0.297 |
| 95% CI for Mean Difference | 95% CI for Cohen’s d | |||||||||
|---|---|---|---|---|---|---|---|---|---|---|
| Mean Difference | Lower | Upper | SE | t | Cohen’s d | Lower | Upper | ptukey | ||
| 1 | 2 | −0.751 | −1.514 | 0.013 | 0.258 | −2.905 | −0.278 | −0.571 | 0.014 | 0.057 |
| 3 | 0.659 | −0.111 | 1.428 | 0.260 | 2.530 | 0.244 | −0.050 | 0.539 | 0.150 | |
| 4 | 1.590 | 0.486 | 2.694 | 0.374 | 4.255 | 0.589 | 0.165 | 1.013 | <0.001 | |
| 5 | −0.287 | −1.382 | 0.809 | 0.371 | −0.773 | −0.106 | −0.525 | 0.313 | 0.987 | |
| 6 | 0.442 | −1.111 | 1.995 | 0.526 | 0.841 | 0.164 | −0.430 | 0.757 | 0.981 | |
| 7 | 1.236 | 0.087 | 2.384 | 0.389 | 3.180 | 0.458 | 0.018 | 0.898 | 0.025 | |
| 2 | 3 | 1.409 | 0.465 | 2.354 | 0.320 | 4.409 | 0.522 | 0.159 | 0.885 | <0.001 |
| 4 | 2.340 | 1.108 | 3.573 | 0.417 | 5.611 | 0.867 | 0.392 | 1.342 | <0.001 | |
| 5 | 0.464 | −0.761 | 1.689 | 0.415 | 1.119 | 0.172 | −0.296 | 0.640 | 0.922 | |
| 6 | 1.192 | −0.454 | 2.839 | 0.557 | 2.140 | 0.442 | −0.188 | 1.072 | 0.330 | |
| 7 | 1.986 | 0.714 | 3.258 | 0.431 | 4.613 | 0.736 | 0.247 | 1.225 | <0.001 | |
| 3 | 4 | 0.931 | −0.305 | 2.167 | 0.418 | 2.225 | 0.345 | −0.128 | 0.818 | 0.283 |
| 5 | −0.945 | −2.174 | 0.284 | 0.416 | −2.273 | −0.350 | −0.821 | 0.120 | 0.258 | |
| 6 | −0.217 | −1.866 | 1.433 | 0.558 | −0.388 | −0.080 | −0.711 | 0.550 | 1.000 | |
| 7 | 0.577 | −0.699 | 1.853 | 0.432 | 1.336 | 0.214 | −0.274 | 0.702 | 0.835 | |
| 4 | 5 | −1.876 | −3.338 | −0.415 | 0.495 | −3.793 | −0.695 | −1.256 | −0.135 | 0.003 |
| 6 | −1.148 | −2.977 | 0.682 | 0.619 | −1.854 | −0.425 | −1.125 | 0.274 | 0.512 | |
| 7 | −0.354 | −1.856 | 1.147 | 0.508 | −0.697 | −0.131 | −0.705 | 0.443 | 0.993 | |
| 5 | 6 | 0.729 | −1.096 | 2.553 | 0.618 | 1.180 | 0.270 | −0.427 | 0.968 | 0.902 |
| 7 | 1.522 | 0.027 | 3.018 | 0.506 | 3.008 | 0.564 | −0.009 | 1.137 | 0.043 | |
| 6 | 7 | 0.794 | −1.063 | 2.650 | 0.628 | 1.263 | 0.294 | −0.416 | 1.004 | 0.869 |
| Clusters | N | Mean | SD | SE | Coefficient of Variation |
|---|---|---|---|---|---|
| 1 | 448 | 8.511 | 2.450 | 0.116 | 0.288 |
| 2 | 147 | 9.898 | 3.024 | 0.249 | 0.306 |
| 3 | 140 | 8.286 | 2.718 | 0.230 | 0.328 |
| 4 | 58 | 7.017 | 2.718 | 0.357 | 0.387 |
| 5 | 61 | 9.639 | 3.072 | 0.393 | 0.319 |
| 6 | 28 | 8.929 | 3.431 | 0.648 | 0.384 |
| 7 | 54 | 6.593 | 2.061 | 0.280 | 0.313 |
| 95% CI for Mean Difference | 95% CI for Cohen’s d | |||||||||
|---|---|---|---|---|---|---|---|---|---|---|
| Mean Difference | Lower | Upper | SE | t | Cohen’s d | Lower | Upper | ptukey | ||
| 1 | 2 | −1.387 | −2.134 | −0.640 | 0.253 | −5.484 | −0.521 | −0.813 | −0.229 | <0.001 |
| 3 | 0.225 | −0.536 | 0.987 | 0.258 | 0.875 | 0.085 | −0.210 | 0.380 | 0.976 | |
| 4 | 1.494 | 0.397 | 2.591 | 0.371 | 4.024 | 0.562 | 0.135 | 0.988 | 0.001 | |
| 5 | −1.128 | −2.201 | −0.055 | 0.363 | −3.107 | −0.424 | −0.841 | −0.007 | 0.032 | |
| 6 | −0.417 | −1.949 | 1.114 | 0.518 | −0.805 | −0.157 | −0.750 | 0.437 | 0.984 | |
| 7 | 1.919 | 0.786 | 3.051 | 0.383 | 5.006 | 0.721 | 0.279 | 1.163 | <0.001 | |
| 2 | 3 | 1.612 | 0.684 | 2.541 | 0.314 | 5.131 | 0.606 | 0.244 | 0.968 | <0.001 |
| 4 | 2.881 | 1.662 | 4.100 | 0.413 | 6.983 | 1.083 | 0.604 | 1.561 | <0.001 | |
| 5 | 0.259 | −0.939 | 1.456 | 0.405 | 0.638 | 0.097 | −0.367 | 0.561 | 0.996 | |
| 6 | 0.969 | −0.652 | 2.590 | 0.549 | 1.767 | 0.364 | −0.264 | 0.993 | 0.571 | |
| 7 | 3.305 | 2.054 | 4.556 | 0.423 | 7.807 | 1.242 | 0.750 | 1.735 | <0.001 | |
| 3 | 4 | 1.268 | 0.041 | 2.496 | 0.415 | 3.053 | 0.477 | −0.0001385 | 0.954 | 0.038 |
| 5 | −1.354 | −2.560 | −0.148 | 0.408 | −3.316 | −0.509 | −0.978 | −0.040 | 0.016 | |
| 6 | −0.643 | −2.270 | 0.985 | 0.551 | −1.167 | −0.242 | −0.873 | 0.389 | 0.906 | |
| 7 | 1.693 | 0.434 | 2.952 | 0.426 | 3.973 | 0.636 | 0.146 | 1.126 | 0.001 | |
| 4 | 5 | −2.622 | −4.064 | −1.180 | 0.488 | −5.374 | −0.986 | −1.549 | −0.423 | <0.001 |
| 6 | −1.911 | −3.720 | −0.102 | 0.612 | −3.122 | −0.718 | −1.421 | −0.016 | 0.030 | |
| 7 | 0.425 | −1.062 | 1.911 | 0.503 | 0.844 | 0.160 | −0.417 | 0.736 | 0.980 | |
| 5 | 6 | 0.711 | −1.084 | 2.505 | 0.607 | 1.170 | 0.267 | −0.429 | 0.963 | 0.905 |
| 7 | 3.047 | 1.578 | 4.516 | 0.497 | 6.129 | 1.145 | 0.570 | 1.720 | <0.001 | |
| 6 | 7 | 2.336 | 0.505 | 4.167 | 0.620 | 3.770 | 0.878 | 0.166 | 1.590 | 0.003 |
| Clusters | N | Mean | SD | SE | Coefficient of Variation |
|---|---|---|---|---|---|
| 1 | 448 | 6.002 | 1.898 | 0.090 | 0.316 |
| 2 | 147 | 6.735 | 2.042 | 0.168 | 0.303 |
| 3 | 140 | 5.557 | 1.983 | 0.168 | 0.357 |
| 4 | 57 | 4.596 | 1.568 | 0.208 | 0.341 |
| 5 | 60 | 7.117 | 1.923 | 0.248 | 0.270 |
| 6 | 28 | 5.000 | 1.610 | 0.304 | 0.322 |
| 7 | 54 | 4.630 | 1.570 | 0.214 | 0.339 |
| 95% CI for Mean Difference | 95% CI for Cohen’s d | |||||||||
|---|---|---|---|---|---|---|---|---|---|---|
| Mean Difference | Lower | Upper | SE | t | Cohen’s d | Lower | Upper | ptukey | ||
| 1 | 2 | −0.732 | −1.264 | −0.201 | 0.180 | −4.070 | −0.387 | −0.678 | −0.096 | <0.001 |
| 3 | 0.445 | −0.097 | 0.987 | 0.183 | 2.428 | 0.235 | −0.060 | 0.531 | 0.188 | |
| 4 | 1.406 | 0.619 | 2.192 | 0.266 | 5.280 | 0.743 | 0.311 | 1.174 | <0.001 | |
| 5 | −1.114 | −1.883 | −0.345 | 0.260 | −4.282 | −0.589 | −1.010 | −0.168 | <0.001 | |
| 6 | 1.002 | −0.088 | 2.092 | 0.369 | 2.718 | 0.529 | −0.065 | 1.124 | 0.095 | |
| 7 | 1.373 | 0.567 | 2.178 | 0.273 | 5.033 | 0.725 | 0.283 | 1.167 | <0.001 | |
| 2 | 3 | 1.178 | 0.517 | 1.838 | 0.224 | 5.267 | 0.622 | 0.260 | 0.984 | <0.001 |
| 4 | 2.138 | 1.265 | 3.011 | 0.295 | 7.238 | 1.129 | 0.647 | 1.611 | <0.001 | |
| 5 | −0.382 | −1.239 | 0.475 | 0.290 | −1.317 | −0.202 | −0.669 | 0.265 | 0.844 | |
| 6 | 1.735 | 0.581 | 2.888 | 0.390 | 4.444 | 0.916 | 0.285 | 1.548 | <0.001 | |
| 7 | 2.105 | 1.215 | 2.995 | 0.301 | 6.987 | 1.112 | 0.621 | 1.603 | <0.001 | |
| 3 | 4 | 0.961 | 0.082 | 1.840 | 0.297 | 3.229 | 0.507 | 0.027 | 0.987 | 0.022 |
| 5 | −1.560 | −2.423 | −0.696 | 0.292 | −5.338 | −0.824 | −1.297 | −0.350 | <0.001 | |
| 6 | 0.557 | −0.601 | 1.715 | 0.392 | 1.422 | 0.294 | −0.337 | 0.925 | 0.790 | |
| 7 | 0.928 | 0.031 | 1.824 | 0.303 | 3.058 | 0.490 | 0.0006589 | 0.979 | 0.037 | |
| 4 | 5 | −2.520 | −3.555 | −1.485 | 0.350 | −7.197 | −1.331 | −1.902 | −0.760 | <0.001 |
| 6 | −0.404 | −1.695 | 0.888 | 0.437 | −0.924 | −0.213 | −0.916 | 0.490 | 0.969 | |
| 7 | −0.033 | −1.095 | 1.029 | 0.360 | −0.092 | −0.018 | −0.596 | 0.561 | 1.000 | |
| 5 | 6 | 2.117 | 0.836 | 3.397 | 0.433 | 4.885 | 1.118 | 0.416 | 1.820 | <0.001 |
| 7 | 2.487 | 1.438 | 3.536 | 0.355 | 7.003 | 1.314 | 0.735 | 1.893 | <0.001 | |
| 6 | 7 | 0.370 | −0.932 | 1.673 | 0.441 | 0.840 | 0.196 | −0.514 | 0.905 | 0.981 |
| Clusters | N | Mean | SD | SE | Coefficient of Variation |
|---|---|---|---|---|---|
| 1 | 448 | 5.585 | 2.257 | 0.107 | 0.404 |
| 2 | 147 | 6.442 | 2.540 | 0.210 | 0.394 |
| 3 | 140 | 5.600 | 2.319 | 0.196 | 0.414 |
| 4 | 58 | 4.845 | 1.890 | 0.248 | 0.390 |
| 5 | 61 | 6.230 | 2.445 | 0.313 | 0.393 |
| 6 | 27 | 5.481 | 2.119 | 0.408 | 0.387 |
| 7 | 53 | 4.057 | 1.247 | 0.171 | 0.307 |
| 95% CI for Mean Difference | 95% CI for Cohen’s d | |||||||||
|---|---|---|---|---|---|---|---|---|---|---|
| Mean Difference | Lower | Upper | SE | t | Cohen’s d | Lower | Upper | ptukey | ||
| 1 | 2 | −0.857 | −1.492 | −0.223 | 0.215 | −3.995 | −0.380 | −0.671 | −0.089 | 0.001 |
| 3 | −0.015 | −0.661 | 0.631 | 0.219 | −0.069 | −0.007 | −0.302 | 0.288 | 1.000 | |
| 4 | 0.740 | −0.191 | 1.671 | 0.315 | 2.348 | 0.328 | −0.098 | 0.753 | 0.222 | |
| 5 | −0.645 | −1.555 | 0.266 | 0.308 | −2.092 | −0.286 | −0.702 | 0.131 | 0.358 | |
| 6 | 0.103 | −1.219 | 1.426 | 0.447 | 0.231 | 0.046 | −0.558 | 0.649 | 1.000 | |
| 7 | 1.528 | 0.559 | 2.497 | 0.328 | 4.659 | 0.677 | 0.232 | 1.122 | <0.001 | |
| 2 | 3 | 0.842 | 0.054 | 1.630 | 0.267 | 3.158 | 0.373 | 0.012 | 0.734 | 0.027 |
| 4 | 1.597 | 0.563 | 2.632 | 0.350 | 4.562 | 0.707 | 0.232 | 1.182 | <0.001 | |
| 5 | 0.213 | −0.804 | 1.229 | 0.344 | 0.618 | 0.094 | −0.370 | 0.558 | 0.996 | |
| 6 | 0.961 | −0.436 | 2.358 | 0.473 | 2.032 | 0.425 | −0.213 | 1.064 | 0.395 | |
| 7 | 2.386 | 1.317 | 3.455 | 0.362 | 6.594 | 1.056 | 0.563 | 1.550 | <0.001 | |
| 3 | 4 | 0.755 | −0.287 | 1.797 | 0.353 | 2.142 | 0.334 | −0.142 | 0.811 | 0.329 |
| 5 | −0.630 | −1.653 | 0.394 | 0.346 | −1.817 | −0.279 | −0.747 | 0.189 | 0.537 | |
| 6 | 0.119 | −1.284 | 1.521 | 0.475 | 0.250 | 0.052 | −0.588 | 0.693 | 1.000 | |
| 7 | 1.543 | 0.467 | 2.619 | 0.364 | 4.238 | 0.684 | 0.190 | 1.177 | <0.001 | |
| 4 | 5 | −1.385 | −2.608 | −0.161 | 0.414 | −3.344 | −0.613 | −1.174 | −0.053 | 0.015 |
| 6 | −0.637 | −2.191 | 0.918 | 0.526 | −1.210 | −0.282 | −0.992 | 0.428 | 0.890 | |
| 7 | 0.788 | −0.480 | 2.056 | 0.429 | 1.837 | 0.349 | −0.230 | 0.929 | 0.523 | |
| 5 | 6 | 0.748 | −0.794 | 2.290 | 0.522 | 1.433 | 0.331 | −0.373 | 1.036 | 0.784 |
| 7 | 2.173 | 0.920 | 3.426 | 0.424 | 5.125 | 0.962 | 0.386 | 1.538 | <0.001 | |
| 6 | 7 | 1.425 | −0.153 | 3.002 | 0.534 | 2.669 | 0.631 | −0.091 | 1.353 | 0.107 |
| Clusters | N | Mean | SD | SE | Coefficient of Variation |
|---|---|---|---|---|---|
| 1 | 448 | 6.212 | 1.995 | 0.094 | 0.321 |
| 2 | 144 | 7.167 | 2.099 | 0.175 | 0.293 |
| 3 | 140 | 5.571 | 2.082 | 0.176 | 0.374 |
| 4 | 57 | 4.175 | 1.477 | 0.196 | 0.354 |
| 5 | 61 | 7.672 | 2.508 | 0.321 | 0.327 |
| 6 | 26 | 5.577 | 2.485 | 0.487 | 0.446 |
| 7 | 54 | 4.630 | 1.629 | 0.222 | 0.352 |
| 95% CI for Mean Difference | 95% CI for Cohen’s d | |||||||||
|---|---|---|---|---|---|---|---|---|---|---|
| Mean Difference | Lower | Upper | SE | t | Cohen’s d | Lower | Upper | ptukey | ||
| 1 | 2 | −0.955 | −1.529 | −0.380 | 0.195 | −4.908 | −0.470 | −0.764 | −0.176 | <0.001 |
| 3 | 0.641 | 0.060 | 1.222 | 0.197 | 3.258 | 0.315 | 0.020 | 0.611 | 0.020 | |
| 4 | 2.037 | 1.193 | 2.880 | 0.286 | 7.132 | 1.003 | 0.569 | 1.437 | <0.001 | |
| 5 | −1.460 | −2.279 | −0.641 | 0.277 | −5.269 | −0.719 | −1.138 | −0.300 | <0.001 | |
| 6 | 0.635 | −0.575 | 1.846 | 0.410 | 1.551 | 0.313 | −0.302 | 0.928 | 0.714 | |
| 7 | 1.582 | 0.718 | 2.447 | 0.293 | 5.410 | 0.779 | 0.337 | 1.222 | <0.001 | |
| 2 | 3 | 1.595 | 0.883 | 2.307 | 0.241 | 6.619 | 0.786 | 0.420 | 1.151 | <0.001 |
| 4 | 2.991 | 2.052 | 3.930 | 0.318 | 9.413 | 1.473 | 0.985 | 1.961 | <0.001 | |
| 5 | −0.505 | −1.422 | 0.411 | 0.310 | −1.629 | −0.249 | −0.715 | 0.217 | 0.663 | |
| 6 | 1.590 | 0.311 | 2.868 | 0.433 | 3.674 | 0.783 | 0.131 | 1.434 | 0.005 | |
| 7 | 2.537 | 1.580 | 3.494 | 0.324 | 7.830 | 1.249 | 0.755 | 1.744 | <0.001 | |
| 3 | 4 | 1.396 | 0.453 | 2.339 | 0.319 | 4.376 | 0.687 | 0.206 | 1.169 | <0.001 |
| 5 | −2.101 | −3.021 | −1.180 | 0.312 | −6.743 | −1.035 | −1.508 | −0.561 | <0.001 | |
| 6 | −0.005 | −1.287 | 1.276 | 0.434 | −0.013 | −0.003 | −0.653 | 0.648 | 1.000 | |
| 7 | 0.942 | −0.019 | 1.903 | 0.325 | 2.895 | 0.464 | −0.025 | 0.953 | 0.059 | |
| 4 | 5 | −3.497 | −4.602 | −2.391 | 0.374 | −9.348 | −1.722 | −2.296 | −1.148 | <0.001 |
| 6 | −1.401 | −2.821 | 0.018 | 0.481 | −2.916 | −0.690 | −1.413 | 0.032 | 0.056 | |
| 7 | −0.454 | −1.594 | 0.685 | 0.386 | −1.178 | −0.224 | −0.802 | 0.355 | 0.902 | |
| 5 | 6 | 2.095 | 0.690 | 3.500 | 0.476 | 4.406 | 1.032 | 0.315 | 1.749 | <0.001 |
| 7 | 3.043 | 1.921 | 4.164 | 0.379 | 8.019 | 1.498 | 0.919 | 2.077 | <0.001 | |
| 6 | 7 | 0.947 | −0.485 | 2.380 | 0.485 | 1.954 | 0.467 | −0.261 | 1.194 | 0.445 |
| Variables | Beta | t | Sig. | CI 95% | Adjusted-R2 | |
|---|---|---|---|---|---|---|
| Lower Bound | Upper Bound | |||||
| RTC-A | 0.289 | 8.293 | <0.001 | 0.281 | 0.455 | 0.141 |
| RTC-PR | 0.140 | 4.017 | <0.001 | 0.099 | 0.289 | |
| Variables | Beta | t | Sig. | CI 95% | Adjusted-R2 | |
|---|---|---|---|---|---|---|
| Lower Bound | Upper Bound | |||||
| RTC-PR | 0.152 | 3.516 | <0.001 | 0.096 | 0.339 | 0.155 |
| RTC-A | 0.163 | 3.875 | <0.001 | 0.108 | 0.329 | |
| RTC-M | 0.147 | 3.596 | <0.001 | 0.089 | 0.304 | |
| Variables | Beta | t | Sig. | CI 95% | Adjusted-R2 | |
|---|---|---|---|---|---|---|
| Lower Bound | Upper Bound | |||||
| RTC-M | 0.129 | 2.411 | 0.016 | 0.041 | 0.397 | 0.129 |
| RTC-A | 0.217 | 5.453 | <0.001 | 0.240 | 0.510 | |
| RTC-SE | −0.099 | −2.803 | 0.005 | −0.253 | −0.045 | |
| RTC-PI | 0.122 | 2.471 | 0.014 | 0.047 | 0.412 | |
| Variables | Beta | t | Sig. | CI 95% | Adjusted-R2 | |
|---|---|---|---|---|---|---|
| Lower Bound | Upper Bound | |||||
| RTC-PI | 0.149 | 4.077 | <0.001 | 0.081 | 0.230 | 0.052 |
| RTC-A | 0.158 | 3.947 | <0.001 | 0.076 | 0.225 | |
| RTC-SE | −0.133 | −3.629 | <0.001 | −0.171 | −0.051 | |
| Variables | Beta | t | Sig. | CI 95% | Adjusted-R2 | |
|---|---|---|---|---|---|---|
| Lower Bound | Upper Bound | |||||
| RTC-PI | 0.122 | 3.085 | 0.002 | 0.048 | 0.217 | 0.073 |
| RTC-ES | −0.134 | −3.608 | <0.001 | −0.175 | −0.052 | |
| RTC-SE | 0.111 | 2.068 | 0.039 | 0.005 | 0.206 | |
| RTC-M | 0.122 | 3.085 | 0.002 | 0.048 | 0.217 | |
| Variables | Beta | t | Sig. | CI 95% | Adjusted-R2 | |
|---|---|---|---|---|---|---|
| Lower Bound | Upper Bound | |||||
| RTC-M | 0.209 | 4.167 | <0.001 | 0.076 | 0.211 | 0.094 |
| RTC-PI | 0.117 | 2.332 | 0.020 | 0.014 | 0.164 | |
| Variables | Beta | t | Sig. | CI 95% | Adjusted-R2 | |
|---|---|---|---|---|---|---|
| Lower Bound | Upper Bound | |||||
| RTC-ES | 0.169 | 4.269 | <0.001 | 0.083 | 0.224 | 0.042 |
| RTC-SE | −0.157 | −4.019 | <0.001 | −0.163 | −0.056 | |
| RTC-A | 0.126 | 3.199 | 0.001 | 0.039 | 0.163 | |
| Variables | Beta | t | Sig. | CI 95% | Adjusted-R2 | |
|---|---|---|---|---|---|---|
| Lower Bound | Upper Bound | |||||
| RTC-M | 0.156 | 3.010 | 0.003 | 0.041 | 0.194 | 0.170 |
| RTC-A | 0.177 | 4.734 | <0.001 | 0.079 | 0.191 | |
| RTC-PI | 0.174 | 3.597 | <0.001 | 0.066 | 0.224 | |
| RTC-SS | −0.087 | −2.733 | 0.006 | −0.118 | −0.019 | |
| Variables | Beta | t | Sig. | CI 95% | Adjusted-R2 | |
|---|---|---|---|---|---|---|
| Lower Bound | Upper Bound | |||||
| HSPS-AES | 0.304 | 8.021 | <0.001 | 0.198 | 0.327 | 0.068 |
| HSPS-EOE | −0.090 | −2.381 | 0.017 | −0.072 | −0.007 | |
| Variables | Beta | t | Sig. | CI 95% | Adjusted-R2 | |
|---|---|---|---|---|---|---|
| Lower Bound | Upper Bound | |||||
| HSPS-AES | 0.304 | 8.021 | <0.001 | 0.198 | 0.327 | 0.101 |
| HSPS-EOE | −0.090 | −2.381 | 0.017 | −0.072 | −0.007 | |
| Variables | Beta | t | Sig. | CI 95% | Adjusted-R2 | |
|---|---|---|---|---|---|---|
| Lower Bound | Upper Bound | |||||
| HSPS-AES | 0.163 | 4.661 | <0.001 | 0.110 | 0.270 | 0.068 |
| HSPS-LST | 0.149 | 4.269 | <0.001 | 0.077 | 0.209 | |
| Variables | Beta | t | Sig. | CI 95% | Adjusted-R2 | |
|---|---|---|---|---|---|---|
| Lower Bound | Upper Bound | |||||
| HSPS-AES | 0.178 | 4.706 | <0.001 | 0.068 | 0.164 | 0.066 |
| HSPS-EOE | 0.115 | 3.047 | 0.002 | 0.014 | 0.062 | |
| Variables | Beta | t | Sig. | CI 95% | Adjusted-R2 | |
|---|---|---|---|---|---|---|
| Lower Bound | Upper Bound | |||||
| HSPS-EOE | 0.308 | 7.385 | <0.001 | 0.075 | 0.130 | 0.200 |
| HSPS-LST | 0.134 | 3.461 | 0.001 | 0.031 | 0.113 | |
| HSPS-AES | 0.070 | 1.982 | 0.048 | 0.000 | 0.091 | |
| Variables | Beta | t | Sig. | CI 95% | Adjusted-R2 | |
|---|---|---|---|---|---|---|
| Lower Bound | Upper Bound | |||||
| HSPS-AES | 0.268 | 7.903 | <0.001 | 0.094 | 0.157 | 0.125 |
| HSPS-LST | 0.147 | 4.341 | <0.001 | 0.031 | 0.083 | |
| Variables | Beta | t | Sig. | CI 95% | Adjusted-R2 | |
|---|---|---|---|---|---|---|
| Lower Bound | Upper Bound | |||||
| HSPS-LST | 0.225 | 5.595 | <0.001 | 0.065 | 0.136 | 0.128 |
| HSPS-EOE | 0.171 | 4.256 | <0.001 | 0.026 | 0.069 | |
| Variables | Beta | t | Sig. | CI 95% | Adjusted-R2 | |
|---|---|---|---|---|---|---|
| Lower Bound | Upper Bound | |||||
| HSPS-AES | 0.273 | 7.565 | <0.001 | 0.104 | 0.178 | 0.164 |
| HSPS-LST | 0.108 | 2.720 | 0.007 | 0.013 | 0.079 | |
| HSPS-EOE | 0.104 | 2.430 | 0.015 | 0.005 | 0.049 | |
References
- Calvin, K.; Dasgupta, D.; Krinner, G.; Mukherji, A.; Thorne, P.W.; Trisos, C.; Romero, J.; Aldunce, P.; Barrett, K.; Blanco, G.; et al. Climate Change 2023: Synthesis Report. Contribution of Working Groups I, II and III to the Sixth Assessment Report of the Intergovernmental Panel on Climate Change, 1st ed.; Core Writing Team, Lee, H., Romero, J., Eds.; Intergovernmental Panel on Climate Change (IPCC): Geneva, Switzerland, 2023. [Google Scholar]
- Watts, N.; Adger, W.N.; Agnolucci, P.; Blackstock, J.; Byass, P.; Cai, W.; Chaytor, S.; Colbourn, T.; Collins, M.; Cooper, A.; et al. Health and Climate Change: Policy Responses to Protect Public Health. Lancet 2015, 386, 1861–1914. [Google Scholar] [CrossRef] [PubMed]
- United Nations Framework Convention on Climate Change. COP 28 Outcomes and Decisions. 2023. Available online: https://unfccc.int/cop28/5-key-takeaways (accessed on 11 April 2025).
- Steinfeld, H.; Gerber, P.; Wassenaar, T.D.; Castel, V.; Rosales, M.M.; de Haan, C. Livestock’s Long Shadow: Environmental Issues and Options; Food and Agriculture Organization of the United Nations: Rome, Italy, 2006; ISBN 978-92-5-105571-7. [Google Scholar]
- Tukker, A.; Jansen, B. Environmental Impacts of Products: A Detailed Review of Studies. J. Ind. Ecol. 2006, 10, 159–182. [Google Scholar] [CrossRef]
- Cook, J.; Oreskes, N.; Doran, P.T.; Anderegg, W.R.L.; Verheggen, B.; Maibach, E.W.; Carlton, J.S.; Lewandowsky, S.; Skuce, A.G.; Green, S.A.; et al. Consensus on Consensus: A Synthesis of Consensus Estimates on Human-Caused Global Warming. Environ. Res. Lett. 2016, 11, 048002. [Google Scholar] [CrossRef]
- Lynas, M.; Houlton, B.Z.; Perry, S. Greater than 99% Consensus on Human Caused Climate Change in the Peer-Reviewed Scientific Literature. Environ. Res. Lett. 2021, 16, 114005. [Google Scholar] [CrossRef]
- Edo, G.I.; Itoje-akpokiniovo, L.O.; Obasohan, P.; Ikpekoro, V.O.; Samuel, P.O.; Jikah, A.N.; Nosu, L.C.; Ekokotu, H.A.; Ugbune, U.; Oghroro, E.E.A.; et al. Impact of Environmental Pollution from Human Activities on Water, Air Quality and Climate Change. Ecol. Front. 2024, 44, 874–889. [Google Scholar] [CrossRef]
- Kurniawan, T.A.; Meidiana, C.; Goh, H.H.; Zhang, D.; Othman, M.H.D.; Aziz, F.; Anouzla, A.; Sarangi, P.K.; Pasaribu, B.; Ali, I. Unlocking Synergies between Waste Management and Climate Change Mitigation to Accelerate Decarbonization through Circular-Economy Digitalization in Indonesia. Sustain. Prod. Consum. 2024, 46, 522–542. [Google Scholar] [CrossRef]
- Bell, M.L.; Gasparrini, A.; Benjamin, G.C. Climate Change, Extreme Heat, and Health. N. Engl. J. Med. 2024, 390, 1793–1801. [Google Scholar] [CrossRef]
- Burrows, K.; Denckla, C.A.; Hahn, J.; Schiff, J.E.; Okuzono, S.S.; Randriamady, H.; Mita, C.; Kubzansky, L.D.; Koenen, K.C.; Lowe, S.R. A Systematic Review of the Effects of Chronic, Slow-Onset Climate Change on Mental Health. Nat. Ment. Health 2024, 2, 228–243. [Google Scholar] [CrossRef]
- Gianfredi, V.; Mazziotta, F.; Clerici, G.; Astorri, E.; Oliani, F.; Cappellina, M.; Catalini, A.; Dell’Osso, B.M.; Pregliasco, F.E.; Castaldi, S.; et al. Climate Change Perception and Mental Health. Results from a Systematic Review of the Literature. Eur. J. Investig. Health Psychol. Educ. 2024, 14, 215–229. [Google Scholar] [CrossRef]
- Le Souëf, P.N.; Adachi, Y.; Anastasiou, E.; Ansotegui, I.J.; Badellino, H.A.; Banzon, T.; Beltrán, C.P.; D’Amato, G.; El-Sayed, Z.A.; Gómez, R.M.; et al. Global Change, Climate Change, and Asthma in Children: Direct and Indirect Effects—A WAO Pediatric Asthma Committee Report. World Allergy Organ. J. 2024, 17, 100988. [Google Scholar] [CrossRef]
- Radua, J.; De Prisco, M.; Oliva, V.; Fico, G.; Vieta, E.; Fusar-Poli, P. Impact of Air Pollution and Climate Change on Mental Health Outcomes: An Umbrella Review of Global Evidence. World Psychiatry 2024, 23, 244–256. [Google Scholar] [CrossRef] [PubMed]
- Pihkala, P. Anxiety and the Ecological Crisis: An Analysis of Eco-Anxiety and Climate Anxiety. Sustainability 2020, 12, 7836. [Google Scholar] [CrossRef]
- Albrecht, G. Chronic Environmental Change: Emerging ‘Psychoterratic’ Syndromes. In Climate Change and Human Well-Being; Weissbecker, I., Ed.; International and Cultural Psychology; Springer New York: New York, NY, USA, 2011; pp. 43–56. ISBN 978-1-4419-9741-8. [Google Scholar]
- Albrecht, G. Psychoterratic Conditions in a Scientific and Technological World. In Ecopsychology: Science, Totems, and the Technological Species; Kahn, P.H., Hasbach, P.H., Eds.; MIT Press: Cambridge, UK, 2012; pp. 241–264. [Google Scholar]
- Mental Health and Our Changing Climate|CiNii Research. Available online: https://cir.nii.ac.jp/crid/1881147691479873536 (accessed on 8 May 2025).
- Clayton, S.; Karazsia, B.T. Development and Validation of a Measure of Climate Change Anxiety. J. Environ. Psychol. 2020, 69, 101434. [Google Scholar] [CrossRef]
- Hogg, T.L.; Stanley, S.K.; O’Brien, L.V.; Wilson, M.S.; Watsford, C.R. The Hogg Eco-Anxiety Scale: Development and Validation of a Multidimensional Scale. Glob. Environ. Change 2021, 71, 102391. [Google Scholar] [CrossRef]
- Rocchi, G.; Pileri, J.; Luciani, F.; Gennaro, A.; Lai, C. Insights into Eco-Anxiety in Italy: Preliminary Psychometric Properties of the Italian Version of the Hogg Eco-Anxiety Scale, Age and Gender Distribution. J. Environ. Psychol. 2023, 92, 102180. [Google Scholar] [CrossRef]
- Verplanken, B.; Marks, E.; Dobromir, A.I. On the Nature of Eco-Anxiety: How Constructive or Unconstructive Is Habitual Worry about Global Warming? J. Environ. Psychol. 2020, 72, 101528. [Google Scholar] [CrossRef]
- Stanley, S.K.; Hogg, T.L.; Leviston, Z.; Walker, I. From Anger to Action: Differential Impacts of Eco-Anxiety, Eco-Depression, and Eco-Anger on Climate Action and Wellbeing. J. Clim. Change Health 2021, 1, 100003. [Google Scholar] [CrossRef]
- Schwartz, S.E.O.; Benoit, L.; Clayton, S.; Parnes, M.F.; Swenson, L.; Lowe, S.R. Climate Change Anxiety and Mental Health: Environmental Activism as Buffer. Curr. Psychol. 2023, 42, 16708–16721. [Google Scholar] [CrossRef]
- Innocenti, M.; Santarelli, G.; Lombardi, G.S.; Ciabini, L.; Zjalic, D.; Di Russo, M.; Cadeddu, C. How Can Climate Change Anxiety Induce Both Pro-Environmental Behaviours and Eco-Paralysis? The Mediating Role of General Self-Efficacy. Int. J. Environ. Res. Public. Health 2023, 20, 3085. [Google Scholar] [CrossRef]
- Pavani, J.-B.; Nicolas, L.; Bonetto, E. Eco-Anxiety Motivates pro-Environmental Behaviors: A Two-Wave Longitudinal Study. Motiv. Emot. 2023, 47, 1062–1074. [Google Scholar] [CrossRef]
- Duradoni, M.; Fiorenza, M.; Bellotti, M.; Severino, F.P.; Valdrighi, G.; Guazzini, A. Highly Sensitive People and Nature: Identity, Eco-Anxiety, and Pro-Environmental Behaviors. Sustainability 2025, 17, 2740. [Google Scholar] [CrossRef]
- Ellis, B.J.; Boyce, W.T. Biological Sensitivity to Context. Curr. Dir. Psychol. Sci. 2008, 17, 183–187. [Google Scholar] [CrossRef]
- Aron, E.N.; Aron, A. Sensory-processing sensitivity and its relation to introversion and emotionality. J. Pers. Soc. Psychol. 1997, 73, 345–368. [Google Scholar] [CrossRef] [PubMed]
- Setti, A.; Lionetti, F.; Kagari, R.L.; Motherway, L.; Pluess, M. The Temperament Trait of Environmental Sensitivity Is Associated with Connectedness to Nature and Affinity to Animals. Heliyon 2022, 8, e09861. [Google Scholar] [CrossRef]
- Kals, E.; Schumacher, D.; Montada, L. Emotional Affinity toward Nature as a Motivational Basis to Protect Nature. Environ. Behav. 1999, 31, 178–202. [Google Scholar] [CrossRef]
- Kurth, C.; Pihkala, P. Eco-Anxiety: What It Is and Why It Matters. Front. Psychol. 2022, 13, 981814. [Google Scholar] [CrossRef]
- Dunne, H.; Lionetti, F.; Pluess, M.; Setti, A. Individual Traits Are Associated with Pro-environmental Behaviour: Environmental Sensitivity, Nature Connectedness and Consideration for Future Consequences. People Nat. 2024, 6, 586–597. [Google Scholar] [CrossRef]
- Pruneau, D.; Doyon, A.; Langis, J.; Vasseur, L.; Ouellet, E.; McLaughlin, E.; Boudreau, G.; Martin, G. When Teachers Adopt Environmental Behaviors in the Aim of Protecting the Climate. J. Environ. Educ. 2006, 37, 3–12. [Google Scholar] [CrossRef]
- Masud, M.M.; Akhtar, R.; Afroz, R.; Al-Amin, A.Q.; Kari, F.B. Pro-Environmental Behavior and Public Understanding of Climate Change. Mitig. Adapt. Strateg. Glob. Change 2015, 20, 591–600. [Google Scholar] [CrossRef]
- DiClemente, C.C.; Prochaska, J.O. Self-Change and Therapy Change of Smoking Behavior: A Comparison of Processes of Change in Cessation and Maintenance. Addict. Behav. 1982, 7, 133–142. [Google Scholar] [CrossRef]
- Prochaska, J.O.; DiClemente, C.C. Stages and Processes of Self-Change of Smoking: Toward an Integrative Model of Change. J. Consult. Clin. Psychol. 1983, 51, 390–395. [Google Scholar] [CrossRef] [PubMed]
- Self-Efficacy: Thought Control of Action; Schwarzer, R., Ed.; Hemisphere Pub. Corp: Washington, DC, USA, 1992; ISBN 978-1-56032-269-6. [Google Scholar]
- Weinstein, N.D. Testing Four Competing Theories of Health-Protective Behavior. Health Psychol. 1993, 12, 324–333. [Google Scholar] [CrossRef] [PubMed]
- Sutton, S. Predicting and Explaining Intentions and Behavior: How Well Are We Doing? J. Appl. Soc. Psychol. 1998, 28, 1317–1338. [Google Scholar] [CrossRef]
- Armitage, C.J.; Conner, M. Social Cognition Models and Health Behaviour: A Structured Review. Psychol. Health 2000, 15, 173–189. [Google Scholar] [CrossRef]
- Velicer, W.; Prochaska, J.; Redding, C. Tailored Communications for Smoking Cessation: Past Successes and Future Directions. Drug Alcohol Rev. 2006, 25, 49–57. [Google Scholar] [CrossRef]
- Weinstein, N.D. Misleading Tests of Health Behavior Theories. Ann. Behav. Med. 2007, 33, 1–10. [Google Scholar] [CrossRef]
- Duradoni, M.; Valdrighi, G.; Donati, A.; Fiorenza, M.; Puddu, L.; Guazzini, A. Development and Validation of the Readiness to Change Scale (RtC) for Sustainability. Sustainability 2024, 16, 4519. [Google Scholar] [CrossRef]
- Duradoni, M.; Baroni, M.; Valdrighi, G.; Guazzini, A. Readiness to Change and Pro-Environmental Transportation Behaviors: A Multidimensional and Gender-Sensitive Analysis. Sustainability 2025, 17, 3021. [Google Scholar] [CrossRef]
- Schwarzer, R. Modeling Health Behavior Change: How to Predict and Modify the Adoption and Maintenance of Health Behaviors. Appl. Psychol. 2008, 57, 1–29. [Google Scholar] [CrossRef]
- Ajzen, I. From Intentions to Actions: A Theory of Planned Behavior. In Action Control; Kuhl, J., Beckmann, J., Eds.; Springer: Berlin/Heidelberg, Germany, 1985; pp. 11–39. ISBN 978-3-642-69748-7. [Google Scholar]
- Ajzen, I. The Theory of Planned Behavior. Organ. Behav. Hum. Decis. Process 1991, 50, 179–211. [Google Scholar] [CrossRef]
- Rogers, R. Cognitive and Psychological Processes in Fear Appeals and Attitude Change. A Revised Theory of Protection Motivation. In Social Psychology: A Sourcebook; The Guilford Press: New York, NY, USA, 1983; pp. 153–176. [Google Scholar]
- Sheeran, P. Intention—Behavior Relations: A Conceptual and Empirical Review. Eur. Rev. Soc. Psychol. 2002, 12, 1–36. [Google Scholar] [CrossRef]
- Bandura, A. Cultivate Self-Efficacy for Personal and Organizational Effectiveness. In Principles of Organizational Behavior; Locke, E., Pearce, C., Eds.; Wiley: Hoboken, NJ, USA, 2023; pp. 113–135. ISBN 978-1-119-82854-9. [Google Scholar]
- Weinstein, N.D.; Rothman, A.J.; Sutton, S.R. Stage Theories of Health Behavior: Conceptual and Methodological Issues. Health Psychol. 1998, 17, 290–299. [Google Scholar] [CrossRef] [PubMed]
- Prescott, P.A.; Soeken, K.L.; Griggs, M. Identification and Referral of Hospitalized Patients in Need of Home Care. Res. Nurs. Health 1995, 18, 85–95. [Google Scholar] [CrossRef] [PubMed]
- Rogan, F.; Shimed, V.; Barclay, L.; Everitt, L.; Wylli, A. ‘Becoming a Mother’—Developing a New Theory of Early Motherhood. J. Adv. Nurs. 1997, 25, 877–885. [Google Scholar] [CrossRef]
- Dalton, C.C.; Gottlieb, L.N. The Concept of Readiness to Change. J. Adv. Nurs. 2003, 42, 108–117. [Google Scholar] [CrossRef]
- Crites, S.L.; Fabrigar, L.R.; Petty, R.E. Measuring the Affective and Cognitive Properties of Attitudes: Conceptual and Methodological Issues. Pers. Soc. Psychol. Bull. 1994, 20, 619–634. [Google Scholar] [CrossRef]
- Holt, D.T.; Armenakis, A.A.; Feild, H.S.; Harris, S.G. Readiness for Organizational Change: The Systematic Development of a Scale. J. Appl. Behav. Sci. 2007, 43, 232–255. [Google Scholar] [CrossRef]
- Rafferty, A.E.; Jimmieson, N.L.; Armenakis, A.A. Change Readiness: A Multilevel Review. J. Manag. 2013, 39, 110–135. [Google Scholar] [CrossRef]
- Miller, W.R.; Tonigan, J.S. Assessing Drinkers’ Motivation for Change: The Stages of Change Readiness and Treatment Eagerness Scale (SOCRATES). In Addictive Behaviors: Readings on Etiology, Prevention, and Treatment.; Marlatt, G.A., VandenBos, G.R., Eds.; American Psychological Association: Washington, DC, USA, 1997; pp. 355–369. ISBN 978-1-55798-468-5. [Google Scholar]
- Zeng, J.; Jiang, M.; Yuan, M. Environmental Risk Perception, Risk Culture, and Pro-Environmental Behavior. Int. J. Environ. Res. Public. Health 2020, 17, 1750. [Google Scholar] [CrossRef]
- Van Valkengoed, A.M.; Steg, L. Meta-Analyses of Factors Motivating Climate Change Adaptation Behaviour. Nat. Clim. Change 2019, 9, 158–163. [Google Scholar] [CrossRef]
- Tagkaloglou, S.; Kasser, T. Increasing Collaborative, pro-Environmental Activism: The Roles of Motivational Interviewing, Self-Determined Motivation, and Self-Efficacy. J. Environ. Psychol. 2018, 58, 86–92. [Google Scholar] [CrossRef]
- Osbaldiston, R.; Sheldon, K.M. Promoting Internalized Motivation for Environmentally Responsible Behavior: A Prospective Study of Environmental Goals. J. Environ. Psychol. 2003, 23, 349–357. [Google Scholar] [CrossRef]
- Emery, D.N. Self-Affirmation, Self-Efficacy and Response-Efficacy in Relation to Pro-Environmental Behavior. Ph.D. Thesis, Towson University, Towson, MD, USA, 2013. [Google Scholar]
- Bradley, G.L.; Babutsidze, Z.; Chai, A.; Reser, J.P. The Role of Climate Change Risk Perception, Response Efficacy, and Psychological Adaptation in pro-Environmental Behavior: A Two Nation Study. J. Environ. Psychol. 2020, 68, 101410. [Google Scholar] [CrossRef]
- Shi, J.; Lu, C.; Wei, Z. Effects of Social Capital on Pro-Environmental Behaviors in Chinese Residents. Sustainability 2022, 14, 13855. [Google Scholar] [CrossRef]
- Yu, T.-K.; Chang, Y.-J.; Chang, I.-C.; Yu, T.-Y. A Pro-Environmental Behavior Model for Investigating the Roles of Social Norm, Risk Perception, and Place Attachment on Adaptation Strategies of Climate Change. Environ. Sci. Pollut. Res. 2019, 26, 25178–25189. [Google Scholar] [CrossRef]
- Lauren, N.; Fielding, K.S.; Smith, L.; Louis, W.R. You Did, so You Can and You Will: Self-Efficacy as a Mediator of Spillover from Easy to More Difficult pro-Environmental Behaviour. J. Environ. Psychol. 2016, 48, 191–199. [Google Scholar] [CrossRef]
- Van Der Werff, E.; Steg, L.; Keizer, K. I Am What I Am, by Looking Past the Present: The Influence of Biospheric Values and Past Behavior on Environmental Self-Identity. Environ. Behav. 2014, 46, 626–657. [Google Scholar] [CrossRef]
- Arli, D.; Tan, L.P.; Tjiptono, F.; Yang, L. Exploring Consumers’ Purchase Intention towards Green Products in an Emerging Market: The Role of Consumers’ Perceived Readiness. Int. J. Consum. Stud. 2018, 42, 389–401. [Google Scholar] [CrossRef]
- Tan, L.P.; Johnstone, M.-L.; Yang, L. Barriers to Green Consumption Behaviours: The Roles of Consumers’ Green Perceptions. Australas. Mark. J. 2016, 24, 288–299. [Google Scholar] [CrossRef]
- Pluess, M. Individual Differences in Environmental Sensitivity. Child Dev. Perspect. 2015, 9, 138–143. [Google Scholar] [CrossRef]
- Psychologiczne Aspekty Wysokiej Wrażliwości Człowieka: Koncepcje-Identyfikacja-Wsparcie: Podręcznik Akademicki; Machulska-Maziarczyk, B., Baryła-Matejczuk, M., Eds.; Monografie Wydziału Nauk o Człowieku; Wydanie pierwsze.; Innovatio Press: Lublin, Poland, 2023; ISBN 978-83-67550-05-5. [Google Scholar]
- Sobocko, K.; Zelenski, J.M. Trait Sensory-Processing Sensitivity and Subjective Well-Being: Distinctive Associations for Different Aspects of Sensitivity. Personal. Individ. Differ. 2015, 83, 44–49. [Google Scholar] [CrossRef]
- Şengül-İnal, G.; Kirimer-Aydinli, F.; Sümer, N. The Role of Attachment Insecurity and Big Five Traits on Sensory Processing Sensitivity. J. Psychol. 2018, 152, 497–514. [Google Scholar] [CrossRef] [PubMed]
- Smolewska, K.A.; McCabe, S.B.; Woody, E.Z. A Psychometric Evaluation of the Highly Sensitive Person Scale: The Components of Sensory-Processing Sensitivity and Their Relation to the BIS/BAS and “Big Five”. Personal. Individ. Differ. 2006, 40, 1269–1279. [Google Scholar] [CrossRef]
- Barragan-Jason, G.; Loreau, M.; De Mazancourt, C.; Singer, M.C.; Parmesan, C. Psychological and Physical Connections with Nature Improve Both Human Well-Being and Nature Conservation: A Systematic Review of Meta-Analyses. Biol. Conserv. 2023, 277, 109842. [Google Scholar] [CrossRef]
- Fishbein, M.; Ajzen, I. Belief, Attitude, Intention, and Behavior: An Introduction to Theory and Research. Philos. Rhetor. 1977, 10, 130–132. [Google Scholar]
- Priadi, A.; Fatria, E.; Nadiroh; Sarkawi, D.; Oktaviani, A. Environmental Citizenship Behavior (the Effect of Environmental Sensitivity, Knowledge of Ecology, Personal Investment in Environmental Issue, Locus of Control towards Students’ Environmental Citizenship Behavior). E3S Web Conf. 2018, 74, 08002. [Google Scholar] [CrossRef]
- Cheng, T.-M.; Wu, H.C. How Do Environmental Knowledge, Environmental Sensitivity, and Place Attachment Affect Environmentally Responsible Behavior? An Integrated Approach for Sustainable Island Tourism. J. Sustain. Tour. 2015, 23, 557–576. [Google Scholar] [CrossRef]
- Yayla, Ö.; Keskin, E.; Keles, H. The Relationship Between Environmental Sensitivity, Ecological Attitude, and the Ecological Product Purchasing Behaviour of Tourists. Eur. J. Tour. Hosp. Recreat. 2022, 12, 31–45. [Google Scholar] [CrossRef]
- Hogg, T.L.; Stanley, S.K.; O’Brien, L.V.; Watsford, C.R.; Walker, I. Clarifying the Nature of the Association between Eco-Anxiety, Wellbeing and pro-Environmental Behaviour. J. Environ. Psychol. 2024, 95, 102249. [Google Scholar] [CrossRef]
- Meyer, A. Is Unemployment Good for the Environment? Resour. Energy Econ. 2016, 45, 18–30. [Google Scholar] [CrossRef]
- Mesmer-Magnus, J.; Viswesvaran, C.; Wiernik, B.M. The Role of Commitment in Bridging the Gap between Organizational Sustainability and Environmental Sustainability. In Managing Human Resources for Environmental Sustainability; The SIOP Professional Practice Series; Jossey-Bass/Wiley: Hoboken, NJ, USA, 2012; pp. 155–186. ISBN 978-0-470-88720-2. [Google Scholar]
- Tian, H.; Liu, X. Pro-Environmental Behavior Research: Theoretical Progress and Future Directions. Int. J. Environ. Res. Public. Health 2022, 19, 6721. [Google Scholar] [CrossRef] [PubMed]
- Markle, G.L. Pro-Environmental Behavior: Does It Matter How It’s Measured? Development and Validation of the Pro-Environmental Behavior Scale (PEBS). Hum. Ecol. 2013, 41, 905–914. [Google Scholar] [CrossRef]
- Breiman, L.; Friedman, J.H.; Olshen, R.A.; Stone, C.J. Classification and Regression Trees, 1st ed; Routledge: London, UK, 2017; ISBN 978-1-315-13947-0. [Google Scholar]
- Han, S.; Kim, H.; Lee, Y.-S. Double Random Forest. Mach. Learn. 2020, 109, 1569–1586. [Google Scholar] [CrossRef]
- Han, S.; Williamson, B.D.; Fong, Y. Improving Random Forest Predictions in Small Datasets from Two-Phase Sampling Designs. BMC Med. Inform. Decis. Mak. 2021, 21, 322. [Google Scholar] [CrossRef]
- Multilevel Modeling of Educational Data; O’Connell, A.A., McCoach, D.B., Eds.; Quantitative methods in education and the behavioral sciences; IAP: Charlotte, NC, USA, 2008; ISBN 978-1-59311-684-2. [Google Scholar]
- Loperfido, N.; Tarpey, T. Some Remarks on the R2 for Clustering. Stat. Anal. Data Min. ASA Data Sci. J. 2018, 11, 135–148. [Google Scholar] [CrossRef]
- Hastie, T.; Friedman, J.; Tibshirani, R. The Elements of Statistical Learning: Data Mining, Inference, and Prediction, 2nd ed.; Springer Series in Statistics; Springer: Berlin/Heidelberg, Germany, 2009. [Google Scholar]
- Qi, Y. Random Forest for Bioinformatics. In Ensemble Machine Learning; Zhang, C., Ma, Y., Eds.; Springer New York: New York, NY, USA, 2012; pp. 307–323. ISBN 978-1-4419-9325-0. [Google Scholar]
- Cohen, J. Eta-Squared and Partial Eta-Squared in Fixed Factor Anova Designs. Educ. Psychol. Meas. 1973, 33, 107–112. [Google Scholar] [CrossRef]
- Dunn†, J.C. Well-Separated Clusters and Optimal Fuzzy Partitions. J. Cybern. 1974, 4, 95–104. [Google Scholar] [CrossRef]
- Calinski, T.; Harabasz, J. A Dendrite Method for Cluster Analysis. Commun. Stat.-Theory Methods 1974, 3, 1–27. [Google Scholar] [CrossRef]
- Schwarzer, R.; Lippke, S.; Luszczynska, A. Mechanisms of Health Behavior Change in Persons with Chronic Illness or Disability: The Health Action Process Approach (HAPA). Rehabil. Psychol. 2011, 56, 161–170. [Google Scholar] [CrossRef]
- Bouman, T.; Verschoor, M.; Albers, C.J.; Böhm, G.; Fisher, S.D.; Poortinga, W.; Whitmarsh, L.; Steg, L. When Worry about Climate Change Leads to Climate Action: How Values, Worry and Personal Responsibility Relate to Various Climate Actions. Glob. Environ. Change 2020, 62, 102061. [Google Scholar] [CrossRef]
- Ogunbode, C.A.; Doran, R.; Hanss, D.; Ojala, M.; Salmela-Aro, K.; Van Den Broek, K.L.; Bhullar, N.; Aquino, S.D.; Marot, T.; Schermer, J.A.; et al. Climate Anxiety, Wellbeing and pro-Environmental Action: Correlates of Negative Emotional Responses to Climate Change in 32 Countries. J. Environ. Psychol. 2022, 84, 101887. [Google Scholar] [CrossRef]
- Pihkala, P. The Process of Eco-Anxiety and Ecological Grief: A Narrative Review and a New Proposal. Sustainability 2022, 14, 16628. [Google Scholar] [CrossRef]
- Parreira, N.; Mouro, C. Living by the Sea: Place Attachment, Coastal Risk Perception, and Eco-Anxiety When Coping with Climate Change. Front. Psychol. 2023, 14, 1155635. [Google Scholar] [CrossRef] [PubMed]
- Lionetti, F.; Aron, A.; Aron, E.N.; Burns, G.L.; Jagiellowicz, J.; Pluess, M. Dandelions, Tulips and Orchids: Evidence for the Existence of Low-Sensitive, Medium-Sensitive and High-Sensitive Individuals. Transl. Psychiatry 2018, 8, 24. [Google Scholar] [CrossRef]
- Knight, A.J. “Bats, Snakes and Spiders, Oh My!” How Aesthetic and Negativistic Attitudes, and Other Concepts Predict Support for Species Protection. J. Environ. Psychol. 2008, 28, 94–103. [Google Scholar] [CrossRef]
- Diessner, R.; Niemiec, R.M. Can Beauty Save the World? Appreciation of Beauty Predicts Proenvironmental Behavior and Moral Elevation Better Than 23 Other Character Strengths. Ecopsychology 2023, 15, 93–109. [Google Scholar] [CrossRef]
- Carver, C.S.; White, T.L. Behavioral Inhibition, Behavioral Activation, and Affective Responses to Impending Reward and Punishment: The BIS/BAS Scales. J. Pers. Soc. Psychol. 1994, 67, 319–333. [Google Scholar] [CrossRef]
- Sheffield, D.; Butler, C.W.; Richardson, M. Improving Nature Connectedness in Adults: A Meta-Analysis, Review and Agenda. Sustainability 2022, 14, 12494. [Google Scholar] [CrossRef]
- Sinclair, A.H.; Cosme, D.; Lydic, K.; Reinero, D.A.; Carreras-Tartak, J.; Mann, M.E.; Falk, E.B. Behavioral Interventions Motivate Action to Address Climate Change. Proc. Natl. Acad. Sci. USA 2025, 122, e2426768122. [Google Scholar] [CrossRef]
- Ong, A.D.; Weiss, D.J. The Impact of Anonymity on Responses to Sensitive Questions. J. Appl. Soc. Psychol. 2000, 30, 1691–1708. [Google Scholar] [CrossRef]
- Bezdek, J.C.; Pal, N.R. Some New Indexes of Cluster Validity. IEEE Trans. Syst. Man Cybern. Part B Cybern. 1998, 28, 301–315. [Google Scholar] [CrossRef] [PubMed]
- Knight, K.W. Explaining Cross-National Variation in the Climate Change Concern Gender Gap: A Research Note. Soc. Sci. J. 2019, 56, 627–639. [Google Scholar] [CrossRef]
- Xiao, C.; McCright, A.M. A Test of the Biographical Availability Argument for Gender Differences in Environmental Behaviors. Environ. Behav. 2014, 46, 241–263. [Google Scholar] [CrossRef]
- Kowasch, M.; Cruz, J.P.; Reis, P.; Gericke, N.; Kicker, K. Climate Youth Activism Initiatives: Motivations and Aims, and the Potential to Integrate Climate Activism into ESD and Transformative Learning. Sustainability 2021, 13, 11581. [Google Scholar] [CrossRef]

| Percentage | |
|---|---|
| Educational level | |
| Primary school certificate | 0.3 |
| Middle school certificate | 2.3 |
| High school diploma | 57.7 |
| Bachelor’s Degree | 29.8 |
| Master’s Degree | 7.2 |
| University Master’s Program | 1.0 |
| Postgraduate specialization/PhD | 1.7 |
| Employment Status | |
| Employed | 24.3 |
| Unemployed | 2.6 |
| Student | 72.2 |
| Retired | 0.8 |
| Income | |
| Less than €10,000 | 1.0 |
| Between €10,000 and €40,000 | 59.0 |
| Between €40,000 and €70,000 | 31.4 |
| Between €70,000 and €120,000 | 6.4 |
| Instrument | Author(s) | Aim |
|---|---|---|
| Highly Sensitive Person Scale | Aron and Aron [29] Smolewska et al. [76] | Assessing sensitivity traits in terms of: (a) Ease of Excitation, (b) Aesthetic Sensitivity, and (c) Low Sensory Threshold. |
| The Readiness to Change Scale | Duradoni et al. [44] | Measuring dimensions of Readiness to Change, namely (a) perceived importance of the problem, (b) motivation, (c) self-efficacy, (d) effectiveness of the proposed solution, (e) social support, (f) action, and (g) perceived readiness. |
| Hogg Eco-Anxiety Scale | Hogg et al. [20] | Assessing eco-anxiety in terms of (a) affective symptoms, (b) rumination, (c) behavioral symptoms, and (d) anxiety for personal impact. |
| The Pro-environmental Behavior Scale | Markle [87] | Measuring pro-environmental behaviors such as (a) conservation, (b) environmental citizenship, (c) food, and (d) transportation. |
| Cluster | 1 | 2 | 3 | 4 | 5 | 6 | 7 |
|---|---|---|---|---|---|---|---|
| Size | 455 | 148 | 141 | 59 | 61 | 28 | 54 |
| Explained proportion within-cluster heterogeneity | 0.466 | 0.129 | 0.183 | 0.087 | 0.075 | 0.027 | 0.033 |
| Within sum of squares | 2658.355 | 734.819 | 1046.305 | 498.609 | 427.623 | 156.929 | 187.602 |
| Pearson’s γ | 0.371 | ||||||
| Dunn index | 0.078 | ||||||
| Entropy | 1.543 | ||||||
| Calinski-Harabasz index | 102.495 | ||||||
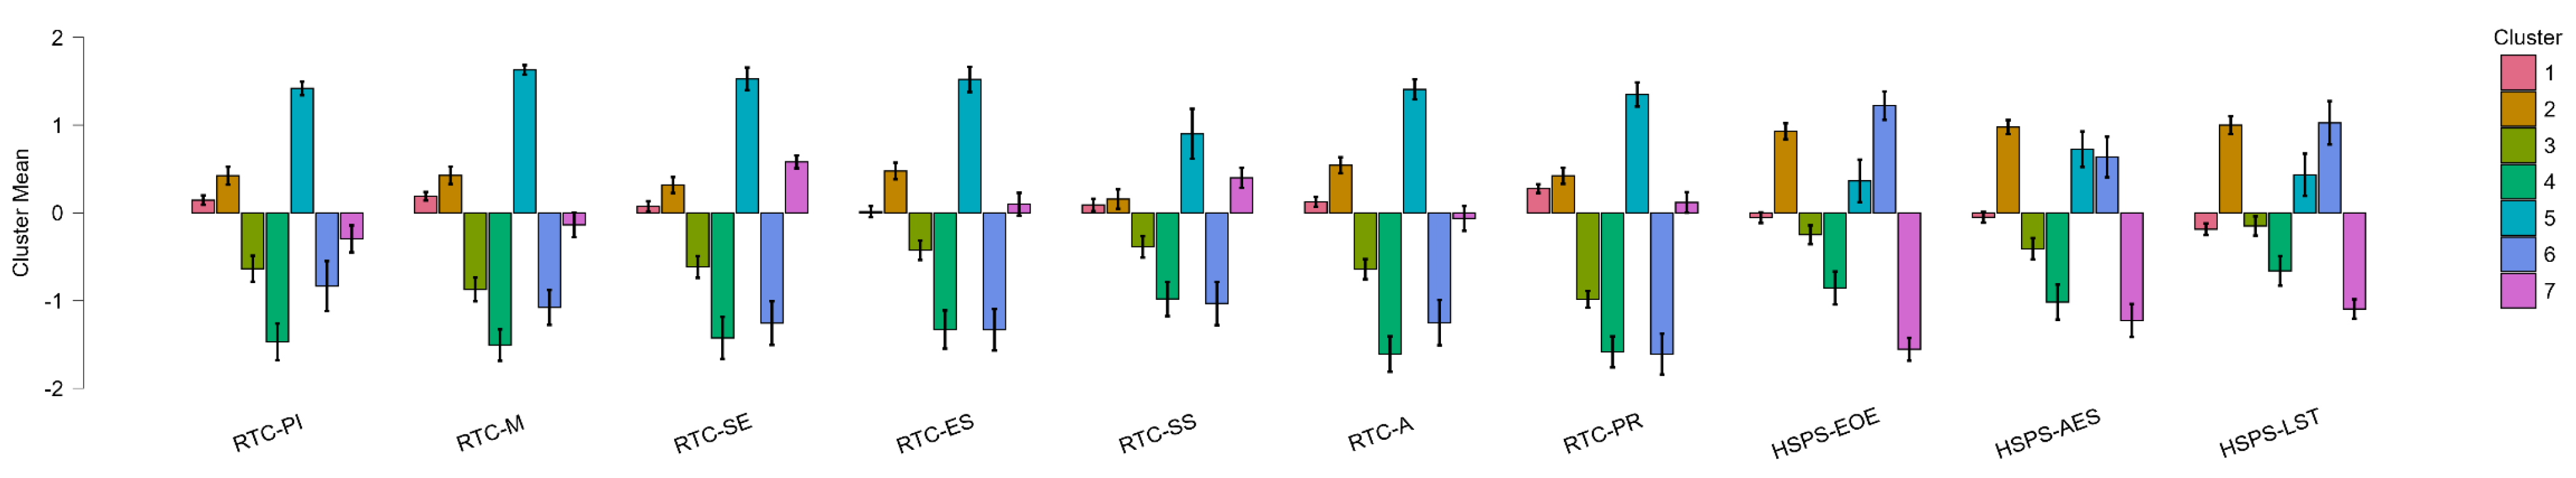
| RTC-PI | RTC-M | RTC-SE | RTC-ES | RTC-SS | RTC-A | RTC-PR | HSPS-EOE | HSPS-AES | HSPS-LST | |
|---|---|---|---|---|---|---|---|---|---|---|
| Cluster 1 | 0.146 | 0.190 | 0.076 | 0.015 | 0.091 | 0.126 | 0.277 | −0.054 | −0.050 | −0.185 |
| Cluster 2 | 0.424 | 0.428 | 0.318 | 0.478 | 0.158 | 0.543 | 0.423 | 0.930 | 0.977 | 1.000 |
| Cluster 3 | −0.636 | −0.872 | −0.616 | −0.426 | −0.386 | −0.641 | −0.984 | −0.248 | −0.408 | −0.148 |
| Cluster 4 | −1.469 | −1.506 | −1.425 | −1.329 | −0.981 | −1.609 | −1.585 | −0.856 | −1.017 | −0.660 |
| Cluster 5 | 1.419 | 1.630 | 1.527 | 1.521 | 0.901 | 1.408 | 1.349 | 0.364 | 0.726 | 0.434 |
| Cluster 6 | −0.833 | −1.077 | −1.255 | −1.332 | −1.032 | −1.250 | −1.610 | 1.222 | 0.637 | 1.027 |
| Cluster 7 | −0.295 | −0.136 | 0.582 | 0.099 | 0.400 | −0.062 | 0.119 | −1.554 | −1.226 | −1.094 |
| Mean Decrease in Gini Index | |
|---|---|
| HSPS-EOE | 116.559 |
| RTC-M | 104.388 |
| HSPS-LST | 101.586 |
| RTC-PI | 95.845 |
| RTC-PR | 94.026 |
| HSPS-AES | 93.166 |
| RTC-SE | 91.284 |
| RTC-A | 90.774 |
| RTC-ES | 82.064 |
| RTC-SS | 74.996 |
| F | p | η2 | 95% CI for η2 | ||
|---|---|---|---|---|---|
| Lower | Upper | ||||
| PEB-C | |||||
| Clusters | 16.900 | <0.001 | 0.099 | 0.061 | 0.132 |
| PEB-EC | |||||
| Clusters | 23.438 | <0.001 | 0.137 | 0.094 | 0.175 |
| PEB-F | |||||
| Clusters | 16.649 | <0.001 | 0.097 | 0.060 | 0.129 |
| PEB-T | |||||
| Clusters | 8.313 | <0.001 | 0.051 | 0.023 | 0.076 |
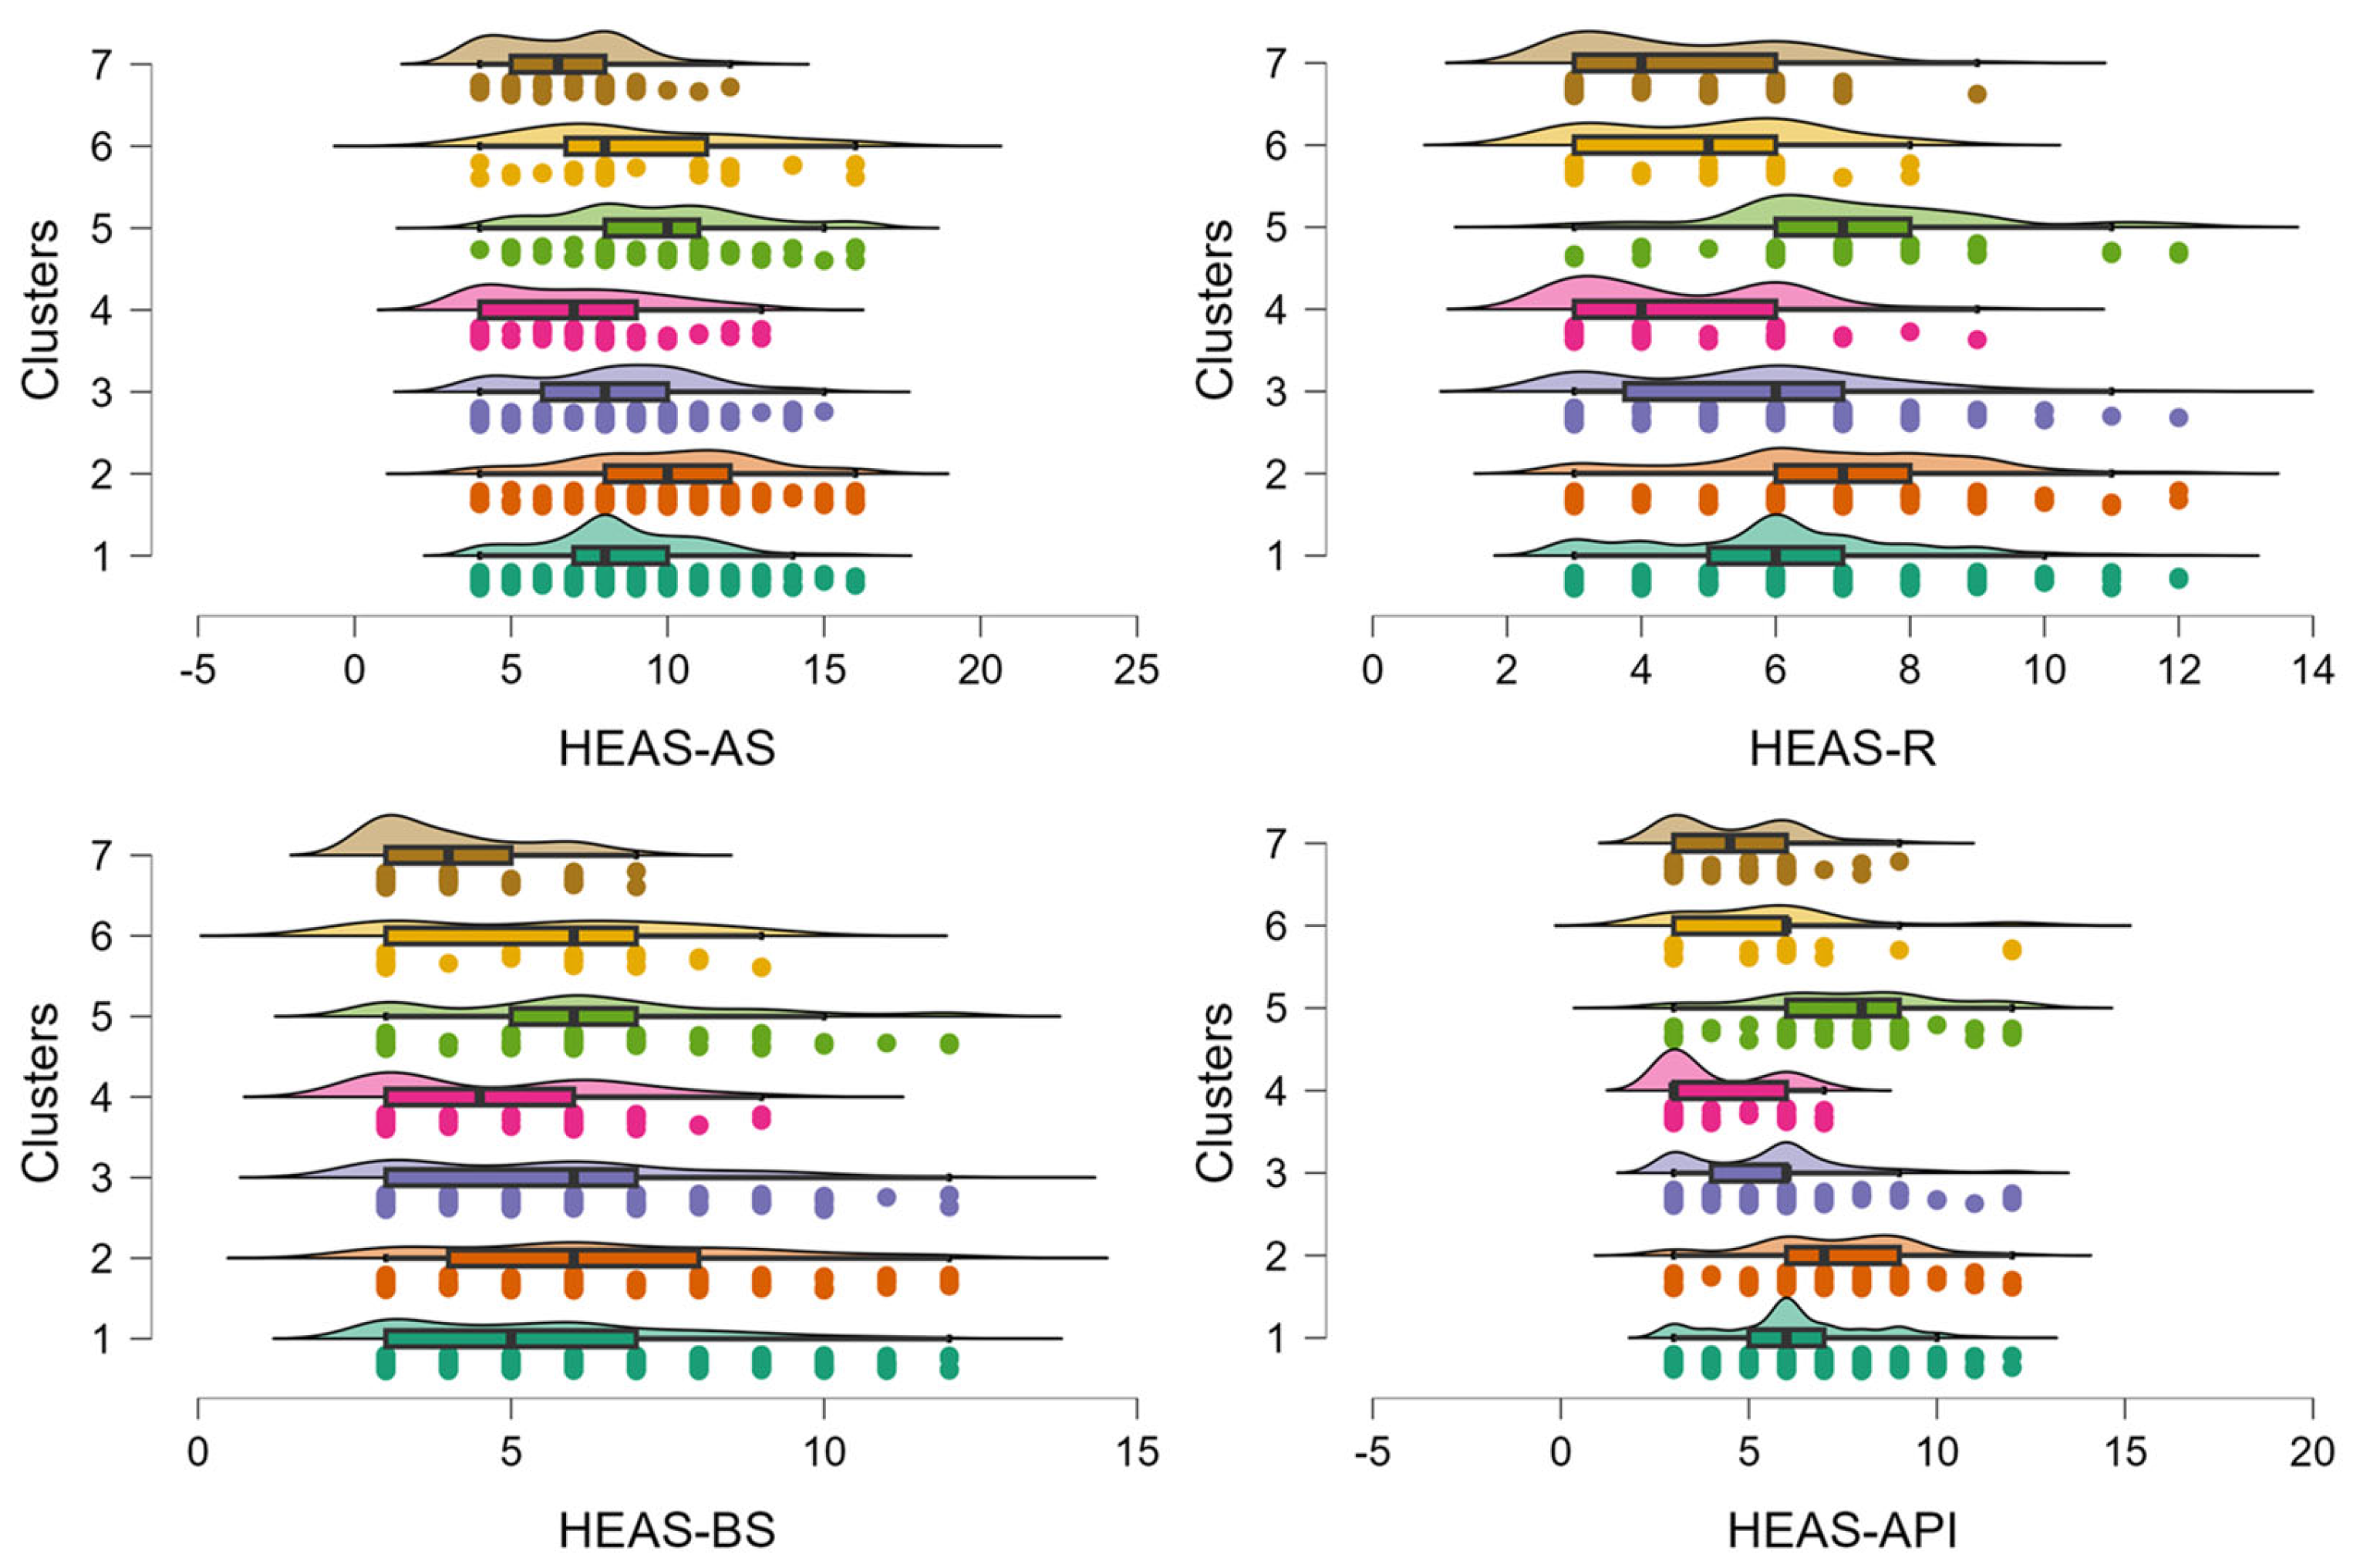
| F | p | η2 | 95% CI for η2 | ||
|---|---|---|---|---|---|
| Lower | Upper | ||||
| HEAS-AS | |||||
| Clusters | 16.397 | <0.001 | 0.096 | 0.059 | 0.128 |
| HEAS-R | |||||
| Clusters | 19.453 | <0.001 | 0.112 | 0.073 | 0.146 |
| HEAS-BS | |||||
| Clusters | 9.397 | <0.001 | 0.057 | 0.027 | 0.084 |
| HEAS-API | |||||
| Clusters | 28.043 | <0.001 | 0.154 | 0.110 | 0.193 |
Disclaimer/Publisher’s Note: The statements, opinions and data contained in all publications are solely those of the individual author(s) and contributor(s) and not of MDPI and/or the editor(s). MDPI and/or the editor(s) disclaim responsibility for any injury to people or property resulting from any ideas, methods, instructions or products referred to in the content. |
© 2025 by the authors. Licensee MDPI, Basel, Switzerland. This article is an open access article distributed under the terms and conditions of the Creative Commons Attribution (CC BY) license (https://creativecommons.org/licenses/by/4.0/).
Share and Cite
Baroni, M.; Valdrighi, G.; Guazzini, A.; Duradoni, M. Eco-Sensitive Minds: Clustering Readiness to Change and Environmental Sensitivity for Sustainable Engagement. Sustainability 2025, 17, 5662. https://doi.org/10.3390/su17125662
Baroni M, Valdrighi G, Guazzini A, Duradoni M. Eco-Sensitive Minds: Clustering Readiness to Change and Environmental Sensitivity for Sustainable Engagement. Sustainability. 2025; 17(12):5662. https://doi.org/10.3390/su17125662
Chicago/Turabian StyleBaroni, Marina, Giulia Valdrighi, Andrea Guazzini, and Mirko Duradoni. 2025. "Eco-Sensitive Minds: Clustering Readiness to Change and Environmental Sensitivity for Sustainable Engagement" Sustainability 17, no. 12: 5662. https://doi.org/10.3390/su17125662
APA StyleBaroni, M., Valdrighi, G., Guazzini, A., & Duradoni, M. (2025). Eco-Sensitive Minds: Clustering Readiness to Change and Environmental Sensitivity for Sustainable Engagement. Sustainability, 17(12), 5662. https://doi.org/10.3390/su17125662