Article

An Intelligent Management System and Advanced Analytics for Boosting Date Production

Department of Management Information Systems, School of Business, King Faisal University, Al-Ahsa 31982, Saudi Arabia
*
Author to whom correspondence should be addressed.
Sustainability 2025, 17(12), 5636; https://doi.org/10.3390/su17125636
Submission received: 3 May 2025 / Revised: 10 June 2025 / Accepted: 16 June 2025 / Published: 19 June 2025
(This article belongs to the Special Issue Sustainable Food Processing and Food Packaging Technologies)

Abstract

The date palm industry is a vital pillar of agricultural economies in arid and semi-arid regions; however, it remains vulnerable to challenges such as pest infestations, post-harvest diseases, and limited access to real-time monitoring tools. This study applied the baseline YOLOv11 model and its optimized variant, YOLOv11-Opt, to automate the detection, classification, and monitoring of date fruit varieties and disease-related defects. The models were trained on a curated dataset of real-world images collected in Saudi Arabia and enhanced through advanced data augmentation techniques, dynamic label assignment (SimOTA++), and extensive hyperparameter optimization. The experimental results demonstrated that YOLOv11-Opt significantly outperformed the baseline YOLOv11, achieving an overall classification accuracy of 99.04% for date types and 99.69% for disease detection, with ROC-AUC scores exceeding 99% in most cases. The optimized model effectively distinguished visually complex diseases, such as scale insert and dry date skin, across multiple date types, enabling high-resolution, real-time inference. Furthermore, a visual analytics dashboard was developed to support strategic decision-making by providing insights into production trends, disease prevalence, and varietal distribution. These findings underscore the value of integrating optimized deep learning architectures and visual analytics for intelligent, scalable, and sustainable precision agriculture.

1. Introduction

Date production plays a significant role in the agricultural economy of many countries, particularly in arid and semi-arid regions, where date palms are a key crop. Dates are a primary food source, rich in essential nutrients, and substantially contribute to food security, rural livelihoods, and national economies. The date industry is a significant foreign exchange earner; in regions with favorable growing conditions, it represents a substantial portion of agricultural income [1,2,3].
Beyond consumption as a food, dates have a wide range of applications in various industries, making them an essential resource worldwide. Dates are used in producing many food products such as juices, syrups, jams, and snacks, due to their rich natural sugars, fiber, and antioxidants [1,4]. The nutritional value of dates makes them a perfect ingredient in healthy foods like energy bars and baked goods, contributing to dietary health. Dates’ high sugar content also plays an essential role in processed foods, where they act as a natural sweetener [2,5]. Dates’ benefits extend beyond food, as they are increasingly recognized for their medicinal properties. Date seeds and extracts have been used in traditional medicine for centuries to treat various ailments such as digestive issues and heart conditions, and to boost energy levels [6,7,8].
Date extracts have garnered increasing interest in the pharmaceutical and cosmetic industries due to their bioactive properties. Studies have shown that dates possess anti-inflammatory, antioxidant, and antimicrobial compounds beneficial for cardiovascular health, immune function, and skin regeneration [2,9]. Date seeds, in particular, have demonstrated therapeutic potential for liver disorders and antimicrobial applications. Additionally, date-derived oils are widely used in cosmetic formulations for their moisturizing, anti-aging, and skin-repairing effects [10,11,12].
Moreover, dates are widely used in herbal supplements, with date palm pollen being a traditional remedy for boosting fertility and improving male reproductive health [9,10]. Dates also have potential applications in animal feed production, where they are mixed with other feed ingredients to provide nourishment to livestock, enhancing milk and meat production. In recent years, researchers have looked into the possibility of using dates for biofuel production, given their high sugar content, which makes them ideal for ethanol production [13].
The various cultivars of dates are characterized by unique nutritional profiles and bioactive compounds, which influence their suitability for different applications. The variability in attributes such as taste, texture, sugar content, and mineral composition plays a significant role in determining the specific health benefits and industrial uses of each variety. For example, Ajwa dates, grown primarily in Saudi Arabia, are known for their high content of antioxidants, polyphenols, and flavonoids, which contribute to their cardioprotective and anti-inflammatory effects [14]. On the other hand, Medjool dates, often called the ‘king of dates’, are renowned for their large size, sweetness, and high fiber content, making them beneficial for digestive health and energy metabolism [15]. Similarly, Deglet Noor dates, commonly found in North Africa and the United States, offer a mild sweetness and are rich in minerals such as potassium and magnesium, supporting heart health and muscle function [16]. Each type’s distinct features, whether it be tannin-rich Barhi dates suitable for skin regeneration or Zahidi dates with a lower glycemic index, highlight the importance of selecting the appropriate variety for specific health benefits and industrial applications [17].
Despite the nutritional and economic value of date fruits, they remain highly susceptible to various diseases and physiological disorders—such as black rot caused by Aspergillus niger [6], worm infestations by the Red Palm Weevil (Rhynchophorus ferrugineus) [18,19], scale insect attacks [19], and abiotic stresses such as dry skin due to poor irrigation or heat stress [10]. These factors significantly affect fruit quality, market value, and productivity. Conventional disease management relies on sanitation, fungicides, and environmental monitoring; however, early detection remains critical. Modern approaches leveraging drone imaging, remote sensing, and acoustic or biochemical sensors have improved detection rates [20,21].
Recent advances in artificial intelligence (AI), notably in deep learning architectures such as convolutional neural networks (CNNs), YOLO-based detectors, and Vision Transformers (ViTs), have significantly contributed to the advancement of precision agriculture. These technologies have been instrumental in automating disease identification, forecasting crop yields, and enabling real-time field surveillance [22,23,24,25].
CNN-based approaches have dominated plant disease recognition, offering robust feature extraction from complex backgrounds. Mohanty et al. applied CNNs for multi-crop disease classification, achieving over 99% accuracy on leaf imagery [22]. Similarly, ResNet50 and EfficientNet architectures have shown efficacy in high-precision detection of wheat rust and rice fungal infections using UAV and multispectral data [26,27]. To improve portability and real-time application, Chen et al. implemented MobileNetV3 with attention mechanisms in apple orchards, demonstrating efficient inference and precision under field conditions [28].
The emergence of Vision Transformers has enabled global attention modeling in plant pathology. Liu et al. compared ViTs with CNNs on grape disease datasets, finding ViTs superior under noise and occlusion [24]. In parallel, object detection frameworks like YOLOv7 and YOLOv8 have been deployed for rapid disease localization in the field. Ahmed et al. reported a high mAP in tomato disease detection using YOLOv7, while Khanam et al. fine-tuned YOLOv11 with the C3K2 and SPPF modules for accurate detection of date varieties and disease lesions [23,29].
Advanced analytics also play a pivotal role in crop health monitoring and resource optimization. Zafar demonstrated how IoT-integrated ML systems improved pest detection and irrigation control in smart farms [30]. LSTM-based models have outperformed regression techniques in predicting wheat yields using time-series weather data [31]. Karthik et al. used hyperspectral imaging with neural networks for early fungal detection in sugarcane, while Shahid et al. developed real-time analytics for nitrogen optimization in corn production [32,33].
Moreover, genomic data have been incorporated into predictive breeding frameworks. Al-Mssallem et al. mapped key loci associated with fruit sugar content and disease resistance in date palms, supporting marker-assisted selection [34]. In terms of transparency, explainable AI (XAI) methods such as Grad-CAM and SHAP have been used to visualize model reasoning in sensitive domains, including plant disease diagnostics [35,36].
Although significant progress has been made, substantial gaps persist in the current literature. Few studies have leveraged high-resolution, real-world datasets of date fruits and associated diseases collected under diverse field conditions. Most existing models concentrate on general crops, limiting their adaptability to specialized arid-zone horticulture, such as date palm farming. Moreover, fine-grained classification of specific disease types, including black rot, dry skin, and scale infestation, remains largely underexplored. While explainable AI techniques have been increasingly utilized in healthcare, their application to agricultural object detection tasks is still limited. To address these challenges, the present study proposes a YOLOv11-based framework, further optimized through YOLOv11-Opt, which incorporates dynamic label assignment strategies and strategic visual analytics. This approach offers a robust, interpretable, and scalable solution for intelligent disease detection and precision agriculture in date palm production systems.

2. Proposed Model

This study proposes an intelligent management system and advanced analytics framework to support precision agriculture in date production. The framework enhances disease detection and variety classification using a structured pipeline of data preprocessing, deep learning-based training, and performance evaluation. Figure 1 presents the overall workflow of the proposed system, as follows:
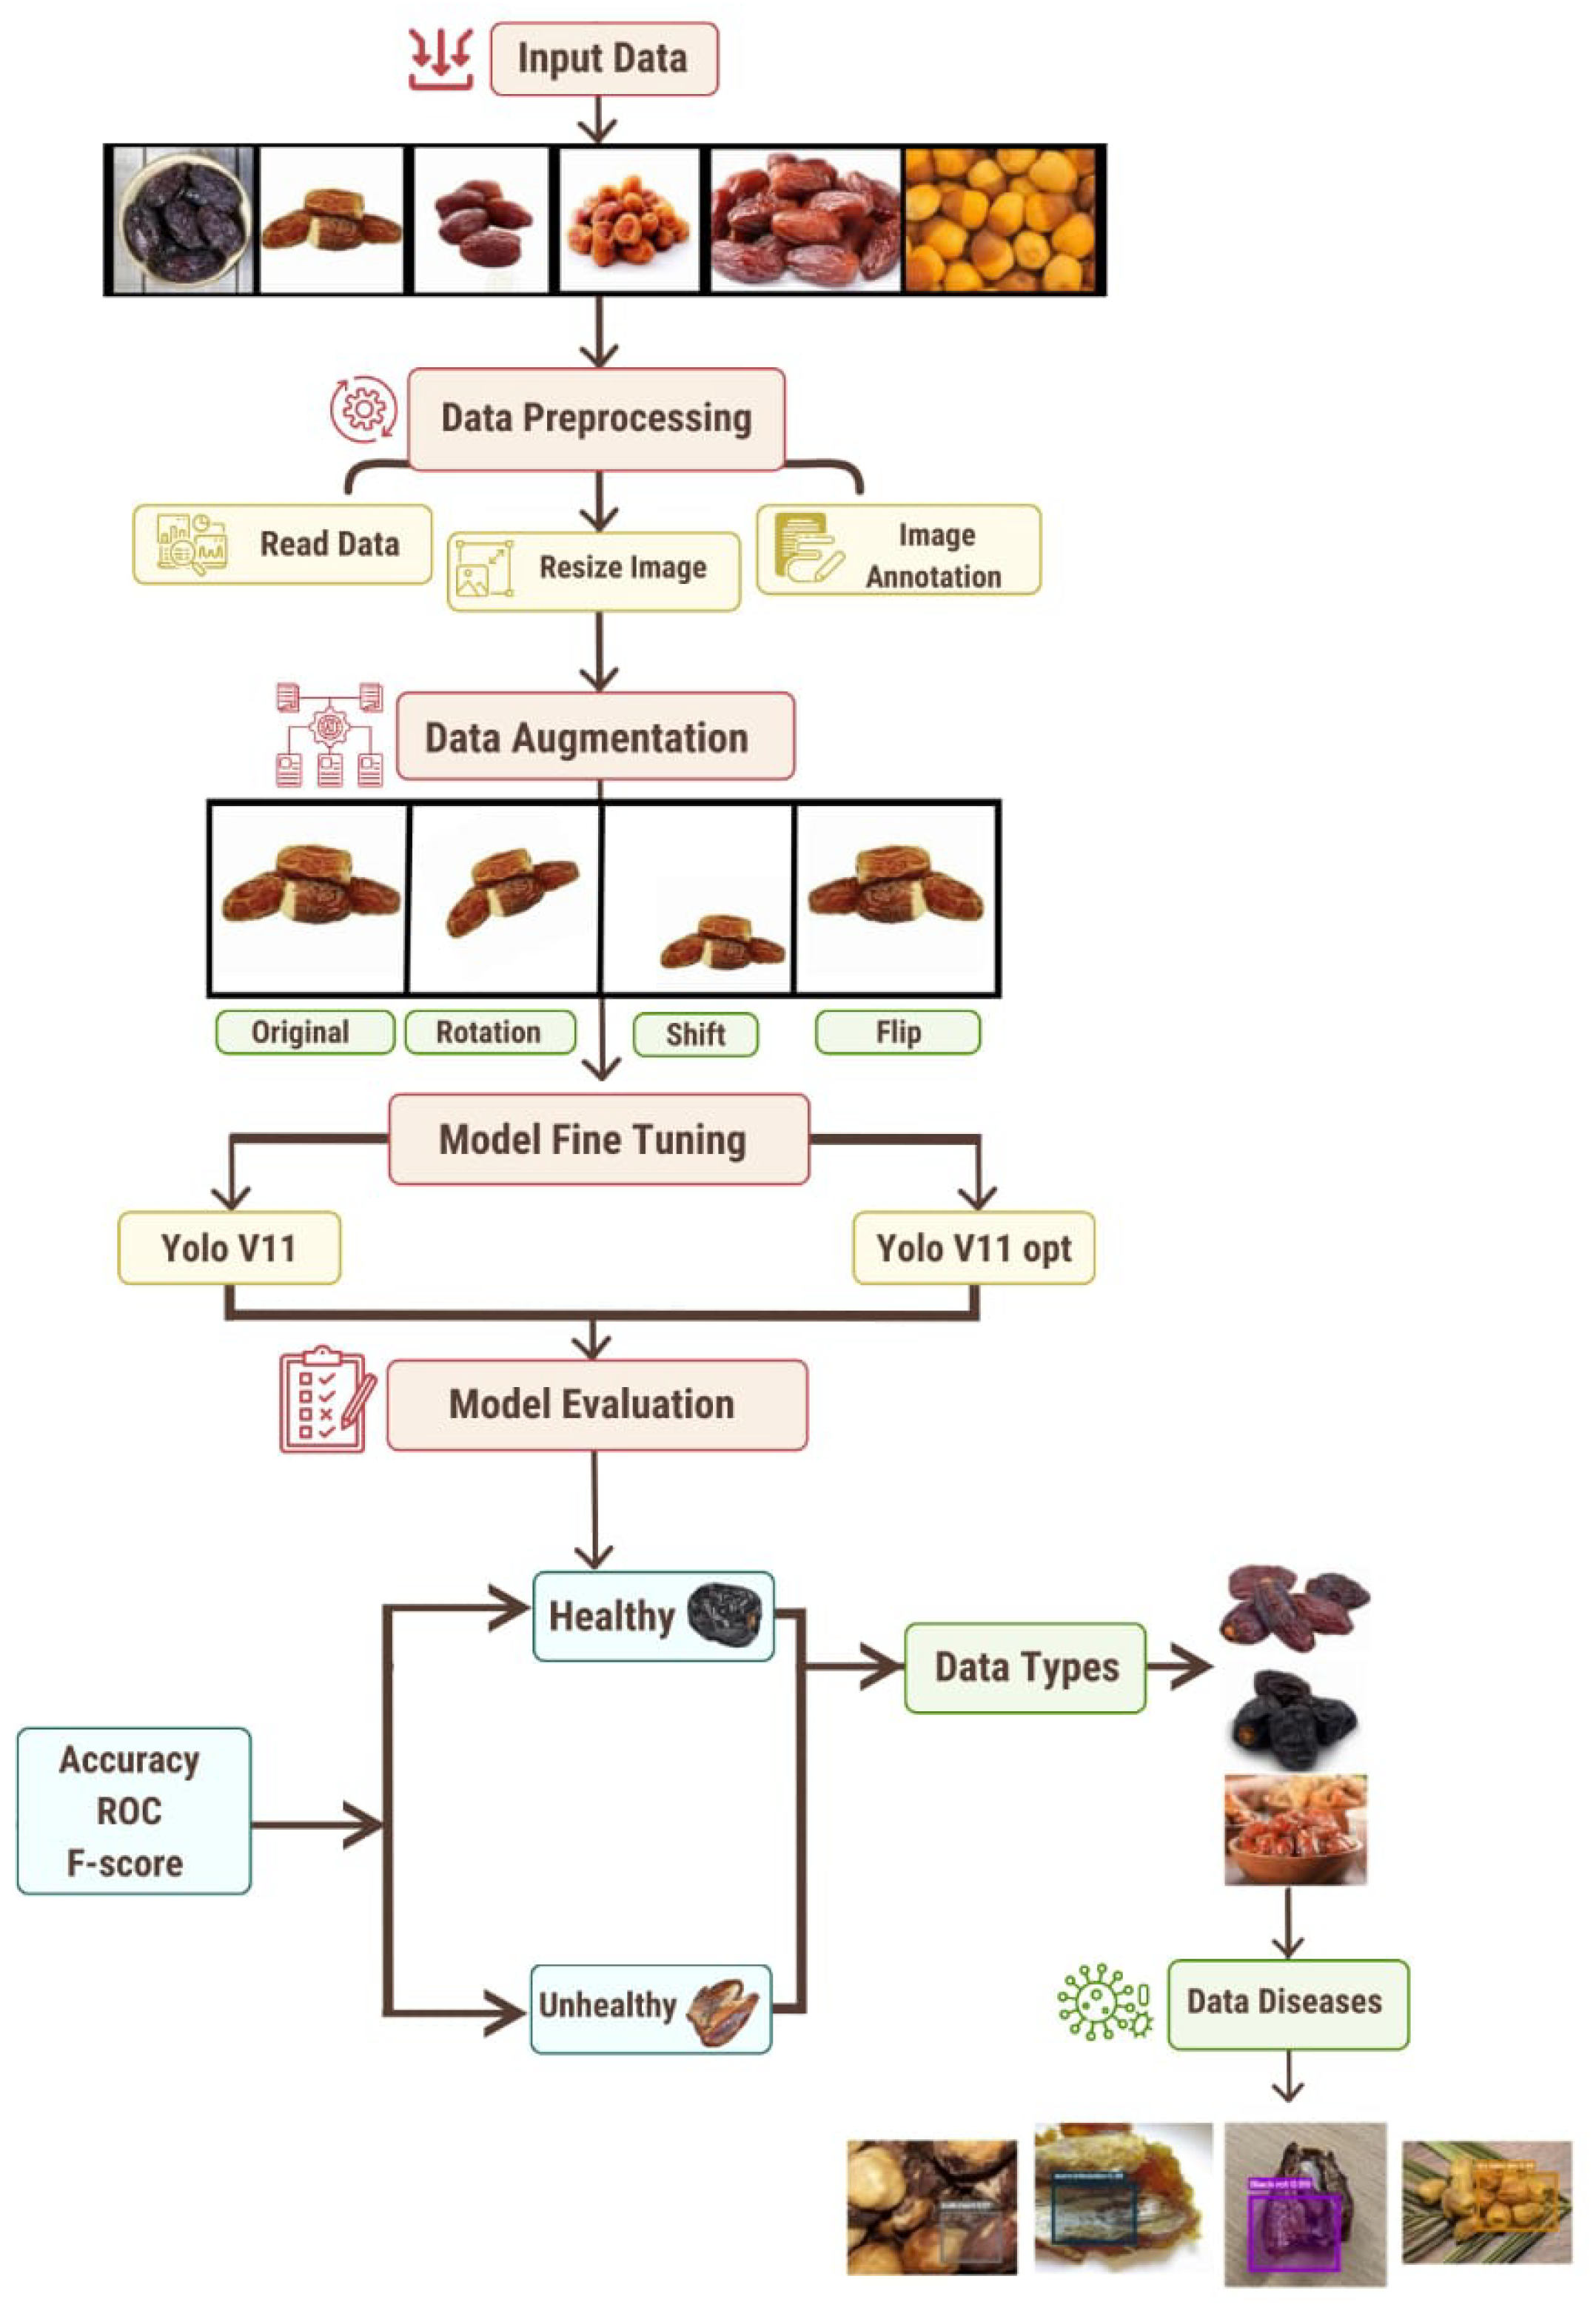
  • Input Data: This study is grounded on a curated dataset comprising 2482 high-resolution images of date fruits, encompassing a wide spectrum of phenotypes including healthy, diseased, and pathogen-affected samples. Such diversity in sample representation is critical for achieving generalizable feature extraction and robust model learning across heterogeneous conditions.
    To support systematic model development, the dataset was partitioned into three distinct subsets: training, validation, and testing. The training subset, containing 1737 images (70% of the dataset), was employed to facilitate the learning of discriminative patterns across various visual attributes. To fine-tune hyperparameters and monitor overfitting behavior, a validation set consisting of 372 samples (15%) was reserved. The final 373 samples (15%) were held back for the independent testing phase, ensuring an unbiased evaluation of the model’s generalization capabilities.
    This stratified data division preserved the class distribution across subsets and provided a rigorous foundation for training, optimizing, and assessing the proposed deep learning framework.
  • Data Preprocessing: The data preparation pipeline was designed to ensure uniformity, compatibility with deep learning architectures, and robustness to environmental variability. The following steps were implemented:
    Image Resizing: All images were resized to 640 × 640 pixels using bilinear interpolation. This standardized input size ensures compatibility with the YOLOv-based detection architecture, while preserving spatial structure.
    Color Space and Channel Handling: Images were loaded in RGB format. When necessary, conversions from OpenCV’s default BGR to RGB were performed.
    Pixel Normalization: Pixel intensity values were scaled to a [0, 1] range by dividing each channel by 255.
    Channel-Wise Standardization: Images were normalized using ImageNet-derived means [0.485, 0.456, 0.406] and standard deviations [0.229, 0.224, 0.225] to align with pretrained CNN backbones and enhance training stability.
    Dataset Partitioning: To ensure representative sampling and balanced class distribution, the dataset was proportionally segmented into training (70%), validation (15%), and testing (15%) subsets using stratified allocation.
  • Data Augmentation: To enhance model generalization under real-world variability, a diverse augmentation strategy was implemented using the Albumentations library (https://github.com/albumentations-team/albumentations (accessed on 1 May 2025)). Each original image was augmented to create five variants with randomized transformations, preserving semantic consistency while introducing noise and distortion. The following augmentation techniques were applied:
    Horizontal and vertical flipping to simulate camera orientation variability.
    Rotation (±30°), scaling, and shifting to replicate changes in viewpoint and framing.
    Brightness and contrast adjustments to mimic natural lighting changes, including overexposure and shadows.
    Gaussian blur and additive Gaussian noise to reflect dust interference or sensor imperfections.
    Coarse dropout to model occlusions caused by leaves, tools, or partial obstructions.
    All augmented images were saved in high-quality JPEG format to retain spatial fidelity. This structured preprocessing pipeline contributes to improved model robustness and generalizability in non-ideal deployment scenarios.
  • Model Fine-Tuning: The proposed framework employs two deep-learning-based object detection architectures: the standard YOLOv11 and an optimized variant, YOLOv11-opt. Both models were fine-tuned using the preprocessed and augmented dataset to capture domain-specific features relevant to date fruit classification and disease detection. The fine-tuning process involved adjusting the model weights through transfer learning, allowing the architectures to learn subtle variations in visual attributes such as texture, color distribution, morphological patterns, and disease symptoms. This targeted adaptation enhances the models’ sensitivity to inter-class distinctions among healthy, diseased, and varietal date types, thereby improving detection precision and classification accuracy within the agricultural domain.
    Stage 1—Health-Based Classification: In the initial classification stage, the fine-tuned models categorize the input date fruit images into two primary classes: healthy and unhealthy. This binary classification serves as the foundational step, enabling a structured hierarchical analysis. For images identified as healthy, the model classifies them into specific date varieties based on morphological and phenotypic characteristics. In contrast, images categorized as unhealthy are directed toward further pathological assessment.
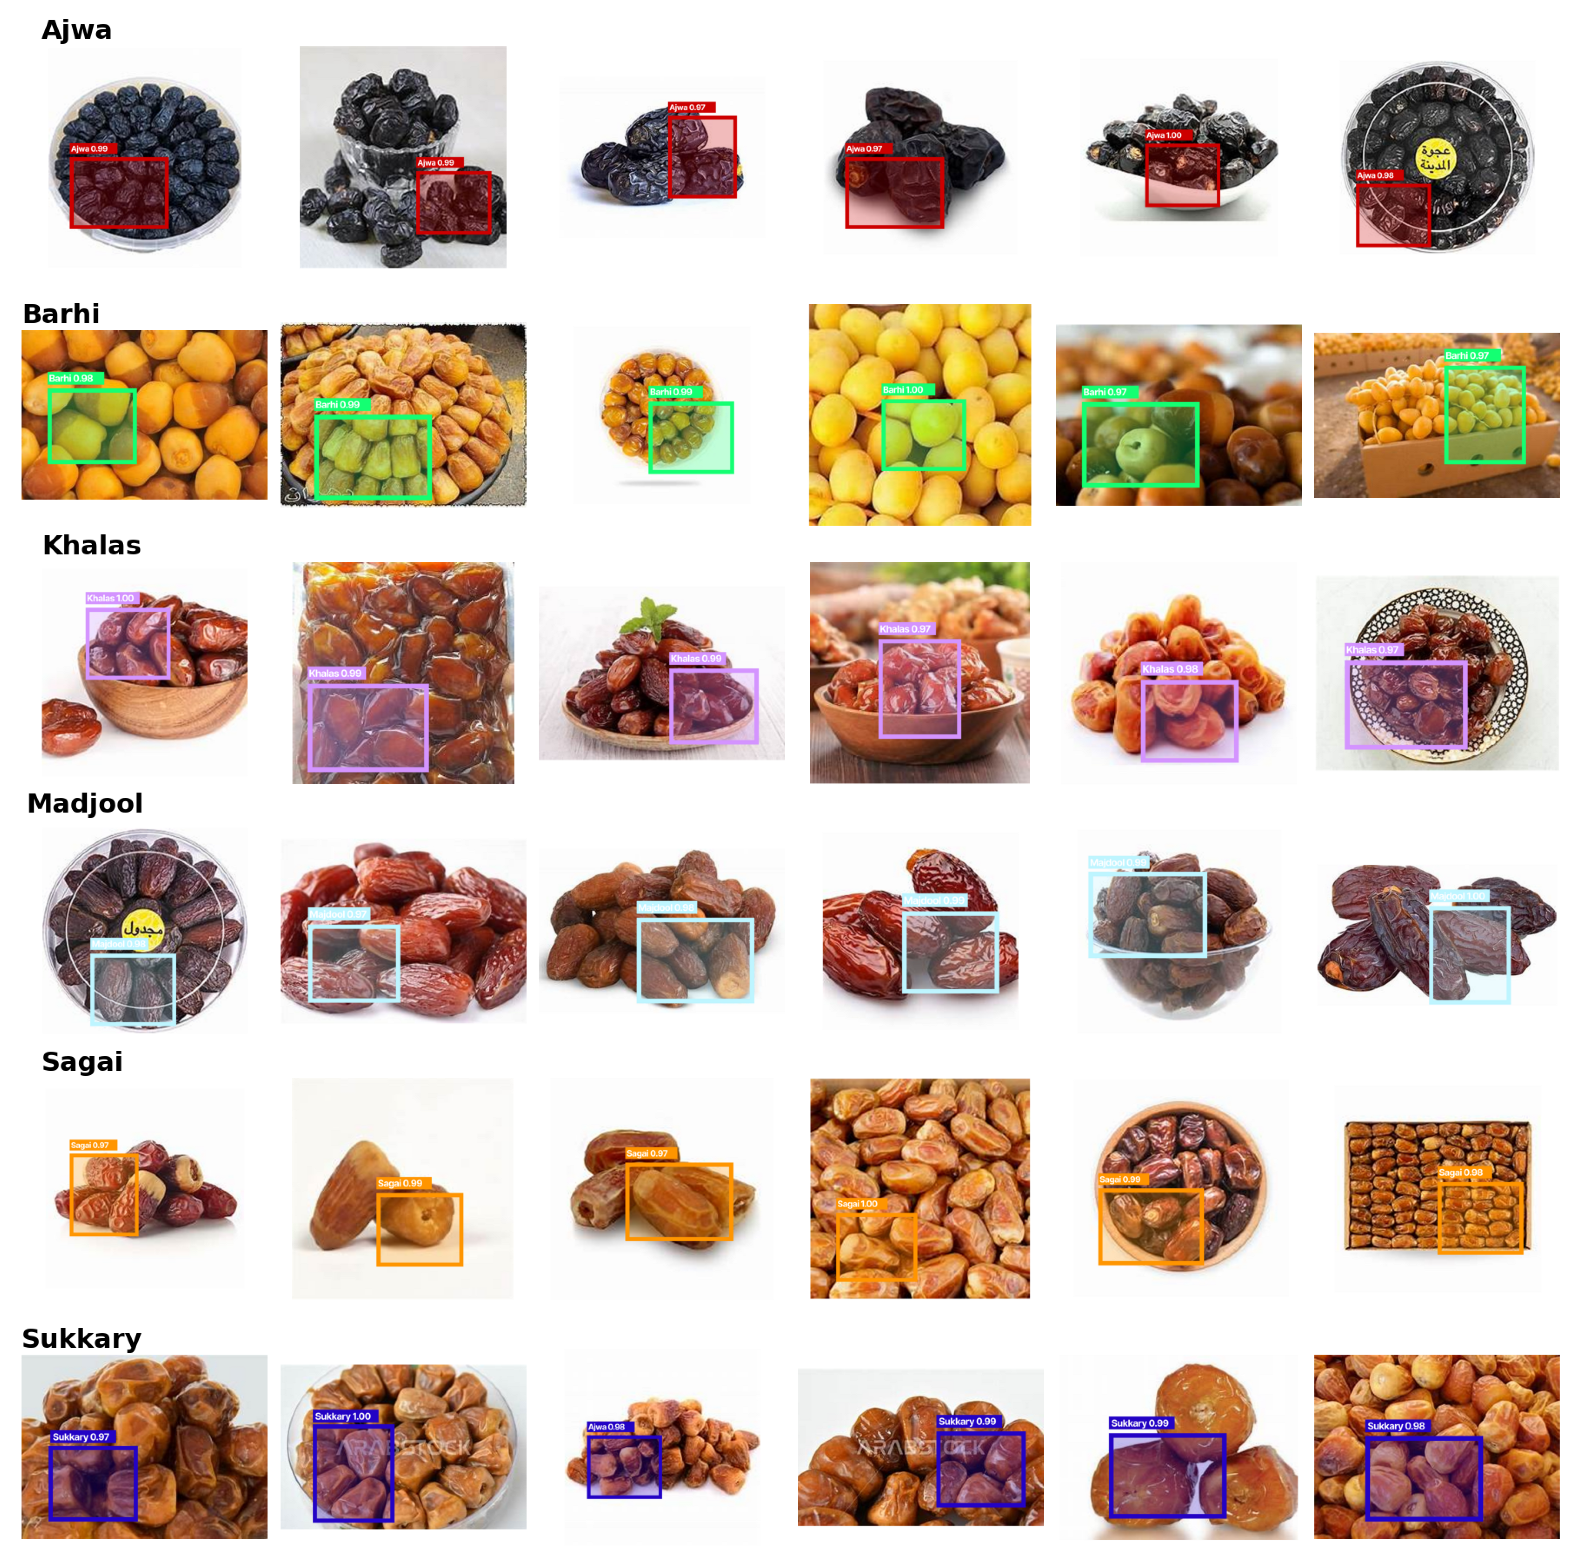
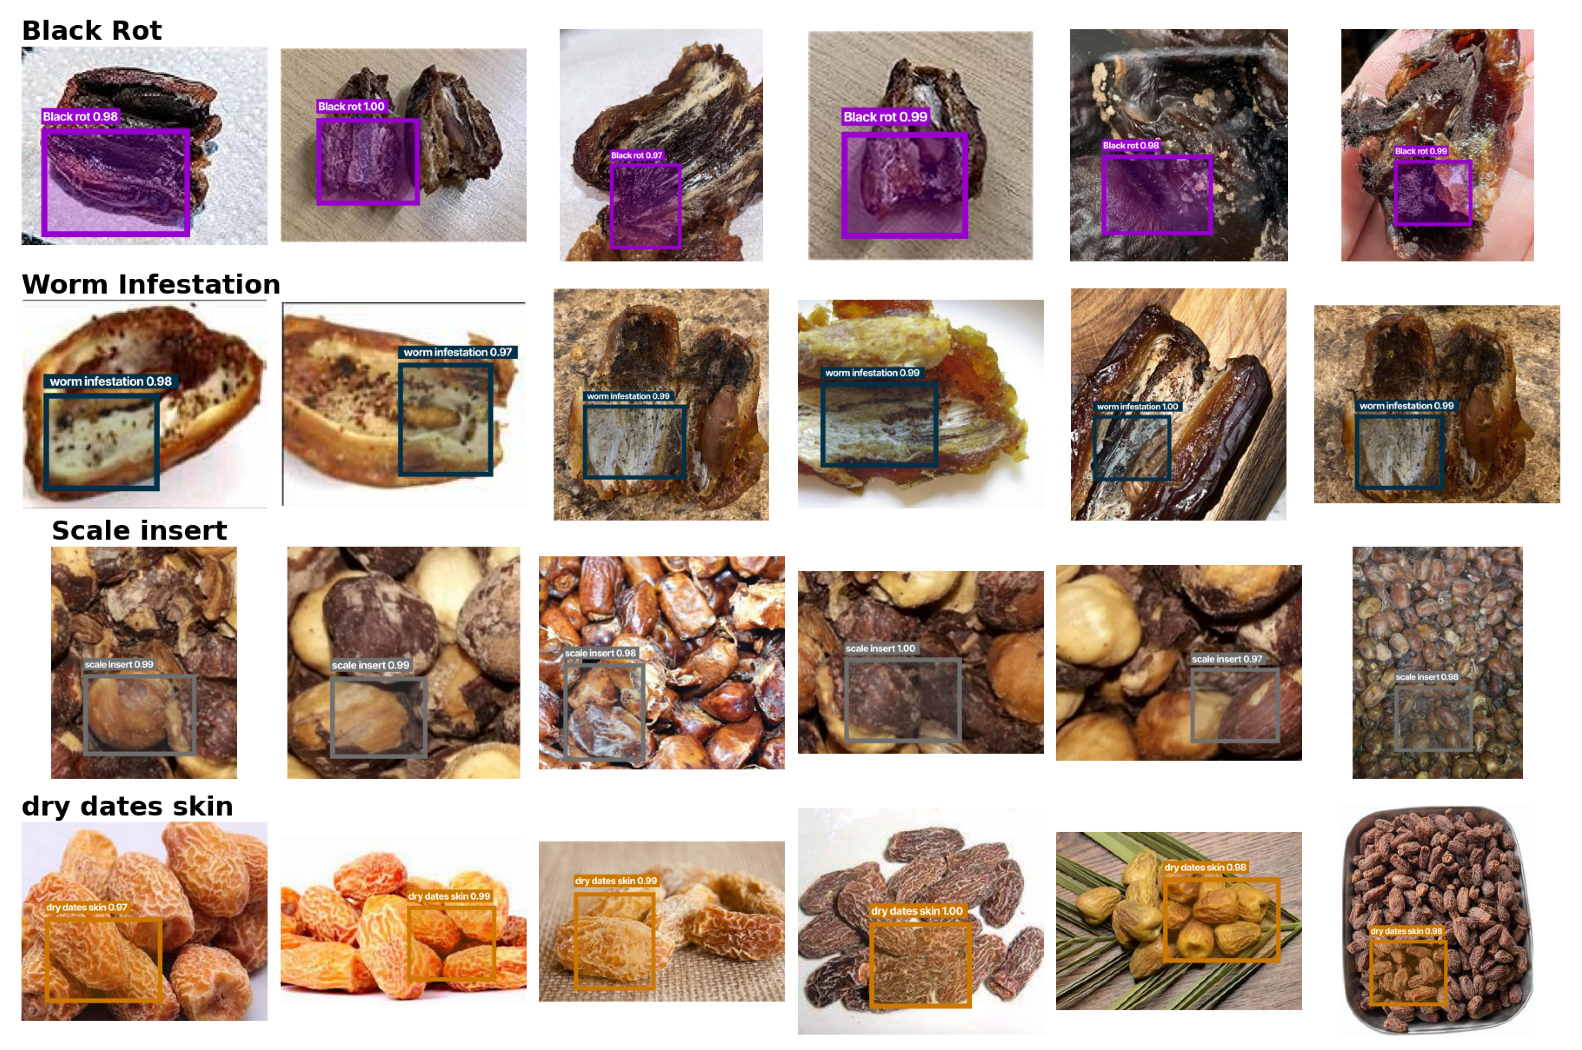
    Stage 2—Varietal and Disease-Specific Classification: Following the health-based categorization, a secondary, more detailed classification is performed. Healthy date fruits undergo varietal classification, in which the system distinguishes among different types, such as Ajwa, Barhi, Khalas, and others. Conversely, unhealthy dates are subjected to disease classification, where the model identifies and categorizes specific pathological conditions such as black rot, worm infestation, scale insect damage, or dry skin. This two-tiered decision-making framework facilitates both quality control for healthy produce and early detection of disease in defective samples, thereby supporting enhanced agricultural management and market optimization.
  • Model Evaluation: Once trained, the models were evaluated using several performance metrics. These included accuracy, which quantifies the proportion of correct predictions; the ROC curve, which evaluates performance across different classification thresholds; and the F-score, which balances precision and recall, providing insight into the model’s robustness.

2.1. YOLOv11 Model

YOLOv11 [37,38] introduced a new-generation object detection architecture that achieves higher detection accuracy and faster inference compared to earlier versions [39]. Extending the foundational advancements in YOLOv8, YOLOv9, and YOLOv10, YOLOv11 incorporates novel architectural modules such as a C3K2 block, Spatial Pyramid Pooling-Fast (SPPF), and Cross-Stage Partial Spatial Attention (C2PSA), which collectively enhance its feature extraction capacity and detection robustness [37].
The C3K2 block captures both local textures and global context via partial connections and convolutional layers. SPPF enables multiscale feature aggregation, improving detection of objects at various sizes. The C2PSA block introduces spatial attention mechanisms, emphasizing salient regions and suppressing noise [38]. These architectural components enhance YOLOv11’s scalability, robustness, and suitability for agricultural tasks such as pest detection, ripeness monitoring, and UAV-based surveillance [40,41,42,43].
Notably, YOLOv11 supports real-time inference on edge devices (e.g., Jetson Nano), with improved handling of small or occluded fruits. Its modular design facilitates extensibility for tasks like disease classification and yield estimation, enabling broad applicability in smart farming.

2.1.1. YOLOv11 Architecture Overview

YOLOv11 is organized into three core components: Backbone, Neck, and Head, optimized for efficient learning and robust prediction [44,45].
  • Backbone: Extracts hierarchical features via convolutional operations, enhanced with Cross-Stage Partial (CSP) structures and SiLU activations for efficient representation and gradient flow.
    Encodes low- and high-level features.
    Applies spatial downsampling.
    Outputs semantically rich feature maps.
  • Neck: Refines and fuses multi-scale features using a BiFPN++ structure, improving detection across object sizes [46].
    Aggregates spatial and contextual information.
    Boosts detection performance on varied object scales.
  • Head: The head is designed to output the final predictions of the model, including bounding boxes, class scores, objectness confidence, and, optionally, segmentation masks. YOLOv11 utilizes a decoupled head architecture that separates classification and localization into distinct branches. This separation enables the network to focus on each task independently, thereby improving accuracy and interpretability, particularly in complex object detection scenarios [47].
    Utilizes a decoupled head architecture for specialized learning.
    Includes
    *
    Classification head—assigns class probabilities.
    *
    Segmentation head—generates masks for segmentation tasks (optional).
Layer-Wise Functional Overview
Table 1 summarizes the functional responsibilities of the core architectural components in YOLOv11, each optimized to balance detection accuracy and computational efficiency.

2.1.2. YOLOv11 Training Optimization for Date Type and Disease Classification

To enhance the performance of YOLOv11 on tasks related to date variety recognition and disease detection, we implemented a comprehensive optimization of its training process. The baseline architecture was fine-tuned through a series of hyperparameter adjustments, custom data augmentation strategies, and refined loss function weighting. This optimization not only improved the model convergence but also contributed to higher precision, recall, and ROC-AUC scores across both classification and segmentation tasks.
The following core strategies were applied to improve the stability and effectiveness of the training process:
  • Exponential Moving Average (EMA): Integrated EMA tracking to smooth parameter updates, stabilizing model weights during training and improving inference performance.
  • Augmentations: Combined advanced augmentation techniques including Mosaic, MixUp, CutMix, CopyPaste, HSV jitter, and Random Affine transformations to increase data diversity and improve generalization.
  • Dynamic Label Assignment: Strategies such as SimOTA++ and TaskAligned assignment were employed to dynamically match predictions with targets, enhancing the effectiveness of supervision during training.
The following hyperparameter optimization strategies were used to further refine the model behavior:
  • Input Resolution: A fixed input image size of 640 × 640 was selected to optimize the trade-off between detection precision and real-time performance, particularly for small lesions and fine-grained date textures.
  • Learning Rate Scheduling: A cosine annealing schedule with warm-up epochs was adopted to gradually reduce the learning rate, promoting stable convergence.
  • Loss Weight Balancing: The weights of classification, objectness, and box regression loss components were fine-tuned to address class imbalance and improve detection accuracy.
  • Batch Accumulation: A batch size of 32 was used alongside gradient accumulation (2×) to accommodate GPU memory constraints, while maintaining stable gradients.
  • Object Confidence Threshold Tuning: The confidence threshold (conf_threshold) was empirically adjusted to 0.25 to reduce false positives without compromising recall.
Table 2 summarizes the key training parameters optimized to enhance the performance of YOLOv11 for date classification and disease segmentation. Each parameter was either tuned experimentally or selected based on best practices in recent literature for object detection tasks.
The input image size (imgsz) was fixed at 640 × 640 , balancing detection accuracy and computational cost, especially for identifying fine-grained features such as small surface lesions. A batch size 32 was selected to fully utilize available GPU memory, with gradient accumulation to simulate a larger effective batch size for more stable gradient updates.
Learning rate optimization was critical; a base rate 0.01 combined with cosine annealing and a 3-epoch warm-up period enabled smooth convergence and avoided early plateaus. The optimizer used was SGD with a momentum value of 0.937, contributing to consistent updates and reduced oscillation in learning.
To prevent overfitting, the weight decay was set to 0.0005. Loss component gains were carefully balanced: box_loss_gain was kept low to prioritize localization accuracy without dominating the loss, while cls_loss_gain and obj_loss_gain were scaled to emphasize correct class prediction and objectness detection, respectively.
The confidence threshold (conf_threshold) was tuned to 0.25, effectively reducing false positives while preserving high recall, particularly important for early-stage disease symptoms and visually subtle defects.
These optimizations collectively contributed to a measurable improvement in mean average precision (mAP), F1-score, and inference speed, demonstrating the effectiveness of domain-specific tuning for agricultural visual analytics.
Figure 2 presents the architecture of the proposed YOLOv11/opt-based framework for fine-grained date classification and disease detection. The model integrates patch embeddings with a convolutional-attention-enhanced backbone.
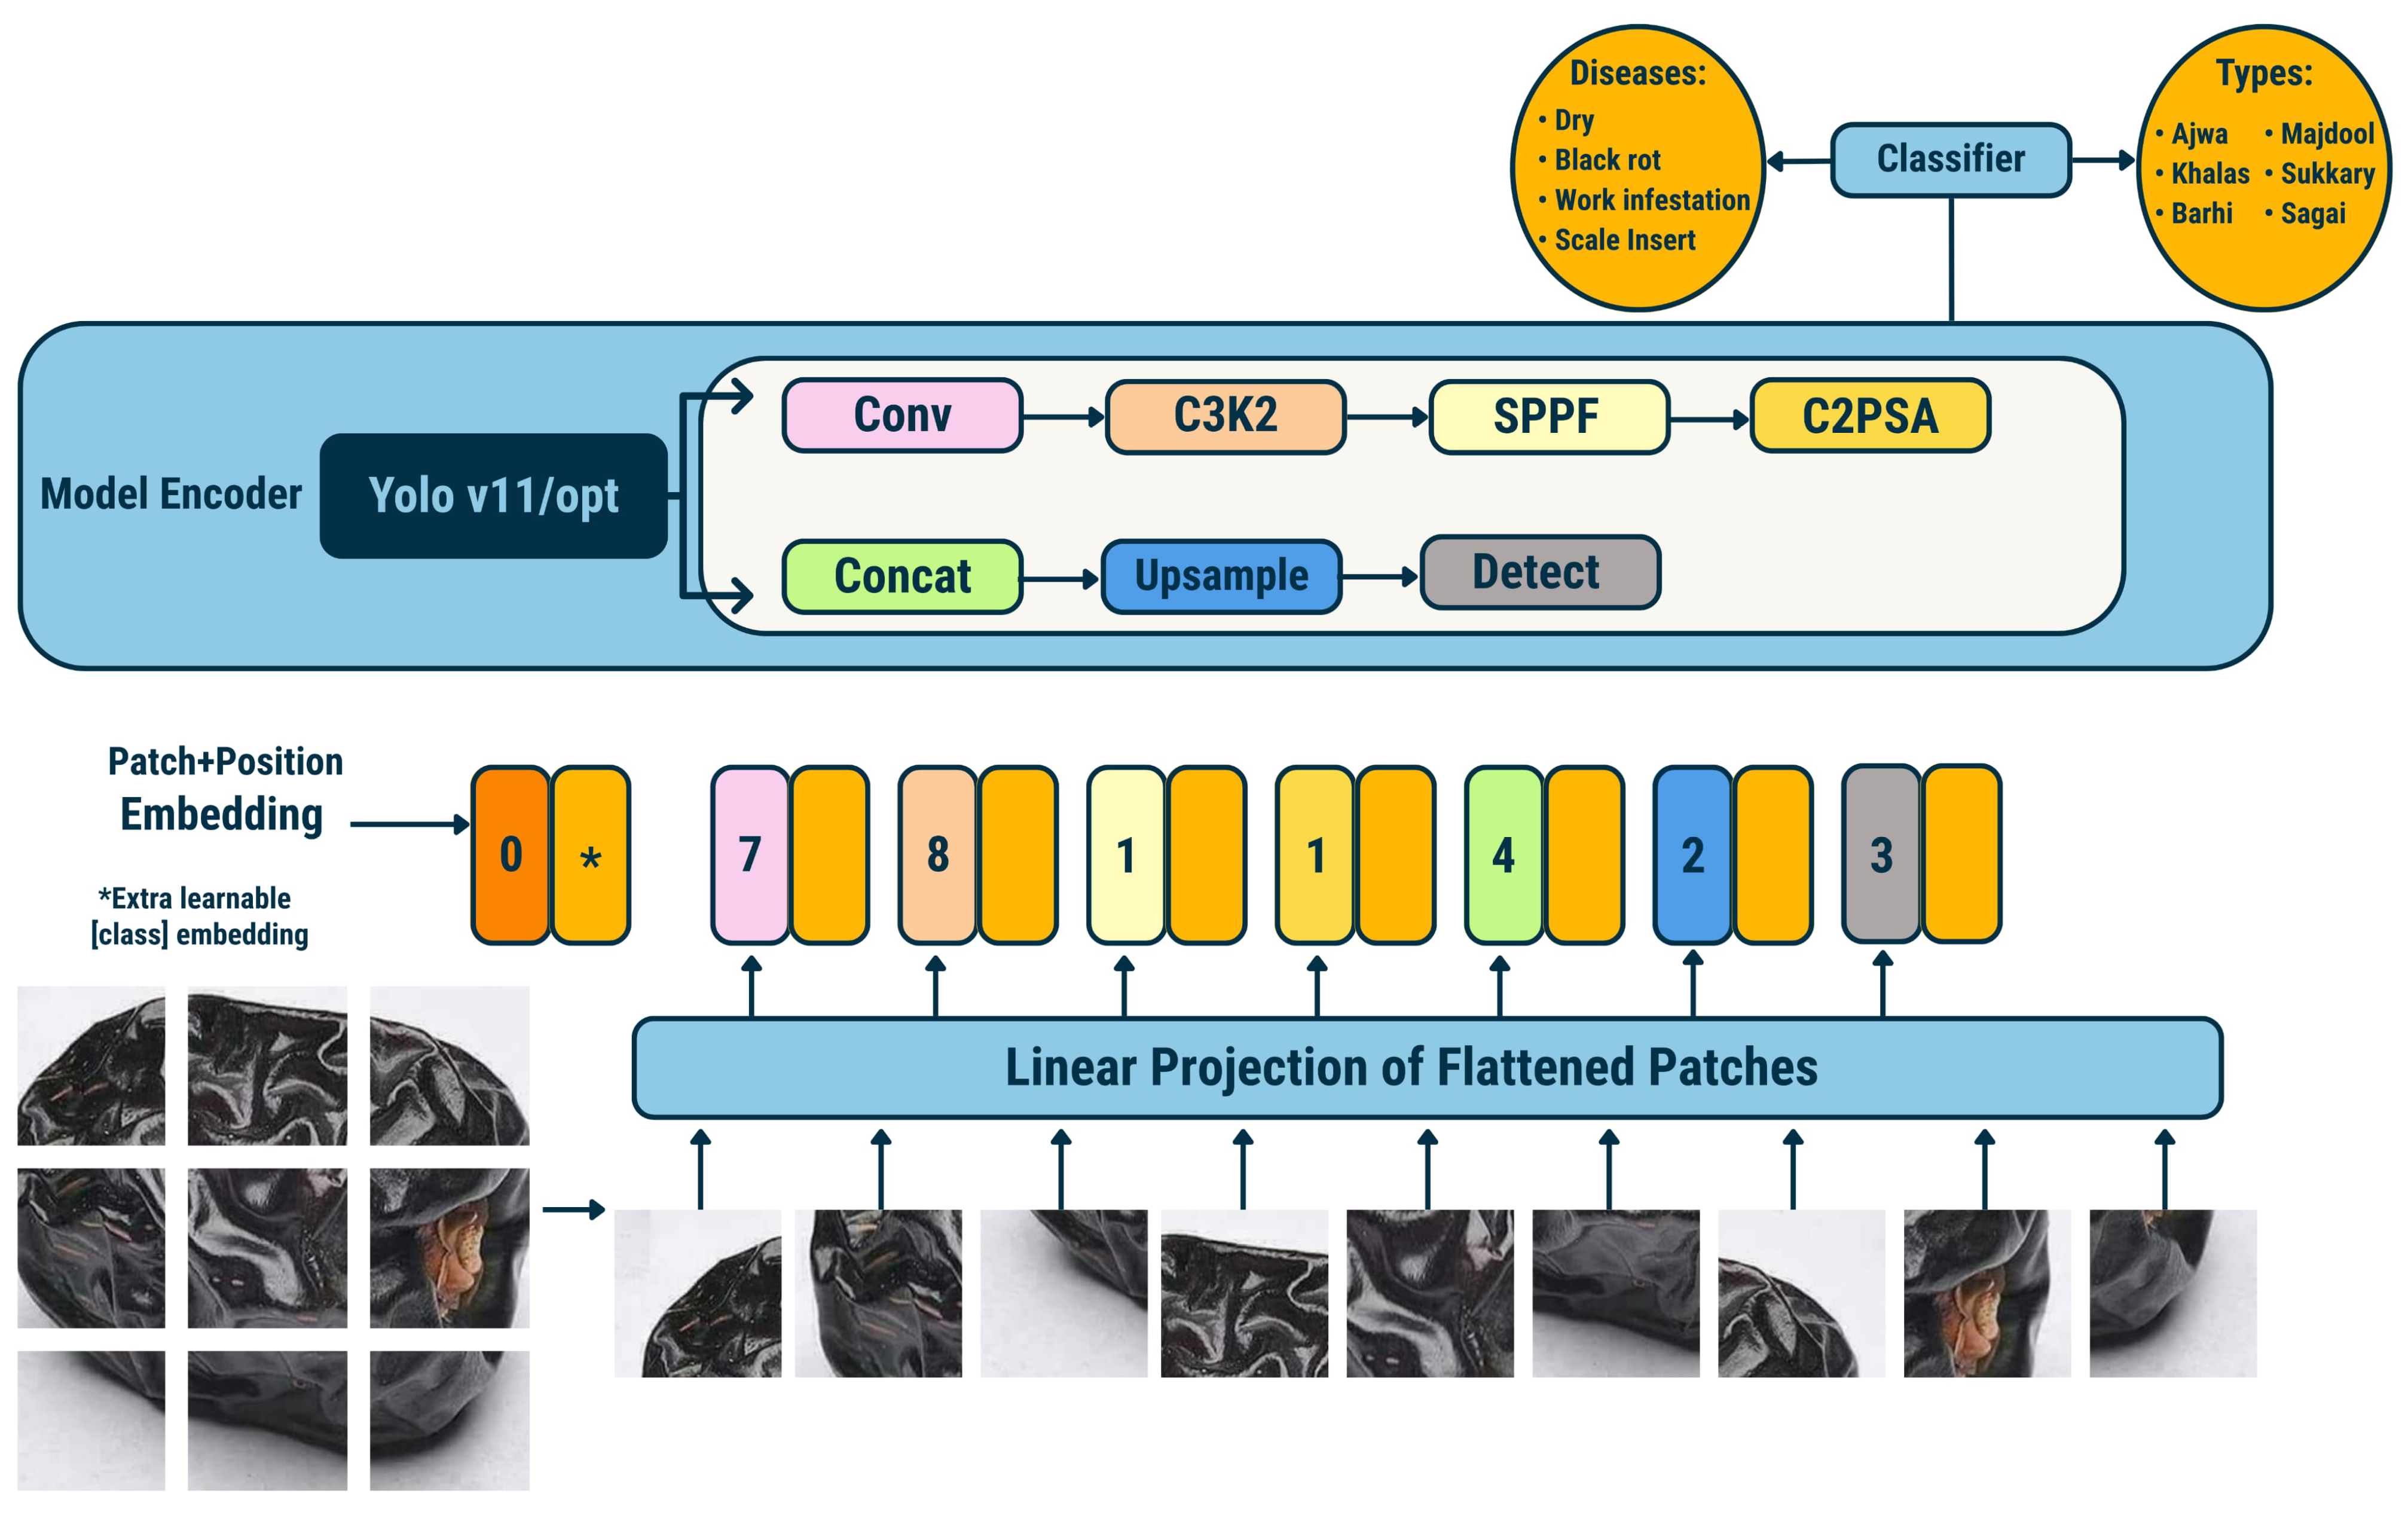
  • Patch and Position Embedding (Layer 1): The input image is divided into non-overlapping patches, each linearly projected and embedded with positional encodings and a learnable classification token.
  • Linear Projection (Layer 2): Flattened patch embeddings are mapped into a latent feature space via a linear projection layer.
  • YOLOv11/opt Backbone (Layers 3–9):
    Conv (Layer 3, ×7): Convolutional layers for low- and mid-level hierarchical feature extraction.
    C3K2 (Layer 4, ×6): Cross-Stage Partial blocks with residual connections to enhance feature reuse and learning efficiency.
    SPPF (Layer 5, ×1): Spatial Pyramid Pooling Fast module for multi-scale receptive field aggregation.
    C2PSA (Layer 6, ×1): Cross-Channel and Parallel Self-Attention module for channel-wise and spatial feature refinement.
    Concat (Layer 7, ×1): Concatenation of multi-resolution feature maps to preserve diverse spatial information.
    Upsample (Layer 8, ×1): Upsampling operation to restore spatial resolution before detection.
    Detect (Layer 9, ×1): Detection head for bounding box regression and objectness prediction.
  • Classification Module (Layer 10): Final classification of detected instances into predefined categories, such as specific fruit types or disease types.
Algorithm 1 summarizes the YOLOv11 fine-tuning pipeline, which integrates advanced data augmentation, dynamic label assignment, and loss optimization strategies. The pretrained model was initialized with optimal hyperparameters and trained on a custom dataset using techniques such as Mosaic, MixUp, and SimOTA++. The training process was guided by a composite loss function and stabilized through exponential moving average (EMA) tracking. The model performance as validated using standard detection metrics, and the final optimized model was exported for deployment on real-time and edge-based inference systems.
Algorithm 1 Optimized YOLOv11 Object Detection and Fine-Tuning Framework
Require: Pretrained YOLOv11 model Y O L O v 11 p r e , labeled dataset D = { I 1 , I 2 , , I n }
Ensure: Optimized model Y O L O v 11 o p t for real-time object detection
1:
Step 1: Data Preparation
2:
   Split the dataset D into training set D t r a i n and validation set D v a l .
3:
   Format annotations in YOLO format and define data.yaml with dataset paths, class names, and number of classes.
4:
Step 2: Model Initialization
5:
   Load the pretrained YOLOv11 model Y O L O v 11 p r e .
6:
   Set hyperparameters: image size = 640 × 640 , batch size = 32, learning rate = 0.01.
7:
   Use SGD optimizer with momentum = 0.937, weight decay = 0.0005, and cosine annealing with 3 warm-up epochs.
8:
Step 3: Model Training with Augmentation
9:
for each batch in D t r a i n  do
10:
    Apply augmentations: Mosaic, MixUp, CutMix, CopyPaste, HSV jitter, and RandomAffine.
11:
    Use dynamic label assignment: SimOTA++ and TaskAligned Matching.
12:
    Train the model using a composite loss:
  • GIoU loss (for localization)
  • Classification loss (weight = 0.5)
  • Objectness loss (weight = 1.0)
  • Box regression loss (weight = 0.05)
13:
    Track exponential moving average (EMA) of model weights for stability.
14:
end for
15:
Step 4: Validation and Checkpointing
16:
for each image in D v a l  do
17:
    Preprocess and evaluate the image (resize without augmentation).
18:
    Compute performance metrics: mAP, precision, recall, and F1-score.
19:
end for
20:
if validation metrics meet the performance threshold then
21:
    Save the current model state as Y O L O v 11 o p t .
22:
end if
23:
Step 5: Local Inference
24:
for each test image I j D t e s t  do
25:
    Use Y O L O v 11 o p t to perform inference on I j .
26:
    Extract bounding boxes, class labels, and confidence scores.
27:
    Apply Non-Maximum Suppression (NMS) with a confidence threshold of 0.25.
28:
end for
29:
Step 6: Hyperparameter Tuning
30:
   Adjust key hyperparameters (learning rate, batch size, image size).
31:
   Perform stratified k-fold cross-validation to validate generalization capability.
32:
Step 7: Model Deployment
33:
   Export the optimized model Y O L O v 11 o p t in .pt format.
34:
   Optionally convert the model to ONNX or TensorRT formats for edge device deployment.

3. Experimental Results

This section evaluates the performance of the proposed YOLOv11 and YOLOv11-Opt models for date variety classification and disease detection. Multiple metrics were employed to validate the models. The experimental results are organized into the following areas:

3.1. Experimental Settings

This subsection presents the experimental settings, including the work environment specifications and the evaluation metrics employed to assess the proposed models’ performance.

3.1.1. Work Environment

The experiments were conducted on a system equipped with the following hardware and software configuration:
Table 3 presents the hardware specifications of the system used to train and evaluate the YOLOv11 model.
The computational environment for model development, training, and evaluation was built using a set of Python libraries and frameworks, detailed in Table 4.

3.1.2. Parameter Settings

Table 5 summarizes the key training hyperparameters and data augmentation techniques applied during the fine-tuning process.

3.1.3. Evaluation Metrics

A set of well-established quantitative metrics were employed to evaluate the classification performance of the proposed model. These indicators included Precision, Accuracy, F1-Score, Sensitivity (Recall), Specificity, and the Area Under the Receiver Operating Characteristic Curve (ROC-AUC). Each metric was derived from the fundamental components of the confusion matrix: True Positives (TP), True Negatives (TN), False Positives (FP), and False Negatives (FN) [52,53].
Precision [54] quantifies the proportion of correctly predicted positive cases relative to all cases classified as positive by a model. It is mathematically expressed as
Precision = T P T P + F P
Accuracy [55] measures the total proportion of correct predictions (positive and negative) relative to all predictions made. It provides a high-level overview of a classifier’s performance and is computed as
Accuracy = T P + T N T P + T N + F P + F N × 100
F1-Score [56] integrates both precision and recall into a single value by computing their harmonic mean. This metric is especially useful in domains where positive instances are rare or unevenly distributed:
F 1 -Score = 2 × T P 2 × T P + F P + F N
Sensitivity [57], also referred to as recall, reflects the ability of a model to detect actual positive cases. It is given by the following ratio:
Sensitivity = T P T P + F N
Specificity [57] assesses the proportion of correctly classified negative examples out of all actual negative instances. It quantifies a model’s capacity to exclude false positives:
Specificity = T N T N + F P
ROC-AUC [58] provides an aggregated measure of classification quality across various thresholds. It is computed using the trapezoidal rule over pairs of True Positive Rate (TPR) and False Positive Rate (FPR):
AUC = i = 1 n 1 TPR i + TPR i + 1 2 · FPR i + 1 FPR i
where TPR i and FPR i represent the true positive rate and false positive rate at the i-th threshold. An AUC close to 1.0 suggests excellent discriminative power, whereas a value near 0.5 implies poor classification effectiveness.
In addition to the above classification metrics, object detection performance was further evaluated using the Intersection over Union (IoU) and the mean Average Precision (mAP) metrics, which are widely adopted in computer vision benchmarks for object detection tasks [59,60].
Intersection over Union (IoU) measures the overlap between the predicted bounding box and the ground truth, and is defined as
IoU = Area of Overlap Area of Union
This metric is a critical threshold criterion (commonly set at 0.5) to determine true positive detections based on spatial alignment.
Mean Average Precision (mAP) evaluates the classification confidence and localization accuracy of object detectors. It aggregates the average precision (AP) across different IoU thresholds and object classes. It is formally expressed as
mAP = 1 N τ { 0.5 , 0.55 , , 0.95 } A P τ
where A P τ represents the average precision at a specific IoU threshold τ , and N denotes the number of thresholds. The use of multiple thresholds, from 0.5 to 0.95 with a step of 0.05, ensures robust evaluation of detection precision and localization performance.
In this study, YOLOv11 and its optimized version achieved high mAP values across the evaluated IoU thresholds, indicating a strong generalization capability in detecting date types and disease instances.

3.2. Comparative Analysis

This section compares the proposed models’ performance outcomes using the YOLO V11 model and the optimized YOLO V11 for date types and diseases.

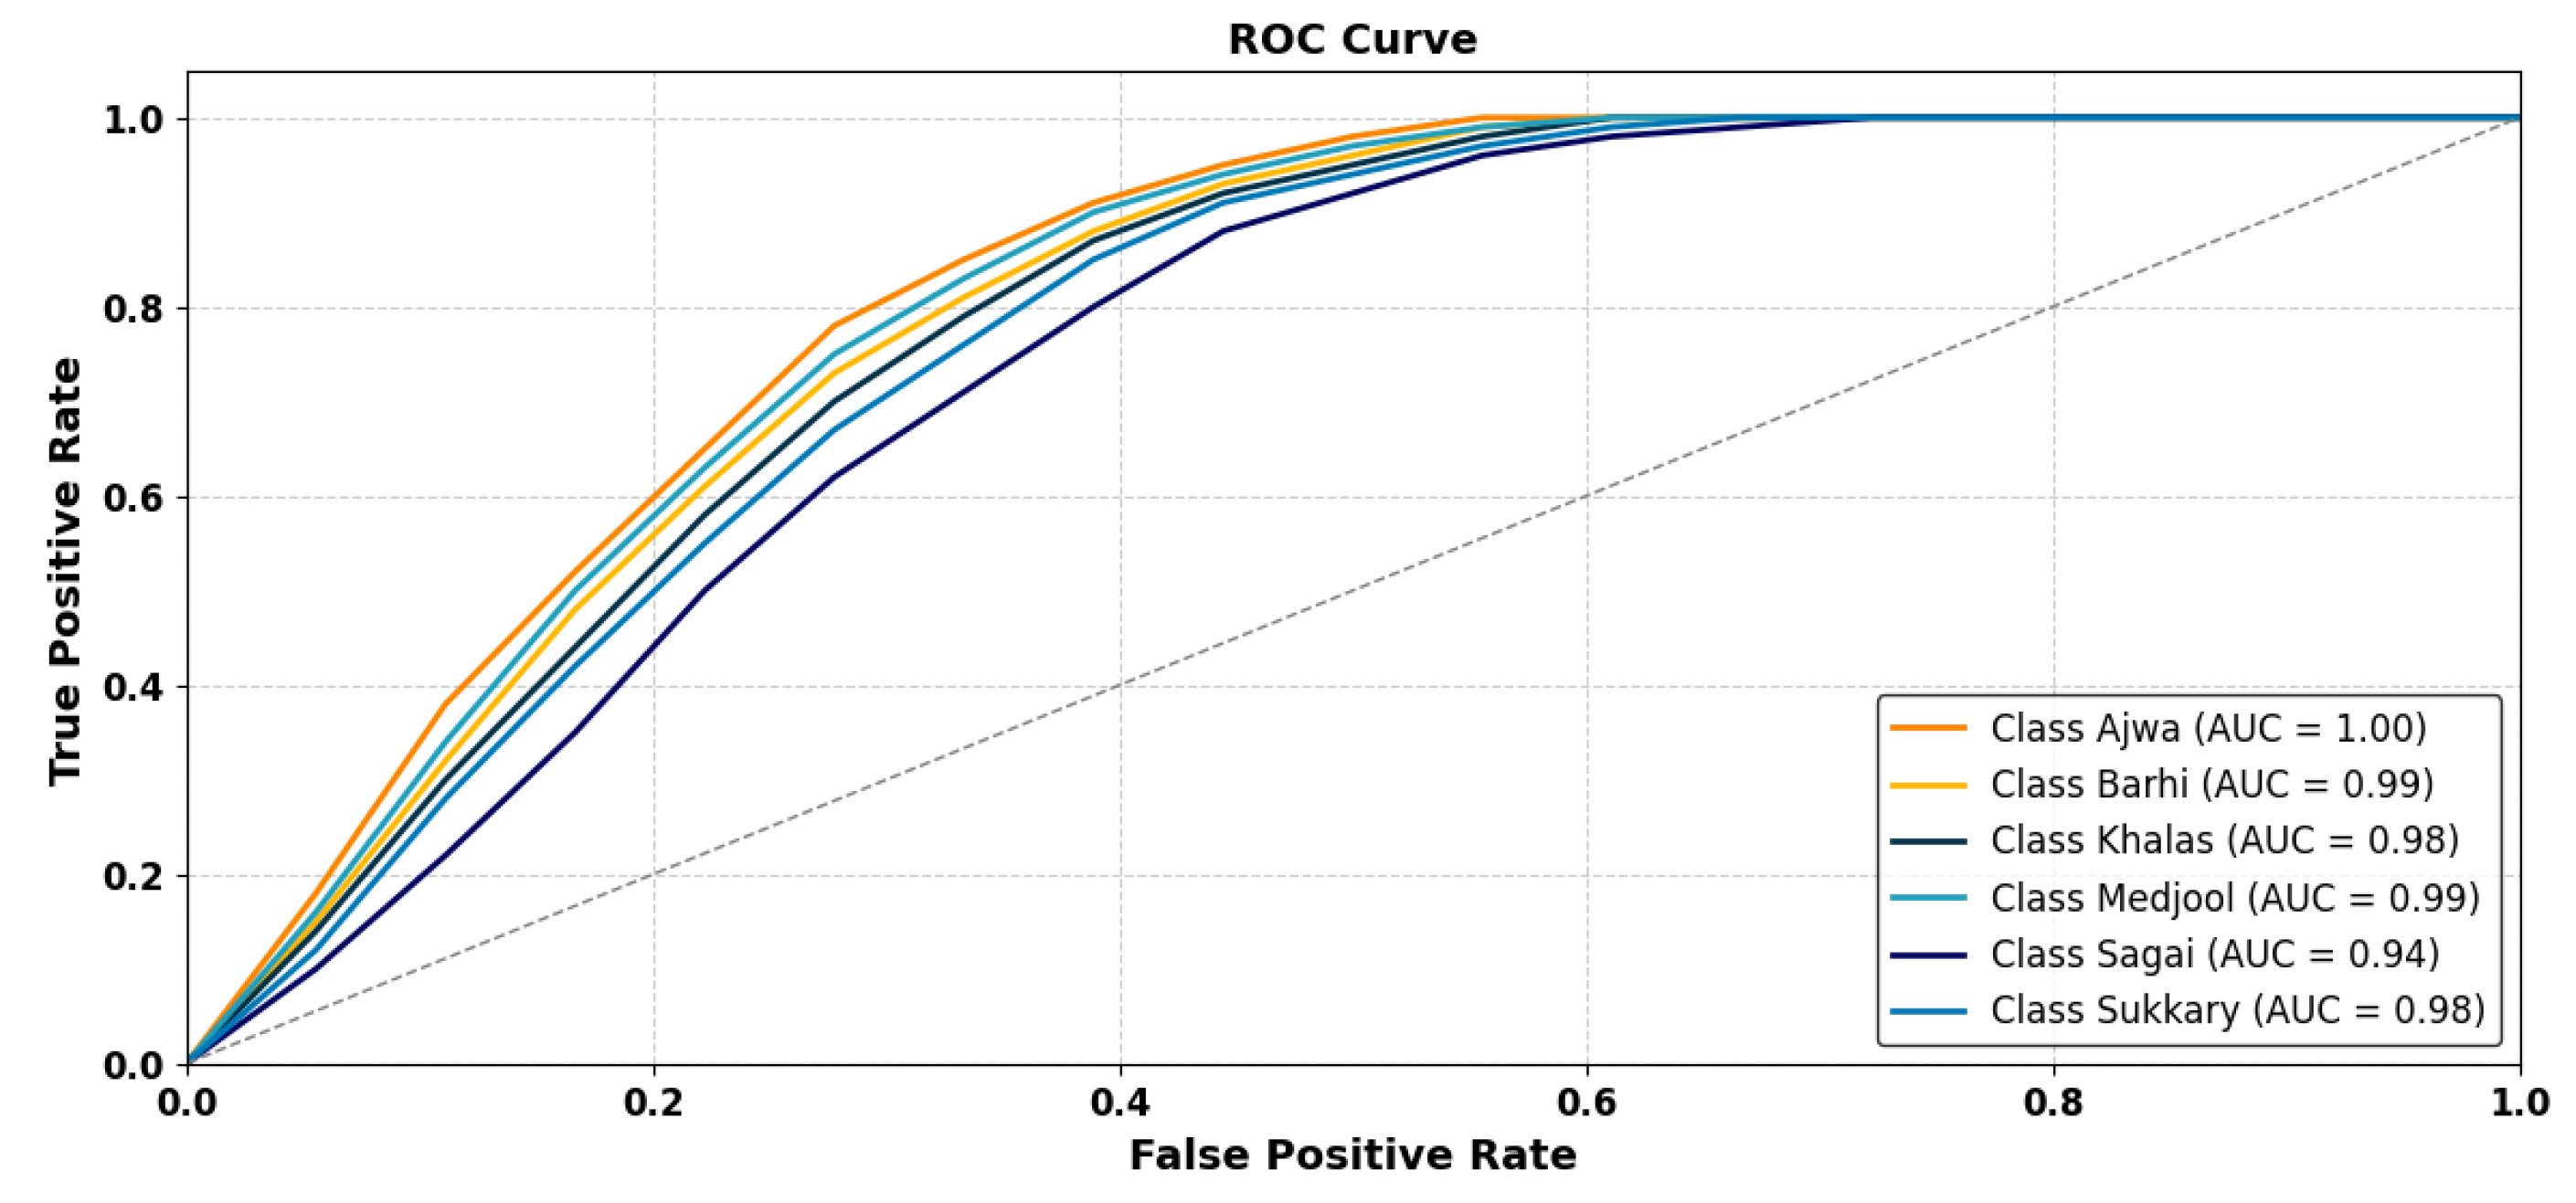
3.2.1. Yolov11 Performance Results Across Different Date Types

Table 6 presents a comparative analysis of the baseline YOLOv11 model and its optimized variant, YOLOv11-Opt, in classifying six primary date fruit varieties: Ajwa, Barhi, Khalas, Medjool, Sagai, and Sukkary. Across all evaluated metrics—accuracy, precision, recall, F-score, specificity, and ROC AUC—YOLOv11-Opt consistently outperformed the standard model.
The optimized model achieved an overall accuracy of 99.04%, precision of 98.96%, recall of 99.32%, and an F-score of 99.25%, in contrast to YOLOv11’s overall accuracy of 98.64% and F-score of 98.09%. Substantial gains were particularly observed in the classification of more challenging varieties such as Khalas and Barhi, where YOLOv11-Opt demonstrated higher precision and recall, mitigating the underperformance noted in the baseline configuration.
Furthermore, the improvement in ROC AUC—from 98% (YOLOv11) to 99.6% (YOLOv11-Opt)—underscores the enhanced discriminative capability of the optimized model under diverse visual and morphological conditions. These findings confirm the effectiveness of the applied optimization strategies and establish YOLOv11-Opt as a robust solution for high-precision classification tasks in smart agriculture and automated fruit quality assessment systems.
Figure 3 depicts the training accuracy and validation loss dynamics of the YOLOv11-Opt model over 14 epochs. In Figure 3a, the accuracy of training steadily improved from 0.4881 to 0.9896, indicating effective learning and convergence. The accuracy shows a consistent upward progression, particularly after epoch 5, with minimal oscillation, suggesting stable gradient updates and good generalization behavior.
Figure 3b illustrates the corresponding validation loss, which decreased significantly from an initial value of 1.14 to 0.62, reflecting improved model performance on unseen data. While slight fluctuations occurred between epochs 6 and 9, the overall downward trend confirms the effectiveness of the optimization strategy in minimizing overfitting and enhancing generalization. These curves collectively validate the training process’s stability and robustness, reinforcing the model’s reliability for real-world deployment in agricultural classification tasks.
Figure 4 presents a confusion matrix illustrating the classification performance of the YOLOv11-Opt model across six date types. The model demonstrated strong diagonal dominance, particularly for Ajwa (110 correct predictions) and Medjool (93 correct predictions), indicating high accuracy in correctly identifying these classes.
Figure 5 displays the Receiver Operating Characteristic (ROC) curves for all classes. The Area Under the Curve (AUC) scores confirm an excellent separability for most classes, with Ajwa achieving a perfect AUC of 100%. Other varieties, Khalas (99%), Barhi (98%), and Medjool (97%), also demonstrated near-optimal classification performance. The slightly lower AUC values for Sagai (0.94) and Sukkary (98%) align with their confusion matrix results, reflecting more challenging class boundaries.

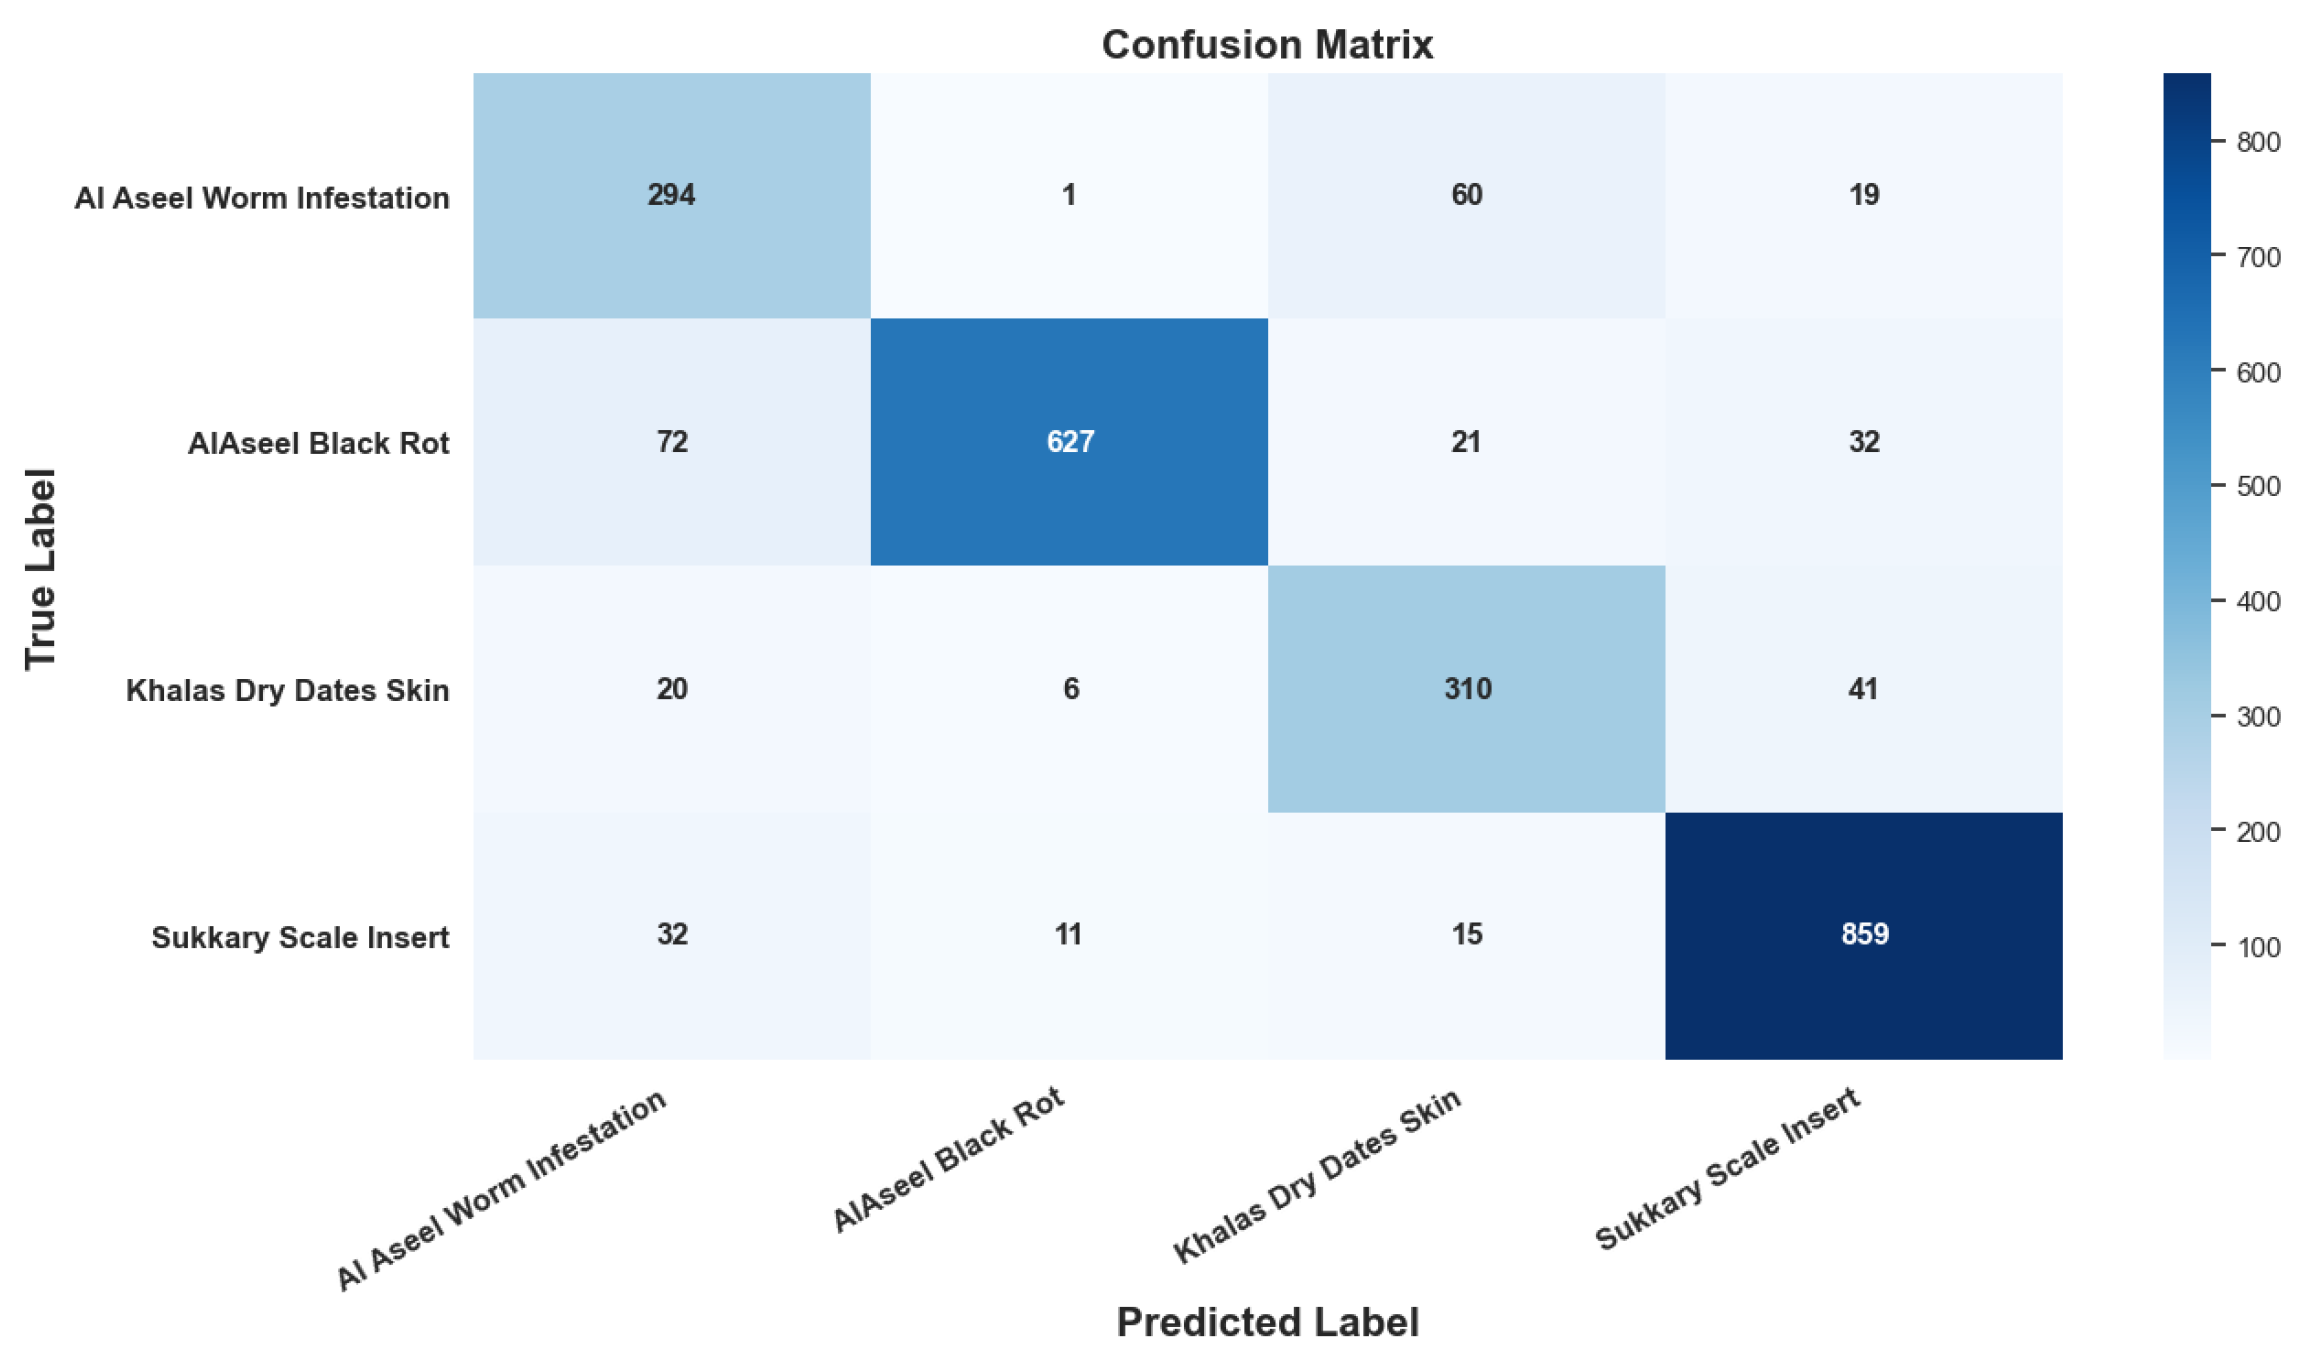
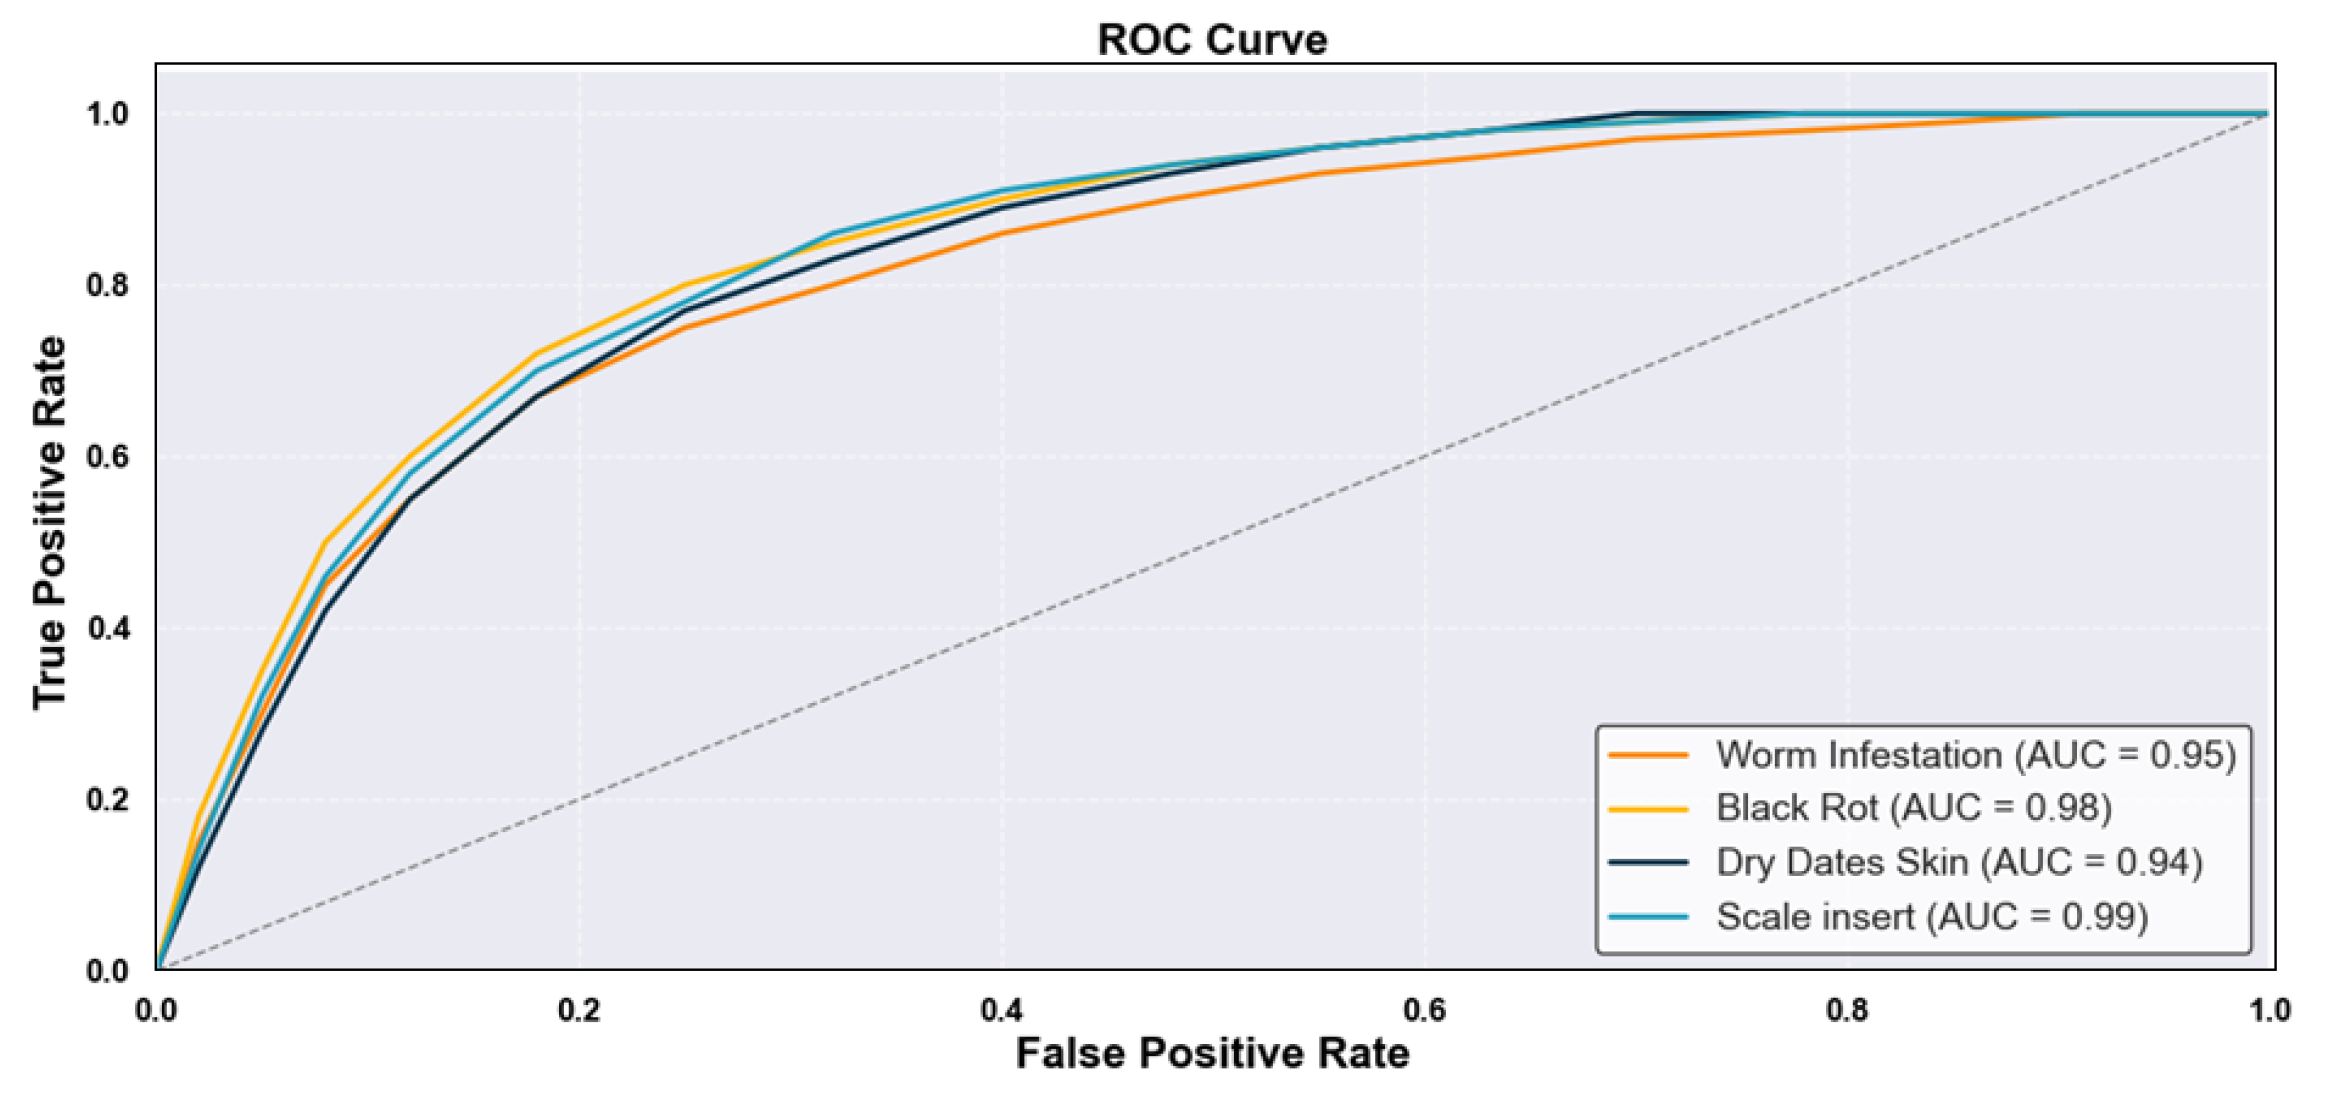
3.2.2. Date Disease Detection Performance

Table 7 and Table 8 compare the performance of YOLOv11 and YOLOv11-Opt in detecting four major date palm diseases across three varieties: Al Aseel, Sukkary, and Khalas. The optimized YOLOv11-Opt model consistently outperformed the baseline YOLOv11 across all evaluation metrics, achieving a higher average accuracy (99.69% vs. 98.53%) and F-score (99.83% vs. 98.71%).
Notable improvements were observed in detecting visually challenging diseases such as scale insert and dry date skin, especially in the Khalas variety. These results confirm the enhanced precision, robustness, and deployment readiness of YOLOv11-Opt for intelligent disease monitoring in modern agricultural systems.

3.2.3. YOLOv11-Opt Performance in Disease Detection

Figure 6, Figure 7 and Figure 8 provide a comprehensive evaluation of the YOLOv11-Opt model’s performance in detecting date diseases across selected varieties such as Al Aseel, Sukkary, and Khalas.
Figure 6a (Validation Loss Curve) displays a general downward trend in loss across 10 epochs, indicating effective learning and generalization. The loss decreased from an initial value above 1.2 to below 0.7, despite some fluctuations mid-training.
Figure 6b (Training Accuracy Curve) shows a steady increase in accuracy, reaching 98.5% by the 10th epoch, confirming consistent model improvement with training progression.
Figure 7 (Confusion Matrix) shows high classification accuracy, particularly for Sukkary Scale Insert (859 correctly classified), with some misclassifications observed in classes like Al Aseel Worm Infestation and Khalas Dry Date Skin, suggesting a partial visual overlap among certain disease features.
Figure 8 (ROC Curve) presents high AUC values for all disease types, with Scale Insert achieving the highest AUC (0.99), followed by Black Rot (0.98), Worm Infestation (0.95), and Dry Date Skin (0.94). These results confirm the strong discriminative capability of YOLOv11-Opt across multiple disease categories.
These figures highlight the effectiveness, stability, and discriminative strength of YOLOv11-Opt in automated disease detection tasks within innovative agriculture systems.
Figure 9 and Figure 10 illustrate the effectiveness of the optimized YOLOv11 (YOLOv11-opt) model in the classification of date types and the detection of disease-related defects. In Figure 9, the model accurately identified six date types through color-coded bounding boxes annotated with predicted class labels and confidence scores. This performance is attributed to the comprehensive fine-tuning on a domain-specific dataset, enabling the model to robustly distinguish subtle morphological differences among visually similar date varieties.
Figure 10 highlights the model’s capability for detecting major post-harvest diseases and surface-level defects, including heterogeneous and visually complex infection patterns. The YOLOv11-opt model accurately localized pathological regions across diverse imaging scenarios, showcasing its capacity to extract fine-grained features crucial for early detection.
Collectively, these results validate the versatility and robustness of the YOLOv11-opt framework in enabling automated grading, disease surveillance, inventory classification, and traceability through the date production lifecycle. This can significantly contribute to quality assurance and operational efficiency in precision agriculture systems.

3.2.4. Object Detection Performance Based on mAP and IoU Thresholds

To comprehensively assess the object detection capabilities of the proposed models, we report evaluation metrics based on the mean Average Precision (mAP) at different Intersection over Union (IoU) thresholds.
Table 9 summarizes the detection performance of YOLOv11 and its optimized version for date type classification and disease detection. The metrics include mAP@0.5, which evaluates detection success at a moderate IoU threshold, and mAP@0.5:0.95, which averages the performance over stricter thresholds, following the COCO evaluation protocol [60].
The results indicate that the two models exhibited high accuracy in object localization and classification, with the optimized YOLOv11 variant outperforming the baseline across all evaluated metrics. Notably, an mAP@0.5:0.95 score of 1.000 was achieved for disease detection, demonstrating exceptional localization precision under varying IoU constraints. This highlights the model’s robustness and suitability for field-level agricultural applications where high detection fidelity is essential.

3.3. Visual Analytics for Strategic Management of Date Production

To enhance transparency, traceability, and operational efficiency in date production systems, an intelligent visual analytics dashboard was developed to serve as an integral component of the proposed management system, offering data-driven insights to support strategic decision-making across production and date health domains. Figure 11 focuses on yield performance and varietal distribution, while Figure 12 offers insights into disease prevalence and impact severity.
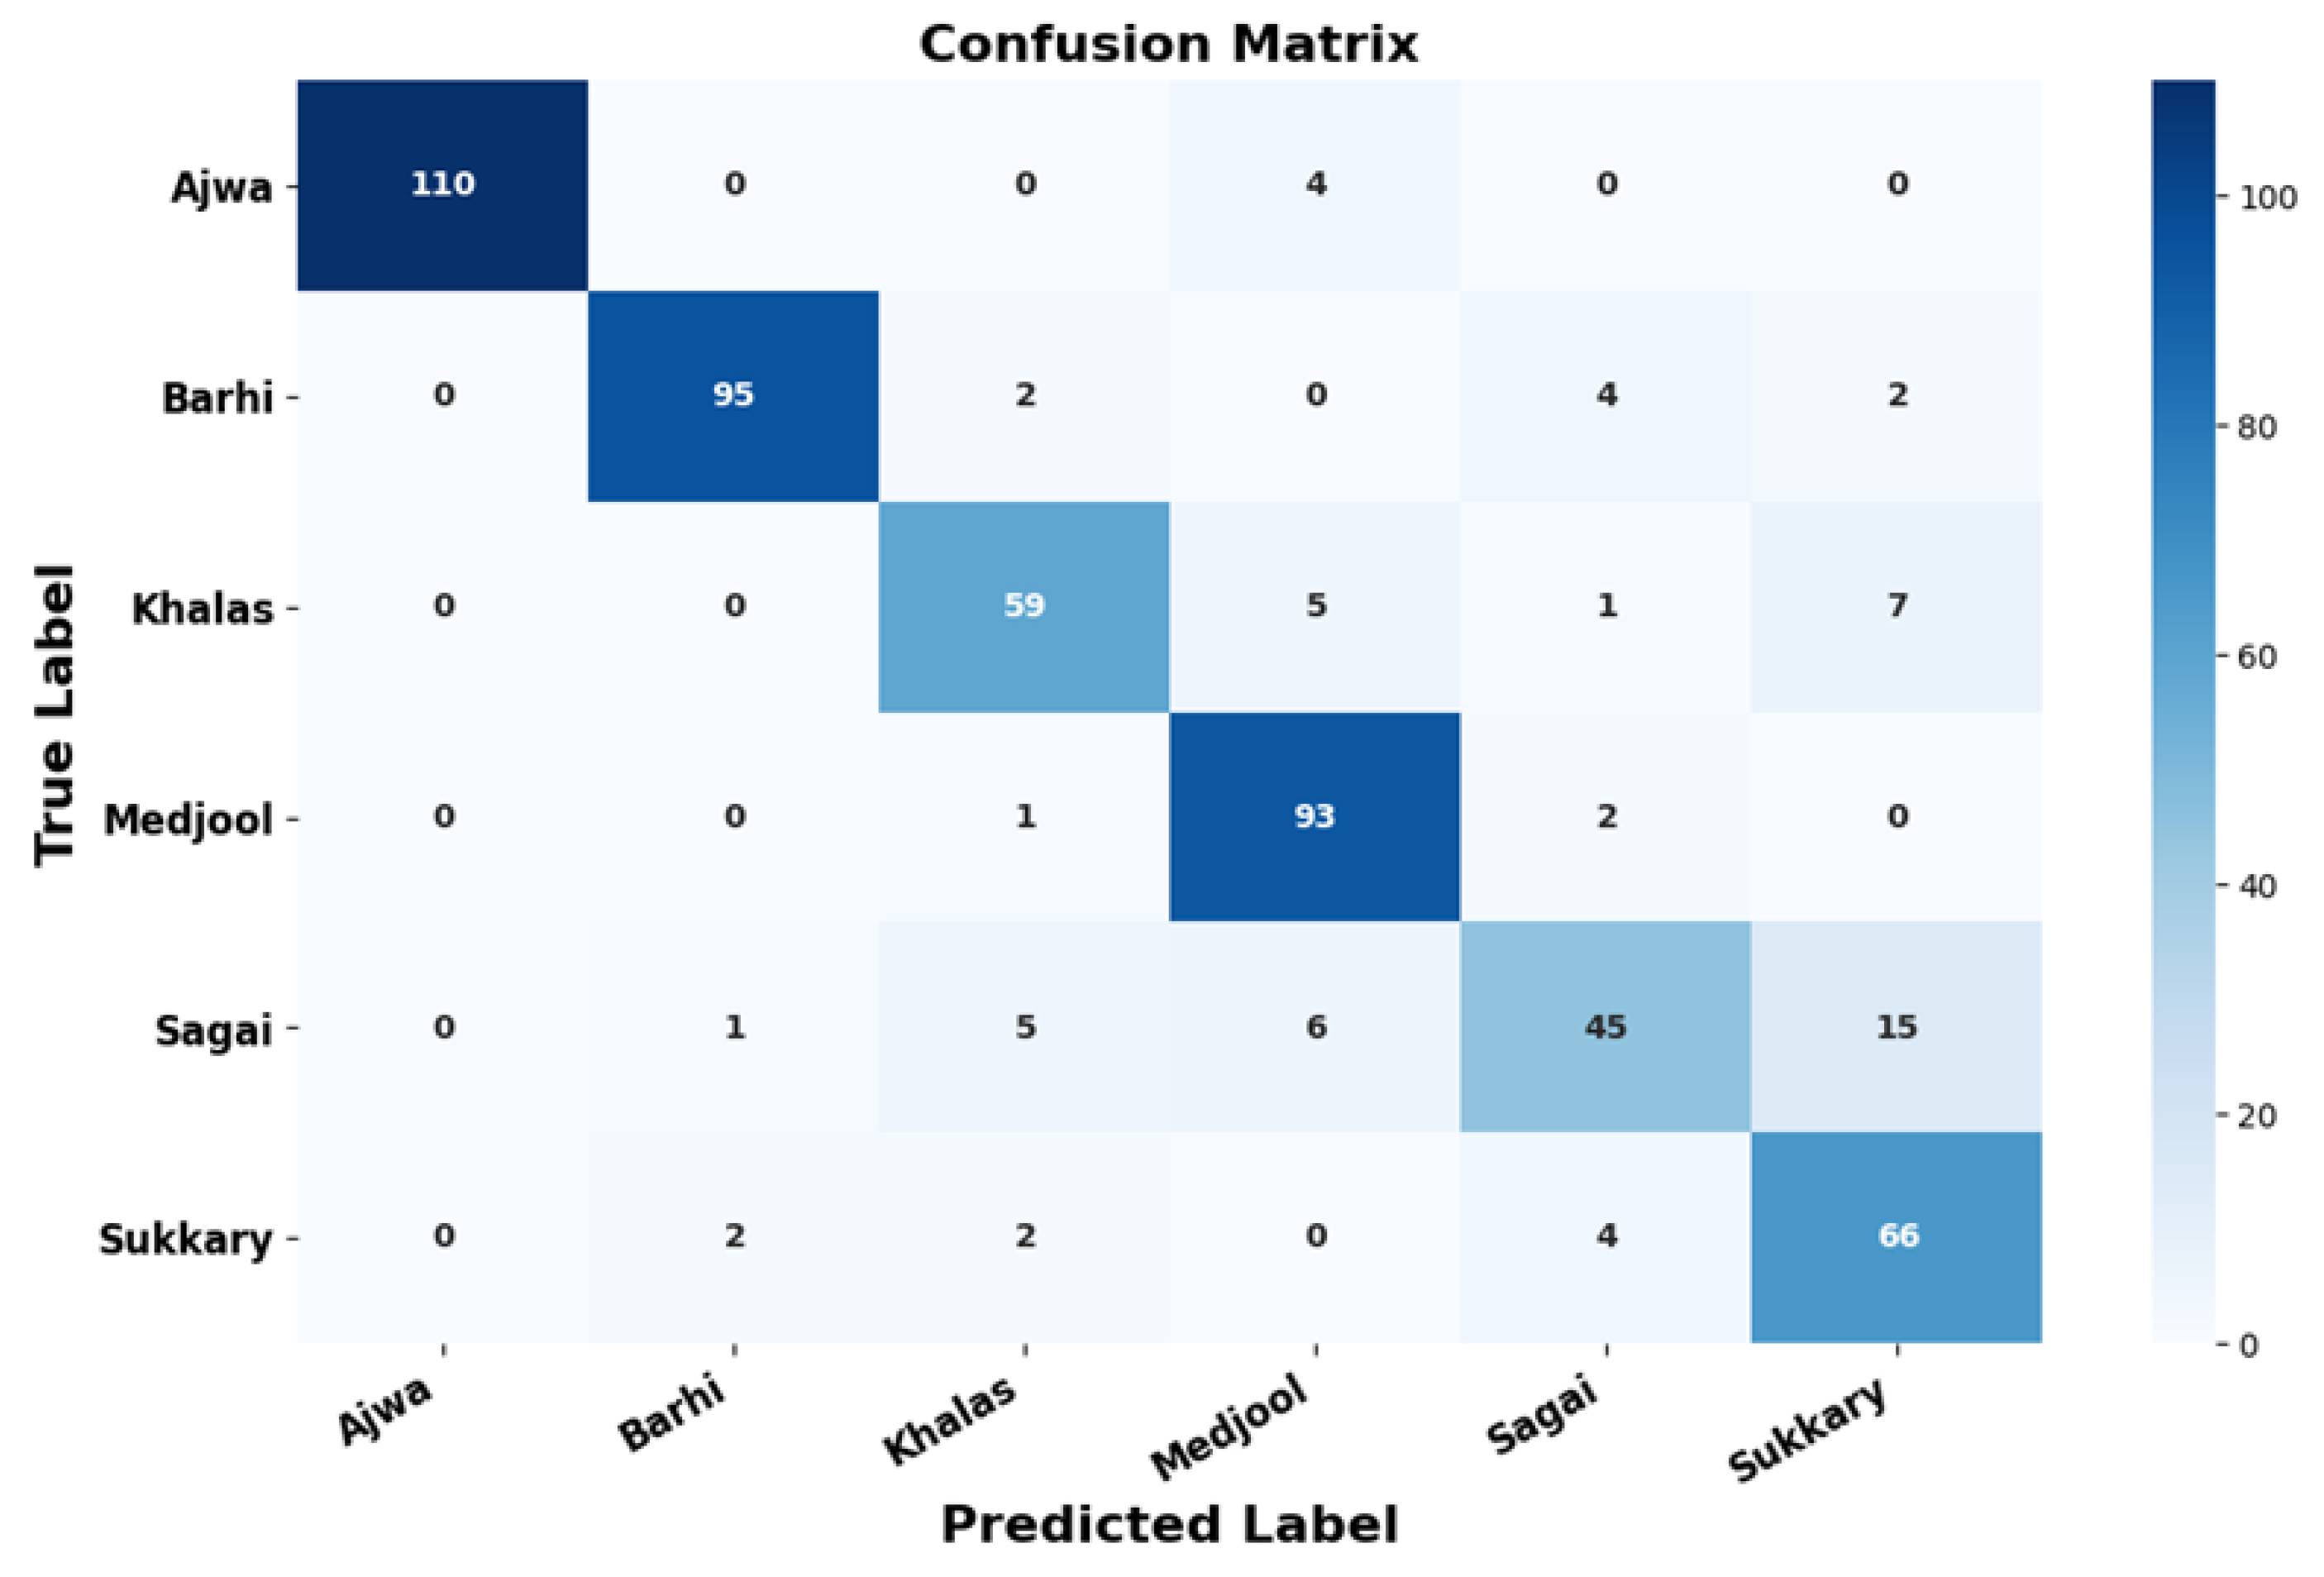
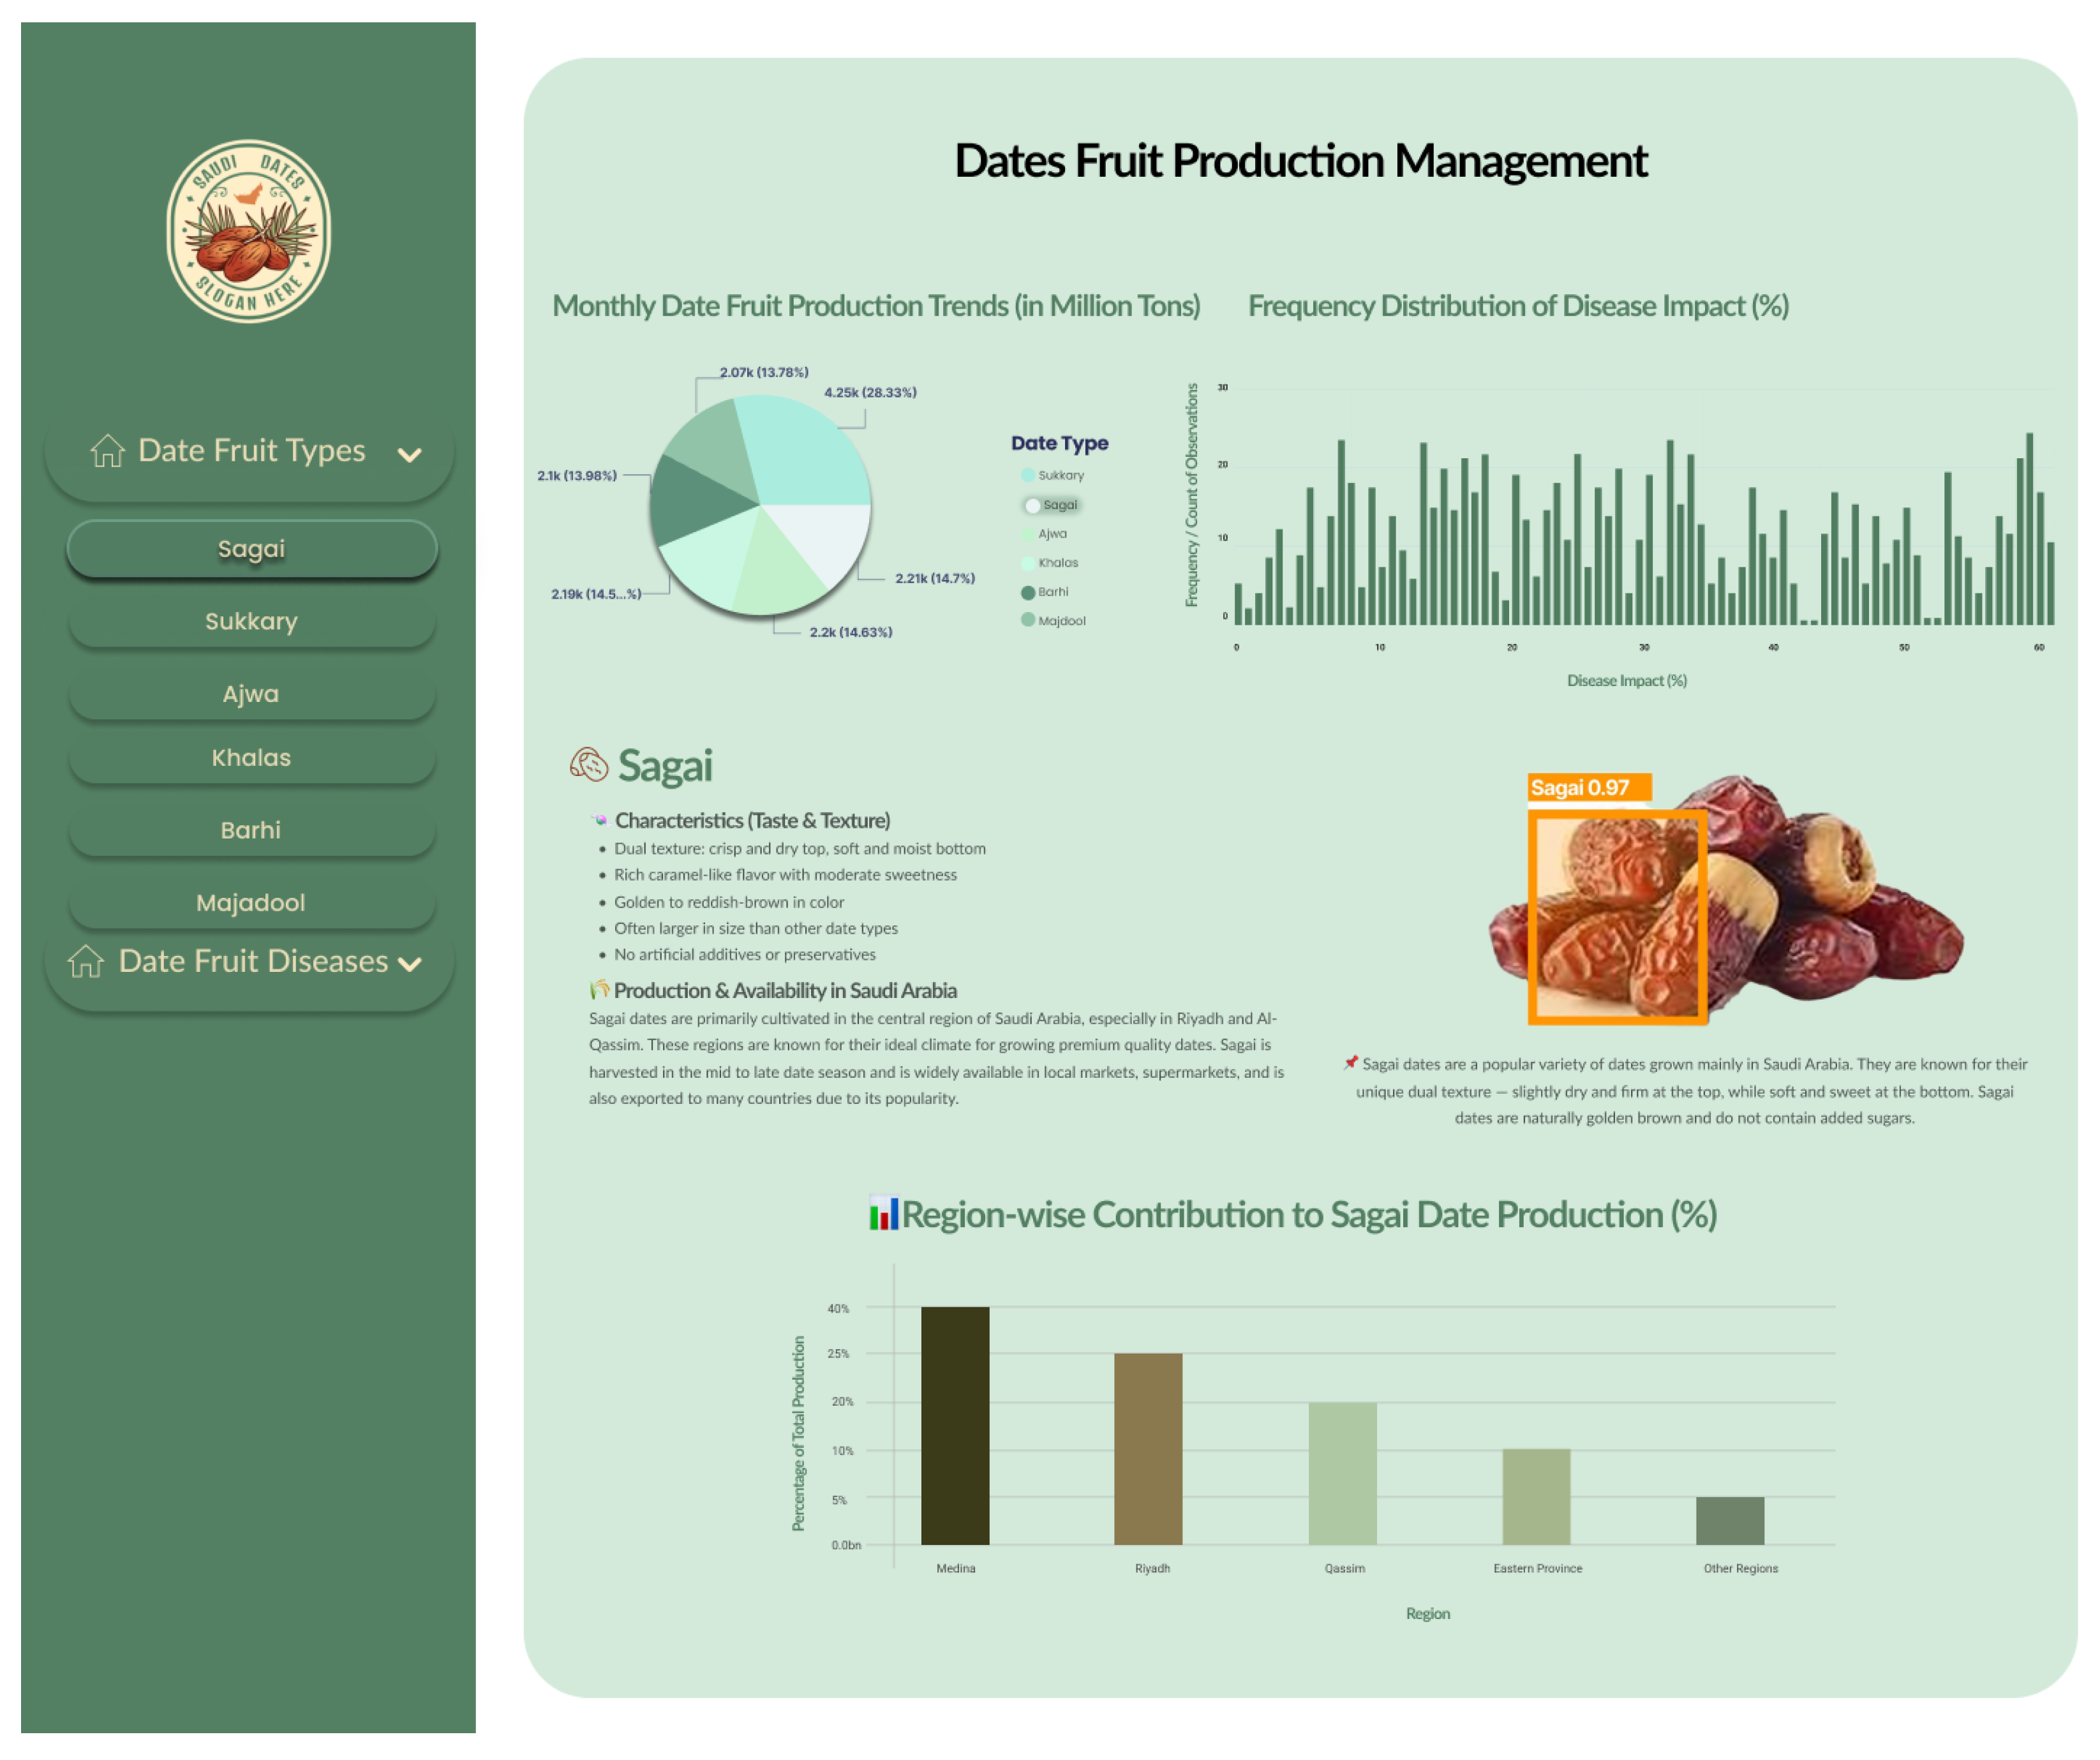
  • Date Type Analytics—Figure 11: This visualization integrates categorical and temporal indicators to present the distribution of dominant date varieties, inter-seasonal yield variability, and comparative productivity levels. It facilitates identification of high-yield cultivars and production imbalances, offering a foundational reference for strategic resource allocation, genetic selection, and market-driven planning. The YOLOv11-Opt model achieved an average classification accuracy of 99.04% and ROC-AUC of 0.9961 across six major varieties (Ajwa, Barhi, Khalas, Medjool, Sagai, and Sukkary), demonstrating highly reliable predictive performance in varietal recognition.
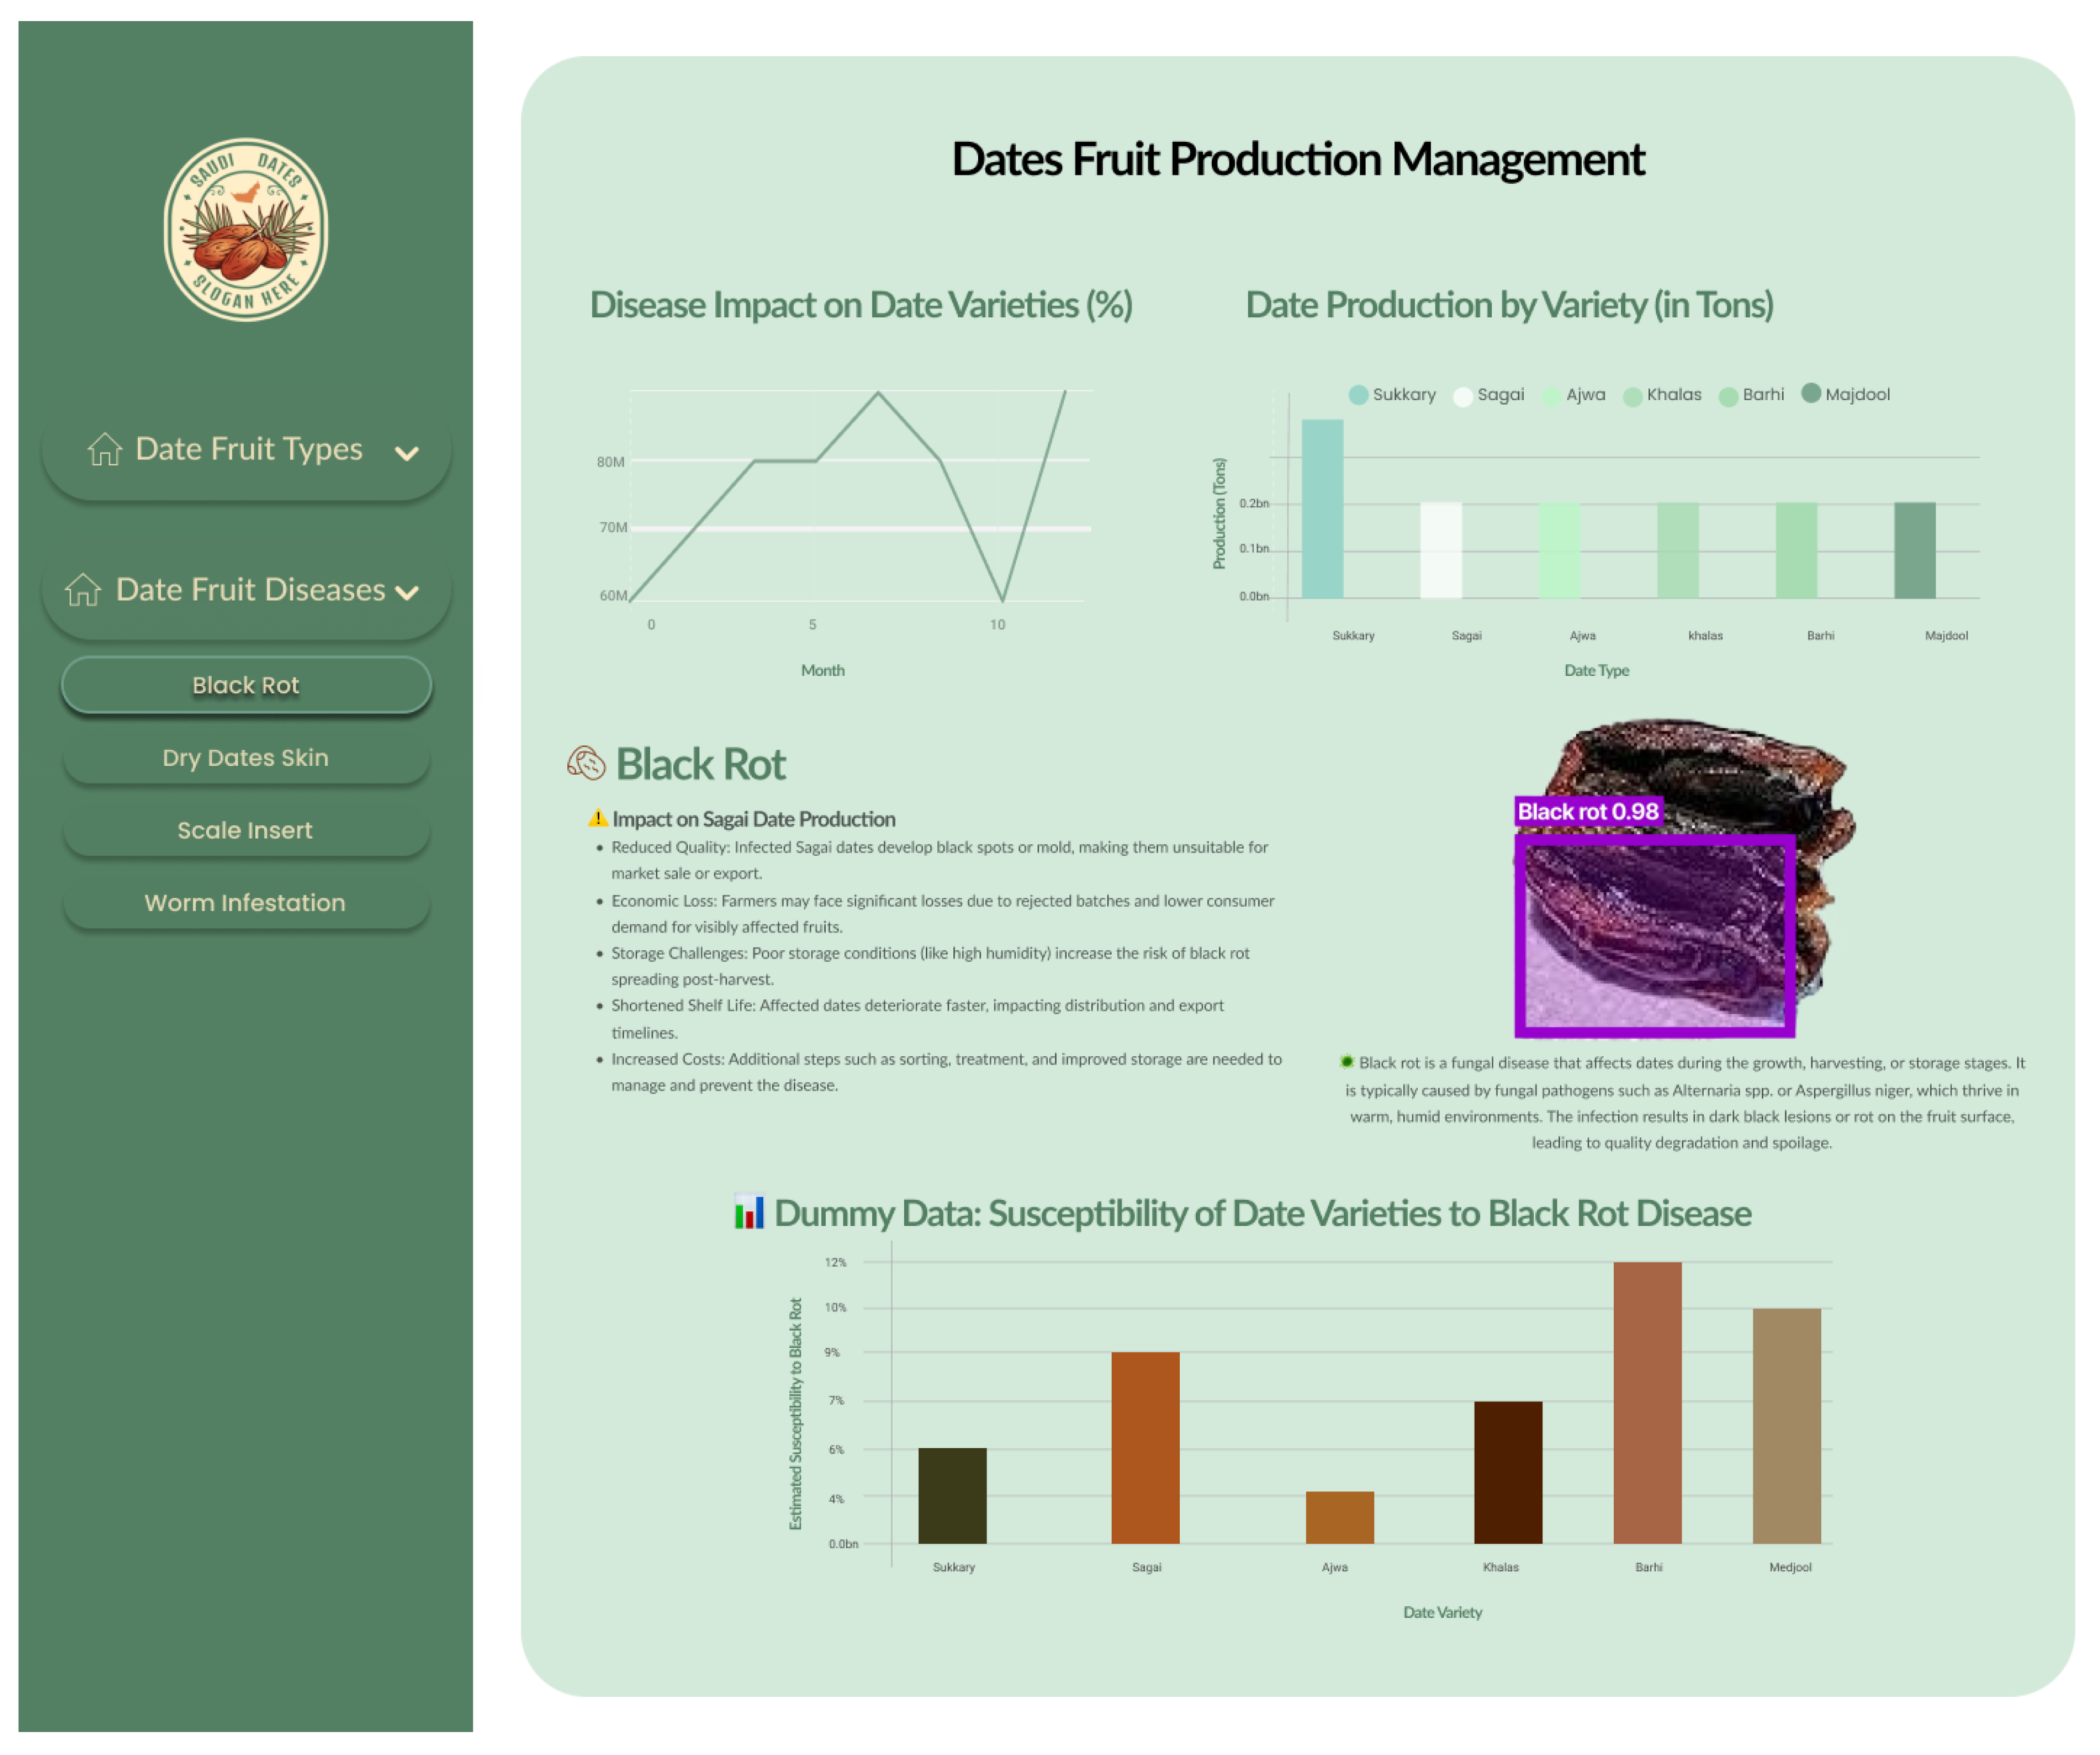
  • Disease Monitoring—Figure 12: The analysis captures disease incidence and severity levels across recorded samples. By highlighting both frequent and sporadic outbreaks, the visualization aids in prioritizing phytosanitary measures and aligning early warning systems with real-time agronomic data. The insights serve as a decision-support layer for surveillance, treatment scheduling, and long-term health risk mitigation. The system demonstrated an average disease detection accuracy of 99.69% and an F1-score of 99.83% across conditions such as Worm Infestation, Black Rot, Scale Insert, and Dry Date Skin, confirming the robustness and precision of the proposed framework in real-world agricultural environments.
The integration of high-resolution prediction results with multidimensional visual analytics, as presented in Figure 11 and Figure 12, exemplifies the proposed intelligent management system’s capability to transform complex agricultural data into actionable knowledge for enhanced yield optimization and disease control. This integrated approach aligns with the overarching goals of precision agriculture, enabling predictive planning, sustainable intensification, and evidence-based interventions across the date production value chain.

4. Conclusions and Future Work

This research presents an AI-driven framework tailored for the intelligent management of date production, focusing on the automated detection of fruit varieties and the classification of post-harvest diseases. The framework integrates the state-of-the-art YOLOv11 object detection architecture with a rigorously optimized variant, YOLOv11-Opt, which incorporates advanced augmentation strategies (e.g., Mosaic, MixUp, CopyPaste), dynamic label assignment methods (SimOTA++), and hyperparameter fine-tuning tailored to the agricultural domain.
The experimental results obtained from real-world datasets of date images, validated the superiority of the YOLOv11-Opt model over its baseline counterpart. Specifically, YOLOv11-Opt achieved an overall classification accuracy of 99.04% in identifying six commercially important date varieties and 99.69% in detecting four major diseases, including worm infestation, black rot, scale insert, and dry date skin. The ROC-AUC scores exceeded 99$ in most cases, reflecting the model’s high discriminative power and robustness under varying visual conditions.
The proposed model effectively addresses the challenge of fine-grained classification in the presence of morphological similarities between fruit types and disease manifestations. Particularly, the optimized model demonstrated a notable improvement in detecting visually complex and frequently misclassified categories—such as dry date skin in the Khalas variety and scale insert across multiple types—where YOLOv11-Opt exhibited superior precision, recall, and F1 scores compared to the baseline.
To further contextualize the findings, a comparative analysis was conducted between YOLOv11-Opt and the widely adopted YOLOv8 model. YOLOv8 achieved an average accuracy of 98.93% and an F1-score of 98.0% for date variety classification, as well as an average accuracy of 98.78% and an F1-score of 98.0% in disease detection. However, its performance declined in fine-grained cases—particularly for scale insert and dry date skin for the Khalas variety, where recall values dropped below 97.5%.
The results confirmed that YOLOv11-Opt outperformed YOLOv8 in varietal classification and disease detection tasks, achieving higher average scores across all key performance metrics. This comparison highlights the practical advantages of our optimized framework in addressing fine-grained recognition challenges within agricultural datasets.
Additionally, this study incorporated an intelligent management system empowered by a smart visual analytics dashboard. This system consolidates multidimensional performance indicators—including disease distribution patterns, seasonal yield dynamics, and variety-specific production metrics—into an interactive and interpretable interface. The dashboard operates as a core component of the intelligent system, enabling real-time monitoring, trend analysis, and anomaly detection based on live agricultural data. By offering transparent and explainable visualizations, it supports informed decision-making for farmers, agricultural engineers, and policymakers. Ultimately, this intelligent management system enhances operational efficiency, facilitates predictive planning, and optimizes resource allocation across the date production lifecycle.
Beyond its empirical contributions, this research advances the application of explainable AI and deep learning in smart agriculture. The modular design of the proposed framework allows for extensibility and adaptability to other horticultural domains, while the model’s real-time performance and lightweight architecture make it suitable for edge deployment on farms and in sorting facilities.
In future work, the system will be extended by incorporating multimodal sensor data, including environmental and geospatial inputs, for context-aware disease prediction, as well as embedding explainable AI (XAI) modules, such as Grad-CAM and SHAP, to provide transparent model interpretations for end-users.

Author Contributions

S.E.S. contributed to the methodology, software development, and data curation. M.A., K.A., and A.A. were involved in validation and provided essential resources. N.A., A.A., and S.A. were responsible for validation, resources, and visualization. S.E.S. contributed to validation and resources. S.E.S. and M.A. collaboratively handled the investigation and formal analysis. S.E.S., N.A., S.A., and M.A. worked on visualization. All authors have read and agreed to the published version of the manuscript.

Funding

This work was supported by the Deanship of Scientific Research, Vice Presidency for Graduate Studies and Scientific Research, King Faisal University, Saudi Arabia, under Project Grant KFU-Creativity-03.

Data Availability Statement

The datasets used and analyzed during the current study are available from the corresponding author upon reasonable request.

Acknowledgments

The authors would like to thank the Department of Management Information Systems and all staff members, as well as the School of Business at King Faisal University, for providing a supportive academic environment. The authors also gratefully acknowledge the generous support from King Faisal University through the Deanship of Scientific Research under Grant No. (KFU-Creativity-03), and the National Research Center for Giftedness and Creativity, for their continued commitment to research excellence.

Conflicts of Interest

The authors declare no conflicts of interest.

References

  1. Badr, A.; Allam, R.; Hassan, E. Advances in Date Palm Production: Challenges and Opportunities. Agric. Food Secur. 2019, 8, 20. [Google Scholar]
  2. Abdullah, M.; Al-Farsi, S. Nutritional Benefits and Health Effects of Dates: A Comprehensive Review. J. Food Sci. 2017, 82, 223–232. [Google Scholar] [CrossRef]
  3. Qazi, I.; Ali, Q.S.; Saad, M.; Ahmad, Z.; Khanb, M.U.; Rabbi, M.K.; ur Rahman, M. Explore the Economic Significance of the Dhakki Date Industry in the Local Region, Including its Contribution to Employment, Income Generation, and Overall Economic Development. Indus J. Biosci. Res. 2023, 1, 1–7. [Google Scholar]
  4. Zaid, A. Date Palm Cultivation; Food & Agriculture Organization: Rome, Italy, 2024. [Google Scholar]
  5. Alkatheri, A.H.; Alkatheeri, M.S.; Cheng, W.H.; Thomas, W.; Lai, K.S.; Lim, S.H.E. Innovations in extractable compounds from date seeds: Farms to future. AIMS Agric. Food 2024, 9, 256–281. [Google Scholar] [CrossRef]
  6. Rahman, M.; Al-Suhaibani, A.; Alghamdi, S. Water Management Strategies for Date Palm Production: A Review of Sustainable Practices. Desalin. Water Treat. 2020, 187, 156–163. [Google Scholar] [CrossRef]
  7. Mohamadizadeh, M.; Dehghan, P.; Azizi-Soleiman, F.; Maleki, P. Effectiveness of date seed on glycemia and advanced glycation end-products in type 2 diabetes: A randomized placebo-controlled trial. Nutr. Diabetes 2024, 14, 37. [Google Scholar] [CrossRef]
  8. Kiesler, R.; Franke, H.; Lachenmeier, D.W. A comprehensive review of the nutritional composition and toxicological profile of date seed coffee (Phoenix dactylifera). Appl. Sci. 2024, 14, 2346. [Google Scholar] [CrossRef]
  9. Al-Wajid, A.; Zawawi, M.; Siddique, M. Therapeutic Potential of Date Palm Seeds and Their Extracts. Pharmacogn. Res. 2018, 10, 289–296. [Google Scholar] [CrossRef]
  10. Majid, M.; Al-Khayri, J.M.; Jain, S.M. Anatomical Assessment of Skin Separation in Date Palm (Phoenix dactylifera L.) Fruit. Agriculture 2024, 13, 38. [Google Scholar]
  11. Himanshu; Kumar, N.; Khangwal, I.; Upadhyay, A. Assessment of nutritional composition, phytochemical screening, antioxidant, and antibacterial activities of date palm (Phoenix dactylifera) seeds. Discover Food 2024, 4, 151. [Google Scholar] [CrossRef]
  12. Karimi, E.; Dehghan, P.; Azizi-Soleiman, F.; Mohamadizadeh, M. Date seed (Phoenix dactylifera) supplementation modulates oxidative DNA damage, lipid peroxidation, and cardiometabolic risk factors in type 2 diabetes: A triple-blinded randomized placebo-controlled trial. J. Funct. Foods 2024, 117, 106226. [Google Scholar] [CrossRef]
  13. Elkeilani, M.; Al-Kayal, A. Biofuel Production from Date Palm By-Products: Current Status and Future Prospects. Renew. Sustain. Energy Rev. 2020, 132, 110037. [Google Scholar] [CrossRef]
  14. Al-Farsi, M.; Lee, C.Y. Nutritional and functional properties of dates: A review. Crit. Rev. Food Sci. Nutr. 2008, 48, 877–887. [Google Scholar] [CrossRef] [PubMed]
  15. Gunnars, K. Medjool Dates: Nutrition, Benefits, and Uses. Healthline. 2024. Available online: https://www.healthline.com/nutrition/medjool-dates (accessed on 7 April 2025).
  16. Al-Shahib, W.; Marshall, R.J. Date fruits (Phoenix dactylifera L.): An overview. Food Res. Int. 2003, 36, 999–1013. [Google Scholar]
  17. Shabani, L.; Rezaee, M.; Azarpazhooh, E.; Ghaffari, H. Phytochemicals and biological activities of Phoenix dactylifera L. (date palm): A comprehensive review. J. Ethnopharmacol. 2022, 285, 114914. [Google Scholar]
  18. Chandio, F.A.; Liu, W.; Shah, S.H. Precision Agriculture and Data-Driven Decision Support for Sustainable Crop Management. J. Agric. Inform. 2021, 12, 1–12. [Google Scholar]
  19. Alawadhi, T.; Alfaris, M.; Alzahrani, M. Artificial Intelligence in Agriculture: A Case Study on Date Palm Farming. J. Agric. Eng. 2022, 8, 232–248. [Google Scholar]
  20. Alaoui, A.O.; Boutaleb Joutei, A. Date Palm Scale and Their Management. World J. Agric. Soil Sci. 2024, 9, WJASS.MS.ID.000710. [Google Scholar]
  21. Aziz, D.; Rafiq, S.; Saini, P.; Ahad, I.; Gonal, B.; Rehman, S.A.; Rashid, S.; Saini, P.; Rohela, G.K.; Aalum, K.; et al. Remote sensing and artificial intelligence: Revolutionizing pest management in agriculture. Front. Sustain. Food Syst. 2025, 9, 1551460. [Google Scholar] [CrossRef]
  22. Mohanty, S.; Hughes, D.; Salathé, M. Using deep learning for image-based plant disease detection. Front. Plant Sci. 2021, 12, 1419. [Google Scholar] [CrossRef]
  23. Ahmed, F.; Malik, H. YOLOv7 for real-time detection of tomato plant diseases in complex backgrounds. Plant Methods 2023, 19, 25. [Google Scholar]
  24. Liu, Y.; Zhang, H. Vision Transformers for plant disease classification: A comparative study. Sensors 2023, 23, 2755. [Google Scholar]
  25. Albarrak, K.M.; Sorour, S.E. Web-Enhanced Vision Transformers and Deep Learning for Accurate Event-Centric Management Categorization in Education Institutions. Systems 2024, 12, 475. [Google Scholar] [CrossRef]
  26. Zhang, Y.; Li, M. Deep residual learning for detection of wheat rust disease. Comput. Electron. Agric. 2022, 197, 106951. [Google Scholar]
  27. Islam, M.; Rahman, M. Fungal infection detection in rice using UAV imagery and EfficientNet. Precis. Agric. 2024, 25, 123–136. [Google Scholar]
  28. Chen, J.; Wang, H. MobileNet-based attention model for real-time apple leaf disease classification. Comput. Electron. Agric. 2023, 206, 107586. [Google Scholar]
  29. Khanam, R.; Ali, M. YOLOv11: A hybrid lightweight model for high-precision object detection in agriculture. IEEE Trans. Image Process. 2024, 33, 1125–1138. [Google Scholar]
  30. Zafar, A. AI-integrated IoT architecture for predictive pest control in precision farming. J. Agric. Inform. 2024, 15, 45–60. [Google Scholar]
  31. Ma, Y.; Chen, L. LSTM-based yield forecasting model for wheat using time-series meteorological data. Agric. Syst. 2022, 195, 103327. [Google Scholar]
  32. Karthik, R.; Manogaran, G. Hyperspectral deep learning model for early sugarcane disease detection. Comput. Electron. Agric. 2022, 194, 106705. [Google Scholar]
  33. Shahid, M.; Zubair, M. IoT-enabled real-time analytics platform for corn nitrogen optimization. Sensors 2023, 23, 1356. [Google Scholar]
  34. Al-Mssallem, I.; Al-Dous, E.; Al-Moammar, K.; Mimida, S.N.; Alothman, Z.; Islam, S.; Alkuraya, A.; Reitz, T.R.; Ahmed, I.; Mahfouz, M.M. Recent developments in date palm genomics and molecular breeding. Front. Genet. 2022, 13, 959266. [Google Scholar]
  35. Tjoa, E.; Guan, C. Explainable AI: A review of methods and applications. Inf. Fusion 2021, 77, 1–15. [Google Scholar]
  36. Zhang, Y.; Sun, W. SHAP-based model interpretation for soybean root rot prediction using ensemble learning. Biosyst. Eng. 2023, 229, 90–102. [Google Scholar]
  37. Khanam, R.; Hussain, M. Yolov11: An overview of the key architectural enhancements. arXiv 2024, arXiv:2410.17725. [Google Scholar]
  38. Jocher, G.; Qiu, J. Ultralytics YOLO11. 2024. Available online: https://github.com/ultralytics/ultralytics (accessed on 1 May 2025).
  39. Liao, Y.; Li, L.; Xiao, H.; Xu, F.; Shan, B.; Yin, H. YOLO-MECD: Citrus Detection Algorithm Based on YOLOv11. Agronomy 2025, 15, 687. [Google Scholar] [CrossRef]
  40. Wang, R.; Zhang, L. Fruit ripeness classification using YOLOv4 and image augmentation on embedded edge devices. Agric. Syst. 2021, 187, 102988. [Google Scholar]
  41. Zhang, H.; Liu, Q.; Chen, W. Research on litchi image detection in orchard using UAV based on improved YOLOv5. Sensors 2023, 23, 1123. [Google Scholar] [CrossRef]
  42. Alahi, A.; Singh, V. A Lightweight YOLO-Based Architecture for Apple Detection on Embedded Systems. Comput. Electron. Agric. 2021, 192, 106573. [Google Scholar] [CrossRef]
  43. Zhao, J.; Huang, L.; Xu, K. YOLOv1 to v8: Unveiling Each Variant—A Comprehensive Review of YOLO. Inf. Fusion 2023, 95, 101786. [Google Scholar]
  44. Bochkovskiy, A.; Wang, C.Y.; Liao, H.Y.M. YOLOv4: Optimal speed and accuracy of object detection. arXiv 2020, arXiv:2004.10934. [Google Scholar]
  45. Sorour, S.E.; Aljaafari, M.; Alarfaj, A.A.; AlMusallam, W.H.; Aljoqiman, K.S. Fine-tuned Vision Transformers and YOLOv11 for precise detection of pediatric Adenoid Hypertrophy. Alex. Eng. J. 2025, 128, 366–393. [Google Scholar] [CrossRef]
  46. Tan, M.; Pang, R.; Le, Q.V. EfficientDet: Scalable and efficient object detection. In Proceedings of the IEEE/CVF Conference on Computer Vision and Pattern Recognition (CVPR), Seattle, WA, USA, 13–19 June 2020; pp. 10781–10790. [Google Scholar]
  47. Liu, T.; Bai, Q.; Torigian, D.A.; Tong, Y.; Udupa, J.K. VSmTrans: A hybrid paradigm integrating self-attention and convolution for 3D medical image segmentation. Med. Image Anal. 2024, 98, 103295. [Google Scholar] [CrossRef] [PubMed]
  48. Ramachandran, P.; Zoph, B.; Le, Q.V. Searching for activation functions. Nat. Commun. 2020, 11, 1–10. [Google Scholar]
  49. Wang, C.Y.; Bochkovskiy, A.; Liao, H.Y.M. Scaled-YOLOv4: Scaling Cross Stage Partial Network. In Proceedings of the IEEE/CVF Conference on Computer Vision and Pattern Recognition (CVPR), Nashville, TN, USA, 20–25 June 2021; pp. 13029–13038. [Google Scholar]
  50. Ding, X.; Zhang, X.; Han, J.; Ding, G. RepVGG: Making VGG-style ConvNets Great Again. In Proceedings of the IEEE/CVF Conference on Computer Vision and Pattern Recognition (CVPR), Nashville, TN, USA, 20–25 June 2021; pp. 13733–13742. [Google Scholar]
  51. Li, C.; Li, L.; Jiang, H.; Weng, K.; Geng, Y.; Li, L.; Ke, Z.; Li, Q.; Cheng, M.; Nie, W.; et al. YOLOv6: A single-stage object detection framework for industrial applications. arXiv 2022, arXiv:2209.02976. [Google Scholar]
  52. Sorour, S.E.; Mine, T.; Goda, K.; Hirokawa, S. A predictive model to evaluate student performance. J. Inf. Process. 2015, 23, 192–201. [Google Scholar] [CrossRef]
  53. Sorour, S.E.; Mine, T.; Goda, K.; Hirokawa, S. Predicting students’ grades based on free style comments data by artificial neural network. In Proceedings of the 2014 IEEE Frontiers in Education Conference (FIE) Proceedings, Madrid, Spain, 22–25 October 2014; pp. 1–9. [Google Scholar]
  54. De Medeiros, A.K.A.; Guzzo, A.; Greco, G.; Van der Aalst, W.M.; Weijters, A.; Van Dongen, B.F.; Saccà, D. Process mining based on clustering: A quest for precision. In Proceedings of the Business Process Management Workshops: BPM 2007 International Workshops, BPI, BPD, CBP, ProHealth, RefMod, semantics4ws, Brisbane, Australia, 24 September 2007; Springer: Berlin/Heidelberg, Germany, 2008; pp. 17–29. [Google Scholar]
  55. Kuhn, M.; Johnson, K. Applied Predictive Modeling; Springer: New York, NY, USA, 2013. [Google Scholar] [CrossRef]
  56. Amigó, E.; Gonzalo, J.; Artiles, J.; Verdejo, F. A comparison of extrinsic clustering evaluation metrics based on formal constraints. Inf. Retr. 2009, 12, 461–486. [Google Scholar] [CrossRef]
  57. Altman, D.G.; Bland, J.M. Diagnostic tests 1: Sensitivity and specificity. BMJ 1994, 308, 1552. [Google Scholar] [CrossRef] [PubMed]
  58. Hanley, J.A.; McNeil, B.J. The meaning and use of the area under a receiver operating characteristic (ROC) curve. Radiology 1982, 143, 29–36. [Google Scholar] [CrossRef]
  59. Everingham, M.; Van Gool, L.; Williams, C.K.I.; Winn, J.; Zisserman, A. The Pascal Visual Object Classes (VOC) Challenge. Int. J. Comput. Vis. 2010, 88, 303–338. [Google Scholar] [CrossRef]
  60. Lin, T.Y.; Maire, M.; Belongie, S.; Hays, J.; Perona, P.; Ramanan, D.; Dollár, P.; Lawrence Zitnick, C. Microsoft COCO: Common objects in context. In Proceedings of the ECCV, Zurich, Switzerland, 6–12 September 2014; Springer: Cham, Switzerland, 2014; pp. 740–755. [Google Scholar]
Figure 1. The framework of the proposed model.
Sustainability 17 05636 g001
Figure 2. The Proposed YOLO V11 Framework.
Sustainability 17 05636 g002
Figure 3. Training accuracy and validation loss curves for YOLOv11-Opt for date types. (a) Training accuracy curve. (b) Validation loss curve.
Sustainability 17 05636 g003
Figure 4. Confusion matrix for date fruit variety classification using YOLOv11-Opt.
Sustainability 17 05636 g004
Figure 5. ROC curves for individual date classes in YOLOv11-Opt classification.
Sustainability 17 05636 g005
Figure 6. Validation loss and training accuracy curves for YOLOv11-Opt in date disease classification. (a) Validation loss curve. (b) Training accuracy curve.
Sustainability 17 05636 g006
Figure 7. Confusion matrix for YOLOv11-Opt disease detection across selected date types.
Sustainability 17 05636 g007
Figure 8. ROC curves for YOLOv11-Opt disease detection by category.
Sustainability 17 05636 g008
Figure 9. Visual detection results for date types using YOLOv11-Opt model.
Sustainability 17 05636 g009
Figure 10. Visual detection of disease and defect types in date fruits using YOLOv11-Opt.
Sustainability 17 05636 g010
Figure 11. Date type distribution analysis using intelligent analytics.
Sustainability 17 05636 g011
Figure 12. Disease impact assessment using intelligent analytics in date production.
Sustainability 17 05636 g012
Table 1. Layer-wise roles and functional contributions of the YOLOv11 architecture components.
LayerFunctional Description
Conv + BN + SiLUImplements convolutional filtering, followed by batch normalization and SiLU activation to facilitate nonlinear feature transformation, improve convergence stability, and enhance representational capacity [48].
CSPBlockEnhances feature reuse and network depth, while reducing computational complexity by partitioning feature maps into cross-stage paths, thus improving learning efficiency and inference speed [49].
RepConvIntroduces a multi-branch convolutional structure optimized during training, which is re-parameterized into a single convolution during inference for speed and memory efficiency [50].
SPPF+Aggregates multi-scale contextual features using an optimized Spatial Pyramid Pooling module, thereby improving detection of objects at varying scales and positions [44].
BiFPN++Provides adaptive feature fusion across scales using a bidirectional weighted mechanism with learnable coefficients, facilitating robust feature propagation and alignment [46].
Decoupled HeadSegregates the detection head into distinct branches for objectness scoring, bounding box regression, and class prediction, improving task specialization and detection accuracy [51].
Table 2. Optimized YOLOv11 training parameters.
ParameterOptimized Value/StrategyContribution/Effect
imgsz640 × 640Enhanced detail capture for small lesions
batch_size32 + gradient accumulation (×2)Balanced memory and convergence
learning_rate0.01 (cosine annealing + warm-up)Stable and effective convergence
weight_decay0.0005Reduced overfitting risk
momentum0.937Smoothed weight updates
optimizerSGD with momentumEffective in large-scale vision models
lr_schedulerCosine annealing (warm-up = 3 epochs)Controlled decay, improved generalization
conf_threshold0.25Balanced precision-recall trade-off
box_loss_gain0.05Focused on localization accuracy
cls_loss_gain0.5Prioritized correct classification
obj_loss_gain1.0Balanced detection objectness
Table 3. Hardware configuration of the experimental setup.
ComponentSpecification
ProcessorIntel(R) Core(TM) i7-8750H @ 2.20 GHz (6 cores, 12 threads)
RAM16 GB
System Architecture64-bit, x64-based
GPUNVIDIA GPU with CUDA support
Operating SystemWindows + WSL2 (Windows Subsystem for Linux)
Table 4. Software dependencies and their version details for full reproducibility.
Library/ToolVersionPurpose
Python3.9.16Primary programming language.
PyTorch1.12.1+cu113Deep learning framework with CUDA 11.3 support.
Torchvision0.13.1Pretrained models and image transforms for PyTorch.
Ultralytics YOLOv8.0.112Model loading, training, and evaluation.
Albumentations1.3.1Data augmentation with field-variation simulation.
Albumentations.pytorchToTensorV2Tensor conversion with channel normalization.
OpenCV (cv2)4.8.0Image reading, resizing, and preprocessing.
scikit-learn1.2.2Data splitting and evaluation metrics.
NumPy1.24.2Numerical array manipulation.
Pandas1.5.3Handling metadata and analysis logs.
Matplotlib3.7.1Plotting training results and confusion matrices.
Seaborn0.12.2Statistical data visualization (e.g., heatmaps).
tqdm4.65.0Progress bar during processing loops.
glob (built-in)-Pattern-based file retrieval.
shutil (built-in)-File operations (copy, move).
os (built-in)-Path and environment management.
random (built-in)-Seed setting for reproducibility.
time (built-in)-Execution time benchmarking.
%matplotlib inline-Notebook-based inline plot rendering.
Table 5. Training parameters and data augmentation settings used in the YOLOv11 fine-tuning process.
ParameterValue
Data Augmentation
Horizontal Flip0.5
Vertical Flip0.2
Rotation0.5
Brightness & Contrast Adjustment0.3
Gaussian Blur0.3
Gaussian Noise0.3
Shift-Scale-Rotate0.5
Coarse Dropout0.3
Convert to Tensor0.1
Training Configuration
Epochs100
Batch Size16
OptimizerSGD
Learning Rate0.1
Weight Decay0.0005
Momentum0.9
DeviceCUDA
Table 6. Comparison of YOLOv11 and YOLOv11-Opt performance results across different date types.
ModelDate TypeAccuracyPrecisionRecallF-ScoreSpecificityROC
YOLOv11Ajwa0.9870.9850.9830.9850.9820.986
Barhi0.9840.9840.9860.9820.9820.987
Khalas0.9750.9750.9760.9730.9820.977
Medjool0.9880.9840.9860.9810.9800.985
Sagai0.9860.9850.9830.9830.9860.987
Sukkary0.9850.9830.9800.9870.9880.981
Avg. Overall0.9860.9820.9820.9810.9820.982
YOLOv11-OptAjwa0.9940.9990.9930.9900.9870.994
Barhi0.9950.9940.9970.9940.9950.996
Khalas0.9960.9960.9930.9940.9950.996
Medjool0.9950.99830.9970.9930.9960.995
Sagai0.9850.9880.9890.9850.9830.993
Sukkary0.9870.9910.9890.9910.9930.992
Avg. Overall0.9900.9900.9930.9950.9950.996
Table 7. Performance of YOLOv11 model in detecting diseases across different date types.
Date TypeDiseaseAccuracyPrecisionRecallF1-ScoreSpecificityROC-AUC
Al AseelWorm Infestation0.9830.9850.9800.9830.9820.989
Black Rot0.9840.9800.9860.9880.9890.985
Dry Date Skin0.9800.9820.9860.9800.9850.982
Scale Insert0.9870.9850.9860.9860.9850.986
SukkaryWorm Infestation0.9850.9800.9810.9760.9760.973
Black Rot0.9810.9820.9880.9900.9850.980
Dry Date Skin0.9860.9850.9800.9730.9700.987
Scale Insert0.9860.9890.9880.9880.9880.989
KhalasWorm Infestation0.9790.9610.9740.9670.9760.984
Black Rot0.9820.9850.9800.9830.9870.974
Dry Date Skin0.9900.9800.9750.9780.9770.983
Scale Insert0.9870.9760.9790.9790.9840.987
Average Overall0.9850.9860.9850.9870.9880.986
Table 8. YOLOv11-Opt performance results for different date types and diseases.
Date TypeDiseaseAccuracyPrecisionRecallF1-ScoreSpecificityROC-AUC
Al AseelWorm Infestation0.9900.9960.9990.9970.9980.993
Black Rot0.9980.8950.9990.9920.9950.993
Dry Date Skin0.9920.9930.9940.9990.9970.993
Scale Insert0.9950.9970.9930.9930.9960.995
SukkaryWorm Infestation0.9950.9930.9940.9980.9960.997
Black Rot0.9930.9900.9920.9960.9910.998
Dry Date Skin0.9970.9980.9990.9940.9920.998
Scale Insert0.9970.9990.9900.9930.9960.998
KhalasWorm Infestation0.9990.9950.9960.9990.9870.993
Black Rot0.9920.9980.9980.9930.9950.992
Dry Date Skin0.9910.9920.9960.9990.9980.995
Scale Insert0.9960.9980.9940.9980.9980.991
Average Overall0.9970.9940.9940.9980.9930.996
Table 9. Object detection performance in terms of mAP metrics across IoU thresholds.
ModelmAP@0.5mAP@0.5:0.95
YOLOv11—Date Type0.9790.974
YOLOv11-Opt—Date Type0.9890.995
YOLOv11—Disease Detection0.9810.987
YOLOv11-Opt—Disease Detection0.9931.000
Disclaimer/Publisher’s Note: The statements, opinions and data contained in all publications are solely those of the individual author(s) and contributor(s) and not of MDPI and/or the editor(s). MDPI and/or the editor(s) disclaim responsibility for any injury to people or property resulting from any ideas, methods, instructions or products referred to in the content.

