Abstract
Global energy transition has driven exponential growth in lithium demand, fueled by advancements in new energy vehicles and battery technologies. Despite abundant lithium resources, volatile market fluctuations underscore the critical need for the accurate monitoring of production capacity. Brine-type lithium resources, accounting for approximately 65% of the global reserves, are concentrated in the “lithium triangle” region of South America (Chile, Argentina, and Bolivia). This region typically employs solar evaporation ponds to extract lithium from brine, where lithium production directly correlates with the pond area, enabling remote sensing-based capacity monitoring. This study focuses on Chile’s Atacama Salt Lake, utilizing long-term Landsat and Sentinel satellite data (1985–2019) to extract evaporation pond areas through visual interpretation and support vector machine (SVM) classification. We further investigated the relationship between salt pond area and lithium production capacity by establishing a linear conversion formula. The results demonstrated a strong correlation (R2 = 0.91), with over 97% of the data points falling within the 95% prediction band, validating the effectiveness of the method. This study proposes a semi-automated monitoring framework for lithium production capacity in salt lake brine systems, offering novel insights for sustainable lithium resource management and supporting the stable development of energy transition.
1. Introduction
Lithium, also known as “white petroleum” and the “green energy metal”, is extensively used in batteries, pharmaceuticals, chemical industries, metallurgy, and nuclear technology [1,2,3]. With the rapid development of new energy batteries, the demand for lithium products has surged exponentially. In recent years, lithium resources have gained strategic importance globally, prompting major economies to intensify their focus on securing lithium supplies and leading to increasingly fierce competition for lithium reserves.
According to the latest data from the United States Geological Survey (USGS), global lithium resources reached approximately 115.14 million tons by the end of 2023 [4]. These resources are categorized into three types: brine (64%), hard rock (26%) [5,6,7,8], and clay (10%) (Figure 1a). Brine-type lithium is further classified into salt lake brine (58%) and underground brine (6%). Salt lake brine lithium deposits have become the main focus of mining companies around the world owing to the rich resources of deposits, the comprehensive utilization of multiple resources, and low development costs [9,10]. Geographically, lithium reserves are concentrated in Bolivia, Argentina, the United States, Chile, Australia, and China, with the “lithium triangle” region in South America (Bolivia, Argentina, and Chile) accounting for nearly 50% of global reserves (Figure 1b).
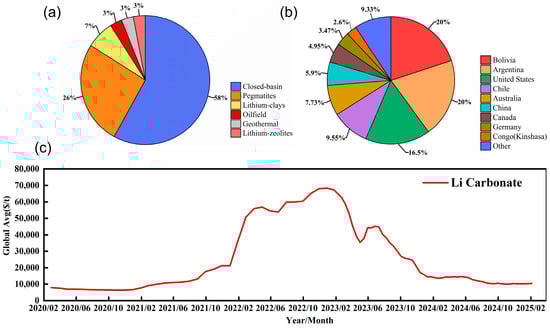
Figure 1.
Overview of global lithium resources: (a) various types; (b) distribution by country; (c) average lithium carbonate spot price.
According to S&P Global Commodity Insights [11], the average global spot price of lithium carbonate surged from USD 7908 per ton in February 2020 to USD 68,366 per ton by the end of 2022, an over eight-fold increase in less than two years. However, by April 2023, prices had plummeted sharply, reaching USD 10,469 per ton as of February 2025 (Figure 1c). This extreme volatility stems from supply–demand imbalances and market sentiment fluctuations, underscoring the critical need for robust production capacity monitoring of major lithium projects to stabilize the energy transition.
Salt lake brine, a primary lithium source (Figure 1a), typically forms in arid closed basins under harsh environmental conditions, which makes manual monitoring costly and inefficient. Remote sensing technology offers distinct advantages for monitoring lithium production, including extensive coverage, real-time dynamics, cost-effectiveness, and traceability.
Previous studies have extensively applied remote sensing to hard rock-type lithium deposits (e.g., lithium-bearing pegmatites) for mineral exploration, mapping, and feature extraction [12,13,14,15,16]. However, research on monitoring the production capacity of salt lake brine lithium deposits remains scarce. Chile is endowed with one of the highest solar potentials in the world [17]. This study focuses on Chile’s Atacama Salt Lake and employs a multi-method analysis of long-term remote sensing imagery to monitor changes in evaporation pond areas. By correlating these changes with production data, we comprehensively evaluated the relationship between pond area and lithium output, providing a novel framework for capacity monitoring in brine-type lithium systems.
2. Study Area
This study focuses on Chile’s Atacama Salt Lake or Salar de Atacama (Figure 2), located between 23°25′56″–23°43′36″ S and 68°16′01″–68°29′12″ W, approximately 280 km east of Antofagasta, Chile’s second-largest city. Situated within a closed basin bounded by the Cordillera de la Sal, Domeyko Mountains, and Andean Plateau, the salt lake lies at the tri-border region of Chile, Bolivia, and Argentina—collectively termed the “lithium triangle” due to its abundant brine lithium resources. According to the 2023 USGS report, the “lithium triangle” holds 52 million tons of lithium resources, accounting for over 50% of global reserves, positioning it as the world’s most critical lithium supply base [4].
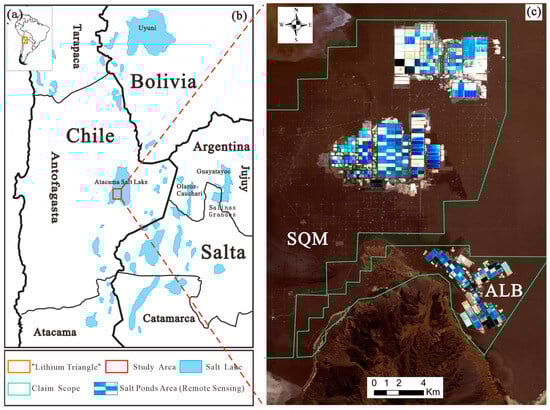
Figure 2.
Location map of the study area: (a) approximate location of the “lithium triangle” in South America; (b) area of the “lithium triangle”; (c) remote sensing image of Atacama Salt Lake. SQM: Sociedad Química y Minera de Chile S.A. ALB: Albemarle Corporation of the U.S.
Since the Miocene, intensive volcanic activity in the region has formed widespread tuff and dacite deposits. Lithium-rich geothermal waters interact with salt-bearing strata, creating a dual recharge system unique to the salt lake. Under arid climatic conditions, prolonged water–rock interactions and intense solar evaporation concentrate brine, leading to the precipitation of salt minerals (such as halite, sylvanite, and carnallite). Lithium ions, characterized by high solubility, accumulate in brine and are preserved within shallow interstitial brines and thick halite (NaCl) deposits [8]. Atacama Salt Lake exhibits exceptional lithium enrichment, with an average lithium concentration of 1500 ppm in the interstitial brines. At depths of 50–350 m, concentrations reach 2000–4000 mg/L [18], making it a globally significant lithium resource. Lithium extraction from Atacama Salt Lake began in 1969. In 1994, Sociedad Química y Minera de Chile (SQM) established evaporation ponds in the northern part of the lake and initiated lithium carbonate production at a facility near the Port of Antofagasta in Carmen Salt Lake. Today, Atacama Salt Lake is the largest lithium-producing salt lake globally, contributing approximately 25% of the world’s lithium reserves [19], and ranks as the third-largest salt lake.
3. Materials and Methods
3.1. Data Acquisition and Processing
3.1.1. Remote Sensing Data Acquisition and Processing
This study aimed to monitor the long-term changes in the salt pond area and, considering the time scale, spatial, and temporal resolution requirements, selected remote sensing images from Landsat 5 (1985–2011), Landsat 7 (2012), Landsat 8 (2013–2014), and Sentinel 2 (2015–2019) satellites, totaling 70 scenes, all with cloud cover below 5% (Table 1). The Landsat series remote sensing image data were sourced from the US Geological Survey website, and Sentinel 2 satellite image data were obtained from the European Space Agency.

Table 1.
Basic information on remote sensing data.
For the above 1985–2019 remote sensing image data, preprocessing, including de-clouding, radiometric calibration, geometric correction, image mosaicking, and cropping, was performed using SNAP 10.0, ENVI 5.6.3, and ArcGIS 10.8 software [20,21,22]. Image enhancement is performed to improve the visual effect of an image or transform an image into a form more suitable for human or computer analyses. Color compositing is a basic method for remote sensing image enhancement, accounting for differences in band-specific information content and correlation among different remote sensing satellites. In this study, the areas of salt ponds in Atacama Salt Lake were extracted, and based on the results of several experiments, Landsat TM(ETM+) 543, Landsat OLI 654, and Sentinel MSI 843 were selected, with remote sensing image resolutions of 30, 30, and 10 m, respectively. A color composite image of the prominent salt pond (Figure 3) was obtained for visual interpretation and automatic extraction. The salt pond consists of several small regular rectangles with distinct borders and is dark or light blue in false color. The different colors of the salt ponds represent the different stages of evaporation from the salt ponds, and this is also the case in this study, which considers the area of the salt ponds.
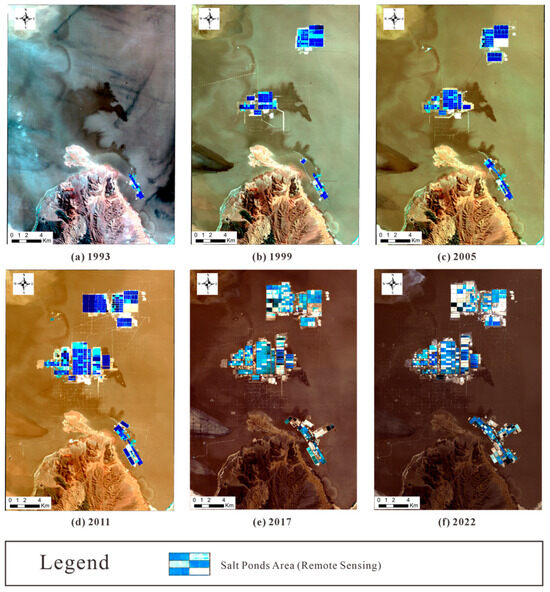
Figure 3.
Remote sensing image maps of solar ponds by typical year.
3.1.2. Production Data Acquisition
The mineral rights of Atacama Salt Lake are vested in the Chilean state, which is jointly operated by the Sociedad Química y Minera de Chile S.A. (SQM) and Albemarle Corporation (ALB) of the U.S., according to the lease area (Figure 2). SQM is mainly engaged in the production and sale of fertilizers, iodine, potassium, and lithium, and is 23.75% owned by China’s Tianqi Lithium. ALB is a global specialty chemical company that focuses on lithium chemicals, high-performance materials, bromine chemicals, and catalysts. Capacity is the theoretical value that refers to the production capacity and the highest output value that can be theoretically achieved. Production is the actual value, which refers to the quantity produced. Compared with capacity data, lithium production data can more directly reflect lithium resource mining and production in salt ponds and are easier to obtain and track. Therefore, this study uses the actual annual production data instead of theoretical capacity data, which is more practical. We fitted the data using actual production and salt pond area to derive a model curve, enabling the monitoring of the theoretical production capacity of the salt lake. Lithium carbonate is a key intermediate product in the lithium industry chain, and its output can better reflect the overall utilization of lithium resources. According to the annual reports disclosed by two companies, SQM and ALB, and previous research [23], the production data for lithium carbonate, lithium hydroxide, and Eq. lithium (short for metallic lithium equivalents) were obtained from 1985 to 2019 (Table 2 and Figure 4).
Table 2.
Lithium brines production, Chile, 1985–2019 (Salar de Atacama).
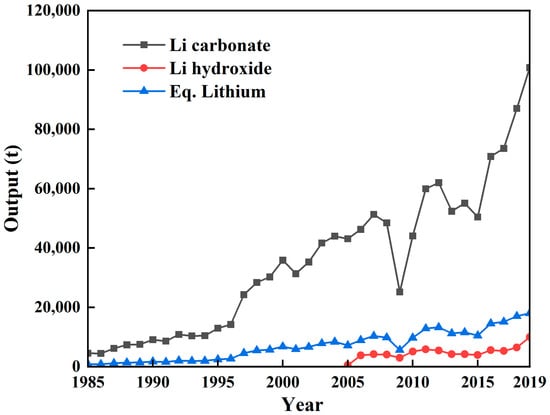
Figure 4.
Chart of changes in production by year.
3.2. Production Capacity Monitoring Method
3.2.1. Basic Process of Salt Lake Mineral Production
Lithium extraction from salt lake brine typically involves initial brine concentration, followed by separation and purification techniques to yield lithium products (lithium carbonate, etc.) [24]. Current methods include solar evaporation, membrane separation, adsorption, and solvent extraction [25,26,27], with the choice depending on brine composition (e.g., lithium content and Mg/Li ratio) and mineralogical characteristics. The Atacama Salt Lake brine, classified as the sulfate-magnesium subtype, exhibited a high lithium concentration (0.15%) and a low Mg/Li ratio (6.4). Its arid climate and minimal precipitation enable cost-effective, large-scale solar evaporation ponds to concentrate on brine and recover lithium via precipitation. This method is environmentally sustainable, has a low cost, and allows the co-production of potassium salts and other byproducts. Brine is pumped into evaporation ponds, where the pond area directly influences lithium production capacity. Satellite remote sensing facilitates the efficient long-term monitoring of pond area dynamics, enabling production trend analysis.
Currently, Atacama Salt Lake, operated by SQM and ALB, extracts lithium from well salts through a solar evaporation process (Figure 5) [28,29]. Brine is first pumped into solar evaporation ponds, where sequential stages—including sodium salt and gypsum (CaSO4·2H2O) ponds, potassium mixed-salt ponds, and carnallite (KMgCl3·6H2O) ponds—gradually concentrate lithium-rich brine (5–6% Li) through solar-driven evaporation. This process requires 12 to 18 months. The enriched brine is then transported to a lithium carbonate processing plant, where boron is removed via solvent extraction, and calcium/magnesium impurities are precipitated using Na2CO3 and lime. Lithium carbonate (Li2CO3) is subsequently precipitated by further Na2CO3 addition. A portion of Li2CO3 is converted to lithium hydroxide (LiOH) in a dedicated processing plant to meet the capacity requirements [30,31].
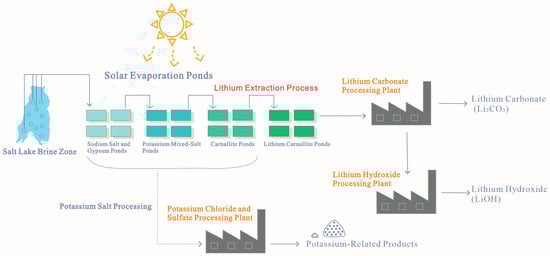
Figure 5.
Schematic diagram of the production process of salt lake brine.
3.2.2. Salt Pond Area Monitoring Method
Visual interpretation is the process of identifying the target features by human eyes based on a priori knowledge of the relevant features of the surface objects and searching for the corresponding feature targets in remote sensing images. Manual visual interpretation is highly accurate in recognizing simple features, but its work efficiency is low, which consumes considerable manpower and time [32]. Therefore, this paper introduces a supervised classification technique to realize the semi-automatic extraction of the salt lake area, which improves the working efficiency and has certain advantages over the traditional manual visual interpretation. Supervised classification is used to establish a recognition model using the eigenvalues of known sample pixels and then using the established recognition model to classify and select training samples. Support vector machine (SVM) is a type of supervised learning classification method that utilizes margin theory to find the best decision boundary in the feature space for efficient classification and regression analysis. Compared to other commonly used supervised classification methods (Random Forest, Decision Tree, Gradient Boosting Machines, etc.), the support vector machine has the advantages of self-learning and strong generalization ability and is widely used [33,34,35,36]. In this study, we extracted the area of the salt pond by year (Figure 6) using visual interpretation and the SVM algorithm to ensure accuracy and high efficiency.
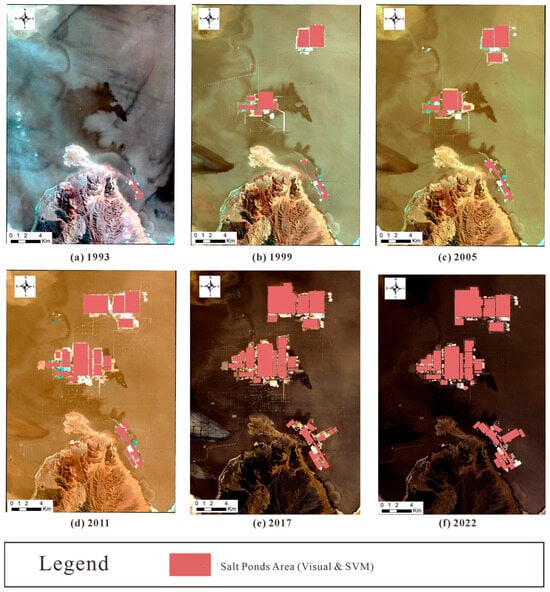
Figure 6.
Extraction map of solar ponds area by typical year.
3.3. Capacity Monitoring Methodology Process
In this study, remote sensing images from 1985 to 2019 were used as data sources, which were statistically analyzed using GIS technology for the salt lake area and fitted with the production data obtained by combining collation and analysis to monitor changes in the production capacity of Atacama Salt Lake. The main method flow is as follows (Figure 7): (1) Remote sensing imagery from various satellites spanning 1985 to 2019 was selected for comprehensive analysis. The images underwent preprocessing, including cloud removal, radiometric calibration, geometric correction, mosaicking, and cropping. Based on band characteristics and visual interpretation requirements, specific band combinations were selected for color compositing to enhance the visualization of salt ponds. These enhanced color composites were then used for both the visual interpretation and automatic extraction of the salt ponds. (2) Based on Google Earth high-resolution images, the area of salt ponds in the study area in each year was defined and calculated using manual visual interpretation to ensure the accuracy of the area results. In order to further automate the monitoring of salt pond area, the SVM algorithm was used to supervise the classification of salt ponds, randomly and uniformly select sample points, and verify the overall accuracy and Kappa coefficient after classification. Finally, the area change data were statistically analyzed using GIS technology. (3) By reviewing the annual reports of each company and the literature, we organized and statistically analyzed the production data of lithium-related products in the salt pond each year. (4) We fitted the salt pond area data and production data to the model, and analyzed them to obtain a linear relationship between the two, and finally comprehensively evaluated the accuracy and validity of the results obtained.
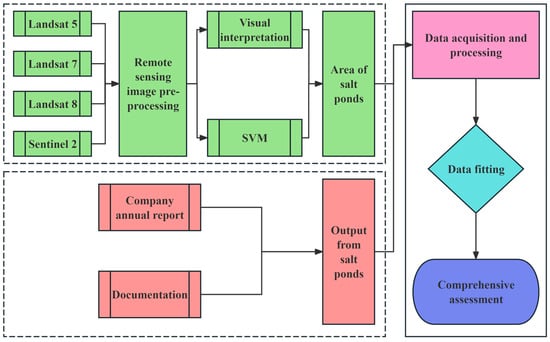
Figure 7.
Technology roadmap.
4. Results
4.1. Salt Pond Area Extraction Results
Based on ENVI and ArcGIS software, remote sensing images after false-color compositing for different periods of Atacama Salt Lake, combined with Google Earth high-resolution live maps, were used to carry out the salt pond area extraction. The initial visual interpretation ensured the accurate delineation of the annual salt pond boundaries. To automate monitoring, a support vector machine (SVM) algorithm was applied for supervised classification. Training samples were randomly and uniformly selected from the regions of interest (ROIs) defined on the false-color composites. The SVM algorithm in the supervised classification module of ENVI software was utilized for classification, and the final classification result of the SVM algorithm was obtained with an overall accuracy of 98.98% and a Kappa coefficient of 0.91, which is highly reliable. The ArcGIS-derived area calculations closely matched the manual interpretation results, validating the efficacy of the method (Table 3 and Figure 8).
Table 3.
Table of changes in the area of Salar de Atacama.
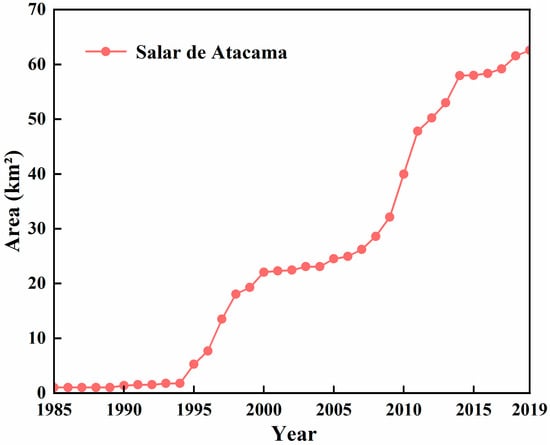
Figure 8.
Statistical map of changes in the area of Salar de Atacama.
From 1985 to 2019, the total salt pond area increased from 1.037 km2 to 62.594 km2, with a net expansion of 61.557 km2. Growth rates varied significantly across the following periods: (1) Slow expansion: 1985–1989, 1992, 1994, 2001–2004, and 2015–2016. (2) Moderate growth: 2005–2006, and 2017–2019. (3) Rapid expansion: 1990–1991, 1993, 1995–2000, and 2007–2014. The most pronounced annual increases occurred in 1995 (198.87% growth rate) and 2010 (absolute increase of 7.848 km2).
4.2. Linear Regression Model
To investigate the correlation between salt pond area and lithium production capacity in Atacama Salt Lake, this study employs readily available and operationally relevant production data for regression analysis. Lithium production metrics, standardized to metallic lithium equivalents for consistency, were derived from lithium carbonate, hydroxide, and metal outputs to ensure a comprehensive and accurate representation. As illustrated in Figure 9, metallic lithium production exhibited a distinct linear relationship with the salt pond area. To mitigate the risk of overfitting, a univariate linear regression model was used to establish a quantitative relationship between these variables. The resulting equation is as follows:
where y represents the metallic lithium equivalents, x denotes the salt pond area, and a and b are constants. By bringing in the salt pond area and metallic lithium equivalent data from 1985 to 2019, we obtained a = 220 and b = 1500. R2 = 0.91, and more than 97% of the data points were within the 95% prediction band, indicating a strong correlation. Coefficient a, equivalent to productivity per square kilometer, reflects the influence of geological conditions (e.g., brine enrichment), extraction efficiency, and processing technologies. The intercept b serves as an adjustment constant, accounting for baseline production. With R2 = 0.91 and over 97% of the data points within the 95% prediction band (Figure 9), the model confirms a strong linear correlation between the salt pond area and lithium output. Notably, the model is valid for x > 1.5 km2, aligning with operational thresholds observed in Atacama Salt Lake.
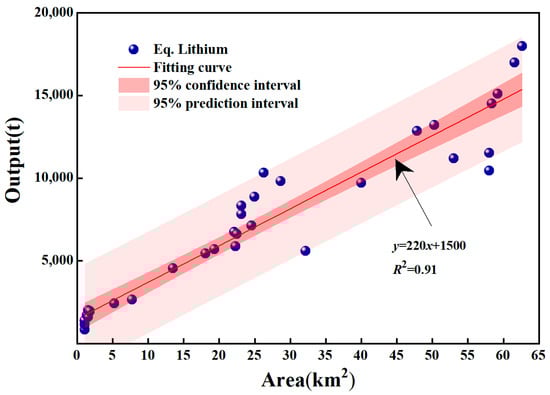
Figure 9.
Trend plot of Salar de Atacama area fitted to yield.
5. Discussion
The above results have initially proved the scientificity and accuracy of the method process, but the actual output of the salt lake lithium mining project is affected by many aspects. Changes in supply and demand lead to price volatility, which further affects changes in production. Changes in supply and demand lead to price volatility, which further affects changes in production. As illustrated in Figure 9, the 2009 global financial crisis severely impacted lithium-intensive sectors such as automotive and construction, triggering a 25% decline in global lithium demand (to 68,500 t lithium carbonate equivalent) [37]. This decline in demand directly reduced metallic lithium production that year. Similarly, in 2013, weakened industrial demand and factory closures further suppressed lithium output. Conversely, exponential growth in lithium production occurred during 2015–2019, driven by rapid advancements in new energy batteries [38]. Technological innovations also critically influenced production trends. For instance, Sociedad Química y Minera de Chile (SQM) achieved a 48,000 t/year lithium carbonate capacity expansion in 2011, significantly boosting output. Furthermore, Albemarle Corporation (ALB) enhanced production efficiency through novel extraction technologies developed in 2017 [39]. In other aspects, despite increased CSR efforts, social activism against salt lake expansions have increased in intensity and scale, and have mobilized from local to national [40]. While demand fluctuations, technological upgrades, and price volatility contribute to short-term variations in actual production, the underlying production capacity remains objectively constrained by the physical scale of evaporation ponds. The remote sensing-based monitoring of pond area dynamics thus provides a robust indicator for tracking fundamental capacity changes.
However, the scope of application for the methods described above is subject to limitations. These methods are applicable to Atacama Salt Lake and its surrounding regions because climatic conditions—such as solar irradiance, evaporation temperature, evaporation rate, and precipitation—exhibit significant similarity there. This consistency results in comparable average evaporation efficiencies within salt ponds. For salt lakes in other regions, applicability is constrained by both climatic variations and differences in lithium extraction technologies employed. Nevertheless, as long as lithium is extracted via the solar evaporation pond method (solar concentration and precipitation), the constants a and b in the aforementioned equations need to be adjusted accordingly, and the model remains viable for production capacity monitoring. In future research, we will further investigate influencing factors such as climatic conditions and technological methodologies to develop a more accurate fitting model.
The equations and experimental results presented in this paper demonstrate the feasibility of monitoring changes in salt pond areas as a means to infer changes in brine-type lithium resource reserves within salt lakes, indicating promising future applications. Monitoring these reserves is critically important for two primary reasons. First, brine-type lithium resources constitute nearly seventy percent of the world’s total lithium reserves [41]. Second, the disorderly expansion of lithium production leads to significant price volatility, which is detrimental to the stability of the lithium industry and, by extension, the broader energy transition. By enabling the monitoring of lithium mining projects—both under construction and operational—alongside accurate estimates of current and projected production capacity, this approach, when combined with forecasts of lithium demand driven by the energy transition, can provide vital guidance for national regulatory decisions and corporate investment strategies.
6. Conclusions
This study monitored the salt pond area of Atacama Salt Lake, Chile, based on long-series remote sensing images, and linearly fitted it with the 35-year lithium production data of the area to obtain the linear equation between metallic lithium equivalents and salt pond area, which provides a new idea and method for monitoring the brine-type lithium mineral energy of salt lakes.
- Based on remote sensing visual interpretation and SVM technology, the area of the salt pond in Atacama Salt Lake was extracted for each year from 1985 to 2019. The total area of the salt pond has increased annually, with a total increase of approximately 62 km2. During this period, lithium metal production increased from 847 tons to 18,000 tons.
- In the process of lithium extraction using the salt pond concentration and precipitation method, the increase in production is inevitably accompanied by an increase in the area of the salt pond. Therefore, this study used the area of the salt pond and the production data for linear fitting in order to obtain the relationship between the two equations, showing that the two have a high correlation between them, and the R2 of the 35 years of the fitted data reaches 0.91, which fully proves the feasibility of the method.
- Although Formula 1 proposed in this study still has application limitations, and influencing factors such as climatic conditions and technical methods need to be further explored in subsequent studies, it provides new ideas for monitoring the production of brine lithium minerals in salt lakes and can contribute to the sustainability of the new energy transition.
Author Contributions
Conceptualization, J.X. and S.L.; methodology, J.X. and Y.Z.; software, S.L. and Y.Z.; validation, J.X. and P.W.; formal analysis, J.X. and P.W.; investigation, J.X. and S.L.; resources, J.X.; data curation, S.L.; writing—original draft preparation, Y.L. and J.X.; writing—review and editing, Y.L. and J.X.; visualization, Y.L. and S.L.; supervision, J.X.; project administration, J.X.; funding acquisition, J.X. All authors have read and agreed to the published version of the manuscript.
Funding
This research was financially supported by the National Natural Science Foundation of China (NNSFC, project No. 42002298) and the Chinese Geological Survey (project No. DD20230900203).
Institutional Review Board Statement
Not applicable.
Informed Consent Statement
Not applicable.
Data Availability Statement
Data are contained within the article.
Conflicts of Interest
The authors declare no conflicts of interest.
References
- Gil-Alana, L.A.; Monge, M. Lithium: Production and estimated consumption. Evidence of persistence. Resour. Policy 2019, 60, 198–202. [Google Scholar] [CrossRef]
- Schulz, K.J.; DeYoung, J.H.; Seal, R.R.; Bradley, D.C. Critical Mineral Resources of the United States: Economic and Environmental Geology and Prospects for Future Supply; U.S. Geological Survey: Reston, VA, USA, 2017.
- Xu, S.; Song, J.; Bi, Q.; Chen, Q.; He, T. Extraction of lithium from Chinese salt-lake brines by membranes: Design and practice. J. Membr. Sci. 2021, 635, 119441. [Google Scholar] [CrossRef]
- USGS. Lithium in US Geological Survey. In Mineral Commodity Summaries; U.S. Geological Survey: Reston, VA, USA, 2023. [Google Scholar]
- Bowell, R.J.; Lagos, L.; Hoyos, C.R.D.L.; Declercq, J. Classification and Characteristics of Natural Lithium Resources. Elements 2020, 16, 259–264. [Google Scholar] [CrossRef]
- Kesler, S.E.; Gruber, P.W.; Medina, P.A.; Keoleian, G.A.; Wallington, T.J. Global lithium resources: Relative importance of pegmatite, brine and other deposits. Ore Geol. Rev. 2012, 48, 55–69. [Google Scholar] [CrossRef]
- Wen, M.J.; Da, Y.S.; Qing, X.G.; Wei, S.S.; Qi, Z.; Bao, G.Y.; Xiang, L.; Fang, F.X.; Jing, C.; Lin, Z.Z.; et al. New advances on metallogenic studies and exploration on critical minerals of China in 21st century. Miner. Depos. 2019, 38, 935–969. [Google Scholar]
- Zhuo, W.; Xiao, H.R.; Tian, W.D.; Ming, X.F.; Wei, S.; Hui, Z.D.; Dong, Z.Y. The basic characteristics and development potential evaluation of salt lake brine-type lithium deposits. Geol. China 2023, 50, 102–117. [Google Scholar]
- Li, J.; Li, T.; Ma, Y.; Chen, F. Distribution and origin of brine-type Li-Rb mineralization in the Qaidam Basin, NW China. Sci. China Earth Sci. 2022, 65, 477–489. [Google Scholar] [CrossRef]
- Lijun, L.; Denghong, W.; Xifang, L.; Jiankang, L.; Hongzhang, D.; Weidong, Y. The main types, distribution features and present situation of exploration and development for domestic and foreign lithium mine. Geol. China 2017, 44, 263–278. [Google Scholar]
- S&P Global Market Intelligence. Price Chart. Available online: https://www.capitaliq.spglobal.cn/web/client?auth=inherit#industry/priceChart (accessed on 15 June 2025).
- Chen, L.; Zhang, N.N.; Zhao, T.Y.; Zhang, H.; Chang, J.Y.; Tao, J.T.; Chi, Y.J. Lithium-Bearing Pegmatite Identification, Based on Spectral Analysis and Machine Learning: A Case Study of the Dahongliutan Area, NW China. Remote Sens. 2023, 15, 2. [Google Scholar] [CrossRef]
- Chi, L.T.; Ru, W.D.; Liang, Z.; Fu, F.R. Classification and change analysis of the substrate of the Yongle Atoll in the Xisha Islands based on Landsat8 remote sensing data. Remote Sens. Nat. Resour. 2023, 35, 70–79. [Google Scholar]
- Han, Y.; Yi, Z. County–level natural resource survey in western China based on both GF--6 images and the third national land resource survey results. Remote Sens. Nat. Resour. 2023, 35, 277–286. [Google Scholar]
- Jun, Y.F.; Wang, X.X.; Min, Y.J.; Nan, W.L.; Xia, G.X. A technology for identifying Li-Be pegmatite using ASTER remote sensing data in granite of Gobi shallow-covered area:A case study of recognition and prediction of Li-Be pegmatite in Jingerquan, Xinjiang. Miner. Depos. 2020, 39, 686–696. [Google Scholar]
- Li, R.G.; Lei, K.H.; Dong, Z.K.; Min, Y.; Kan, L.; Jian, Z.X.; Shun, J.M.; Yuan, L.W. Spectral Characteristics and Prospecting Implications of Lithium Deposits in Dahongliutan Area, Karakoram, Xinjiang. Northwestern Geol. 2022, 55, 103–114. [Google Scholar]
- Roselung, C. Chile’s solar market is leading the way in South America. Abgerufen Am. 2014, 7, 25. [Google Scholar]
- Sheng, S.P. Comprehensive Utilization of Salt Lake and Related Resources. J. Salt Lake Res. 2000, 8, 33–58. [Google Scholar]
- Marazuela, M.A.; Vazquez-Sune, E.; Ayora, C.; García-Gil, A.; Palma, T. The effect of brine pumping on the natural hydrodynamics of the Salar de Atacama: The damping capacity of salt flats. Sci. Total Environ. 2019, 654, 1118–1131. [Google Scholar] [CrossRef]
- Beyer, H.L. Hawth’s Analysis Tools for ArcGIS. 2004. Available online: http://www.spatialecology.com/htools (accessed on 15 June 2025).
- Leskovec, J.; Sosič, R. Snap: A general-purpose network analysis and graph-mining library. ACM Trans. Intell. Syst. Technol. (TIST) 2016, 8, 1–20. [Google Scholar] [CrossRef]
- Triglav, J. Exelis Visual Information Solutions. Geoinformatics 2012, 15, 34. [Google Scholar]
- Cabello, J. Lithium brine production, reserves, resources and exploration in Chile: An updated review. Ore Geol. Rev. 2021, 128, 103883. [Google Scholar] [CrossRef]
- Feng, G.; Ping, Z.M.; Zhen, N.; Hua, L.J.; Sheng, S.P. Brine Lithium Resource in the Salt Lake and Advances in Its Exploitation. Acta Geosci. Sin. 2011, 32, 483–492. [Google Scholar]
- Khalil, A.; Mohammed, S.; Hashaikeh, R.; Hilal, N. Lithium recovery from brine: Recent developments and challenges. Desalination 2022, 528, 115611. [Google Scholar] [CrossRef]
- Li, W.X.; Sheng, Y.W. Research progress of electrochemical lithium extraction systems and electrode materials. CIESC J. 2021, 72, 2957. [Google Scholar]
- Li, X.H.; Mo, Y.H.; Qing, W.H.; Shao, S.L.; Tang, C.Y.Y.; Li, J.X. Membrane-based technologies for lithium recovery from water lithium resources: A review. J. Membr. Sci. 2019, 591, 117317. [Google Scholar] [CrossRef]
- Maxwell, P.; Mora, M. Lithium and Chile: Looking back and looking forward. Miner. Econ. 2020, 33, 57–71. [Google Scholar] [CrossRef]
- Stevens, C.G.R.; Valdés-González, H. Lithium production issues in Chile: Perceptions involving the strategic resource and the common good. Renew. Energy Biomass Sustain. 2023, 5, 24–31. [Google Scholar] [CrossRef]
- Sociedad Química y Minera de Chile S.A. Home Page. Available online: https://sqmlitio.com/ (accessed on 15 June 2025).
- Zhen, N.; Qian, W.; Tao, D.; Zhong, B.L.; Sheng, W.Y.; Jiang, Y.J.; Hua, H.X. Research progress on industrialization technology of lithium extraction from salt lake brine in China. Inorg. Chem. Ind. 2022, 54, 1–12. [Google Scholar]
- Lillesand, T.; Kiefer, R.W.; Chipman, J. Remote Sensing and Image Interpretation; John Wiley & Sons: Hoboken, NJ, USA, 2015. [Google Scholar]
- Han, W.H.; Ze, Z.; Yan, K.X.; Jiao, L.; Xia, Y.C.; Lu, M.L.; Ping, H.C.; Xin, L. Cotton planting area extraction and yield prediction based on Sentinel-2A. Trans. Chin. Soc. Agric. Eng. 2022, 38, 10. [Google Scholar]
- Jian, L.J.; Zhang, L.H.; Cui, H.; Man, S.Y.; Song, C.J.; Yu, H. Extraction of early paddy rice area in Lingao County based on Sentinel-1A data. Remote Sens. Land Resour. 2020, 32, 9. [Google Scholar]
- Jie, S.R.; Feng, N.J.; Ying, L.X.; Rui, C.Q. Apple Orchard Extraction with Quick Bird Imagery Based on Texture Features and Support Vector Machine. Trans. Chin. Soc. Agric. Mach. 2017, 48, 10. [Google Scholar]
- Long, W.X.; Wen, Y.H.; Liang, Z.; Ming, Z.L.; Wei, D.X. Using SVM classify Landsat image to analyze the spatial and temporal characteristics of main urban expansion analysis in Democratic People’s Republic of Korea. Remote Sens. Land Resour. 2020, 32, 9. [Google Scholar]
- IEA. Energy Technology Perspectives 2010: Scenarios & Strategies to 2050; IEA: Paris, France, 2010. [Google Scholar]
- Deetman, S.; Pauliuk, S.; Van Vuuren, D.P.; Van Der Voet, E.; Tukker, A. Scenarios for demand growth of metals in electricity generation technologies, cars, and electronic appliances. Environ. Sci. Technol. 2018, 52, 4950–4959. [Google Scholar] [CrossRef] [PubMed]
- Jaskula, B.W. Lithium in 2012. Min. Eng. 2013, 65, 63–64. [Google Scholar]
- Liu, W.; Agusdinata, D.B. Interdependencies of lithium mining and communities sustainability in Salar de Atacama, Chile. J. Clean. Prod. 2020, 260, 120838. [Google Scholar] [CrossRef]
- Ober, J.A. Mineral Commodity Summaries 2018; U.S. Geological Survey: Reston, VA, USA, 2018; 204p.
Disclaimer/Publisher’s Note: The statements, opinions and data contained in all publications are solely those of the individual author(s) and contributor(s) and not of MDPI and/or the editor(s). MDPI and/or the editor(s) disclaim responsibility for any injury to people or property resulting from any ideas, methods, instructions or products referred to in the content. |
© 2025 by the authors. Licensee MDPI, Basel, Switzerland. This article is an open access article distributed under the terms and conditions of the Creative Commons Attribution (CC BY) license (https://creativecommons.org/licenses/by/4.0/).