
Impact Assessment of Natural Springs for Irrigation Potential in the Hilly Areas of Kashmir

 , , , and
Abstract
1. Introduction
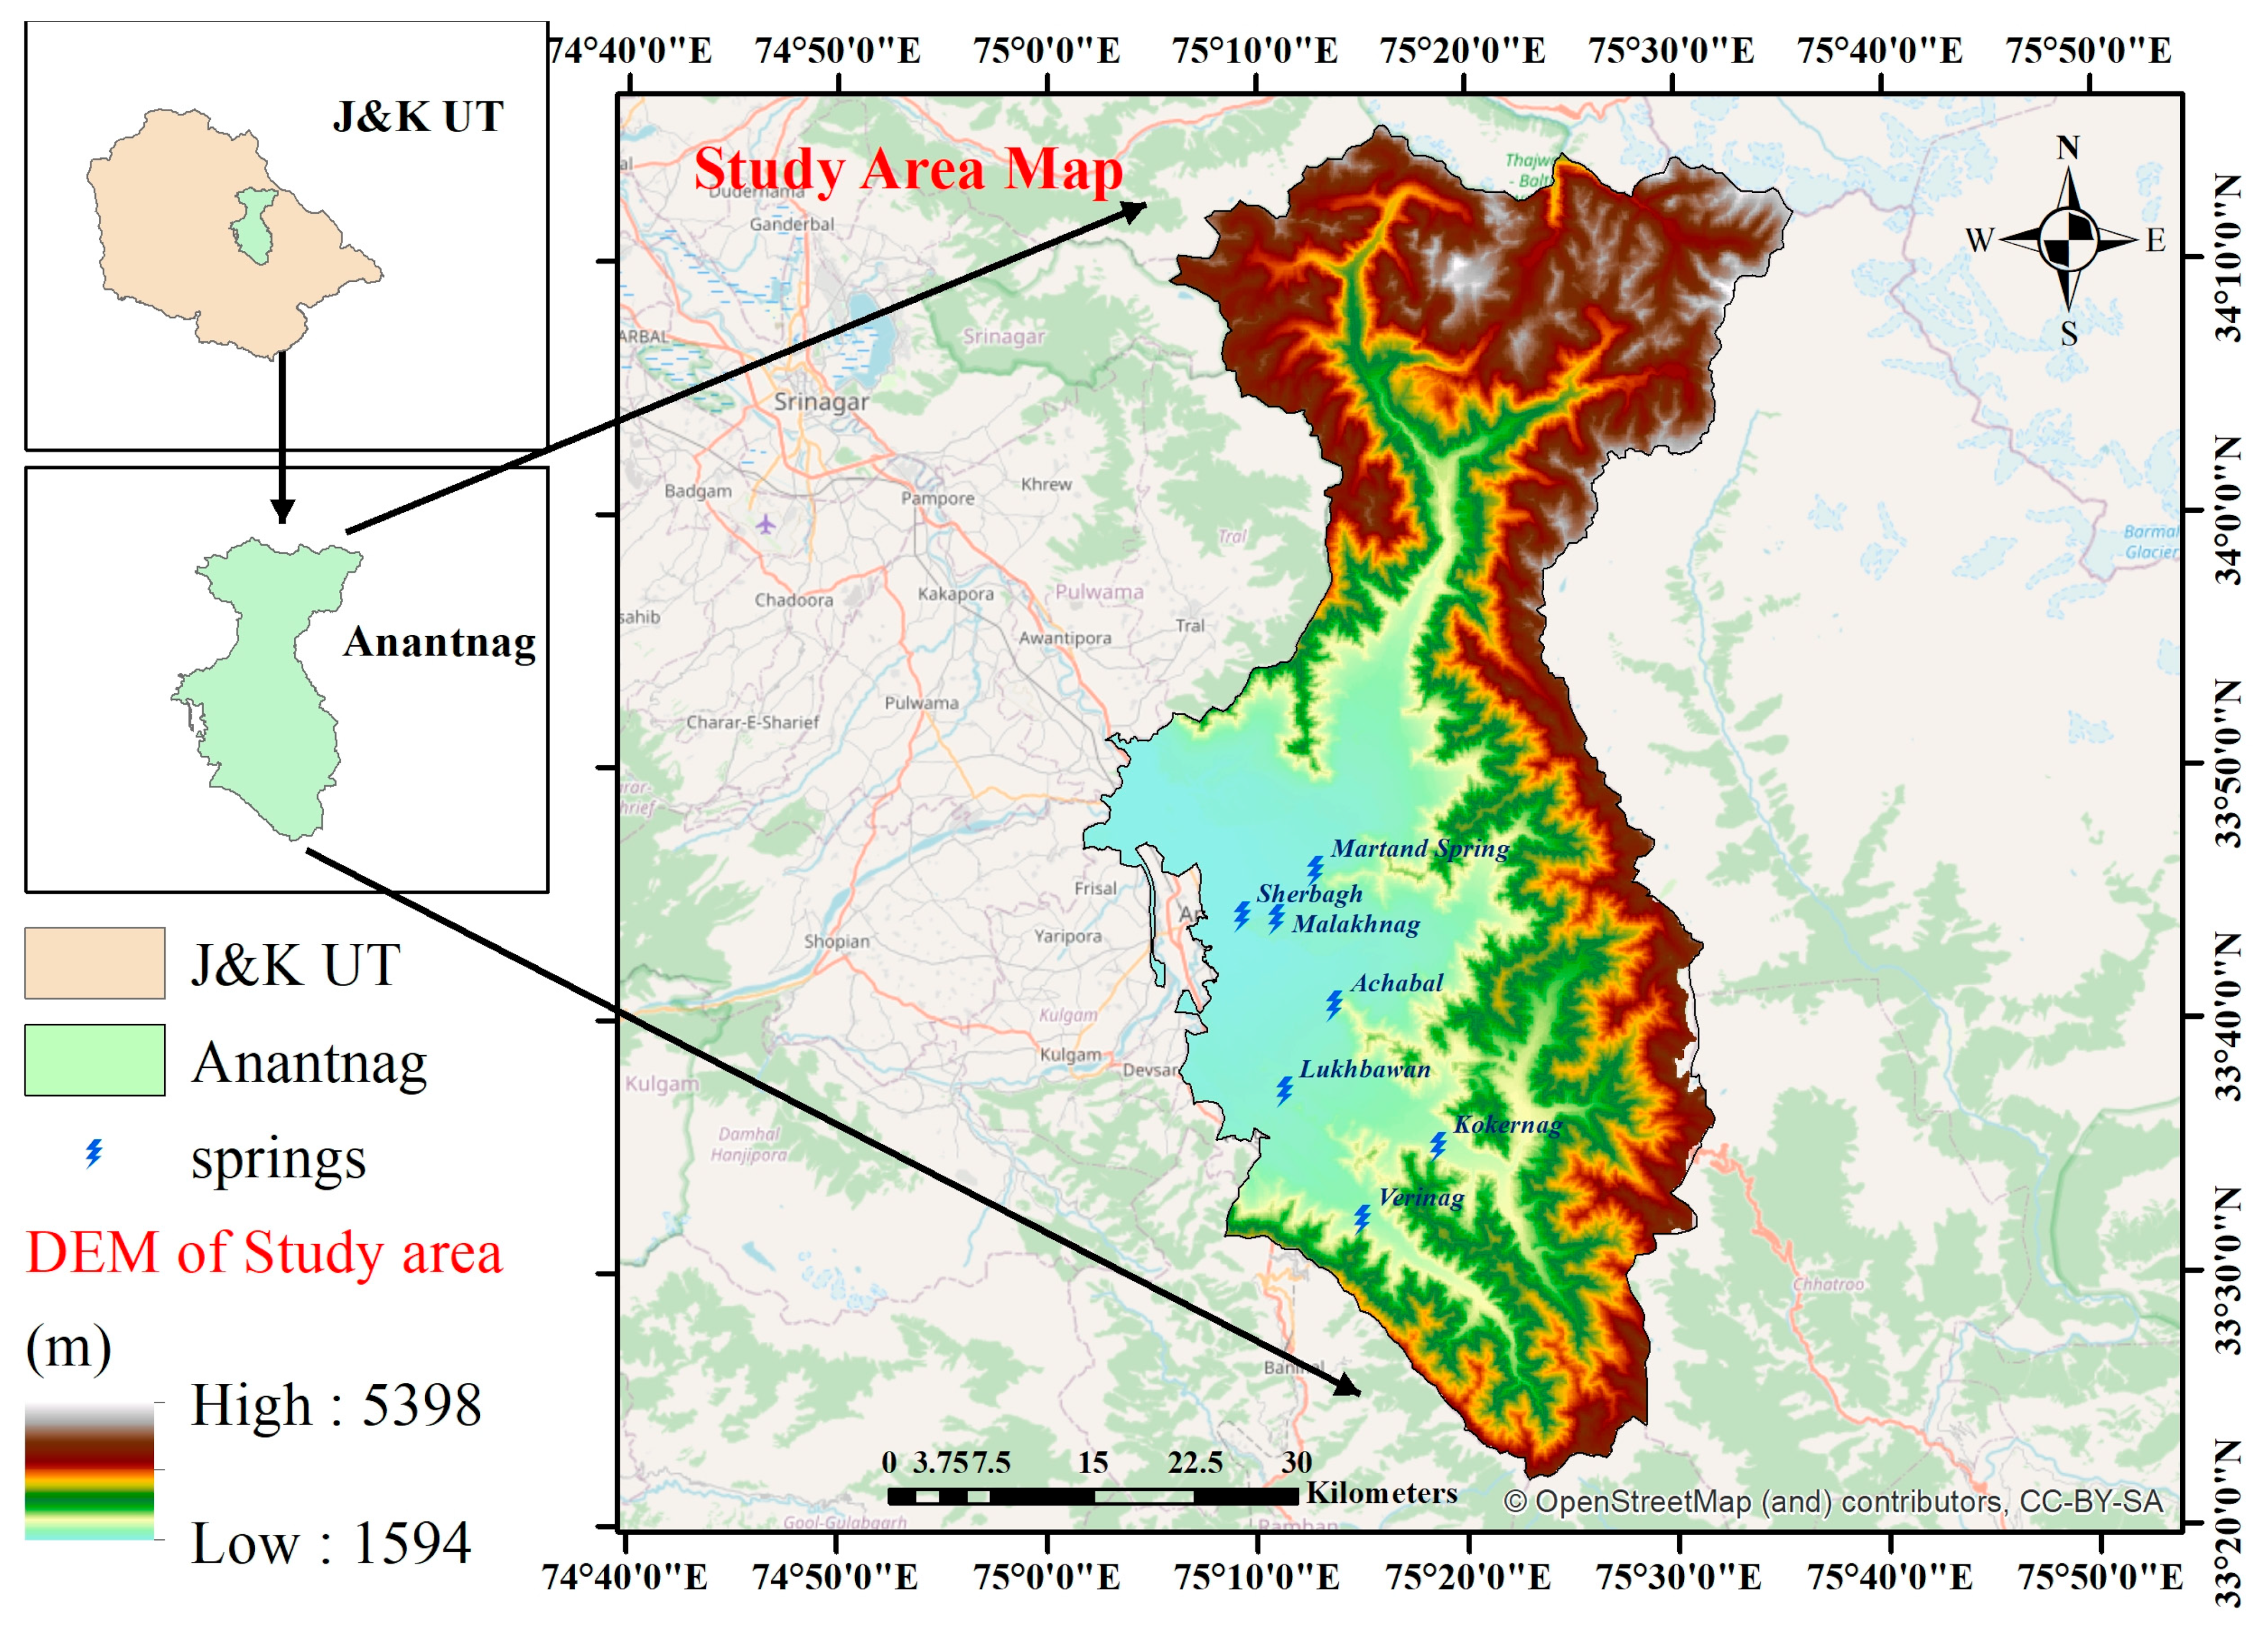
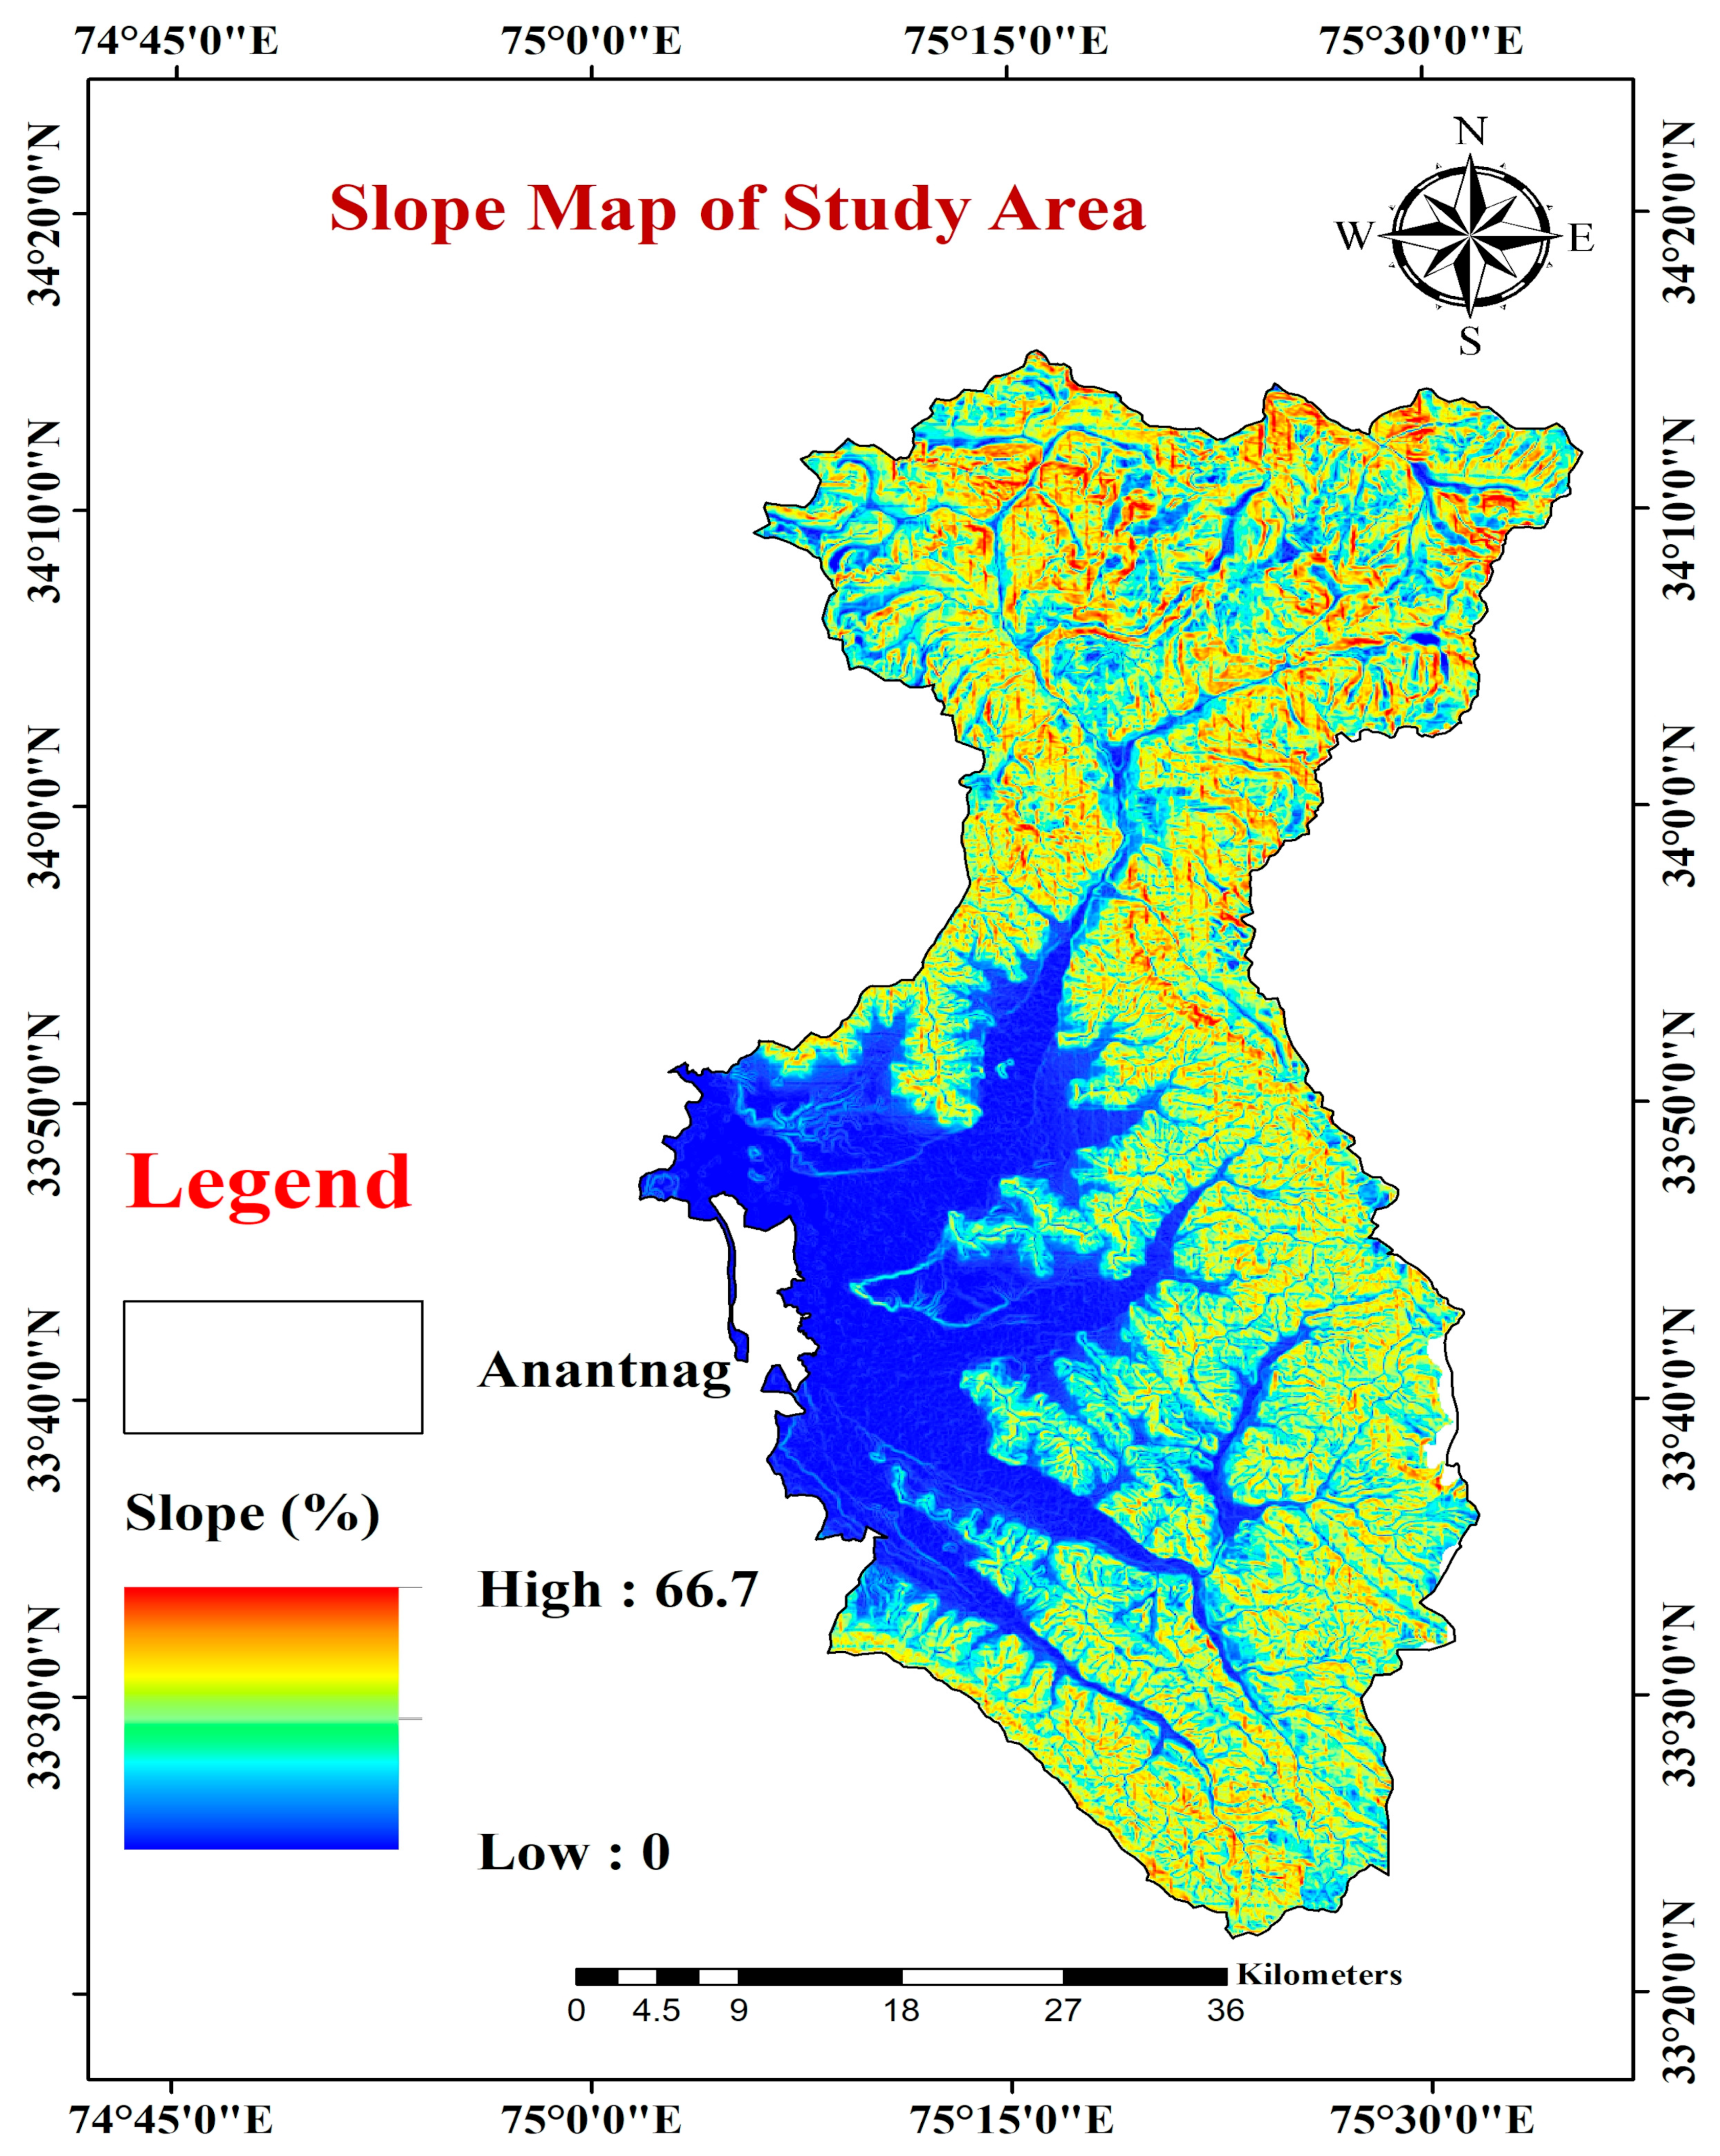
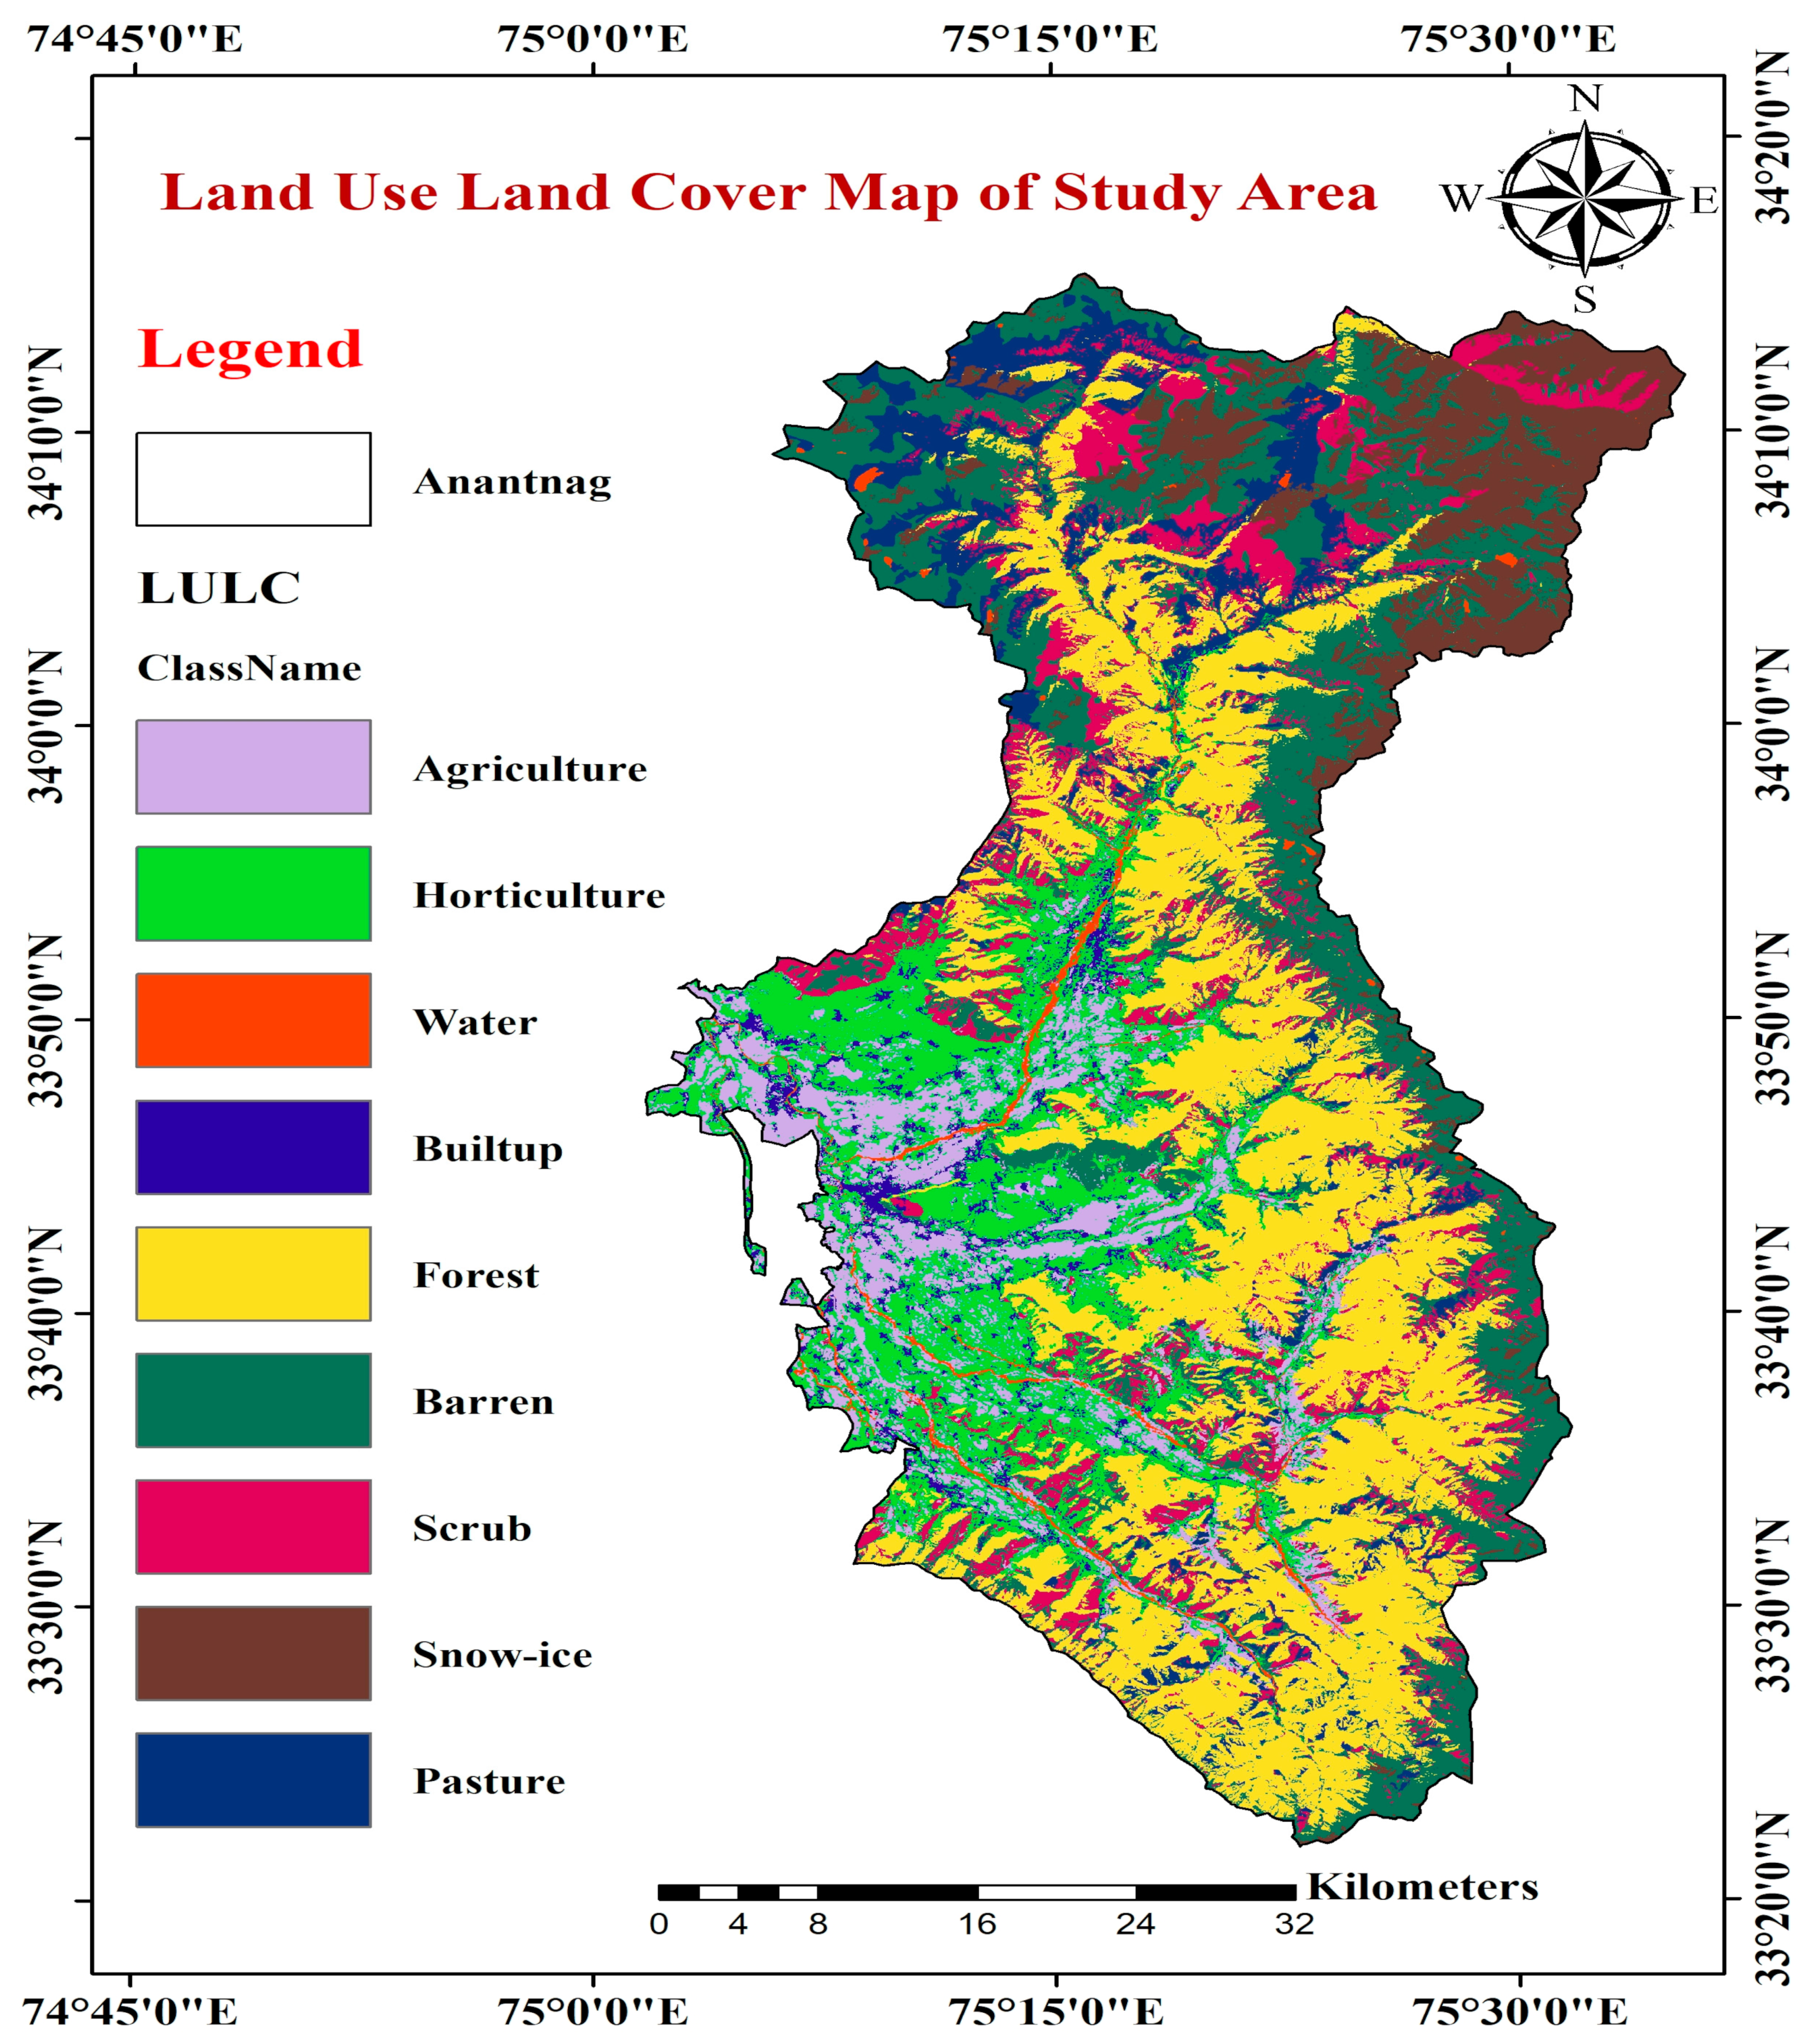
2. Materials and Methods
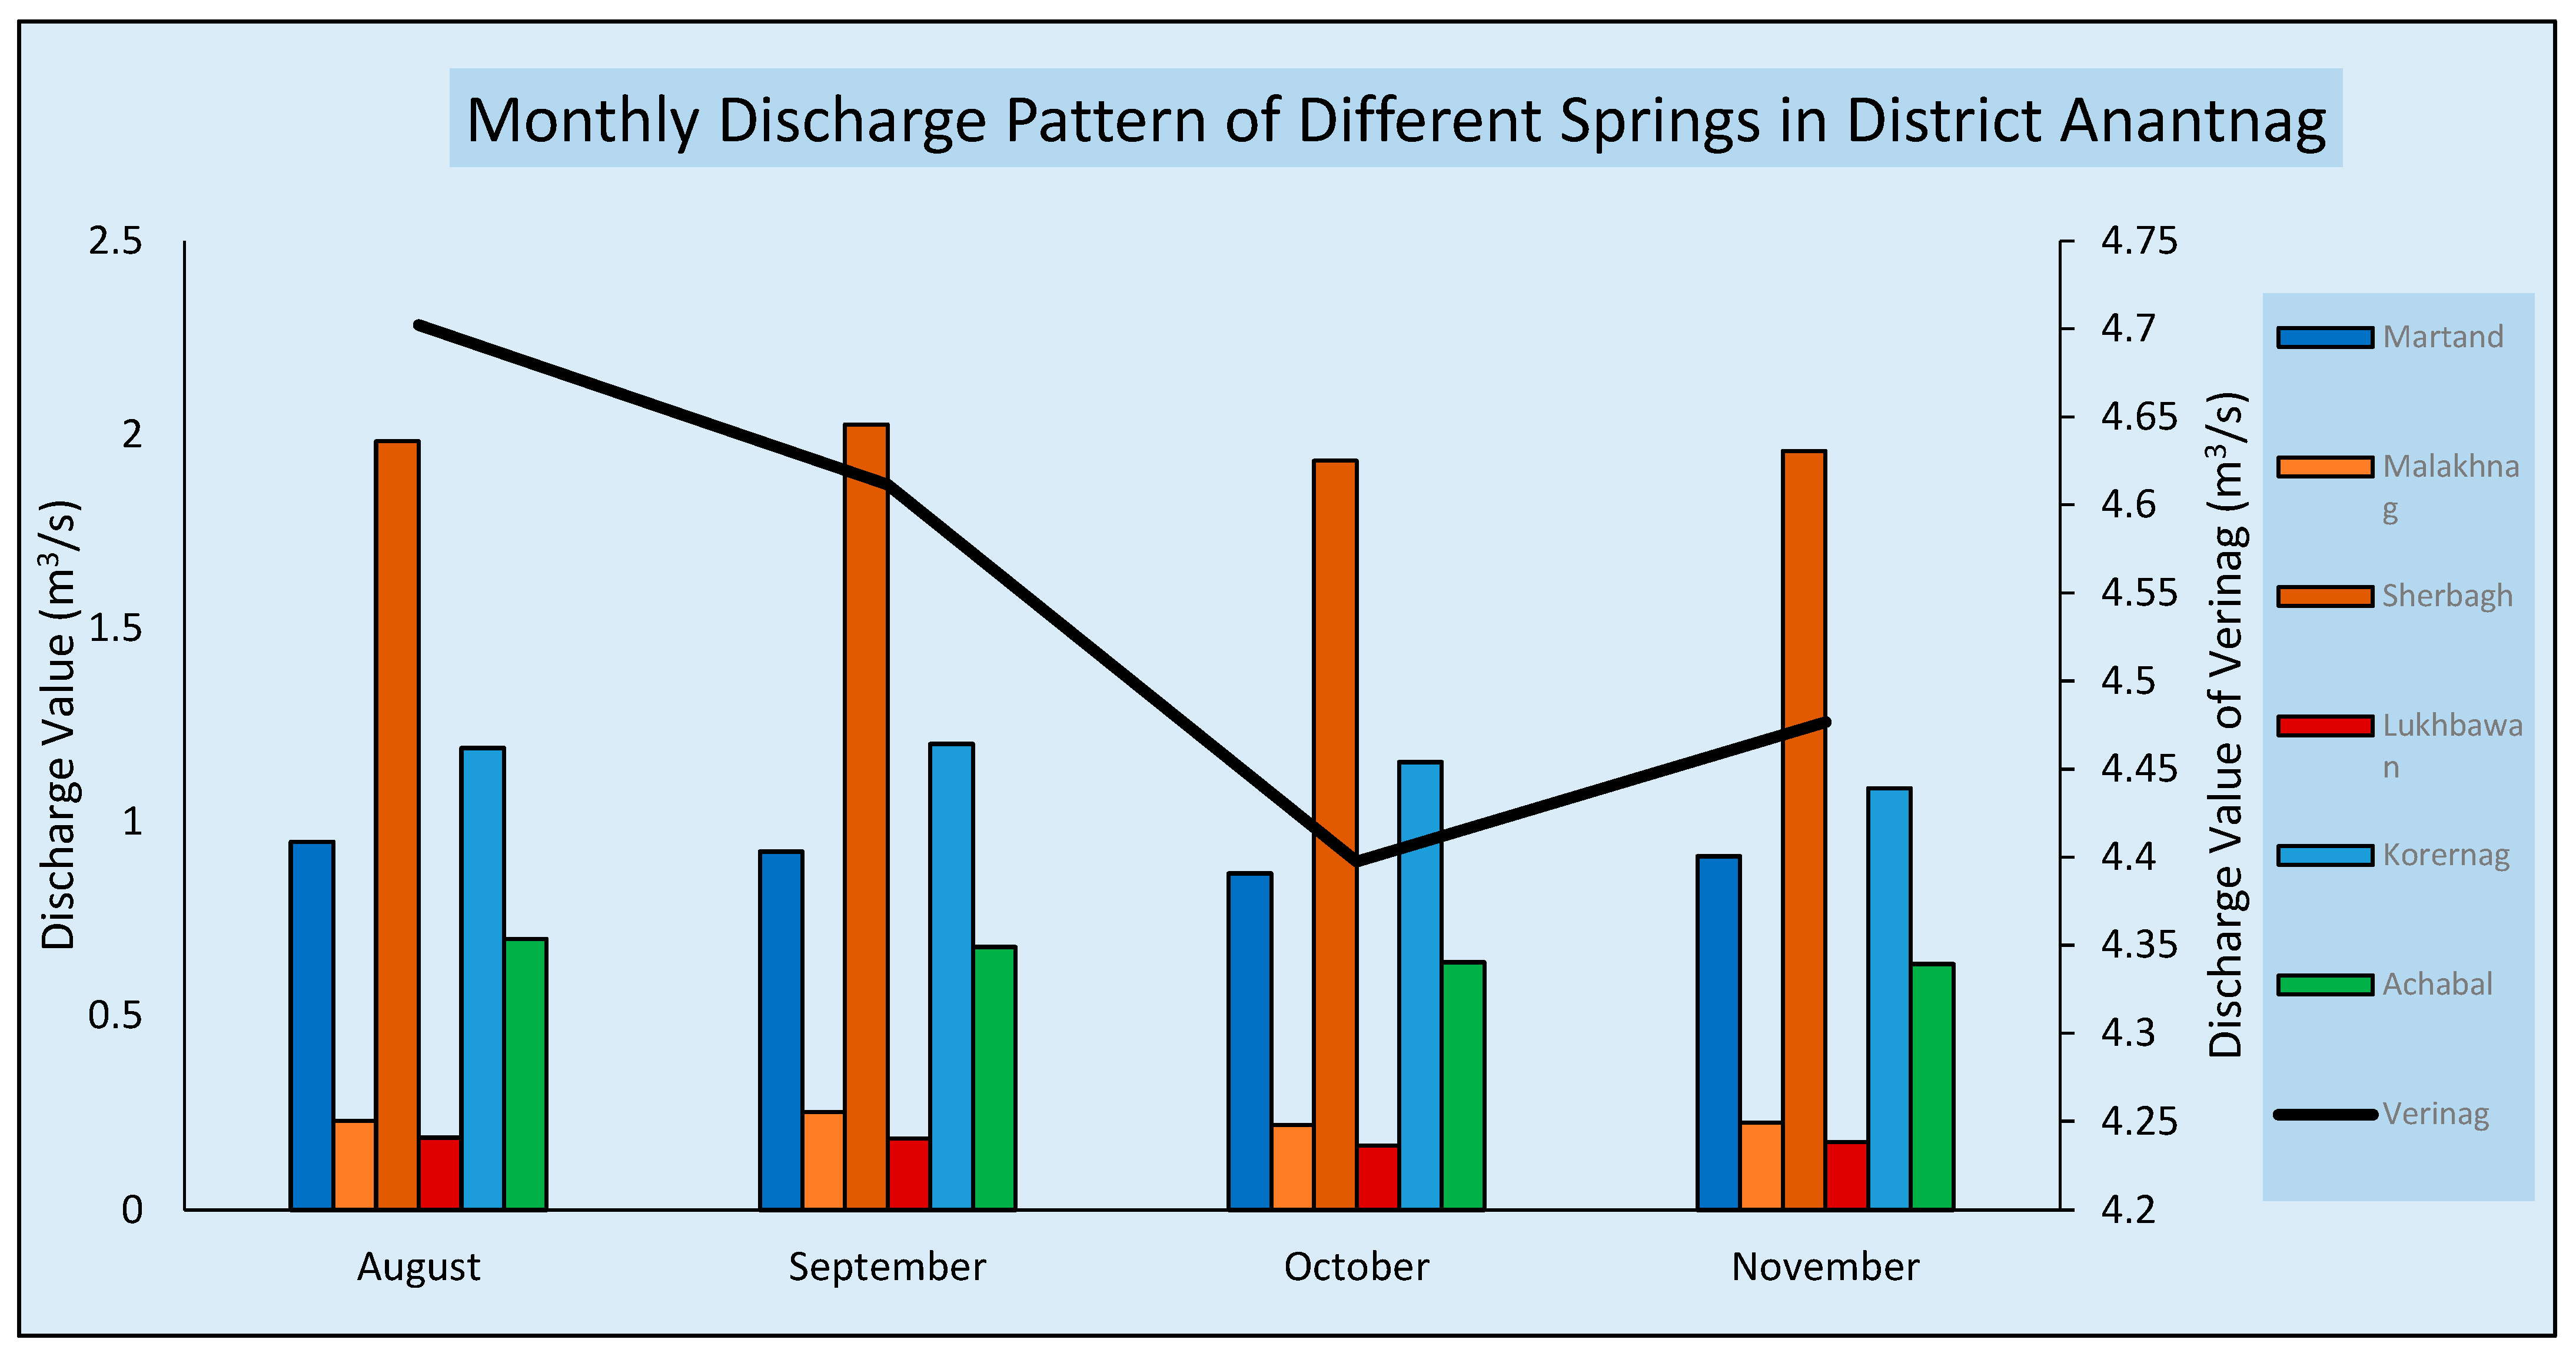
2.1. Discharge of Springs
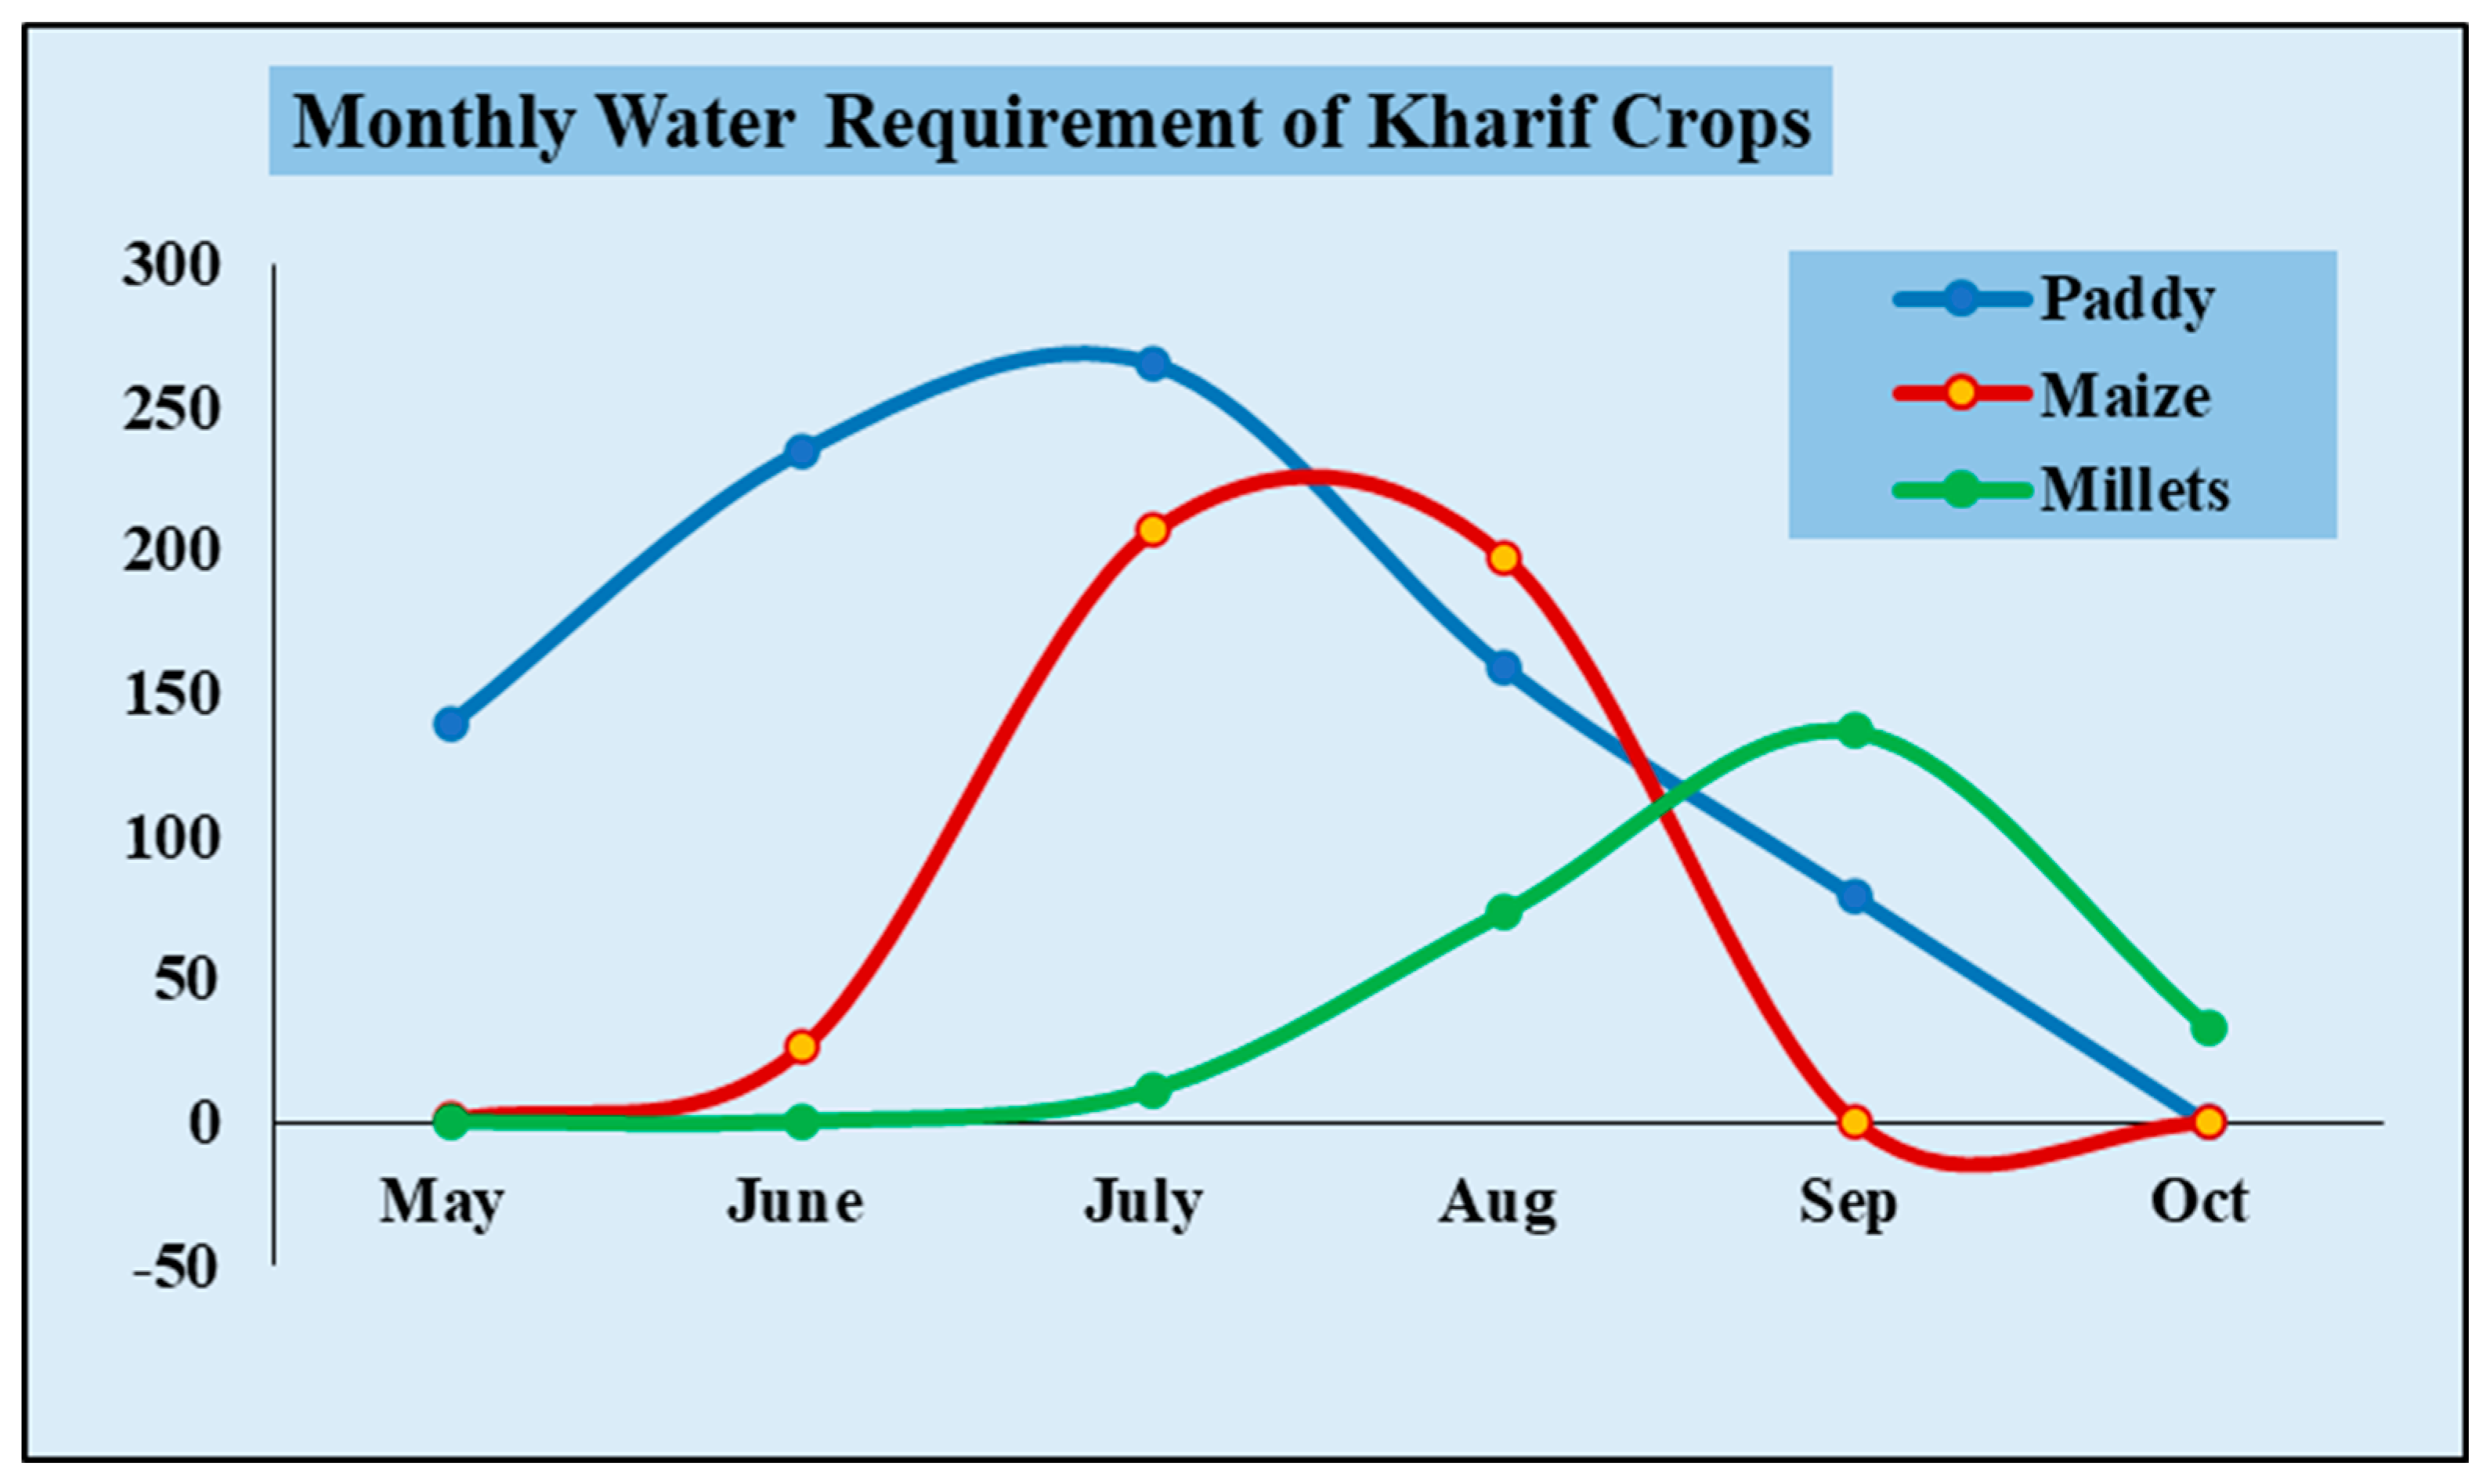
2.2. Crop Water Requirement (ETc)
3. Results
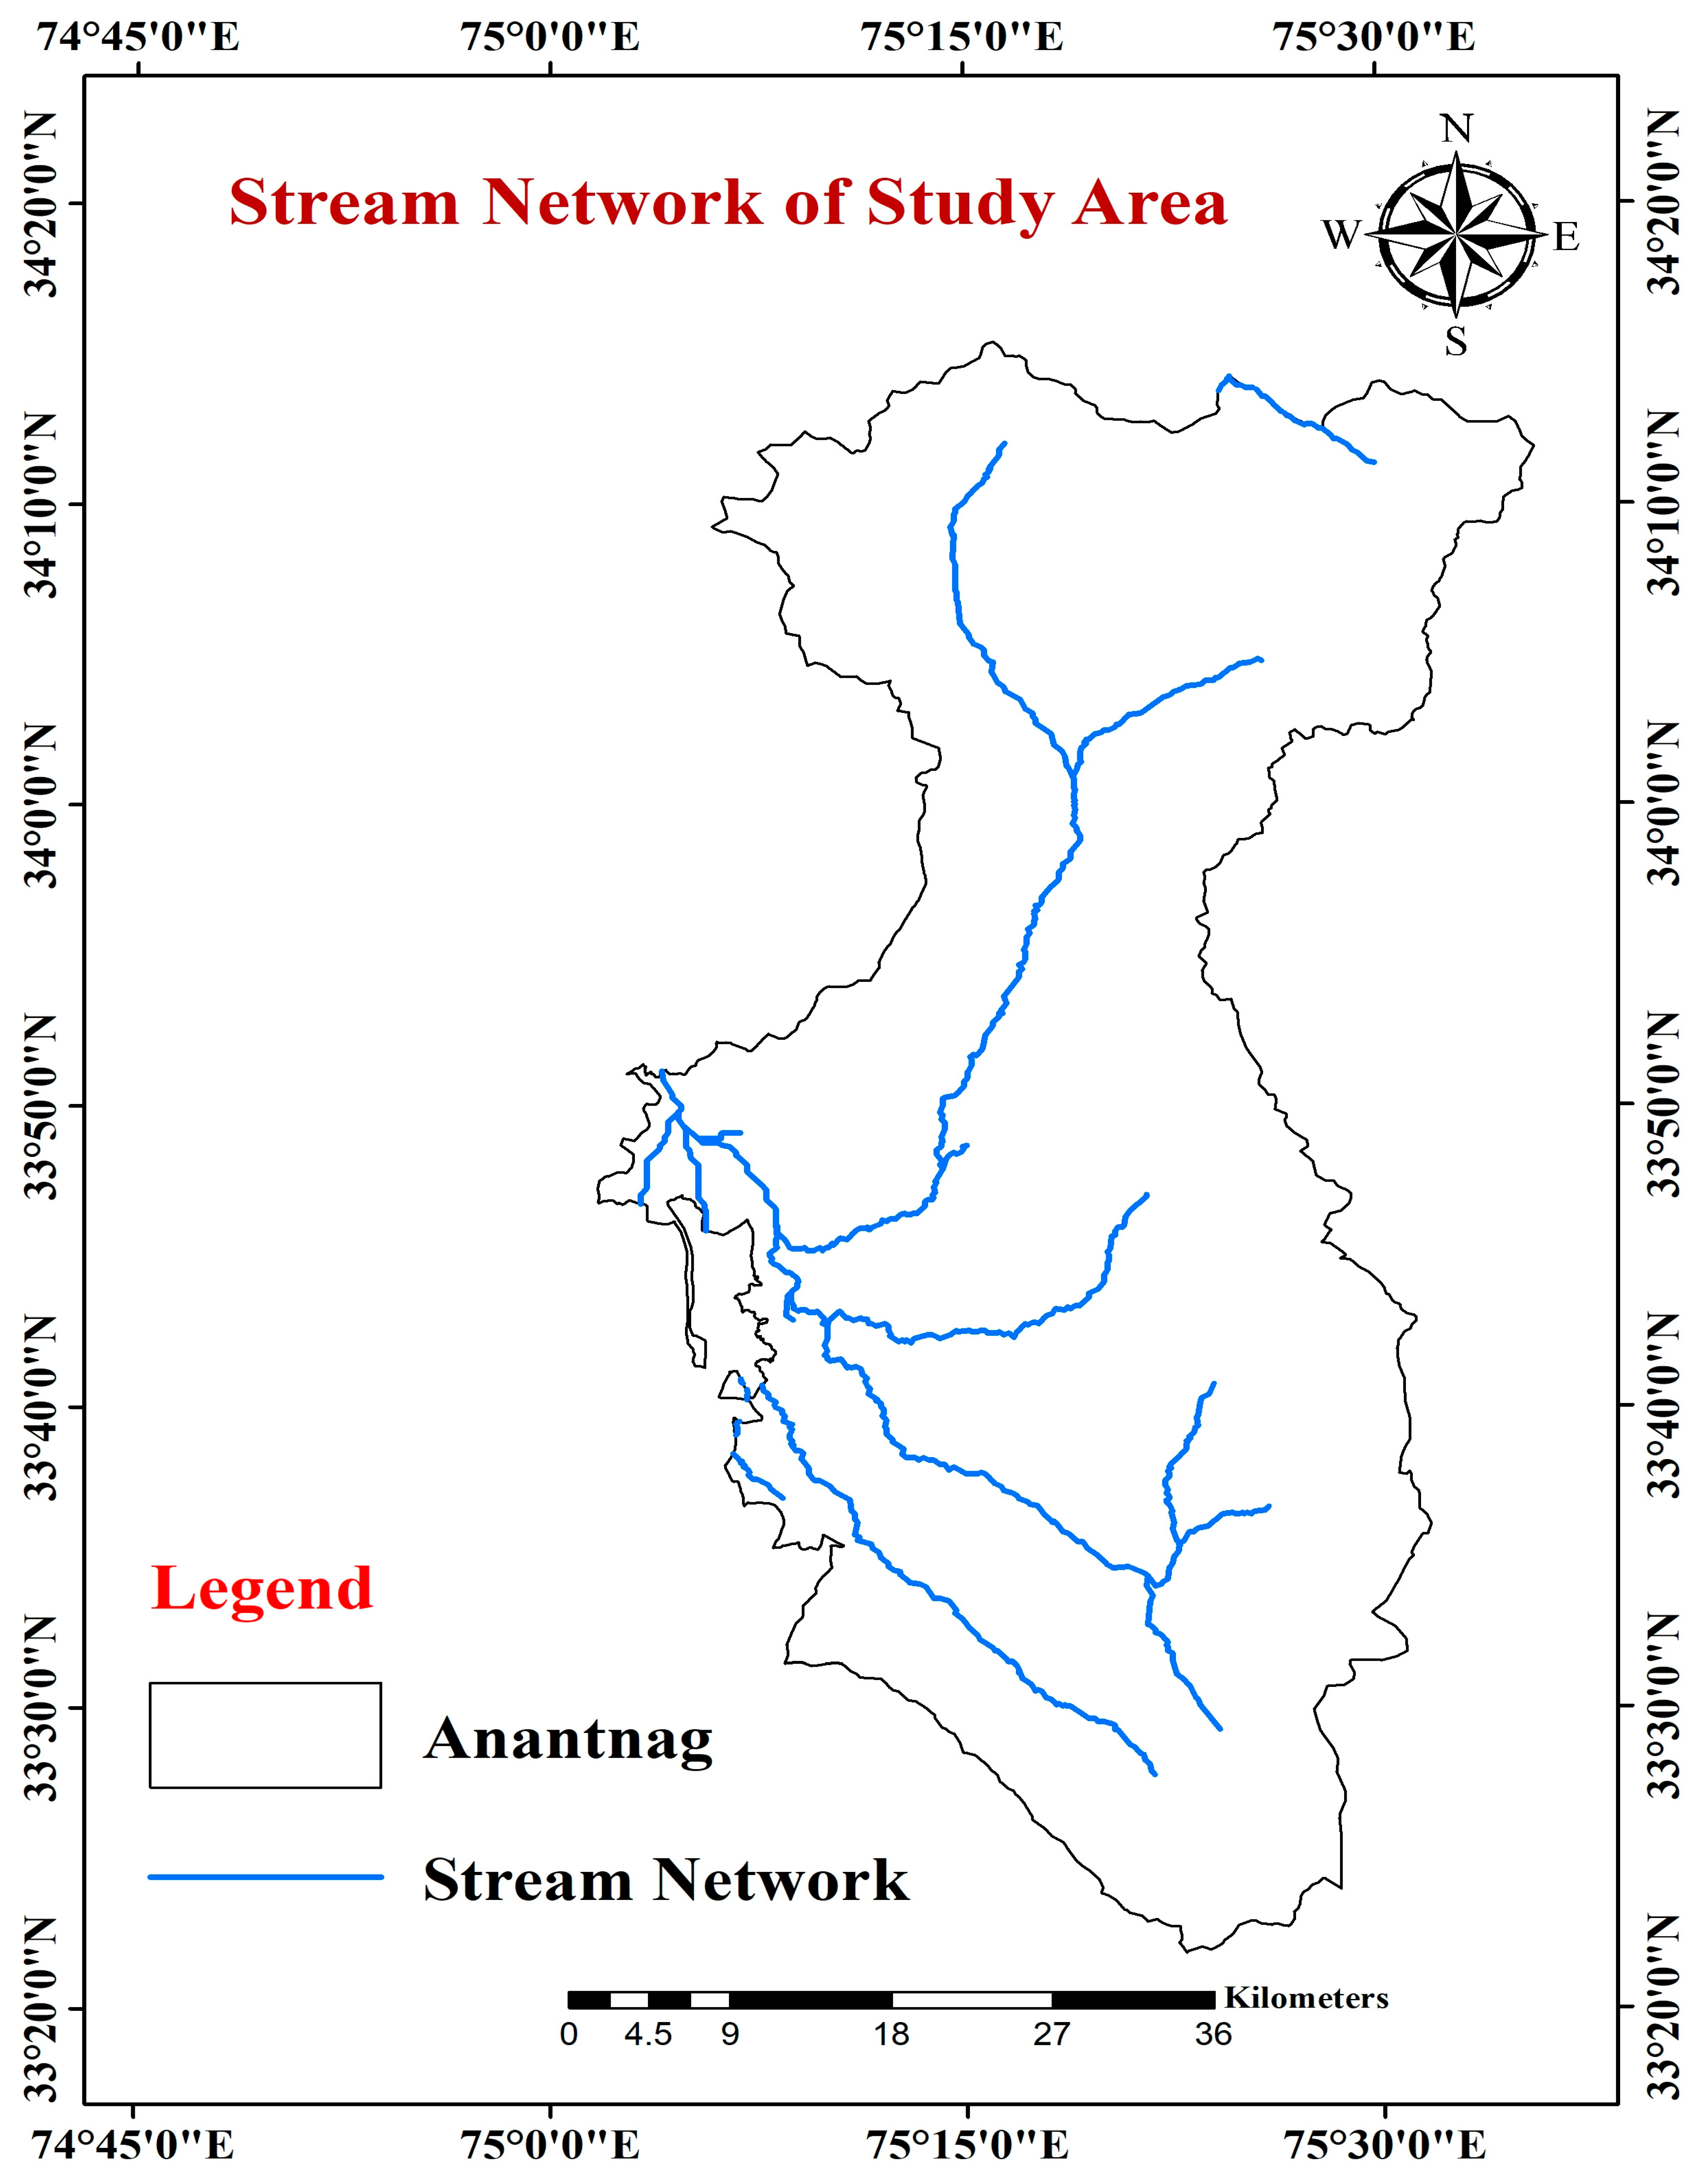
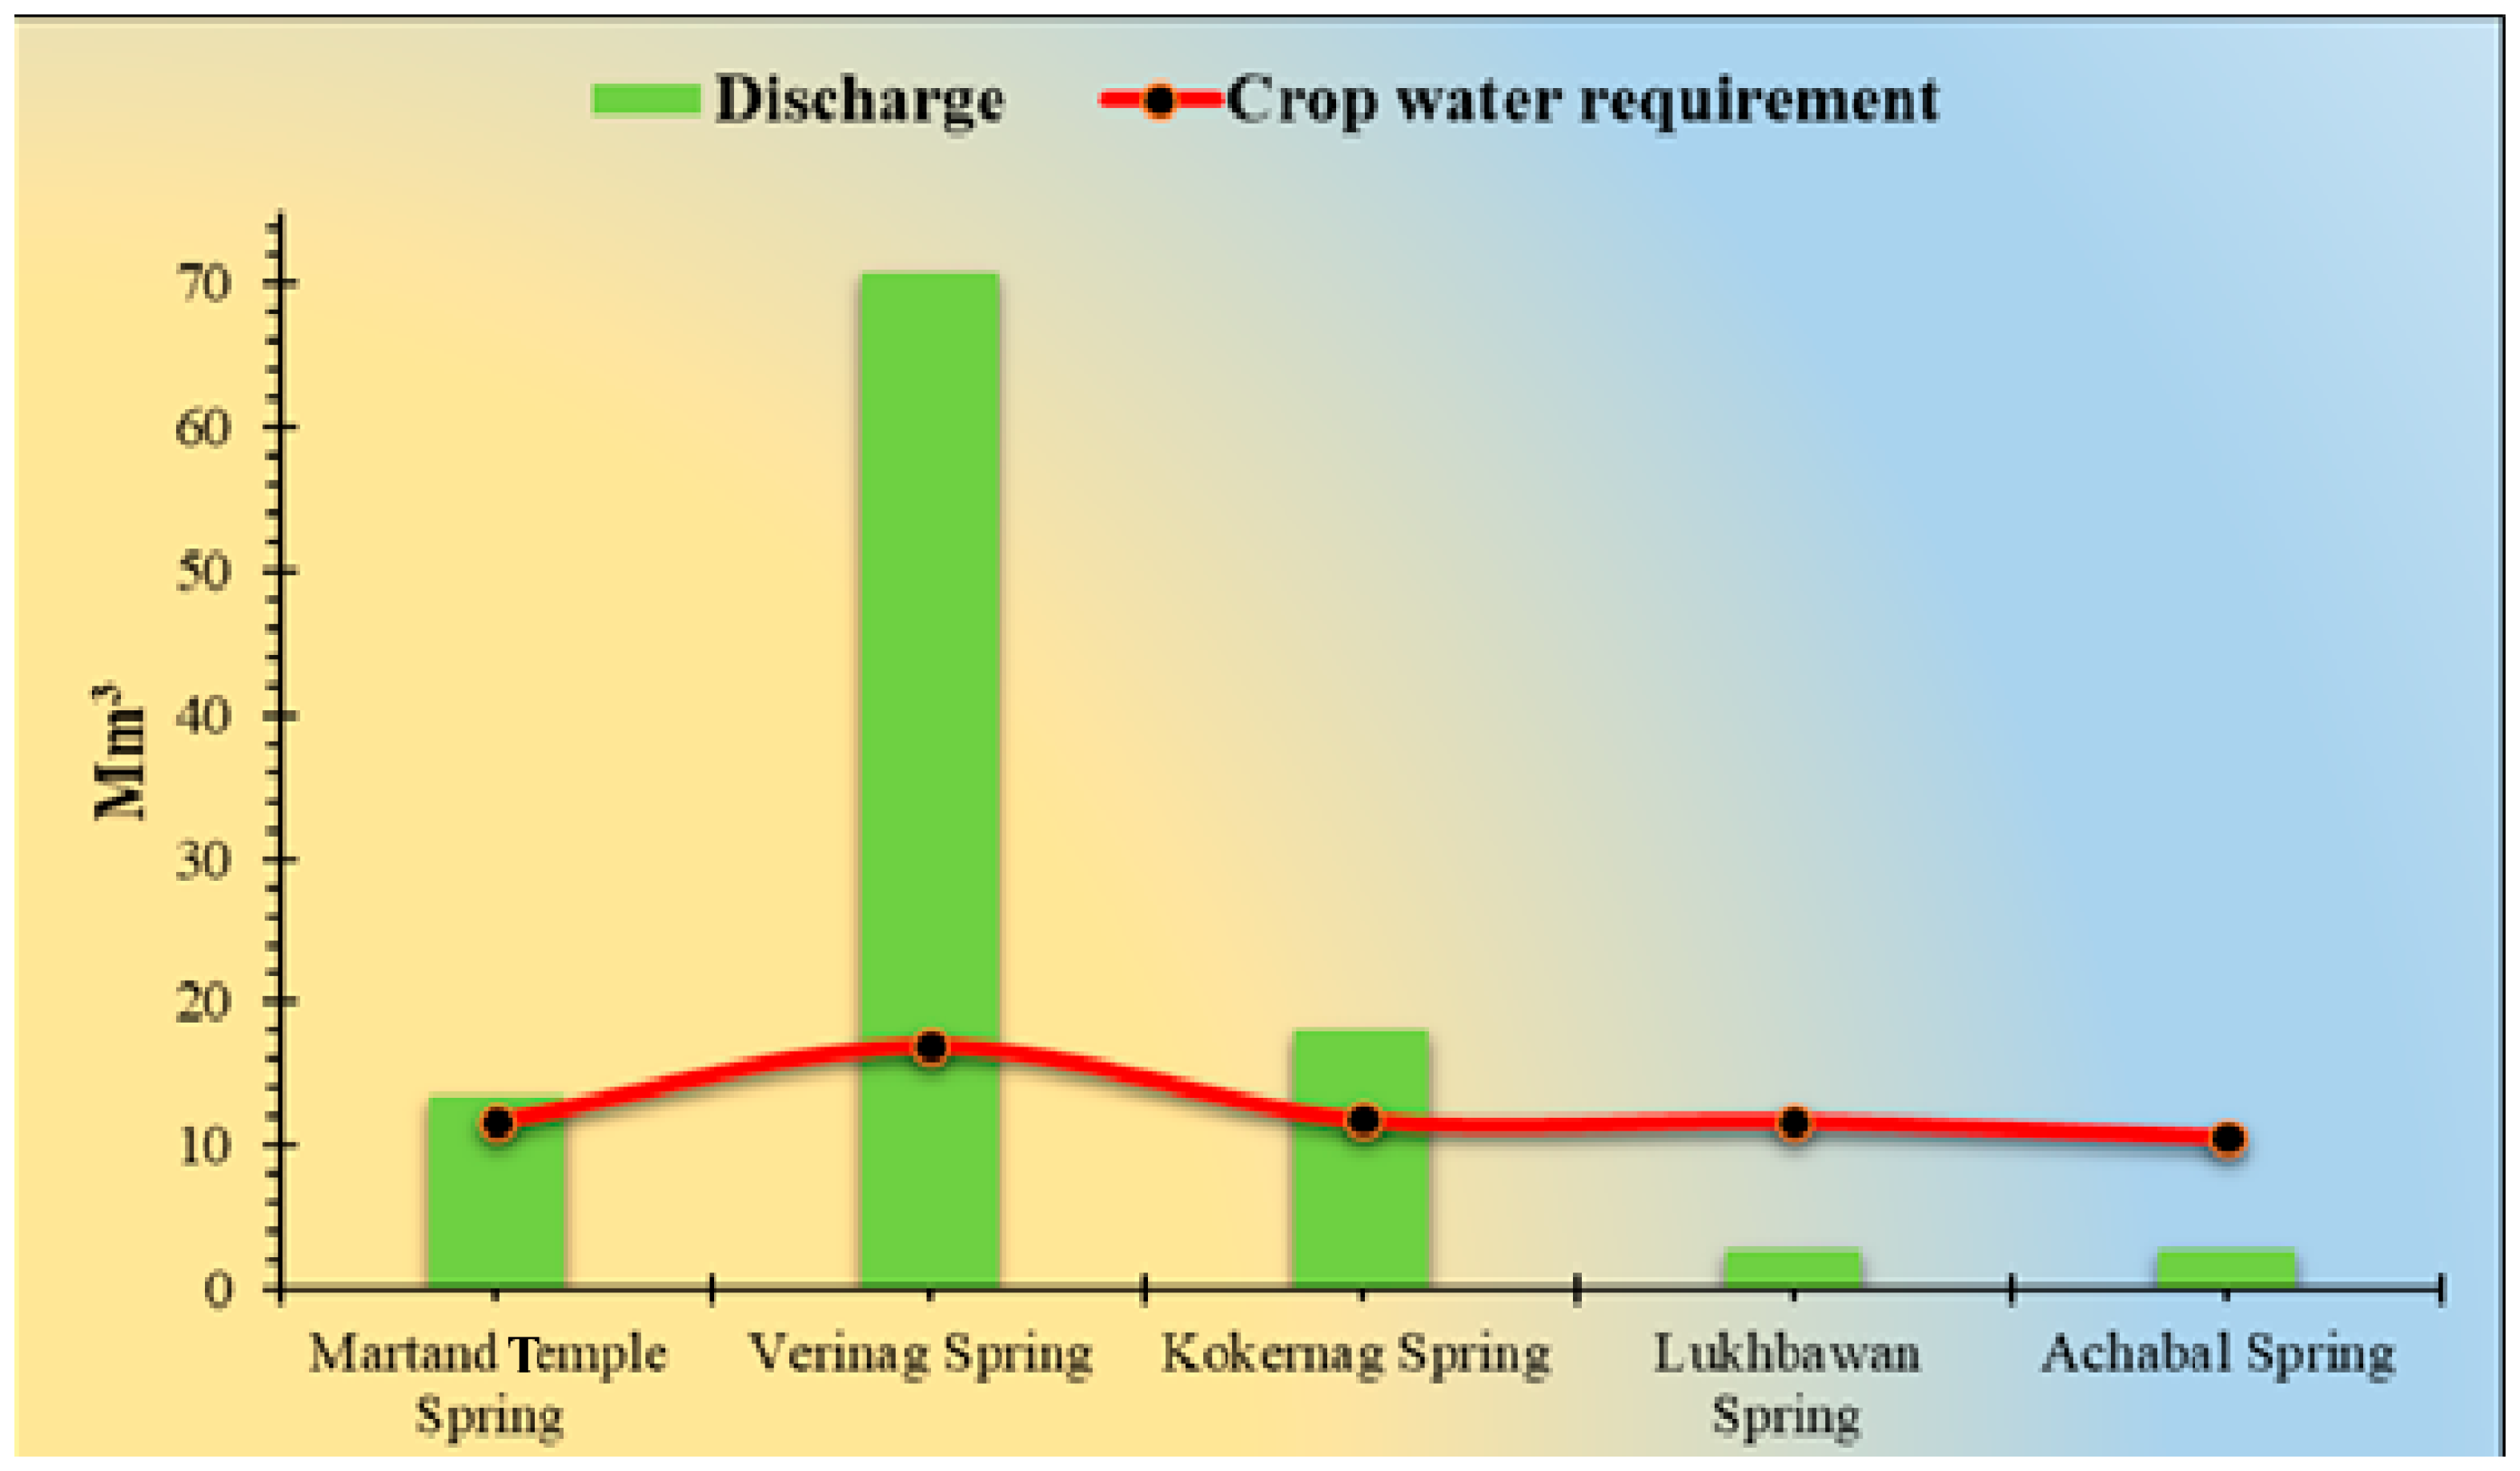
3.1. Evaluation of Spring Discharge and Mapping of the Corresponding Irrigated Regions
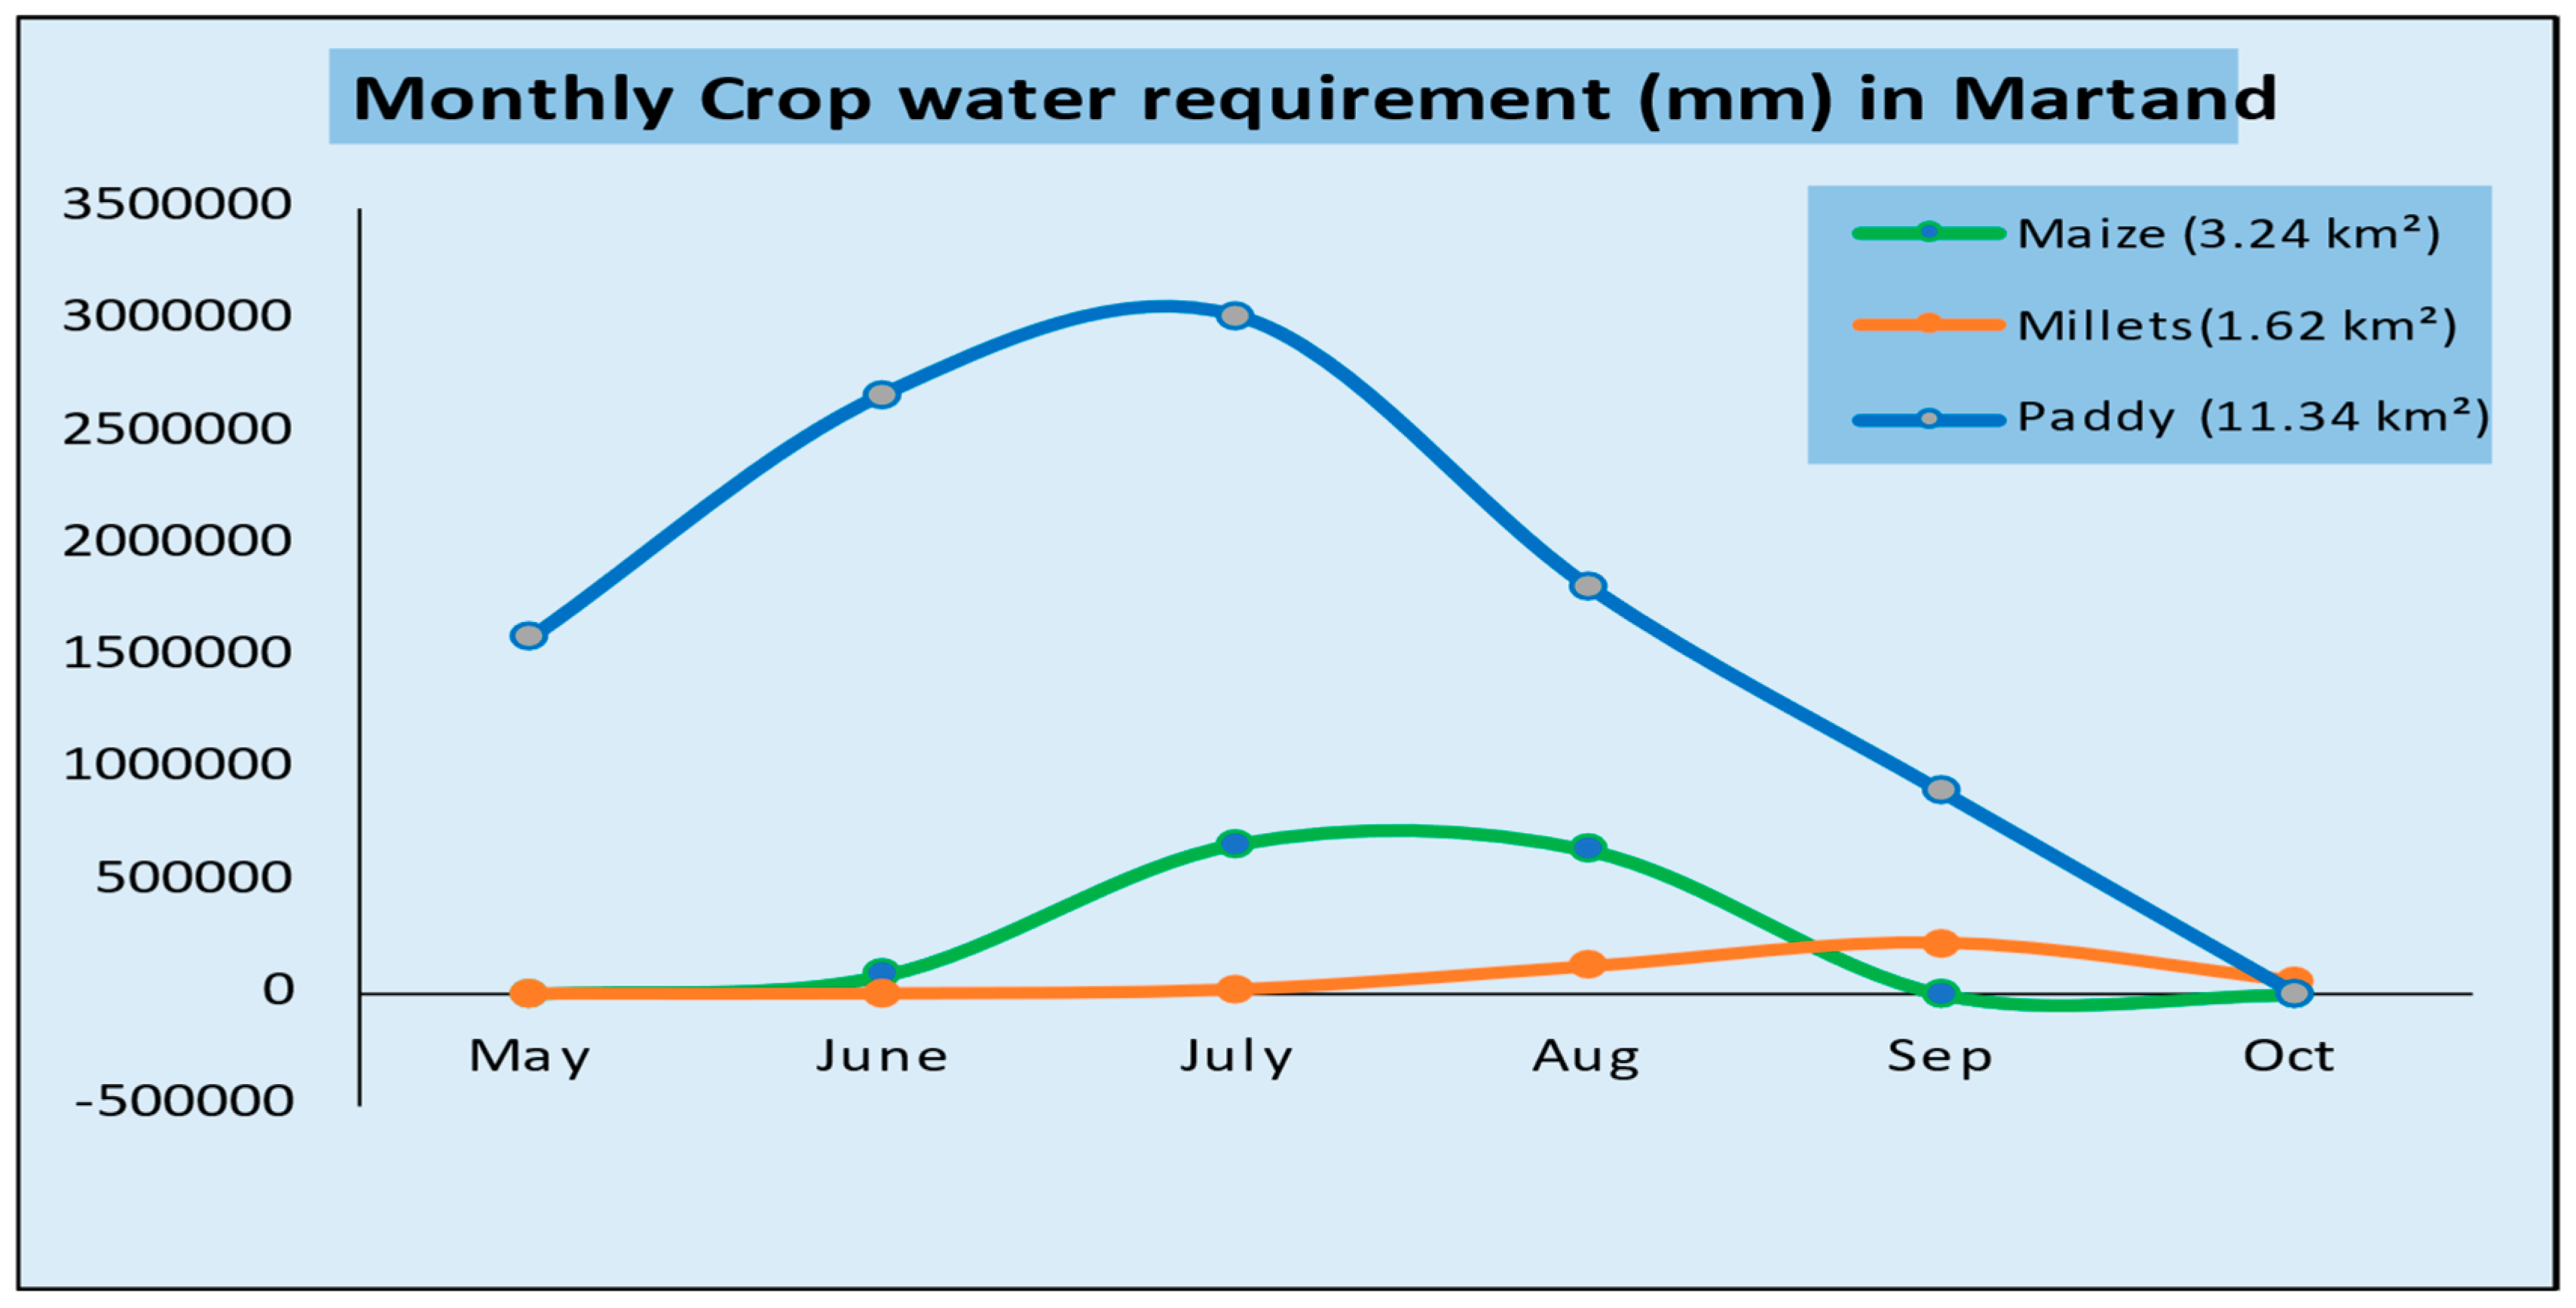
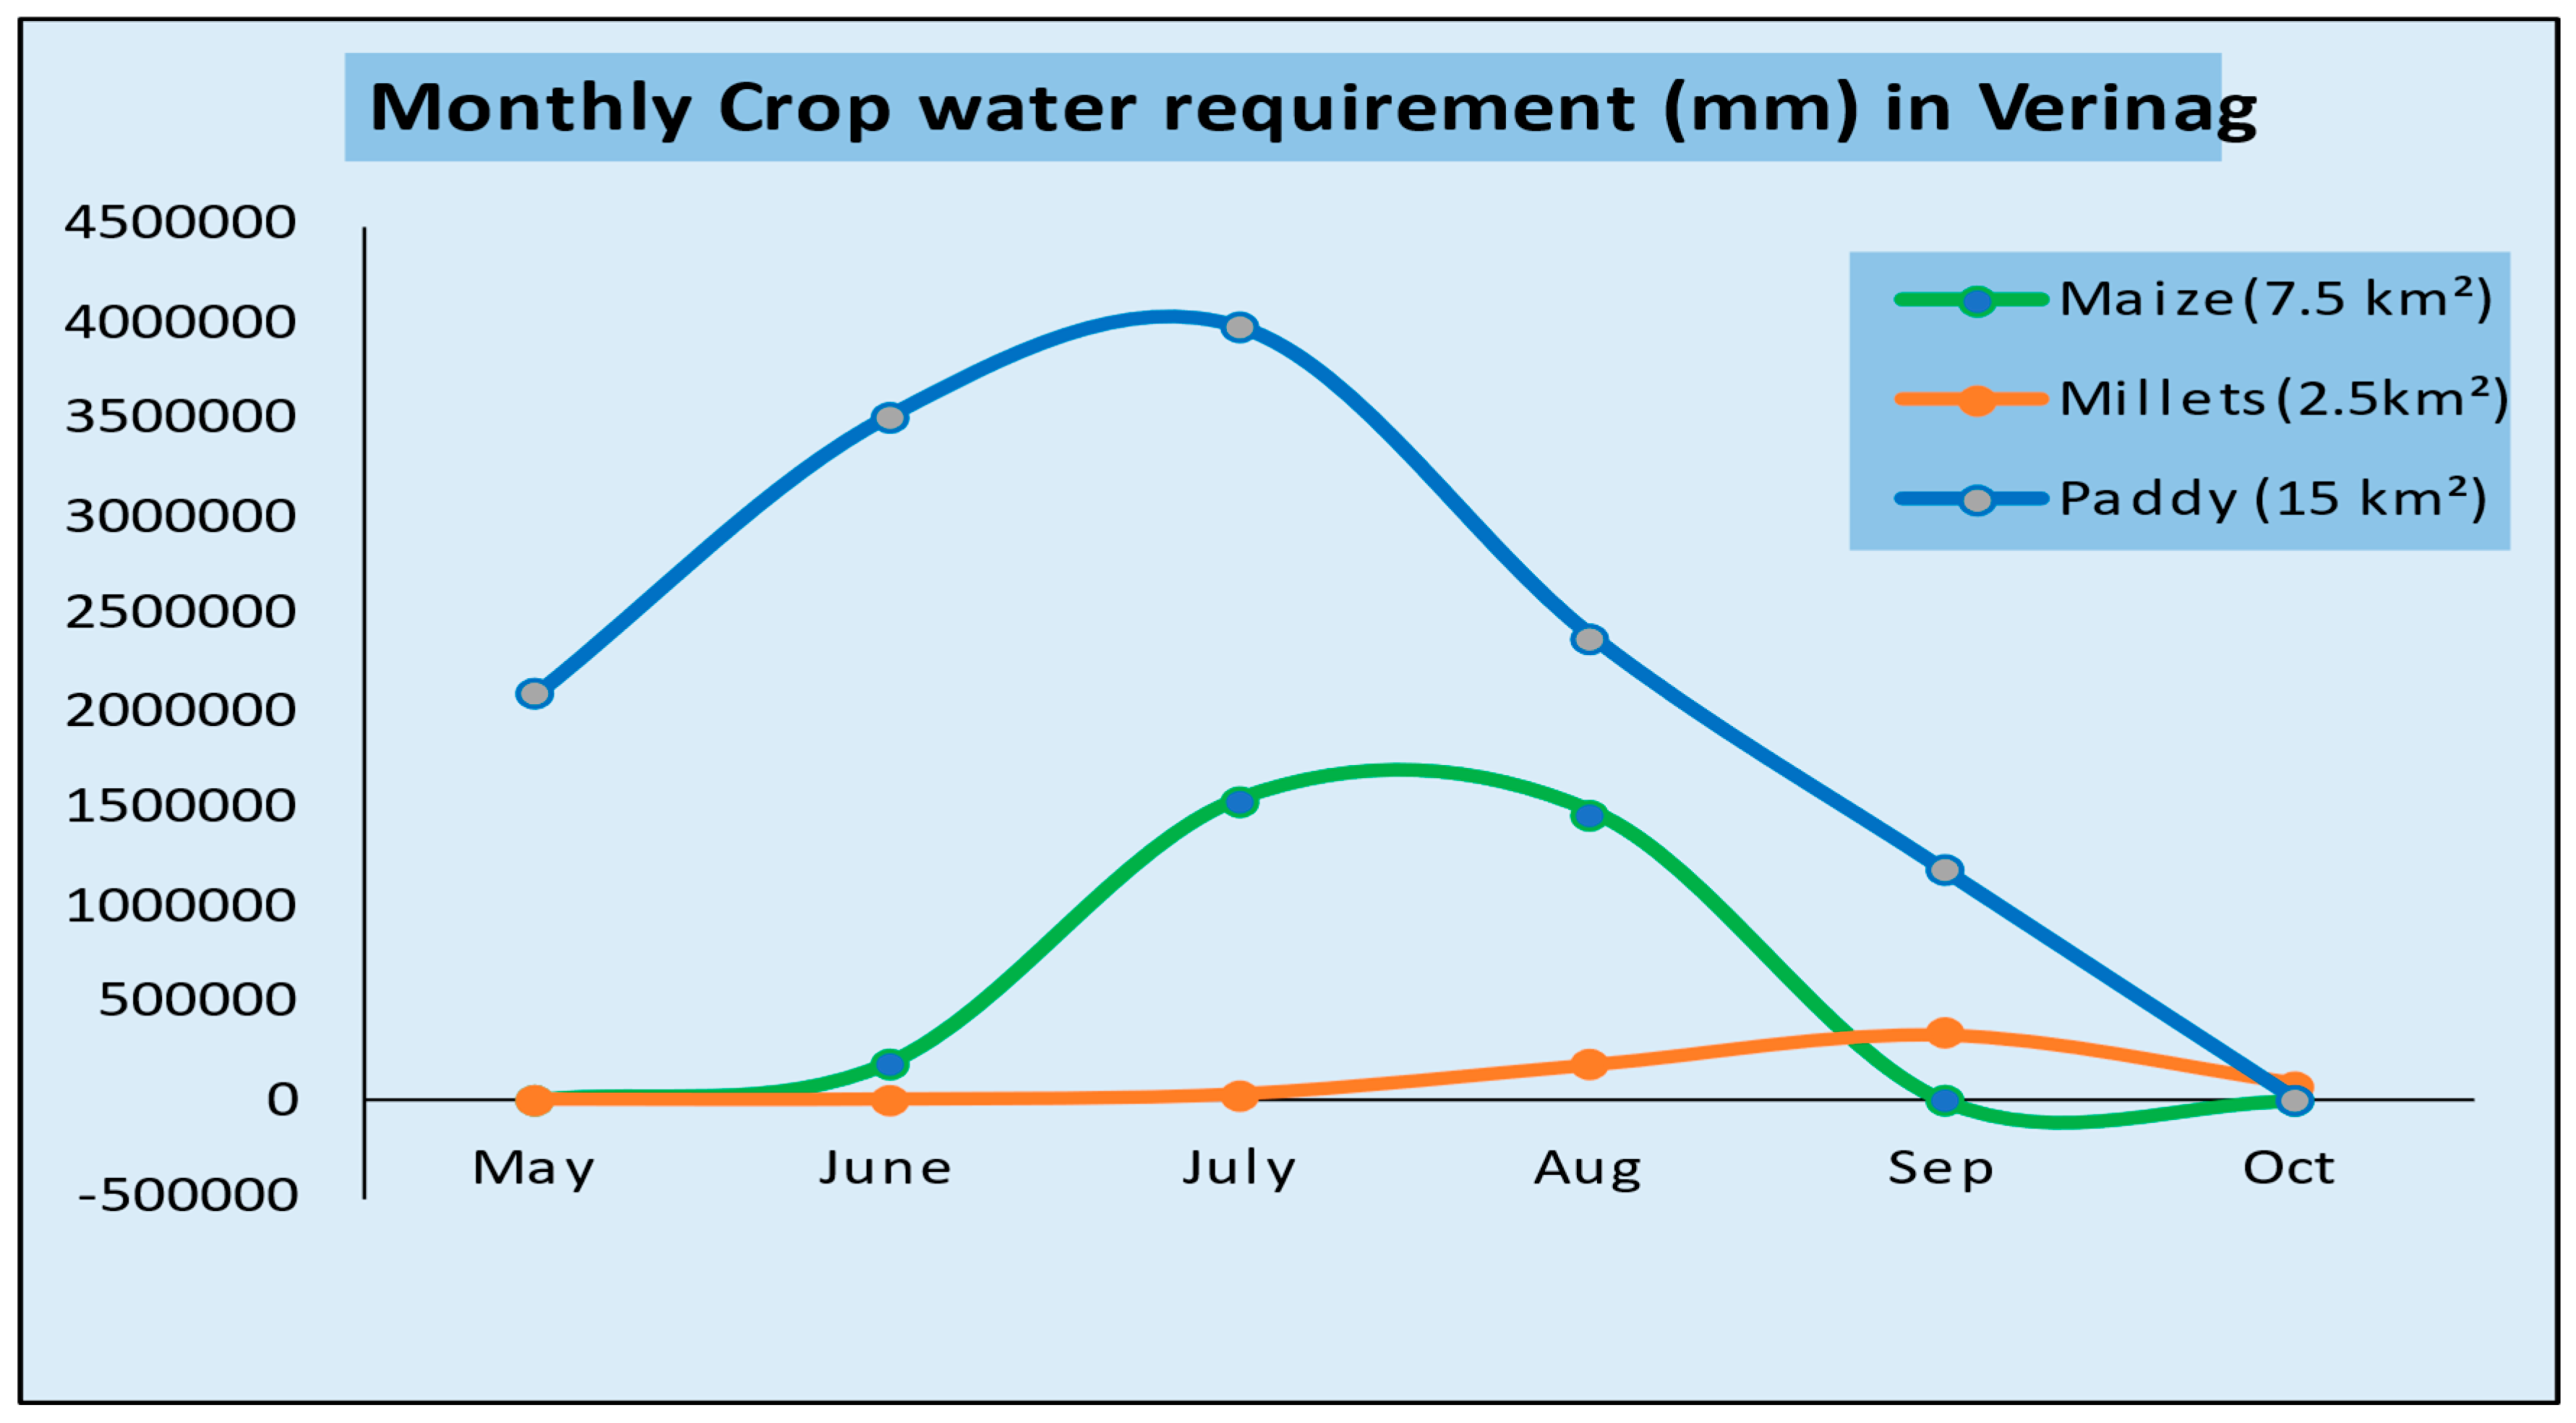
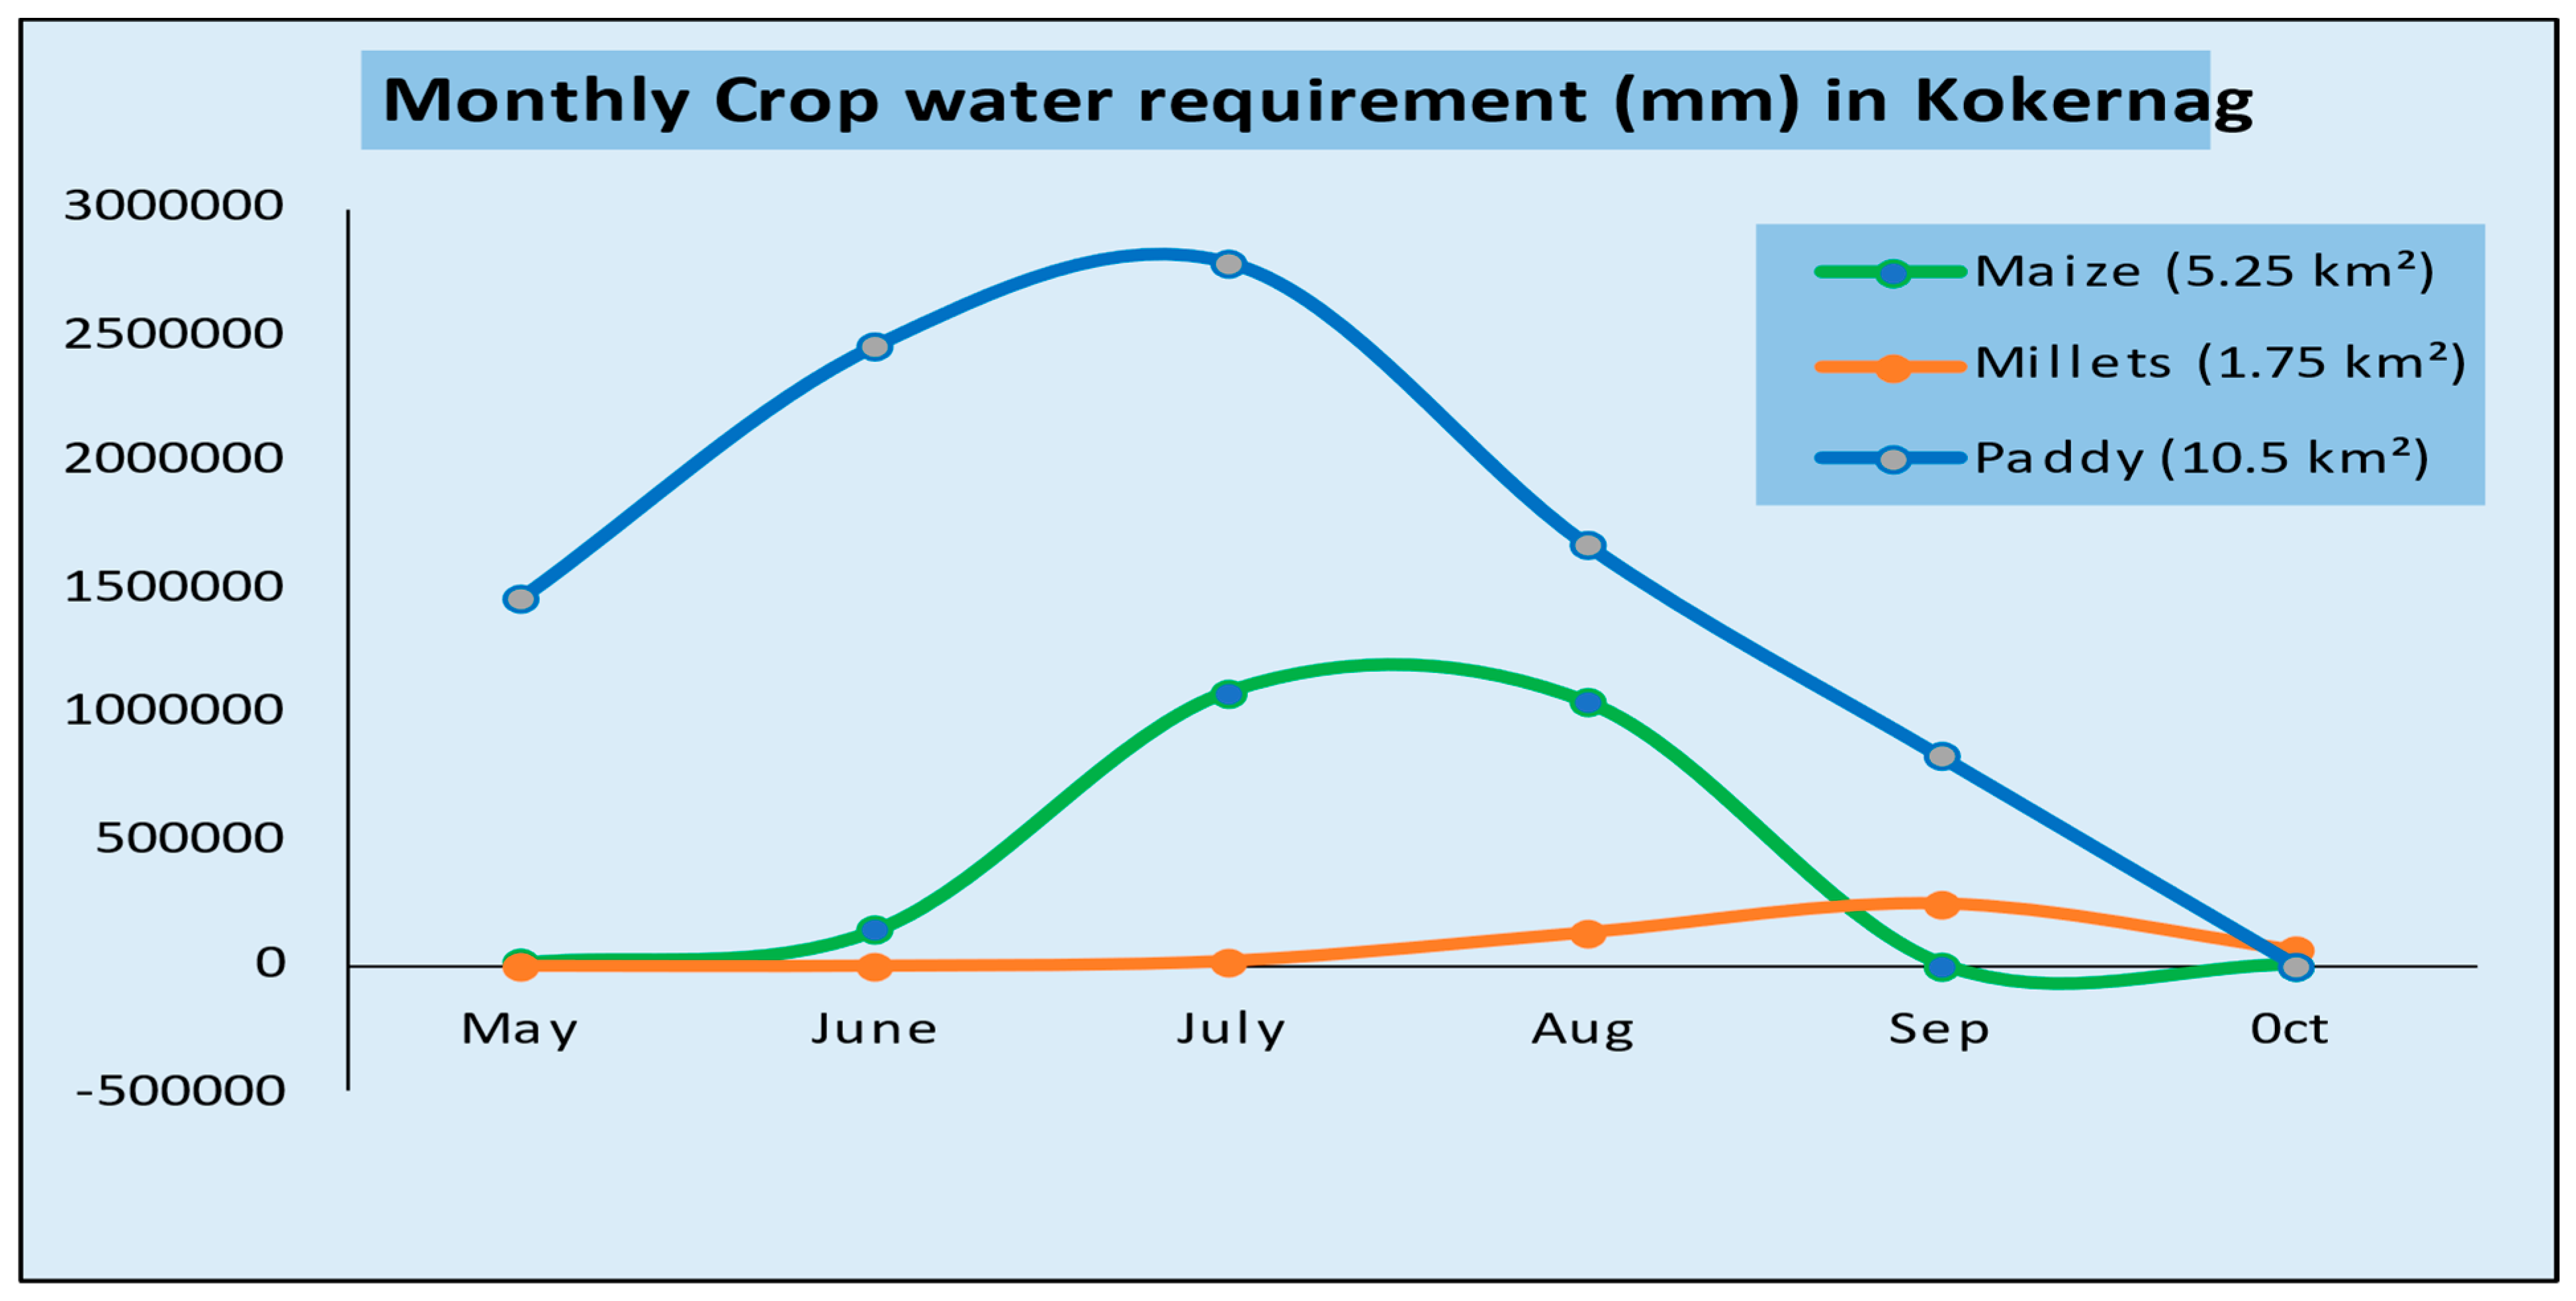
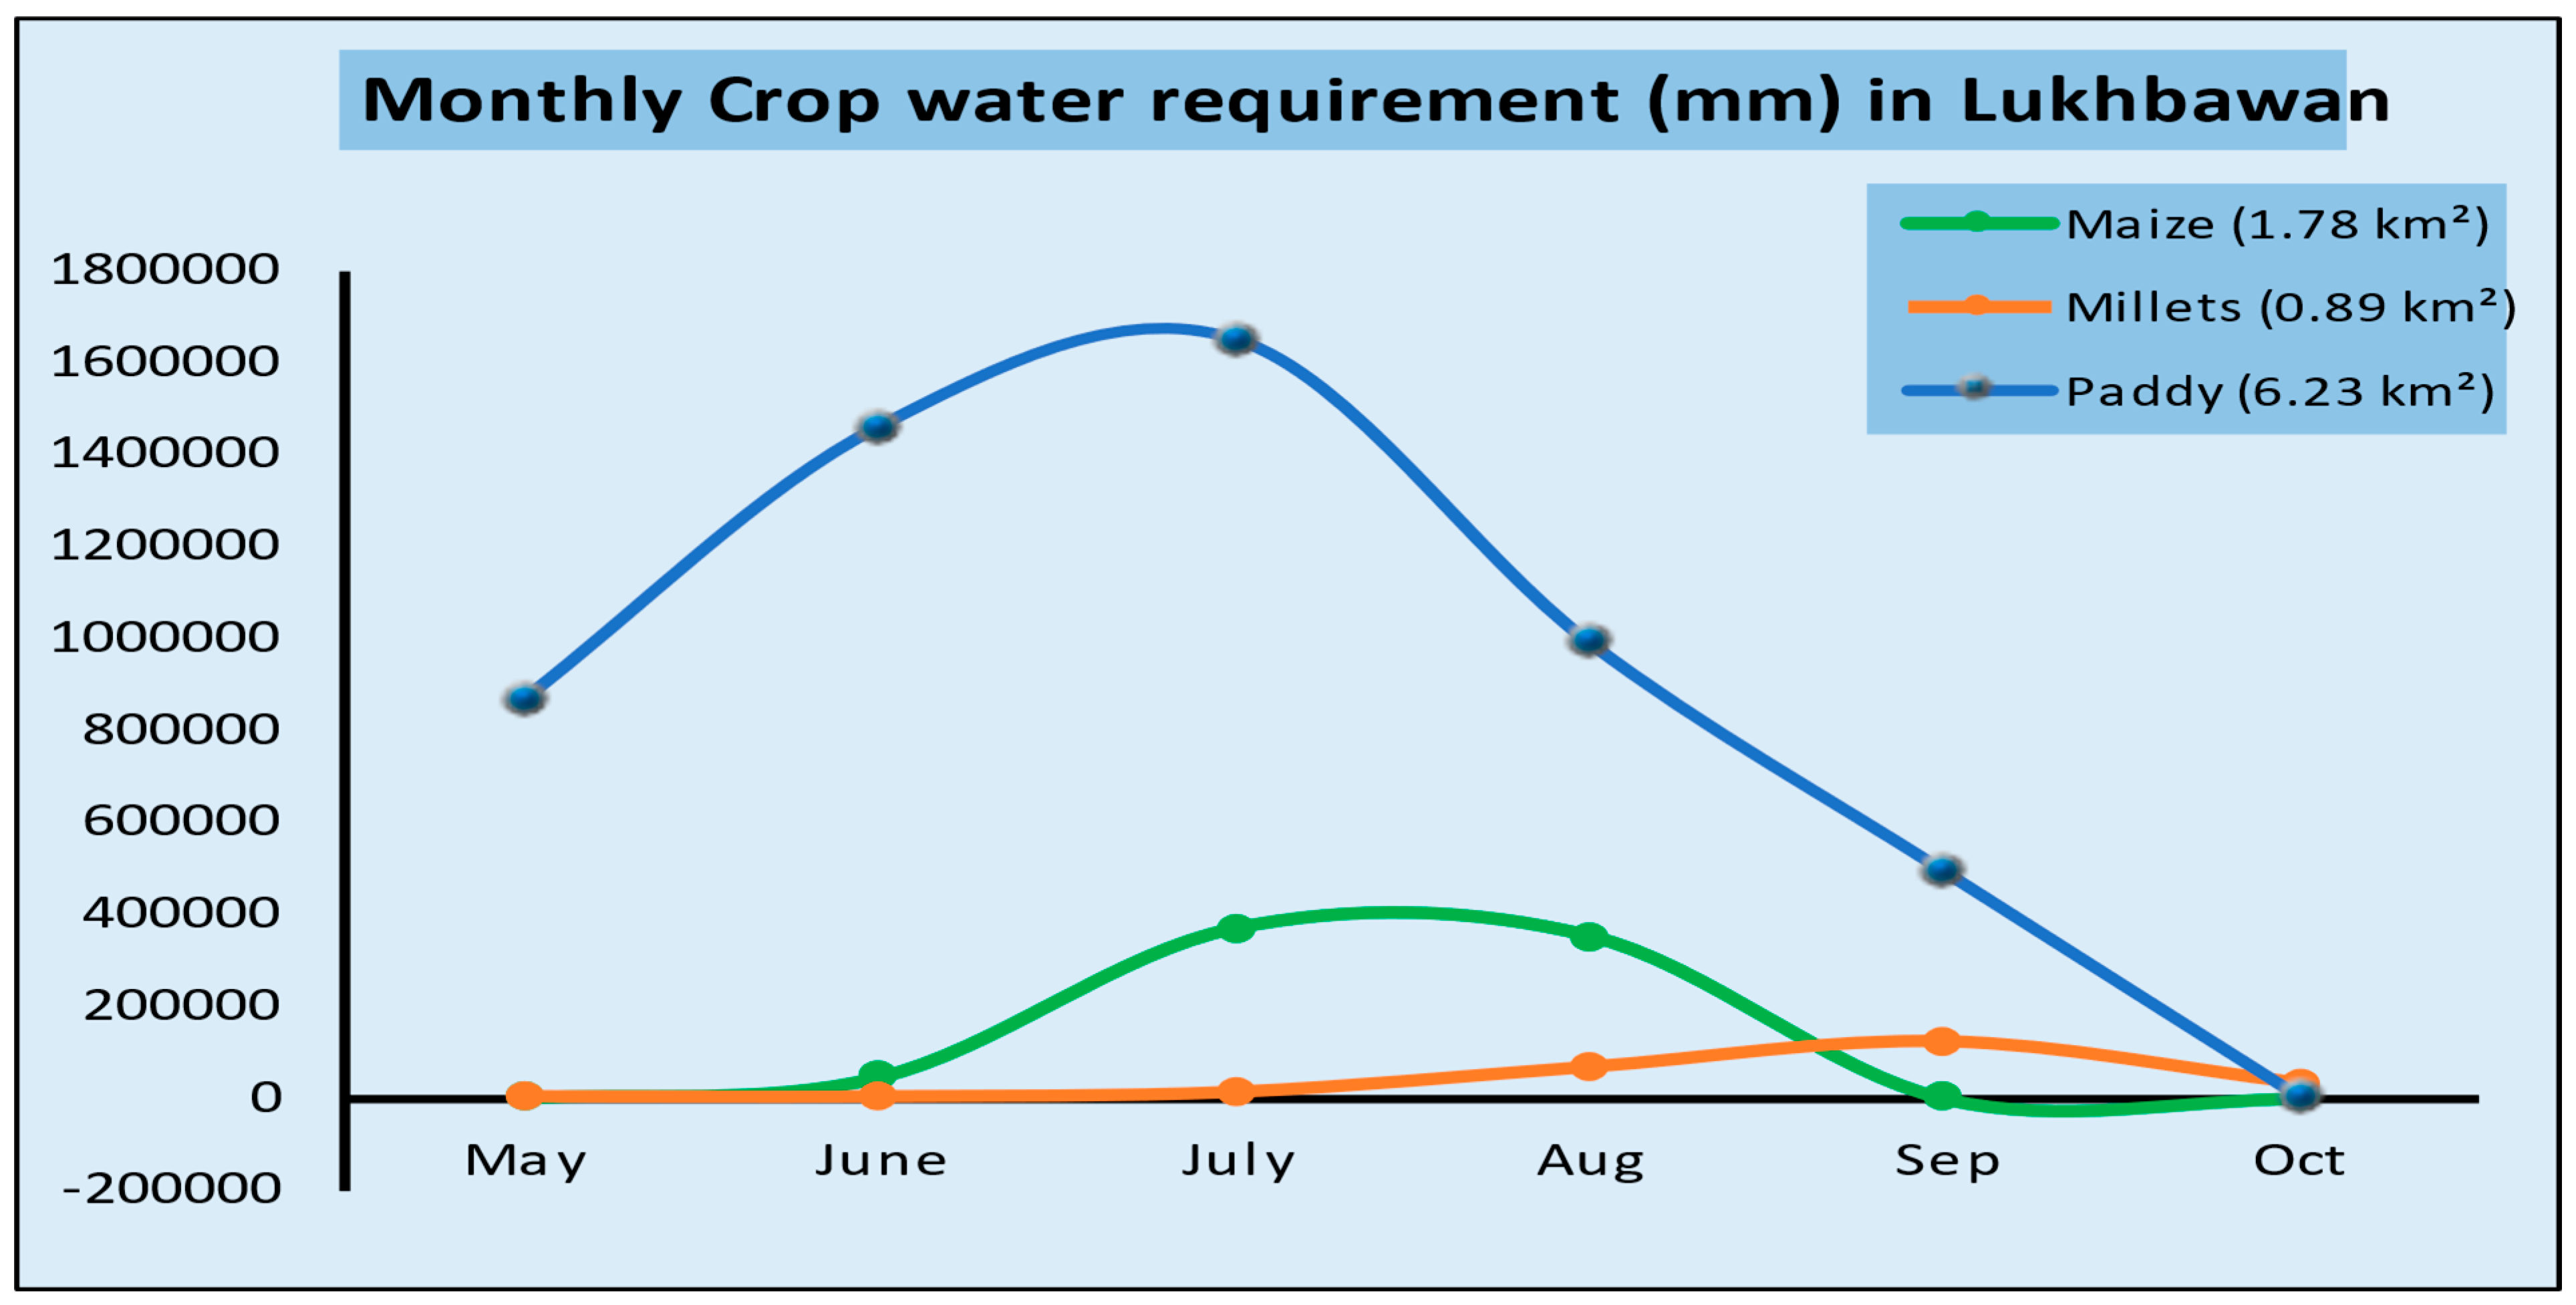
3.2. Crop Water Requirement
- (I)
- Martand Spring
- (II)
- Verinag Spring
- (III)
- Kokernag Spring
- (IV)
- Lukhbawan Spring
- (V)
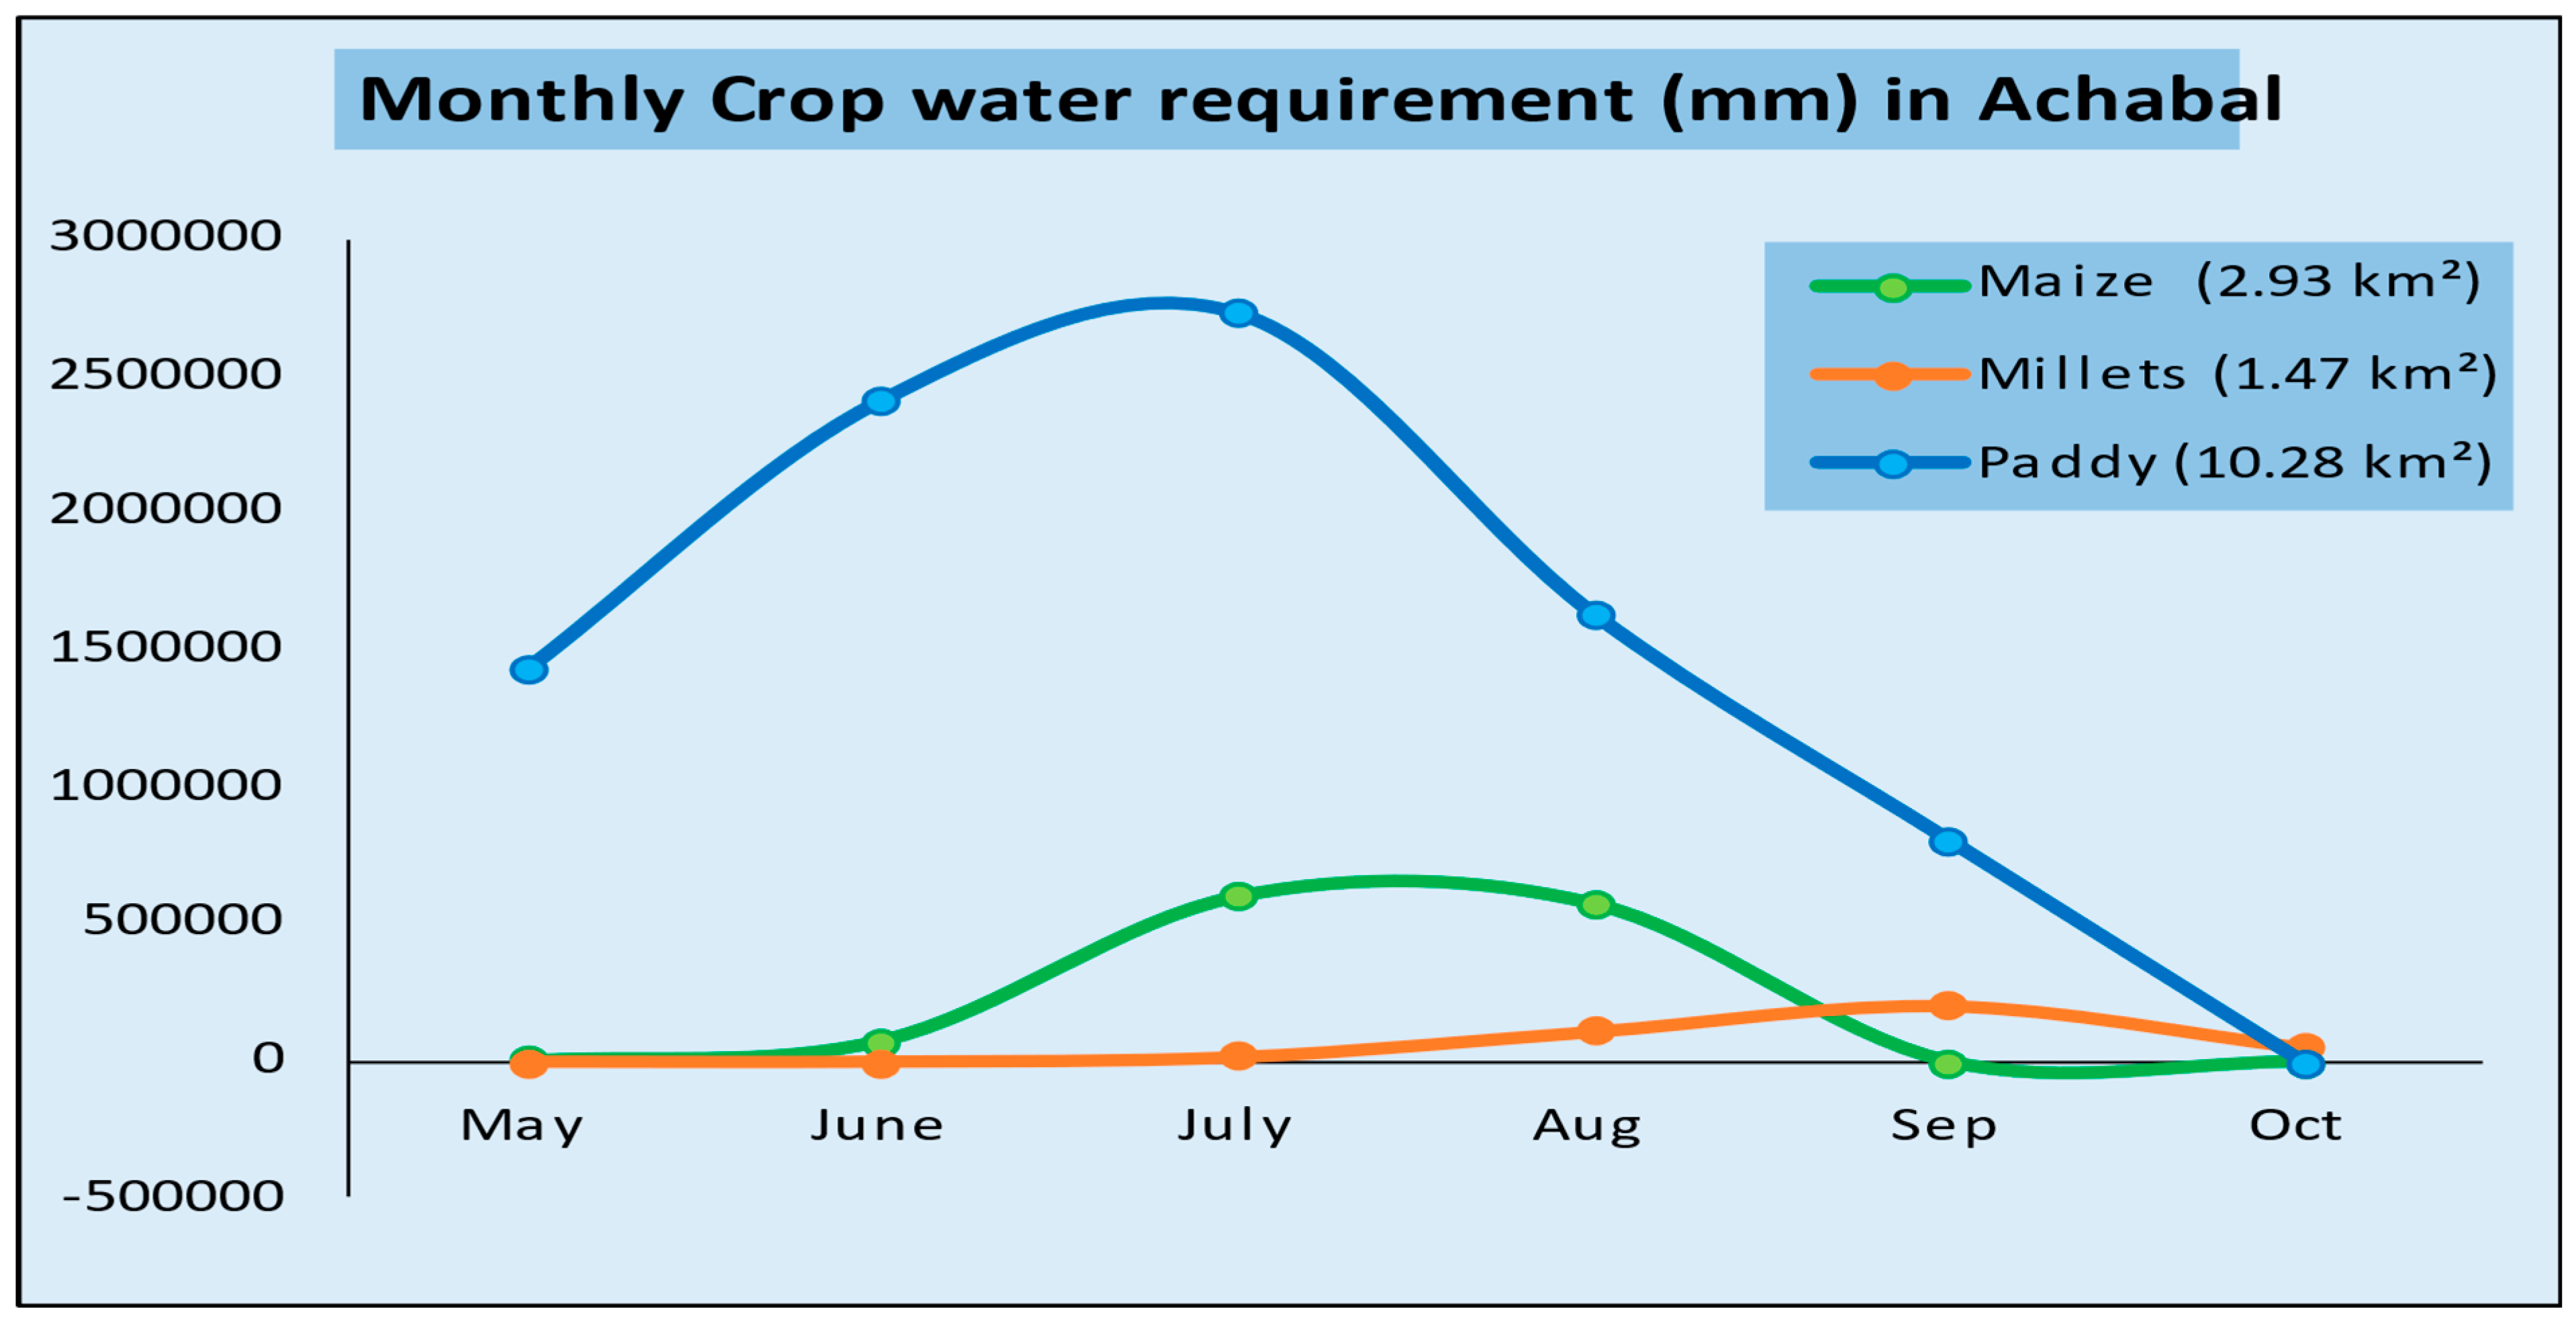
- Achabal Spring
4. Discussion
5. Conclusions
6. Limitations
7. Future Thrust
7.1. Advanced Geospatial Analysis
7.2. Climate Impact Studies
7.3. Integrated Watershed Management
7.4. Biodiversity Conservation
7.5. Geological and Hydrological Research
7.6. Collaborative Research
Author Contributions
Funding
Institutional Review Board Statement
Informed Consent Statement
Data Availability Statement
Acknowledgments
Conflicts of Interest
References
- McDonald, R.I.; Green, P.; Balk, D.; Fekete, B.M.; Revenga, C.; Todd, M.; Montgomery, M. Urban growth, climate change, and freshwater availability. Proc. Natl. Acad. Sci. USA 2011, 108, 6312–6317. [Google Scholar] [CrossRef] [PubMed]
- McDonald, R.I.; Weber, K.; Padowski, J.; Flörke, M.; Schneider, C.; Green, P.A.; Gleeson, T.; Eckman, S.; Lehner, B.; Balk, D.; et al. Water on an urban planet: Urbanization and the reach of urban water infrastructure. Glob. Environ. Change 2014, 27, 96–105. [Google Scholar] [CrossRef]
- Garrick, D.; De Stefano, L.; Yu, W.; Jorgensen, I.; O’Donnell, E.; Turley, L.; Aguilar-Barajas, I.; Dai, X.; de Souza Leão, R.; Punjabi, B.; et al. Rural water for thirsty cities: A systematic review of water reallocation from rural to urban regions. Environ. Res. Lett. 2019, 14, 043003. [Google Scholar] [CrossRef]
- Krueger, E.H.; Borchardt, D.; Jawitz, J.W.; Klammler, H.; Yang, S.; Zischg, J.; Rao, P.S.C. Resilience dynamics of urban water supply security and potential of tipping points. Earth’s Future 2019, 7, 1167–1191. [Google Scholar] [CrossRef]
- Krueger, E.; Rao, P.S.C.; Borchardt, D. Quantifying urban water supply security under global change. Glob. Environ. Change 2019, 56, 66–74. [Google Scholar] [CrossRef]
- Flörke, M.; Schneider, C.; McDonald, R.I. Water competition between cities and agriculture driven by climate change and urban growth. Nat. Sustain. 2018, 1, 51–58. [Google Scholar] [CrossRef]
- Chakraborti, R.K.; Kaur, J.; Kaur, H. Water shortage challenges and a way forward in India. J.-Am. Water Work. Assoc. 2019, 111, 42–49. [Google Scholar] [CrossRef]
- Kumar, V.; Sen, S. Assessment of spring potential for sustainable agriculture: A case study in lesser Himalayas. Appl. Eng. Agric. 2020, 36, 11–24. [Google Scholar] [CrossRef]
- James, A.J. Institutional challenges for water resources management: India and South Africa. In Water, Households and Rural Livelihoods (WHIRL); WHIRL Project Working Paper 7; WHIRL: Pittsburgh, PA, USA, 2003. [Google Scholar]
- Rao, C.S.; Lal, R.; Prasad, J.V.; Gopinath, K.A.; Singh, R.; Jakkula, V.S.; Sahrawat, K.L.; Venkateswarlu, B.; Sikka, A.K.; Virmani, S.M. Potential and challenges of rainfed farming in India. Adv. Agron. 2015, 133, 113–181. [Google Scholar] [CrossRef]
- Postel, S.L. Securing water for people, crops, and ecosystems: New mindset and new priorities. Nat. Resour. Forum 2003, 27, 89–98. [Google Scholar] [CrossRef]
- Tilman, D.; Cassman, K.G.; Matson, P.A.; Naylor, R.; Polasky, S. Agricultural sustainability and intensive production practices. Nature 2002, 418, 671–677. [Google Scholar] [CrossRef] [PubMed]
- Rockström, J.; Steffen, W.; Noone, K.; Persson, A.; Chapin, F.S.; Lambin, E.F.; Foley, J.A. A safe operating space for humanity. Nature 2009, 461, 472–475. [Google Scholar] [CrossRef] [PubMed]
- Askri, B.; Bouhlila, R.; Job, J.O. Development and application of a conceptual hydrologic model to predict soil salinity within modern Tunisian oases. J. Hydrol. 2010, 380, 45–61. [Google Scholar] [CrossRef]
- Mahamuni, K.; Kulkarni, H. Groundwater resources and spring hydrogeology in South Sikkim, with special reference to climate change. In Climate Change in Sikkim—Patterns, Impacts and Initiatives; Information and Public Relations Department Govemment of Sikkim: Gangtok, India, 2012; pp. 261–274. [Google Scholar]
- Khadka, K.; Rijal, M.L. Hydrogeochemical assessment of spring water resources around Melamchi, Central Nepal. Water Pract. Technol. 2020, 15, 748–758. [Google Scholar] [CrossRef]
- Ansari, M.A.; Deodhar, A.; Kumar, U.S.; Khatti, V.S. Water quality of few springs in outer Himalayas—A study on the groundwater–bedrock interactions and hydrochemical evolution. Groundw. Sustain. Dev. 2015, 1, 59–67. [Google Scholar] [CrossRef]
- Haque, S.; Kannaujiya, S.; Taloor, A.K.; Keshri, D.; Bhunia, R.K.; Ray, P.K.C.; Chauhan, P. Identification of groundwater resource zone in the active tectonic region of Himalaya through earth observatory techniques. Groundw. Sustain. Dev. 2020, 10, 100337. [Google Scholar] [CrossRef]
- Gupta, P.; Minhas, D.S.; Tamhane, R.M.; Mookerjee, A.K. Application of Geographic Information System (GIS) tools in watershed analysis. In Technical Bulletin; ESRI: New Delhi, India, 2003. [Google Scholar]
- Barakat, A.; Meddah, R.; Afdali, M.; Touhami, F. Physicochemical and microbial assessment of spring water quality for drinking supply in piedmont of Béni-Mellal Atlas (Morocco). Phys. Chem. Earth Parts A/B/C 2018, 104, 39–46. [Google Scholar] [CrossRef]
- Bhat, B.B. Physico-chemical analysis of River Baldi Sahastradhara (Dehradun). Int. J. Sci. Technoledge 2015, 3, 292–299. [Google Scholar]
- Chen, J.; Wang, Y.; Li, F.; Liu, Z. Aquatic ecosystem health assessment of a typical sub-basin of the Liao River based on entropy weights and a fuzzy comprehensive evaluation method. Sci. Rep. 2019, 9, 14045. [Google Scholar] [CrossRef]
- Adimalla, N.; Qian, H. Spatial distribution and health risk assessment of fluoride contamination in groundwater of Telangana: A state of the art. Geochemistry 2020, 80, 125548. [Google Scholar] [CrossRef]
- NITI Aayog. Budget Allocation Increased by More Than 20%; Press Information Bureau: New Delhi, India, 2020. [Google Scholar]
- Thakur, N.; Rishi, M.; Keesari, T.; Sharma, A.D. Suitability of spring water from the Upper Beas River Basin in Kullu Valley (Western Himalaya, India) for drinking and irrigation purposes. Arab. J. Geosci. 2020, 13, 1186. [Google Scholar] [CrossRef]
- Coward, J.M.H.; Waltham, A.C.; Bowser, R.J. Karst springs in the Vale of Kashmir. J. Hydrol. 1972, 16, 213–223. [Google Scholar] [CrossRef]
- Central Groundwater Board (CGWB). Groundwater Information Booklet of Chandel District, Manipur; Technical Report Series: D, No: 10/2013-14; North Eastern Region, Ministry of Water Resources: Guwahati, India, 2013. [Google Scholar]
- Anantnag District Administration. District Anantnag. District Profile. Available online: https://anantnag.nic.in/district-profile/ (accessed on 26 December 2024).
- Rashid, I.; Romshoo, S.A.; Abdullah, T. The recent deglaciation of Kolahoi valley in Kashmir Himalaya, India in response to the changing climate. J. Asian Earth Sci. 2017, 138, 38–50. [Google Scholar] [CrossRef]
- Attar, M.I.; Pandey, Y.; Naseer, S.; Bangroo, S.A. Soil erosion modelling using GIS-integrated RUSLE of Urpash watershed in Lesser Himalayas. Arab. J. Geosci. 2024, 17, 104. [Google Scholar] [CrossRef]
- Attar, M.I.; Naseer, S.; Khan, J.N.; Bangroo, S.A.; Altaf, Y.; Khan, A.H.; Sabi, E. Assessment of shift in GWPZs in Kashmir Valley of Northwestern Himalayas. Environ. Sustain. Indic. 2024, 24, 100513. [Google Scholar] [CrossRef]
- Morse, B.; Hamai, K.; Choquette, Y. River discharge measurement using the velocity index method. In Proceedings of the 13th Workshop on the Hydraulics of Ice Covered Rivers, Hanover, NH, USA, 15–16 September 2005. [Google Scholar]
- Van den Bosch, B.E.; Snellen, W.B.; Brouwer, C.; Hatcho, N. Irrigation Water Management Training Manual No. 8. Structures for Water Control and Distribution; Food and Agriculture Organisation of the United Nations: Rome, Italy, 1993. [Google Scholar]
- Chen, Y.; Fu, Z.; Chen, Q.; Cui, Z. Discharge coefficient of rectangular short-crested weir with varying slope coefficients. Water 2018, 10, 204. [Google Scholar] [CrossRef]
- Burnett, M.W.; Quetin, G.R.; Konings, A.G. Data-driven estimates of evapotranspiration and its controls in the Congo Basin. Hydrol. Earth Syst. Sci. 2020, 24, 4189–4211. [Google Scholar] [CrossRef]
- Valiantzas, J.D. Simplified versions for the Penman evaporation equation using routine weather data. J. Hydrol. 2006, 331, 690–702. [Google Scholar] [CrossRef]
- Ferreira, M.I.; Paço, T.A.; Silvestre, J.; Silva, R.M. Evapotranspiration estimates and water stress indicators for irrigation scheduling in woody plants. In Agricultural Water Management Research Trends; Nova Publishers: New York, NY, USA, 2008; pp. 129–170. [Google Scholar]
- Von Zabeltitz, C. Crop water requirement and water use efficiency. In Integrated Greenhouse Systems for Mild Climates: Climate Conditions, Design, Construction, Maintenance, Climate Control; Springer: Berlin/Heidelberg, Germany, 2011; pp. 313–319. [Google Scholar] [CrossRef]
- Division of Agrometeorology, SKUAST Kashmir. Rainfall and Evaporation Data Records for Kashmir Region (2010–2018.2016–2019 Respectively); Sher-e-Kashmir University of Agricultural Sciences and Technology: Kashmir, India, 2025; unpublished. [Google Scholar]
- Jaunat, J.; Dupuy, A.; Huneau, F.; Celle-Jeanton, H.; Le Coustumer, P. Groundwater flow dynamics of weathered hard-rock aquifers under climate-change conditions: An illustrative example of numerical modeling through the equivalent porous media approach in the north-western Pyrenees (France). Hydrogeol. J. 2016, 24, 1359–1373. [Google Scholar] [CrossRef]
- Duan, X.; Dong, Q.; Ye, W.J.; Zhou, L.J.; Oh, E. Study on adverse effects of groundwater level rising induced by land creation engineering in hilly and gully area of the Loess Plateau. J. Mt. Sci. 2019, 16, 2739–2753. [Google Scholar] [CrossRef]
- Pandit, A.; Batelaan, O.; Pandey, V.P.; Adhikari, S. Depleting spring sources in the Himalayas: Environmental drivers or just perception? J. Hydrol. Reg. Stud. 2024, 53, 101752. [Google Scholar] [CrossRef]
- Joshi, R.; Dhyani, P.P. Environmental sustainability and tourism—Implications of trend synergies of tourism in Sikkim Himalaya. Curr. Sci. 2009, 97, 33–41. [Google Scholar]
- Ahsan, S.; Bhat, M.S.; Alam, A.; Ahmed, N.; Farooq, H.; Ahmad, B. Assessment of trends in climatic extremes from observational data in the Kashmir basin, NW Himalaya. Environ. Monit. Assess 2021, 193, 649. [Google Scholar] [CrossRef]
- Lone, S.A.; Jeelani, G.; Alam, A.; Bhat, M.S.; Farooq, H. Effect of changing climate on the water resources of Upper Jhelum Basin (UJB), India. In Riverine Systems: Understanding the Hydrological; Springer International Publishing: Cham, Switzerland, 2021. [Google Scholar]
- Ahsan, S.; Bhat, M.S.; Alam, A.; Farooq, H.; Shiekh, H.A. Evaluating the impact of climate change on extreme temperature and precipitation events over the Kashmir Himalaya. Clim. Dyn. 2021, 58, 1651–1669. [Google Scholar] [CrossRef]
- Bhat, S.U.; Pandit, A.K. Hydrochemical characteristics of some typical freshwater springs—A case study of Kashmir Valley springs. Int. J. Water Resour. Arid Environ. 2018, 7, 90–100. [Google Scholar]
- Ahmad, L.; Parvaze, S.; Kanth, R. Crop water requirement of major crops of Srinagar, Kashmir (J&K). J. Exp. Agric. Int. 2017, 15, 1–9. [Google Scholar]
- Bhat, S.A.; Pandit, B.A.; Khan, J.N.; Kumar, R.; Jan, R. Water requirements and irrigation scheduling of maize crop using CROPWAT model. Int. J. Curr. Microbiol. Appl. Sci. 2017, 6, 1662–1670. [Google Scholar] [CrossRef]


| Spring | Average Discharge | Command Area |
|---|---|---|
| (m3/s) | (Km2) | |
| Martand Temple Spring | 0.9124 | 16.21 |
| Malakhnag Spring | 0.23 | 0.10 |
| Sherbagh Spring | 1.97 | 0.11 |
| Achabal Spring | 0.67 | 14.69 |
| Kokernag Spring | 1.16 | 17.49 |
| Verinag Spring | 4.55 | 25.01 |
| Lukhbawan Spring | 0.17 | 8.9 |
Disclaimer/Publisher’s Note: The statements, opinions and data contained in all publications are solely those of the individual author(s) and contributor(s) and not of MDPI and/or the editor(s). MDPI and/or the editor(s) disclaim responsibility for any injury to people or property resulting from any ideas, methods, instructions or products referred to in the content. |
© 2025 by the authors. Licensee MDPI, Basel, Switzerland. This article is an open access article distributed under the terms and conditions of the Creative Commons Attribution (CC BY) license (https://creativecommons.org/licenses/by/4.0/).
Share and Cite
Khan, Z.A.; Kumar, R.; Khan, A.H.; Majeed, A.; Attar, M.I.; Jagadesh, P. Impact Assessment of Natural Springs for Irrigation Potential in the Hilly Areas of Kashmir. Sustainability 2025, 17, 5490. https://doi.org/10.3390/su17125490
Khan ZA, Kumar R, Khan AH, Majeed A, Attar MI, Jagadesh P. Impact Assessment of Natural Springs for Irrigation Potential in the Hilly Areas of Kashmir. Sustainability. 2025; 17(12):5490. https://doi.org/10.3390/su17125490
Chicago/Turabian StyleKhan, Zubair Ahmad, Rohitashw Kumar, Afzal Husain Khan, Adil Majeed, Mohmmad Idrees Attar, and P. Jagadesh. 2025. "Impact Assessment of Natural Springs for Irrigation Potential in the Hilly Areas of Kashmir" Sustainability 17, no. 12: 5490. https://doi.org/10.3390/su17125490
APA StyleKhan, Z. A., Kumar, R., Khan, A. H., Majeed, A., Attar, M. I., & Jagadesh, P. (2025). Impact Assessment of Natural Springs for Irrigation Potential in the Hilly Areas of Kashmir. Sustainability, 17(12), 5490. https://doi.org/10.3390/su17125490