Article

Tracing the Evolution of Tourist Perception of Destination Image: A Multi-Method Analysis of a Cultural Heritage Tourist Site

1
College of Art and Design, Xihua University, Chengdu 610041, China
2
Department of Global Convergence, Kangwon National University, Chuncheon 24341, Republic of Korea
*
Author to whom correspondence should be addressed.
Sustainability 2025, 17(12), 5476; https://doi.org/10.3390/su17125476
Submission received: 19 May 2025 / Revised: 8 June 2025 / Accepted: 10 June 2025 / Published: 13 June 2025
(This article belongs to the Section Tourism, Culture, and Heritage)

Abstract

In the face of an unprecedented public health crisis (COVID-19), despite tourist perceptions toward cultural heritage tourism having undergone significant transformation, such transitions are increasingly viewed as opportunities to enhance sustainability practices in cultural heritage tourism worldwide. This study traces the evolution of tourist perceptions at Lijiang Old Town, a UNESCO World Heritage Site, across three stages from 2017 to 2024—before the pandemic, during the pandemic, and after the pandemic. Data were collected from major tourism platforms, yielding a comprehensive dataset of 50,022 user-generated reviews. We adopt a mixed-method framework integrating TF-IDF, Social Network Analysis (SNA), and Latent Dirichlet Allocation (LDA) to identify salient terms, semantic structures, and latent themes from large-scale unstructured textual data across time. The findings indicate that cultural heritage tourism demonstrates adaptability and resilience through significant perceptual transitions. After the pandemic, visitors increasingly prioritized cultural depth and high-quality service experiences, whereas before the pandemic, tourists focused more on cultural heritage attractions and commercial experiences. Moreover, during the pandemic period, visitor narratives reflected adaptations toward quieter, safer, and more personalized experiences, highlighting the impact of safety measures on tourism patterns. These findings demonstrate the methodological potential for dynamically monitoring perception shifts and offer empirical grounding for future perception-oriented research and sustainable cultural heritage destination management practices in cultural heritage tourism toward sustainable tourism.

1. Introduction

COVID-19 caused a 74% decline in global tourism [1]. In particular, a global survey by UNESCO reported that 71% of World Heritage sites experienced full or partial closure in 2020, with an average duration of 157 days [2]. However, this disruption may offer potential positive insights [3], including the temporary alleviation of physical pressures on heritage sites [4]. Scholars have noted that the risks of resurgence may persist if pre-pandemic models continue, but the crisis has accelerated debates on tourism sustainability, with scholars advocating path-breaking reforms [5].
In the post-pandemic era, cultural heritage tourism (CHT) plays a key role in economic recovery [6,7]. Meanwhile, its inherent cultural value enables tourists to experience the soul of a place through both tangible and intangible expressions [8]. Nowhere is this dual role more evident than in China, where it serves as a cultural carrier. CHT is specifically an important vehicle for disseminating rich and unique cultural traditions to the public [9]. Grounded in rich historical, cultural, and architectural assets, CHT has grown into a prominent and influential travel form [10]. Globally, CHT grapples with a fundamental tension: cultural preservation versus commercial exploitation, a core dilemma also central to debates on sustainable tourism development [10]. Mature heritage sites face overcrowding threats to their Outstanding Universal Value [11] and authenticity challenges [12,13]. Meanwhile, tourists’ cultural experiences—such as wonder, learning, and connection to local heritage—are increasingly seen as integral to the perceived image of heritage destinations [14].
Despite the conceptual definition of destination image (DI) in tourism remaining somewhat ambiguous, the dimensions of cognitive and affective are widely recognized by scholars as being the two primary ones, which work together and affect the overall impression of potential tourists on the destination [15,16]. In this study, the term DI is used to emphasize representations constructed from the visitor’s perceptions [17]. DI plays a critical role in shaping visitor behavior and satisfaction and is increasingly recognized as a practical tool for destination governments [18,19,20]. In the context of CHT, recent studies further emphasize its significance not only for attracting visitors but also for optimizing heritage site management strategies [21,22].
Although early studies by Hunter and Gartner in the late 1980s acknowledged the dynamic nature of destination image, most subsequent research has continued to rely on static, cross-sectional methods. Pike et al. [23] demonstrated the value of temporal analysis in DI through structural surveys, and also highlighted the lack of systematic studies that trace temporal DI shifts. With the rise of social media, many tourists share their experiences and reviews through online platforms, which is beyond merely reflecting their perceptions of the destination; meanwhile, they serve as a dynamic force in the co-construction of its image, influencing how others perceive and engage with the place. These personal narratives are more relevant and credible than official propaganda [24]. Meanwhile, User-generated content (UGC) data stands out as one of the most strategic sources for researching overall destination image by extracting real-time perceptions of cultural destinations [8,25]; however, its ability to reveal subtle shifts in image across time remains underexplored [26].
Given its well-documented commercial pressures [27], the Old Town of Lijiang—a UNESCO World Heritage site recognized for its Outstanding Universal Value and a mature cultural heritage destination in China—serves as a revealing case to trace how tourist-perceived destination image evolves across crisis phases. The dynamics observed here are not unique but reflective of wider heritage tourism challenges in China and beyond [28]. To address the gap, this study analyzes a total of 50,022 valid online reviews and applies a triangulated framework that combines TF-IDF (lexical salience), SNA (semantic network structure), and LDA (latent topics). This exploratory design captures the temporal shifts in destination image across pandemic phases within the context of cultural heritage tourism (CHT). It responds to Pike et al.’s [23] call for temporally grounded insights with practical implications for destination management, contributing to two key fronts:
(1)
Exploring how a data-driven mixed-method design can trace the temporal evolution of destination image by triangulating salient terms, shifting semantic structures, and latent cultural themes, with attention to both stability and transformation across crisis stages.
(2)
Revealing the temporal shifts in the components of destination image in cultural heritage tourism, and further examining how tourists’ culturally rooted and commercially oriented perceptions are restructured in response to external disruptions, with the pandemic as a representative case.

2. Literature Review

2.1. Cultural Heritage Tourism

Cultural Heritage Tourism (CHT) has been conceptualized as serving both cultural and economic functions. CHT enhances cultural distinctiveness maintenance, helping to preserve traditional crafts, festivals, and rituals [29]. By increasing awareness and appreciation of the local traditions, it fosters pride and a sense of belonging among residents, contributing to cultural conservation [27,30]. Economically, CHT stimulates the local economy through the expenditures on accommodations, food, activities, and souvenirs significantly by tourists [31], further boosting local job creation, city revitalization, and community development. However, excessive commodification can lead to alienation from cultural roots and the erosion of authenticity [12,13]. As a response, community-based tourism has been proposed as a sustainable approach, ensuring that economic benefits remain within the community and encouraging residents’ participation [32,33]. It is not only influenced by the economic and cultural capital of tourists but also by the values and norms inherent in the destination. As Urry [34] succinctly noted, “what the tourist sees is never innocent”, suggesting that perception is shaped as much by social structures as by individual preferences.
The perception is usually seen as a mental experience, constituting a complex and multidimensional process. It has been proven that well-being, conceptualized as an eudemonic and hedonic experience of tourists, is positively correlated with the destination fascination of CHT through a research survey in Shennong Heritage Street in Taiwan [35]. Studies have also shown the positive influences of tourists’ perceptions on experience and cultural identity. The aesthetic aspects of perceptions play an important mediating role in the intrinsic mechanisms connecting CHT and cultural identity [36]. As part of collections of perceived continuities, “felt history” influences the visitor experience of cultural heritage tourism [37], transforming destinations into spaces of emotional connection and leaving a profound impression on visitors’ understanding of the past. It also determines tourists’ estimation and expectation of visiting experiences, which are formed through the interaction between tourists with their interpretation and knowledge and the tangible and intangible assets of cultural heritage sites, including buildings, residents, events, and activities [38,39]. Research conducted with 499 respondents in Macau revealed that historical storytelling can positively contribute to tourists’ perceptions of authentic places through the approach of enhancing interaction between tourists and tour guides [40].
Despite the fact that CHT is considered an important segment for tourism destinations, a systematic and multidimensional approach to understanding the collective perception of CHT remains lacking. Moreover, evidence shows that CHT has become increasingly important for tourism recovery after the crisis [41]. While many recent studies on CHT in China have examined historic districts and streets in urban areas [42,43,44]. There remains a lack of in-depth understanding of historically layered old towns like Lijiang.

2.2. Destination Image

Destination image (DI) is an overall impression created by all the associations that individuals relate to a destination [45]. Since the early work undertaken by John Hunter, Edward Mayo, and Clare Gunn in the 1970s, DI research has long been a focus of tourism research [46]. The significance of DI to tourism has been well-established in the literature [47,48]. DI is mainly influenced by personal perceptions through visiting experiences and impressions from second-hand information sources such as advertisements [17], comprising collectively held ideas or conceptions [49]. Most researchers tend to represent DI as the holistic mental impressions and perceptions held by tourists about a destination [50]. Despite the continuing imprecision and ambiguity surrounding the DI concept [45,51], consensus exists that DI develops through three hierarchically interrelated components: cognitive, affective, and conative [52]—a framework widely applied in DI studies.
Additionally, internal structure models, including the long-tail distribution model [53] and the core-periphery model [50], have been developed, leading to an enhanced understanding of DI’s multifaceted nature and underlying components.
Empirical studies on DI have extensively examined its relationship with tourist behaviors, including visitation intention, satisfaction, and loyalty [15,18,54,55,56]. In contrast, while some scholars have noticed the temporal change in DI, most DI research has traditionally emphasized static analyses [46,57]. Early research by Gartner [58] found minimal short-term shifts in state image, followed by the research by Gartner and Hunt [59], which identified significant long-term DI improvements driven by advertising. This temporal pattern was confirmed through Tasci and Holecek’s [60] longitudinal DI study of Michigan from surveys. It is worth noticing that major events create distinct impacts—the Olympics generally enhanced DI [61], while crises like COVID-19 negatively affected destinations despite resilience in crisis management [62,63]. Despite these contributions, systematic temporal analyses remain scarce, predominantly focusing on urban or national scales [64,65]. While existing studies have advanced understanding of DI evolution, most rely on structured questionnaires with pre-defined attributes, which constrain the inductive analysis of tourist perceptions [66]. A few employ interviews to partially offset framing bias [62]. As Pike et al.’s [23] emphasizes, methodologically rigorous longitudinal research represents a critical gap in tourism literature.

2.3. Destination Image of Cultural Heritage Tourism Based on UGC

Social media significantly influences destination image through reviews and blogs [67], transforming image formation from DMO-controlled to co-created with tourists [68]. This co-created image subsequently integrates into destination promotional content, not only critically influencing potential visitors’ decision-making processes but also creating unprecedented opportunities for destination image research. While traditional methods like surveys and interviews demonstrate significant limitations when examining collective destination perceptions at scale, user-generated content (UGC) as a non-structural research corpus enables researchers to construct more comprehensive DI that reflect collective perceptions without the constraints of predefined questionnaire structures [26,35].
Adopting text mining techniques to analyze UGC to reveal an overall image of a destination has become an ongoing trend; within it, tourists’ online reviews become essential data sources and have been widely analyzed. As it has usually been seen as a message, content analysis has mainly been applied. Keyword analysis offers opportunities to extract meaningful words from large raw data for content analysis [69].
The term frequency-inverse document frequency (TF-IDF) algorithm has been used for identifying important terms from unstructured text, such as online reviews in the tourism research domain [25,64], alongside word cloud visualization to compare the preferences and perceptions of tourists toward different destinations, alongside keywords [25,70].
In the past five years, Latent Dirichlet Allocation (LDA) based on UGC data has begun to emerge. It has been applied to extract perceived characteristics from travel microblog content and user comments [71]. As a probabilistic topic modeling method, LDA addresses key limitations of traditional clustering in mining unstructured UGC data. Its ability to extract coherent latent topics and reveal semantic structures makes it particularly suited for identifying the thematic composition of perceived destination image in heritage tourism, as demonstrated in recent studies on Jeju Island and Harbin. More importantly, the interpretable topic–word distributions it produces enhance transparency and cognitive traceability [72].
In addition, a study on DI from tourists’ perception towards tropical forest parks has applied social network analysis (SNA), revealing the core-edge semantic structure of DI [73]. This research demonstrated the effectiveness of SNA in revealing semantic associations among keywords; however, high-frequency terms were manually grouped into five pre-assigned thematic categories based on semantic and contextual interpretation, rather than being derived through unsupervised clustering techniques. Recent scholarship has also examined the use of SNA-based community detection as a viable alternative to traditional topic modeling methods in textual analysis. A Twitter-based study compared LDA, SNA-based semantic networks, and clustering analysis. While all three identify core topics, LDA excels at topic granularity but may cause overlap and ambiguity, whereas SNA better reveals semantic linkages and structure, offering clearer, more concise clusters [73].
Despite research on the perception of cultural heritage still focusing on questionnaires, interviews, and other traditional forms, few research studies have used text-mining techniques for analyzing static images of CHT. In a comparative study on the formation of destination perception formed by UGC and DMO in ancient towns in China, a clustering model combined with manual classification was used for topic extraction and a destination image framework containing three dimensions “space”, “activity”, “emotion” and a total of 16 categories was obtained [74].
Moreover, a few scholars applied UGC data to analyze the temporal shifts in DI under the significant influence of major events. It has been proven that a big event can positively influence the city’s image while a crisis can negatively impact the sentiment evaluation [64,75]. Applying a mixed-methods approach combining LDA and TF-IDF, the research of Finland’s state image reveals the relevant stability of DI and shifts in the characteristics via seasonal change [76]. In addition, a mixed-methods approach combining LDA and TF-IDF has been applied for comparing the different topics and terms over time [64,76]. However, the structural semantic connections of words may be lacking. Not to mention the lack of semantic research of Macau DI over time by a single method of term frequency [64,76].
While these studies demonstrate the viability of using UGC to analyze dynamic DI, they are often confined to macro-level units such as cities or countries. In addition, the use of pre-defined attributes may limit the capacity to capture nuanced or emerging perceptions, leaving the full analytical potential of textual data underexplored, particularly in heritage-focused destination contexts.
In response, this study proposes a composite analytical framework that integrates TF-IDF, social network analysis (SNA), and Latent Dirichlet Allocation (LDA) to examine the DI of a cultural heritage site. This framework is designed to leverage the complementary strengths of the three methods—TF-IDF for identifying salient terms, SNA for revealing structural semantic connections, and LDA for extracting latent thematic patterns—thereby enhancing the interpretability, depth, and stability of the analytical results.

3. Research Design and Methods

3.1. The Destination Case

Lijiang Old Town, with its rich multi-ethnic heritage and mature tourism ecosystem, presents an exemplary case for investigating how major public events, such as COVID-19, reshape the destination image (DI) of cultural heritage destinations. The old town of Lijiang, known as Dayan, is one of China’s most renowned cultural heritage sites, and officially began its preservation efforts in the 1990s. It is the homeland of the Naxi ethnic minority and the mixed residential area of Naxi, Han, Bai, and Tibetan people. It is famous for its ancient town environment and historic architecture of mixed elements influenced by different cultures and the harmonious co-existence of different ethnic groups and philosophies [77]. The site includes the main core of Dayan old town (including Black Dragon Pond) and two housing clusters of Baisha and Shuhe (Figure 1).
Since 1993, the central government has started advocating for the development of tourism as a market-driven force [78]. In 1997, UNESCO inscribed Lijiang Old Town on the World Heritage List. The brand effect of “World Cultural Heritage” promoted the rapid development of tourism, and since it was rated as a 5A-level tourist scenic spot in China, many tourists and operators have continued to pour in. The Conservation Plan for Lijiang Ancient Town was published by the local government to support its inclusion on the World Heritage List and promote its development as a tourist destination [79]. The ancient town gradually shifted from life-oriented to tourism-oriented. Moreover, the inclusion of Naxi Dongba culture on the Intangible World Heritage List in 2001 promoted the development of the Naxi ethnic culture and the commoditization of tourism. After 2015, the land used for commercial service facilities of the ancient town has shifted from “replacing residential places with places of consumption” to “replacing places of consumption with internal ones” [80]. Thus, the ancient town entered a mature stage of tourism development and has focused on providing good tourism services and cultural experiences. Due to its multi-ethnic cultural integration and mature tourism development, the Old Town of Lijiang makes it an ideal case study for studying the impact of major public events (such as COVID-19) on the perception of cultural heritage tourism destinations, and its changes in tourists’ perception can provide reference for other similar destinations.
Due to the pandemic, the number of tourists visiting Lijiang Old Town has plummeted from 2020 to 2022, and the number of tourists gradually picks up from 2023 to 2024 after COVID-19 (Figure 2). According to the 2024 report, Lijiang remains one of the top 10 most-watched ancient city tourist destinations in China. This study conducts a comparative study on the perceived image of the cultural heritage tourism destination. Therefore, Lijiang Old Town was selected as a representative case to examine how tourists’ perceptions toward cultural heritage destinations evolve across major public events.

3.2. Research Design

This section begins by dividing the stages of dynamic research according to the epidemic and introducing the data collection and preparation in this study. To analyze the changes in destination image (DI) across the three pandemic phases, this study adopts an exploratory design that integrates multiple text-mining techniques to detect semantic shifts. Rather than testing hypotheses, the focus lies on uncovering temporal patterns DI. To ensure interpretive coherence and enhance the robustness of the findings, this study adopts a triangulated analytical strategy that integrates TF-IDF, SNA, and LDA in a mutually reinforcing framework. Specifically, high-weighted keywords identified by TF-IDF reflect the lexical prominence of perceived destination image at each stage. These keywords then construct co-occurrence networks in SNA, revealing the underlying semantic structure and relational patterns among core concepts. Finally, the results are further cross-validated through LDA, where these terms frequently align with dominant topics. This integrated strategy allows for a more coherent and multi-layered interpretation of the evolving destination image. This framework was operationalized using Python 3.12.6 for TF-IDF and LDA computations, and Gephi 0.10.1 for SNA-based network visualization.

3.3. Data Collection and Preprocessing

The user-generated data of tourists in this study is sourced mainly from China’s four popular online travel platforms, including Ctrip, Qunar, Mafengwo, and Dianping. The goal is to gather as much open data in social media as possible related to the tourism experience of Lijiang, the Old Town, as the case of a cultural heritage destination. Text reviews of Lijiang Old Town were crawled, covering the period from January 2017 to October 2024. The study begins with cleaning the UGC data by removing noise, duplicate reviews, overly short comments, and eliminating symbols and unnecessary punctuations, resulting in a dataset of 50,022 valid reviews.
Specifically, we defined the before-COVID-19 category as posts made between 1 January 2017 and 20 January 2020; the during-COVID-19 category consists of posts from 21 January 2020 to 8 January 2023, and the after-COVID-19 category consists of posts from 8 January 2023 to 10 October 2024. The date of 1 January 2017 was selected as the starting point for the pre-pandemic phase, as this year marked the onset of intensified tourism regulation and infrastructural consolidation in Lijiang Old Town [81]. The date of 20 January 2020 was selected as the dividing point, as this is the date on which the Chinese government declared COVID-19 a pandemic and started to deploy the national epidemic prevention and control work [9]. The date of 8 January 2023 was selected as the dividing point, as this is the date on which the Chinese government lifted the measures for the prevention and control of Class A infectious diseases against the new coronavirus infection, and declared that the novel coronavirus infection will no longer be included in the management of quarantine infectious diseases under the Border Health and Quarantine Law of the People’s Republic of China [82]. As shown in Table 1, there are 18,599 reviews posted before the COVID-19 pandemic (D1), 14,671 reviews posted during the COVID-19 pandemic (D2), and 16,752 reviews posted after the COVID-19 pandemic (D3).
The Jieba library is used for Chinese word tokenization, incorporating a custom-built dictionary tailored to the cultural heritage tourism theme and specific characteristics of Lijiang Old Town, ensuring accurate segmentation (e.g., avoiding the incorrect splitting of terms like “万古楼” into “万古” and “楼”). Having preprocessed the UGC data, the following section details how these analytical tools were applied to reveal temporal shifts in destination image.

3.4. Analytical Methods

3.4.1. TF-IDF

Term Frequency-Inverse Document Frequency (TF-IDF) is a statistical method utilized in text mining for analyzing the importance of words in a corpus [25]. The TF-IDF algorithm combines two components: term frequency (TF) and inverse document frequency (IDF), as presented in Formula (1). TF measures the frequency at which a word appears in a document, as shown in Formula (2). IDF measures the importance of words by decreasing the weight of frequently occurring words and increasing the weight of less common terms. The IDF for a particular word is calculated as the logarithm of the ratio between the total number of documents and the number of documents containing that word, as shown in Formula (3). n t represents the number of documents that contain the word t i , calculated by directly counting these documents. In the theoretical definition, this statistic corresponds to the set |j∶ t i d j \|. To prevent division by zero, the formula introduces 1 + n t in the denominator.
TF-IDF t , d = TF t , d   ×   IDF t
TF t , d = f t , d k f k , d
I D F   ( t ) = l o g N 1 + n t
In this study, three datasets are generated based on the step of data preprocessing. Each dataset is seen as a corpus, and each review in one corpus is seen as a separate document. The TF-IDF algorithm is employed to extract keywords for each dataset. To determine the relative importance of these keywords, they were sorted based on their weight. To maintain accuracy and avoid information overload, the number of keywords is limited, and keywords are manually cleaned to avoid nonsense words for the research. For example, the words “Lijiang” and “ancient city”, which are mentioned in almost all online reviews, are deleted to reveal the characteristics of the site. Finally, three data lists of 100 terms based on the periods separated in the previous work are generated. This is followed by the Word cloud to visualize the significance of terms [70]. In which the font size of each keyword is determined by the weights calculated using TF-IDF, and larger values correspond to larger font sizes.
This method effectively highlights the importance of terms in each dataset. Additionally, the key terms that appear in all the lists were extracted, and a shared terms list was constructed, revealing the resilience of DI core across periods. To further evaluate the internal shifts in shared terms over three stages, we calculated the coefficient of variation (CV) for shared keywords [83]. CV is defined as the ratio of the standard deviation to the mean of a keyword’s TF-IDF values across the merged datasets, expressed as a percentage. This metric quantifies the relative variability of keyword importance over time, providing insight into the consistency of key descriptors amid external disruptions.

3.4.2. Semantic Network Analysis via Social Network Analysis

While the TF-IDF lexical analysis effectively identifies prominent terms associated with DI shifts over time, it does not capture the semantic relationships among terms. To address the gap, we introduce social network analysis (SNA) to explore micro-level relationships among keywords as a complement to the TF-IDF analysis. Similarly, the LDA model, which assumes each word is assigned to a topic independently, also suffers from the limitations of its inability to account for word correlations [84]. Scikit-learn, a Python-based machine learning library for text mining, is optimized for sparse matrix operations and suitable for large-scale UGC data. We first construct a word co-occurrence matrix using Scikit-learn, where each cell denotes the frequency with which two keywords appear together in individual comments. This matrix is then converted into a network structure using Python’s NetworkX library for subsequent SNA, where nodes represent keywords, and edges, weighted by co-occurrence frequencies, indicate their semantic associations.
The semantic network was analyzed and visualized in Gephi using ForceAtlas2 layout with node sizes reflecting degree and edge thicknesses indicating co-occurrence frequencies. To focus on the core semantic structure, we applied a k-core filter with N as the maximum k value, retaining a connected core subgraph with the k-value determined through iterative testing to remove noise while preventing network collapse [85]. Meanwhile, we filtered edges based on their co-occurrence frequency to remove low-frequency associations. Later, we applied modularity analysis to detect communities from the filtered semantic networks of each stage as perceived clusters of DI’s attributes and validated them with clustering coefficients to ensure reliable interpretation in Gephi [86].
For network visualization, we retained only the larger clusters from the modularity classification to highlight the core semantic network, excluding smaller clusters that often represent niche themes to recognize the core clusters as the domain feature and compare them to uncover the shifts in the domain features and their internal terms across before the pandemic (D1), during-the pandemic (D2), and after the pandemic (D3) stages.
To compare the similar clusters, we ranked the top 5 weighted edges that reflect the internal semantic structure, and the top 5 nodes by degree centrality, representing attributes with prominent structural roles. These nodes were further analyzed for their potential as bridges across communities (via betweenness centrality) and cognitive hubs (via closeness centrality). Betweenness and Closeness Centrality are normalized to [0, 1] for cross-stage comparability.

3.4.3. LDA Analysis

This study applies Latent Dirichlet Allocation (LDA) to tourist reviews to uncover latent cognitive dimensions of destination image (DI) in Lijiang Ancient Town. LDA models were separately trained on three pre-processed datasets corresponding to different periods. Distinct from conventional approaches relying solely on bag-of-words frequency-based inputs, our LDA modeling was built upon term-weighted TF-IDF vectors to mitigate the dominance of high-frequency yet semantically light terms. It was built on our earlier TF-IDF analysis for methodological consistency. Optimal topic numbers were determined by calculating perplexity and coherence [64], with coherence being prioritized due to its stronger correlation with human interpretability.
To capture the temporal evolution of DI topic incorporated time as a dimension, aligning topics across temporal stages introduces additional complexity due to potential semantic drift and topic evolution, since most studies manually assign topic labels of static analyses [64]. On the one hand, Jensen–Shannon (JS) divergence was introduced to measure the semantic similarity between topics in this study [87], to reduce the subjectivity in the process of intertemporal topic alignment, Specifically, we computed pairwise JS divergence between topic–word distributions from each stage and used this as the basis for topic matching. Instead of mechanically applying a fixed threshold, we analyzed the distributional patterns of JS divergence and incorporated manual inspection of keyword clusters to improve cross-period semantic consistency. On the other hand, the topics of each period were manually inspected based on the top keywords associated with each topic, following established practices [64,88]. While topic names were simplified in the main text for clarity, full keyword lists are provided in Appendix A to enhance transparency and support interpretability.
Based on similarities, a Sankey diagram was used to visualize topic evolution across the three stages [89]. We further introduced topic attention and topic strength metrics to facilitate the visualization and interpretation of topic evolution across different periods, as well as changes in tourists’ perceptions of the destination image. Topic attention, as applied in topic modeling studies, is the proportion of reviews (Table 1) containing a specific topic in a given period, reflecting tourists’ focus on that topic [89]. This metric determines the node height in the Sankey diagram. Drawing on Wang et al. [90], topic strength is defined as the total probability mass of a topic in the corpus, indicating its dominance in the discourse. This metric is inversely correlated with the transparency of connecting lines in the Sankey diagram, where higher topic strength results in less transparent lines.

4. Results

4.1. TF-IDF Results

The TF-IDF algorithm was used to extract the top 100 keywords from the online review dataset of tourists in the three periods from D1 to D3, forming the keyword datasets of each stage (excluding the high-frequency but directly related to the research subject “Lijiang” and “Ancient City”). To enhance interpretability, we filtered the word list by part of speech, retaining nouns, verbs, adjectives, and adverbs. Adjectives and adverbs were preserved as they potentially reflect affective evaluations, while nouns tend to represent cognitive or descriptive attributes. This approach allows for a more structured interpretation of both descriptive and emotionally expressive content. As shown in Figure 3, Word Clouds were applied to visualize the tourists’ perceived overall DI of each period, where the font size of each term is proportional to its TF-IDF weight, reflecting its relative importance within the corpus of online reviews.
“Dali” and “Yunnan” consistently appear across three stages, reflecting the regional location and indicating the shared characteristics of the two destinations of Dali and Lijiang through the association of tourists. Terms like “history”, “culture”, “architecture”, “Mu family mansion”, “Sifang street”, and “Dayan” primarily underscore the rich cultural heritage and historical attractions. Terms like “park”, “scenery”, “Yulong Snow Mountain”, and “Lion Hill” illustrate the importance of natural landscapes in shaping visitors’ perceptions of the destination. Meanwhile, “good”, “worth”, “recommend”, “beautiful”, and “visually appealing” (The Chinese word “visually appealing” (好看) is roughly translated to mean “aesthetic qualities” in tourist language. However, its precise meaning needs to be confirmed through further LDA topic modeling and semantic role labeling to separate contextual details (for example, photogenic suitability vs. performance evaluation)) highlight visitors’ positive sentiments and personal impressions, emphasizing the emotional resonance of the destination. Additionally, terms “business”, “commercialization”, “free of charge”, “tickets”, and “guide” are associated with tourism services and commercial dynamics, and involve tourism services and business operational factors shaping visitors’ experiences.
The TF-IDF results reveal a coexistence of stability and variability in the perceived destination image (DI) across the three stages. Across the three phases, the top 100 keywords of each stage yielded a combined set of 130 unique terms. Of these, 69 (53%) persisted across all three periods, indicating a relatively stable layer of perceived DI (Figure 4). High-weighted terms such as “Mu family mansion”, “Sifang street”, “history”, and “architecture” maintain consistent prominence, while the consistent presence of “Naxi minority” reflects the enduring cognitive recognition of cultural heritage.
While over half of the terms remain across the three phases, their TF-IDF weights show temporal fluctuations (Figure 4), indicating and the dynamics of non-shared terms further reveal temporal shifts in tourists’ perception focus.
(1)
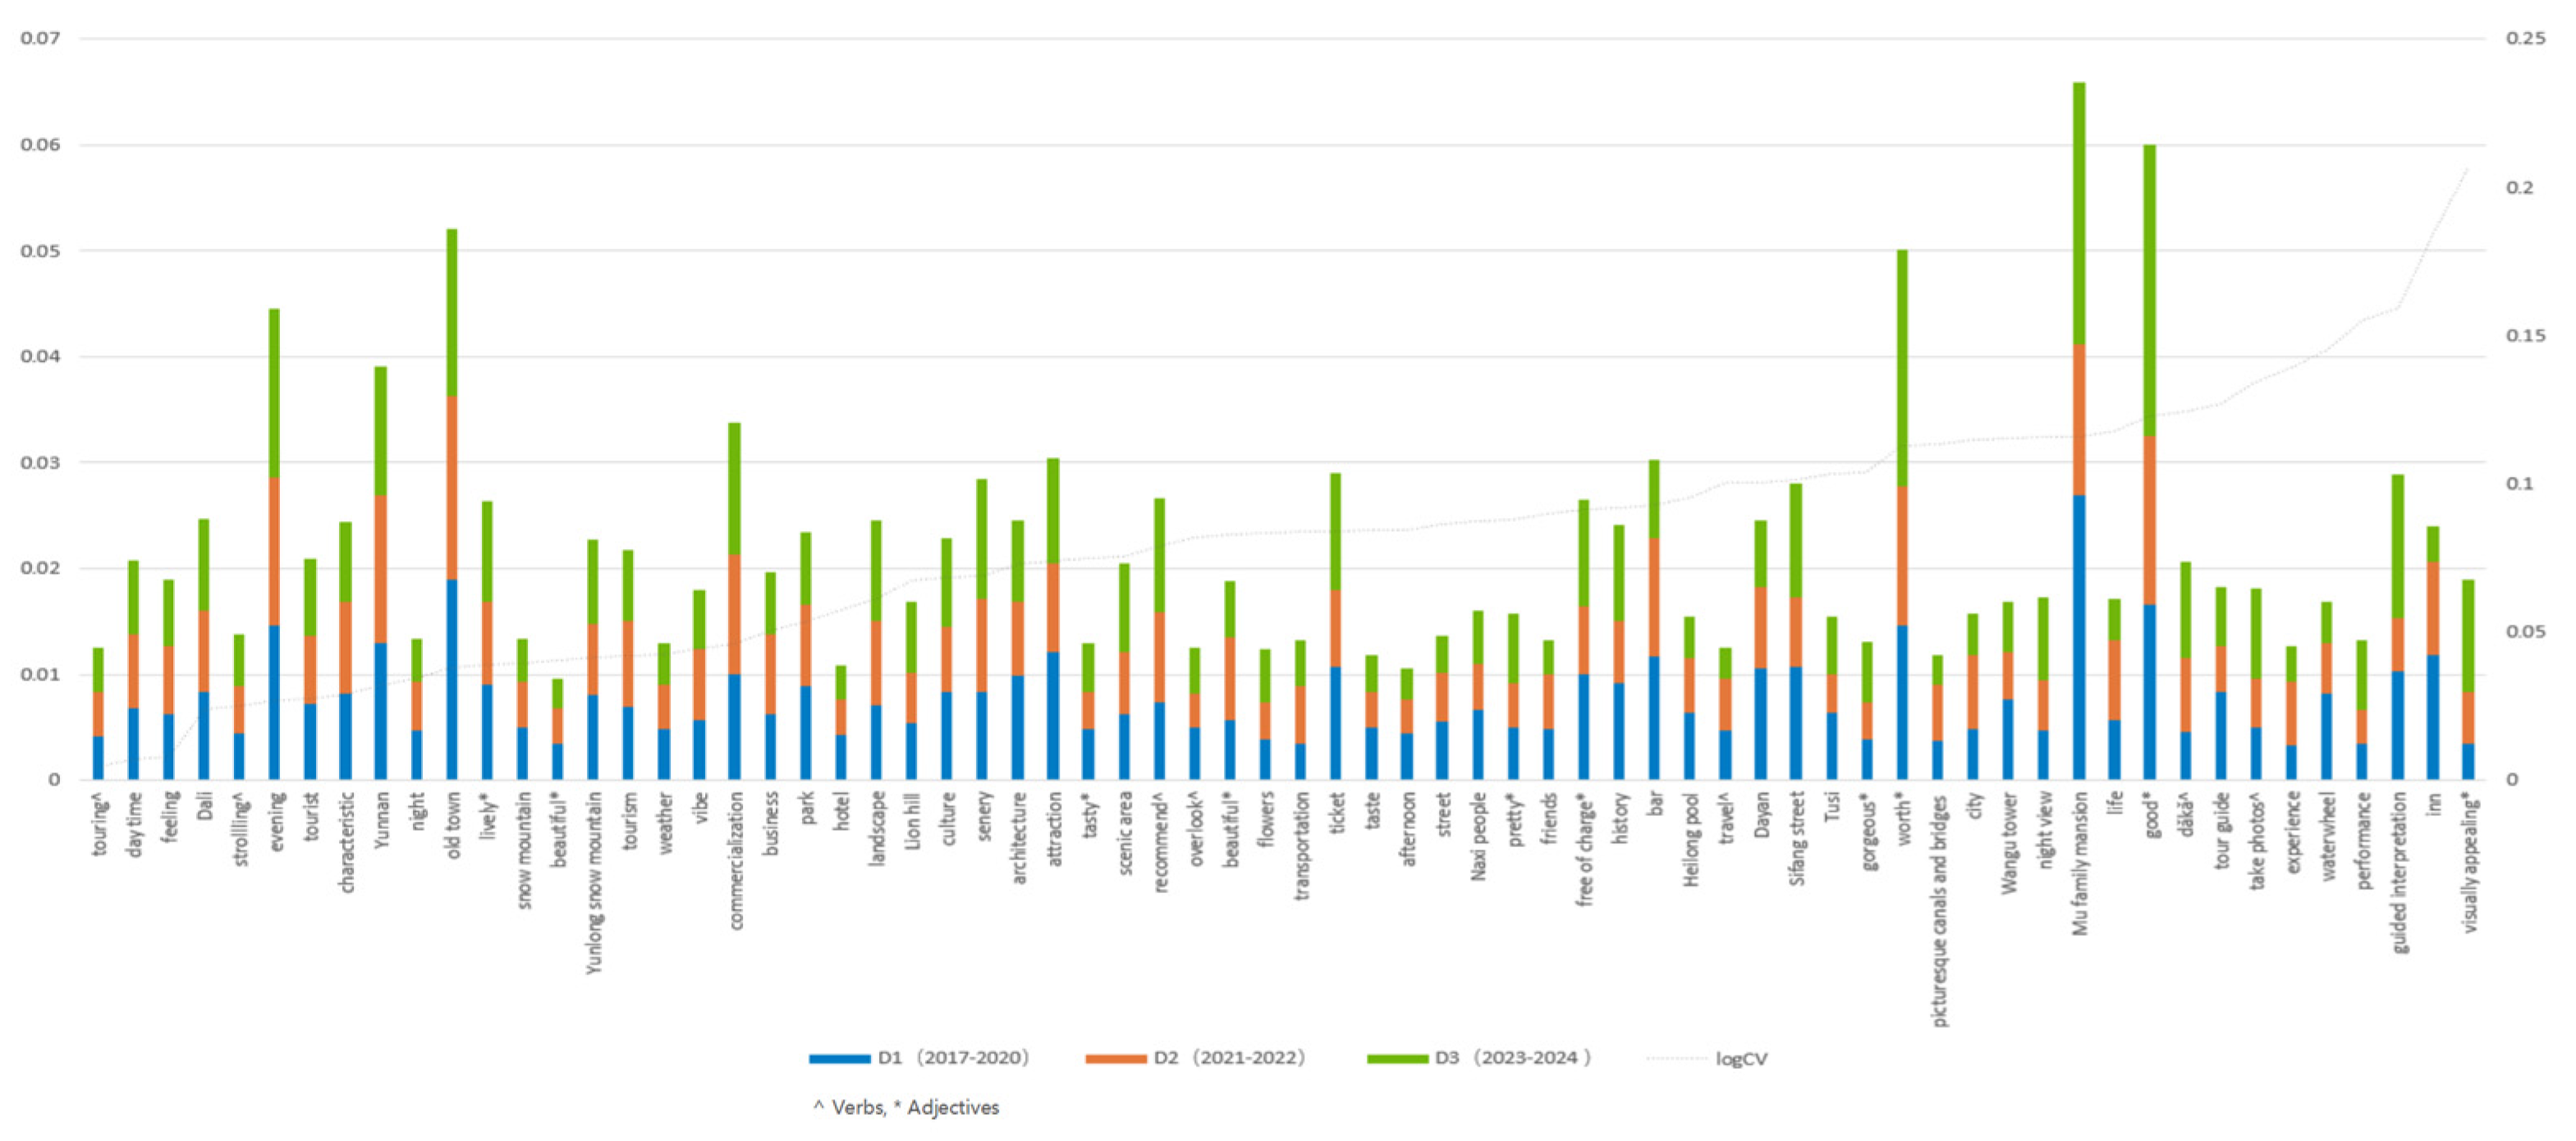
Representational landmarks, “waterwheels” and natural attractions, “Heilong Pool” and “Lion Hill” declined during (D2) and after the pandemic period (D3).
(2)
Cultural tourism service-related terms “guided tours” and “guided interpretation” experience a temporary decline in D2, followed by a rapid rebound after the pandemic (Figure 4). Meanwhile, “interpreter” and “antique charm” are no longer among the core perceptual keywords in D2, indicating a notable decrease in salience. These shifts reflect an adjustment in tourists’ preferences for service contact under pandemic conditions.
(3)
Accommodation-related terms also diverged: the term “inn” continued to decline from D1 to D3, contrasting with “hotel”, with less fluctuation, pointing to the shift in accommodation intentions from localized to standardized due to the pandemic.
(4)
In contrast, while most terms declined in D2, “life”, “feeling”, “picturesque canals and bridges”, and “city” rose (Figure 4). Emotion-laden terms like “relax”, “comfort”, “sunshine”, “tranquility”, and “slow pace” gained prominence during and after the pandemic, suggesting heightened emphasis on comfort-oriented experiences.
(5)
In D3, “dǎkǎ” (social media check-ins) and “take photos”, along with “visually appealing”, notably surge. Their lexical presence may suggest an increasing attention to visual expression. In contrast, culturally embedded everyday terms like “quiet” and “local snack” were no longer considered core perceptual content, reflecting a decline in their perceived relevance.

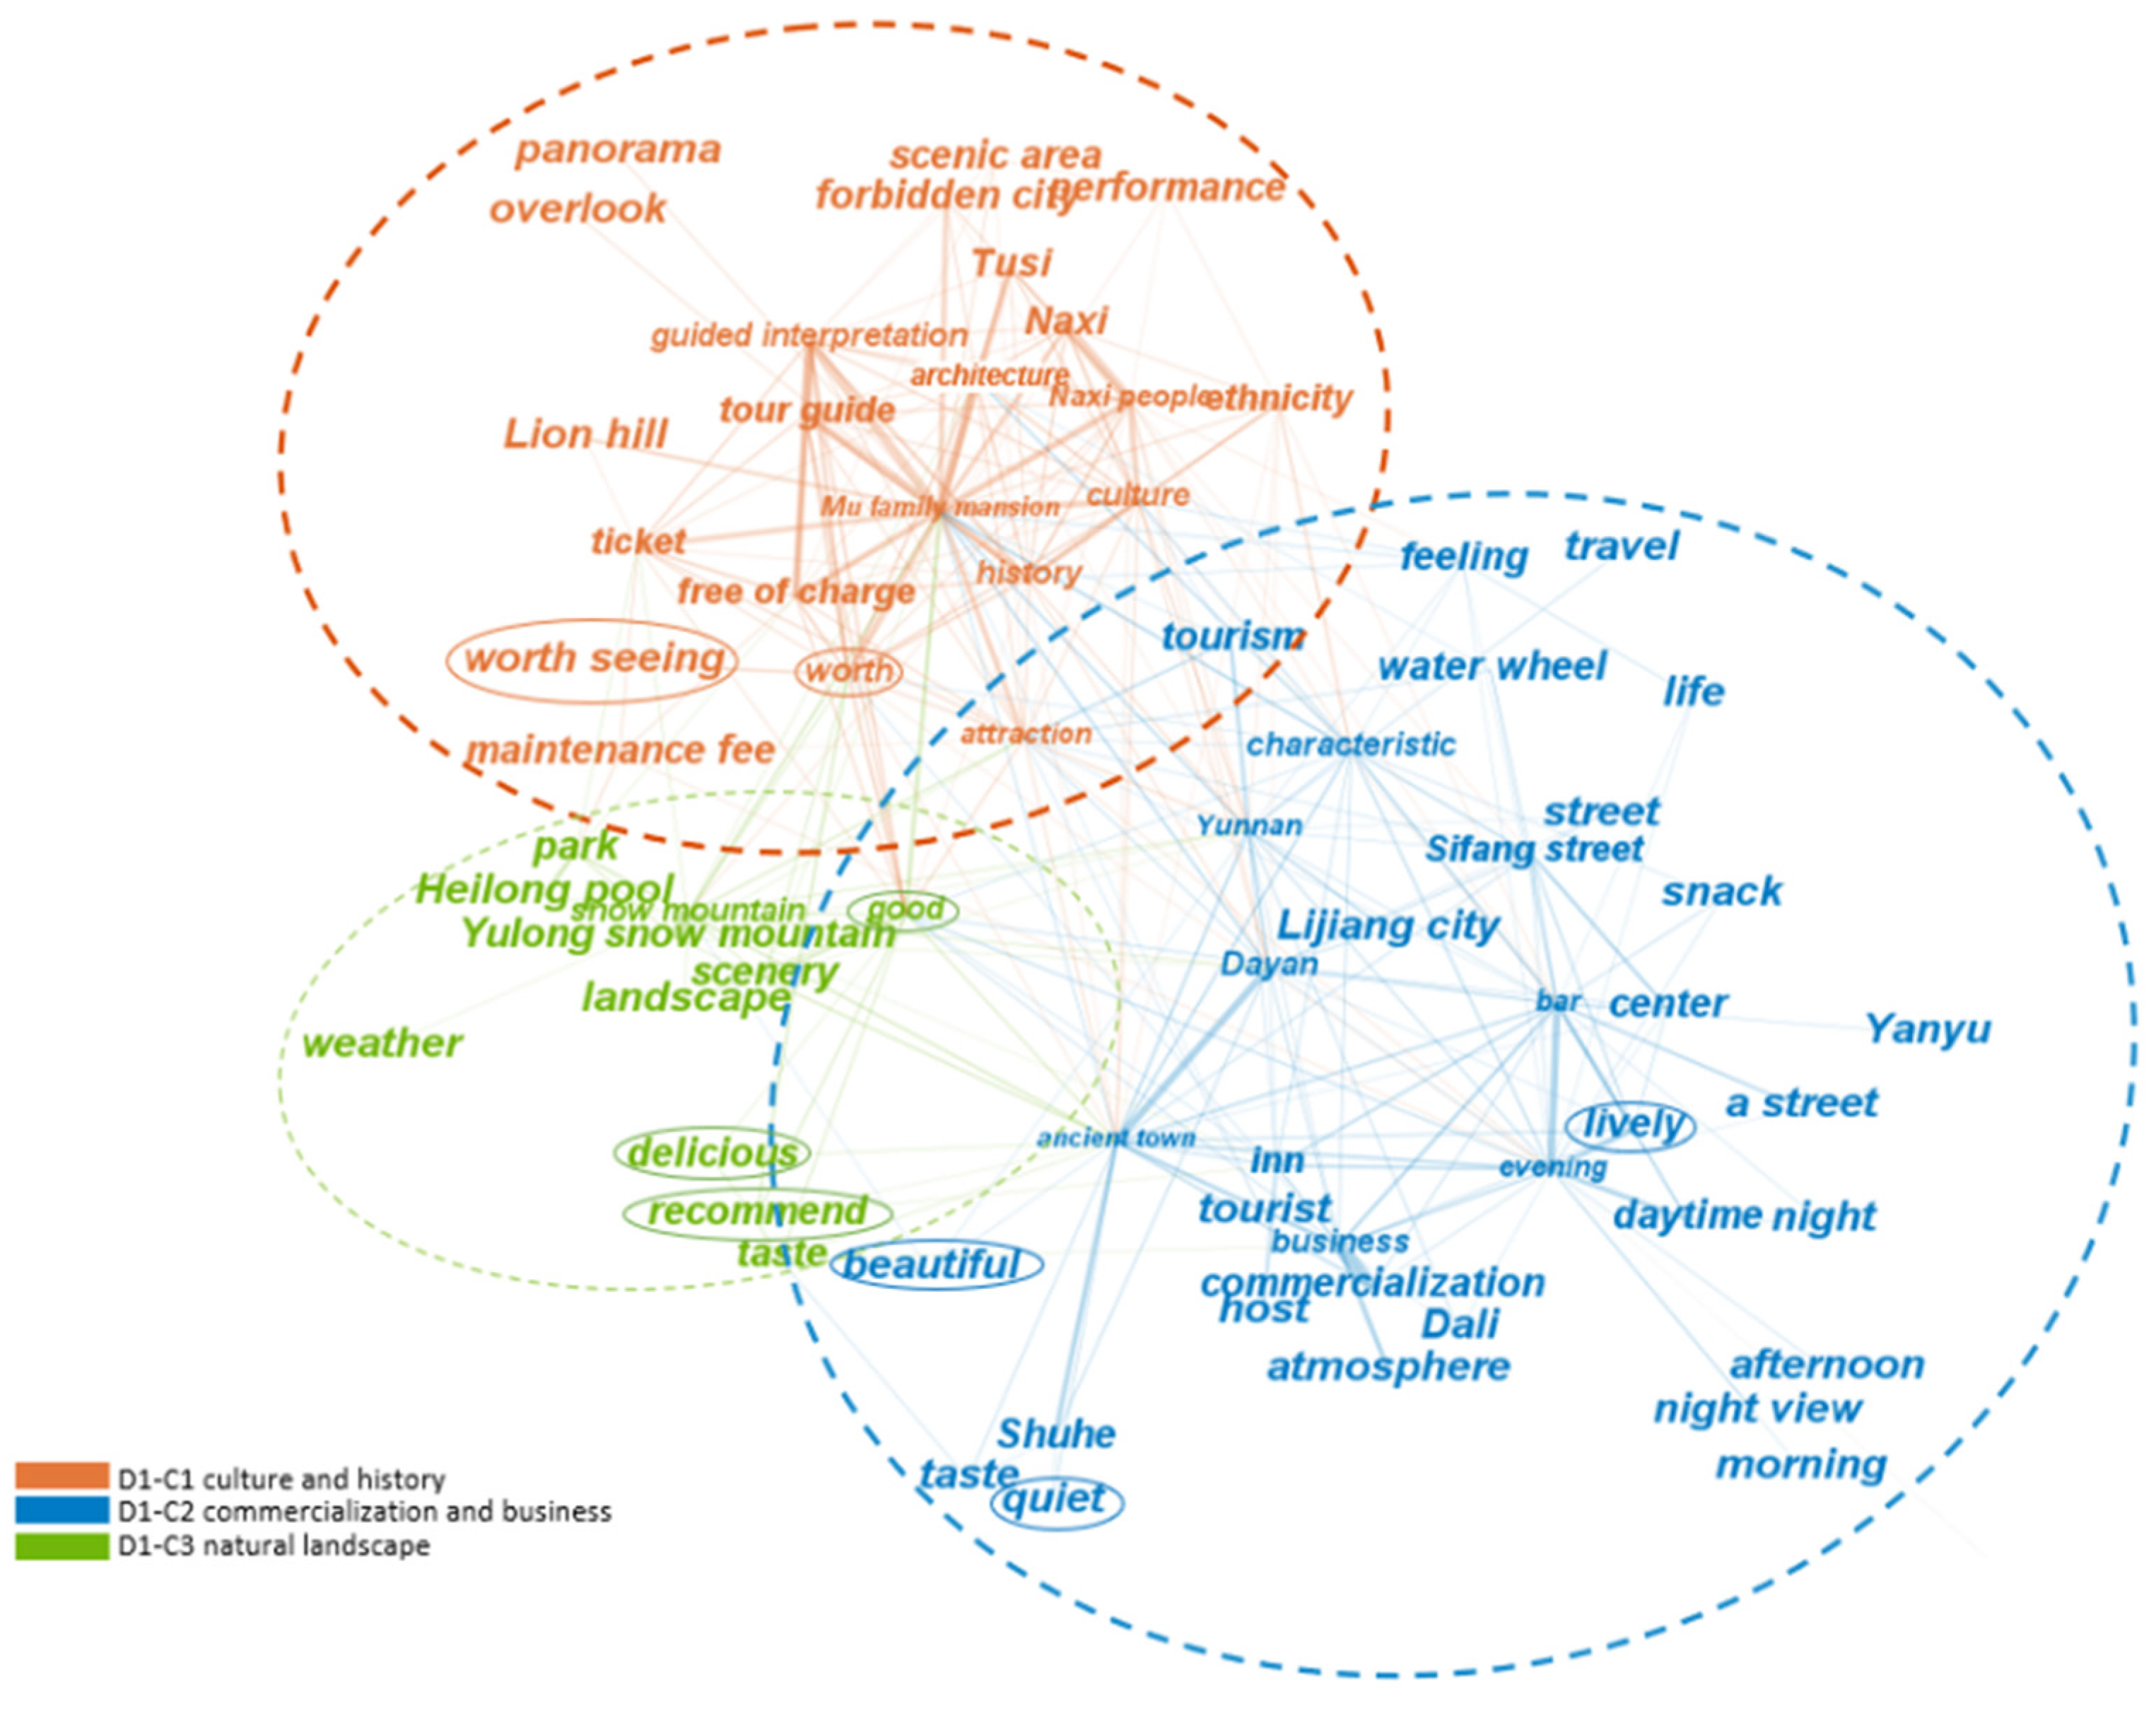
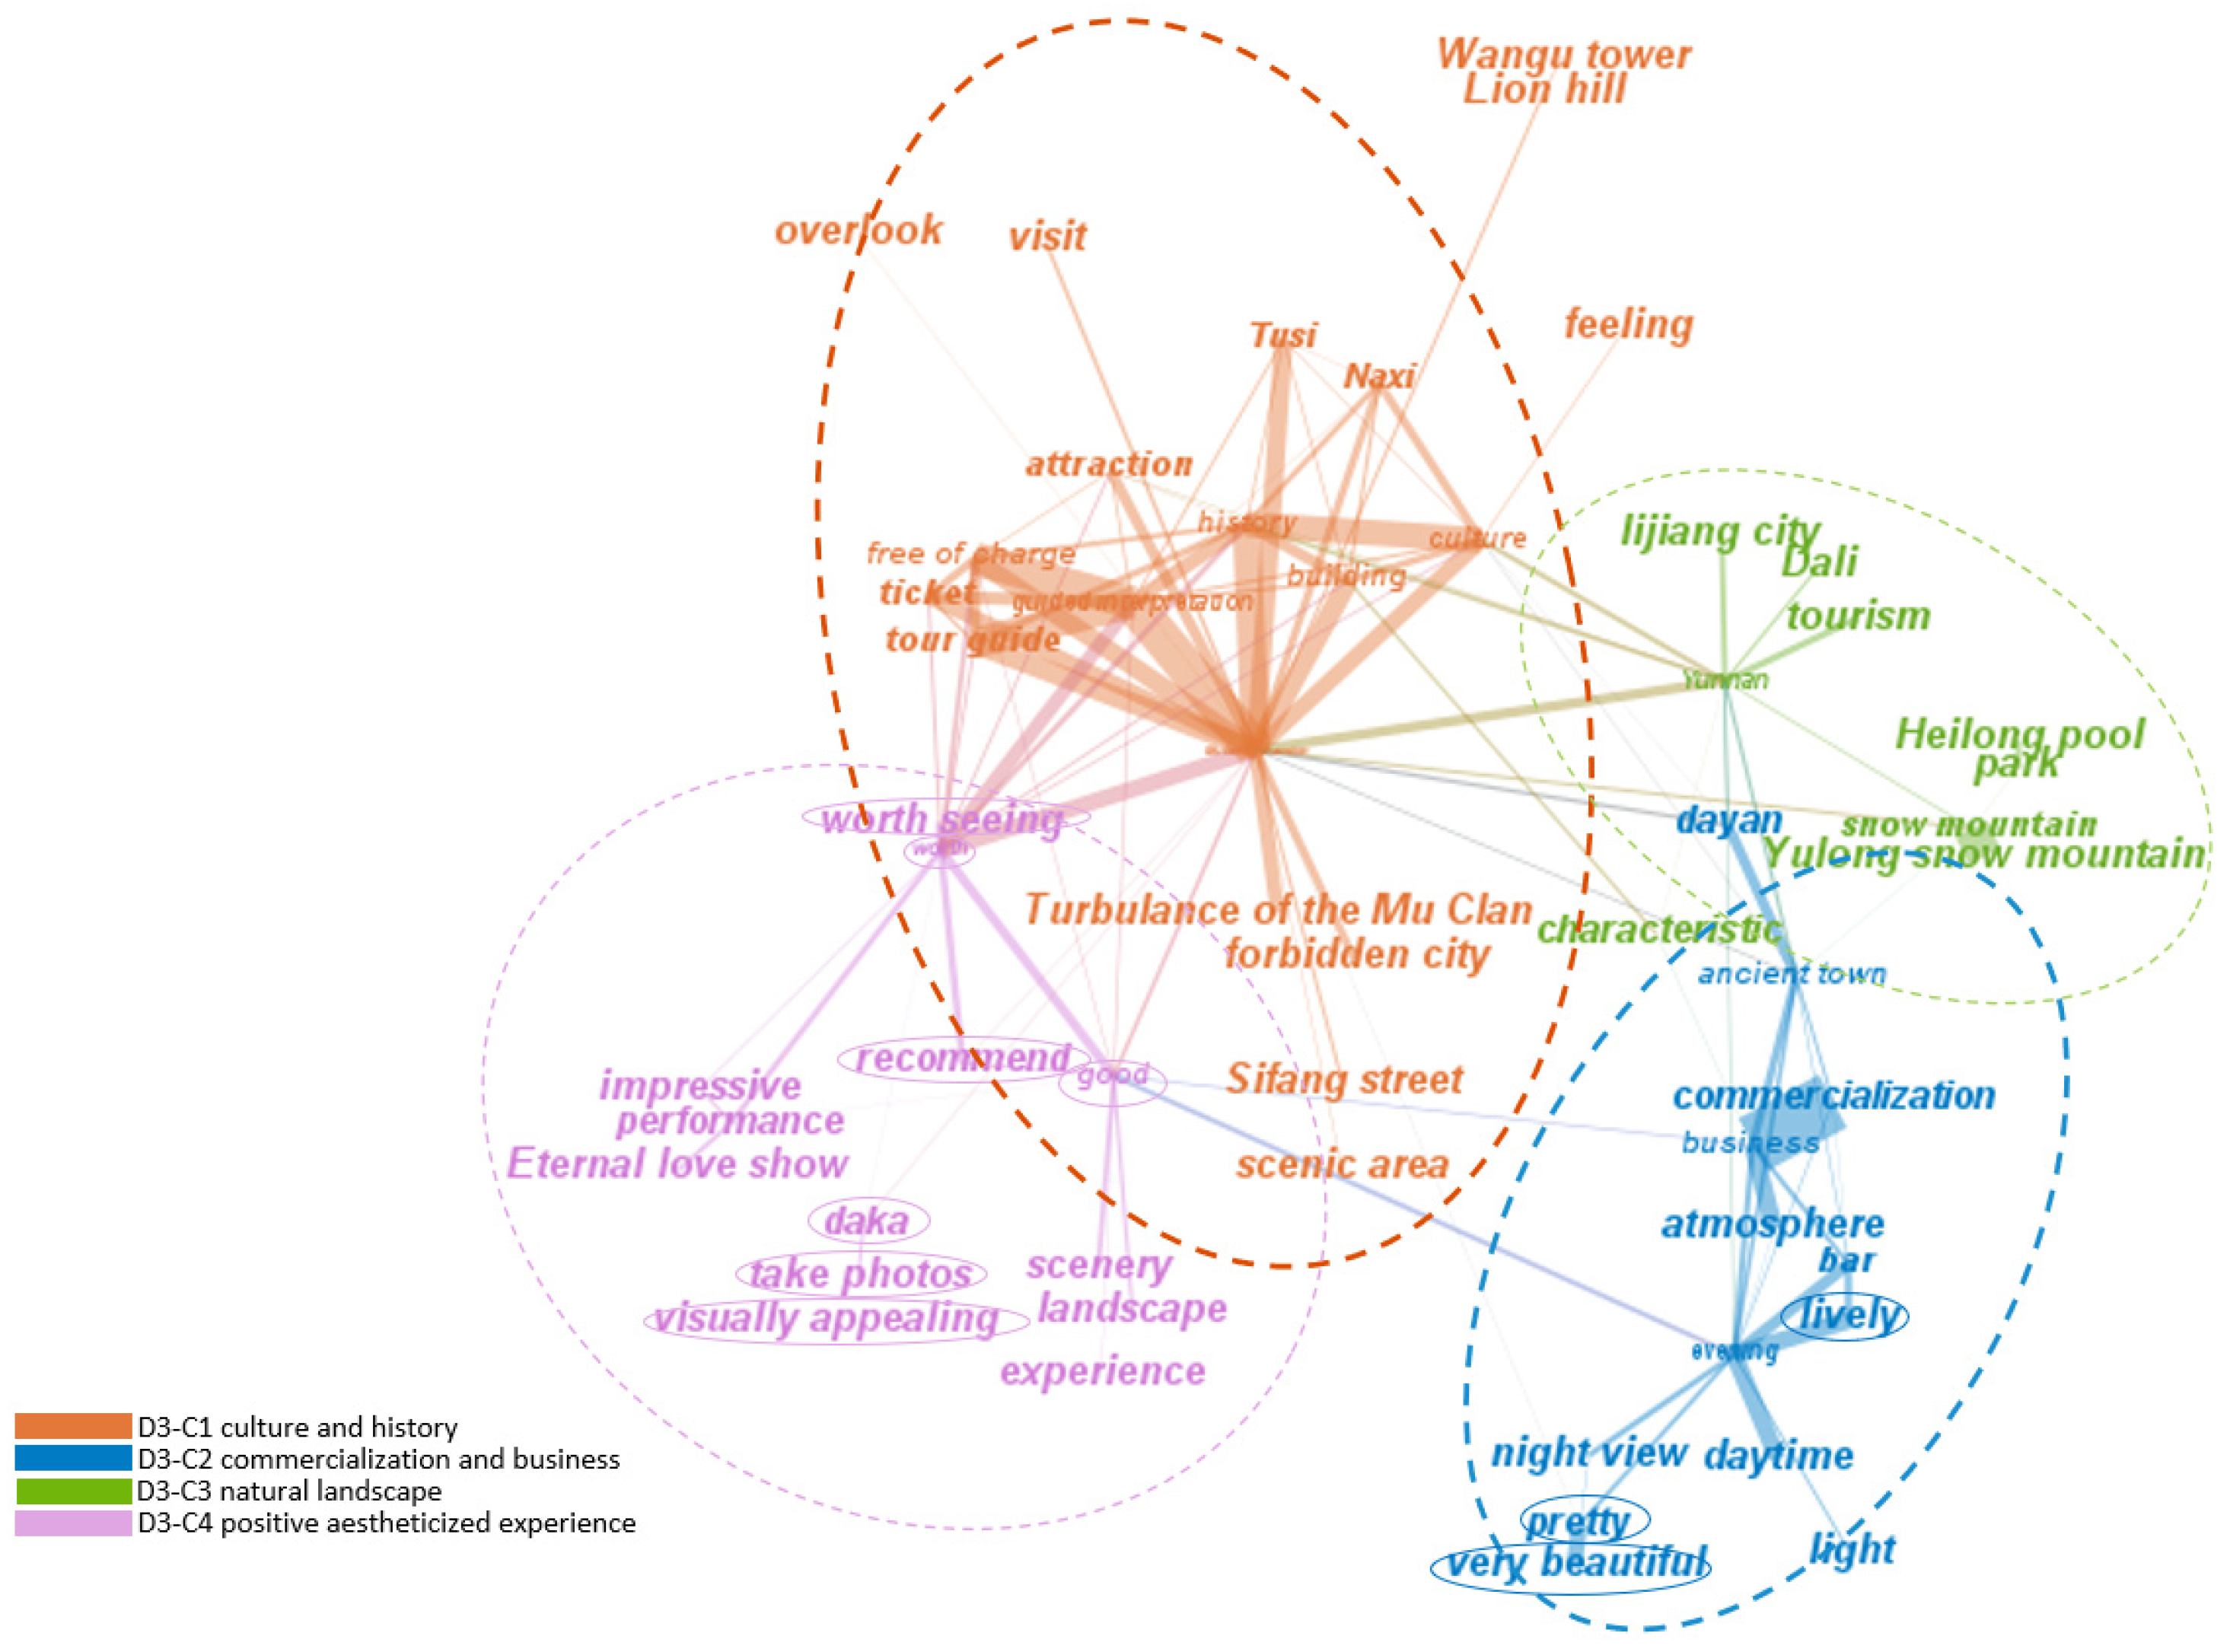
4.2. Semantic Network Analysis Results

The semantic networks were constructed after k-core clustering, and only co-occurrence relationships with edge weights above 200 were visualized to emphasize structural clarity. With the application of modularity calculation, the community distributions were obtained. As shown in Figure 5, Figure 6 and Figure 7, the network identifies four communities in D1, increasing to six in D2 and five in D3, with names manually named by identifying similar communities across stages. This uncovers the perceived structure of DI change across periods.
The modularity scores identify perceived clusters of DI attributes in the semantic network, reflecting perceived associations among attributes [51], and the clusters are supplemented by Beerli and Martín’s attribute classification [17]. Scores of all three phases exceed 0.3 (D1: Modularity = 0.336, D2: Modularity = 0.349, D3: Modularity = 0.523), indicating a relatively clear and continuously strengthening perceived structure. A decreasing clustering coefficient from 0.442 in D1 to 0.189 in D3 suggests a gradual reduction in connectivity density, with D3 nodes increasingly relying on a few larger clusters for indirect connections (Figure 5, Figure 6 and Figure 7), supporting the shift in perceived structure.
As shown in Figure 5, Figure 6 and Figure 7, “Culture and History”, “Commercialization and Business” and “Natural Landscape” emerge as the continued clusters across all stages. “Culture and History” mainly encompasses cultural and historical dimensions, including heritage attributes (“Mu family mansion”). “Commercialization and Business” with the tourist infrastructure attributes (e.g., “bar”, “evening”) centered on the commercialization attitude of tourists, tightly linked to local businesses, reflecting the commercial tension of DI. And “Natural landscape” identifies the natural resource dimension.
The node proportion of each is used as a proxy. “Culture and History” (D1: 34.09%, D3: 18.75%) and “Commercialization and Business” (D1: 23.86%, D3: 18.95%) were identified as the dominant in D1 and D3 phase networks (Figure 5 and Figure 7). “Culture and History” (D2: 10.11%) and “Commercialization and Business” (D2: 3.37%) are notably reduced in D2 (Figure 6). However, in D2, “Natural landscape” expands, and “Nightlife experience and ambiance” (both: 20.22%) stand out.
In addition to the core communities, both D2 and D3 revealed the emergence of distinct modular clusters (Figure 6 and Figure 7). In D2, the “Leisure Experience” and “Visiting Experience” communities reflected atmospheric and recreational engagement with the natural environment (e.g., “laid back”, “sunlight”, “scenery”), signaling a pandemic-induced perceptual shift. In D3, a new semantic community labeled “Positive Aesthetic Experience” emerged, centered around emotionally evaluative terms (e.g., “worth”, “worth seeing”, “good”) and visually expressive terms (e.g., “visually appealing”, “take photos”). This cluster is structurally linked to the “Culture and History” group via bridging nodes such as “worth” and “worth seeing.” Notably, it contains three internally coherent subgroups: (1) performative scenes, (2) visual-participatory behavior, and (3) scenic evaluation. The clustering pattern suggests an evolving attentional emphasis on affectively and aesthetically coded elements of the destination experience.

4.2.1. Evolution of the “Culture and History”

As shown in Table 2, “Mu family mansion” (Betweenness = 0.0831, Closeness = 0.5750) anchors a network with strong ethnic-cultural connections (“history”, “culture”, “Naxi”), evidenced by the high-weight edges like “Naxi—Naxi people” (weight = 1484) in D1. The free guide service is also an important attribute in the cluster, visible near the center of clustering with “tour guide”, “guided interpretation”, and “free of charge” nodes in Figure 6. Notably, “good and “worth” connect mainly to the guide service and cultural theme, reflecting tourists’ positive affection focused on free guide service and appreciation of heritage architecture (good-guided interpretation: 446, worth-history: 444, worth-architecture: 438, worth-free of charge: 426).
In D2, “Mu family mansion” (Betweenness = 0.0415, Closeness = 0.4839) retains centrality but reduced influence. As the guided interpretation cluster dissolved, the community contracted (Figure 6). Shifting to the architecture-culture centered cluster as evidenced by edges “culture-history” (weight = 594), “culture-Naxi people” (weight = 524), and “Mu family mansion-architecture” (weight = 472) (Table 2).
In D3, “Mu family mansion” (Betweenness = 0.1671, Closeness = 0.6067) regained prominence, and the guided interpretation cluster re-emerged (Figure 6). Evidenced by edges “Mu family mansion—guided interpretation” (weight = 1160) and “guided interpretation—free of charge” (weight = 1018) (Table 2).
The cultural aspect of Lijiang Old Town’s destination image (DI) is illuminated by social network analysis (SNA) through the Culture and History Community across three distinct stages, mainly encompassing heritage attributes (“Mu family mansion”) with associated service (“tour guide”, “guided interpretation”) and economic dimensions (“ticket”, “free of charge”) (Figure 4 and Figure 6). In D1, ethnic-cultural cognition was anchored by “Mu family mansion” (Closeness 0.5750), with “Naxi-Naxi people” (edge weight 1484) linking free guide services and heritage architecture. In D2, the network was markedly contracted, pivoting to historical-architectural clusters (“culture-history”, edge weight 594; Closeness 0.4839) as guide services vanished. By D3, “guided interpretation” (edge weight 1160) regains centrality. Architecture consistently bridged cultural attributes, while free guide services significantly shaped cultural attributes in D2 and D3. Yet Naxi culture, as the cornerstone of Lijiang’s UNESCO World Heritage designation, was notably diminished post-pandemic, meriting further investigation given its significance.

4.2.2. Evolution of the “Commercialization and Business”

As shown in Table 3, the Commercialization and Business Community in D1 shows a cohesive nightlife-driven structure, with “evening” leading with Betweenness (0.1273) and Closeness (0.5750, Degree = 25), bridging “bar” and “business” via “bar-lively” (660) and spreading nightlife semantics efficiently. “Characteristic” (Betweenness = 0.0120, Closeness = 0.5433) and “inn” (Betweenness = 0.0235, Closeness = 0.5074) played minor roles, while “Sifang street-center” (520) tied commercial landmarks, reflecting a tight network (Closeness = 0.5074–0.5750).
In D2, the community contracted, with only “commercialization-business” (2022) and “business-atmosphere” (886) remaining, with “commercialization” (Betweenness = 0, Closeness = 0.4412, Degree = 5) and “atmosphere” (Betweenness = 0, Closeness = 0.4317, Degree = 4) isolated in the core network (Betweenness = 0–0.0048, Closeness = 0.4317–0.5128). Interestingly, previous nightlife-driven commercial attributes around “evening” and “bar” shift to the Nightlife and Ambiance Community, alongside “picturesque canals and bridges” and “stroll”. Thus, the two communities are both recognized as the Commercial aspect of perceived DI in D2.
In D3, the nightlife groups are re-included in the “commercialization and business” community, and “commercialization-business” resumes its central position within the internal semantic structure. Notably, “pretty” (Betweenness = 0.0209, Closeness = 0.4320) and the “evening-very beautiful” reflect new positive aesthetic affection of tourists in the community after the pandemic.
SNA elucidates the evolution of the core commercial aspect of Lijiang Ancient Town’s destination image (DI) through the Commercialization and Business Community across three stages. In D1, vibrant bar-and-inns cognition formed cohesive clusters of attributes, with “evening” (Closeness 0.5750) and Sifang Street (edge weight 520) linking “bar-lively” (660). In D2, the network fragmented into static commercialization-atmosphere clusters (“commercialization-business”, edge weight 2022; Closeness 0.4412) and experiential nightlife clusters (“evening”, “stroll”) in the Nightlife and Ambiance Community, collectively forming the core commercial aspect. In D3, condensed evening-business clusters reintegrated nightlife and commercialization, with “pretty” (Closeness 0.4320) indicating aesthetic affect but limited integration. Notably, the persistent “commercialization-business-atmosphere” core, declining bar-and-inns cognition, and shift from Sifang Street to broader old town/Yunnan references underscore Lijiang’s adaptive commercial vibrancy amid crisis and recovery.

4.3. LDA Analysis Results

LDA topic modeling was used to extract the topics of each stage and further model the evolution of the recognitional destination image themes. To identify the number of topics in each stage, we set a range of 2 to 12 topics to calculate the Perplexity and Coherence of the three datasets of online reviews. According to the results of Coherence (Figure 8), the distribution of topics in the datasets of collective comments from the period before COVID-19 (D1) is better with eight topics, and during COVID-19 (D2) is better with nine. As for the dataset of collective comments of the post-pandemic period (D3), the distribution of topics is better with seven topics.

4.3.1. Dominant Topics of Each Period

Jensen–Shannon (JS) was calculated to identify the similarities of topics across stages, with JS < 0.4 considered a similar topic. Topic naming was manually conducted based on salient keywords identified through pyLDAvis visualizations to enhance semantic clarity and coherence [89]. As shown in Table 4, the four most prominent topics of each period were highlighted based on attention scores and topic strength metrics of each stage. Notably, attention scores were standardized as proportions (Attention Proportion = Attention Score/Total Reviews × 100%) to enable comparison across periods and then listed in Table 4.
Before the pandemic (D1), “Local Slow-Paced Lifestyle Experience” led with notable prominence (25.52%) followed by “Commercial Streets and Bar Culture” (16.12%), “Related Regional Tourism Routes” (15.65%), and “Mu Family Mansion History and Guided Tour” (11.25%). This reflects tourists’ perceptions centered on leisurely experiences via visiting, with cultural and natural heritage as complementary elements, establishing Lijiang as a regional tourism destination. Amid the pandemic (D2), the “Local Slow-Paced Lifestyle Experience” continued to dominate (27.59%), trailed by “Visual Experience and Services” (16.01%), “Related Regional Tourism Routes” (13.07%), and “Cultural and Natural Heritage” (9.20%) (Table 4). This forms a balanced perception blending leisure and cultural-natural tourism, with growing emphasis on service quality. D2’s destination image struck a balance between leisure tourism and cultural-natural tourism, with greater attention to services and management, maintaining Lijiang’s position. After the pandemic (D3), the leading topic shifted to “Scenic Viewpoints and Visitor Recommendations” (28.33%), followed by “Mu Family Mansion History and Guided Tour” (19.66%), “Cultural Performance and Scene-Based Tourism Experience” (13.35%), and “Contested Access and Management Response” (12.74%). D3’s destination image showed a transition toward cultural heritage and experiences, with management issues receiving more attention.

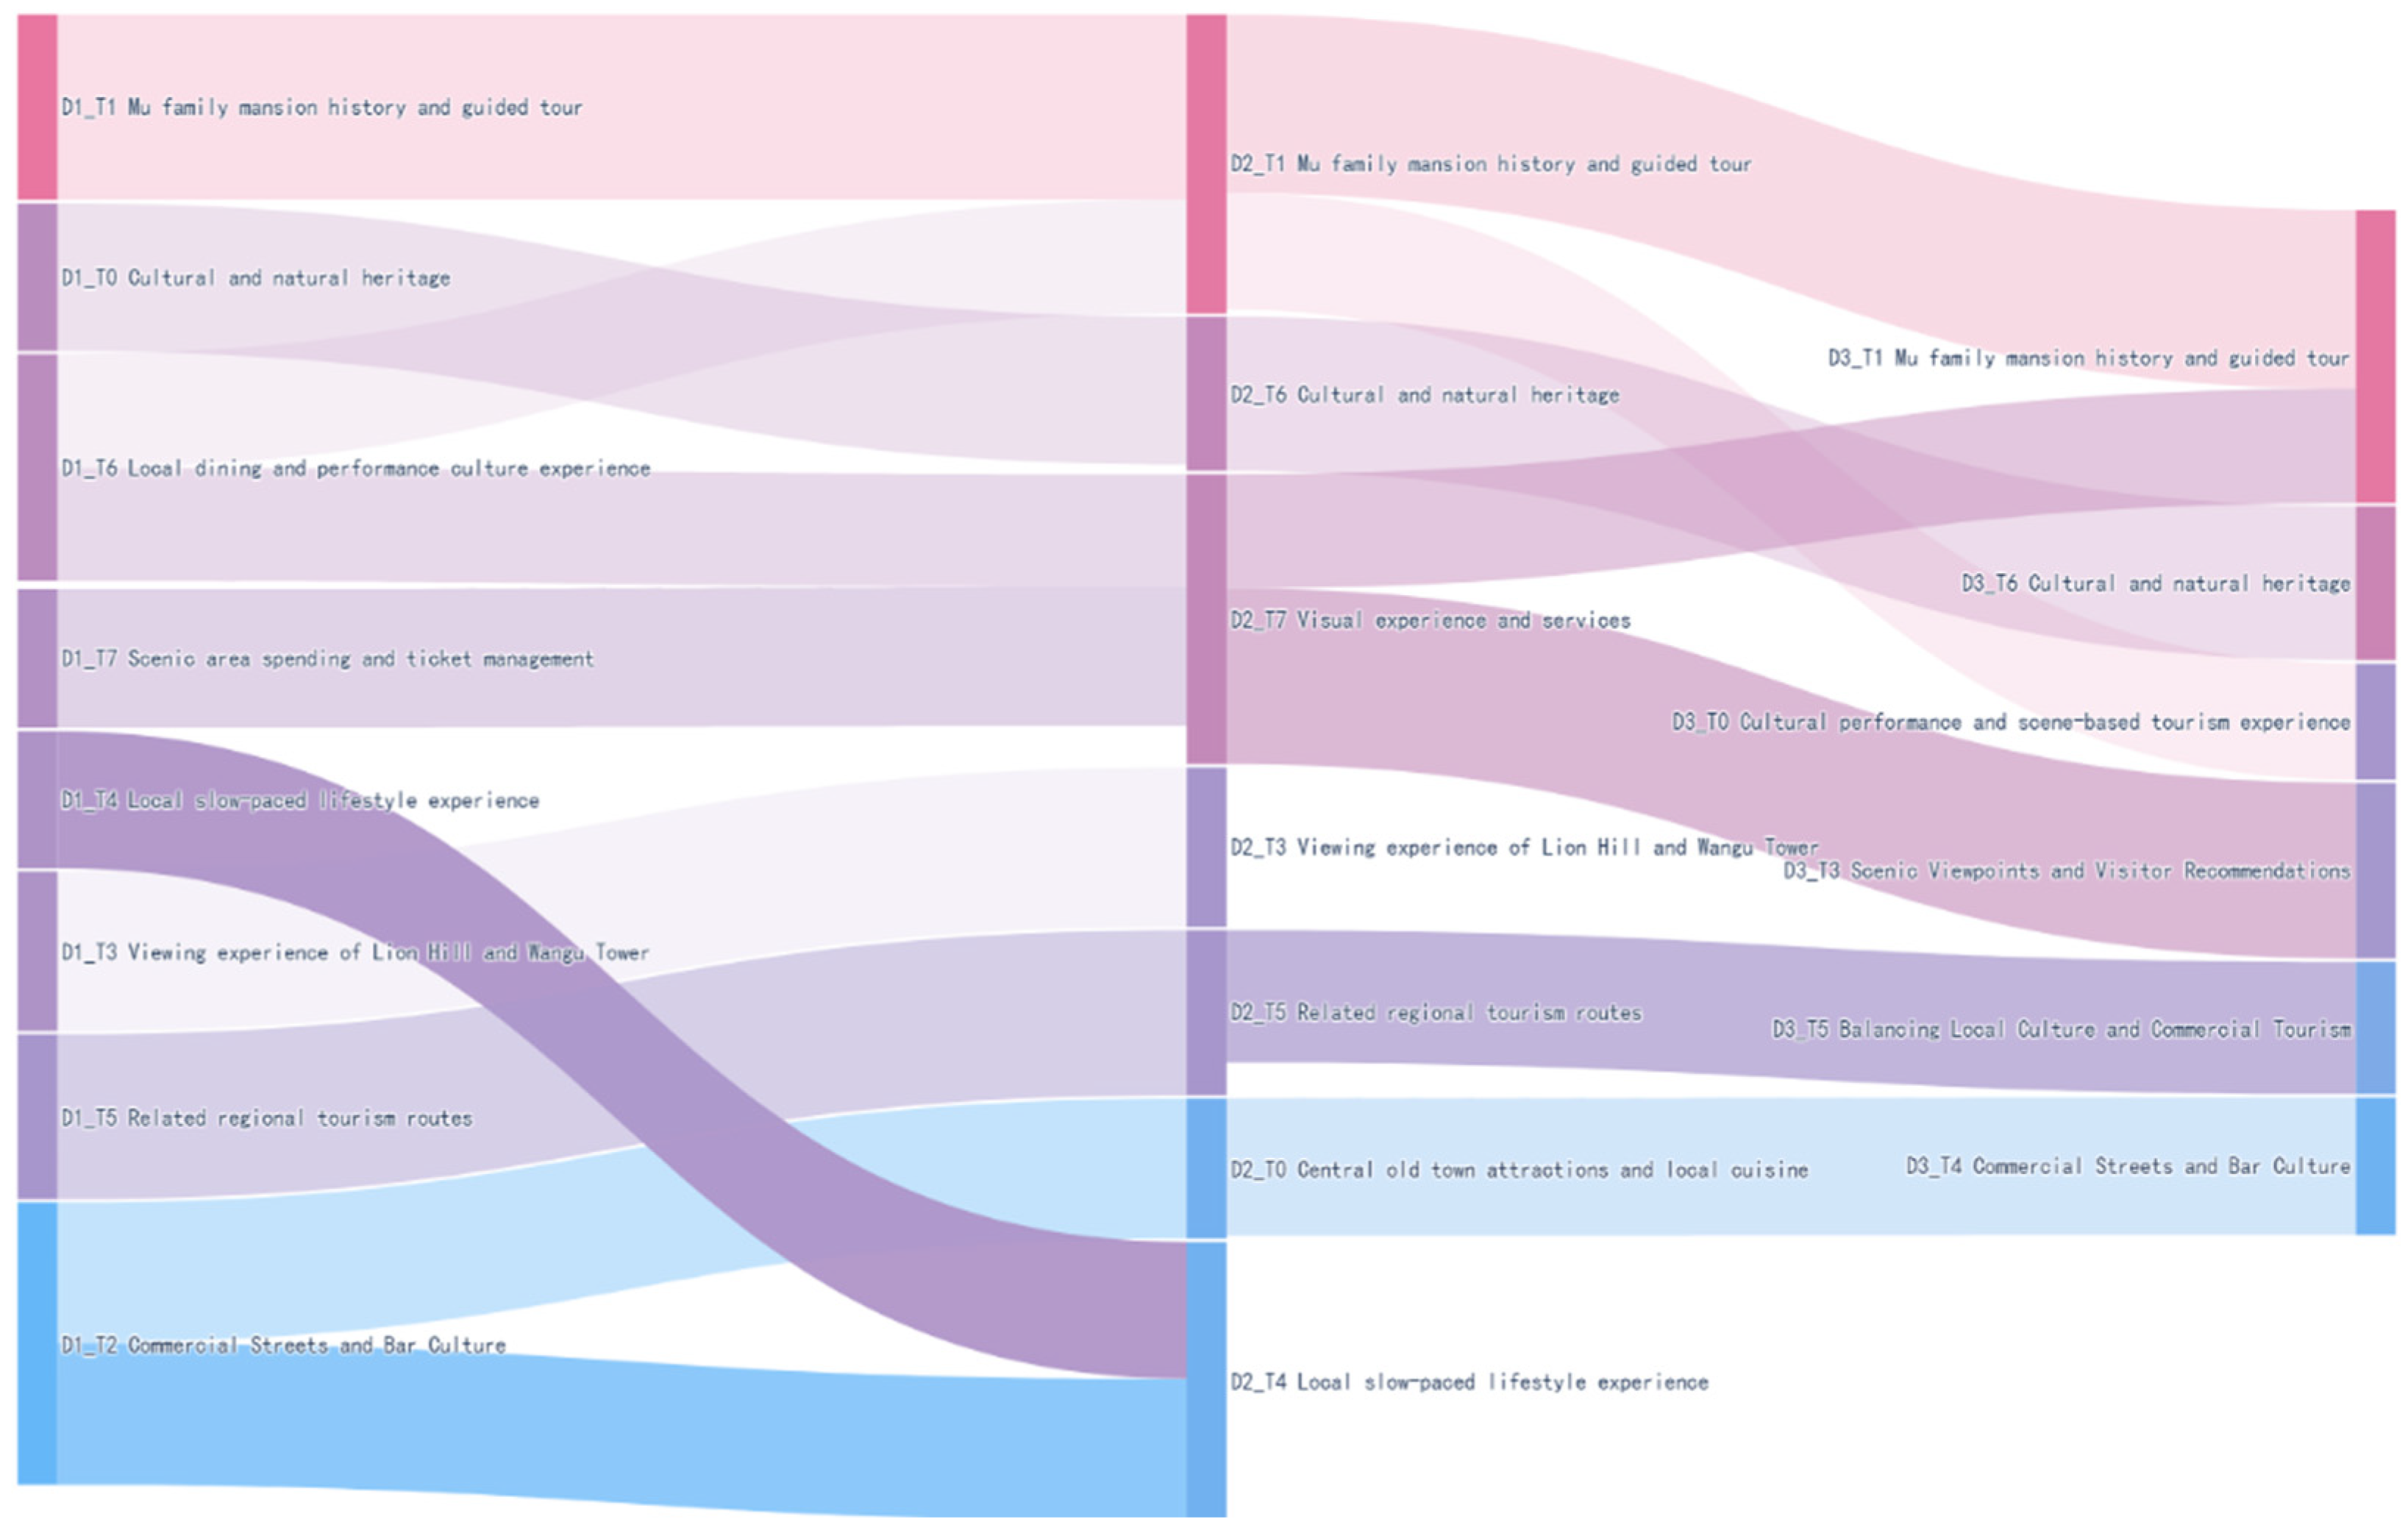
4.3.2. LDA Topic Evolution

The Sankey diagram illustrates the dynamic relationships of continuation, splitting, and merging between themes in response to the evolution of Lijiang Old Town’s image. As shown in Figure 9, topics with similarity above 0.5 (JS < 0.5) are connected, indicating potential continuity, highlighting the evolving themes in Lijiang’s destination image (DI) across three periods (D1-D3). To illustrate the cultural and commercial dimensions of Lijiang’s destination image based on SNA results, we applied color transitions to the Sankey diagram. The topic “Mu Family Mansion History and Guided Tour” (D1-T1) serves as the cultural anchor, and “Commercial Streets and Bar Culture” (D1-T2) serves as the commercial anchor. Nodes in Figure 9 are colored based on similarity to these anchors: redder for cultural attributes, bluer for commercial activities.
Topic continuity emerges as a defining pattern across the three phases. All eight topics presented in D1 continue in D2, indicating a stable destination image (DI) continuity despite the onset of the pandemic. And the majority of the topics in D2 persist into D3.
(1)
Among them, “Mu Family Mansion History and Guided Tour” with high similarities throughout three stages (D1-T1: 10.39%; D2-T1: 7.65%; D3-T1: 16.24%; JS < 0.2) shows a brief decline of strength during the pandemic, and a surge of attention in D3.
(2)
Cultural and Natural Heritage” theme stays steady throughout D1-D3 with a minor post-pandemic decline (D1-T0: 8.75%, 0.0947; D2-T6: 11.32%, 0.0920; D3-T6: 6.84%, 0.0828). This prominent persistence indicates the resilience of the cultural and natural attributes of the DI under the public health event.
(3)
Meanwhile, D1′ “Local dining and performance culture experience” (5.81%, 0.0629) temporarily merges with the D1-T1 “Mu Family Mansion History and Guided Tour” during the pandemic period, and further extends to “Cultural performances and Scene-based Tourism experiences” (11.03%, 0.1335) after pandemic, with increasing perceptual attention of novel tourism attractions and immersive experiences (“Dayan Flower Lane”, “Staged scene”) increasing.
(4)
The topic “Related regional tourism routes” persists from D1 to D2, while it changes into “Balancing local culture and Commercial Tourism” in D3, with terms “commercialization” and” business” emerging. And the node color of the topic changes to a bluer color. This transition to the critical perspective suggests the possible intensifier in tourists’ perception of commercial after the pandemic.
(5)
Additionally, D1’s “Commercial Streets and Bar Culture” (D1-T2, 14.89%) splits into D2’s “Local Slow-Paced Lifestyle Experience” (D2-T4, 33.96%) and “Central Old Town Attractions and Local Cuisine” (D2-T3, 11.18%), with only the commercial topic persisting in D3 (D3-T4, 9.19%), with decreasing perceptual attention (14.89%→9.19%).
(6)
Moreover, “Scenic Area Spending and Ticket Management” (D1-T7, 9.50%, 0.1028) in D1, merged with elements of “Local Dining and Performance Culture Experience” (D1-T6), transformed into “Visual Experience and Services” (D2-T7, 19.71%, 0.1601) in D2 and evolved into “Scenic Viewpoints and Visitor Recommendations” (D3-T3, 23.39%, 0.2833) in D3, with perceptual attention increasing from 9.50% to 23.39%. Notably, “Scenic Viewpoints and Visitor Recommendations” (D3-T3, 23.39%) reflects positive visitor sentiments and visual appeal through photographing and exploration activities. Further, with D3-T3’s node color changing from purple to blue (Figure 8), this transition reflects rising commercial perception and positive affect post-pandemic.
In contrast, two topics from D2 do not persist into D3, reflecting a shift in tourist perception during the post-pandemic recovery. The “Local Slow-Paced Lifestyle Experience” (D2-T4) (33.96%, 0.2759), D2’s most significant dimension, merges D1’s slow-paced lifestyle (D1-T4, 25.58%, 0.2552) and commercial attributes of DI (D1-T2, 14.89%, 0.1612), reflecting a peak in slow tourism, but its absence in D3, with “Commercial Streets and Bar Culture” persisting (D3-T4, 9.19%, 0.1116), demonstrates a dynamic shift in Lijiang’s destination image in the post-pandemic phase. Reflecting tourists’ appreciation of scenic waterways, tranquil streets, and serene ambiance, the slow-paced lifestyle experience in Lijiang Old Town underscores its engagement with the town’s water system and street architecture as an avenue for slow tourism [91,92]. These elements, central to UNESCO’s recognition of Lijiang’s cultural heritage [77], reinforce slow tourism as a core identifier of Lijiang’s destination image [93]. The topic (33.96%, 0.2759) in D2 merges with “Commercial Streets and Bar Culture”, with heightened perceptual attention, and a blue node is shown in the diagram (Figure 9), reflecting heightened perceptual attention. In addition, the topic “Viewing experience of Lion Hill and Wangu Tower” in D2 fails to carry over into D3.
Notably, three emergent topics, excluded from Figure 9 due to low similarity (0.5 threshold), highlight increased perceptual significance in Lijiang’s destination image. In D2, tourists engage with scenic night-time experiences shaped by internet-famous cultural ambiance (D2-T2, 6.37%) and prioritize reliable accommodation services emphasizing hospitality and budget-friendly options (D2-T8, 9.68%). In D3, concerns about access management and commercialized experiences reflect ticketing and operational challenges (D3-T2, 10.52%).

5. Discussion

The research unfolded the temporal shifts in destination image via tourists’ online reviews on Lijiang Old Town by applying a tiered semantic-triangle approach of TF-IDF, SNA, and LDA, where each contributes distinct perspectives to the overall transformation. This study identified key patterns of semantic convergence and perceptual narrowing. Three notable dimensions of change are identified. The multi-method design provides not only complementary insights but also interpretive reinforcement across analytical levels. The centrality of “Mu family mansion” in SNA, their repeated emergence in high-TF-IDF rankings, and their clustering within related LDA topics, “Mu family mansion history and guided tour”, exemplify this cross-method alignment. Such consistency strengthens confidence in the stability of cultural identity elements in tourists’ perceptions, even as peripheral terms shift across phases.
Meanwhile, this layered semantic approach not only enables the detection of perceptual evolution but also echoes recent research efforts to incorporate tourist perception into heritage management practices. While prior studies have primarily relied on survey-based perception data [22], this study demonstrates the potential of unstructured UGC as a complementary source for dynamic monitoring.

5.1. Cultural Resilience and Its Limitations

The Lijiang’s destination image exhibited notable cultural stability throughout the three periods, as demonstrated by the consistent appearance of 53% cross-stage keywords in the TF-IDF analysis (Section 4.1). Yet, this stability in cultural cognition was largely concentrated on the single attraction of “Mu Family Mansion”, rather than encompassing Lijiang’s diverse cultural heritage elements, with semantic network metrics demonstrating the consistent centrality of “Mu Family Mansion” throughout all periods (D1: 0.0831; D2: 0.0415; D3: 0.1671). The post-pandemic period witnessed a strengthening of this “focal” pattern of cultural perception, with service-oriented aspects becoming more emphasized, as evidenced by the LDA topic modeling showing the “Mu Family Mansion History and Guided Tour” theme increasing in attention from 7.65% during the pandemic to 16.24% afterward (Section 4.3.1). This cross-stage persistence of perception surrounding this node not only reflects a path dependence in cognitive components [23,58] but also reveals the cultural resilience of symbolic cultural elements within the destination image. Although communication strategies and tourism experiences may have shifted due to the pandemic, the cultural imagery continues to endure in tourists’ collective cognition, indicating a certain degree of stability in the cognitive structure of the cultural dimension.
Notably, the semantic network revealed a substantial reinforcement of the association between “Mu Family Mansion” and “guided interpretation” (edge weight increasing to 1160) (Section 4.2.1). The observed association highlights the importance of guided interpretation as a key channel for cultural understanding, especially in shaping perceptions around core heritage nodes. heritage nodes, particularly in how guided services increasingly function as intermediaries for cultural transmission around iconic attractions [40]. Several reviews referenced guided services in direct and tangible terms, such as:
A grand and antique mansion, with a dedicated guide leading our tour and providing detailed explanations…”
Took the kids to learn about history—the guide did a great job, and the kids were really happy…”
The highlight was definitely the free full-length guided tour—truly from start to finish, explaining the history of the Mu Mansion thoroughly…”
The guide’s explanation felt rushed, like herding ducks…”
These expressions illustrate how tourists perceived guided interpretation not merely as background information, but as a vital element that shaped their cultural understanding and contributed meaningfully to their overall experience. Tourists’ perception of Naxi culture appears to be largely constructed through guided narratives within the Mu Family Mansion, with their understanding increasingly anchored to this specific cultural node. Notably, absence can also be meaningful. Keywords related to local community life or cultural practice are rarely found in tourist comments. This suggests that tourists’ cultural understanding relies more on institutionalized interpretations than on lived engagement with local culture. Although research on Lijiang’s community participation indicates that effective urban cultural heritage management requires substantial involvement of local communities in constructing cultural narratives, our findings reveal that the voice of the Naxi community remains relatively marginalized in tourist perceptions. This centralization of interpretive authority reflects a broader trend in contemporary heritage tourism: prioritizing tangible, manageable, and explainable heritage assets over complex, community-embedded practices [10]. Increasing reliance on official narratives may lead to symbolic concentration, reducing both the diversity and visibility of spontaneous, community-driven cultural expressions while simplifying deeper cultural complexities [37].
From the perspective of structural evolution, this trend of concentration also reflects a further reinforcement of the “core–periphery” structure [50]. For example, the Naxi culture, representing the indigenous cultural foundation of Lijiang, was still located in the core of the semantic network in the pre-pandemic phase (D1 stage, edge weight between “Naxi” and “Naxi people” reaching 1484), but by the D3 stage, it no longer appears, signaling its marginalization within the perceptual structure. As shown in Appendix A, related keywords such as ‘Naxi’, ’Naxi people’, and ‘Naxi ethnicity’ were initially dispersed across multiple topics in D1, later converged in D2, and nearly disappeared in D3. This trajectory illustrates how semantically significant but structurally dispersed concepts can escape LDA detection, further underscoring the need for multi-method triangulation. Although the Naxi culture served as a key cultural foundation for Lijiang’s UNESCO World Heritage designation, it has gradually become marginalized in tourist expressions, suggesting that the destination image may be increasingly centered on specific cultural elements. This trend of structural concentration may, over time, reshape the broader perceptual landscape. It is therefore essential to remain vigilant to the potential homogenization of cultural expression—a risk that may arise from sustained concentration around symbolic heritage elements [10]. This structural marginalization not only reduces Naxi culture to consumable symbols but also threatens the sustainability of heritage tourism. The diminished visibility of community voices and lack of participatory inclusion risks eroding cultural integrity and weakening the role of local actors in cultural preservation.
While our LDA analysis successfully captured major thematic evolution, we acknowledge certain limitations in tracking semantically dispersed but structurally significant elements. For instance, “Naxi culture” appeared as a central node in our SNA (D1) but was not highlighted as a separate LDA topic, and its presence diminished in D3. This semantic drift phenomenon highlights both the complementary nature of our multi-method approach and the necessity of integrating different analytical lenses to fully capture destination image evolution.

5.2. The Rise and Decline of ‘Slow Life’

Though the term “pandemic” appears in the top 100 keyword set (Section 4.1) throughout the pandemic, but does not become a core node in SNA, nor does it form an independent cluster of LDA results. Tourist perceptions of Lijiang Old Town noticeably pivoted toward introspective and relaxing elements, cultivating an emotional narrative built around “slow pace” and “tranquility”. Evidenced by TF-IDF analysis revealing increased prominence of words like “life”, “feeling”, and “picturesque canals and bridges” during this period, and groups of terms like “sunshine”, “tranquility” related to emotional and ambience perceptions temporarily emerged during the pandemic period (Section 4.1), semantic network analysis revealing modules centered on “slow pace-healing” connections (Section 4.2), and LDA topic analysis identifying “Local Slow-Paced Lifestyle Experience” (33.96%) as the principal perceptual theme during the pandemic (Section 4.3.1).
This trend of cognitive bias under the pandemic context indicates an enhanced perception among tourists of comfortable and emotionally engaging leisure experiences. It reflects a shift in tourists’ perceptions and reinterpretations of destinations during sudden events (such as the pandemic), often stemming from a change in the pace of experience, from the fast-paced, modern sightseeing approach to a slower, more leisurely engagement with the destination. As mentioned in the relevant reviews: “…when tired, I just stayed in Lijiang Old Town, napping on a rocking chair and feeling the warm afternoon sunshine…”, “Life here is very pleasant, the pace of life is slow, and I wake up naturally every day…”. The pandemic and related restrictive policies like quarantine and prevention measures, which brought about controls on tourist flows at destinations or the temporary weakening of modern commercial activities, provided the conditions for this shift. As mentioned in the relevant reviews, “There were far fewer people. None of the past noise, just a sense of leisure and comfort”, “Even with shops closed, the Old Town had its own serenity and peace”. Furthermore, the study found that “slow lifestyle” tourism broadened and deepened the tourist cultural engagement. For example, imagery like “picturesque canals and bridges” entered the core semantic layer during the pandemic (see Section 4.2.2), reflecting a new opportunity for cultural perception. This aligns with slow tourism theory emphasizing authenticity and place-based engagement [94], further confirming that the pandemic enabled a perceptual restructuring of cultural tourism modes [3].
The evolution of the “slow life” imagery, while not overtly represented by the term “pandemic”, structurally underscores a significant cognitive shift among tourists, precipitated by the reduced visitor numbers and altered spatial usage rhythms during the pandemic. This shift delineates a transition from external information-driven stimulation to an alignment with tourists’ intrinsic emotional rhythms. In the context of sudden events such as the pandemic, the process of tourists reinterpreting and reorganizing their perceptions of destinations reveals a cognitive reconstruction pathway shaped by shifting emotional focus and perceptual rhythm under pandemic conditions.
Nevertheless, this imagery quickly attenuated following the pandemic, failing to secure a stable position within the destination image’s fundamental structure, as TF-IDF analysis demonstrated a substantial decline in “slow life” related terminology during the D3 phase (Section 4.1), and more significantly, the “Local Slow-Paced Lifestyle Experience” theme, which represented the largest proportion (33.96%) in the D2 phase of LDA topic analysis, entirely vanished in the D3 phase, exhibiting an evident thematic rupture (Section 4.3.2, Figure 9). This rupture feature reveals the situational dependency and semantic volatility of “healing imagery” within tourism cognition, as semantic network analysis results show that the “Nightlife Experience and Ambiance” module (20.22%) that appeared in the D2 phase was subsequently reincorporated into the “Commercialization and Business” community in the D3 phase (Section 4.2.2), indicating that these experiential perceptions could not be consolidated into a stable, long-term thematic cognitive framework for tourists. This also indirectly reflects that emotions and rhythms are susceptible to disruptions from the social context, whereas cultural depth requires more stable institutional and narrative support.
In the wake of the pandemic, the reduced emphasis on “slow lifestyle” qualities—evidenced by the decline in mentions of “relaxation” (0.035) and “tranquility” (0.028)—signals an ongoing tension between the mounting forces of commercialization and the commitment to uphold slow tourism ideals [94]. This observed relationship between transient affective states and destination image development provides new insights into both the longitudinal construction of heritage tourism sites and the remarkable persistence of slow tourism ideals in the face of increasing commercialization pressures. This observation further underscores the need to examine the transferability and fragility of “perceptual nodes” within semantic frameworks, with particular emphasis on the limited resilience of emotion-driven imagery under fluctuating contextual conditions. Such imagery is susceptible to being reabsorbed or supplanted by broader trends, such as the resurgence of commercial activity. This insight offers local policymakers a novel perspective for conducting risk assessments in the formulation of cultural dissemination strategies.

5.3. The Emergence of Performative Cultural Experiences as Mediating Structures

In the post-pandemic phase, tourists’ attention to performative and scenarized cultural experiences increased significantly, and these elements shifted from the periphery to the core within the perceived semantic structure. This semantic cluster gradually embedded itself into the cultural structure core, reflecting a perceptual reconfiguration from peripheral recognition to core image components. Such a “core–periphery” structural feature has been noted in previous studies: destination image not only includes the overall cognitive picture of tourists but also presents hierarchical semantic layering between center and periphery, which may undergo structural reorganization under specific events or circumstances [50].
Semantic network analysis showed that these terms did not form a cluster during the pre- and mid-pandemic phases (D1, D2), but in the post-pandemic phase (D3), they first converged into a “positive aesthetic experience” semantic group (e.g., “impressive”, “show”, “photography”, “visually appealing”) and established structural connections with the “culture and history” cluster through high-salience TF-IDF terms such as “worth” and “worth seeing” (Section 4.2). TF-IDF results also indicated that while these terms appeared across all three stages, their weights rose significantly in D3 (Section 4.1), reflecting the continuous presence and periodic upsurge of attention in tourist expressions, thus providing the semantic basis for the formation of this cluster. This structure did not stem from newly emerging discourse in the post-pandemic context but was rather the result of a reorganization and centralization of existing expressions within the semantic network.
It is worth noting that although this semantic cluster was structurally adjacent to the “cultural” dimension in SNA results, its keywords were highly concentrated on emotional and sensory expressions such as “impressive”, “show”, and “performance”, and its semantic color in LDA leaned toward the commercialization-related cluster.
This structure was not only evident in the network-level aggregation but also substantiated by tourist comments, which revealed distinct patterns of emotional expression and cultural interpretation. For example:
The Mu Mansion performance was lively and fun, especially due to its interactive nature…”
As the music played and the scene changed, it felt vividly alive—with dancing stone lions and sky lanterns.”
Great sensory impact, visually stunning, especially the earthquake scene with immersive audience participation.”
What makes the ‘Eternal Love of Lijiang’ performance so remarkable is that it conveys the cultural essence in an easily understandable way, appealing to all ages.”
These comments suggest that such scenarized performances function as emotional and perceptual anchors, embedding cultural content within sensory experiences. Through allegorical narratives and visualized stage designs, they translate local histories, ethnic symbols, and cultural imaginaries into accessible narrative units. For instance, the portrayal of the “Caravan Legend” was described as “Lijiang’s glory was built on the hoofbeats of caravans”, highlighting how regional history is recontextualized within performative settings. This type of “performable culture” has gradually shifted from peripheral to central in the post-pandemic phase, not only reshaping tourists’ cultural understanding but also contributing to the emotional centralization of the destination image.
This misalignment between “cultural labeling” and “commercial semantics” suggests that these services and tourism scenes function as a mediating mechanism for cultural cognition, having gained a central position within the cultural dimension [36]. The LDA results revealed an evolution from “local dining and performance experience” to “cultural scenography and visual engagement”, indicating a perceptual shift from meaning-making toward scene participation. The expressive logic embedded in these cultural experiences aligns with consumption-oriented participatory narratives [12,13], culminating in what MacCannell (1973) termed “staged authenticity” [95], where choreographed cultural performances are emphasized, often at the expense of embedded, community-based practices. While such performative culture responds to tourists’ desire for immersive experiences and may enhance emotional connection and perceived accessibility, it also risks aestheticizing cultural meanings and weakening the link to authentic cultural identity [95]. Co-occurrence patterns between emotional keywords (e.g., “beautiful”, “worthwhile”) and performative symbols (e.g., “Eternal Love”) further suggest that emotional resonance plays a mediating role, reinforcing the perceptual dominance of staged spectacles.
Notably, such semantic prominence is not guaranteed by the mere existence of physical spaces. Although Lijiang has made progress in community cultural display in recent years, such as the “Ancient City Cultural Courtyard” project launched in 2007 and the gradually opened Dongba papermaking experience spaces, semantic analysis results show that related vocabulary did not enter high-frequency TF-IDF items, nor did they form stable structural clusters in SNA or LDA. This indicates that such projects have not achieved significant semantic prominence in tourist cognition, nor have they established stable image structural presence. This lack of visibility may be related to factors such as limited coverage, small participation scale, or ineffective integration into tourist experience pathways.
To address this, cultural heritage tourism management should strengthen the cognitive accessibility of diverse heritage expressions, encouraging deeper interaction between tourists and authentic cultural values. Through integrated strategies such as narrative embedding, spatial guidance, visual cues, and community participation, the visibility and affective resonance of lived cultural practices can be enhanced—facilitating the core layer of tourists’ perceptions.

6. Conclusions

This study took Lijiang Old Town as a case, and, based on UGC tourist review data, applied a multi-method analytical framework integrating TF-IDF, SNA, and LDA to systematically identify the evolution path of tourists’ perceptions of destination image across the three stages before, during, and after the COVID-19 pandemic. The findings revealed that the cultural dimension exhibited strong stability and anchoring effects, while the commercial dimension showed a shift from spatial concentration to cultural embedding, especially as performative and visually participatory experiences increasingly functioned as mediating mechanisms of cultural perception. In addition, although the notion of “slow life” persisted before and during the pandemic and briefly intensified during the pandemic, it gradually faded from the core perceptual layer after the pandemic, failing to solidify into a long-term image. This study not only revealed the trend of structural reconfiguration of destination image under major public crises (i.e., the pandemic) but also validated the strengths of a mixed-method approach in capturing semantic nuances and dynamic cognition. By capturing the evolving semantics of tourist perception, this study enhances the understanding of destination image restructuring in heritage tourism and offers insights into balancing tourism attractiveness and cultural integrity in heritage site management. The findings contribute to sustainable heritage tourism development by enhancing managers’ ability to identify and respond to changes in tourist perceptions. Although Lijiang serves as a unique case, the methodological framework and observed perceptual patterns may be transferable to other heritage tourism destinations undergoing similar public health or socio-environmental disruptions.
This study utilized online reviews from multiple platforms as the primary data source. Although the content type was standardized, differences in user demographics across platforms were not deeply analyzed, which may influence the interpretation of destination image construction. While this study primarily focused on the cognitive dimension, emotional terms such as “worth” and “good” emerged organically from the data and were qualitatively interpreted in relation to cultural performance. However, we acknowledge that a formal sentiment polarity analysis may help systematically capture tourists’ affective orientations, especially in terms of positive or negative evaluations. Future studies could benefit from incorporating sentiment polarity scoring to enrich the structural and thematic analysis of affective responses. Moreover, the current analytical framework focused primarily on textual content and did not incorporate visual or multimodal expressions, which may limit the comprehensiveness of tourist perception capture. Integrating dynamic monitoring mechanisms of tourist perceptions into sustainable heritage tourism destination management can enhance managers’ capacity to identify image changes and develop adaptive responses to cultural communication. Meanwhile, tracking the evolution of cultural anchoring points can provide practical guidance for heritage site interpretation strategies and cultural activity planning.
Future research may build on this study by incorporating official communication materials to explore the evolving alignment between tourist perceptions and institutional narratives under external shocks, and provide more targeted recommendations for destination image management and heritage site governance. It may also conduct comparative analyses across multiple destinations to test the generalizability of the observed patterns or integrate multimodal and visual UGC to capture more layered perceptions.

Author Contributions

Conceptualization, Y.W. and M.C.; methodology, Y.W.; software, Y.W.; validation, Y.W. and M.C.; formal analysis, Y.W.; investigation, Y.W.; resources, Y.W.; data curation, Y.W.; writing—original draft preparation, Y.W.; writing—review and editing, M.C.; visualization, Y.W.; supervision, M.C. All authors have read and agreed to the published version of the manuscript.

Funding

This research received no external funding.

Institutional Review Board Statement

Not applicable.

Informed Consent Statement

Not applicable.

Data Availability Statement

The data presented in this study are available on request from the corresponding author.

Conflicts of Interest

The authors declare no conflicts of interest.

Appendix A

Table A1. LDA topics of D1.
Topic IDTopic TermsTopic Label
D1-T0Heilong pool, cultural heritage, Naxi, culture, Yulong snow mountain, Suhe, ancient, Naxi minority, History, streetCultural and natural heritage
D1-T1Mu family mansion, guided interpretation, tour guide, history, Tusi, free of charge, culture, architecture, Naxi minority, visit, worth, Forbidden CityMu family mansion history and guided tour
D1-T2bar, Sifang street, commercialization, waterwheel, lively, characteristic, tourist, business, vibe, street, night view, snack, shopCommercial Streets and Bar Culture
D1-T3Wangu Tower, Lion Hill, panorama, overlook, architecture, Yulong Snow Mountain, viewing platform, full view, distant view, vantage point, mountaintop, good, scenic area, snow mountainViewing experience of Lion Hill and Wangu Tower
D1-T4Inn, good, scenery, life, beautiful, Yanyu, city, weather, friends, view, picturesque canals and bridges, daka, discover, sunshine, flowers, quietLocal slow-paced lifestyle experience
D1-T5Yunnan, Dali, hotel, tourism, recommend, trip, airport, Lugu Lake, Kunming, inn, good, accommodationRelated regional tourism routes
D1-T6Eternal Love show, performance, show, cuisine, Naxi, impressive, taste, culture, good, ethnic, Xiaoguo rice noodle, serene, taste, worthLocal dining and performance culture experience
D1-T7Entrance ticket, worth, attraction, maintenance fee, free of charge, scenic area, photo, charge, tourism, take photos, purchase, expensiveScenic area spending and ticket management
Table A2. LDA topics of D2.
Topic IDTopic TermsTopic Label
D2-T0tourist, Dayan, lively, Sifang street, waterwheel, strolling, Shuhe, prosperous, bar street, activity, shop, local people, pork ribs, flowers, noisy, marketCentral old town attractions and local cuisine
D2-T1Mu family mansion, history, culture, Tusi, Eternal Love show, impressive, guided interpretation, performance, visit, architecture, earthquake, guide, management, Naxi minority, Forbidden CityMu family mansion history and guided tour
D2-T2night view, internet-famous, old town district, lighting, well-known, alleys, cultural city, coffee, Dayan, famousNight view experience
D2-T3Lion Hill, Yulong Snow Mountain, maintenance fee, Wangu tower, Snow Mountain, overlook, happy, park, disappointed, Tiger Leaping Gorge, landscape, panorama, entrance ticket, viewingViewing experience of Lion Hill and Wangu Tower
D2-T4bar, characteristic, beautiful, life, city, vibe, business, street, picturesque canals and bridges, sunshine, Yanyu, snack, quiet, relax, cozy, impressionLocal slow-paced lifestyle experience
D2-T5Yunnan, tourism, Dali, trip, Kunming, Yulong Snow Mountain, friends, Lugu Lake, freedom, Yunnan travel, Shangri-la, happy, enthusiasmRelated regional tourism routes
D2-T6Architecture, Naxi, Naxi people, Heilong pool, culture, ethnic, Yulong snow mountain, ancient trail, ancient, cultural heritage, unpretentious, attractCultural and natural heritage
D2-T7worth, good, recommend, view, free of charge, scenery, experience, beautiful, daka, guide, ticket, visually appealing, photo, tasty, guided interpretationVisual experience and services
D2-T8inn, guesthouse, hospitality, transportation, room, host, accommodation, hotel, location, budget-friendly, arrangement, attitude, clean, airport, luggageAccommodation services and management
Table A3. LDA topics of D3.
Topic IDTopic TermsTopic Label
D3-T0performance, Eternal Love show, show, emotionally stirring, breathtaking, professional, leisure strolling, splendid, performance segments, Huaxiang cultural street, favorable reviews, Staged sceneCultural performance and scene-based tourism experience
D3-T1Mu family mansion, guided interpretation, free of charge, entrance ticket, Tusi, history, architecture, tour guide, Naxi minority, ticket price, worthMu family mansion history and guided tour
D3-T2park, fun, charging, entrance ticket, maintenance fee, local residents, staff, freedom, non-locals, photography, strolling, attitude, reservationContested Access and Management Response
D3-T3good, worth, recommend, view, take photos, landscape, visually appealing, Lion Hill, experience, Wangu tower, daka, night view, overlookScenic Viewpoints and Visitor Recommendations
D3-T4lively, bar, Sifang street, Dayan, waterwheel, take photos, street, daka, restaurant, snacks, stone-paved road, bonfire, Yanyu, bustlingCommercial Streets and Bar Culture
D3-T5commercialization, tourism, flowers, business, guesthouse, beautiful, inn, Yulong Snow Mountain, strolling, tasty, hotel, lightingBalancing Local Culture and Commercial Tourism
D3-T6Old Town District, Baisha, Heilong Pool, Naxi minority, Naxi, architecture, culture, cultural heritage, history, ancient, rustic.Cultural and natural heritage

References

  1. UNWTO. 2020: Worst Year in Tourism History with 1 Billion Fewer International Arrivals. Available online: https://www.unwto.org/news/2020-worst-year-in-tourism-history-with-1-billion-fewer-international-arrivals#:~:text=January%2028%2C%202021-,2020%3A%20Worst%20Year%20in%20Tourism%20History%20with%201%20Billion%20Fewer,World%20Tourism%20Organization%20(UNWTO) (accessed on 3 March 2025).
  2. United Nations Educational, Scientific, and Cultural Organization. World Heritage in the Face of COVID-19; CLT/CCE/2021/RP/2; UNESCO: Paris, France, 2021; p. 42. [Google Scholar]
  3. Seabra, C.; Bhatt, K. Tourism Sustainability and COVID-19 Pandemic: Is There a Positive Side? Sustainability 2022, 14, 8723. [Google Scholar] [CrossRef]
  4. Tiwari, P.; Chowdhary, N. Has COVID-19 brought a temporary halt to overtourism? Turyzm 2021, 31, 89–93. [Google Scholar] [CrossRef]
  5. Ioannides, D.; Gyimóthy, S. The COVID-19 crisis as an opportunity for escaping the unsustainable global tourism path. Tour. Geogr. 2020, 22, 624–632. [Google Scholar] [CrossRef]
  6. Madandola, M.; Boussaa, D. Cultural heritage tourism as a catalyst for sustainable development; the case of old Oyo town in Nigeria. Int. J. Herit. Stud. 2023, 29, 21–38. [Google Scholar] [CrossRef]
  7. Galluccio, C.; Giambona, F. Cultural heritage and economic development: Measuring sustainability over time. Socio-Econ. Plan. Sci. 2024, 95, 101998. [Google Scholar] [CrossRef]
  8. Geçikli, R.M.; Turan, O.; Lachytová, L.; Dağlı, E.; Kasalak, M.A.; Uğur, S.B.; Guven, Y. Cultural Heritage Tourism and Sustainability: A Bibliometric Analysis. Sustainability 2024, 16, 6424. [Google Scholar] [CrossRef]
  9. The State Council of the People’s Republic of China. China’s Campaign to Fight the Coronavirus Pandemic. 2022. Available online: https://www.gov.cn/zhengce/2020-06/07/content_5517737.htm (accessed on 5 January 2025).
  10. Timothy, D.J. Contemporary Cultural Heritage and Tourism: Development Issues and Emerging Trends. Public Archaeol. 2014, 13, 30–47. [Google Scholar] [CrossRef]
  11. Nian, S.; Bao, J.; Chen, Y.; Zhang, X.; Chen, Y. How does the tourist experience affect the conservation of World Heritage Sites via the stimulus—organism—response model? Mount Sanqingshan National Park, China. npj Herit. Sci. 2025, 13, 21. [Google Scholar] [CrossRef]
  12. Zhang, Y.; Zheng, Q.; Huang, L.; Lee, T.J.; Hyun, S.S. Alienation and authenticity in intangible cultural heritage tourism. J. Sustain. Tour. 2023, 32, 2459–2478. [Google Scholar] [CrossRef]
  13. Wang, C.; Wang, Y.; Edelheim, J.R.; Zhou, J. Tourism commercialisation and the frontstage-backstage metaphor in intangible cultural heritage tourism. Tour. Stud. 2024, 24, 246–265. [Google Scholar] [CrossRef]
  14. Simeon, M.I.; Buonincontri, P.; Cinquegrani, F.; Martone, A. Exploring tourists’ cultural experiences in Naples through online reviews. J. Hosp. Tour. Technol. 2017, 8, 220–238. [Google Scholar] [CrossRef]
  15. Afshardoost, M.; Eshaghi, M.S. Destination image and tourist behavioral intentions: A meta-analysis. Tour. Manag. 2020, 81, 104154. [Google Scholar] [CrossRef]
  16. Kock, F.; Josiassen, A.; Assaf, A.G. Advancing destination image: The destination content model. Ann. Tour. Res. 2016, 61, 28–44. [Google Scholar] [CrossRef]
  17. Beerli, A.; Martín, J.D. Factors influencing destination image. Ann. Tour. Res. 2004, 31, 657–681. [Google Scholar] [CrossRef]
  18. Prayag, G.; Hosany, S.; Muskat, B.; Del Chiappa, G. Understanding the Relationships between Tourists’ Emotional Experiences, Perceived Overall Image, Satisfaction, and Intention to Recommend. J. Travel Res. 2015, 56, 41–54. [Google Scholar] [CrossRef]
  19. Viet, B.N.; Dang, H.P.; Nguyen, H.H. Revisit intention and satisfaction: The role of destination image, perceived risk, and cultural contact. Cogent Bus. Manag. 2020, 7, 1796249. [Google Scholar] [CrossRef]
  20. Zhu, D.; Wang, J.; Wang, M. Sustainable Tourism Destination Image Projection: The Inter-Influences between DMOs and Tourists. Sustainability 2022, 14, 3073. [Google Scholar] [CrossRef]
  21. Vong, F. Relationships among perception of heritage management, satisfaction and destination cultural image. J. Tour. Cult. Change 2013, 11, 287–301. [Google Scholar] [CrossRef]
  22. Li, Y.; Liang, J.; Huang, J.; Shen, H.; Li, X.; Law, A. Evaluating tourist perceptions of architectural heritage values at a World Heritage Site in South-East China: The case of Gulangyu Island. J. Hosp. Tour. Manag. 2024, 60, 127–140. [Google Scholar] [CrossRef]
  23. Pike, S.; Jin, H.; Kotsi, F. There is nothing so practical as good theory for tracking destination image over time. J. Destin. Mark. Manag. 2019, 14, 100387. [Google Scholar] [CrossRef]
  24. Escobar-Farfán, M.; Cervera-Taulet, A.; Schlesinger, W. Destination brand identity: Challenges, opportunities, and future research agenda. Cogent Soc. Sci. 2024, 10, 2302803. [Google Scholar] [CrossRef]
  25. Sun, S.; Wang, L.; Zhao, E.; Wang, S. How do tourists perceive churches as tourism destinations? A text mining approach through online reviews. Int. J. Tour. Res. 2024, 26, e2711. [Google Scholar] [CrossRef]
  26. Chemin, M.; Silva, C.P.d.; Vikou, S.V.d.P. User-generated content (UGC) in tourist attractions and destinations: Systematic literature review and perspectives for management. PASOS Rev. Tur. Patrim. Cult. 2025, 23, 539–562. [Google Scholar] [CrossRef]
  27. Li, J.; Dai, T.; Yin, S.; Zhao, Y.; Kaya, D.I.; Yang, L. Promoting conservation or change? The UNESCO label of world heritage (re)shaping urban morphology in the Old Town of Lijiang, China. Front. Archit. Res. 2022, 11, 1121–1133. [Google Scholar] [CrossRef]
  28. Li, J.; Krishnamurthy, S.; Pereira Roders, A.; van Wesemael, P. Imagine the Old Town of Lijiang: Contextualising community participation for urban heritage management in China. Habitat Int. 2021, 108, 102321. [Google Scholar] [CrossRef]
  29. Durie, A.J. Tourism and National Identity. Heritage and Nationhood in Scotland. Tour. Manag. 2015, 48, 414–415. [Google Scholar] [CrossRef]
  30. Loulanski, T.; Loulanski, V. The sustainable integration of cultural heritage and tourism: A meta-study. J. Sustain. Tour. 2011, 19, 837–862. [Google Scholar] [CrossRef]
  31. Ortega, B.; Ribeiro, M.A. An index of the economic dependence on Tourism. Tour. Econ. 2024, 31, 426–452. [Google Scholar] [CrossRef]
  32. Anindhita, T.A.; Zielinski, S.; Milanes, C.B.; Ahn, Y. The Protection of Natural and Cultural Landscapes through Community-Based Tourism: The Case of the Indigenous Kamoro Tribe in West Papua, Indonesia. Land 2024, 13, 1237. [Google Scholar] [CrossRef]
  33. Muštra, V.; Perić, B.Š.; Pivčević, S. Cultural heritage sites, tourism and regional economic resilience. Pap. Reg. Sci. Assoc. 2023, 102, 465–483. [Google Scholar] [CrossRef]
  34. Urry, J. The Tourist Gaze; SAGE: Thousand Oaks, CA, USA, 2002. [Google Scholar]
  35. Lee, Y. Destination fascination, well-being, and the reasonable person model of behavioural intention in heritage tourism. Curr. Issues Tour. 2023, 27, 288–304. [Google Scholar] [CrossRef]
  36. Yang, W.; Chen, Q.; Huang, X.; Xie, M.; Guo, Q. How do aesthetics and tourist involvement influence cultural identity in heritage tourism? The mediating role of mental experience. Front. Psychol. 2022, 13, 990030. [Google Scholar] [CrossRef] [PubMed]
  37. Prentice, R.; Andersen, V. Interpreting heritage essentialisms: Familiarity and felt history. Tour. Manag. 2006, 28, 661–676. [Google Scholar] [CrossRef]
  38. Dai, T.; Zheng, X.; Yan, J. Contradictory or aligned? The nexus between authenticity in heritage conservation and heritage tourism, and its impact on satisfaction. Habitat Int. 2020, 107, 102307. [Google Scholar] [CrossRef]
  39. Jv, X.; Liu, X.; Wang, F. Authentic perception experience of tourists in traditional agricultural cultural heritage village: Scale development and validation. Tour. Hosp. Res. 2024, 14673584241285174. [Google Scholar] [CrossRef]
  40. Leong, A.M.W.; Yeh, S.-S.; Zhou, Y.; Hung, C.-W.; Huan, T.-C. Exploring the influence of historical storytelling on cultural heritage tourists’ value co-creation using tour guide interaction and authentic place as mediators. Tour. Manag. Perspect. 2024, 50, 101198. [Google Scholar] [CrossRef]
  41. Yang, L.; Li, X.; Hernández-Lara, A.B. Tourism and COVID-19 in China: Recovery and resilience strategies of main Chinese tourism cities. Int. J. Tour. Cities 2022, 10, 387–404. [Google Scholar] [CrossRef]
  42. Liu, Y. Research on Tourism Experience of Historical and Cultural Blocks. In Proceedings of the 2018 7th International Conference on Social Science, Education and Humanities Research, Xi’an, China, 15–16 December 2018. [Google Scholar]
  43. Zeng, X.; Zhang, C.; Xu, D. Developing and validating a scale to measure perceived cultural atmosphere in historic districts. Asia Pac. J. Tour. Res. 2024, 29, 1152–1169. [Google Scholar] [CrossRef]
  44. Ye, Y.; Zhao, T.; Shi, X.; Liu, P.; Fei, T. The identification of cultural genes in historic districts and their influences on cultural perception: A case study in Central Street in Harbin, China. J. Asian Archit. Build. Eng. 2024, 1–17. [Google Scholar] [CrossRef]
  45. Josiassen, A.; Assaf, A.G.; Woo, L.; Kock, F. The Imagery-Image Duality Model. J. Travel Res. 2015, 55, 789–803. [Google Scholar] [CrossRef]
  46. Pike, S. Destination image analysis-a review of 142 papers from 1973 to 2000. Tour. Manag. 2002, 23, 541–549. [Google Scholar] [CrossRef]
  47. Chon, K. The role of destination image in tourism: A review and discussion. Tour. Rev. 1990, 45, 2–9. [Google Scholar] [CrossRef]
  48. Chon, K. The role of destination image in tourism: An extension. Tour. Rev. 1992, 47, 2–8. [Google Scholar] [CrossRef]
  49. Embacher, J.; Buttle, F. A Repertory Grid Analysis Of Austria’s Image As A Summer Vacation Destination. J. Travel Res. 1989, 27, 3–7. [Google Scholar] [CrossRef]
  50. Lai, K.; Li, X. Tourism Destination Image. J. Travel Res. 2015, 55, 1065–1080. [Google Scholar] [CrossRef]
  51. Gartner, W.C. Tourism Image: Attribute Measurement of State Tourism Products Using Multidimensional Scaling Techniques. J. Travel Res. 1989, 28, 16–20. [Google Scholar] [CrossRef]
  52. Gartner, W.C. Image Formation Process. J. Travel Tour. Mark. 1994, 2, 191–216. [Google Scholar] [CrossRef]
  53. Pan, B.; Li, X. The long tail of destination image and online marketing. Ann. Tour. Res. 2010, 38, 132–152. [Google Scholar] [CrossRef]
  54. Carvalho, M.a.M. Factors affecting future travel intentions: Awareness, image, past visitation and risk perception. Int. J. Tour. Cities 2022, 8, 761–778. [Google Scholar] [CrossRef]
  55. Agapito, D.; Pinto, P.; Mendes, J. Tourists’ memories, sensory impressions and loyalty: In loco and post-visit study in Southwest Portugal. Tour. Manag. 2016, 58, 108–118. [Google Scholar] [CrossRef]
  56. Lee, T.H.; Hsu, F.Y. Examining How Attending Motivation and Satisfaction Affects the Loyalty for Attendees at Aboriginal Festivals. Int. J. Tour. Res. 2011, 15, 18–34. [Google Scholar] [CrossRef]
  57. Echtner, C.M.; Ritchie, J.R.B. The measurement of destination image: An empirical assessment. J. Travel Res. 1993, 31, 3–13. [Google Scholar] [CrossRef]
  58. Gartner, W.C. Temporal influences on image change. Ann. Tour. Res. 1986, 13, 635–644. [Google Scholar] [CrossRef]
  59. Gartner, W.C.; Hunt, J.D. An analysis of state image change over a twelve-year period (1971–1983). J. Travel Res. 1987, 26, 15–19. [Google Scholar] [CrossRef]
  60. Tasci, A.D.A.; Holecek, D.F. Assessment of image change over time: The case of Michigan. J. Vacat. Mark. 2007, 13, 359–369. [Google Scholar] [CrossRef]
  61. Li, X.; Kaplanidou, K. The impact of the 2008 Beijing Olympic Games on China’s destination brand. J. Hosp. Tour. Res. 2011, 37, 237–261. [Google Scholar] [CrossRef]
  62. Rittichainuwat, B.; Laws, E.; Maunchontham, R.; Rattanaphinanchai, S.; Muttamara, S.; Mouton, K.; Lin, Y.; Suksai, C. Resilience to crises of Thai MICE stakeholders: A longitudinal study of the destination image of Thailand as a MICE destination. Tour. Manag. Perspect. 2020, 35, 100704. [Google Scholar] [CrossRef]
  63. Balakrishnan, J.; Sambasivan, M. Impact of COVID-19 on tourism image, commitment and ownership: A longitudinal comparison. Int. J. Tour. Cities 2022, 8, 1042–1061. [Google Scholar] [CrossRef]
  64. Zhang, Z.; Luo, M.; Luo, Z.; Niu, H. The international city image of Beijing: A quantitative analysis based on Twitter texts from 2017–2021. Sustainability 2022, 14, 10675. [Google Scholar] [CrossRef]
  65. Liu, M.T.; Liu, Y.; Mo, Z.; Ng, K.L. Using text mining to track changes in travel destination image: The case of Macau. Asia Pac. J. Mark. Logist. 2020, 33, 371–393. [Google Scholar] [CrossRef]
  66. Stepchenkova, S.; Mills, J.E. Destination image: A meta-analysis of 2000–2007 research. J. Hosp. Mark. Manag. 2010, 19, 575–609. [Google Scholar] [CrossRef]
  67. Xiang, Z.; Gretzel, U. Role of social media in online travel information search. Tour. Manag. 2010, 31, 179–188. [Google Scholar] [CrossRef]
  68. Huang, X.; Han, Y.; Meng, Q.; Zeng, X.; Liao, H. Do the DMO and the Tourists Deliver the Similar Image? Research on Representation of the Health Destination Image Based on UGC and the Theory of Discourse Power: A Case Study of Bama, China. Sustainability 2022, 14, 953. [Google Scholar] [CrossRef]
  69. Költringer, C.; Dickinger, A. Analyzing destination branding and image from online sources: A web content mining approach. J. Bus. Res. 2015, 68, 1836–1843. [Google Scholar] [CrossRef]
  70. Hardt, D.; Glückstad, F.K. A social media analysis of travel preferences and attitudes, before and during COVID-19. Tour. Manag. 2024, 100, 104821. [Google Scholar] [CrossRef]
  71. Peng, H.; Huang, J.; Li, X.; Dong, D.; Fan, P. Topic Extraction Based on LDA and Its Application in Tourism. In Proceedings of the AIoTC, Mumbai, India, 2–5 June 2022; pp. 52–57. [Google Scholar]
  72. Barnett, G.A.; Calabrese, C.; Ruiz, J.B. A comparison of three methods to determine the subject matter in textual data. Front. Res. Metr. Anal. 2023, 8, 1104691. [Google Scholar] [CrossRef]
  73. Li, X.; Geng, S.; Liu, S. Social network analysis on tourists’ perceived image of tropical forest park: Implications for niche tourism. SAGE Open 2022, 12, 21582440211067243. [Google Scholar] [CrossRef]
  74. Ding, J.; Tao, Z.; Hou, M.; Chen, D.; Wang, L. A comparative study of perceptions of destination image based on content mining: Fengjing Ancient Town and Zhaojialou Ancient Town as examples. Land 2023, 12, 1954. [Google Scholar] [CrossRef]
  75. Yang, S.; Zhang, M. Changes in tourism destination image of Guangzhou. J. Serv. Sci. Manag. 2020, 13, 594–616. [Google Scholar] [CrossRef]
  76. Guo, X.; Pesonen, J.; Komppula, R. Analysing online travel reviews to identify temporal changes of a destination image. Eur. J. Tour. Res. 2022, 32, 3209. [Google Scholar] [CrossRef]
  77. UNESCO. Old Town of Lijiang. Available online: https://whc.unesco.org/en/list/811 (accessed on 5 January 2025).
  78. Airey, D.; Chong, K. Tourism in China: Policy and Development Since 1949; Routledge: London, UK, 2011. [Google Scholar] [CrossRef]
  79. Shao, Y. Conservation and Sustainable development of Human-inhabited World Heritage Site: Case of World Heritage Lijiang Old Town. Built Herit. 2017, 1, 51–63. [Google Scholar] [CrossRef]
  80. Zhao, M.; Li, P.; Chen, C.; Bian, Z. Continuous Space Production of Living Heritage Sites Based on TSL Model: A Case Study of the Old Town of Lijiang. Trop. Geogr. 2022, 42, 67–77. [Google Scholar] [CrossRef]
  81. China National Tourism Administration (CNTA). Notice on Severe Warning Issued to Lijiang Old Town. Available online: https://www.gov.cn/xinwen/2017-02/25/content_5170975.htm (accessed on 10 January 2025).
  82. National Health Commission of China. Announcement No. 7 of 2022 of the National Health Commission. Available online: https://www.gov.cn/zhengce/zhengceku/2022-12/26/content_5733669.htm (accessed on 5 January 2025).
  83. Baker, P. A year to remember? Int. J. Corpus Linguist. 2023, 28, 407–429. [Google Scholar] [CrossRef]
  84. Wang, X. Modeling word relatedness in latent dirichlet allocation. arXiv 2014, arXiv:1411.2328. [Google Scholar] [CrossRef]
  85. Alvarez-Hamelin, J.I.; Dall’Asta, L.; Barrat, A.; Vespignani, A. How the k-core decomposition helps in understanding the internet topology. In Proceedings of the ISMA Workshop on the Internet Topology, San Diego, CA, USA, 10–12 May 2006. [Google Scholar]
  86. Newman, M.E. The structure and function of complex networks. SIAM Rev. 2003, 45, 167–256. [Google Scholar] [CrossRef]
  87. Blei, D.M.; Ng, A.Y.; Jordan, M.I. Latent Dirichlet Allocation. J. Mach. Learn. Res. 2003, 3, 993–1022. [Google Scholar]
  88. Hu, S.; Wu, X.; Cang, Y. Exploring business environment policy changes in China using quantitative text analysis. Sustainability 2024, 16, 2159. [Google Scholar] [CrossRef]
  89. Sievert, C.; Shirley, K. LDAvis: A method for visualizing and interpreting topics. In Proceedings of the Workshop on Interactive Language Learning, Visualization, and Interfaces, Baltimore, MD, USA, 27 June 2014; pp. 63–70. [Google Scholar]
  90. Wang, J.; Li, L.; Wu, X. LDA-based topic strength analysis. Comput. Inform. 2017, 36, 1283–1311. [Google Scholar] [CrossRef]
  91. Mohamad Noor, F.A.; Nair, V.; Mura, P. Conceptualizing a framework for slow tourism in a rural destination in Malaysia. Adv. Sci. Lett. 2015, 21, 1185–1188. [Google Scholar] [CrossRef]
  92. Sun, X.; Xu, H. Lifestyle tourism entrepreneurs’ mobility motivations: A case study on Dali and Lijiang, China. Tour. Manag. Perspect. 2017, 24, 64–71. [Google Scholar] [CrossRef]
  93. Wu, Z.; Ling, W.; Ma, J. Slow-Living Experience of Ancient Town Tourism: Grounded Theory Analysis on Travel Notes of Lijiang Ancient Town. Trop. Geogr. 2024, 44, 123–135. [Google Scholar] [CrossRef]
  94. Guiver, J.; McGrath, P. Slow tourism: Exploração de discursos. Dos Algarves Tour. Hosp. Manag. J. 2017, 27, 11–34. [Google Scholar] [CrossRef]
  95. MacCannell, D. Staged Authenticity: Arrangements of Social Space in Tourist Settings. Am. J. Sociol. 1973, 79, 589–603. [Google Scholar] [CrossRef]
Figure 1. Views of Lijiang Old Town (Photo by authors, 2019).
Sustainability 17 05476 g001
Figure 2. Number of tourists and revenue of tourism in Lijiang City (Source: Lijiang statistical book 2017–2023, draw: by author).
Sustainability 17 05476 g002
Figure 3. Word clouds of online reviews, before, during, and after the pandemic.
Sustainability 17 05476 g003
Figure 4. The shifts of shared TF-IDF-weighted terms across stages.
Sustainability 17 05476 g004
Figure 5. Semantic network of D1.
Sustainability 17 05476 g005
Figure 6. Semantic network of D2.
Sustainability 17 05476 g006
Figure 7. Semantic network of D3.
Sustainability 17 05476 g007
Figure 8. Coherence results of three datasets before, during, and after the pandemic.
Sustainability 17 05476 g008
Figure 9. Evolution of DI’s themes before, during, and after the pandemic.
Sustainability 17 05476 g009
Table 1. Number of posts and authors before, during, and after COVID-19.
No. of Period PeriodNumber of Posts
D1Before COVID-191 January 2017–20 January 202018,599
D2During COVID-1920 January 2020–8 January 202314,671
D3After COVID-198 January 2023–20 October 202416,752
Source: by authors.
Table 2. SNA metrics for cultural and historical evolution.
PeriodEdges (Top 5)Edge WeightNode (Top 5)Betweenness CentralityCloseness Centrality
D1Naxi-Naxi people1484Mu family mansion0.08310.5750
guided interpretation-tour guide1348Naxi people0.02290.5565
Mu family mansion-guided interpretation1244worth0.04550.5565
Mu family mansion-tour guide1138good0.03820.5656
Mu family mansion-architecture1110culture0.01530.5391
D2Naxi-Naxi people1056Mu family mansion0.04150.4839
culture-history594culture0.00980.5128
culture-Naxi people524architecture0.00680.4918
Mu family mansion-architecture472Naxi people0.00610.4724
Mu family mansion-history460history0.00030.4255
D3Mu family mansion-guided interpretation1160Mu family mansion0.16710.6067
guided interpretation-free of charge1018culture0.01860.4696
guided interpretation-tour guide954history0.00480.4576
Mu family mansion-history896architecture0.00470.4252
history-culture828ticket0.00000.4030
Source: by authors.
Table 3. SNA Metrics for Commercialization and Business Evolution.
PeriodEdges (Top 5)Edge WeightNode (Top5)Betweenness CentralityCloseness Centrality
D1commercialization-business1826evening0.1273420.5750
business-atmosphere728bar0.0724710.5656
bar-lively660characteristic0.0119510.5433
Sifang street-center520business0.0308450.5188
bar-business506inn0.0235190.5074
D2business-atmosphere886commercialization00.441176
commercialization-business2022atmosphere00.431655
--business0.0047950.512821
commercialization-business1668evening0.0566490.435484
business-atmosphere646Yunnan0.0537160.490909
D3evening-daytime634old town0.0281770.477876
evening-lively632pretty0.0209420.432
commercialization-business1826evening0.1273420.5750
business-atmosphere728bar0.0724710.5656
bar-lively660characteristic0.0119510.5433
Source: by authors.
Table 4. Distribution of LDA topics across three periods with attention and strength scores.
Topic IDTopic LabelAttention Strength
D1-T0Cultural and natural heritage8.75%0.0947
D1-T1Mu family mansion history and guided tour10.39%0.1125
D1-T2Commercial Streets and Bar Culture14.89%0.1612
D1-T3Viewing experience of Lion Hill and Wangu Tower4.99%0.0541
D1-T4Local slow-paced lifestyle experience23.58%0.2552
D1-T5Related regional tourism routes14.46%0.1565
D1-T6Local dining and performance culture experience5.81%0.0629
D1-T7Scenic area spending and ticket management9.50%0.1028
D2-T0Central old town attractions and local cuisine11.18%0.0908
D2-T1Mu family mansion history and guided tour7.65%0.0621
D2-T2Night view experience6.37%0.0517
D2-T3Viewing experience of Lion Hill and Wangu Tower7.15%0.0581
D2-T4Local slow-paced lifestyle experience33.96%0.2759
D2-T5Related regional tourism routes16.09%0.1307
D2-T6Cultural and natural heritage11.32%0.0920
D2-T7Visual experience and services19.71%0.1601
D2-T8Accommodation services and management9.68%0.0786
D3-T0Cultural performance and scene-based experience11.03%0.1335
D3-T1Mu family mansion history and guided tour16.24%0.1966
D3-T2Contested Access and Management Response10.52%0.1274
D3-T3Scenic Viewpoints and Visitor Recommendations23.39%0.2833
D3-T4Commercial Streets and Bar Culture 9.19%0.1113
D3-T5Balancing Local Culture and Commercial Tourism5.37%0.0650
D3-T6Cultural and natural heritage6.84%0.0828
Source: by authors.
Disclaimer/Publisher’s Note: The statements, opinions and data contained in all publications are solely those of the individual author(s) and contributor(s) and not of MDPI and/or the editor(s). MDPI and/or the editor(s) disclaim responsibility for any injury to people or property resulting from any ideas, methods, instructions or products referred to in the content.

