Article

Analysis of Ecological Environment Changes and Influencing Factors in the Upper Reaches of the Yellow River Based on the Remote Sensing Ecological Index

1
Faculty of Geomatics, Lanzhou Jiaotong University, Lanzhou 730070, China
2
Key Laboratory of Remote Sensing of Gansu Province, Heihe Remote Sensing Experimental Research Station, State Key Laboratory of Cryospheric Science and Frozen Soil Engineering, Northwest Institute of Eco-Environment and Resources, Chinese Academy of Sciences, Lanzhou 730000, China
3
University of Chinese Academy of Sciences, Beijing 100094, China
*
Author to whom correspondence should be addressed.
Sustainability 2025, 17(12), 5410; https://doi.org/10.3390/su17125410
Submission received: 11 April 2025 / Revised: 23 May 2025 / Accepted: 6 June 2025 / Published: 11 June 2025
(This article belongs to the Section Environmental Sustainability and Applications)

Abstract

The Upper Yellow River Region plays an irreplaceable role in water conservation and ecological protection in China. Due to both natural and human-induced factors, this area has experienced significant grassland deterioration, land desertification, and salinization. Consequently, evaluating the region’s environmental status plays a vital role in promoting ecological conservation and sustainable growth in the Upper Yellow River Basin. This study constructed an ecological index based on remote-sensing data and examined its spatiotemporal changes from 1990 to 2020. Future ecological dynamics were predicted using the Hurst index, while key influencing factors were examined through an optimal-parameter-based GeoDetector and geographically weighted regression. The findings revealed the following: (1) RSEI values were generally lower in the north and increased progressively toward the south, indicating a notable spatial disparity. (2) Ecological conditions remained largely stable, with notable improvements observed in 65.47% of the study area. (3) It was anticipated that 52.76% of the region would continue to improve, whereas 24% is expected to experience further degradation. (4) Precipitation, temperature, elevation, and land cover were major factors contributing to ecological variation. Their impact on ecological quality varies across different geographic locations. These research findings provided references for the sustainable development and ecological civilization construction of the Upper Yellow River Region.

1. Introduction

The Yellow River, China’s second longest, plays a vital role not only as a primary water resource but also as a key component in maintaining the ecological equilibrium across its path. It flows through China’s arid and semi-arid regions, providing essential moisture for vegetation along its banks and supporting the protection and maintenance of regional biodiversity. The ecological health of the Yellow River Basin is closely linked to the environmental stability of adjacent regions, making it a vital natural buffer and an important economic hub in China. Safeguarding the Yellow River Basin’s environment is vital for regional ecological stability and promoting long-term economic and social progress [1]. Despite abundant resources, its ecological environment remains highly vulnerable, presenting substantial challenges for both ecological conservation and long-term development. The increasing global population and rapid urbanization are exacerbating the pressures on ecosystems [2]. Environmental issues such as soil erosion, grassland degradation, desertification, and salinization are worsening. The loss of biodiversity and the degradation of habitats represent significant threats to the ecosystem [3]. Therefore, scientifically assessing ecological changes in the Upper Yellow River Region, along with evaluating environmental quality and the factors influencing it, holds great practical significance [4]. By studying changes in the ecological environment, we can promptly identify signs of degradation, formulate targeted protection and restoration measures, and maintain ecosystem health. This, in turn, ensures a stable water supply for downstream agriculture, industry, and daily life, while also promoting the green development path of the upstream areas.
Traditional methods for assessing ecological quality typically rely on ground monitoring data and statistical analysis methods, which exhibit limited flexibility when applied across varying spatial and temporal scales. These methods are particularly inadequate for evaluating large-scale areas or long-term dynamic ecological changes as they often fail to capture the complexity and evolving trends of ecosystems. Remote sensing has rapidly become a focal point of academic research. Due to its efficiency, accuracy, and objectivity in acquiring land surface information, it has become a vital tool in ecological environment quality assessment and monitoring [5]. As an integrated tool, it provides rich multi-dimensional and multi-temporal data, offering robust technical support for ecological status evaluation and dynamic monitoring across various spatial scales [6]. In practical applications, many researchers focus on the spatiotemporal dynamics of ecological changes by extracting key ecological indicators from satellite imagery. For example, Jiang et al. [7] employed the NDVI to analyze the changes in China’s ecological environment, while Taripanah and Ranjbar [8] explored how Land Surface Temperature (LST) is distributed across space and its associations with hydrology, topography, and socio-economic factors. These studies, focusing on individual ecological indicators, provide valuable insights into regional ecological changes. Owing to the heterogeneous and multi-faceted structure of ecosystems, it is often challenging to holistically represent the interplay among all constituent elements [9]. With a deeper understanding of ecosystem complexity, researchers are increasingly adopting comprehensive ecological indicators to offer a more thorough representation of regional ecological conditions and trends in change [10]. For example, Jing et al. [11] used the Ecological Index (EI) to assess ecological protection in the Ebinur Lake wetland, incorporating indicators like species richness, plant coverage, and hydrological features. However, this method depends on statistical data, limiting its applicability in areas with complex topography, and may not provide high-precision spatial and temporal assessments in regions experiencing significant dynamic changes. Meanwhile, Sun et al. [12] applied the Analytic Hierarchy Process (AHP) in assessing ecosystem status; however, its outcomes are often influenced by subjective weighting, which may compromise precision. In response to the shortcomings of conventional methods for assessing ecological quality, Xu [13] introduced the Remote Sensing Ecological Index (RSEI), providing a novel approach to ecological quality assessment. The RSEI incorporates four key indicators: greenness (NDVI), humidity (WET), heat (LST), and dryness (NDBSI). The indicators are readily extracted from satellite data and their weights are objectively determined via Principal Component Analysis (PCA), thus removing the subjectivity inherent in manually assigning weights in conventional methods. This automated weighting enhances the clarity, consistency, and reliability of capturing regional ecological dynamics. Due to its easy accessibility and high reliability, the RSEI effectively captures the complexities of regional ecological changes, rendering it especially suitable for monitoring areas with diverse and dynamic ecological conditions [14]. RSEI has gained widespread use in the assessment and monitoring of ecological quality at regional scales. For example, Jiang et al. [15] utilized this method to monitor the ecological conditions across arid desert landscapes, while Yue et al. [16] used it to evaluate the ecological quality of urban agglomerations in China. The RSEI has been proven to be a reliable and adaptable tool for evaluating complex ecological environments, and it is fundamental to formulating strategies aimed at environmental conservation and sustainable growth.
The ecological environment is shaped by the interaction of natural elements and anthropogenic actions, with the influencing mechanisms showing notable regional variation [17]. To gain deeper insights into these influencing factors and their mechanisms, researchers have extensively utilized a range of analytical techniques in the study of ecological systems. For example, Das et al. [18] employed a multiple linear regression model to examine the effects of various remote-sensing factors on the quality of ecological spaces. Similarly, Lv et al. [19] utilized the geographically weighted regression (GWR) approach to examine how ecological quality varies across Shanxi Province, revealing that temperature, elevation, and terrain slope significantly influence its spatial patterns. However, traditional methods often assume independent, linear relationships between variables, limiting their ability to capture complex interactions among multiple factors. This is particularly evident in studies examining the combined effects of natural conditions and human activities on ecosystems, where fully capturing their dynamic interactions remains a challenge [20]. To address the limitations of traditional methods, the Geographical Detector (GD) model has emerged as an innovative tool in ecological and environmental research. The GD model quantifies the relationship between influencing factors and the target variable, revealing both their independent effects and interactions. Its primary advantage lies in its ability to assess how these factors interact and quantify their collective impact on the ecological environment, overcoming the limitations of traditional methods in addressing complex multi-variable interactions [21]. Despite its strong performance in uncovering multi-faceted interactions, the GD model’s reliance on subjective parameter settings often lacks a precise quantitative basis, which can limit the accuracy of its results. To overcome this limitation, researchers have developed the optimal-parameter-based Geographical Detector (OPGD) model as an improved approach [22]. The OPGD model enhances the detection of key factors and their nonlinear interactions by optimizing parameters and segmenting variables, enabling a more precise evaluation of their impacts on the ecological environment. When combined with GWR, which captures spatial heterogeneity, this integrated approach provides both accurate factor identification and detailed spatial analysis, offering stronger support for ecological protection and management.
The research targeted the Upper Yellow River Region, employing Landsat remote-sensing imagery to compute the RSEI. A trend analysis method was employed to examine both the improvement and degradation of ecological quality within the study area. In order to thoroughly investigate the factors influencing ecological environmental quality in the upper reaches of the Yellow River, a combined approach using the OPGD model and GWR was employed for the quantitative analysis. This study examined both the influence of single variables and the combined effects arising from their interplay on ecological environment quality. Finally, leveraging the Hurst exponent—a metric that quantifies persistence in temporal data and helps distinguish between persistent, anti-persistent, or random behaviors—the future ecological trends of the Upper Yellow River were forecasted. Given its effectiveness in revealing the continuity and predictability of temporal changes, the Hurst exponent is suitable for assessing ecological evolution in this study.

2. Materials and Methods
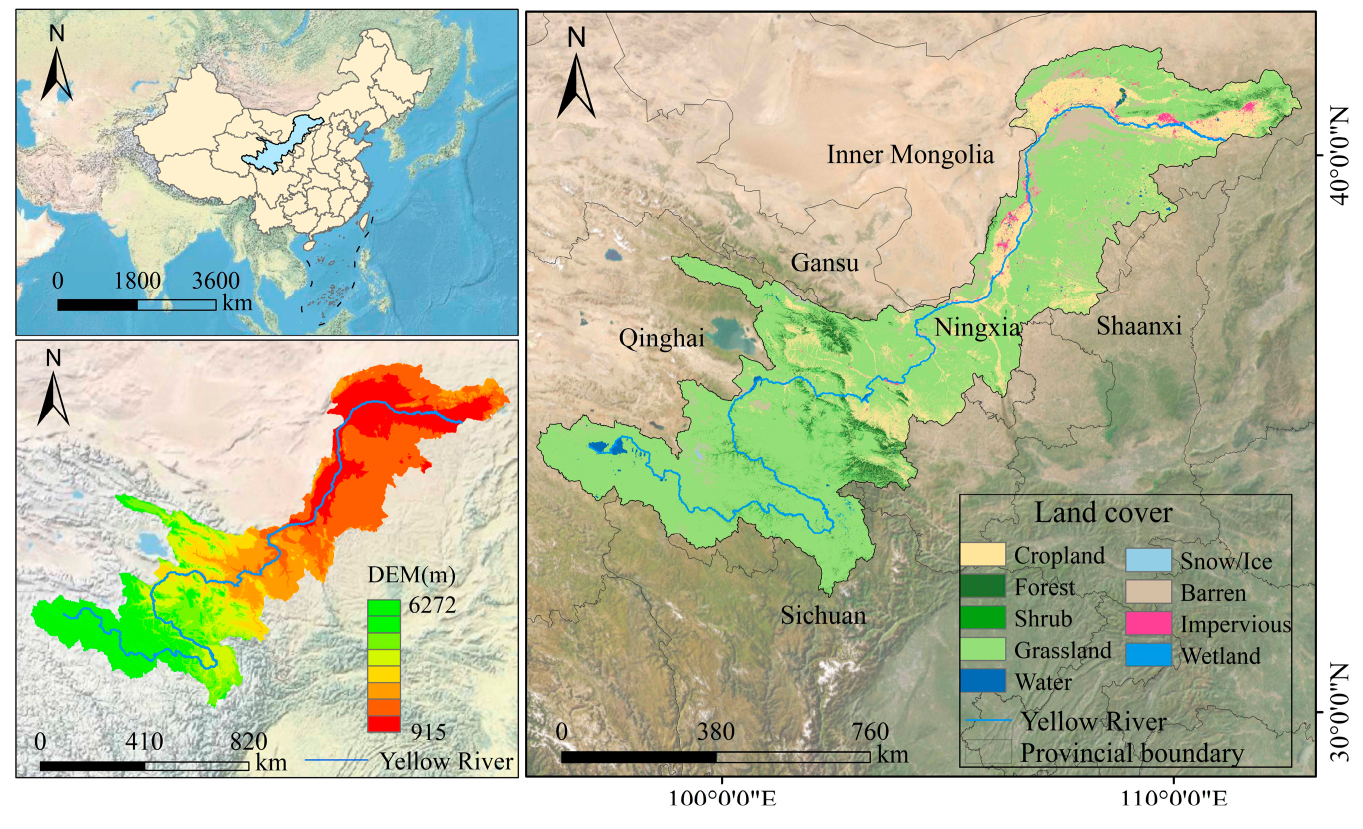
2.1. Study Area

The upper reaches of the Yellow River (E: 95°53′–112°49′, N: 32°9′–41°50′) extend for a total of 3472 km (Figure 1). Covering 51.3% of the Yellow River’s catchment, the upper basin spans parts of Qinghai, Sichuan, Gansu, Ningxia, and Inner Mongolia [23]. This section of the river experiences a total elevation drop of 3496 m and receives inflow from 43 larger tributaries (each with a basin area exceeding 1000 k m 2 ), which contribute 54% of the river’s total runoff. The annual sediment yield from the upper reaches constitutes only 8% of the total annual sediment yield of the entire river, thereby characterizing it as a source of clearer water compared to other sections of the river. The Yellow River flows through the Ningxia and Hetao Plains, regions characterized by a network of crisscrossing canals and flat, open terrain—thus making them one of the earliest agricultural development zones in this region—that lies at the transitional zone between China’s first and second topographic steps, exhibiting geographic patterns such as a cold, plateau climate as well as arid and semi-arid climates. Precipitation is scant and unevenly distributed both temporally and spatially, with most of the rainfall occurring during the summer, accompanied by considerable interannual variability. Moreover, evaporation rates substantially exceed precipitation levels, further exacerbating the scarcity of water resources in this area. This area consists mainly of desert landscapes, including Gobi and arid grasslands—ecosystems marked by ecological fragility, sparse drought-tolerant vegetation, and limited capacity for natural recovery. Intensifying anthropogenic impacts and shifting climatic patterns have jointly contributed to reduced runoff, flow interruptions in certain tributaries, low compliance with ecological flow targets, and weakened ecological functions along the river corridor [24]. The upper reaches of the Yellow River are characterized by unique geography and climate, a fragile ecosystem, scarce and unevenly distributed water resources, and limited sediment transport. Nevertheless, intensified anthropogenic disturbances coupled with climate variability have led to diminished runoff, ecosystem deterioration, and growing obstacles to the effective stewardship of both water systems and ecological assets.

2.2. Data Sources

Landsat-derived surface reflectance data served as the main input for analyzing spatiotemporal dynamics in the ecological conditions of the Upper Yellow River Basin. The data products underwent rigorous geometric, radiometric, and atmospheric corrections to ensure their accuracy and quality. The Google Earth Engine (GEE) was employed to handle imagery captured between June and September for the years 1990 to 2020 at five-year intervals. These specific years were selected at 5-year intervals to provide a balanced temporal resolution for long-term trend analysis while minimizing data redundancy. The intervals were aligned with the availability and consistency of Landsat data and were utilized for capturing major ecological and socio-economic changes in the study area. Choosing consistent time intervals helped to avoid bias that could arise from irregular sampling and ensured comparability across different years. By leveraging GEE’s efficient data processing capabilities and computational resources, the imagery was preprocessed using a cloud detection algorithm to remove clouds and cloud shadows. Additionally, water body masking was performed to improve data accuracy and maintain uniformity.
To explore the factors influencing ecological environment change, this study drew on existing research and selected eight key factors covering various dimensions such as climate, topography, land use, and socio-economic conditions [25,26]. These influencing factor data included temperature (TEM), precipitation (PRE), digital elevation model (DEM), slope, land cover types, soil type, GDP, and population density (POP). Temperature and precipitation datasets at a spatial resolution of 1 km were obtained from the National Earth System Science Data Center. Data on the DEM, slope, soil type, GDP, and population density were obtained from the Resource and Environment Science Data Platform, with the DEM provided at 30 m resolution and the remaining datasets at 1 km resolution. CLCD was a 30-m-spatial-resolution dataset published by Huang from Wuhan University [27]. The data sources are listed in Table 1. Taking into account the specific traits of the region, the Upper Yellow River area was partitioned into 5 km × 5 km units to ensure consistency in scale and shape across diverse datasets. Variable values were obtained through point-based grid extraction. To ensure spatial consistency of datasets with different resolutions, we performed resampling according to the variable type. Continuous variables were resampled using bilinear interpolation to maintain spatial continuity, while categorical variables were processed using majority resampling to maintain the subject integrity of the data. Although unifying all data might have introduced potential mixed pixel effects, the selected resampling strategy effectively reduced information loss and helped maintain the reliability and accuracy of the analysis results.
Bilinear Interpolation: The corresponding position of the target pixel in the original image is the coordinate (x, y), and its four nearest neighbor pixels are f ( Q 11 ) = f ( x 1 , y 1 ) , f ( Q 12 ) = f ( x 1 , y 2 ) , f ( Q 21 ) = f ( x 2 , y 1 ) , and f ( Q 22 ) = f ( x 2 , y 2 ) . The interpolation value is outlined below:
f ( x , y ) = ( x 2 x ) ( y 2 y ) ( x 2 x 1 ) ( y 2 y 1 ) f ( Q 11 ) + ( x x 1 ) ( y 2 y ) ( x 2 x 1 ) ( y 2 y 1 ) f ( Q 21 )   + ( x 2 x ) ( y y 1 ) ( x 2 x 1 ) ( y 2 y 1 ) f ( Q 12 ) + ( x x 1 ) ( y y 1 ) ( x 2 x 1 ) ( y 2 y 1 ) f ( Q 22 )
Majority Resampling: Suppose the values of n pixels in the original image corresponding to the target pixel after resampling are { v 1 , v 2 , , v n } . Then, the output pixel value V is as follows:
V = mode ( v 1 , v 2 , , v n )

2.3. Methods

The research is organized into three sections (see Figure 2): first, calculating the RSEI; second, analyzing how the RSEI varied across space and time; and third, exploring the main influences on ecological quality in the Upper Yellow River area using OPGD alongside GWR models.

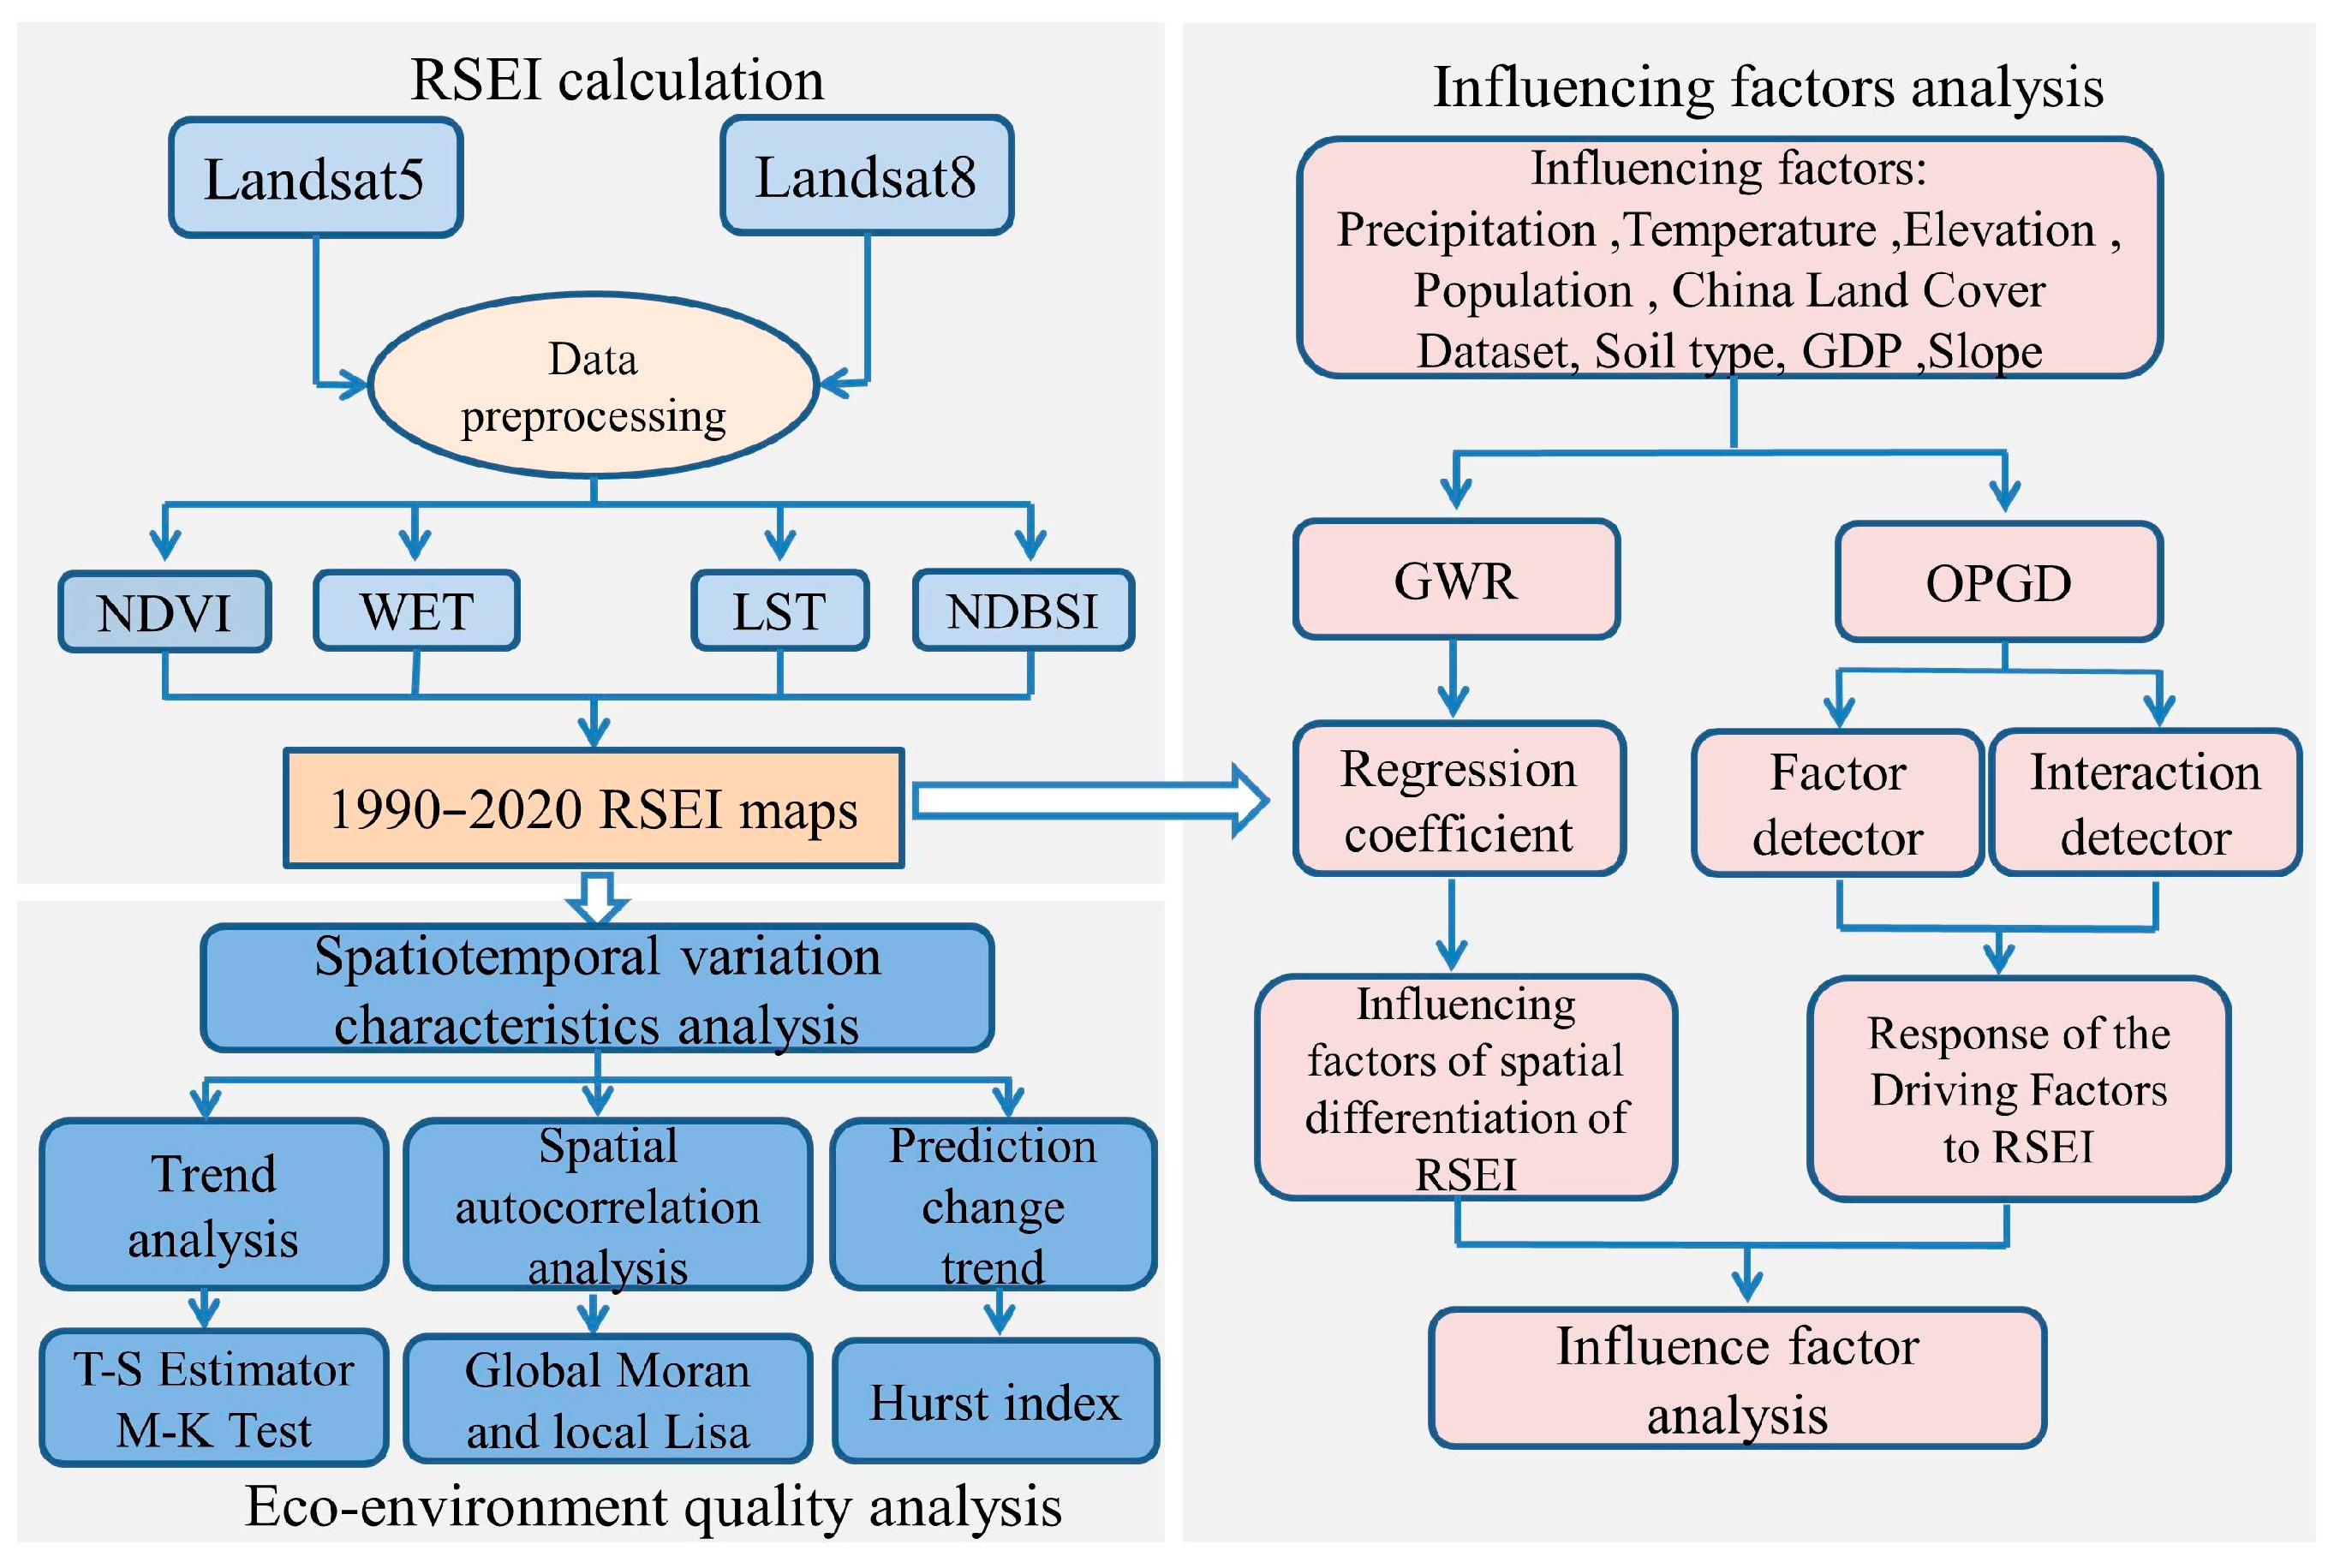
2.3.1. RSEI Calculation

The RSEI integrates indicators such as NDVI, WET, LST, and NDBSI to provide a holistic assessment of regional ecological conditions. Table 2 outlines the calculation method for each index.
RSEI = f ( NDVI , WET , NDBSI , LST )
To ensure the scientific validity and comparability of the four ecological assessment indicators, the original data were first standardized.
N i = ( I i I min ) ( I max I min )
where N i is the normalized value of a given indicator; I i represents the value of the indicator for pixel i; I max is the maximum value of the indicator; and I min is the minimum value of the indicator.
Subsequently, PCA was conducted. First, the four normalized indicators were combined into a multi-dimensional feature matrix, where n denotes the total count of pixels in the study region.
X = x 11 x 12 x 13 x 14 x 21 x 22 x 23 x 24 x n 1 x n 2 x n 3 x n 4
Each column of matrix X was mean-centered by subtracting its respective mean, resulting in a standardized matrix Z with zero mean.
z i j = x i j x ¯ j
The covariance matrix C was computed and, subsequently, subjected to eigenvalue decomposition, yielding the eigenvalues λ1, λ2, λ3, λ4, and their corresponding eigenvectors (i.e., principal component directions) e1, e2, e3, e4.
C = 1 n 1 Z T Z
Contribution rates of principal components measure their effectiveness in summarizing the original data’s information. The formula used for calculation is presented below:
p i = λ i j = 1 m λ j
where λ i denotes the eigenvalue linked to the i-th principal component; m indicates the number of original variables; j = 1 m λ j represents the sum of all eigenvalues.
The first principal component (PC1) is the result of a linear combination of the original variables with the eigenvector corresponding to the largest eigenvalue.
PC 1 = e 1 , 1 z i 1 + e 1 , 2 z i 2 + e 1 , 3 z i 3 + e 1 , 4 z i 4
where e 1 , j represents the coefficient of each variable in the direction of the first principal component, i.e., the weight of each ecological factor.
To ensure that larger PC1 values represent better ecological conditions, PC1 can be subtracted from 1 to obtain the initial ecological index RSEI0:
RSE I 0 = 1 { PC 1 [ f ( NDVI , WET , LST , NDBSI ) ] }
To facilitate the measurement and comparison of the indicators, RSEI0 can also be normalized accordingly.
RSEI = ( RSE I 0 RSE I 0 _ min ) ( RSE I 0 _ max RSE I 0 _ min )
Reflectance values for Landsat images in the blue, green, red, near-infrared, and two shortwave infrared bands are expressed as ρ b l u e ,   ρ g r e e n , ρ r e d , ρ N I R , ρ S W I R 1 , and ρ S W I R 2 . The variable T corresponds to the sensor’s radiance; λ to the central wavelength of the thermal band; ρ is a fixed constant; and ε indicates the emissivity of the surface.

2.3.2. T-S Slope Estimation and M-K Trend Test

Trend analysis compared metrics measured across various time intervals to directly assess variations and their extent, thereby evaluating developmental patterns. The ecological environment changes in the study area were evaluated through time-series trend analysis using the Mann–Kendall test alongside the Theil–Sen median estimator.
As a robust non-parametric technique, the Theil–Sen median estimator effectively identifies trends in data. This technique is resistant to measurement inaccuracies and outliers, which makes it especially appropriate for analyzing trends in extended time series [28]. When β is greater than 0.05, it reflects an improvement in the ecological status, while a β smaller than 0.05 indicates a downward trend in ecological quality. The trend β was computed using the following formula:
β = Median x j x i j i
where x i and x j are the values of i year and j year, respectively; Median is the statistical median function; β is defined as the median slope between paired data values.
Researchers typically use the Mann–Kendall test along with the Theil–Sen slope to assess trend significance in temporal datasets [29]. A Z-value with an absolute value greater than 1.96 (corresponding to p < 0.05) indicates statistical significance, while an absolute value of 1.96 or less indicates no significance. The equation is as follows:
Z = s V a r ( S ) ( S > 0 ) 0 ( S = 0 ) S + 1 V a r ( S ) ( S < 0 )
S = i = 1 n 1 j = i + 1 n sign ( x j x i )
sign ( θ ) = 1 ( θ > 0 ) 0 ( θ = 0 ) 1 ( θ < 0 )
V a r ( S ) = n ( n 1 ) ( 2 n + 5 ) 18
The variability in the dependent variable is assessed using the coefficient of variation, which is computed as the standard deviation divided by the mean. This index serves as an indicator of the stability of interannual variations in the ecological environment’s quality over time. A larger coefficient of variation indicated lower stability. To visually represent the stability of ecological environment quality changes, it was divided into four levels: very stable (cv ≤ 0.1); stable (0.1~0.2); unstable (0.2~0.3); and very unstable (cv > 0.3). The calculation formula is as follows:
c v = σ μ
where σ represents the standard deviation of the data; and μ represents the meaning.

2.3.3. Spatial Pattern Analysis

Spatial pattern analysis revealed the spatial distribution patterns of various elements within the study area and their interrelationships. It has been widely applied in extensive remote-sensing studies of environmental ecology [30]. This research utilized two widely adopted spatial statistical techniques: global spatial autocorrelation analysis and Local Indicators of Spatial Association (LISA). The global spatial autocorrelation method was applied to examine the general spatial distribution pattern of RSEI across the study region [31]. The global Moran’s I is calculated using the following formula:
Moran s   I = m × i = 1 m j = 1 m W i j ( P i P ) ( P j P ) i = 1 m j = 1 m W i j × i = 1 n ( P i P ) 2
where m represents the total number of jointly selected samples; P i and P j denote the attribute values at sample points located at positions i and j, respectively; P is the mean attribute value of all sampled points; and W i j is the weight between grid points in row i and column j. W i j is defined as 1 if the points are neighbors, and 0 otherwise.
LISA can reflect the local spatial autocorrelation of the attributes of the research objects. Even if the global Moran’s I was zero, there might have been local clustering phenomena. Therefore, it was necessary to combine LISA with a global Moran’s I analysis [32]. The formula is shown below:
LISA = ( P i P ) × j = 1 m W i j ( P j P ) i = 1 n ( P i P ) 2

2.3.4. Prediction of RSEI Trend Changes

The Hurst index provides a quantitative measure of the future dependency in sequential data, helping to assess if existing trends are likely to continue [33]. The Rescaled Range (R/S) method is used to compute the Hurst exponent of the environmental impact index, thereby indicating future ecological trends in the Upper Yellow River Region. The Hurst exponent varies between 0 and 1, with future trends categorized into five types as presented in Table 3. The formula for the calculation is provided below:
RSE I ( γ ) ¯ = 1 γ t = 1 γ R S E I ( t )
U ( t , γ ) = 1 γ ( RSE I ( t ) RSE I ( γ ) ¯ ) ( 1 t γ )
R ( γ ) = M a x 1 t γ U ( t , γ ) M i n 1 t γ U ( t , γ )
S ( γ ) = 1 γ t = 1 γ ( RSE I ( t ) RSE I ( γ ) ¯ ) 2 1 / 2
γ H = R ( γ ) S ( γ )
where RSE I ( t ) is the number of RSEI data points, with t = 1, 2, 3,… representing each time step; RSE I ( γ ) ¯ denotes the mean value of the sequence; U ( t , γ ) denotes the sequence of accumulated decreases; R ( γ ) is a range parameter; and S ( γ ) is the standard deviation.

2.3.5. OPGD and GWR Model

The OPGD model and GWR model provided a complementary analytical framework. The OPGD could identify the key driving factors affecting ecological quality and quantify their nonlinear interactions without relying on linear assumptions. However, it did not account for the spatial heterogeneity of these effects. In contrast, GWR effectively captured spatial variations in the relationships between variables but lacked the capacity to detect factor interactions. This integrated approach first employed OPGD to screen critical factors and assess their interactive influences, then applied GWR to explore their spatial heterogeneity. In doing so, it overcame the limitations of using a single method. The combined use of OPGD and GWR enabled both robust detection of driving mechanisms and detailed spatial interpretation.
Spatial heterogeneity constitutes an essential characteristic of geographic processes. The OPGD framework is employed as a statistical method for analyzing regional layered heterogeneity and uncovering its causal drivers [34]. In the process of applying the model, the optimal discretization method for continuous variables was determined by comparing five methods. By evaluating these methods, the best discretization technique and the ideal number of classifications were selected to achieve the most optimal results. The model comprises modules for identifying individual influencing factors as well as examining their combined interactions.
Factor Detection: This involves analyzing spatial variations in the ecological condition of the Yellow River’s upper basin. This step assesses how well the driving factors account for spatial variation in ecological environmental quality. If spatial variation is affected by factor X, a higher q value reflects a greater contribution of X to explaining this pattern. The value of q is calculated using the following equation:
q = 1 h = 1 L N h σ h 2 N σ 2
where h = 1, …, L denotes the strata levels of each factor; the explanatory power strengthens as the q value rises, with q varying between 0 and 1; N h and N denote the sample counts within the h-th stratum and across the whole study area; and variables σ h 2 and σ 2 correspond to the variances of samples in the h-th region and the whole study area.
Interaction Detection: By comparing the q values of individual and paired factors, one can assess whether the factors act independently or interactively, and further classify the nature of their interaction, thereby illustrating their combined influence on RSEI. First, compute the q statistics for X1 and X2 separately. Then, determine the q value associated with their combined spatial overlay.
Geographically weighted regression (GWR) is a commonly applied technique for capturing the spatial variation in regression associations at the local level [21]. The GWR equation is typically expressed in the following manner:
y i = β 0 ( u i , v i ) + β k ( u i , v i ) x i k + ε i
where y i stands for the estimated RSEI value corresponding to sample i, for the i-th sample; β k represents the estimated coefficient of the frequency band; ( u i , v i ) represents the spatial unit’s central coordinates; β 0 ( u i , v i ) denotes the estimated intercept corresponding to sample i; and ε i denotes the error term assumed to be independently and identically distributed.

3. Results

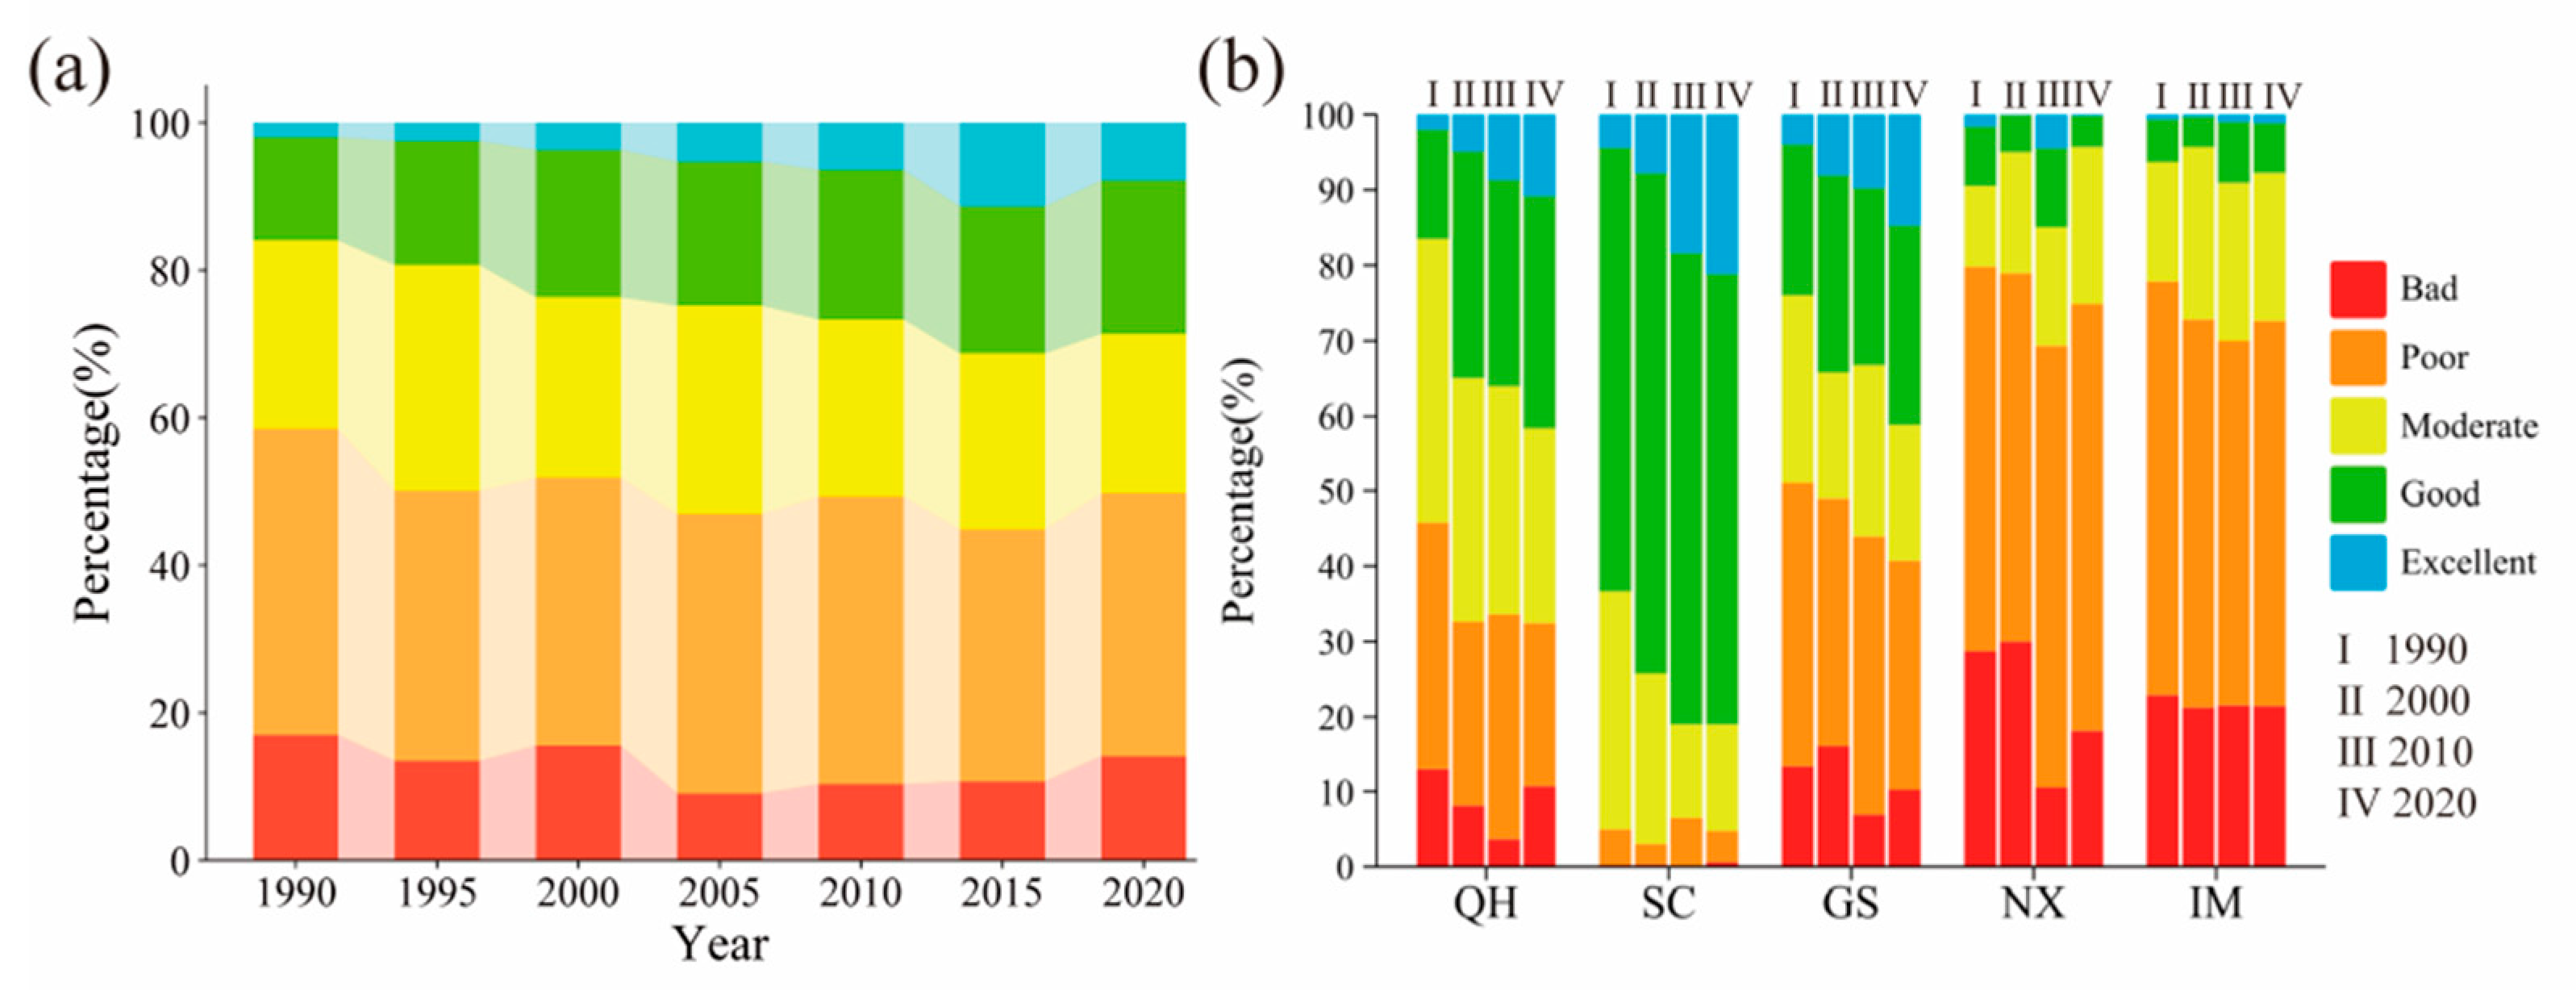
3.1. Temporal Dynamics of Ecological Quality

Over the last three decades, the ecological quality in the Upper Yellow River Region has generally shown a positive upward trend. The mean RSEI values in 1990, 1995, 2000, 2005, and 2020 were 0.3832, 0.4156, 0.4198, 0.4454, 0.4458, 0.4713, and 0.4435, respectively, demonstrating a gradual improvement. This indicates that the overall ecological environment is undergoing a slow but steady improvement process. The proportion of the RSEI levels for each year are shown in Figure 3a. In detail, the share of regions classified as having relatively high ecological quality increased from 14% in 1990 to 20.8% by 2020. This growth was particularly notable between 1990 and 2000, although the upward trend slowed after 2000. Meanwhile, the proportion of areas with moderate ecological quality exhibits a gradual decline. Between 1990 and 2020, the share of areas categorized as having poor ecological quality declined from 41.51% to 35.67%, and those with bad quality fell from 17% to 14.14%. The overall ecological state of the upper reaches of the Yellow River has shown steady enhancement, characterized by expansion in high and moderate zones and a marked contraction in low-quality regions.
As shown in Figure 3b, the RSEI exhibited variation across different provinces. Overall, ecological quality has improved in all five provinces, although significant spatial differences remain. Sichuan (SC) exhibits relatively good overall ecological quality, whereas Qinghai (QH) and Gansu (GS) demonstrate medium-quality ecological conditions, and Ningxia (NX) and Inner Mongolia (IM) perform poorly. SC exhibits the best overall ecological quality, with over 70% of the region falling under the “Good” or “Excellent” ecological quality categories. Regions classified as having poor or bad ecological conditions account for a small portion of the total area. The ecological quality of QH and GS is roughly equivalent, both belonging to the medium level. However, GS has a higher share of low-ecological-quality areas compared to QH, while its proportion of moderately rated regions is relatively smaller. The ecological environments of NX and IM are relatively poor, with over 70% of their areas classified as “Poor” and “Bad”. Overall, the southern provinces demonstrate better ecological quality, whereas the northern provinces perform relatively poorly.
Based on the trend of changes (Figure 4a), the areas with slight ecological improvement represent the largest proportion, reaching 54.63%. This indicates that most areas within the basin have experienced a minor improvement in ecological quality over the past 30 years. Specifically, areas with slight degradation comprise 28.71%, primarily located in parts of Qinghai Province and areas south of the Yellow River in Inner Mongolia. These regions have experienced transformations in land utilization, with urban and built-up areas continuously expanding, which have exerted a certain influence on ecological conditions [35]. Regions with significant improvement account for 10.84%, where the environmental quality has markedly enhanced due to recent ecological restoration projects and stringent environmental policies [36]. The proportions of unchanged and severely degraded areas are 4.39% and 1.43%, respectively, primarily in small regions of Ordos City, Inner Mongolia. The main contributing factors include the expansion of urban land and the environmental deterioration resulting from anthropogenic influences. These severely degraded areas require urgent attention and should be prioritized for governance and restoration in the future. Most of the study areas exhibit an improving trend, while regions showing slight degradation are present, with severe degradation being minimal. This reflects a strong correlation with the policies established in recent years for protecting the ecological quality of the Yellow River Basin.
As illustrated in Figure 4b, the coefficient of variation for RSEI averages 0.174, reflecting relatively low variability and a stable ecological environment. Regions exhibiting strong ecological stability are mainly distributed across southern Gansu, the Helan Mountains, and the Yinshan Mountains. The natural conditions and ecosystems in these areas are relatively stable, and the ecological environment has not been significantly disturbed by external factors. Areas identified as stable constitute 51.23% of the entire research area, suggesting that ecological changes in most areas are relatively stable. In contrast, ecologically fragile zones in unstable or highly unstable states are mainly distributed across Central Inner Mongolia and northern Qinghai Province. These areas are highly susceptible to external factors and are significantly influenced by human activities. Overall, the stable area in this study accounts for 70.79% of the entire region, indicating that ecological changes over the past 30 years have been relatively stable.

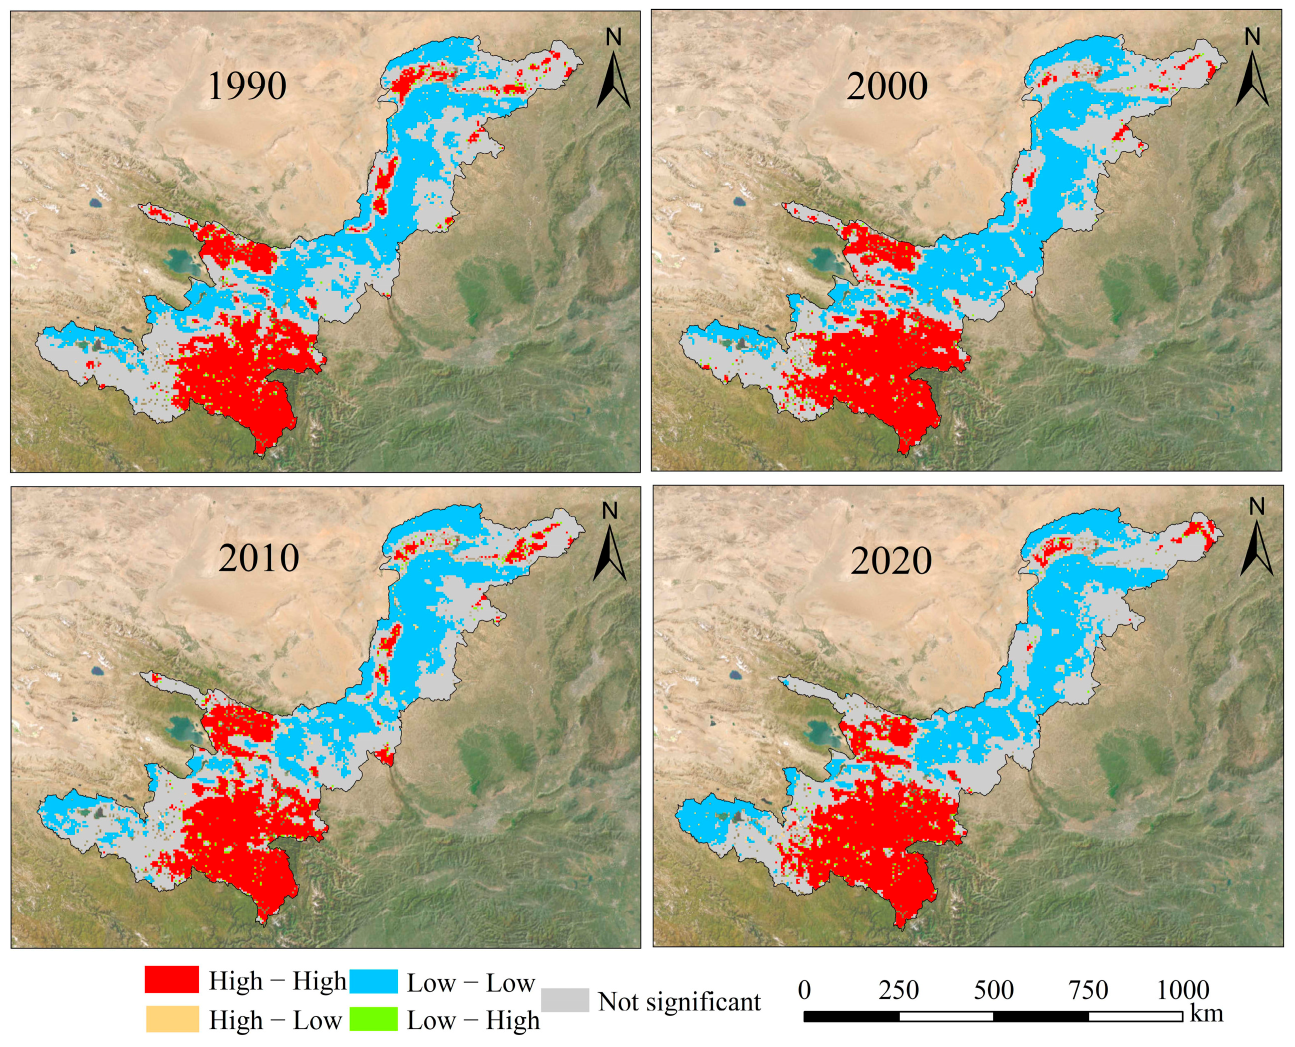
3.2. Spatial Dynamics of Ecological Quality

Figure 5 reveals substantial variation in RSEI across different parts of the Upper Yellow River area. The Upper Yellow River’s northern areas, including Inner Mongolia, Ningxia, and northeastern Gansu, along with some parts of western Qinghai, exhibit poorer ecological states. Moderate-level ecological zones are concentrated in areas such as eastern Inner Mongolia, the Ningxia Plain, and portions of Qinghai. High-quality ecological zones are chiefly distributed across the Hetao Plain, eastern and southern Qinghai, southern Gansu, and Sichuan.
To analyze the spatial correlation of the RSEI in the upper reaches of the Yellow River, this study utilized the Global Moran’s I to identify the spatial clustering characteristics of the region. The Global Moran’s I values for the years 1990, 2000, 2010, and 2020 are 0.739, 0.786, 0.757, and 0.761, respectively. The data points predominantly cluster within the first and third quadrants of the plot, reflecting a significant positive spatial autocorrelation in ecological quality across the Upper Yellow River.
To deepen the analysis of RSEI’s spatial patterns in the region, local LISA cluster maps were generated for 1990, 2000, 2010, and 2020, as presented in Figure 6. Predominantly, the High–High (H-H) clusters occur in southeastern and northern Qinghai Province, southern Gansu, Sichuan, and select regions of Bayannur (Inner Mongolia) and Yinchuan (Ningxia). These areas exhibit high RSEI values, alongside similarly high values in surrounding areas, indicating strong ecological clustering characteristics. The High–Low (H-L) and Low–High (L-H) outliers are sparse and scattered, suggesting that extreme values in ecological quality are rare across the study area, indicating a relatively balanced ecosystem. The Low–Low (L-L) clusters are predominantly found across most of western Inner Mongolia, Central Ningxia, northern Gansu, and a small part of northern Qinghai, forming a band-like distribution. From 1990 to 2020, there was a noticeable intensification in the spatial clustering of H-H and L-L groups within the RSEI. Over time, the number of H-H clusters increased, suggesting that regions with higher ecological quality are becoming more concentrated and stable.

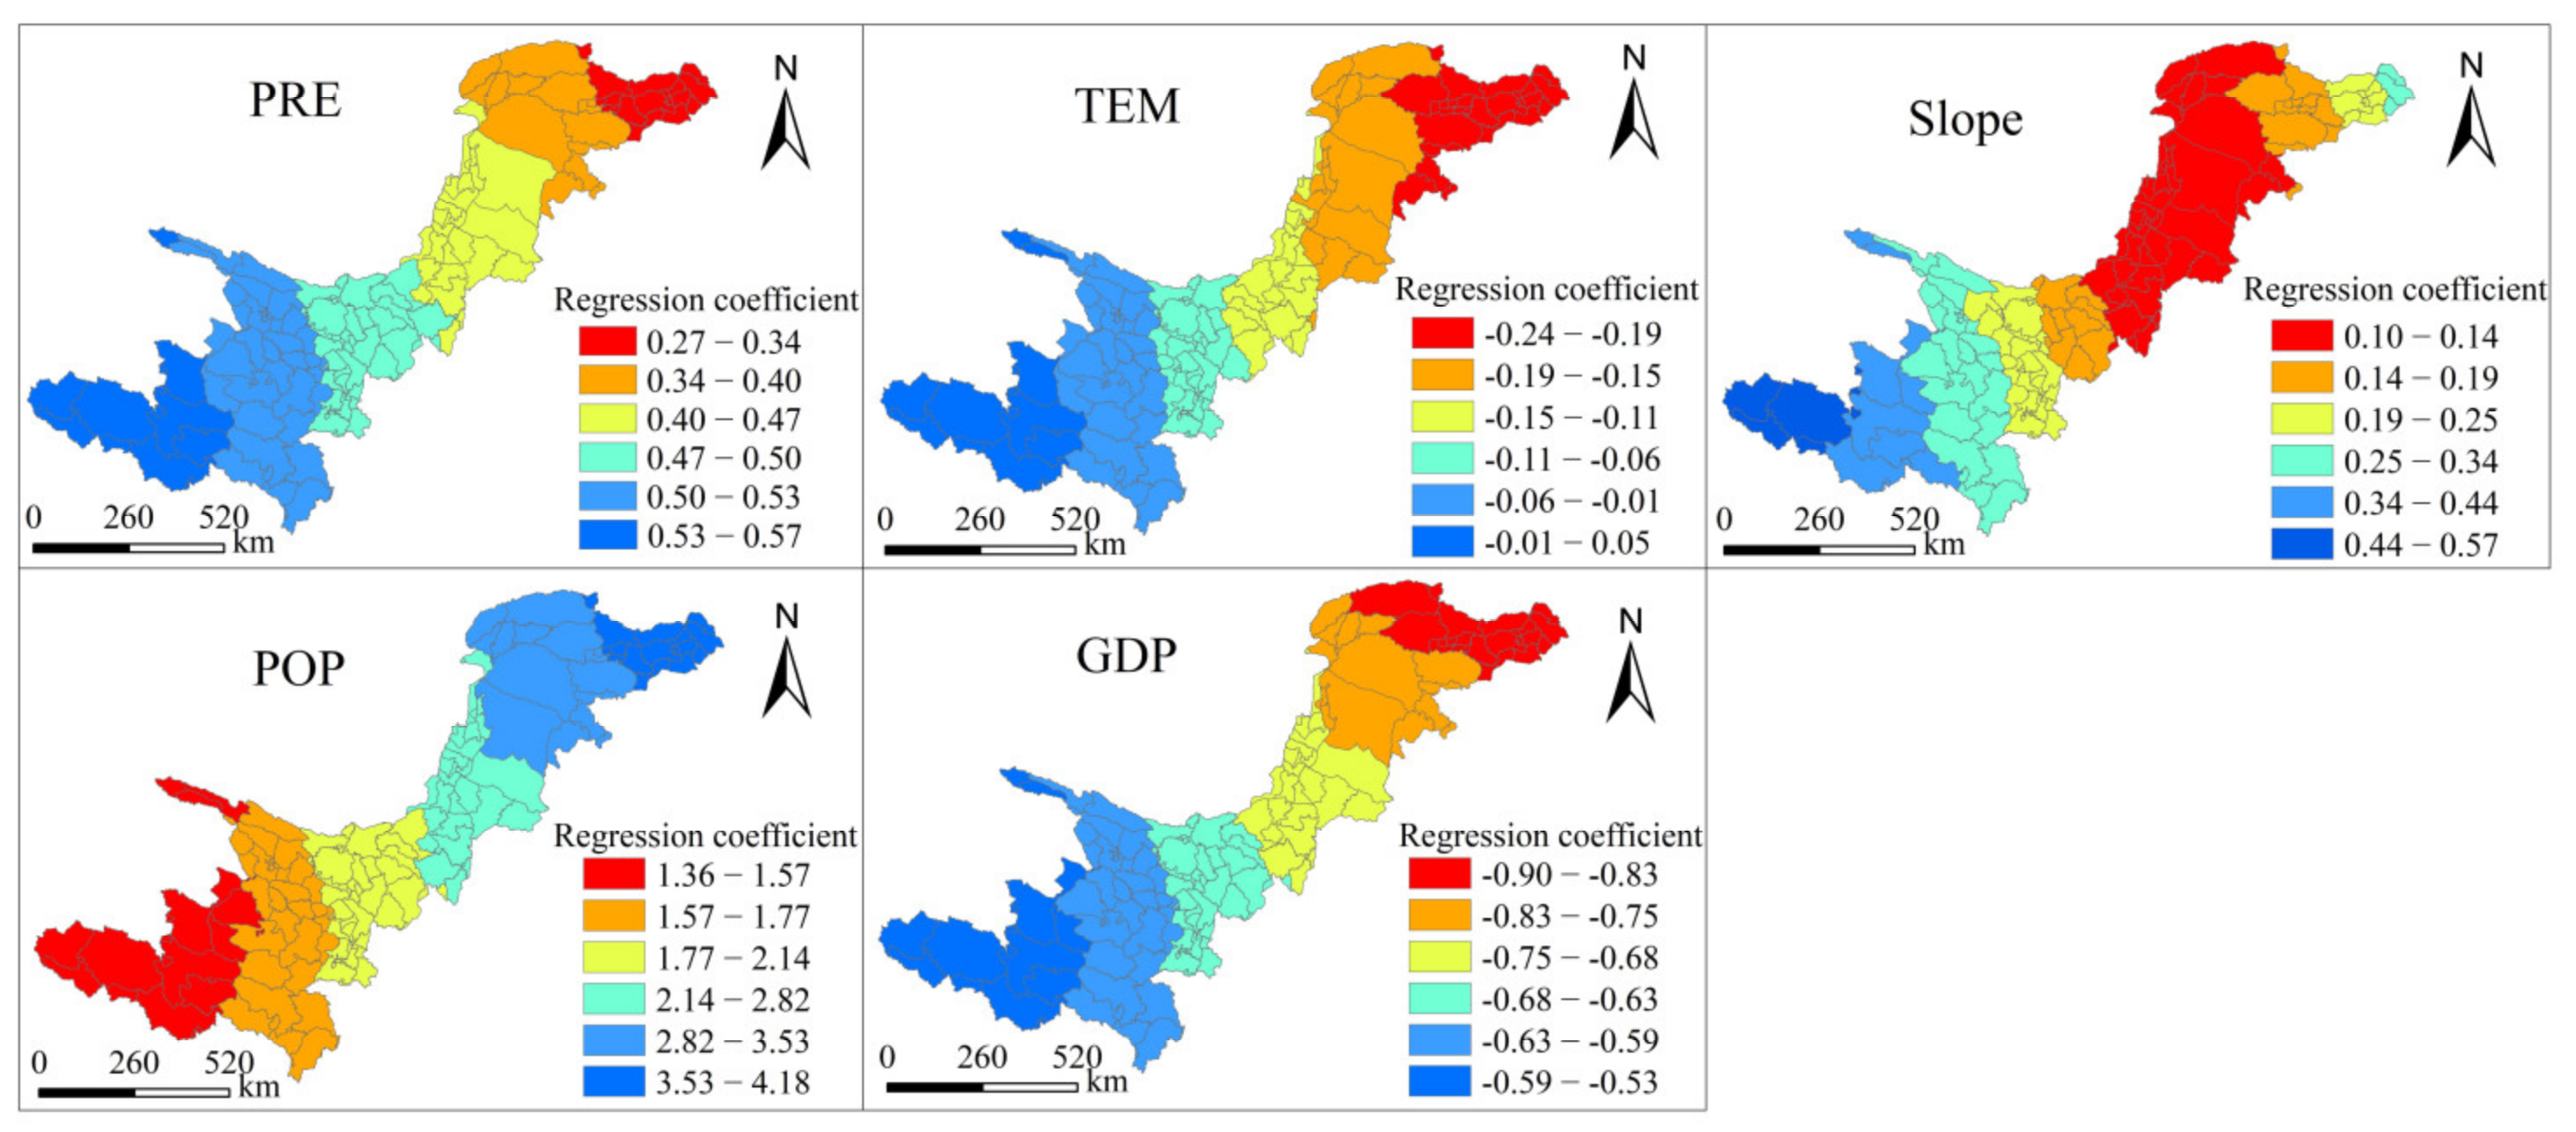
3.3. Analysis of Factors Influencing RSEI

By employing the OPGD model, this research assessed the independent and synergistic impacts of driving factors on ecological variation in the Upper Yellow River Basin. During the single-factor analysis, the model assessed how strongly each factor explained variations in RSEI, as indicated by the q-value magnitude (Figure 7a). The results indicate that the factors can be ranked in terms of explanatory strength as follows: PRE (q = 0.516) > TEM (q = 0.456) > DEM (q = 0.416) > soil type (q = 0.334) > GDP (q = 0.177) > CLCD (q = 0.169) > slope (q = 0.112) > POP (q = 0.028). With the highest q-value, precipitation (PRE) emerges as the most influential factor, suggesting that rainfall plays a crucial role in shaping ecological conditions across the upper reaches of the Yellow River. This is followed by TEM and DEM, which also exhibit relatively high explanatory power. Overall, natural elements like precipitation, temperature, and terrain exert the greatest influence on ecological conditions in the region. Further analysis was performed on the interactions between various factors (Figure 7b). It is evident that paired factors have a stronger effect than any single factor alone, indicating that ecological environment changes result from the synergy of multiple influences. The results of interaction analysis revealed two main types of effects: nonlinear synergies and two-factor enhancements. PRE interacting with CLCD produced the highest q value (0.667), suggesting the strongest combined influence. Other notable interactions include TEM with CLCD (0.609), DEM with PRE (0.597), TEM with PRE (0.588), and PRE with soil type (0.585). These combinations reflect prominent joint drivers of ecological change. It indicates that the evolution of ecological conditions in the Upper Yellow River Region is shaped by a combination of influences, with significant interactions observed among climate variables, land surface characteristics, and topography.
To address differences in the scales of influencing factors, all data were normalized to enhance the reliability and comparability of the analysis. To investigate how influencing factors spatially relate to RSEI in the Upper Yellow River area, the GWR model was applied. The distribution results are shown in Figure 8. Increased precipitation is significantly positively correlated with RSEI, with its impact more pronounced in the south and less so in the north. Temperature changes exhibit a negative correlation, notably in the northern section of the study area, where the effect of increasing temperature on RSEI is more severe compared to a milder impact in the south. Additionally, slope shows a positive correlation with RSEI, suggesting that moderate slopes contribute to ecosystem stability, though its influence is more limited in the central region. Regarding human activity factors, GDP growth negatively impacts ecological quality, likely due to the overexploitation of natural resources and the increased environmental pressure associated with economic development. In contrast, higher POP is positively correlated with RSEI, potentially reflecting the benefits of enhanced environmental management and ecological restoration measures driven by human activities. Results from the GWR model reveal the uneven spatial influence of various factors, capturing the differing impacts and processes of both environmental and human elements on ecological quality in the Upper Yellow River area.

3.4. Prediction of Ecological Environment Change Trends

Future trends were predicted using the Hurst index (Figure 9a). Regions with a Hurst index < 0.5 account for 22.98%, indicating unsustainable development trends; regions with a Hurst index > 0.5 account for 76.76%, indicating sustainable development trends; regions with a Hurst index = 0.5 only account for 0.26%, displaying significant random characteristics.
Across the entire study area, the patterns of “Up–Down” (UD), “Down–Up” (DU), “Random” (RD), “Down–Down” (DD), and “Up–Up” (UU) account for 15.03%, 7.95%, 0.26%, 24%, and 52.76%, respectively. The spatial pattern of trends is illustrated in Figure 9b. UD types are distributed in a relatively dispersed manner, reflecting current improvements in ecological quality but potential future declines. The DU type is primarily found in southern Inner Mongolia and eastern Ningxia, where ecological environment quality had previously deteriorated but may now be reversing, suggesting potential improvements in ecological conditions. The DD-type areas are mainly concentrated in Ningxia and Ordos City, Inner Mongolia, showing a continuous worsening trend in ecological environment quality, with a widespread distribution of ecologically fragile areas and challenges in grassland vegetation and wetland ecosystem recovery. Finally, the UU type is the most extensively distributed, reflecting sustained enhancement of ecological environment quality over both past and future periods. These areas are predominantly located in Qinghai, Gansu, and Sichuan Provinces. This sustained improvement is linked to national vegetation conservation initiatives, including the Grassland Return Program and the Three-North Shelter Forest Program [35].
The Hurst index was applied here to assess the continuity of ecological quality variations in the Upper Yellow River Basin and predict its future trajectory. The results showed that most areas showed strong persistence (H > 0.5), indicating that the current ecological trends are likely to continue. To assess the robustness of these findings, we compared our results with those of Yang et al. [37]. Yang et al. applied the Hurst index to assess ecological trends in the Yellow River Basin, and their study also reported a widespread persistence pattern, which is consistent with our findings. The similarity in spatial patterns and trend directions validates the reliability of this paper. However, it is worth noting that, while this consistency increases credibility, the Hurst index itself cannot explain external factors such as climate change, land policy changes, or socio-economic interventions. Therefore, our predictions should be viewed as indicative trends rather than final results. Future studies should incorporate other models, such as climate scenario simulations, socio-economic development forecasts, or machine learning methods to improve prediction accuracy.

4. Discussion

4.1. Ecological Environment Changes in the Upper Reaches of the Yellow River

This study employed the RSEI to investigate the spatiotemporal dynamics, variation trends, and clustering characteristics of ecological conditions in the upper reaches of the Yellow River during the period 1990–2020. The primary factors influencing ecological changes were further analyzed using the OPGD and GWR models. According to the spatial distribution of ecological quality, regions identified as having “Poor” and “Bad” ecological conditions are mainly located in the northern section of the Upper Yellow River. The primary causes stem from the region’s harsh natural conditions, such as low precipitation, poor soil quality, and an arid climate. These factors reduce the resilience of the local ecosystem, increasing its susceptibility to external disruptions. Furthermore, long-term ecological pressure from inappropriate land use—such as excessive grazing and uncontrolled development—has undermined the original ecosystem, intensified its vulnerability, and resulted in ecological degradation [38]. Areas exhibiting better ecological conditions are mostly concentrated in the southern region. Regions such as Gansu and Sichuan recognized the importance of protecting the Yellow River’s ecology early on and pioneered implementing a series of environmental management measures. For example, policies such as converting farmland to forests and grasslands effectively reduced human disturbances to ecosystems. Additionally, considerable effort and funding were dedicated to conserving soil and water, combating desertification, and restoring ecosystems, resulting in notable enhancements to the regional environment. Thanks to these scientifically grounded conservation efforts, the natural environment has steadily advanced, leading to notable improvements in ecological quality. Although Qinghai Province in the upper reaches of the Yellow River has a relatively underdeveloped economy, it has preserved a high level of ecological quality. Its unique geographical position as the source of the river has made it a national priority for conservation, with significant government investments in ecological protection. The steady enhancement in ecological conditions in the Upper Yellow River area can be attributed to the implementation of national-level environmental initiatives and increased investment in ecological governance. In recent years, there has been a marked growth in the establishment of nature reserves [39]. Initiated in 1999, the ”Grain for Green” project aims to reduce unsustainable farming activities, increase vegetation cover, and restore the natural functions of the regional ecosystem [40]. In addition, multiple initiatives aimed at ecological restoration and conservation—particularly those focused on vegetation recovery and efforts in the Sanjiangyuan Region—have yielded significant results. The designation of ecological preservation and sustainable development in the Yellow River Basin as a national priority has significantly enhanced conservation efforts across the region. Despite the notable success of these policies, some areas still face degradation driven by intensive economic development and substantial environmental disruption.

4.2. Factors Affecting Ecological Environment Quality

The Upper Yellow River Basin is characterized by dry and semi-dry highland areas, where ecological conditions are shaped by the combined effects of natural processes and human activities. Precipitation plays a crucial role in shaping the ecosystem in the upper reaches of the Yellow River and demonstrates a strong positive association with the RSEI, suggesting that within this dry and semi-dry environment, precipitation directly impacts soil moisture, surface runoff, and vegetation growth, serving as a fundamental element for maintaining ecosystem functionality. Increased precipitation can promote plant growth, enhance soil moisture, and reduce soil erosion. Ecosystems in arid regions are highly sensitive to changes in precipitation, which can significantly affect regional vegetation coverage and ecological quality [41]. Amid accelerating climate shifts, improving the availability and regulation of water in dry areas, optimizing irrigation systems, and improving water use efficiency are crucial for this region. Temperature changes affect the ecological environment in a complex and dual manner. Generally, rising temperatures tend to exacerbate drought conditions, increase evaporation, and weaken soil moisture reserves, thereby inhibiting vegetation growth [42]. However, in certain elevated regions within the Upper Yellow River Basin, the impact of temperature is relatively small, and a moderate increase in temperature may extend the growing season of vegetation, providing favorable conditions for local ecological restoration. Moreover, land cover changes reflect human interventions in natural ecosystems [43]. Changes in land cover—including the transformation of grasslands into agricultural fields or built-up areas—can alter surface albedo, temperature, and moisture, potentially leading to ecological degradation, while overgrazing and unsustainable land development often result in soil erosion, vegetation degradation, and a decline in biodiversity. Areas with higher vegetation coverage generally exhibit better ecological quality, whereas the expansion of built-up and barren lands significantly degrades ecological conditions. Studies indicate that, between 2001 and 2020, barren land across the upper reaches of the Yellow River gradually declined, with a considerable share converted into vegetated or ecological land through conservation projects [35]. This transformation has significantly improved regional ecological quality, highlighting the positive outcomes of ecological management and protection efforts. GDP and POP demonstrate varying impacts on ecological conditions across different regions [44], further emphasizing the complex effects of urbanization and economic activities: from one angle, economic growth and population concentration can improve ecological quality through enhanced resource management capabilities and infrastructure development; from another angle, overexploitation and high-intensity land use may trigger land degradation and a decline in ecosystem carrying capacity. These impacts demonstrate considerable spatial heterogeneity across regions, supporting adaptive ecological management by capturing the diverse effects of influencing factors across different geographical locations.
In the process of environmental change within the Upper Yellow River Region, precipitation and land use types exhibit a notable reciprocal influence. As a limiting climatic factor, precipitation directly determines the ecological responsiveness of different land use categories. Under a semi-arid climate, increased precipitation helps enhance the productivity of cropland and grassland, improves soil moisture conditions, and thereby promotes vegetation growth and elevates ecological quality [45]. Conversely, in periods of reduced precipitation, the effectiveness of habitat restoration initiatives—like reforesting or establishing grasslands on former cropland—may be limited and may even trigger land degradation. In addition, land use types exhibit distinct responses to precipitation changes. For instance, the expansion of cropland is often accompanied by vegetation destruction and surface disturbance, leading to increased runoff and soil erosion, which deteriorates ecological quality [46]. In contrast, land use types focused on vegetation restoration—such as forests and grasslands—are more capable of enhancing surface retention and improving ecological conditions during years with favorable precipitation. This mechanism is also evident in practice. In the Kubuqi Desert, for example, the planting of drought-tolerant vegetation (e.g., shrubs) has successfully transformed sandy areas into grasslands and woodlands. As a result, vegetation cover has significantly increased, enabling more effective interception of precipitation, a reduction in surface runoff, and an improvement in soil moisture, thereby enhancing the ecosystem’s self-sustainability [47]. By contrast, areas such as Ulanqab have suffered from grassland degradation due to the expansion of animal husbandry. Overgrazing has led to a decline in vegetation cover, making surface soils more vulnerable to erosion under precipitation, which has further worsened the ecological environment.

4.3. Research Prospects of the RSEI Model

The RSEI, which integrates greenness, dryness, humidity, and heat, helps overcome the limitations of single-indicator assessments. It employs the PCA to autonomously extract the weighting coefficients for each factor, thereby avoiding the subjective bias associated with manually assigned weights [48]. However, some researchers have highlighted the limitations of the PCA method under certain circumstances, which may influence the accuracy of RSEI calculation results. Liao and Jiang [49] argued that establishing indicator weights for RSEI over large areas is not conducive to computation and cognitive decision-making and proposed an approach grounded in knowledge granulation entropy for determining these weights. Despite numerous studies aimed at improving PCA-based indicator integration methods, these methods still face challenges such as distorted ecological information, high computational complexity, human intervention, or incorrect correlation assessment. Therefore, PCA remains the dominant method for RSEI indicator integration. We assessed the stability of PCA-derived weights by comparing our results with those reported by Yang et al. [37], who conducted a similar RSEI analysis covering the Yellow River Basin, including its upper reaches examined in our study. In their study, they applied PCA to determine the weights of the RSEI components automatically. Despite the climatic and geographical heterogeneity of the basin, our findings for the Upper Yellow River demonstrate spatial patterns that closely align with those reported by Yang et al. This consistency supports the robustness of the RSEI methodology, suggesting that even if PCA-derived weights vary across regions, the resulting spatial patterns of ecological quality remain stable. Consequently, the reliability and applicability of RSEI for ecological assessment in the Upper Yellow River Region are further confirmed.
While the selection criteria for RSEI single indicators are suitable for terrestrial ecosystems, as the model is increasingly applied, efforts are being made to introduce more adaptable indicators when applying it to research areas like mining regions [50] and wetlands [51] in order to improve the RSEI model. For example, Zhang et al. [52] developed the Extended Remote Sensing Ecological Index (ERSEI) for assessing ecological dynamics across Jiangxi Province. The aim of improving the index for specific regions is highly targeted; however, the limitations in its generalizability across different land types necessitate corresponding model adjustments. Despite the fact that RSEI cannot entirely capture the complexity of watershed systems, it is still the most broadly adopted and consolidated index in modern environmental assessment [53]. As the demand for ecosystem monitoring grows increasingly complex and variable, future research will focus on improving indicator selection and integration algorithms to enhance model generality and adaptability, better addressing ecological evaluation challenges across diverse environmental conditions.

5. Conclusions

This research employed the RSEI to analyze the spatiotemporal distribution characteristics, change trends, and aggregation features across the Upper Yellow River Basin from 1990 to 2020. Additionally, it revealed the main factors influencing ecological environment changes by integrating the OPGD model and GWR model. The main conclusions are as follows:
(1)
The distribution characteristics of RSEI in the upper reaches of the Yellow River exhibit a pronounced north–south disparity. The southern areas have a higher ecological quality compared to the northern regions. Sichuan Province exhibits the highest ecological environment quality, whereas the Inner Mongolia Autonomous Region performs the worst.
(2)
Ecological conditions throughout the Upper Yellow River Region show a continuous improvement trend, with 65.47% of the area experiencing ecological improvement, while the proportion of severely degraded areas is relatively small. Areas with a coefficient of variation below 0.2 make up 70.79%, indicating that most regions have stable ecological conditions. Spatially, High–High (H-H) clustering predominantly appears toward the south, while Low–Low (L-L) clustering is mainly distributed across the central and northern parts, forming a band-like pattern.
(3)
Future trend predictions indicate that UU areas (with consistently improving ecological trends) are the most prevalent, suggesting strong restoration potential and justifying continued investment in ecological protection and green development. In contrast, DD areas (with consistently declining trends) are primarily located in northern and western Ningxia, as well as Central Ordos. It is recommended that Ningxia promote rotational grazing, grassland restoration, and water-efficient irrigation practices, while Ordos should prioritize post-mining land reclamation and vegetation recovery.
(4)
PRE, TEM, and DEM are key factors affecting ecological conditions across the Upper Yellow River Region, with the interaction between precipitation and land cover being the most significant. The GWR model results reveal notable variations in how different factors affect ecological quality throughout various geographic areas. Thus, when designing development strategies, careful attention must be paid to the unique conditions of each area.

Author Contributions

Conceptualization, C.H. and X.T.; methodology, C.H. and X.T.; software, X.T.; validation, X.T., T.Z., T.F. and Q.B.; formal analysis, X.T. and T.Z.; investigation, X.T., T.Z., T.F. and Q.B.; data curation, X.T.; writing—original draft preparation, X.T.; writing—review and editing, X.T., T.Z., T.F. and Q.B.; visualization, X.T.; supervision, C.H.; project administration, C.H.; funding acquisition, C.H. All authors have read and agreed to the published version of the manuscript.

Funding

This work was supported by the National Natural Science Foundation of China (grant no. 42130113) and the Basic Research Innovative Groups of Gansu Province, China (grant no. 21JR7RA068).

Institutional Review Board Statement

Not applicable.

Informed Consent Statement

Not applicable.

Data Availability Statement

The data and scripts of this work are available from the corresponding author upon reasonable request.

Conflicts of Interest

The authors declare no conflicts of interest.

References

  1. Wang, J. A primary framework on protection of ecological environment and realization of high-quality development for the Yellow River Basin. Environ. Prot. 2020, 48, 18–21. [Google Scholar] [CrossRef]
  2. Huang, J.; Cao, Y.; Qin, F. Analysis of eco-environment quality based on Land Use/Cover Change in the Yellow River Basin. J. Hunan Univ. Nat. Sci. 2020, 44, 127–138. [Google Scholar] [CrossRef]
  3. Han, P.; Wang, Y.; Li, D. Spatial and Temporal Variations of Baseflow and Its Responses to Soil and Water Conservation in Hekouzhen—Longmen Section in the Middle Reaches of the Yellow River. J. Basic Eng. 2020, 3, 505–521. [Google Scholar] [CrossRef]
  4. Li, Y.; Tian, H.; Zhang, J.; Lu, S.; Xie, Z.; Shen, W.; Zheng, Z.; Li, M.; Rong, P.; Qin, Y. Detection of spatiotemporal changes in ecological quality in the Chinese mainland: Trends and attributes. Sci. Total Environ. 2023, 884, 163791. [Google Scholar] [CrossRef]
  5. Karbalaei Saleh, S.; Amoushahi, S.; Gholipour, M. Spatiotemporal ecological quality assessment of metropolitan cities: A case study of central Iran. Environ. Monit. Assess. 2021, 193, 305. [Google Scholar] [CrossRef]
  6. Willis, K.S. Remote sensing change detection for ecological monitoring in United States protected areas. Biol. Conserv. 2015, 182, 233–242. [Google Scholar] [CrossRef]
  7. Jiang, L.; Liu, Y.; Wu, S.; Yang, C. Analyzing ecological environment change and associated driving factors in China based on NDVI time series data. Ecol. Indic. 2021, 129, 107933. [Google Scholar] [CrossRef]
  8. Taripanah, F.; Ranjbar, A. Quantitative analysis of spatial distribution of land surface temperature (LST) in relation Ecohydrological, terrain and socio-economic factors based on Landsat data in mountainous area. Adv. Space Res. 2021, 68, 3622–3640. [Google Scholar] [CrossRef]
  9. Wang, C.-s.; Duan, Y.-x.; Zhang, R. Spatial pattern evolution of cities and influencing factors in the historical Yellow River Basin. J. Nat. Resour. 2021, 36, 69–86. [Google Scholar] [CrossRef]
  10. Pariha, H.; Zan, M.; Alimjia, K. Remoting sensing evaluation of ecological environment in Urumqi City and analysis of driving factors. Arid Zone Res. 2021, 38, 1484–1496. [Google Scholar] [CrossRef]
  11. Jing, Y.; Zhang, F.; He, Y.; Johnson, V.C.; Arikena, M. Assessment of spatial and temporal variation of ecological environment quality in Ebinur Lake Wetland National Nature Reserve, Xinjiang, China. Ecol. Indic. 2020, 110, 105874. [Google Scholar] [CrossRef]
  12. Sun, D.; Zhang, J.-x.; Zhu, C.; Hu, Y.; Zhou, L. An assessment of China’s ecological environment quality change and its spatial variation. Acta Geogr. Sin. 2012, 67, 1599–1610. [Google Scholar] [CrossRef]
  13. Xu, H. A remote sensing urban ecological index and its application. Acta Ecol. Sin. 2013, 33, 7853–7862. [Google Scholar]
  14. Yuan, B.; Fu, L.; Zou, Y.; Zhang, S.; Chen, X.; Li, F.; Deng, Z.; Xie, Y. Spatiotemporal change detection of ecological quality and the associated affecting factors in Dongting Lake Basin, based on RSEI. J. Clean. Prod. 2021, 302, 126995. [Google Scholar] [CrossRef]
  15. Jiang, C.L.; Wu, L.; Liu, D.; Wang, S.M. Dynamic monitoring of eco-environmental quality in arid desert area by remote sensing: Taking the Gurbantunggut Desert China as an example. J. Appl. Ecol. 2019, 30, 877–883. [Google Scholar] [CrossRef]
  16. Yue, H.; Liu, Y.; Li, Y.; Lu, Y. Eco-environmental quality assessment in China’s 35 major cities based on remote sensing ecological index. IEEE Access 2019, 7, 51295–51311. [Google Scholar] [CrossRef]
  17. Bai, T.; Cheng, J.; Zheng, Z.; Zhang, Q.; Li, Z.; Xu, D. Drivers of eco-environmental quality in China from 2000 to 2017. J. Clean. Prod. 2023, 396, 136408. [Google Scholar] [CrossRef]
  18. Das, M.; Das, A.; Pereira, P. Impact of urbanization induced land use and land cover change on ecological space quality-mapping and assessment in Delhi (India). Urban Clim. 2024, 53, 101818. [Google Scholar] [CrossRef]
  19. Lv, Y.; Xiu, L.; Yao, X.; Yu, Z.; Huang, X. Spatiotemporal evolution and driving factors analysis of the eco-quality in the Lanxi urban agglomeration. Ecol. Indic. 2023, 156, 111114. [Google Scholar] [CrossRef]
  20. Wang, X.; Yao, X.; Jiang, C.; Duan, W. Dynamic monitoring and analysis of factors influencing ecological environment quality in northern Anhui, China, based on the Google Earth Engine. Sci. Rep. 2022, 12, 20307. [Google Scholar] [CrossRef]
  21. Li, M.; Abuduwaili, J.; Liu, W.; Feng, S.; Saparov, G.; Ma, L. Application of geographical detector and geographically weighted regression for assessing landscape ecological risk in the Irtysh River Basin, Central Asia. Ecol. Indic. 2024, 158, 111540. [Google Scholar] [CrossRef]
  22. Song, Y.; Wang, J.; Ge, Y.; Xu, C. An optimal parameters-based geographical detector model enhances geographic characteristics of explanatory variables for spatial heterogeneity analysis: Cases with different types of spatial data. GISci. Remote Sens. 2020, 57, 593–610. [Google Scholar] [CrossRef]
  23. Jiang, W.; Yuan, L.; Wang, W.; Cao, R.; Zhang, Y.; Shen, W. Spatio-temporal analysis of vegetation variation in the Yellow River Basin. Ecol. Indic. 2015, 51, 117–126. [Google Scholar] [CrossRef]
  24. Fu, J.-b. Coordinating management of the eco-environmental systems in the Yellow River Basin. J. Irrig. Drain. Eng. 2020, 39, 130–137. [Google Scholar] [CrossRef]
  25. Cai, Z.; Zhang, Z.; Zhao, F.; Guo, X.; Zhao, J.; Xu, Y.; Liu, X. Assessment of eco-environmental quality changes and spatial heterogeneity in the Yellow River Delta based on the remote sensing ecological index and geo-detector model. Ecol. Inf. 2023, 77, 102203. [Google Scholar] [CrossRef]
  26. Zhou, S.; Li, W.; Zhang, W.; Wang, Z. The Assessment of the Spatiotemporal Characteristics of the Eco-Environmental Quality in the Chishui River Basin from 2000 to 2020. Sustainability 2023, 15, 3695. [Google Scholar] [CrossRef]
  27. Yang, J.; Huang, X. 30 m annual land cover and its dynamics in China from 1990 to 2019. Earth Syst. Sci. Data Discuss. 2021, 2021, 1–29. [Google Scholar] [CrossRef]
  28. Xu, J.; Liu, J.; Gao, J. Quantitative assessment of vegetation suitability in China based on carbon-water balance. J. Clean. Prod. 2023, 387, 135735. [Google Scholar] [CrossRef]
  29. Thakur, S.; Mondal, I.; Bar, S.; Nandi, S.; Ghosh, P.; Das, P.; De, T. Shoreline changes and its impact on the mangrove ecosystems of some islands of Indian Sundarbans, North-East coast of India. J. Clean. Prod. 2021, 284, 124764. [Google Scholar] [CrossRef]
  30. Xiong, Y.; Xu, W.; Lu, N.; Huang, S.; Wu, C.; Wang, L.; Dai, F.; Kou, W. Assessment of spatial–temporal changes of ecological environment quality based on RSEI and GEE: A case study in Erhai Lake Basin, Yunnan province, China. Ecol. Indic. 2021, 125, 107518. [Google Scholar] [CrossRef]
  31. Yang, Q.; Xu, G.; Li, A.; Liu, Y.; Hu, C. Evaluation and trade-off of ecosystem services in the Qingyijiang River Basin. Acta Ecol. Sin. 2021, 41, 9315–9327. [Google Scholar] [CrossRef]
  32. Qiu, M.; Zuo, Q.; Wu, Q.; Yang, Z.; Zhang, J. Water ecological security assessment and spatial autocorrelation analysis of prefectural regions involved in the Yellow River Basin. Sci. Rep. 2022, 12, 5105. [Google Scholar] [CrossRef] [PubMed]
  33. Umuhoza, J.; Jiapaer, G.; Tao, Y.; Jiang, L.; Zhang, L.; Gasirabo, A.; Umwali, E.D.; Umugwaneza, A. Analysis of fluctuations in vegetation dynamic over Africa using satellite data of solar-induced chlorophyll fluorescence. Ecol. Indic. 2023, 146, 109846. [Google Scholar] [CrossRef]
  34. Yang, H.; Yu, J.; Xu, W.; Wu, Y.; Lei, X.; Ye, J.; Geng, J.; Ding, Z. Long-time series ecological environment quality monitoring and cause analysis in the Dianchi Lake Basin, China. Ecol. Indic. 2023, 148, 110084. [Google Scholar] [CrossRef]
  35. Cui, Y.; Li, H.; Zheng, L.; Wu, M. Study of ecological environmental quality changes in the upper Yellow River basin based on remote sensing ecological index. J. Desert Res. 2023, 43, 107–118. [Google Scholar] [CrossRef]
  36. Liu, S.; Shao, Q.; Ning, J.; Niu, L.; Zhang, X.; Liu, G.; Huang, H. Remote-sensing-based assessment of the ecological restoration degree and restoration potential of ecosystems in the upper yellow river over the past 20 years. Remote Sens. 2022, 14, 3550. [Google Scholar] [CrossRef]
  37. Yang, Z.; Tian, J.; Su, W.; Wu, J.; Liu, J.; Liu, W.; Guo, R. Analysis of ecological environmental quality change in the Yellow River Basin using the remote-sensing-based ecological index. Sustainability 2022, 14, 10726. [Google Scholar] [CrossRef]
  38. Guo, S.; Pei, Y.; Hu, S.; Yang, D.; Qiu, H.; Cao, M. Response of vegetation index to climate change and their relationship with runoff-sediment change in Yellow River Bastion. Bull. Soil Water Conserv. 2020, 40, 2–13. [Google Scholar] [CrossRef]
  39. Liu, X.; Zhang, Y.; Wang, Y.; Yang, H.; Ma, Z.; Dong, W.; Yang, J.; Dabuxilite, W.; Sun, X. Investigation and Evaluation on Water Quality of Cold Alpine Wetland in Gansu Yanchiwan National Nature Reserve. Bull. Soil Water Conserv. 2018, 38, 160–165. [Google Scholar] [CrossRef]
  40. Pei, X.; Gan, Z.; Liu, X. A study on the problem of returning farmland to forests in Yellow River Basin. J. Arid. Land Resour. Environ. 2003, 17, 98–102. [Google Scholar] [CrossRef]
  41. Du, W.; Guo, E.; Wang, A.; Tong, Z.; Liu, X.; Zhang, J.; Guna, A. Spatiotemporal variation in precipitation concentration and its potential relationship with drought under different scenarios in Inner Mongolia, China. Int. J. Climatol. 2022, 42, 7648–7667. [Google Scholar] [CrossRef]
  42. Huang, Y.; Xin, Z.; Dor-ji, T.; Wang, Y. Tibetan Plateau greening driven by warming-wetting climate change and ecological restoration in the 21st century. Land Degrad. Dev. 2022, 33, 2407–2422. [Google Scholar] [CrossRef]
  43. Cai, Y.; Zhang, F.; Duan, P.; Jim, C.Y.; Chan, N.W.; Shi, J.; Liu, C.; Wang, J.; Bahtebay, J.; Ma, X. Vegetation cover changes in China induced by ecological restoration-protection projects and land-use changes from 2000 to 2020. Catena 2022, 217, 106530. [Google Scholar] [CrossRef]
  44. Li, J.; Sun, W.; Li, M.; Meng, L. Coupling coordination degree of production, living and ecological spaces and its influencing factors in the Yellow River Basin. J. Clean. Prod. 2021, 298, 126803. [Google Scholar] [CrossRef]
  45. Yu, Y.; Zhu, R.; Ma, D.; Liu, D.; Liu, Y.; Gao, Z.; Yin, M.; Bandala, E.R.; Rodrigo-Comino, J. Multiple surface runoff and soil loss responses by sandstone morphologies to land-use and precipitation regimes changes in the Loess Plateau, China. Catena 2022, 217, 106477. [Google Scholar] [CrossRef]
  46. Jiang, T.; Wang, X.; Afzal, M.M.; Sun, L.; Luo, Y. Vegetation productivity and precipitation use efficiency across the Yellow River Basin: Spatial patterns and controls. Remote Sens. 2022, 14, 5074. [Google Scholar] [CrossRef]
  47. Li, T.; Zhang, Q.; Wang, G.; Singh, V.P.; Zhao, J.; Sun, S.; Wang, D.; Liu, T.; Duan, L. Ecological degradation in the Inner Mongolia reach of the Yellow River Basin, China: Spatiotemporal patterns and driving factors. Ecol. Indic. 2023, 154, 110498. [Google Scholar] [CrossRef]
  48. Xu, H.; Li, C.; Lin, M. Should RSEI use PCA or kPCA? Geomat. Inf. Sci. Wuhan Univ. 2023, 48, 506–513. [Google Scholar] [CrossRef]
  49. Liao, W.; Jiang, W. Evaluation of the spatiotemporal variations in the eco-environmental quality in China based on the remote sensing ecological index. Remote Sens. 2020, 12, 2462. [Google Scholar] [CrossRef]
  50. Zhu, D.; Chen, T.; Niu, R.; Zhen, N. Analyzing the ecological environment of mining area by using moving window remote sensing ecological index. Geomat. Inf. Sci. Wuhan Univ. 2021, 46, 341–347. [Google Scholar] [CrossRef]
  51. Zhang, S.; Zhai, X.; Yang, P.; Xia, J.; Hu, S.; Zhou, L.; Fu, C. Ecological health analysis of wetlands in the middle reaches of Yangtze River under changing environment. Int. J. Digit. Earth 2023, 16, 3125–3144. [Google Scholar] [CrossRef]
  52. Zhang, X.; Fan, H.; Sun, L.; Liu, W.; Wang, C.; Wu, Z.; Lv, T. Identifying regional eco-environment quality and its influencing factors: A case study of an ecological civilization pilot zone in China. J. Clean. Prod. 2024, 435, 140308. [Google Scholar] [CrossRef]
  53. Zhou, M.; Li, Z.; Gao, M.; Zhu, W.; Zhang, S.; Ma, J.; Ta, L.; Yang, G. Revealing the Eco-Environmental Quality of the Yellow River Basin: Trends and Drivers. Remote Sens. 2024, 16, 2018. [Google Scholar] [CrossRef]
Figure 1. Overview of the study area.
Sustainability 17 05410 g001
Figure 2. The technology roadmap for this study.
Sustainability 17 05410 g002
Figure 3. Proportion of RSEI levels over the years (a); and proportion of RSEI in each province (b).
Sustainability 17 05410 g003
Figure 4. RSEI trend distribution (a); and coefficient of variation distribution (b).
Sustainability 17 05410 g004
Figure 5. Spatial distribution of RSEI levels.
Sustainability 17 05410 g005
Figure 6. LISA clustering distribution.
Sustainability 17 05410 g006
Figure 7. Single factor test results (a); and interaction verification results (b).
Sustainability 17 05410 g007
Figure 8. Distribution of regression coefficients.
Sustainability 17 05410 g008
Figure 9. Hurst exponent distribution (a); and future trend of RSEI variation (b).
Sustainability 17 05410 g009
Table 1. Research data sources.
Data TypesResolutionSource
TEM1 kmhttp://www.geodata.cn/main/#/ (accessed 20 June 2024)
PRE1 kmhttp://www.geodata.cn/main/#/ (accessed 20 June 2024)
DEM30 mhttps://www.resdc.cn
Slope1 kmhttps://www.resdc.cn
Soil type1 kmhttps://www.resdc.cn
GDP1 kmhttps://www.resdc.cn
POP1 kmhttps://www.resdc.cn
CLCD30 mhttps://zenodo.org/records/12779975 (accessed 10 July 2024)
Table 2. Calculation methods of RSEI index.
IndexFormula
NDVI N D V I = ( ρ N I R ρ r e d ) / ( ρ N I R + ρ r e d )
WET W E T T M = 0.0315 ρ b l u e + 0.2021 ρ g r e e n + 0.3102 ρ r e d + 0.1594 ρ N I R 0.6806 ρ S W I R 1 0.6109 ρ S W I R 2
W E T O L I = 0.1511 ρ b l u e + 0.1973 ρ g r e e n + 0.3283 ρ r e d + 0.3407 ρ N I R 0.7117 ρ S W I R 1 0.4559 ρ S W I R 2
NDBSI N D B S I = ( S I + I B I ) / 2
S I = ( ρ S W I R 1 + ρ r e d ) ( ρ b l u e + ρ N I R ) ( ρ S W I R 1 + ρ r e d ) + ( ρ b l u e + ρ N I R )
I B I = 2 ρ S W I R 1 / ( ρ N I R + ρ S W I R 1 ) [ ρ g r e e n / ( ρ S W I R 1 + ρ g r e e n ) + ρ N I R / ( ρ r e d + ρ N I R ) ] 2 ρ S W I R 1 / ( ρ N I R + ρ S W I R 1 ) + [ ρ g r e e n / ( ρ S W I R 1 + ρ g r e e n ) + ρ N I R / ( ρ r e d + ρ N I R ) ]
LST L S T = T 1 + λ T / ρ ln ε 273.15
Table 3. Future trends of RSEI.
SlopeHurstTypeShorthandDescription
<0>0.5Down–DownDDDown continuously
<0<0.5Down–UpDUFirst down then up
0=0.5RandomRDNo regularity
>0<0.5Up–DownUDFirst up then down
>0>0.5Up–UpUUUp continuously
Disclaimer/Publisher’s Note: The statements, opinions and data contained in all publications are solely those of the individual author(s) and contributor(s) and not of MDPI and/or the editor(s). MDPI and/or the editor(s) disclaim responsibility for any injury to people or property resulting from any ideas, methods, instructions or products referred to in the content.

