1. Introduction
Under the World Bank’s absolute poverty threshold of USD 1.9 per person per day, China has lifted approximately 800 million people out of poverty over the past four decades—representing 75% of global poverty reduction during this period. A landmark achievement was realized on 25 February 2021, when China officially eradicated extreme poverty under its national standards, marking a historic milestone in building a moderately prosperous society. This unprecedented progress in both scale and pace remains remarkable, whether measured by international or domestic poverty benchmarks. However, despite eliminating absolute deprivation, income levels for some populations remain below thresholds typical of upper-middle-income countries. In response, China has established a new 2035 target for “achieving more substantial progress toward common prosperity.” This policy shift has redirected academic attention toward relative poverty measurement and interventions, with particular emphasis on rural revitalization strategies and broader common prosperity objectives.
The conceptual underpinnings related to relative poverty first emerged in the late-19th century, when early sociologists and economists, including Seebohm Rowntree and Charles Booth, first systematically examined poverty in Britain. Subsequent academic developments have greatly refined this theoretical construct. Notably, Alkire and Foster advanced the field through the development of the Multidimensional Poverty Index (MPI), which argues that relative poverty assessments must incorporate multiple dimensions of well-being beyond income measures, including educational attainment, health status, and living conditions. Their methodological contribution was the development of a pioneering analytical paradigm, the A-F dual-threshold approach, which provides a systematic assessment of multidimensional poverty through a structured process that includes dimension selection, threshold determination, poverty identification, and weighted composite index construction [
1]. In China, scholars such as Wang Sangui (2020) proposed a strategic shift in poverty governance after 2020, shifting the focus from eradicating absolute poverty to addressing relative poverty resulting from development gaps. The multidimensional framework they propose incorporates economic factors, social development indicators, and ecological factors [
2]. It is worth noting that there are key intersections between poverty dynamics and vulnerability, particularly in terms of climate resilience. Empirical studies by Haseeb Ahmed et al. (2025) show that the climate vulnerability of farm households exhibits a strong socioeconomic gradient, with populations in economically disadvantaged areas, populations with limited economic resources, and populations with lower levels of education being more vulnerable [
3].
As the scientific community’s understanding of global warming grew, researchers began to assume the important role of predictors of the climate crisis, and the concept of climate change became widely recognized. Currently, the pace of climate change and its consequences are faster than initially predicted, and the global climate system shows a continuing warming trend. The frequency and severity of extreme meteorological phenomena, including extreme heat, prolonged droughts, and catastrophic floods, are directly linked to the rise in the Earth’s temperature. These environmental changes pose significant challenges to human civilization, particularly affecting rural populations through the potential exacerbation of multidimensional relative poverty. In recent years, international academics have made important breakthroughs in the study of the relationship between climate change and poverty. Leichenko & Silva (2014) noted that climate change risks can have a direct impact on the incomes and livelihoods of poor households, and also contribute to the creation of “poverty traps” through their long-term impacts [
4]. Further research by Hallegatte et al. (2017) found that climate change exacerbates poverty through reduced agricultural yields and asset destruction, but that inclusive development policies are effective in mitigating its negative impacts [
5]. Yuan, X. et al. (2024) studied that rising temperatures and extreme weather events due to climate change have had a significant negative impact on global agricultural productivity. This decline in productivity has a direct impact on the incomes and food security of poor households that depend on agriculture [
6].
Empirical findings from multiple regions confirm the link. For example, Roquia Salam et al. (2020) revealed that in Bangladesh, frequent droughts and floods have pushed many rural households into or deepened poverty [
7], while in the northeastern highlands of Ethiopia, climate variability coupled with food security challenges has compromised agricultural households’ adaptive capacity while exacerbating their socioeconomic fragility (Hilemelekot F. et al., 2021; Ayinu YT. et al., 2022; Umar Demisse et al., 2024) [
8,
9,
10]. Similarly, pastoralist communities in the Borana region of Africa face serious livelihood challenges due to repeated droughts (Zewdie Birhanu et al., 2017; Abraham Abera F. et al., 2025) [
11,
12]. These studies are consistent with the findings of this study that climate change significantly exacerbates multidimensional relative poverty among rural households.
However, regional disparities exist in climate adaptation approaches. Research in Bangladesh underscores the crucial necessity of bolstering the adaptive capacity of farm households, with a focus on enhancing education, healthcare, and livelihood diversification (Roquia Salam et al., 2020) [
7], while Ethiopia focuses more on systemic interventions to enhance household resilience (Umar Demisse et al., 2024) [
10]. In contrast, this study instead investigates how digital financial inclusion alleviates climate change-induced rural poverty, offering innovative policy implications for global poverty alleviation strategies.
Digital financial inclusion has been recognized in recent years as an important tool for alleviating poverty and promoting economic inclusiveness. Research by Thiagarajah Ramilan et al. (2022) shows that easy access to credit significantly improves the ability of Indian households to cope with risk [
13], while related research in Africa has emphasized the critical role of technological innovation in weatherproofing against extreme weather (Baninla Yvette et al., 2022; Daka Ephraim, 2022; Boima M. Bernard Jr. 2023) [
14,
15,
16]. Notably, the spread of digital financial inclusion needs to incorporate regional differences: in Africa and South Asia, mobile payments have lowered the barriers to rural finance, while in developed countries, fintech innovation is more dominant (Alawi Suha M. et al., 2022; Saba Khan et al., 2024) [
17,
18]. The findings of this study provide an important reference for optimizing digital financial inclusion policies, highlighting their strategic value in global poverty reduction and climate adaptation.
This study advances the existing literature in three key ways. First, it adopts an innovative analytical framework to examine the impact of climate change on the multidimensional relative poverty of rural households in China, bridging a significant gap in existing empirical research that focuses primarily on income-based measures of poverty. Second, the analysis uses digital financial inclusion as a novel financial tool for mitigating climate-related poverty, shedding light on the complex interplay between climate risk, financial inclusion, and multidimensional poverty. Third, the heterogeneity analysis uncovered significant differences in climate vulnerability across geographic locations, income levels, and digitally literate populations. These findings provide policymakers with nuanced insights that can help them design targeted interventions to address multidimensional relative poverty in different socioeconomic contexts.
2. Theoretical Analysis
2.1. Theoretical Foundation
The analysis in this paper is based on economic vulnerability theory (Hoddinott & Quisumbing, 2003) [
19] and the poverty resilience literature (Barrett & Constas, 2014) [
20], which posit that households fall into multidimensional poverty due to income volatility, asset depletion, and insufficient coping capacity when exposed to external shocks, such as climate risk.
- (1)
Economic vulnerability theory
Developed by scholars such as Hoddinott and Quisumbing (2003) [
19], the Economic Vulnerability Theory (EVT) examines how exposure to risk and uncertainty can lead to a descent into poverty or prevent a population from reducing poverty. The theory argues that economic vulnerability stems not only from low income but also from a combination of risk factors, including income volatility, insufficient assets, lack of social security, health problems, low educational attainment, and weak social networks. These factors intertwine to form a cycle of vulnerability that makes it easier for individuals or households to fall into poverty in the face of external shocks (e.g., unemployment, illness, natural disasters) and more difficult to recover through their own strength. The theory places particular emphasis on the asset poverty trap (Carter & Barrett, 2006) [
21]—when shocks force households to sell off productive assets to maintain basic consumption, which will lead to a continued decline in productivity and a self-reinforcing cycle of poverty. Applied to climate change research, the theory reveals how natural risks can trigger cascading vulnerability through the destruction of farm household livelihood assets (e.g., land degradation, livestock deaths), and that tools such as digital finance can reduce vulnerability thresholds by enhancing risk diversification (insurance), accelerating capital accumulation (credit), and optimizing resource allocation (market access), providing a theoretical rationale for interrupting intergenerational transmission of poverty.
- (2)
Poverty resilience theory
Poverty Resilience Theory (PRT), systematically proposed by Barrett and Constas (2014) [
20], aims to show that in the face of risk and uncertainty, an individual, household, community, or system is able to remain stable and achieve sustainable development through adaptation, recovery, and transformation. It emphasizes that poverty is not just a lack of income or resources, but a form of vulnerability and risk. The theory argues that poor groups are not passive recipients of fate, but have a certain degree of mobility and adaptability, and that they build their resilience to cope with and recover from risks and shocks through the accumulation of assets, the development of skills, and the establishment of social networks. This theory breaks away from the static perspective of traditional poverty research and emphasizes the synergistic effects of enhanced access to financial instruments (such as digital inclusive finance) and investment in human capital and social safety nets to help households build a resilience ladder of “resilience to shocks, structural adjustment, and development”.
Economic vulnerability theory focuses on how external systemic risks (e.g., economic crises, natural disasters) push individuals into poverty, emphasizing structural vulnerability factors and revealing the external drivers of poverty; while poverty resilience theory focuses on how the internal capacities of individuals and communities (e.g., social capital, adaptive strategies) can help them withstand or escape from poverty, explicating the mechanism of endogenous dynamics of poverty exit. The combination of the two can form a more comprehensive policy framework that addresses the structural vulnerability of the economy and enhances the resilience of the population. This dual perspective of “risk diagnosis–resilience building” provides a complete theoretical underpinning for the formulation of poverty reduction policies that balance short-term protection with long-term capacity enhancement.
2.2. Analysis of the Mechanisms by Which Climate Change Risks Affect the Relative Poverty of Farm Households
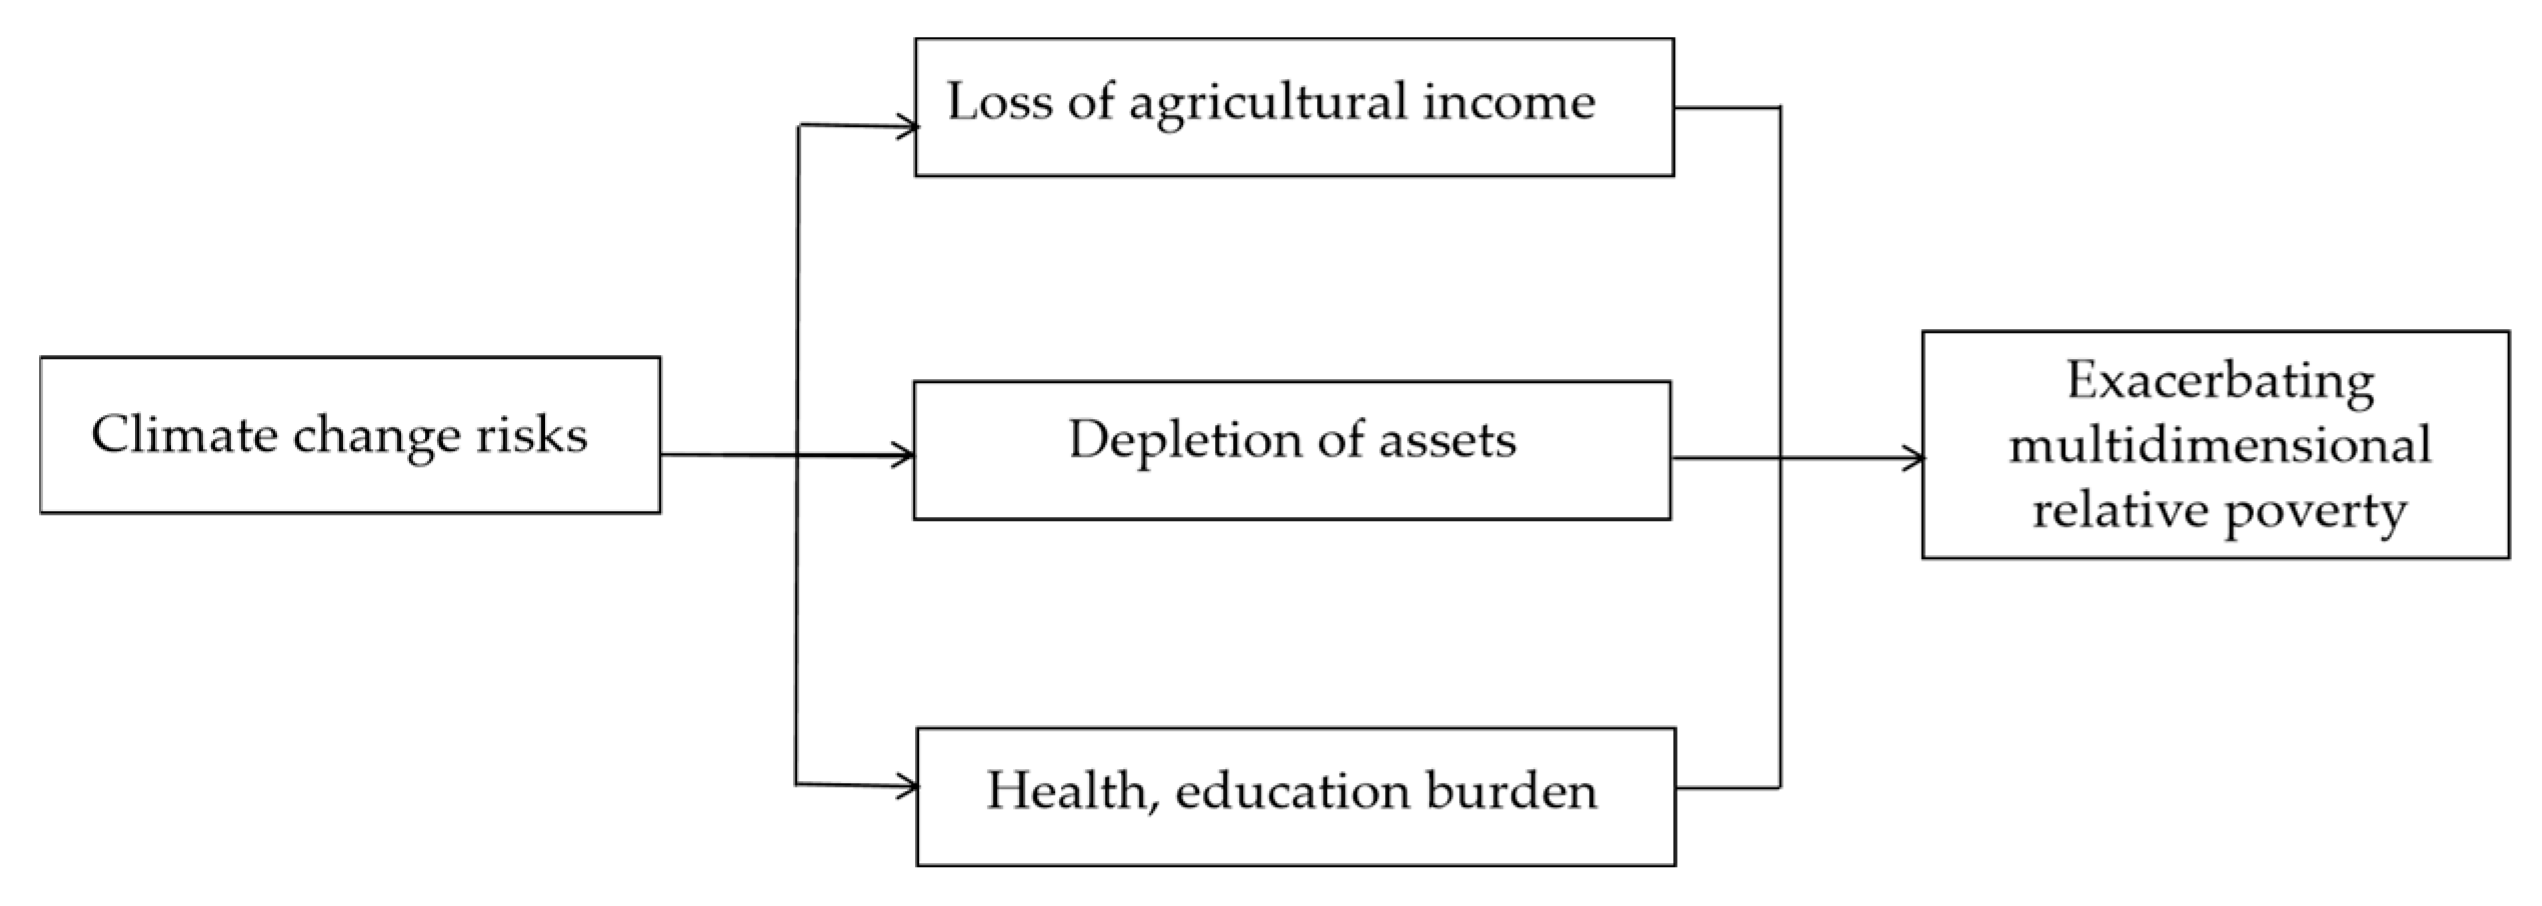
Climate change risks are exacerbating the relative poverty of farm households through multidimensional impact mechanisms, which fall into three main dimensions.
At the level of agricultural production, physical risks due to climate change are its main source of uncertainty. Weather extremes, including prolonged drought, excessive precipitation, and tropical cyclones, can severely disrupt crop growth and reduce agricultural productivity. (Tongxi Hu et al., 2024; Agha Ali Akram et al., 2025; Hui Mao et al., 2025) [
22,
23,
24]. Such impacts may lead to a significant drop in crop yields or even no harvest at all, which further cuts into the economic income of farmers and aggravates their economic poverty. According to the Food and Agriculture Organization of the United Nations (FAO), the persistent drought in North China during 2010–2011 affected the main wheat-producing areas, reducing wheat yields by about 5–10% and causing direct economic losses of more than USD 2 billion. At the same time, Somalia, Kenya, and other countries suffered a severe drought, and the World Food Program (WFP) reported that corn production fell by 50%, resulting in 13 million people facing a food crisis. In 2019, Japan’s Kanto region’s rice and fruit production areas were hit by floods caused by Typhoon Hajibis. According to a white paper by the Japanese Ministry of Agriculture, Forestry and Fisheries (MAFF), 20,000 hectares of farmland were damaged and apple and grape yields were reduced by 40 percent. Agriculture serves as the main source of income for rural households. The impact of climate risks on agriculture undoubtedly has an impact on the multidimensional relative poverty status of rural households.
At the asset and property level, extreme weather events brought about by climate change may damage the agricultural infrastructure of farm households, including but not limited to on-farm water facilities, irrigation channels, storage facilities, and so on (Njogu Humphrey Waita, 2021; de Abreu, V. H. S. et al., 2022; Bonginkosi E. Mthembu et al., 2025) [
25,
26,
27]. Repairing and reconstructing these infrastructures requires a large amount of capital, but farm households usually lack sufficient funds, which not only hinders normal agricultural production but also puts them in heavy debt and increases relative poverty. At the same time, climate change-induced natural disasters, such as earthquakes and mudslides, have the potential to cause direct damage to household assets such as homes, household furniture, and agricultural machinery. These assets are the wealth that farmers have accumulated over the years, and once they are damaged, they will be difficult to recover in the short term, and the farmers may fall into relative poverty.
In the areas of health and education, climate change has exacerbated the extent and frequency of disease transmission, exposing farming communities to significantly higher disease risks. Frequent disease attacks not only lead to a significant increase in medical expenses, but may also reduce the ability of farmers to work, which in turn reduces productivity and dramatically increases the economic pressure on the household. In addition, the increased household economic burden may negatively affect the educational opportunities for the children of farming households. Since education is a key way to enhance individual human capital and future earning potential, insufficient investment in education due to economic pressure will limit the access of children of farming households to high-quality educational resources, which in turn reduces the likelihood of their acquiring high-income occupations in the future, and ultimately leads to the intergenerational transmission of poverty (Behrman Jere R et al., 2017; Zhao Nan et al., 2023; Zheyuan Zhang et al., 2025) [
28,
29,
30].
Figure 1 illustrates a roadmap of mechanisms by which climate risk affects multidimensional poverty. Building upon the preceding theoretical framework, we formulated the first research hypothesis as follows:
H1: Climate change risks exacerbate multidimensional relative poverty among farm households.
Figure 1.
Roadmap of mechanisms by which climate risk affects multidimensional poverty.
Figure 1.
Roadmap of mechanisms by which climate risk affects multidimensional poverty.
2.3. The Moderating Role of Digital Financial Inclusion
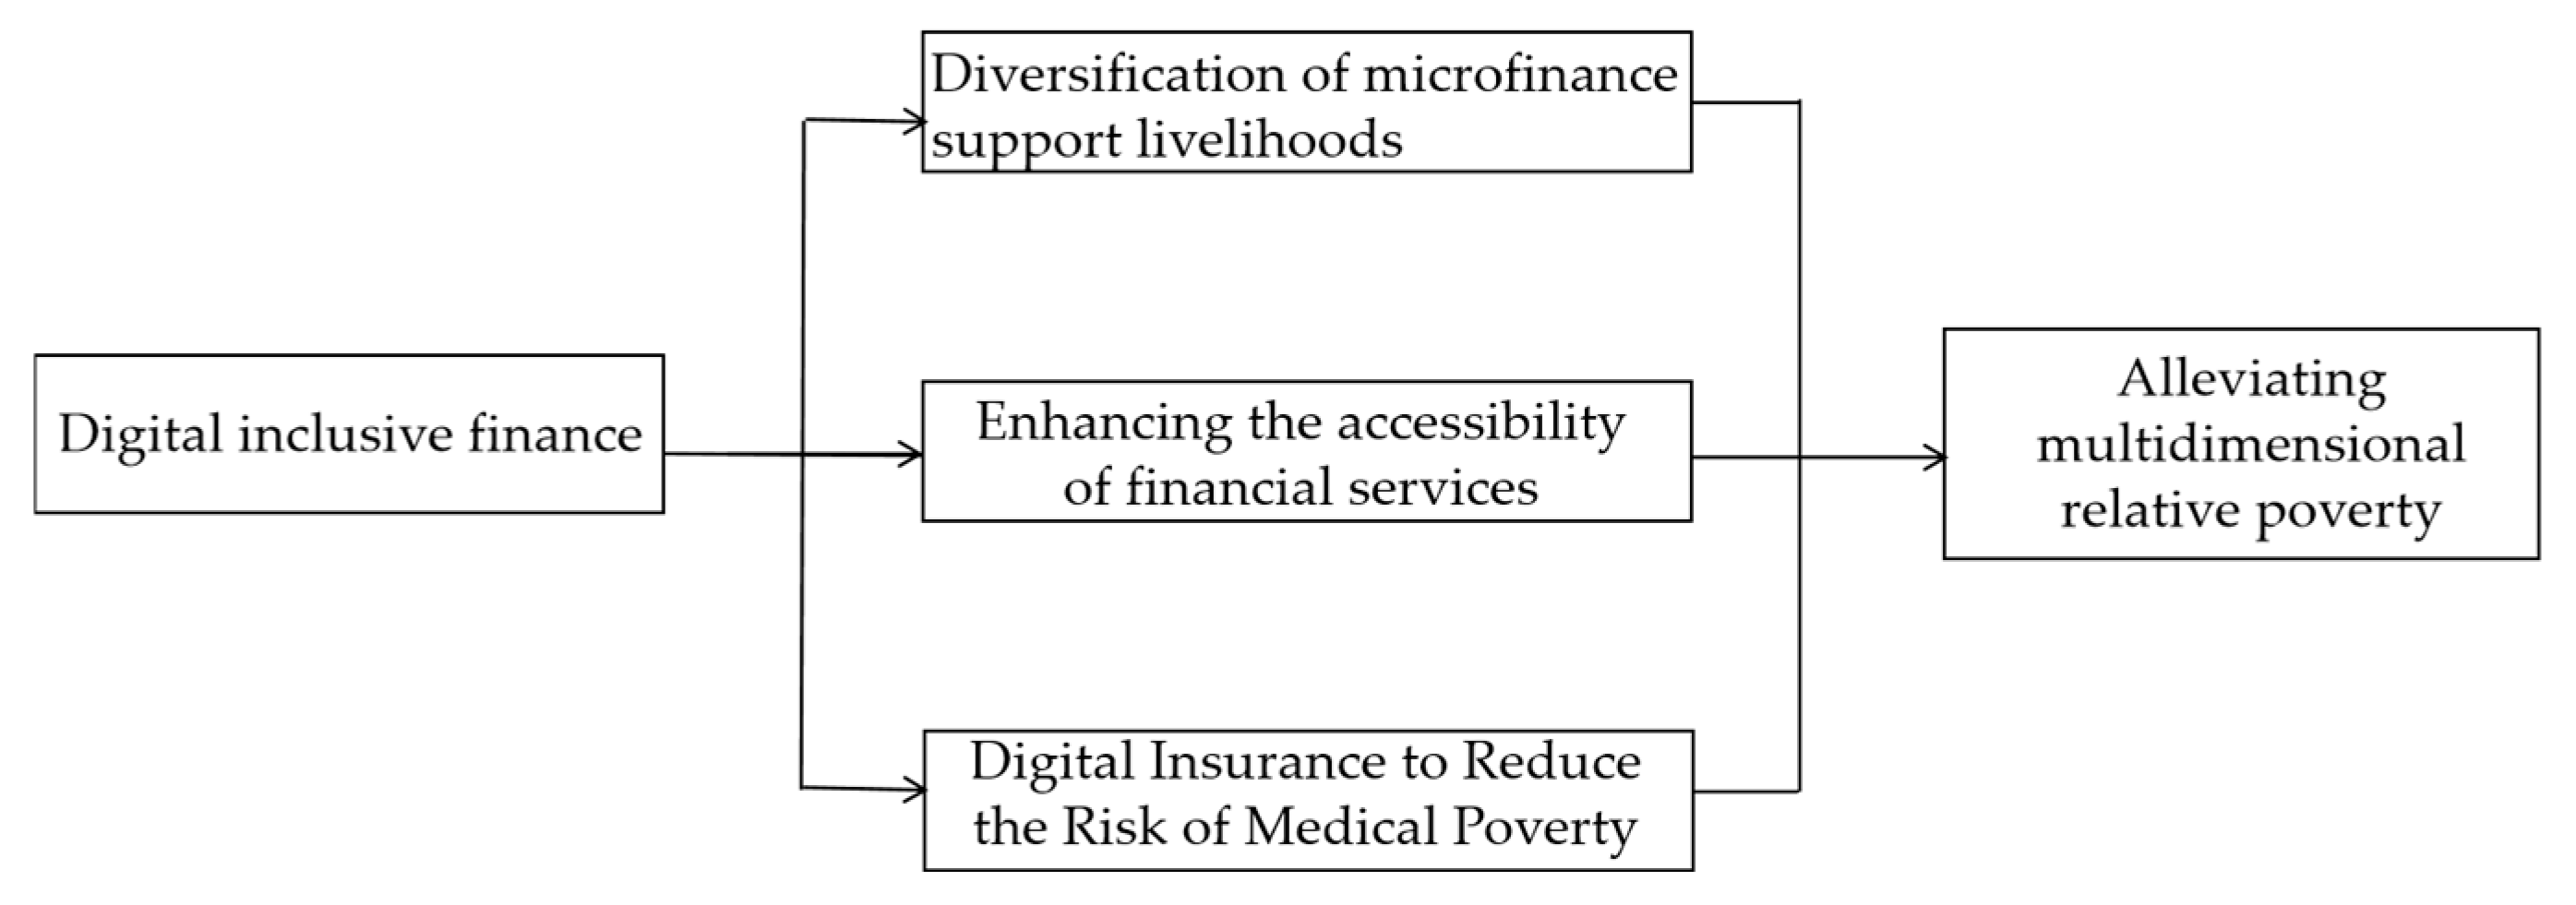
Against the backdrop of global climate change, the problem of multidimensional relative poverty among farm households is becoming increasingly prominent, and digital financial inclusion is gradually becoming a key force in alleviating this predicament. Digital financial inclusion mitigates the adverse impact of climate change on the multidimensional relative poverty of farm households in various ways.
In the first place, digital financial inclusion diversifies the livelihoods of agricultural households, creates employment opportunities, facilitates the occupational mobility of low-skilled workers, and, ultimately, increases the resilience of rural communities to economic shocks. By providing microcredit that is easy to apply for, quick to approve, offers favorable interest rates, and requires no collateral, digital inclusive finance helps farm households accumulate the initial capital needed to start their businesses and equip them to enter new industries. For example, digital inclusive finance helps to stimulate farmers’ interest in e-commerce and transform it into concrete, practical activities. At a time when traditional agricultural production faces many uncertainties due to climate change, e-commerce provides a new way for farmers to increase their income. Agricultural producers in mountainous regions have leveraged digital commerce channels to achieve nationwide distribution of their regional specialty crops. This digital integration has not only increased household incomes but also strengthened their resilience to climate-related shocks by diversifying their sources of income and reducing their dependence on local markets that are vulnerable to environmental disruptions. According to the China Rural E-Commerce Development Report (2011), Alibaba’s Taobao and other platforms have been used to alleviate poverty through e-commerce in rural areas of Yunnan, China. Post-harvest losses were reduced from 30% to 10% due to direct-to-consumer sales, while farmers selling honey, mushrooms, and tea online increased their incomes by 35–50% (World Bank, 2020). At the same time, low-skilled laborers can use microfinance to participate in some emerging rural services or specialty handicrafts to transform employment and increase income, thus mitigating the potential increase in poverty due to climate change (Li Zhaonan et al., 2021; Tian Gou et al., 2022) [
31,
32].
Also, digital inclusive finance helps rural residents access financial services and promotes inclusive economic development, thereby addressing climate change and reducing the risk of multidimensional relative poverty. Peng and Xu (2021) demonstrated that digital financial inclusion substantially enhances the resilience of agricultural households through mitigating both financial and informational barriers [
33]. This means that digital inclusive finance effectively reduces poverty vulnerability by providing deep financial services that enable farmers to more easily access economic, financial, and other information, and help farmers cope with the risks of crop yield reduction and livestock epidemics brought about by climate change. In extreme weather events, farmers with insurance coverage can resume production more quickly and avoid falling into long-term poverty.
In addition, climate change-induced extreme weather events significantly increase the risk of communicable disease transmission and exacerbation of non-communicable diseases, disproportionately affecting vulnerable and low-income groups in remote areas (Ebi, Kristie L. et al., 2021; Breitner-Busch, S. et al., 2023; Alhassan Siiba et al., 2024) [
34,
35,
36]. These population groups face multiple challenges: limited access to healthcare facilities, inadequate health insurance coverage, and limited financial capacity to withstand health shocks, making them particularly vulnerable to health-related poverty traps. Digital financial inclusion offers a transformative solution to these systemic barriers. By leveraging mobile payment systems and Internet platforms, digital financial inclusion circumvents the geographic and administrative constraints of traditional health insurance programs; this technological paradigm shift has given rise to new and more inclusive insurance products. Meanwhile, digital financial inclusion in China’s Guizhou Province, where a blockchain-based mutual health assistance program has reduced the recurrence of poverty due to health shocks by 28 percent (People’s Bank of China, 2023). This synergistic integration of digital financial inclusion and healthcare risk mitigation demonstrates that technological innovation can break the traditional poverty-disease cycle and provide scalable protection against multifaceted deprivation.
In summary, digital inclusive finance mitigates the adverse impact of climate change on multidimensional relative poverty of farm households in all aspects by enhancing the self-development capacity of farm households, improving the standard of living in rural areas, assisting the access to financial services, and promoting inclusive development, an important engine for promoting sustainable rural development and helping farm households to escape from poverty and become rich.
Figure 2 illustrates a roadmap of digital financial inclusion mechanisms to alleviate multidimensional poverty. Building upon the preceding theoretical framework, we formulate the second research hypothesis as follows:
H2: Digital inclusive finance has the potential to alleviate the negative effects of climate change on the multidimensional relative poverty of rural households.
Figure 2.
A roadmap of mechanisms for digital financial inclusion to alleviate multidimensional poverty.
Figure 2.
A roadmap of mechanisms for digital financial inclusion to alleviate multidimensional poverty.
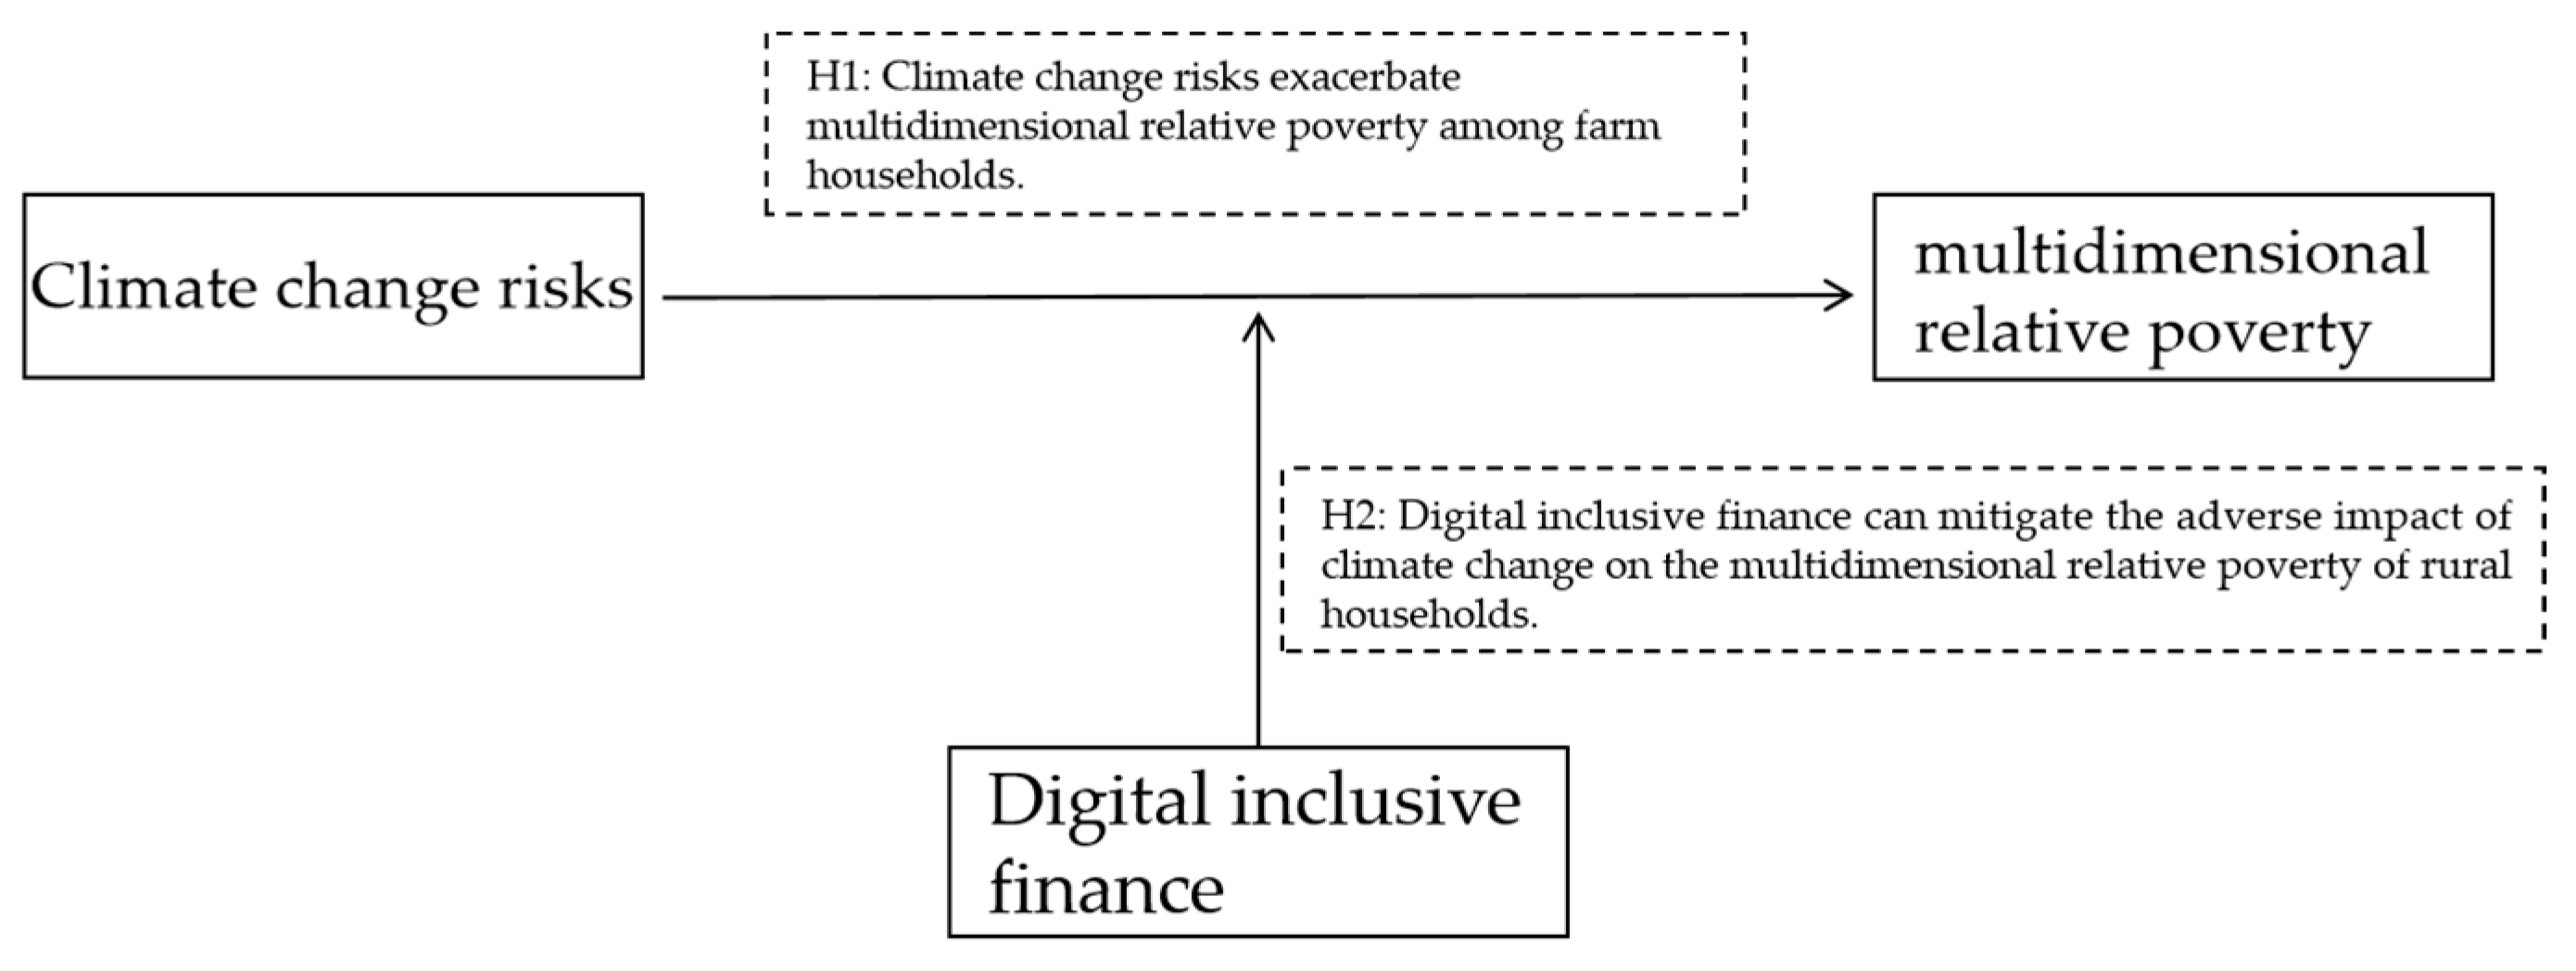
Figure 3 illustrates the relationship between the hypotheses regarding H1 and H2.
3. Materials and Methods
3.1. Data
This study utilizes four primary data sources, beginning with household-level microdata that use the China Household Finance Survey (CHFS) data from the China Household Finance Survey and Research Center of the Southwestern University of Finance and Economics [
37,
38]. These data collect detailed information on the demographic characteristics, assets and liabilities, social and security, expenditures and incomes, financial literacy, and subjective attitudes of the survey sample, providing a comprehensive and detailed portrayal of the economic situation and financial behaviors of Chinese households, and providing important data support for the study of multidimensional relative poverty. The study employs a three-stage, population-proportionate stratified sampling design to ensure both statistical validity and robust data quality. Next is the Climate Physical Risk Index (CPRI), which measures the risk of climate change, with data from the website of the International Energy Finance Network of the International Energy Transition Institute. Next, the Peking University Digital Financial Inclusion Total Index was used to measure the level of digital financial inclusion in each province. The index was jointly developed by Peking University’s Digital Finance Research Center in collaboration with Ant Financial Services Group, ensuring methodological rigor and strong external validity. The set of indices includes the digital inclusive finance index, as well as the breadth of digital finance coverage, the depth of digital finance use, and the degree of digitization of inclusive finance; in addition, the depth of use index contains categorical indices for businesses such as payment, credit, insurance, credit, investment, and money fund. Finally, the data for the head of household and household level of the control variables come from the CHFS database, and the macroeconomic-level data were sourced from the National Bureau of Statistics’ official publications.
This study employs panel data spanning four survey waves (2013, 2015, 2017, 2019) from 28 Chinese provinces and autonomous regions. To ensure data comparability, the analysis excludes Shanghai, Xinjiang, Tibet, and special administrative regions (Hong Kong, Macao, and Taiwan) due to incomplete statistical reporting. The data exclude samples with missing values for key variables and retains only the sample of rural household heads, finally obtaining micro-information on multidimensional relative poverty indicators of rural households, personal information of household heads, demographic characteristics of households, household income, assets, etc., and obtaining an effective sample size of 13,764 rural households.
3.2. Benchmark Model
To investigate the effects of climatic risks on rural households’ multidimensional deprivation and examine how digital financial inclusion moderates this relationship, this study establishes a binary Logit fixed effects model for empirical analysis and constructs the following regression model:
In the formula, for subscript i, c denotes the ith household in province c, and t denotes time. povertyict represents the multidimensional relative poverty index of farm households, CPRIct represents climate change risk, and PDIct represents the digital financial inclusion index. CPRIct*PDIct is the interaction term between the digital financial inclusion index and climate change risk, and this indicator is used to measure digital financial inclusion’s moderating effect. Xict represents control variables measured at both the household head and household levels, and Zct is a control variable at the macro level; is an individual fixed effect, and εict is a random error term.
3.3. Variables
- (1)
Explanatory variable: multidimensional relative poverty indicators for rural households
In this paper, the indicator of multidimensional relative poverty is chosen for empirical analysis, and in the selection of indicators, reference is made to Wang Xiaolin et al. (2020) [
39], which selects six dimensions: income, education, health, employment, social security, and quality of life. Specific dimension definitions are shown in
Table 1. In the construction of multidimensional relative poverty indicators, the multidimensional poverty measurement method proposed by Alkire and Foster (referred to as the A-F method) is borrowed; i.e., the poverty status of an individual in multiple dimensions is calculated by setting the poverty thresholds for each dimension and across dimensions, which are then aggregated into a composite index [
1].
In this paper, we organize the data in the Chinese Household Finance Survey CHFS: firstly, the database is filtered to retain only the household head, and secondly, the database is filtered to retain only the village data. According to the definition of the index, the sample data involved in the six dimensions of multidimensional poverty, namely, income, education, health, employment, social security, and quality of life, are screened and organized, and after invalid samples and samples with missing or abnormal values of the key indexes are excluded, the specific values of each dimensional index of each household are calculated, and a multidimensional relative poverty index measurement system is constructed.
Because the importance of poverty in all levels of dimensions is difficult to quantify, this paper adopts the method of equal weighting of the same level of dimensions for the assignment of weights, which is also a common treatment method in most of the relevant domestic and foreign research literature and statistical organizations (Dong X et al., 2021; You S et al., 2023) [
40,
41]. Accompanied by the successful implementation of China’s precision poverty alleviation work, the problem of income poverty has been significantly alleviated, and the importance of other dimensions of poverty has gradually come to the fore. When the multidimensional poverty level indicator increases, it demonstrates that the household experiences poverty in more aspects, revealing a more severe multidimensional poverty situation. In this study, we define the multidimensional relative poverty thresholds (*k*) as 0.3 and 0.4, constructing a binary variable (0–1) to classify rural households as poor (1) or non-poor (0) based on whether their multidimensional poverty index exceeds the threshold. For baseline regression analysis, we use the poverty index with k = 0.4 (poverty) as the core measure, while the index with k = 0.3 (poverty1) serves as an explanatory variable in robustness tests.
- (2)
Core explanatory variable: climate physical risk index
Building upon Guo, K et al.’s (2024) approach, we measure climate change risks at the provincial level using the Climate Physical Risk Index (CPRI) [
42]. The China Climate Physical Risk Index (CPRI) integrates four component indices (LTD, HTD, ERD, EDD) measuring annual extreme weather events—low/high temperature days, extreme rainfall days, and drought days—across China’s 31 provinces and 229 cities (1993–2023) (data description derived from
http://www.cnefn.com). These indicators are aggregated into a composite CPRI score reflecting regional climate risk severity. For analytical consistency with multidimensional poverty metrics, we applied standardization to the CPRI data.
- (3)
Moderating variable: digital financial inclusion index
Following the methodology established by Guo Feng et al. (2020), this study uses the Peking University Digital Financial Inclusion Total Index (PDI) as a measure of digital financial inclusion [
43]. Our empirical analysis utilizes both the composite PDI and its three sub-indices: coverage breadth, usage depth, and digitization degree. To ensure comparability with multidimensional rural poverty measures, we apply dimensionless standardization to all financial inclusion indices.
Controlling other variables that may have an impact on the multidimensional relative poverty of rural households can address the omitted variable bias and obtain more accurate estimation results. Regarding control variables, our study accounts for potential determinants of rural households’ multidimensional relative poverty across three dimensions: household head characteristics, household characteristics, and macro level. These include the head of the household level: age, gender, marital status; family level: family size, old age dependency ratio, juvenile dependency ratio, total household assets, housing situation; macro level: the level of openness to the outside world, consumer price index, the gross domestic product of each province, the level of urbanization, the level of Internet development.
Table 2 lists all the variable definitions.
Table 3 presents the descriptive statistics. The rural household multidimensional poverty indicator averages 0.498, revealing that 49.8% of sampled households experience multidimensional poverty, highlighting a severe rural poverty situation requiring societal attention. The standardized climate risk index ranges from −2.091 to 3.772, showing substantial interprovincial variation. Similarly, the digital financial inclusion index varies significantly across provinces, range: −1.843 to 2.426.
4. Results
4.1. Benchmark Regression Results
Table 4 presents the estimated effects of climate risk on rural multidimensional poverty and the moderating role of digital financial inclusion. Columns (1)–(2) display OLS results, while columns (3)–(4) report binary Logit fixed-effects estimates. Across all specifications, climate risk shows statistically significant positive coefficients on multidimensional poverty. The coefficient on the climate physical risk index in column (3) is 0.123, indicating that for each standard deviation change in the climate physical risk index, the probability of a farm household being multidimensionally relatively poor (Poverty = 1) increases from 49.8% to 52.9%, an increase of 3.1 percentage points in absolute terms. This indicates that climate change risk has a positive exacerbating effect on the level of multidimensional relative poverty of rural households, and Hypothesis 1 is tested. On the one hand, climate change leads to an increase in extreme weather events, such as droughts, floods, heavy rains, and typhoons, which seriously affect rural households’ income from agricultural production. On the other hand, climate change exacerbates infrastructure degradation in rural areas, escalates household disaster-related expenditures, and inflates agricultural commodity prices. These combined effects elevate rural living costs and intensify multidimensional relative poverty.
Table 4 columns (2) and (4) reveal significantly negative coefficients (−0.0286 and −0.374,
p < 0.01) for the digital financial inclusion index (PDI), demonstrating its poverty-alleviating effect. The interaction term CPRI×PDI has significantly negative coefficients (−0.0497 and −0.361,
p < 0.01), indicating an important moderating effect. Specifically, the −0.361 coefficient in column (4) suggests that a simultaneous increase of one standard deviation in both the Climate Physical Risk Index and the Digital Financial Inclusion Index mitigates the probability of multidimensionally relatively poor (Poverty = 1) farmers by 8.9 percentage points. This indicates that the development of digital inclusive finance can effectively mitigate the negative impact of climate change risk on the multidimensional poverty of rural households. The higher the level of digital inclusive finance in the area where the household is located, the lower the adverse impact of climate change risk on the multidimensional relative poverty of rural households. Hypothesis 2 is tested.
4.2. Robustness Checks
4.2.1. Treatment of Endogeneity Problems
Common endogeneity problems are mainly caused by reverse causation and omitted variables. Climate change not only affects natural resources such as land, water, and biological resources but also indirectly alters the lifestyles of rural households that depend on these resources and their state of poverty. Similarly, reductions in natural capital may affect both household livelihoods and climate change resilience. In this paper, the climate physical risk index of neighboring provinces in the same climate zone of each province is selected as the instrumental variable for the climate physical risk index of the province, and endogeneity is tested using the two-stage least squares (2SLS) method.
Table 5 presents the endogeneity test results. The significantly positive IV coefficient (Column 1) confirms the instrument’s relevance to the climate risk index. With a Kleibergen–Paap Wald rk F-statistic of 3821.901, substantially exceeding the Stock–Yogo 10% critical value (16.38), rejecting the null hypothesis of weak instruments. The results of the second stage show a statistically significant positive correlation between climate risk and multidimensional poverty. This indicates that climate risk significantly exacerbates multidimensional poverty. Meanwhile, digital financial inclusion maintains its mitigating effect on multidimensional poverty, a finding that persists even after controlling for endogeneity.
4.2.2. Changing the Construction of the Explanatory Variables
The choice of the critical value of the multidimensional relative poverty index will change the number of households in multidimensional relative poverty in each region. The larger the critical value, the fewer households are in multidimensional relative poverty. In the benchmark regression, this paper chooses 0.4 as the critical value for constructing the household multidimensional relative poverty index. For the sake of further exploring the robustness of the benchmark regression, this paper replaces the critical value of 0.3 for the construction of the multidimensional relative poverty index to form a new household multidimensional poverty index, poverty1, for robustness testing. The test results are shown in (1) and (2) of
Table 6, and the regression results of the two-way fixed effects after replacing the critical value of the multidimensional relative poverty index are consistent with the previous paper, indicating that the empirical results of this paper are robust.
4.2.3. Replacing the Measurement of Digital Financial Inclusion
Drawing on Yin Z (2020) [
44], we construct a household-level digital financial inclusion index comprising six dimensions: whether or not to have a bank account, credit card, formal loan, commercial insurance, financial products, and use of digital financial services (see
Table 7 for operational definitions). Following Sarma’s (2011) [
45] methodology, we calculate dimensional scores using the standardized formula:
where
Xi denotes the actual value on the
ith dimension,
mi is the minimum value on the ith dimension, and
Mi is the maximum value on the
ith dimension.
Subsequently, we employ the entropy method to determine indicator weights, which are then combined with standardized dimension scores to construct the Integrated Financial Inclusion Index (IFI). This index combines multiple dimensions of financial services in a region and reflects these dimensions in one value, the Digital Financial Inclusion Index (IFI). Zero represents a low degree of digital financial inclusion, i.e., complete financial exclusion, and one represents the absence of financial exclusion, i.e., complete digital financial inclusion. The data are from the CHFS database. To verify robustness, we substitute the aggregate Digital Financial Inclusion Index (PDI) with a household-level digital inclusion measure (IFI) and employ a linear fixed-effects specification. As evidenced in
Table 6 column (3), the climate risk–digital finance interaction maintains its statistically significant negative coefficient. This suggests that digital financial inclusion still has a moderating effect even after changing the measure of the digital financial inclusion index, further confirming the robustness of the empirical results.
4.2.4. Excluding Some Cities
Given policy-induced resource disparities, we conduct subsample analyses to address potential bias: first, excluding centrally administered municipalities (Beijing, Tianjin, Chongqing) with a higher degree of financial autonomy and resource allocation, and second, further omitting autonomous regions affected by ethnic policies.
Table 8 presents these robustness checks. Columns (1)–(2) exclude municipalities, while (3)–(4) exclude both municipalities and autonomous regions. After excluding some municipalities, the conclusions that climate change risks exacerbate multidimensional relative poverty among rural households and that digital financial inclusion mitigates this adverse effect still hold, further demonstrating the robustness of the baseline regression results.
4.3. Further Analysis of Sub-Dimensions
The digital financial inclusion framework comprises three core dimensions: coverage breadth, usage depth, and digitization degree. Regarding coverage breadth, technological innovations in digital finance have effectively overcome the spatial and temporal limitations characteristic of traditional financial services. This transformation has significantly expanded service accessibility to geographically remote regions and economically disadvantaged populations, thereby substantially improving financial service penetration rates. Regarding usage depth, digital inclusive finance not only provides basic payment and savings services but also covers a wide range of financial products such as credit, investment, insurance, etc., which meet the needs of different user groups and promote the deep integration of financial services into daily life and economic activities. Regarding digitization degree, leveraging cutting-edge technologies including big data analytics, cloud computing, and artificial intelligence, digital financial inclusion has achieved the dual outcome of enhancing financial service efficiency while reducing operational costs. This technological integration has enabled personalized and intelligent service delivery, thereby accelerating the digital transformation of the entire financial ecosystem. Digital inclusive finance has been jointly influenced by these three dimensions and has played an indispensable role in promoting financial inclusion and fueling the growth of micro and small enterprises and individual economies. For the sake of further exploring the moderating role of each dimension, this paper replaces the moderating variable, digital financial inclusion total index, with digital financial coverage breadth, digital financial usage depth, and financial inclusion digitization degree for a sub-dimensional test.
Table 9 presents the dimensional analysis of digital financial inclusion’s moderating effects, with column (1) reporting coverage breadth, column (2) usage depth, and column (3) digitization degree. Given the detected multicollinearity between the digitization degree and CPRI, we retained only their interaction term in the subdimensional regressions while excluding the standalone digitization degree variable. The results confirm that all three dimensions significantly mitigate climate-induced poverty among rural households. Comparative analysis reveals that usage depth demonstrates the strongest effect, followed by coverage breadth, while digitization degree shows relatively weaker influence.
4.4. Heterogeneity Analysis
4.4.1. Heterogeneity Analysis Based on Region
China is a vast country, but the developmental differences among regions have always been the core challenge in poverty governance in China. Since there are significant differences among regions in several aspects such as economic conditions, geography, resource allocation, and infrastructure, and the basis for residents to cope with climate change risks varies substantially from place to place, the development of digital inclusive finance may have different degrees of impact on the multidimensional poverty problem in different regions. An empirical study by Yi X (2018) using microdata from Chinese rural households found that the development of digital inclusive finance raised the overall consumption level of urban and rural residents, and the spillover effect was more significant for low-income groups in rural areas of central and western China [
46]. Consistent with established regional classifications in economic development literature, we stratify our sample of 28 provinces into three geographic regions: eastern (12 provinces: Beijing, Tianjin, Hebei, Liaoning, Jilin, Heilongjiang, Jiangsu, Zhejiang, Fujian, Shandong, Guangdong, Hainan), central (6 provinces: Shanxi, Anhui, Jiangxi, Henan, Hubei, Hunan), and western (10 provinces: Inner Mongolia, Guangxi, Chongqing, Sichuan, Guizhou, Yunnan, Shaanxi, Gansu, Qinghai, Ningxia).
Table 10 summarizes the regression outcomes for each designated region.
The regression analysis reveals distinct regional heterogeneity in climate change impacts. Specifically, climate risks significantly aggravate multidimensional poverty among rural households in both eastern and central China, with the central region exhibiting the most pronounced vulnerability. However, this effect is statistically insignificant in the western provinces. Digital financial inclusion demonstrates significant poverty-mitigation effects across all regions, though with varying intensity: strongest in central China, followed by the west, and relatively weakest in the east. Possible reasons are that the central area is China’s primary grain production base, and its heavy reliance on climate-sensitive wheat and rice cultivation creates acute vulnerability. The fixed crop cycles and critical growth phases make farming particularly susceptible to climatic shocks (e.g., spring frosts, flooding). When such disasters strike during crucial growth stages, the limited capacity for timely crop adjustment exacerbates income volatility, leaving households disproportionately exposed to climate-induced economic shocks. In contrast, rural households in the western region are more diversified in their mode of production, and in addition to farming, animal husbandry plays an important role (e.g., cattle and sheep breeding in Inner Mongolia and Qinghai), and herders can flexibly adjust the scope and time of grazing according to changes in the climate and pasture, which is an adaptability that gives them a stronger buffering capacity in the face of climate change.
4.4.2. Heterogeneity Analysis Based on Income Level
Household income disparity constitutes a key economic pillar for residents in the face of climate change risks. In China, differences in residents’ income levels and consumption structures have led to large differences in residents’ sensitivity to climate change. In the face of climate change, households at different income levels show very different responses. In addition, there are differences in the consumption ability and consumption tendency of families at different income levels. As income levels rise progressively, residents’ consumption capacity strengthens and expenditure scales expand correspondingly, with digital financial inclusion demonstrating more pronounced effects. Accordingly, this study classifies rural households into three income tiers (low, middle, and high) based on annual total income for stratified regression analysis. The income-heterogeneity estimation results are systematically presented in
Table 11.
The regression results demonstrate that climate change risk significantly intensifies multidimensional relative poverty across all income strata, with particularly severe impacts on middle-income rural households. This heightened vulnerability likely stems from middle-income households’ unique transitional position: unlike high-income households, they lack diversified income sources and robust risk mitigation mechanisms, yet unlike low-income households, they receive less targeted social assistance, creating a “missing middle” phenomenon in climate resilience. They are often dependent on specific agricultural or small-scale industries and experience a significant drop in income when climate disasters disrupt production patterns, as well as difficulties in quickly restructuring their consumption (e.g., rigid expenditures on education, health care, etc.), making them susceptible to borrowing difficulties. Meanwhile, in terms of the regulatory role of digital inclusive finance, digital inclusive finance can play a certain regulatory role for rural households at all income levels, but its mitigating effect on middle- and high-income households is more significant. Possible reasons for this are that middle- and upper-income people typically have wider social networks and can access new digital financial products (e.g., information on disaster emergency loans) more quickly and utilize them effectively; poor households may miss out on supportive policies due to a lack of information.
4.4.3. Heterogeneity Analysis Based on Digital Literacy
Rural residents’ differential digital literacy levels create a dual effect: shaping their climate change adaptation strategies, and moderating digital inclusion’s capacity to alleviate climate-induced multidimensional poverty. Prof. Murdoch called the attention of the academic community and the public to the strong link between digital communication and the climate crisis and emphasized that digital media technologies are not only a force for climate change, but also have the potential to be a key tool for mitigating the climate crisis. Digital literacy refers to an individual’s ability to effectively access, understand, evaluate, apply, and create digital information in a digital environment. It encompasses not only basic computer and Internet-use skills but also broader literacy in information processing, communication, security, and ethics. Digital literacy education helps to improve the comprehensive quality of the population to cope with climate change issues. In modern society, digital literacy is regarded as one of the key skills needed by citizens, and its importance is becoming increasingly obvious, especially in the rapid progress of digital transformation. Based on this, this paper selects the number of rural broadband access subscribers in each province as the basis for the division of rural households’ digital literacy data into low-digital literacy households and high-digital literacy households for regression estimation, respectively. The regression results of the sub-digital literacy heterogeneity analysis are shown in
Table 12.
The regression results reveal that climate change risks exert more severe adverse effects on the high digital literacy cohort, while digital financial inclusion demonstrates stronger mitigation effects for this group. This phenomenon may stem from the digitally enhanced exposure effect. The digitally enhanced exposure effect refers to the fact that the popularization and application of digital technology significantly increases the intensity of an individual’s exposure to information in a given risk situation. In the field of climate change, this effect is particularly prominent: digital technology has not only reconfigured the dissemination mode of risk information but also profoundly changed people’s risk perception and behavioral response mechanisms. Specifically, highly digitally literate groups are continuously exposed to massive amounts of climate change risk information through digital channels such as the Internet and social media. This high-intensity information exposure will have a double impact: at the cognitive level, information overload will increase the risk cognitive burden of individuals, making it difficult for them to effectively screen key information; at the emotional level, continuous exposure to negative risk information will easily induce anxiety, forming a vicious cycle of “risk amplification–anxiety reinforcement”. This dual impact will ultimately be reflected in economic decision-making behavior: although highly digitally literate groups are more sensitive to climate change risks, excessive information stimulation may lead to irrational risk avoidance behavior. This phenomenon essentially reveals the “paradox of cognitive overload” in the digital age—when risk information exceeds an individual’s cognitive processing capacity, the information advantage is transformed into a decision-making disadvantage. Therefore, highly digitally literate groups are more susceptible to the impact of climate change risks.
5. Discussion
This study provides empirical evidence that climate change risk (CPRI) exacerbates multidimensional relative poverty among rural households in China, emphasizing the urgency of developing policies to enhance climate resilience. Results show that households facing greater climate variability experience significantly higher deprivation in terms of income, education, health, and standard of living, highlighting the need to integrate climate adaptation strategies into poverty alleviation programs. Notably, the moderating role of digital financial inclusion (PDI) offers a viable pathway for mitigating climate shocks. By expanding livelihood pathways, improving financial accessibility, and optimizing risk management tools, digital inclusive finance can help buffer households from the negative impacts of climate risks. Policymakers should prioritize expanding the coverage of digital financial services in rural areas, accompanied by targeted financial literacy programs to maximize their policy impact. In addition, the design of financial products (e.g., microinsurance and flexible credit options) specifically tailored to the needs of rural households facing climate risks can further enhance their resilience to climate shocks.
Despite the important findings of this study, several limitations remain: first, the study is based on CHFS data from 2013 to 2019 and may not adequately reflect extreme weather events in recent years or recent developments in digital financial inclusion. Second, although some of the endogeneity issues are mitigated by fixed effects modeling, unobservable variables such as social networks and local governance may still affect the results. Third, this study focuses on the overall effect of digital financial inclusion without delving into the specific mechanisms through which it plays a moderating role. Further research could explore the channels through which digital financial services enhance rural resilience, such as by improving access to credit, providing risk-sharing mechanisms, or facilitating financial planning and savings. Finally, this study focuses on the Chinese context, and its findings have limited generalizability to other regions with significant differences in climate and socioeconomic conditions.
Future research should aim to address the limitations of this study and build on them. First, updating the analysis using more recent data to capture the latest trends in climate change risks and digital financial inclusion would help to more accurately assess the current situation and inform timely policy interventions. At the same time, more detailed temporal analyses are needed to better understand the different short- and long-term impacts of climate change on poverty dynamics. Second, future research should further explore the potential mechanisms by which digital financial inclusion mitigates the impacts of climate change risks. This could be conducted through qualitative research, case studies, or experimental designs to understand how rural households use digital financial services to cope with climate shocks and improve their overall financial well-being. Finally, future research could incorporate cross-country panel data or comparative case studies to test the applicability of this study’s findings across different climatic zones, levels of economic development, and financial system environments, with a particular focus on the performance of heterogeneity in regions with frequent climate extremes (e.g., Southeast Asia’s monsoon zone, Africa’s arid zones) and in countries dominated by small-farmer economies, to build a more generalizable framework for climate–finance–poverty analysis.
6. Conclusions
Utilizing multidimensional poverty indicators for rural households alongside empirical data, including climate physical risk indices and Peking University’s Digital Financial Inclusion Index from 2013 to 2019, this study examines the adverse impact of climate change risk on the multidimensional relative poverty of rural households and the moderating role of digital inclusive finance, with rural households as the research object. The analysis reveals: climate change risks significantly aggravate rural multidimensional poverty, while digital financial inclusion effectively buffers these impacts. Further robustness tests through endogeneity analysis, substitution variable treatment, and exclusion of some cities consistently confirm our core findings: climate risks significantly aggravate rural multidimensional poverty, and digital financial inclusion effectively mitigates these adverse impacts. Subdimensional analysis reveals that the usage of the depth dimension demonstrates the strongest mitigating effect. In addition, the heterogeneity tests further reveal the following results: the mitigating effect of digital financial inclusion is more pronounced in the central region, among middle- and high-income households, and among highly digitally literate households. Based on these empirical results, the paper provides three policy suggestions:
First, strengthening the research and development and popularization of climate adaptation technologies in the agricultural sector. The Government should set up a special research and development fund for agricultural climate adaptation technologies, and establish a stable financial support mechanism to provide sustained financial security for relevant research. The fund can be based on regional agricultural characteristics and climate vulnerability differences, and the implementation of a differentiated funding allocation strategy, focusing on supporting the development of key technologies that have a significant impact on regional agricultural production. At the same time, a financial and tax incentive mechanism should be established to guide agribusinesses to increase their R&D investment in climate adaptation technologies through R&D tax credits, special subsidies, and other policy tools. Specifically, stepwise tax incentives can be implemented for priority areas such as the selection and breeding of drought- and flood-resistant crop varieties, or a linkage mechanism between R&D inputs and financial subsidies can be established to effectively enhance the innovation momentum of market players.
Secondly, climate financing mechanisms should be developed to enhance the climate resilience of farmers. The Government should take the lead in setting up a special fund for climate financing, building a diversified system of funding sources, integrating channels such as the fiscal budget, proceeds from carbon emissions trading, and social capital, and focusing on supporting climate adaptation and mitigation projects in the agricultural sector. The fund can prioritize investment in key areas such as renewable energy agricultural applications and climate-smart water infrastructure to enhance the climate resilience of the agricultural system, and provide targeted financial support for poor areas. At the same time, the climate finance policy incentive framework should be improved to reduce the credit risk and capital cost of financial institutions through tools such as tax relief, risk compensation, and financial interest subsidies, and guide them to expand the scale of financing for agricultural climate adaptation projects.
Thirdly, an agro-climatic information-sharing platform should be established to support the development of organizations such as farmers’ cooperatives and agricultural associations. The Government should implement a “social network support plan” and set up community cooperation centers in rural areas to provide places for farmers to communicate, cooperate, and share resources, so as to encourage farmers to take collective action to jointly address the challenges posed by climate change. At the same time, an agro-climatic information-sharing platform has been set up, and digital means have been used to disseminate timely information on climate warnings, agricultural technology guidance, and market dynamics, so as to assist farmers in scientific decision making. Furthermore, regular climate change adaptation training programs should be implemented to increase farmers’ understanding of climate risks, develop practical coping skills, and foster community collaboration and knowledge-sharing practices. These integrated training initiatives will strengthen both individual capacity and collective action, ultimately improving farmers’ preparedness to address climate challenges through enhanced cooperation and resource pooling.
Author Contributions
J.L.: Conceptualization, Methodology, Validation, Formal analysis, Investigation, Data Curation, Writing—Review & Editing, Visualization, Supervision, Funding acquisition. L.C.: Methodology, Formal analysis, Investigation, Writing—Original Draft & Editing, Data Curation, Visualization, Writing—Review & Editing. All authors have read and agreed to the published version of the manuscript.
Funding
This article is supported by The Natural Science Foundation of Hunan Province (No.2022JJ30404).
Institutional Review Board Statement
Not applicable.
Informed Consent Statement
Not applicable.
Data Availability Statement
The data are available from the corresponding authors upon request.
Acknowledgments
Authors used Kimi 2.0.8, developed by Moonshot AI, to quickly obtain background information related to the research topic by inputting keywords or questions, which helps them gain a comprehensive understanding of the research field in a short time.
Conflicts of Interest
The authors declare no conflicts of interest.
References
- Alkire, S.; Foster, J. Counting and multidimensional poverty measurement. J. Public Econ. 2011, 95, 476–487. [Google Scholar] [CrossRef]
- Wang, S.-g.; Liu, M.-y. From absolute poverty to relative poverty: Theoretical relationships, strategic shifts and policy priorities. J. South China Norm. Univ. (Soc. Sci. Ed.) 2020, 6, 18–29. [Google Scholar]
- Ahmed, H.; Correa, J.S.; Sitko, N.J. Climate adaptation, perceived resilience, and household wellbeing: Comparative evidence from Kenya and Zambia. Ecol. Econ. 2025, 235, 108611. [Google Scholar] [CrossRef]
- Leichenko, R.; Silva, J.A. Climate change and poverty: Vulnerability, impacts, and alleviation strategies. Wiley Interdiscip. Rev. Clim. Change 2014, 5, 539–556. [Google Scholar] [CrossRef]
- Hallegatte, S.; Rozenberg, J. Climate change through a poverty lens. Nat. Clim. Change 2017, 7, 250–256. [Google Scholar] [CrossRef]
- Yuan, X.; Li, S.; Chen, J.; Yu, H.; Yang, T.; Wang, C.; Huang, S.; Chen, H.; Ao, X. Impacts of global climate change on agricultural production: A comprehensive review. Agronomy 2024, 14, 1360. [Google Scholar] [CrossRef]
- Salam, R.; Towfiqul Islam, A.R.M.; Shill, B.K.; Monirul Alam, G.M.; Hasanuzzaman, M.; Morshadul Hasan, M.; Ibrahim, S.M.; Shouse, R.C. Nexus between vulnerability and adaptive capacity of drought-prone rural households in northern Bangladesh. Nat. Hazards 2021, 106, 509–527. [Google Scholar] [CrossRef]
- Hilemelekot, F.; Ayal, D.Y.; Ture, K.; Zeleke, T.T. Climate change and variability adaptation strategies and their implications for household food Security: The case of Basona Worena District, North Shewa zone, Ethiopia. Clim. Serv. 2021, 24, 100269. [Google Scholar] [CrossRef]
- Ayinu, Y.T.; Ayal, D.Y.; Zeleke, T.T.; Beketie, K.T. Impact of climate variability on household food security in Godere District, Gambella Region, Ethiopia. Clim. Serv. 2022, 27, 100307. [Google Scholar] [CrossRef]
- Demisse, U.; Bazezew, A.; Bantigegen, S. Rural households’ resilience to the adverse impacts of climate variability and food insecurity in the North-eastern highlands of Ethiopia. Heliyon 2024, 10, e32960. [Google Scholar] [CrossRef]
- Birhanu, Z.; Ambelu, A.; Berhanu, N.; Tesfaye, A.; Woldemichael, K. Understanding resilience dimensions and adaptive strategies to the impact of recurrent droughts in Borana Zone, Oromia Region, Ethiopia: A grounded theory approach. Int. J. Environ. Res. Public Health 2017, 14, 118. [Google Scholar] [CrossRef] [PubMed]
- Feyissa, A.A.; Angassa, A.; Tadesse, M. Are climate change adaptation strategies interrelated? Evidence from Borana pastoral communities, southern Ethiopia. Front. Clim. 2025, 7, 1545422. [Google Scholar] [CrossRef]
- Ramilan, T.; Kumar, S.; Haileslassie, A.; Craufurd, P.; Scrimgeour, F.; Kattarkandi, B.; Whitbread, A. Quantifying farm household resilience and the implications of livelihood heterogeneity in the semi-arid tropics of India. Agriculture 2022, 12, 466. [Google Scholar] [CrossRef]
- Baninla, Y.; Sharifi, A.; Allam, Z.; Tume, S.J.P.; Gangtar, N.N.; George, N. An overview of climate change adaptation and mitigation research in Africa. Front. Clim. 2022, 4, 976427. [Google Scholar] [CrossRef]
- Ephraim, D. Adopting Clean Technologies to Climate Change Adaptation Strategies in Africa: A Systematic Literature Review. Environ. Manag. 2022, 71, 87–98. [Google Scholar]
- Bernard, B.M., Jr.; Song, Y.; Narcisse, M.; Hena, S.; Wang, X. A nonparametric analysis of climate change nexus on agricultural productivity in Africa: Implications on food security. Renew. Agric. Food Syst. 2023, 38, e9. [Google Scholar] [CrossRef]
- Alawi, S.M.; Abbassi, W.; Saqib, R.; Sharif, M. Impact of financial innovation and institutional quality on financial development in emerging markets. J. Risk Financ. Manag. 2022, 15, 115. [Google Scholar] [CrossRef]
- Khan, S.; Ullah, A.; Pinglu, C.; Kashif, M. Impact of financial technology innovation on sustainable transition finance: The moderating role of globalization in BRI, advanced and emerging economies. Clean Technol. Environ. Policy 2024, 27, 1479–1503. [Google Scholar] [CrossRef]
- Hoddinott, J.; Quisumbing, A. Methods for microeconometric risk and vulnerability assessment. In Risk, Shocks, and Human Development: On the Brink; Palgrave Macmillan: London, UK, 2010; pp. 62–100. [Google Scholar]
- Barrett, C.B.; Constas, M.A. Toward a theory of resilience for international development applications. Proc. Natl. Acad. Sci. USA 2014, 111, 14625–14630. [Google Scholar] [CrossRef]
- Carter, M.R.; Barrett, C.B. The economics of poverty traps and persistent poverty: An asset-based approach. J. Dev. Stud. 2006, 42, 178–199. [Google Scholar] [CrossRef]
- Hu, T.; Zhang, X.; Khanal, S.; Wilson, R.; Leng, G.; Toman, E.M.; Wang, X.; Li, Y.; Zhao, K. Climate change impacts on crop yields: A review of empirical findings, statistical crop models, and machine learning methods. Environ. Model. Softw. 2024, 179, 106119. [Google Scholar] [CrossRef]
- Akram, A.A.; Abidoye, B.; Kannan, S.; Omotoso, K. The impact of climate change on African agriculture: A Ricardian analysis of smallholder farmers in sub-Saharan Africa. Clim. Change 2025, 178, 1–19. [Google Scholar] [CrossRef]
- Mao, H.; Sun, Z.; Chai, A.; Fang, L.; Shi, C. Extreme Weather, agricultural insurance and farmer’s climate adaptation technologies adoption in China. Ecol. Econ. 2025, 228, 108456. [Google Scholar] [CrossRef]
- Njogu, H.W. Effects of floods on infrastructure users in Kenya. J. Flood Risk Manag. 2021, 14, e12746. [Google Scholar] [CrossRef]
- De Abreu, V.H.S.; Santos, A.S.; Monteiro, T.G.M. Climate change impacts on the road transport infrastructure: A systematic review on adaptation measures. Sustainability 2022, 14, 8864. [Google Scholar] [CrossRef]
- Mthembu, B.E.; Cele, T.; Mkhize, X. Climate Change Impacts on Agricultural Infrastructure and Resources: Insights from Communal Land Farming Systems. Land 2025, 14, 1150. [Google Scholar] [CrossRef]
- Behrman, J.R.; Schott, W.; Mani, S.; Crookston, B.T.; Dearden, K.; Duc, L.T.; Fernald, L.C.; Stein, A.D. Intergenerational transmission of poverty and inequality: Parental resources and schooling attainment and children’s human capital in Ethiopia, India, Peru, and Vietnam. Econ. Dev. Cult. Change 2017, 65, 657–697. [Google Scholar] [CrossRef]
- Zhao, N.; Liao, W.; Xia, J.; Zhang, Z. The effect of intergenerational mobility on family education investment: Evidence from China. Humanit. Soc. Sci. Commun. 2023, 10, 613. [Google Scholar] [CrossRef]
- Zhang, Z.; Xu, H.; Liu, R.; Zhao, Z. Free education and the intergenerational transmission of cognitive skills in rural China. J. Popul. Econ. 2025, 38, 29. [Google Scholar] [CrossRef]
- Li, Z.; Li, Y.; Liu, S.; Liu, Q. The impact of digital inclusive finance on rural households’ relative poverty: Evidence from farmer survey data in Ningxia. Res. Agric. Mod. 2021, 42, 1104–1113. [Google Scholar] [CrossRef]
- Tian, G.; Zhang, X. Digital economy, non-agricultural employment, and division of labor. J. Manag. World 2022, 38, 72–84. [Google Scholar]
- Peng, P.; Xu, Z.G. Can digital inclusive finance reduce the vulnerability of peasant households. Econ. Rev. 2021, 42, 82–95. [Google Scholar]
- Ebi, K.L.; Vanos, J.; Baldwin, J.W.; Bell, J.E.; Hondula, D.M.; Errett, N.A.; Hayes, K.; Reid, C.E.; Saha, S.; Spector, J.; et al. Extreme weather and climate change: Population health and health system implications. Annu. Rev. Public Health 2021, 42, 293–315. [Google Scholar] [CrossRef] [PubMed]
- Breitner-Busch, S.; Mücke, H.G.; Schneider, A.; Hertig, E. Impact of climate change on non-communicable diseases due to increased ambient air pollution. J. Health Monit. 2023, 8 (Suppl. S4), 103. [Google Scholar]
- Siiba, A.; Kangmennaang, J.; Baatiema, L.; Luginaah, I. The relationship between climate change, globalization and non-communicable diseases in Africa: A systematic review. PLoS ONE 2024, 19, e0297393. [Google Scholar] [CrossRef]
- Gan, L.; Yin, Z.; Tan, J. Report on the Development of Household Finance in Rural China (2014); Springer: Singapore, 2016. [Google Scholar]
- Gan, L.; Yin, Z.; Jia, N.; Xu, S.; Ma, S.; Zheng, L. Data You Need to Know About China Research Report of China Household Finance Survey 2012; Springer: Berlin/Heidelberg, Germany, 2014; pp. 66–78. [Google Scholar]
- Wang, X.; Feng, H. China’s multidimensional relative poverty standards after 2020: International experience and policy orientation. Chin. Rural Econ. 2020, 3, 2–21. [Google Scholar]
- Dong, X.; Wu, Y.; Xiong, J. The impact of financial service participation methods on farmers’ multidimensional relative poverty. China Rural Surv. 2021, 6, 47–64. [Google Scholar] [CrossRef]
- You, S.; Liu, D.; Qin, W.; Jiang, J. Research on the alleviation effect of digital inclusive finance on relative poverty. Stat. Decis. 2023, 39, 142–146. [Google Scholar] [CrossRef]
- Guo, K.; Ji, Q.; Zhang, D. A dataset to measure global climate physical risk. Data Brief 2024, 54, 110502. [Google Scholar] [CrossRef]
- Guo, F.; Wang, J.; Wang, F.; Kong, T.; Zhang, X.; Cheng, Z. Measuring China’s digital financial inclusion: Index compilation and spatial characteristics. China Econ. Q. 2020, 19, 1401–1418. [Google Scholar]
- Yin, Z.; Zhang, D. Financial inclusion, household poverty and vulnerability. China Econ. Q. 2020, 20, 153–172. [Google Scholar]
- Sarma, M.; Pais, J. Financial inclusion and development. J. Int. Dev. 2011, 23, 613–628. [Google Scholar] [CrossRef]
- Yi, X.J.; Zhou, L. Does the development of digital inclusive finance significantly affect residents’ consumption: Micro-evidence from Chinese households. J. Financ. Res. 2018, 11, 47–67. [Google Scholar]
| Disclaimer/Publisher’s Note: The statements, opinions and data contained in all publications are solely those of the individual author(s) and contributor(s) and not of MDPI and/or the editor(s). MDPI and/or the editor(s) disclaim responsibility for any injury to people or property resulting from any ideas, methods, instructions or products referred to in the content. |
© 2025 by the authors. Licensee MDPI, Basel, Switzerland. This article is an open access article distributed under the terms and conditions of the Creative Commons Attribution (CC BY) license (https://creativecommons.org/licenses/by/4.0/).


