Article

The Spatial Correlation Network of China’s Urban Digital Economy and Its Formation Mechanism

College of Geography and Environment, Shandong Normal University, Jinan 250358, China
*
Author to whom correspondence should be addressed.
Sustainability 2025, 17(12), 5382; https://doi.org/10.3390/su17125382
Submission received: 1 May 2025 / Revised: 8 June 2025 / Accepted: 9 June 2025 / Published: 11 June 2025

Abstract

:
Based on digital patent data from 359 Chinese cities between 2006 and 2022, this paper calculates the gravitational value of the digital economy using a modified gravity model and employs social network analysis and QAP analysis to investigate the correlation network of cities’ digital economy and the influencing factors. The study found the following: (1) Chinese cities have a high level of digital economy, showing a consistent increase in growth rate, and density and relevance are rising without revealing a distinct hierarchical network structure. (2) The inner economic network demonstrates a significant imbalance, as illustrated by the “Matthew effect”. Core cities like Shenzhen and Beijing show greater net spillover, indicating their role as network hubs, while less developed cities have lower net spillover, necessitating improvements in interconnection capacity. (3) Differences in economic scale, population quality, scientific and technological innovation, and infrastructure construction, which have a positive effect, are the main sources of linkage network formation. At the same time, the difference in urbanization rates is stage-specific, reflecting the dual logic of factor complementarity and policy synergy. Overall, this study reveals the dynamic evolution of the digital economic spatial network through city-scale innovation and provides theoretical support for promoting the region’s sustainable and coordinated development.

1. Introduction

Since the onset of the twenty-first century, the world’s scientific and technical innovation activity has peaked historically against the background of the rapid evolution period. The factors of production in social and economic life have changed significantly during this process, and “data” has become the most important factor among them. As a result, the digital economy built on data has emerged as a new form of social development. It has gathered international support, and digital transformation has come about as the world’s largest development trend. Many countries have made digitization their top priority and actively promote the growth of the digital economy [1]. Restructuring the economic structure, altering the competitive environment, and reorganizing global resource factors are all made possible by the digital economy, which also helps to create favorable conditions for closing the development gap between areas [2]. China has seen remarkable growth in its digital economy in recent years. With Comrade Xi Jinping at its center, the Communist Party of China (CPC) Central Committee has prioritized the growth of the digital economy since the 18th CPC National Congress. It has seized the major historical opportunity for global digital development and transformation, systematically planned and coordinated the promotion of the construction of “Digital China”, and built a novel framework for the growth of the digital economy [3]. Since 2017, the Chinese government has included “digital economy” in its work reports on four occasions. According to the China Digital Economy Development Report 2022 released by the China Academy of Information and Communications Technology (CAICT), a nominal annual growth rate of 16.2% was recorded in 2021, when the overall scale reached CNY 45.5 trillion. Its share of the GDP was 39.8%, marking an increase of 1.2 percentage points from 2020. This growth serves as a vital force for stabilizing economic growth and advancing the country’s development. Furthermore, the 20th Party Congress report emphasized the urgency of accelerating the establishment of digital China and fostering the digital economy’s growth; thus, the digital economy has emerged as a research hotspot.
Networking is a new trend in regional economic development [4]. The new technical revolution, the new economic structure, the new method of allocating resources, and the need for innovation have all been deeply integrated to create the digital economy. At the digital geography level, it eliminates the constraints of physical space, converts “geographical proximity” in the conventional sense into “digital accessibility”, and establishes an innovative type of geographic pattern, acknowledging the intricacy of economic ties and the blurring of regional boundaries [5], speeding up the growth of the digital economic network. On the one hand, the network can map the extent and depth of interregional cooperation and speed up the interaction of the components of the regional economic system. On the other hand, the “point–line–plane” development pattern of the digital economy network can quickly feed back information, avoid information asymmetry [6], effectively reducing the cost of the spatial dissemination of innovation factors, accelerating the flow of knowledge, technology, and talents across regions, and realize the breakthrough from “a single point” to “network synergy” [7]. In the context of the new era, promoting the integration of the digital economy with regional coordinated development policies is an essential way to achieve sustainable and high-quality regional economic development.

2. Literature Review

The American scholar Don Tapscott [8] coined the phrase “digital economy” initially to describe economic activities driven by contemporary information technologies. As research in related fields continues to deepen, the interpretation of broader dimensions has gained a certain degree of consensus. Generally speaking, the digital economy is a new modern economic model, which is based on cyber infrastructure and centered on digital components to enhance economic efficiency using digital means. This model emerges as a sophisticated, sustainable economic form and a prime example of regional development characterized by intelligence, networking, and interconnectivity [9,10].
Currently, researchers are investigating the digital economy from various aspects. Their work can be broadly categorized into three main areas. First, there is an emphasis on the concept of the digital economy. Ouyang approaches it from a macro perspective, developing a multi-tiered analysis to understand its connotations and patterns [11]. Bai focuses on rural areas, examining the unique characteristics and theoretical frameworks of rural digitization to propose development strategies [12]. Additionally, certain scholars view the digital economy through the lens of data- and information-related industries. They emphasize how the integration of information and communication in traditional relations can lead to the digitization of economic activities via platforms like the Internet of Things, which promote the development of digital trade [13,14,15,16,17]. The second main research area centers on the quantitative evaluation of digital economy progression, which involves establishing a multidimensional assessment framework and applying diverse analytical approaches to measure development dynamics. In terms of the indicator system, Lai constructs an indicator system from five aspects, including infrastructure construction, to make predictions for the future development of the digital economy [18]. In terms of the scope of studies, Wang evaluates the level of the economy at the scale of the province in China [19], while Huang chooses prefecture-level cities within specific provinces [20]. In terms of methodological approaches, weighted principal component analysis (WPCA) and entropy weighting methods have been extensively employed for measurement. Wang uses the TOPSIS method to calculate the digital economy level of cities over a 10-year period [21]. Meanwhile, emerging studies adopt more innovative and complex frameworks to assess digital economy development levels [22]. Lastly, researchers focus on examining the spatial characteristics of the digital economy. These studies reveal insights into the spatial and temporal discrepancies, evolutionary patterns, and factors affecting the digital economy [23,24]. Meanwhile, Zhang employs methods like the Moran index to explore the spatial–temporal evolutionary trends within the Yellow River Basin [25]. Luo discussed the regional characteristics of the digital economy based on the spatial Markov Chain transition probability matrix [26], while Zhang analyzed the sources of regional differences in combination with the Dagum Gini coefficient on the basis of the characteristics of the spatial pattern of the provincial digital economy [27].
According to the literature study, there is a fair amount of research on the digital economy’s spatial features and measurement. Additionally, the promotion effect of the digital economy on regional economic growth has been extensively discussed, leading to the formation of a more systematic theoretical system known as “geospatial–digital elements–economic growth”, which serves as the theoretical foundation for the long-term development of the digital economy as well as a good starting point for this study.
However, it can be found that, firstly, the research scale of the existing literature is primarily restricted to the provincial area or urban agglomeration, focusing on the general impact of the digital economy on the geographic space while ignoring the crucial aspects of cross-regional network collaboration. Secondly, the majority of the research focuses on measuring the regional digital economy’s level and analyzing interregional gaps, with little attention paid to the specific functional positioning and role transformation of various regions. Thirdly, there are fewer studies on the variations in the diffusion paths of various innovation factors. In light of this, considering the coherence of policies and the stage of development, this paper takes 2006–2022 as the time frame of study and examines 359 cities in China (including all prefecture-level and above cities, alliances, autonomous regions, districts, and some county-level cities under provincial jurisdiction). It employs digital patents to evaluate the digital sector, establishes a digital economic spatial correlation network through an adjusted gravity model, and systematically analyzes structural characteristics via social network analysis. Additionally, this study uses the quadratic assignment procedure (QAP) approach to examine the factors that influence the economic geographical network among cities.
This paper makes three main contributions. First, utilizing 359 prefecture-level cities as the subject of study, it methodically demonstrates the dynamic growth of the city-scale digital economy spatial association network and explores the processes of the creation and weakening of new and old connections, as well as the reconfiguration of geospatial patterns to provide a basis for comprehending the geo-dynamics of the digital economy. Second, the patterns of urban node dispersion in space are computationally delineated through integrating the improved gravity model with graph-theoretical methodologies, which advance the comprehension of its stratified topology and value diffusion channels, providing theoretical justification for modifying regional economic development strategies. Third, based on the QAP regression technique, this study considers how the urban economic network structure is formed by combining multiple factors, and analyzes the flow paths and speeds of different innovation factors to enrich the theory of innovation diffusion, which is conducive to providing a methodological innovation for the digital economy’s spatial governance.

3. Research Methods and Data

3.1. Research Methods

3.1.1. Improved Gravity Model

The gravity model is widely used in the fields of regional economic association, economic growth, etc., and it has been effectively verified in all of them. The theory of the economic gravity model holds that there is a relationship of mutual interaction between the economies of regions, and the strength of the linkage between them decreases with the increase in distance [28]. Consequently, considering the gravitational model’s benefits, the following improved gravity model has been established to evaluate how strongly Chinese cities’ digital economies are spatially associated:
R i j = P i · P j [ D i j ] 2
where R i j denotes the strength of the spatial correlation in Chinese cities, P i , P j denote the quantity of patents in the digital economy in cities i and j, and D i j denotes the distance between the two cities. In traditional gravity models, the distance between cities is usually represented by the shortest straight-line distance. With the improvement in transportation modes, the straight-line distance can no longer accurately reflect the change in interaction strength between two places with distance [29]. Therefore, considering the causality of real digital economic development links and the non-reciprocity between regions, this paper refers to the relevant research [30] and uses the “economic distance” between two cities, which is the ratio of the geographic distance of the two cities to the difference in GDP per capita, to express distance.
D i j = d i j ( G i G j )
where d i j denotes the geographical distance between the two cities, and G i , G j denote the level of per capita GDP of the two cities.
Therefore, the modified gravitational model is as follows:
R i j = P i · P j D i j ( G i G j ) 2
The gravity matrix R i j of Chinese cities’ digital economy is derived from Equation (3). The threshold value x * is determined by taking the average value of the data in each row of the matrix, and the spatial binary matrix S i j of cities’ digital economy is constructed, and it is used as the data for the examination of the network architecture. Below is an equation for the procedure.
S i j = 1 ,   R i j > x * 0 ,   R i j x *
According to Equation (4), if the spatial correlation strength R i j is higher than the threshold value x * , then S i j = 1, indicating that the digital economies of cities i and j are correlated; conversely, S i j = 0, indicating that there is no correlation between the cities.

3.1.2. Social Network Analysis

Social network analysis (SNA) is a significant multidisciplinary research technique that emerged in the 1930s. Its theoretical foundations are drawn from various disciplines, including sociology, psychology, and other fields. In SNA, individuals or organizations are represented as nodes, with their interrelationships depicted as edges, forming a network. Through the application of graph theory, statistics, and other techniques, SNA examines the structural and dynamic characteristics of the network, and focuses on the positions and roles of individuals within the network and their mutual influence to uncover social phenomena and structures. In the urban digital system, this hierarchical structure made up of various nodes and data relationships also reveals the flow law of information, resources, and power in the digital network, reflecting the status differences and functional division-of-labor elements.
(1) Overall characteristic indicators
The total network perspective is used to illustrate the structural features of the geographical network and its stability and proximity in depth, so as to comprehensively measure each network node’s position, function, and responsibility. The four key indicators of network density, relevance, efficiency, and hierarchy are employed in the analysis.
Among these, network density, which is represented by the proportion of the actual number of edges to the maximum number of edges that can exist, shows how closely nodes are connected to one another. High network density symbolizes the “stickiness” and “activity” of the regional economy, which serve as the foundation for the development of industrial clusters and knowledge spillover effects. Network relevance can show the strength and breadth of interconnections between nodes. Through specialized division of labor, regional cooperation can increase overall efficiency more easily with greater network connectivity. Network efficiency focuses on the efficiency of transferring and connecting information, resources, and other inter-city connections, which is a key indicator of regional competitiveness. Network hierarchy reflects the accessibility and hierarchical structure of cities in the spatially connected network. A core node controlling resource allocation is a common feature in networks with large hierarchical disparities, exhibiting a “core–edge” geographic pattern.
(2) Individual characteristic indicators
In this research, the individual features are described using degree centrality, betweenness centrality, and closeness centrality.
Degree centrality mainly measures the number of direct connections between a node and other nodes; the greater the value, the more extensive the node’s network connection, which means that it is more likely to be at the center of the network [31]. Through high-frequency direct links, nodes with a high degree of centrality can create a dense network of economic collaboration with other cities, controlling the industrial division of labor and resource distribution in the area.
Betweenness centrality shows the capacity of a node to manage the entire network’s resources and the node’s monopoly power and importance as a hub position in the local economy. The node’s function as a “bridge” in the network becomes more apparent the greater that its intermediary centrality and industrial clustering effect become.
A node’s proximity to other nodes can be gauged using closeness centrality, which indicates how independent a city is from other cities in the network, reflecting its overall reach and effectiveness in acquiring resources within the regional economic network. An increase in closeness centrality can enhance the regional economic network’s resilience, optimize its spatial structure, and encourage a shift in policies from “single subject-led” to “multidimensional synergistic governance”. Ultimately, this will lead to more accurate policy objectives, more effective implementation, and longer-lasting effects. The specific calculation formulas are displayed in Table 1.

3.1.3. Quadratic Assignment Procedure Model

The quadratic assignment procedure (QAP) model is an analytical technique used for examining the connection and regressivity between two relationship matrices [32]. The core algorithm is based on the substitution of random matrix data to simulate the null hypothesis of “no correlation”, so as to verify whether the matrices are related [33]. Consequently, the method tends to utilize the absolute differences between the variables to construct the difference matrix, guaranteeing numerical stability and replacement invariance. In this research, we begin with a QAP regression analysis to investigate the factors that influence the spatial correlation network and build the following model based on the binary matrix of the spatial correlation network of the digital economy across Chinese cities:
P = f G D P p e r , V A 3 / V A 2 , U R , R & D , E d u , T e c h
where the dependent variable P is the spatial correlation network of China’s digital economy, and the independent variables use the absolute value differences in the corresponding indicators of the two cites to construct the difference matrix, in which G D P p e r represents the matrix of differences in per capita gross domestic product among cities; V A 3 / V A 2 denotes the difference matrix of the value added of the tertiary industry and the value added of the secondary industry between cities; U R denotes the matrix of the urbanization ratio of the population between cities’ network matrices; R & D denotes the network matrix of R & D investment; E d u denotes the number of college students per 10,000 people among cities; and T e c h stands for the network matrix of the whole volume of business in telecommunications between cities. All of the variables mentioned above are relational data and have the possibility of having strong correlations with one another on their own [34]. Multicollinearity may be an issue if the traditional method is used to estimate their parameters. This could result in an increase in the standard deviation of the parameter estimates and the variable significance test losing its significance, and therefore, it cannot be tested by conventional statistical methods. In contrast, the QAP analysis method is a nonparametric analysis method, in which the difference matrix is directly studied in terms of the relationship matrix, without relying on the specific values of the variables, to reveal potential associations at the level of the relationship structure. At the same time, it does not need to assume that the variables are independent of each other. It can also successfully circumvent the problems of multiple covariates in the results and the autocorrelation of relational data, which is more robust than the parametric method [35].

3.2. Research Data

The research data is divided into two parts: digital patent data and influencing factor data.
Digital patent data. Digital patent data is a useful indicator of the degree of technical and scientific progress, characterized by standardized data, long time series, objectivity, and practicality, etc. Generally speaking, the higher the number of citations to a patent, the more solid the scientific foundation knowledge it contains, the more opportunity to contribute to societal and economic advantages, and the better the quality of the innovation outcomes [36]. Digital patent citations reflect the inheritance, continuity, and accumulation of knowledge and technological innovation, which can better reflect the quality and impact of innovation, and the quality of innovation being measured by the number of patent citations is more internationally recognized. In this paper, the degree of a city’s digital economy was measured using data from digital patents [37]. Digital patent data spanning 2006 to 2022 were systematically collected through web crawling techniques from the Patent Search and Analysis System of the National Intellectual Property Administration (NIPA) (https://www.cnipa.gov.cn/, accessed on 8 June 2025), with methodological alignment to the China Open Data Platform (https://www.cnopendata.com/, accessed on 8 June 2025). The dataset comprehensively covers 359 Chinese cities, including all prefecture-level and above administrative units (municipalities, leagues, autonomous prefectures, districts) and selected county-level cities under provincial jurisdiction.
Influencing factor data. The selection of influencing factors was conducted through methodological triangulation encompassing economic development, scientific and technological advancement, and infrastructure service dimensions. Core indicators include the following: per capita GDP, value-added output of secondary and tertiary industries, urbanization rate, R&D expenditure intensity, college student density per 10,000 population, and total telecommunication service volume. All datasets were uniformly sourced using standardized data retrieval protocols implemented on the China Socioeconomic Big Data Research Platform (https://data.cnki.net/, accessed on 8 June 2025), specifically derived from the China Urban Statistical Yearbook and provincial statistical bulletins. For the purpose of examining the factors that influence the spatial association network of the digital economy in Chinese cities, 286 cities were further selected from the 359 cities based on the data’s accuracy and reliability. The distances between cities were obtained by calculating the distance between the centers of mass of each city map after importing Chinese maps using ArcMap 10.2 software.

4. Research Results

4.1. Temporal Evolution Characteristics of China’s Urban Digital Economy

The gravity value between cities for the years 2006–2022 is calculated using the improved gravity model previously discussed, and the overall degree of development of the digital economy is represented by the average gravity value of each city per year, with its time evolution trend being shown in Figure 1. Overall, in Chinese cities, the digital economy grew from 0.006 in 2006 to 4.592 in 2022, representing a leapfrog growth rate of 56.67% on average every year, indicating a significant upward trajectory. Regarding sub-periods, throughout the “Eleventh Five-Year Plan” (11th FYP) from 2006 to 2010, the level of the city’s digital economy remained relatively low, increasing from 0.006 in 2006 to 0.087 in 2010, marked by a high growth rate. This stage is the infancy of the growth of the digital economy. Between 2011 and 2015, the cities’ digital economy level rose from 0.168 to 0.892 in the “Twelfth Five-Year Plan” (12th FYP) era, reflecting an overall increase in the digital economy. The growth rate exhibits stable fluctuations within a bounded range, a pattern of the developmental phase in digital economy progression. In the 2016–2020 “Thirteenth Five-Year Plan” (13th FYP) period, the cities’ digital economy grew quickly, from 1.293 to 2.517 between 2016 and 2020, with the growth rate gradually slowing and a higher degree of development. This period corresponds to the high-speed growth stage. After the “Thirteenth Five-Year Plan” period, the digital economy entered a new stage, with the level reaching 4.592 in 2022, signaling rapid development and marking the take-off stage of the digital economy. From a broad standpoint, China’s urban digital economy is doing well generally, with notable development accomplishments.

4.2. Characteristics of the Spatial Network of the Urban Digital Economy in China

4.2.1. Construction of Spatially Associative Networks

To illustrate the spatial linking pathways and structural changes among cities, as well as the variations in the digital economy’s spatial structure among Chinese cities, a gravity grid is constructed using the enhanced gravity model as a basis, and the spatial linkage structure of Chinese cities in 2010, 2015, 2020, and 2022 is mapped using the ArcGIS tool, as illustrated in Figure 2, respectively. To enhance the network visualization effect, reference is made to the methodological framework of related scholars, and values with a smaller gravitational force are deleted based on appropriate ratios (2.0000, 10.0000, 29.5000, 30.5000, and below are deleted from 2006 to 2022, respectively), and the strength of the cities’ association is categorized using the natural breakpoint approach. The results show that from 2006 to 2022, the spatial association network evolved continuously from a simple to a complex structure. The degree of linkage has been continuously strengthened, mainly radiating from the more economically developed first-tier cities, showing the trend of agglomeration development.

4.2.2. Overall Network Characteristics

This article has measured the network characteristics between cities using “Ucinet 6” software. The overall network density between cities shows a fluctuating upward trajectory, rising at an average yearly growth rate of 0.07% from 0.0421 in 2006 to 0.1192 in 2022, and the number of network connections rises from 3650 in 2006 to 12,547 in 2022, which indicates that the digital economy links between cities are becoming increasingly closer and deeper. Recently, the country has implemented a range of regionally coordinated development policies, such as the coordinated development of the Beijing–Tianjin–Hebei region, the Yangtze River Delta (YRD) integration, etc. These policies help break down communication barriers and foster inter-city exchanges, gradually facilitating the formation of a more closely knit spatial network in the digital economy.
However, the average overall network density stands at 0.28 (as shown in Table 2), which remains relatively low across the study period, implying that there is still considerable room for improvement and new opportunities for cities to collaborate. With further time, the density of digital economy networks is expected to continue to grow and the growth rate of China’s digital economy connectivity will progressively slow down as the digital economy develops [38].
The average value of network relevance is 0.678, which is considered a high level, with a significant growth rate increase from 0.221 in 2006 to 0.957 in 2022, which is close to “1”. This indicates that the accessibility between spatial networks is constantly increasing and that cities are increasingly connected, both directly and indirectly. At the same time, cities themselves use their digital advantages as hubs while promoting the expansion and further enhancement of the digital economy in surrounding areas, making the network denser and more complex. However, the value has not yet reached “1”, which indicates that there are still some isolated cities, and the degree of connection has yet to be strengthened.
The average value of network efficiency between cities is 0.792, with insignificant changes, fluctuating up and down near the average value. This indicates that there are fewer redundant paths between digital economy networks and that the internal connection channels are highly diversified, which breaks the pattern of closed development within a city. Leveraging their strong economic foundations, cities continue to expand new paths for digital economy development, explore new economic growth points, and seek new ways of cooperation to support the region’s and their own integrated development. This effectively promotes the gradual narrowing of the comparative advantages among cities, realizing the coordinated development of regional integration.
The changing trend of the network hierarchy degree of the digital economy-related network of Chinese cities presents “w” type characteristics, and the overall trend is moving upward, with a mean value of 0.037, with the value for the research period being more than 0.1, which is at a lower level, reflecting the fact that the degree of the digital economy of each city is constantly developing, that the regional cooperation tendency is obvious, and that the network does not yet present a fully hierarchical or well-structured framework. The network structure is characterized by a higher symmetrical accessibility and more significant synergistic effect between cities. In addition, peripheral cities within the spatial correlation network are being affected by the central cities, gradually integrating into the network, and the network develops toward densification and deepening.

4.2.3. Individual Network Characteristics

The macro architecture of the spatial association network is displayed based on the examination of the overall network structure features. However, its limitation is that it makes it difficult to analyze the centrality of individual nodes in detail. To deeply explore the digital economy spatial network in Chinese cities, it is necessary to carry out individual network characterization. This study calculates degree centrality and intermediary centrality to thoroughly examine each node’s position and function inside the network, as well as proximity centrality.
The flow of digital economy resources and elements is becoming more active, and the two-way effect of outward diffusion and inward attraction is increasing [39]. To better measure the benefit correlation and spillover correlation of each city, the degree of centrality is split into in-degree and out-degree, and the net spillover inflow degree of each city is computed. Furthermore, an analysis is conducted to rank the cities’ net spillover inflow degree at four different time points, 2010, 2015, 2020, and 2022 (as shown in Table 3, Table 4, Table 5 and Table 6). It is found that the point in-degree of Shenzhen, Guangzhou, Beijing, Shanghai, and Wuxi is significantly larger than the out-degree, and the cities’ ranking consistently placed the net spillover degree at the top. The higher the point in-degree, the more advanced the region’s digital economy, the more economic resources it can gather, and the more it is an important node in the digital economic network. As the city at the forefront of reform and opening up, Shenzhen attaches great importance to the development of emerging industries and has implemented a number of policies to encourage the progress of the digital economy, such as “The Opinions on Developing and Strengthening Strategic Emerging Industry Clusters and Cultivating and Developing Future Industries” and “the 14th Five-Year Plan for the Development of Shenzhen’s Digital Government and Intelligent Cities”, which clearly define the city’s strategic position and offer robust policy guarantees and direction for the growth of the digital industry. Furthermore, there is a typically significant siphon effect in places with large net spillover values, such as Beijing and Shanghai, attracting digital economy resources from neighboring cities owing to their great degree of economic growth and flawless digital infrastructure, enabling them to expand the scale of their own digital economy, realize their own improvement, and become beneficiaries of digital economy development. As for the underdeveloped cities at the bottom of the ranking, they lack supporting amenities and have a low level of economic growth and agglomeration capacity, and the existing conditions cannot promote further development, which results in the outflow of resource elements. Also, the linkage generated by the siphoning effect of the core cities is relatively sparse, so that their own digital economic change is impeded, and their centrality is not strong in the associated network.
Higher betweenness centrality means stronger control over the digital economy resources in the structure. Between 2010 and 2015, the ranking of cities with higher betweenness centrality changed constantly, and the ranking of cities stabilized after 2020 (as shown in Table 7 and Table 8). In 2010, the average value of betweenness centrality was 0.123, with 34 cities exceeding this value, which means that these cities serve as “intermediary” in the network and have a strong ability to dominate in terms of digital economy resources. In 2022, the average value was 0.236, which is a big increase compared with that of 2010, indicating that the intermediary ability of the cities has improved. Cities are increasingly acting as “bridges” in the association network. The degree of connection with the surrounding cities increases, and the transfer of information resource elements between cities is more direct. In addition, in 2022, the top 10 cities in terms of betweenness centrality accounted for 44.8% of the total betweenness centrality in that year, while the cities in the bottom 10 accounted for less than 0.1%, which means that it is difficult for these cities to play the role of allocating and controlling resources in the network, and this reflects that there is a huge difference in betweenness centrality. Combined with the net spillover, cities with strong betweenness centrality have higher net spillover values, demonstrating that these cities have a large capacity to absorb resources and a notable agglomeration impact, placing them in the network’s core dominant position, while cities with insignificant betweenness centrality have lower net spillover values and fewer configurable digital economic resources and are in a subordinate position in the network [40,41].
Closeness centrality is commonly utilized as an indicator of how well cities communicate and work together. In the ranking of cities’ closeness centrality in 2010, 2015, 2020, and 2022 (as shown in Table 9 and Table 10), the top ten cities experienced frequent fluctuations, with relatively small differences in the closeness centrality values across cities. The average value of closeness centrality for cities in 2010 was 1.058, with 44 cities having values higher than the average, and by 2022, the average value grew to 11.397, with 59 cities having values higher than the average, signifying strengthened overall interconnection between cities and a growing integration of cities’ development into the digital economy network. In addition, cities located in the Pearl River Delta (PRD) region like Shenzhen, Guangzhou, and Xiamen were at the forefront of proximity in 2010. By 2022, however, cities from the Yangtze River Delta (YRD) region, including Shanghai, Suzhou, Wuxi, and Nanjing, exhibited higher closeness centrality values than the cities in the PRD, demonstrating that these cities may function as key actors and establish rapid connections with other cities. As important mediums for the spatial correlation network, these cities often occupy a good geographic location, which facilitates easier communication and exchange with other cities, shortening the distance of digital economic development between cities, which effectively promotes the cross-regional circulation of resources. As the digital economy has developed, the phenomenon of spatial agglomeration has steadily smoothed out, and the radiation effect between cities has been strengthened to better drive the growth of the digital economy across surrounding communities.

5. The Formation Mechanism of the Spatial Correlation Network of the Urban Digital Economy

5.1. QAP Regression Analysis

QAP regression analysis was conducted on the relationship between the above influencing factors and the geographical correlation network of urban digital economy development, and the findings are displayed in Table 11.
The difference coefficients of GDP per capita, the quantity of college and university students per 10,000 people, R&D investment, and the overall size of the telecommunication business are substantially positive. This indicates that the greater the differences in economic scale, population quality, scientific and technological innovation, and infrastructure construction—represented by the aforementioned four factors—the higher the extent of the digital economic network, and the more conducive it is to the formation of spatial correlation networks. On the one hand, cities with a higher GDP per capita tend to have a larger scale of economy and more students in colleges and universities. Leveraging their economic and talent advantages, such cities not only exert a demonstration effect but also actively promote their own rapid scientific and technological development. Their influence keeps spreading outward, allowing for frequent factor movement and distribution among nearby regions, which raises the degree of growth of the digital economy in nearby cities and regions. This strengthens the spatial correlation of the digital economy across cities. On the other hand, each city occupies a different position based on its specific characteristics related to economic scale, population quality, and innovation in science and technology, as well as the building of infrastructure, jointly making contributions to the digital economy. Cities with developed economies and many universities, advanced science and technology, and advanced telecommunication infrastructure focus more on high-end R&D and innovative applications regarding the digital economy. In contrast, cities with relatively backward economies, yet possessing certain labor resources and basic communication facilities, leverage their unique resources for technological application and promotion, and undertake some of the downstream activities in the digital economy industry chain. These differences between cities promote complementary relationships and improve the growth of the industry chain for the electronic economy, prompting cities to strengthen cooperation and exchanges, increasing the degree of spatial correlation and constructing a sophisticated and intimate network of geographical correlations for the economy.
The coefficient of variation in the urbanization rate of the population shows a fluctuating trend, which transitions from a negative value to a significant positive value. Earlier in the development process, because of the disparities in geographic location, resource endowment, policy support, and other conditions between cities, each city tended to develop its digital economy independently, and the gap in the urbanization rate was large, which hindered the construction of the digital economy’s network. As the economy and society continue to develop, the urbanization rate’s coefficient of difference turns to a positive value, and the larger the difference in the urbanization rate, the more conducive it is to the construction of the network, leading to the realization of agglomeration and synergistic development. The coefficient of the ratio of the added value of the tertiary industry and secondary industry among cities does not pass the significance test, demonstrating that the establishment of a spatial correlation network across cities is not substantially impacted by variations in this index.

5.2. Robustness Tests

5.2.1. Robustness Tests for Digital Patent Data

The digital economy is rich in connotation and covers a wide range, and there are more indicators related to the development of the digital economy. In order to further confirm the robustness and reliability of the results of this paper, alternative variables were selected for a robustness test. Firstly, the patent data is taken as the explanatory variable, the net overflow degree of the city is taken as the explanatory variable, and the increase in urban GDP and the added value of the tertiary industry (TIAV) are used as the control variables, and the regression analysis is carried out to obtain Table 12. Then, the explanatory variable is re-measured, the explanatory variable, patent data, is replaced with the Internet broadband penetration rate (IBPR) to represent the level of digital economy development of the city, and the other conditions remain unchanged, and the regression analysis is carried out again. The results are shown in Table 13.
By comparing the above results, we find that the coefficients of the independent variables of the surrogate model are consistent with those of the original model, all of them are significantly positive and the change in R2 is less than 10%, and the significance and sign of the control variables remain stable. In addition, the VIF values of the independent variables are all less than “5”, and there is no collinearity problem. The above results show that the core conclusions of this paper are not affected by the choice of variables and have strong robustness.

5.2.2. Robustness Tests for QAP Analysis

To confirm the validity of the main conclusions, the inter-city gravity matrix in 2022 is taken as the explanatory variable in this paper. The time lag strategy is adopted to predict and analyze the results in 2022 using the 2010 and 2015 data, respectively, and the experimental results are shown in Table 14.
G D P p e r According to the robustness test results, the regression analysis of data from various time nodes shows that the coefficients of core explanatory variables, including GDP per capita, population urbanization rate, R&D funding input, the number of college and university students per 10,000 people, and the total amount of telecommunication businesses, all maintain a significant level. The sign of the coefficients is consistent, indicating that the direction and significance of each variable are stable. Meanwhile, the fluctuations of the R² and adjusted R² values of the model between 2010 and 2022 are small, respectively, between 0.160 and 0.175, reflecting that the overall explanatory power of the model is relatively stable. The above findings unequivocally demonstrate that this study’s model is robust across time dimensions and that its conclusions are trustworthy, accurately reflecting the long-term effects of numerous events on the inter-city gravity matrix.

6. Discussion

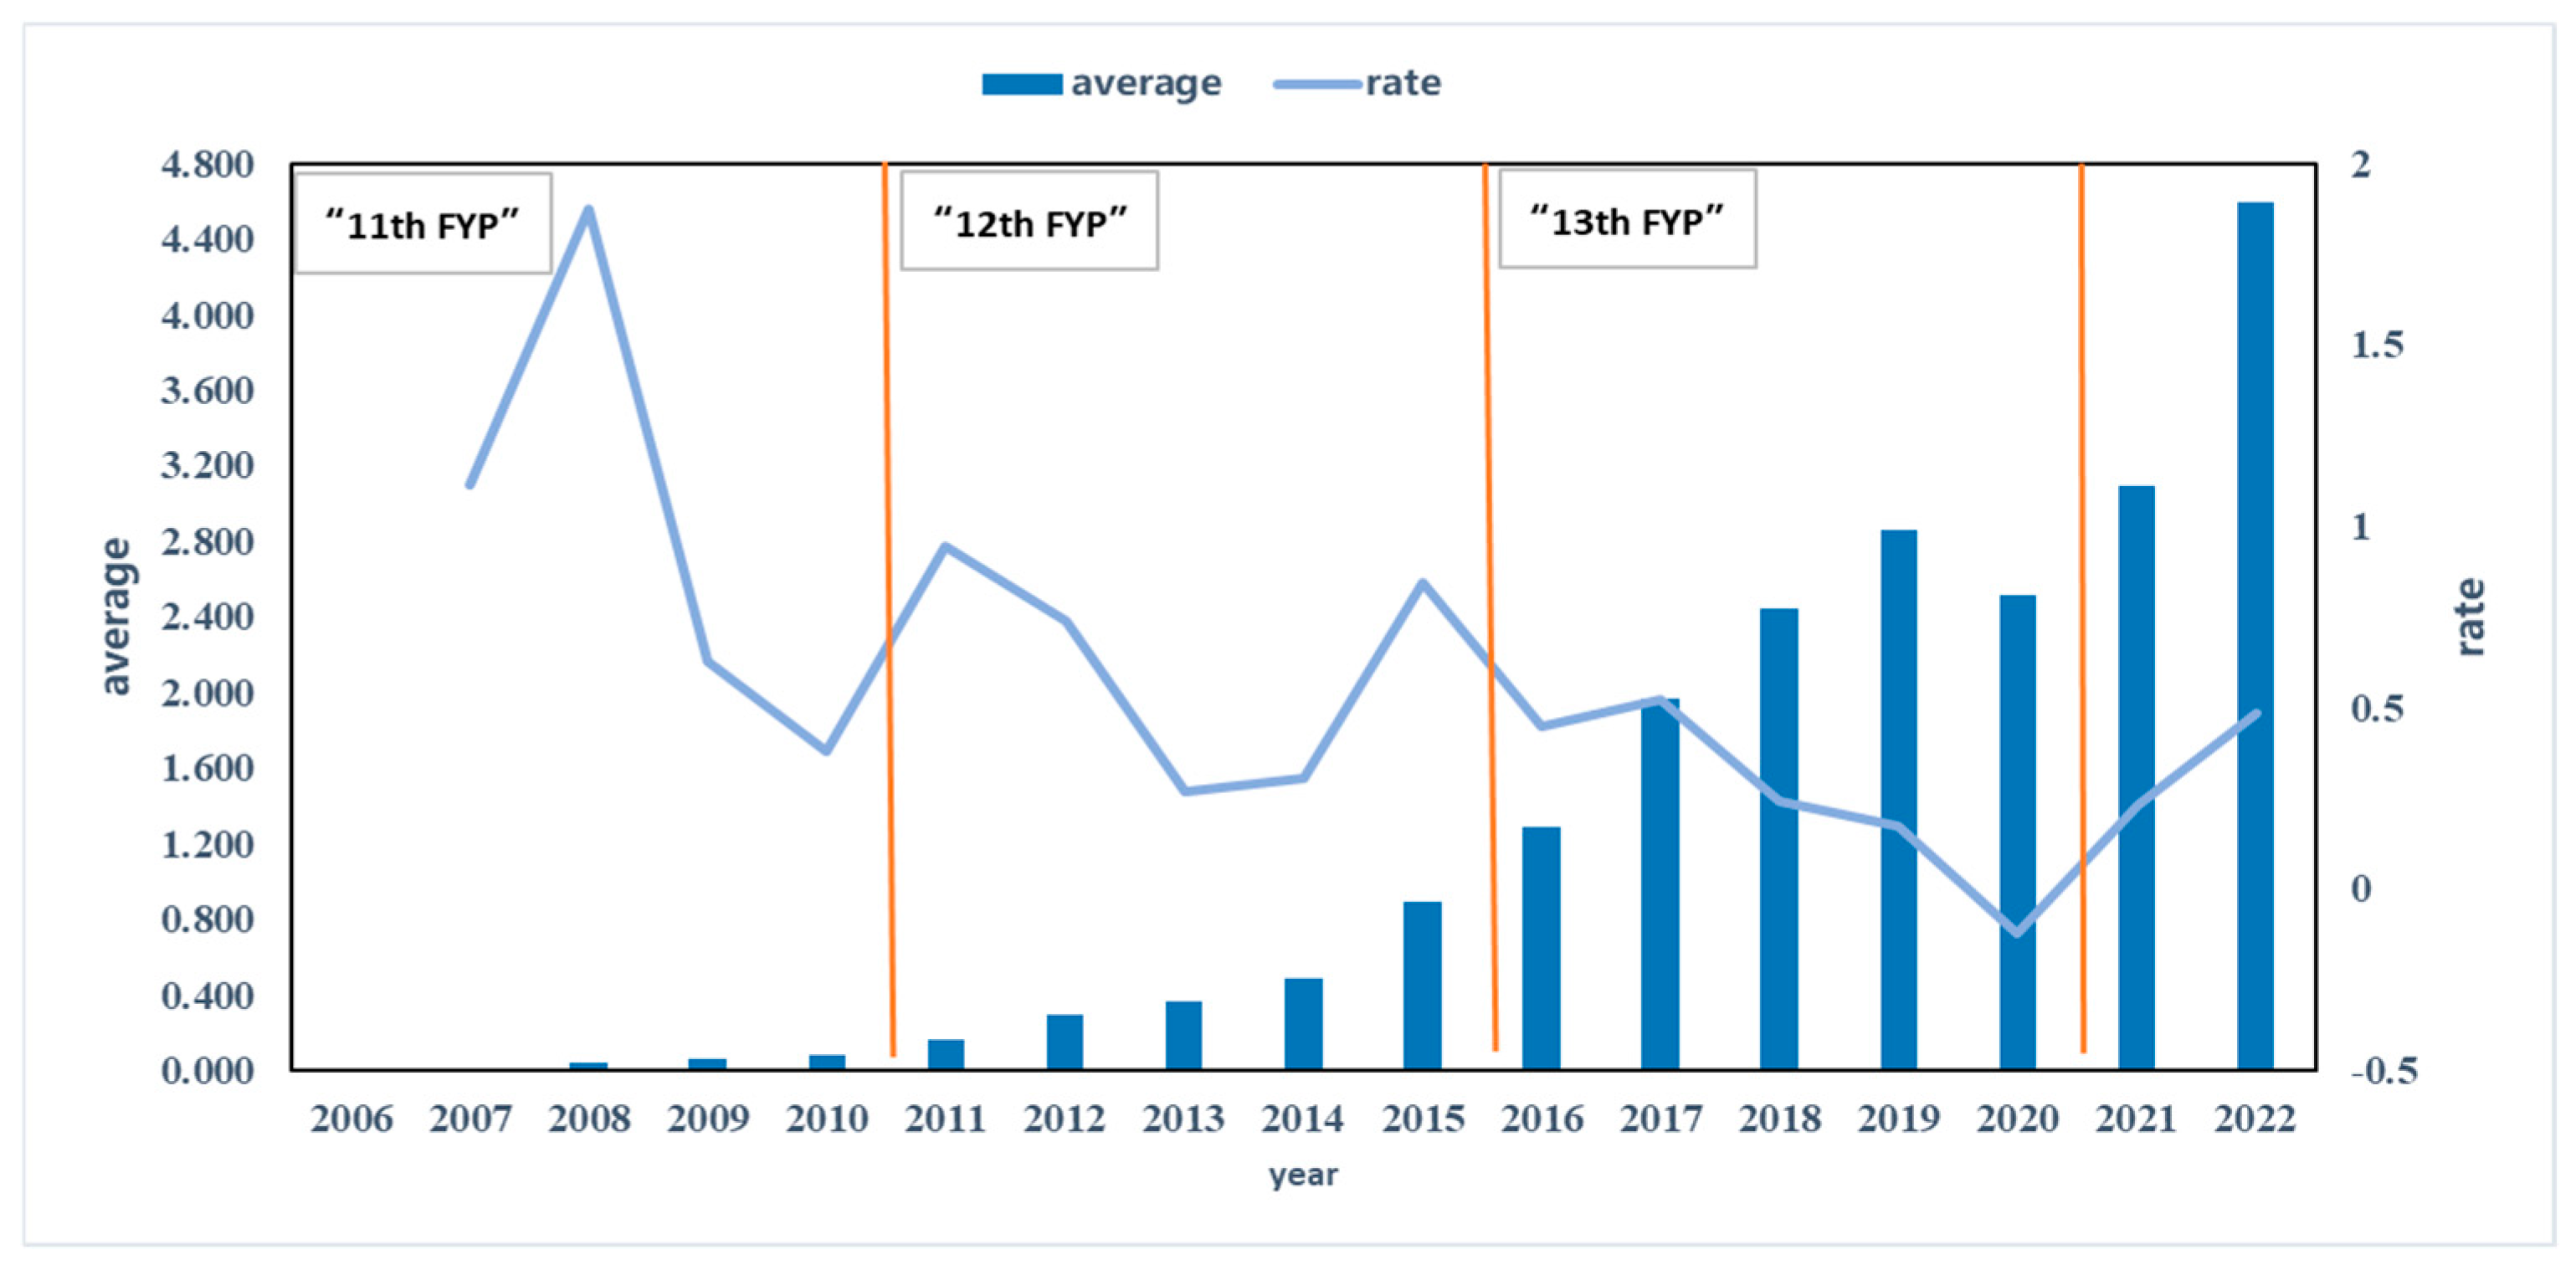
This study focuses on how China’s digital economy developed in 359 cities between 2006 and 2022. The scale of the digital economy has expanded quickly over time, especially in the era of the 13th Five-Year Plan. The total density of the cities’ digital networks has risen, with higher levels of network relevance and efficiency and lower levels of network hierarchy, showing the growing diversification of intra-network communication pathways. Notably, significant differences exist in the roles of cities within the network, with developed cities showing marked advantages in resource aggregation and communication. Taking net spillover degree and proximity to the center as examples, this study found that during the 11th Five-Year Plan period, the majority of cities had lower dispersion and closer net spillover entry values, and the cities were more distinguishable in their ability to communicate and synergize. In the Five-Year Plan phases of 12 and 13, some cities gradually surpassed others in digital economic development. This indicates that although the overall digital economy of most prefecture-level cities showed an upward trend, the increasing dispersion in the distribution of net inflow degree and closeness centrality has led to an imbalance among cities over time.
Compared with the existing literature, this study realizes breakthroughs in three aspects. Regarding the research perspective, it breaks through the previous limitations of focusing on the provincial or city cluster scale [42,43,44,45,46], shifts perspective to the “city” level, accurately captures the role change in small- and medium-sized cities in the digital economy network, and fills the gap in research on the geo-dynamics of the digital economy among cities. Regarding the research content, distinguishing itself from a single static analysis based on distribution in the existing literature [47,48,49,50], this study analyzes the temporal evolution of and regional differences in the linkage structure both vertically and horizontally, building a comprehensive analysis paradigm of geospatial dynamic evolution. Regarding the research results, this study reveals the heterogeneity of the flow of innovation factors under the city network by determining the difference-driven mechanism of the factors, expands the application boundary of the innovation diffusion theory, and offers fresh concepts in the field of digital economy.
However, this study has several limitations. First, there are the limitations of patent data. The degree of the digital economy can be somewhat reflected in digital patent data, but the coverage of patent data is limited due to the one-sidedness of industries and technology fields, as well as the differences in regional innovation ecology. It is also challenging to cover data on other aspects, such as new business forms and modes of the digital economy, and there is a risk of underestimating the degree of the non-technology-driven digital economy. At the same time, cross-regional comparisons are challenging because of the potential standard variations in the definition of “digital patents” among cities, which might impact the timeliness and quality of the data. To improve the quality of the data, future research needs to establish a methodology for evaluating patent quality and further refine the classification of technological domains to increase the data’s coverage. Second, the gravity model has shortcomings. With the help of set thresholds, this study establishes the network during the model-building process, facilitating clear visualization and analysis. However, connections are frequently influenced by multidimensional factors, and fixed thresholds cannot intuitively reflect their internal mechanism. Future studies may consider the combination of threshold setting and mechanism analysis to guarantee the model’s robustness and dynamics. Additionally, there are restrictions on the choice of affecting elements. This study has the problem of insufficient dynamic adaptation while choosing influencing factors like the market environment and policy. Future studies should focus on refining the factor system and improving the dynamic and heterogeneous analysis of the components to more thoroughly and precisely investigate its spatial correlation network and formation mechanism.

7. Conclusions and Suggestions

7.1. Conclusions

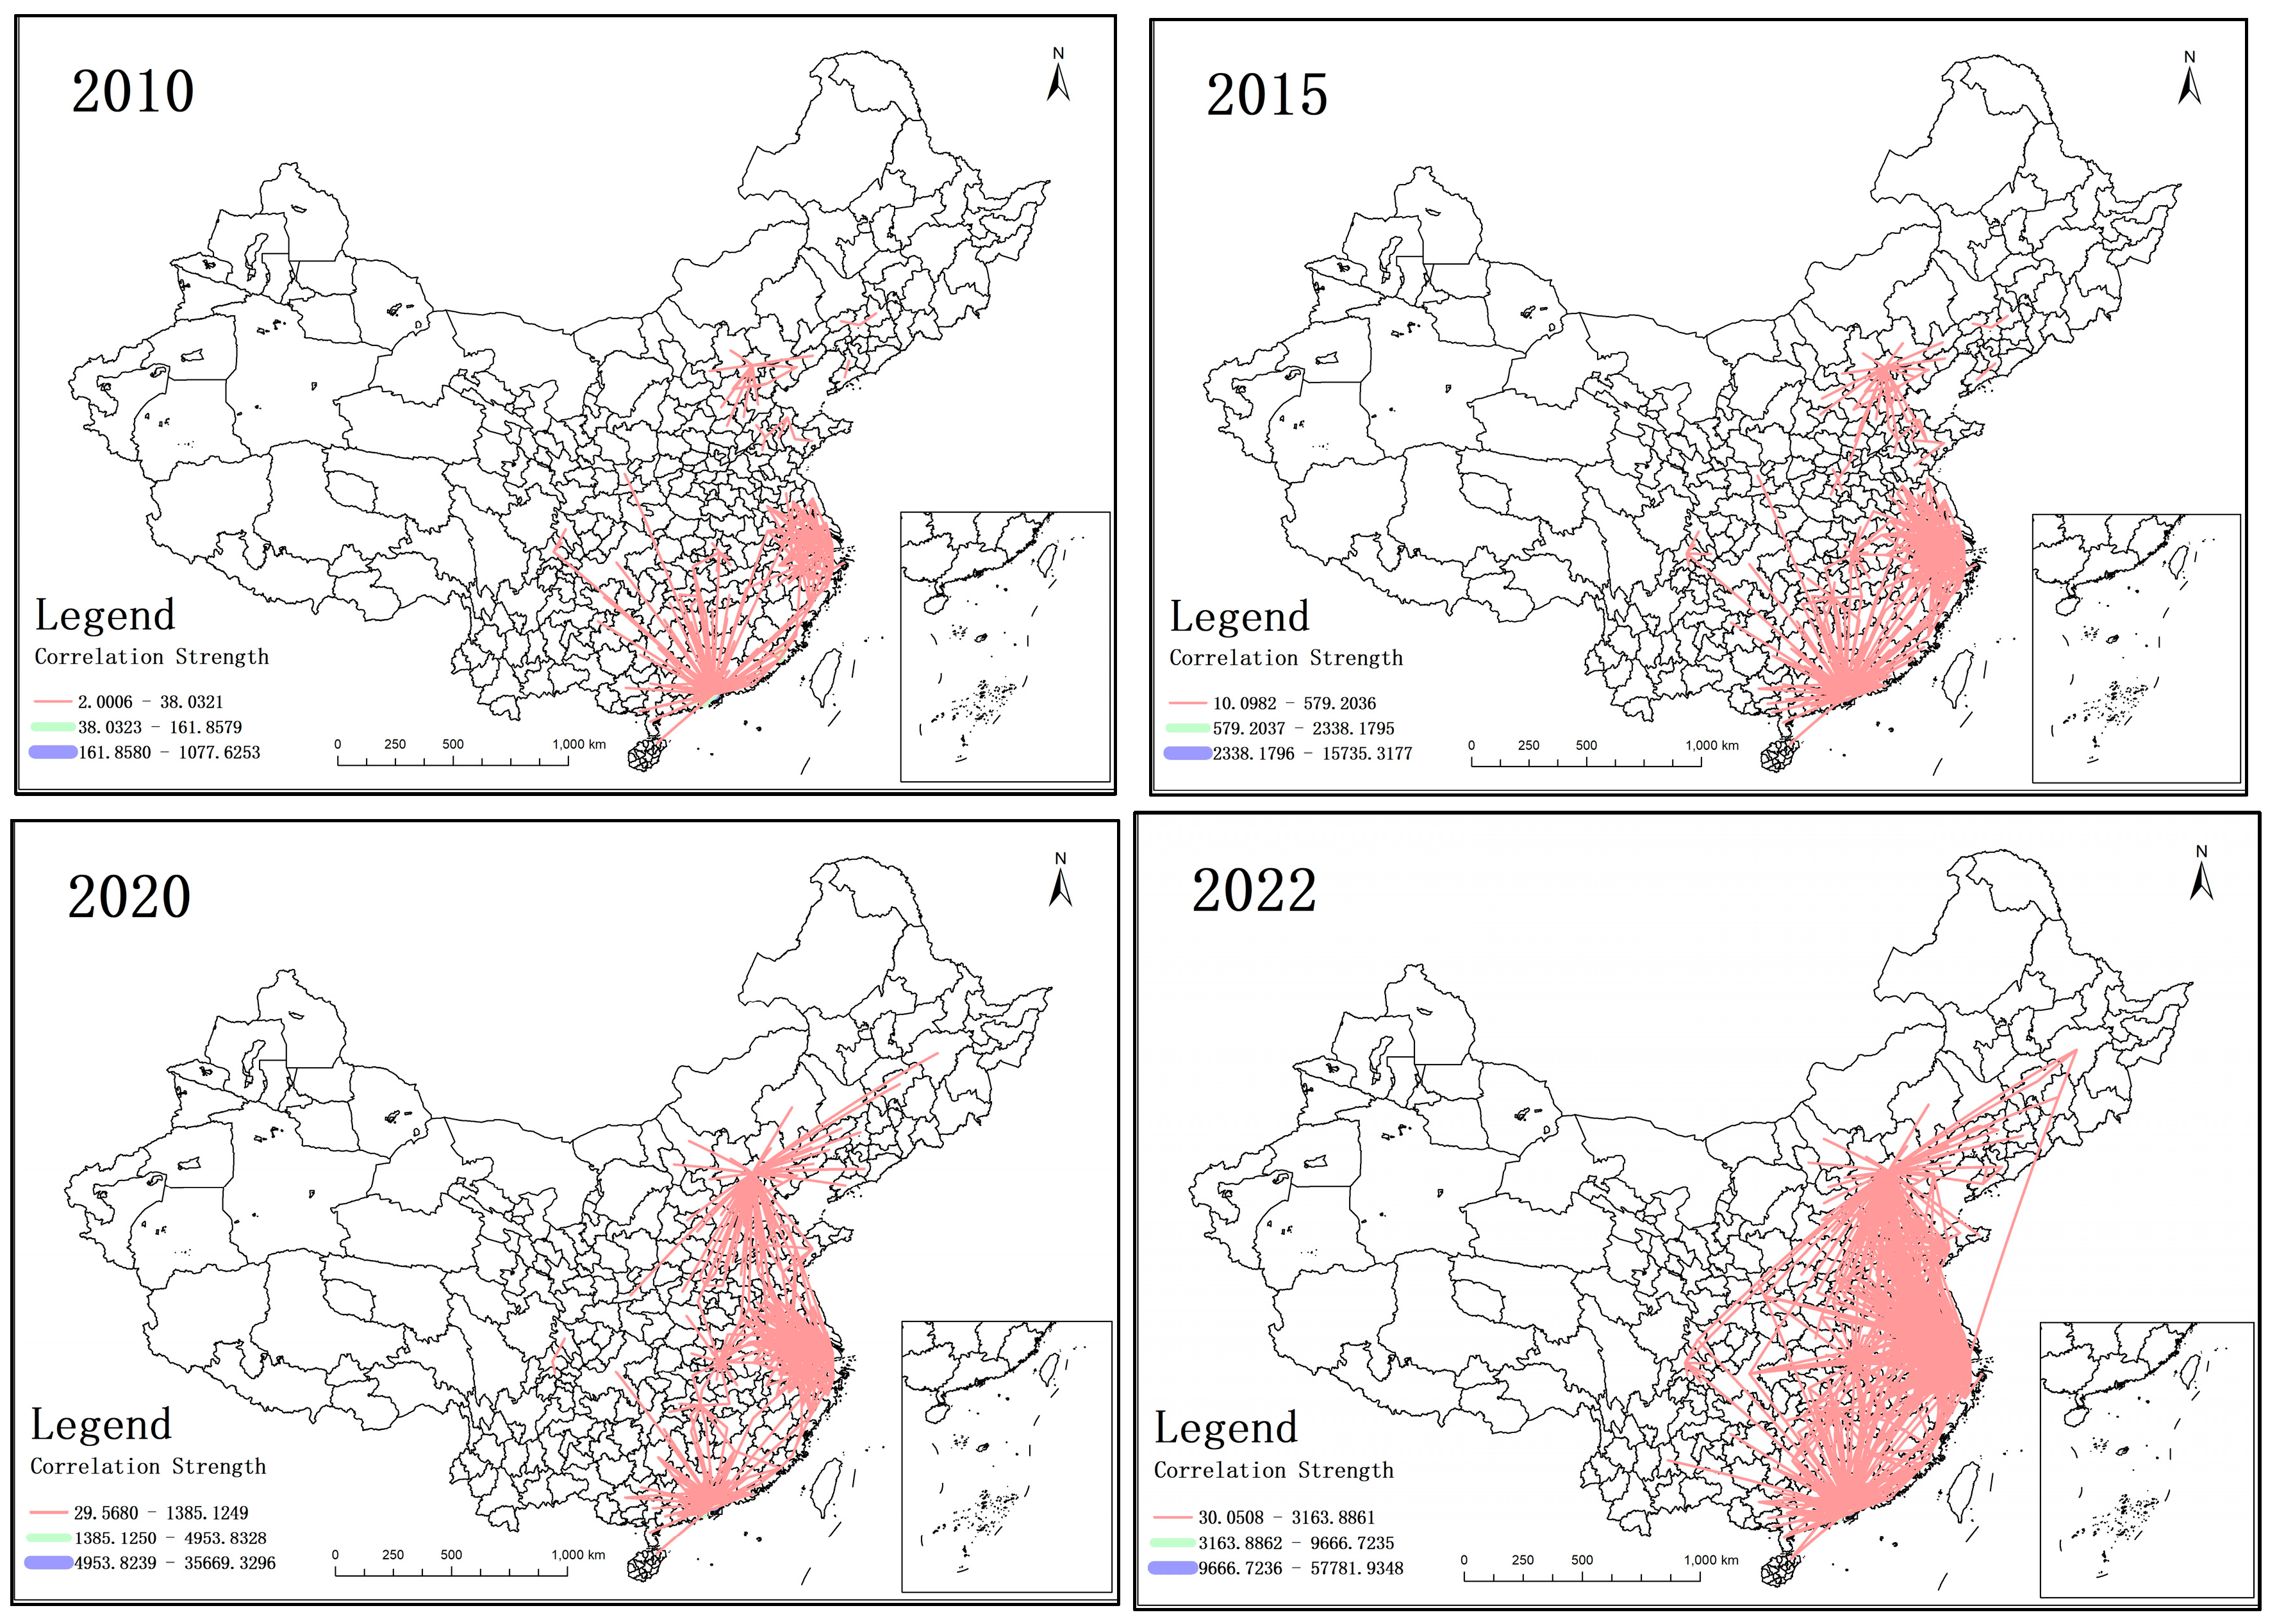
This study examines the development of the digital economy across 359 cities between 2006 and 2022 and also builds a geographical correlation network of urban digital economy development, looking at how it forms. The key findings are as follows: (1) From the perspective of the overall network, China’s urban digital economy has shown a notable upward tendency overall, growing at an average yearly pace of 56.67%. Notably, the digital economy expanded rapidly during the “13th Five-Year Plan” period. The association network exhibits a sophisticated network structure pattern. In this context, the number of regions taking part in the spatial network of the digital economy has been growing, as have the network density, relatedness, and hierarchy. However, there is still much space for development because the network connection is insufficiently close and the total average value deviates significantly from “1”. (2) From the perspective of the individual network, the role of different cities in the digital economy network varies significantly, and the network shows a typical “center–edge” structure. As the primary beneficiaries, Shenzhen, Beijing, Guangzhou, and other developed cities exhibit a typical agglomeration development mode, with a strong influence on the entire network of digital economy associations. They are also able to effectively control the flow of factor resources to other cities. Conversely, less developed cities that are subject to the problem of network marginalization and have weak centrality and agglomeration capacity have hindered the growth of the digital economy. (3) From the results of the regression analysis, except for the difference matrix of the proportion of value added of tertiary and secondary industries, the difference coefficients of GDP per capita, the number of tertiary students per 10,000 people, the investment in R&D, and the total amount of telecommunication services all pass the significance test, and they always show a positive influence, serving as the key factors influencing the spatial network of cities and driving the optimization and reorganization of the structure of inter-city linkages.
In the future, we will broaden our focus on the digital economy, extending our research into 2023 and 2024, and continue to monitor the evolution of digital economy networks. At the same time, we plan to drill down to the county or urban level to analyze the differences in network topology at different scales. Furthermore, we will introduce international perspectives for comparison, allowing us to better enrich and improve the theoretical framework, as well as provide more timely and targeted academic support for optimizing the layout of the digital economy and promoting regional synergy.

7.2. Suggestions

Drawing on the investigation of the features of spatial correlation networks between Chinese cities and the examination of determining factors, the following recommendations are proposed to foster the digital economy’s balanced, sustainable, synergistic growth in Chinese cities.
Strengthen top-level design and enhance overall network synergy. Create a market-driven, government-guided mechanism for cross-regional digital economy synergy, focusing on the construction of standardized data interfaces and revenue-sharing rules that can be used by enterprises, forming a three-dimensional governance structure of “central policy traction–regional agreement linkage–urban market response”. The framework of the “East Counts, West Counts” project should promote the accurate matching of Eastern computing power demand with Western data center resources, and enhance the network density and relevance. Simultaneously, it is imperative to lower the hardware threshold for peripheral cities to join the network, implement corporate income tax reduction and exemption policies for areas with weak digital infrastructure, and increase investment in new types of infrastructure, such as 5G base stations and cloud computing centers in central and western China as well as in less developed regions.
Optimize the division of roles among cities and establish a benefit-sharing mechanism. Emphasis should be placed on implementing differentiated digital economy development strategies, pushing central cities like Beijing and Shenzhen to focus on high-end elements and original digital technology innovation, encouraging leading enterprises to take the lead in forming industrial innovation alliances, realizing innovation spillover through patent cross-licensing and technical standard output, and creating a global digital economy innovation hotspot. Peripheral cities should be guided to develop niche areas of the digital economy based on local characteristic resources. For example, cities with abundant agricultural resources can concentrate on the growth of smart agriculture and rural e-commerce; cities with enough workers can engage in labor-intensive digital industries, like data marking and digital content processing, to create a mismatch and complementarity with core cities. The creation of a “core–periphery” benefit-sharing system will increase the natural motivation for peripheral cities to join the network and achieve regional sustainability.
Direct the movement of important elements to encourage synergy and digital economic agglomeration. Expand assistance for the development and mobility of human capital, put the “Two-Way Mobility Program for Digital Talents” into action, and encourage eastern talent to support peripheral cities by offering technology shares and part-time services, while also giving them the chance to travel to the core cities for training. Moreover, the distribution of innovation resources should be optimized. The share of R&D funding in peripheral cities should be increased, and the key national technology programs and innovation platforms should be oriented toward less developed areas. To speed up the transformation of technological advancements, establish a cross-regional platform for collaboration between businesses, academic institutions, and research institutes in the digital economy. Additionally, encourage collaboration between businesses in peripheral cities and scientific research institutes in core cities.

Author Contributions

Conceptualization, K.L.; methodology, K.L.; software, J.H.; validation, J.H.; formal analysis, J.H.; investigation, J.H.; resources, K.L.; data curation, J.H.; writing—original draft, J.H.; writing—review and editing, K.L.; visualization, K.L.; supervision, K.L.; project administration, K.L.; funding acquisition, K.L. All authors have read and agreed to the published version of the manuscript.

Funding

This research was funded by the Taishan Scholar Foundation of Shandong Province, grant number tsqn202408139 and Shandong Provincial Education Department, China, grant number 2022RW064.

Institutional Review Board Statement

Not applicable.

Informed Consent Statement

Not applicable.

Data Availability Statement

Data will be made available on request.

Conflicts of Interest

The authors declare no conflicts of interest.

Abbreviations

The following abbreviations are used in this manuscript:
SNASocial network analysis
QAPQuadratic Assignment Procedure
CAICTChina Academy of Information and Communications Technology
NIPANational Intellectual Property Administration
FYPFive-year Plan
PRDPearl River Delta
YRDYangtze River Delta

References

  1. Lu, S. Research on the Path of China’s Digital Economy Development. Master’s Thesis, Party School of Liaoning Provincial Committee of the Communist Party of China, Shenyang, China, 2023. [Google Scholar]
  2. Wang, S.; Teng, T.; Hu, S.; Li, W. The evolution of the spatial network structure of China’s digital economy and its driving factors. Geogr. Sci. 2024, 44, 743–753. [Google Scholar]
  3. Cheng, Y.; Wu, C. Digital strategy to build a new pattern of China’s digital economy. Sci. Technol. Rev. 2022, 40, 5–11. [Google Scholar]
  4. Sang, M.; Qin, C. A new trend in the study of regional economy in foreign countries: The study of regional economic networks. Hum. Geogr. 2014, 29, 28–34. [Google Scholar]
  5. Yang, S.; Li, H.; Liu, X.; Wei, Y.; Shen, J.; Cheng, B. Spatial analysis of the digital economy’s influence on urban sustainable development: A decade-long study of Chinese prefecture-level cities. Ecol. Indic. 2024, 166, 112338. [Google Scholar] [CrossRef]
  6. Li, L.; Yuan, S. The level of development of China’s digital economy and the structure of regional networks. Res. Dev. 2024, 4, 31–40. [Google Scholar]
  7. Li, X.; Zhang, Y.; Zhou, S.; Wei, Y.; Shen, J.; Cheng, B. Exploration and future trends on spatial correlation of green innovation efficiency in strategic emerging industries under the digital economy: A social network analysis. J. Environ. Manag. 2024, 359, 121005. [Google Scholar] [CrossRef]
  8. Tapscott, D.; Agnew, D. Governance in the Digital Economy. Financ. Dev. 1999, 36, 34–37. [Google Scholar]
  9. Shang, Y.; Lee, H.; Ma, J. A Study on the Spatial Effects of the Digital Economy on Regional Economic Growth in China. Sustainability 2025, 17, 2259. [Google Scholar] [CrossRef]
  10. Niu, F.; Shi, R. Research on the spatial network and spillover effects of China’s digital economy. Big Data Res. 2024, 10, 161–171. [Google Scholar]
  11. Ouyang, R. Theoretical evolution, connotation characteristics, and development law of digital economy. Soc. Sci. Guangdong 2023, 1, 25–35. [Google Scholar]
  12. Bai, Y.; Zhang, J.; Wang, Z. The connotation, characteristics, theoretical mechanism and promotion strategy of rural digitization. Soc. Sci. Ningxia 2022, 5, 111–119. [Google Scholar]
  13. Ayres, U.R.; Williams, E. The digital economy: Where do we stand? Technol. Forecast. Soc. Change 2003, 71, 315–339. [Google Scholar] [CrossRef]
  14. Jiang, J.; Zhu, X. The development trend of the digital economy in foreign countries and the national development strategy of the digital economy. Sci. Technol. Prog. Policy 2013, 30, 124–128. [Google Scholar]
  15. Urinovich, K.A.; Qobiljonovich, R.O.; Baxtiyorvich, R.S.; Abdulakhatov, M.M. Modern content and concept of digital economy. ACADEMICIA Int. Multidiscip. Res. J. 2021, 11, 829–832. [Google Scholar] [CrossRef]
  16. Wang, S.; Li, Y.; Khaskheli, M.B. Innovation Helps with Sustainable Business, Law, and Digital Technologies: Economic Development and Dispute Resolution. Sustainability 2024, 16, 3910. [Google Scholar] [CrossRef]
  17. Li, M.; Zhang, L.; Zhang, Z. Impact of Digital Economy on Inter-Regional Trade: An Empirical Analysis in China. Sustainability 2023, 15, 12086. [Google Scholar] [CrossRef]
  18. Lai, S.; Chen, H.; Zhao, Y. Measurement and prediction of the development level of China’s digital economy. Humanit. Soc. Sci. Commun. 2024, 11, 1756. [Google Scholar] [CrossRef]
  19. Wang, B.; Wei, Y.; Ma, L. Measurement of China’s digital economy level and decomposition of relative regional differences—Based on weighted principal component evaluation method. J. Tianshui Norm. Univ. 2024, 44, 115–128. [Google Scholar]
  20. Huang, S. Research on the high-quality development of digital economy in Henan Province: Based on panel data of 17 prefecture-level cities. Technol. Ind. Across Strait 2024, 37, 4–8. [Google Scholar]
  21. Wang, H.; Peng, G.; Du, H. Digital economy development boosts urban resilience—Evidence from China. Sci. Rep. 2024, 14, 2925. [Google Scholar] [CrossRef]
  22. Shi, X. Comprehensive Evaluation Method of Digital Economy Development Level Based on Complex Network Model. Comput. Intell. Neurosci. 2022, 2022, 4999178. [Google Scholar] [CrossRef] [PubMed]
  23. Yang, Y.; Wang, A.; Liu, C.; Zhu, C. Study on the Measurement of the Level of Development of the Digital Economy and the Structure of Spatial Networks. J. Innov. Dev. 2024, 7, 54–61. [Google Scholar] [CrossRef]
  24. Yang, H. Research on Spatial Differences and Influencing Factors of Digital Economy Based on Spatial Econometric Mode. Master’s Thesis, Chongqing University of Technology, Chongqing, China, 2023. [Google Scholar]
  25. Zhang, H.; Li, S.; Zhou, Y. Measurement, spatial-temporal evolution and regional differences of digital economy development level in the Yellow River Basin. J. Xi’an Univ. Posts Telecommun. 2024, 29, 90–101. [Google Scholar]
  26. Luo, R.; Zhou, N. Dynamic Evolution, Spatial Differences, and Driving Factors of China’s Provincial Digital Economy. Sustainability 2022, 14, 9376. [Google Scholar] [CrossRef]
  27. Zhang, D.; Song, Y.; Gu, J. Measurement and spatiotemporal difference analysis of Chinese-style modernization construction level. Stat. Decis. 2024, 40, 103–108. [Google Scholar]
  28. Liu, Q.; Lu, L. Research on regional differences of spatial dynamic evolution of China’s digital economy. Sci. Manag. 2024, 44, 85–94. [Google Scholar]
  29. Miao, H.; Zhou, H. Comparison of Economic Linkages and Hierarchical Structure of Three Major Urban Agglomerations in China: An Analysis Based on Integrated Gravity Model. Econ. Geogr. 2017, 37, 52–59. [Google Scholar]
  30. Yu, H. Research on the spatial correlation and driving factors of China’s digital economy. J. Stat. Inf. 2021, 36, 23–34+44. [Google Scholar]
  31. Sun, Y.; Wang, Y. Research on the spatial correlation network of China’s digital economy. Stat. Res. 2024, 41, 44–56. [Google Scholar]
  32. Yang, W.; Yan, M.; Wang, X.; Shi, J. Study on the Spatial Association Network Structure of Urban Digital Economy and Its Driving Factors in Chinese Cities. Systems 2025, 13, 322. [Google Scholar] [CrossRef]
  33. Dong, J.; Wang, J. Analysis of the spatial correlation network and its influencing factors of China’s digital economy. Sci. Technol. Ind. 2023, 23, 81–89. [Google Scholar]
  34. Yang, W.; Wang, J. Research on the regional spatial correlation and mechanism of China’s high-tech industry. Macroeconomics 2023, 5, 55–66+116. [Google Scholar]
  35. Xia, X.; Li, X. Analysis of the structural characteristics of the spatial correlation network and its driving factors for the development of e-commerce in China. Guizhou Soc. Sci. 2021, 2, 132–140. [Google Scholar]
  36. Guo, J.; Cai, Q. Does digital finance enhance the city’s innovation vitality? An empirical study of patent data from 253 cities. Financ. Mark. Res. 2024, 2, 76–86. [Google Scholar]
  37. Li, T.; Shi, Z.; Han, D.; Zeng, J. The Development of Digital Economy and the Quality of Provincial Innovation: Evidence from the Quality of Patents. Stat. Res. 2023, 40, 92–106. [Google Scholar]
  38. Li, G.; Wang, L. Spatial association network analysis of China’s provincial digital economy. Financ. Theory Teach. 2023, 3, 59–67. [Google Scholar]
  39. Jin, C.; Xu, A.; Qiu, K. Measurement of China’s provincial digital economy and its spatial correlation. J. Stat. Inf. 2022, 37, 11–21. [Google Scholar]
  40. Cui, R.; Zhai, L.; Sun, Y. The spatial correlation network structure of China’s digital economy and its influencing factors. Rev. Econ. Manag. 2023, 39, 95–108. [Google Scholar]
  41. Feng, X.; Ma, X.; Lu, J.; Tang, Q.; Chen, Z. Assessing the impact of the digital economy on sustainable development in the underdeveloped regions of western China. Cities 2025, 156, 105552. [Google Scholar] [CrossRef]
  42. Wang, X. Research on the spatial correlation network and influencing factors of digital economy in the Yangtze River Delta urban agglomeration. Hous. Real Estate 2023, 30, 48–53. [Google Scholar]
  43. Tang, J.; Gao, Y. Measurement of High-Quality economic development level and comparison of regional differences in China’s central and Western regions. Technol. Innov. Manag. 2024, 45, 521–531. [Google Scholar]
  44. Zhang, J.; Cheng, Y.; Shi, X.; Zhang, Y. Impact of Digital Economy Industrial Agglomeration on Carbon Emissions: A Case Study of the Four City Clusters Along the Eastern Seaboard of China. Sustainability 2025, 17, 3053. [Google Scholar] [CrossRef]
  45. Zhang, X.; Ding, R.; Yang, W. Study on Spatial Differentiation of Digital Economy and It’s Driving Factors in China: Based on Geodetector. Sustainability 2024, 16, 10472. [Google Scholar] [CrossRef]
  46. Shen, R.; Li, J.; Peng, Y. Analysis of the Development Patterns and Improvement Strategies of China’s Digital Economy—Drawing Insights from Data Collected across 227 Cities in China. Sustainability 2024, 16, 4974. [Google Scholar] [CrossRef]
  47. Liu, X.; Wen, G. Statistical measurement of the development level of digital economy in Sichuan Province. Bus. Obs. 2024, 10, 30–35. [Google Scholar]
  48. Fu, Y.; Zhang, C.; Liu, K.; Liu, W. Spatially linked network structure of digital economy development and Its driving factors: Taking the Yangtze River Economic Belt as an Example. Areal Res. Dev. 2023, 42, 20–25. [Google Scholar]
  49. Zhao, T.; Zhang, Z.; Liang, S. Digital economy, entrepreneurship, and High-Quality economic development: Empirical evidence from urban China. Manag. World 2020, 36, 65–76. [Google Scholar]
  50. Guo, F.; Wang, J.; Wang, F.; Kong, T.; Zhang, X.; Cheng, Z. Measuring China’s digital financial inclusion: Index compilation and spatial characteristics. China Econ. Q. 2020, 19, 1401–1418. [Google Scholar]
Figure 1. The trend of changes in the level of the urban digital economy.
Sustainability 17 05382 g001
Figure 2. Spatial correlation network of China’s urban digital economy from 2006 to 2022.
Sustainability 17 05382 g002
Table 1. Calculation formulas of social network analysis.
IndicatorsCalculation FormulasMeaning of Indicators
Network Density D = L / N N 1 The higher the network density,
the more network associations
N e t w o r k   R e l e v a n c e C = 1 V / N N 1 / 2 The higher the network relevance,
the stronger the robustness of the network structure
N e t w o r k   E f f i c i e n c y E = 1 M / max ( M ) This represents an indicator of
the network’s level of redundancy
N e t w o r k   H i e r a r c h y H = 1 K / max K The more rigorous the network structure and the more pronounced the hierarchical order, the higher the network hierarchy
D e g r e e   C e n t r a l i t y R D i = n / N 1 This represents how important a city is in the network
B e t w e e n n e s s   C e n t r a l i t y R B i = 2 N 2 3 N + 2 j N k N g j k i g i k This represents the city′s ability to control network resources
C l o s e n e s s   C e n t r a l i t y R C i = N 1 / j = 1 N d i j This represents the extent of inter-city
communication synergy
Note: L is the actual number of associations between nodes, whereas N is the network’s total number of nodes; V is the quantity of node pairs that cannot be reached, and K is the number of symmetrically reachable member pairs in the network. M is the number of redundant connections; n represents the number of nodes directly connected with other nodes; and g j k is the number of nodes between nodes i and k.
Table 2. Overall network characteristic results.
DensityRelevanceEfficiencyHierarchy
20060.04210.22120.72880
20070.04640.28170.75940.0125
20080.05170.34140.77340.0112
20090.07230.51490.78840.0271
20100.07050.49070.77980.0092
20110.08070.60720.79360.0403
20120.08230.63850.79950.0471
20130.08650.64550.79170.0078
20140.0880.69660.80360.0368
20150.09890.80580.80510.0273
20160.10530.87480.80780.0261
20170.10330.89150.81310.0575
20180.10810.90350.80610.0508
20190.09790.84370.81170.045
20200.10950.90110.80370.0833
20210.11520.91150.79650.0673
20220.11920.95730.80020.073
Average0.0870.6780.7920.037
Table 3. Ranking of the cities’ degree centrality in 2010.
In-DegreeOut-DegreeNet In-DegreeDegreeRank
Shenzhen2091919067.4191
Guangzhou2003316764.8392
Xiamen1993616364.5163
Wuxi1933016362.2584
Suzhou1953815762.9035
Hangzhou1984715164.1946
Ningbo1903915161.2907
Shanghai1995514464.5168
Foshan1703513554.8399
Nanjing1764613057.41910
Table 4. Ranking of the cities’ degree centrality in 2015.
In-DegreeOut-DegreeNet In-DegreeDegreeRank
Shenzhen2811426787.2671
Guangzhou2602423680.7452
Suzhou2714123084.1613
Hangzhou2714522684.1614
Wuxi2684222683.2305
Nanjing2654422182.2986
Shanghai2654621982.6097
Ningbo2654921682.9198
Changzhou2464020676.7089
Beijing2555520079.50310
Table 5. Ranking of the cities’ degree centrality in 2020.
In-DegreeOut-DegreeNet In-DegreeDegreeRank
Shenzhen2821326989.5241
Nanjing2844923590.1592
Hangzhou2744323186.9843
Shanghai2835223190.4764
Suzhou2835223190.1595
Beijing2805023088.8896
Guangzhou25222230807
Wuxi2775222588.2548
Changzhou2645121384.4449
Ningbo2484320580.31710
Table 6. Ranking of the cities’ degree centrality in 2022.
In-DegreeOut-DegreeNet In-DegreeDegreeRank
Shenzhen2961727991.3581
Beijing2984625291.9752
Wuxi3025225093.2103
Nanjing2995624392.2844
Guangzhou2662624082.0995
Hangzhou2894924089.1986
Suzhou3016423793.2107
Shanghai3016923293.2108
Changzhou2875822988.5809
Hefei2544221279.01210
Table 7. Ranking of the cities’ betweenness centrality in 2010 and 2015.
20102015
CityBetweennessRankCityBetweennessRank
Shenzhen2.7731Shenzhen4.0631
Guangzhou2.5332Hangzhou3.5332
Xiamen2.4353Guangzhou3.4443
Hangzhou2.2254Suzhou3.4384
Shanghai2.1575Ningbo3.3125
Suzhou2.0946Wuxi3.2716
Wuxi1.99347Shanghai3.2517
Ningbo1.9508Nanjing3.1158
Beijing1.8439Beijing3.0799
Foshan1.71610Changsha2.91510
Table 8. Ranking of the cities’ betweenness centrality in 2020 and 2022.
20202022
CityBetweennessRankCityBetweennessRank
Shenzhen3.9781Shenzhen3.971
Beijing3.7172Beijing3.7112
Shanghai3.7063Shanghai3.5783
Suzhou3.6404Suzhou3.5784
Nanjing3.6195Nanjing3.5205
Hangzhou3.3536Wuxi3.5076
Wuxi3.3117Hangzhou3.3297
Wuhan3.1988Changzhou3.1938
Changzhou2.9739Guangzhou2.9929
Guangzhou2.96610Ningbo2.90810
Table 9. Ranking of the cities’ closeness centrality in 2010 and 2015.
20102015
CityClosenessRankCityClosenessRank
Shenzhen1.06351Shenzhen2.93901
Guangzhou1.06322Hangzhou2.93632
Xiamen1.06323Suzhou2.93633
Shanghai1.06324Wuxi2.93554
Hangzhou1.06325Ningbo2.93535
Suzhou1.06306Shanghai2.93506
Wuxi1.06297Nanjing2.93477
Ningbo1.06288Guangzhou2.93348
Beijing1.06269Beijing2.93239
Nanjing1.062410Changzhou2.929910
Table 10. Ranking of the cities’ closeness centrality in 2020 and 2022.
20202022
CityClosenessRankCityClosenessRank
Shanghai5.86701Shanghai12.42811
Nanjing5.86592Suzhou12.42812
Suzhou5.86593Wuxi12.42813
Shenzhen5.86374Nanjing12.41384
Beijing5.86165Beijing12.40905
Wuxi5.85946Shenzhen12.39956
Hangzhou5.85507Hangzhou12.36647
Changzhou5.84638Changzhou12.35708
Wuhan5.84319Ningbo12.31009
Ningbo5.832310Wuhan12.291410
Table 11. Results of QAP regression analysis.
Variables2010201520202022
G D P p e r 0.165353 ***0.137175 ***0.256339 ***0.143577 ***
VA3/VA2−0.013524−0.02542 **−0.02672−0.01706
UR−0.0039660.05535 ***0.05133 ***0.048604 ***
R&D0.151647 ***0.228974 ***−0.026720.279715 ***
Edu0.092996 ***0.094645 ***0.036535 ***0.076253 ***
Tech0.082827 ***0.092127 ***0.196715 ***0.055109 ***
Note: The variable coefficients are standardized regression coefficients; ** and *** represent significance levels of 5% and 1%, respectively.
Table 12. The results of model regression.
BBetatpVIF
Constant−22.517-−10.6190.000 **-
Digital patents0.0120.1653.1430.002 **1.792
GDP0.0251.28010.1240.000 **10.374
TIAV−1.376−0.697−5.2650.000 **11.365
R20.567
Adjusted R20.562
Note: ** represents significance levels of 5%.
Table 13. The results of alternative model regression.
BBetatpVIF
Constant−31.013-−14.5180.000 **-
IBPR12.5510.3417.5670.000 **1.533
GDP0.0190.9807.9590.000 **11.435
TIAV−0.952−0.482−4.0920.000 **10.469
R20.627
Adjusted R20.623
Note: ** represents significance levels of 5%.
Table 14. The results of QAP analysis.
Variables201020152022
G D P p e r 0.163080 ***0.118737 ***0.143577 ***
UR0.035133 **0.051823 ***0.048604 ***
R&D0.079258 ***0.244964 ***0.279715 ***
Edu0.093769 ***0.074307 ***0.076253 ***
Tech0.079258 ***0.089835 ***0.055109 ***
R20.1610.1600.175
Adjusted R20.1610.1600.175
Note: The variable coefficients are standardized regression coefficients; ** and *** represent significance levels of 5% and 1%, respectively.
Disclaimer/Publisher’s Note: The statements, opinions and data contained in all publications are solely those of the individual author(s) and contributor(s) and not of MDPI and/or the editor(s). MDPI and/or the editor(s) disclaim responsibility for any injury to people or property resulting from any ideas, methods, instructions or products referred to in the content.

