Article

Can Public Environmental Concern Drive Changes in Residents’ Green Consumption Behavior?

by
Jing Zhao
1,
Yaya Li
2,*,
Tian Wu
3 and
Wen Jiang
3
1
Jingjiang College, Jiangsu University, Zhenjiang 212028, China
2
School of Finance & Economics, Jiangsu University, Zhenjiang 212013, China
3
Department of Student Affairs, Jiangsu University, Zhenjiang 212013, China
*
Author to whom correspondence should be addressed.
Sustainability 2025, 17(12), 5352; https://doi.org/10.3390/su17125352
Submission received: 9 May 2025 / Revised: 6 June 2025 / Accepted: 7 June 2025 / Published: 10 June 2025
(This article belongs to the Section Economic and Business Aspects of Sustainability)

Abstract

:
Enhancing residents’ green consumption is essential to fostering high-quality economic advancement. This study constructs an indicator system for residents’ green consumption based on three subsystems: green manufacturing processes, sustainable lifestyles, and environmental ecosystems. A regression model analyzes how public environmental concern affects residents’ green consumption, using panel data from 30 provinces and cities in China over the period 2011–2023. Additionally, analyses of mechanisms and heterogeneity are carried out. The study results are presented below: First, public environmental concern (PEC) can significantly enhance residents’ green consumption (RGC), with an increase of 1% in PEC leading to a 0.261% rise in RGC. Second, green technological innovation (GTI) and market-based incentive environmental regulation (MER) mediate the relationship between PEC and RGC. However, the role of command-and-control environmental regulation (CER) as a mediator is insignificant. Third, there is heterogeneity in RGC based on region, pollution emissions, and innovation foundations. The impact of PEC is notably greater in central-western regions, areas with higher pollution emissions, and regions with better innovation foundations. Therefore, this study proposes policy recommendations from three aspects: improving public environmental concern, strengthening green technological innovation in enterprises, and formulating region-specific industrial upgrading paths to promote residents’ green consumption.

1. Introduction

On 24 October 2024, the UNEP published the Emissions Gap Report 2024, which indicated that, according to the current development trend, global temperature by the end of this century will increase by 3.1 °C relative to the period before industrialization, far exceeding the targets set by the Paris Agreement. Addressing environmental issues has become an inevitable challenge in the development processes of all countries. The Chinese government has been actively implementing the dual carbon goals, using policy constraints to drive the green transformation of industries [1,2]. However, sustained, healthy, and stable economic development requires a dual-driven approach from both the supply and demand sides. Consumption is also a key engine behind economic expansion [3]. In 2024, final consumption expenditure accounted for 44.5% of economic growth, boosting GDP growth by 2.2 percentage points. Since 2001, China has been vigorously promoting green consumption. The 20th National Congress of the Communist Party of China explicitly advocated for the growth of green and low-carbon industries, encouraging green consumption, fostering low-carbon production, and adopting sustainable lifestyles. Despite the government’s high regard for this issue, the rising living standards have led to unreasonable consumption patterns that have substantially impacted resources and the environment. The green transformation in the consumption sector has influenced overall green development [4]. China’s current demand for green consumption has yet to be realized, and the green consumption sector is still a shortcoming in China’s low-carbon transformation.
Elkington was the first to present the notion of green consumption in his Green Consumption Guide, in which he described it as the consumption behavior of products that are pollution-free, waste-free, and harmless to human health [5]. In 2022, the Implementation Plan for Promoting Green Consumption was issued by the State Council, in which green consumption is defined as adopting green and low-carbon principles throughout the consumption process by various consumer entities. The concept of green consumption centers on a consumption style that prioritizes conserving resources and protecting the environment, reflecting consumers’ social responsibility toward ecological protection [6]. Green consumption’s characteristics include the greening of consumption concepts, the reduction in the quantity of consumption, and the optimization of consumption structure. Therefore, transforming green consumption on the demand side not only facilitates the achievement of the ‘dual carbon’ targets but also serves as a key driver of high-quality development, improved living standards, and the practical implementation of the concept that “lucid waters and lush mountains are invaluable assets” [7] (p. 101).
As early as 1979, China enacted the Environmental Protection Law. However, during the formal implementation of environmental regulation, challenges such as insufficient funding and ineffective oversight have frequently arisen. Moreover, some local governments, prioritizing economic development, have at times compromised environmental protection in the pursuit of economic growth [8]. Therefore, when formal environmental regulations are ineffective, informal environmental regulations can influence the market [9]. Since the 2015 implementation of the Environmental Protection Law of the People’s Republic of China, which for the first time legally acknowledged the role of the public in environmental governance, the Chinese government has been actively clarifying the legal entitlements and participation channels available to the public in environmental governance through various laws and regulations [10]. To promote modern environmental governance, the CPC Central Committee and the State Council introduced a guiding document in 2020 to emphasize further the importance of strengthening social supervision and improving channels for environmental oversight [11]. The Chinese government has consistently been committed to building a modern, diversified environmental governance system characterized by governmental leadership, active enterprise participation, and broad engagement from society and the public. By expressing environmental concerns through government platforms or social media, the public not only contributes to bridging the informational divide among governmental authorities, corporations, and society, thereby preventing significant environmental issues from triggering public outcry [12], but also reduces the costs of environmental governance and promotes the modernization of China’s system of ecological and environmental governance. In recent years, as global environmental challenges have intensified, public awareness of environmental protection has continued to grow. Public environmental concern has gradually emerged as a crucial force in promoting environmental preservation [13]. In 2015, the documentary Under the Dome drew widespread public attention to environmental issues, which helped advance the implementation of environmental policies and regulations, such as the Action Plan for Air Pollution Prevention and Control. In 2019, the introduction of waste sorting in Shanghai was significantly driven by public participation and supervision, contributing to the improvement and enforcement of related policies. With the rapid development of internet technologies, the public has gained more opportunities to express opinions, while the cost of engaging in environmental oversight has decreased. As a result, public environmental concern has become a key mechanism for environmental governance in China [14,15].
Baidu, the largest search engine in China, accurately reflects the public’s focus on particular keywords through its search index [16]. The mainstream research method utilizes the Baidu index to evaluate public environmental concern. Figure 1 shows the daily trend in the Baidu search index at the national level for the keyword “environmental pollution”. The public’s immediate focus on environmental concerns and their sensitivity to major environmental events are constantly improving. The public’s awareness of their role in environmental management is also constantly improving.
  • March 2015: Under the Dome documentary raises awareness of environmental issues related to coal burning.
  • March 2017: The 2017 Work Plan for Air Pollution Prevention and Control in the Beijing–Tianjin–Hebei Region and surrounding areas was officially released.
  • March 2018: Pilot implementation of the household waste classification system begins.
  • September 2020: The “dual carbon” targets are officially proposed.
  • Data source: Baidu search index; Note: Data visualization using Python 3.13.3
Public environmental concern involves recognizing environmental issues and proactively solving pollution-related problems. Thus, public environmental concern reflects public recognition of environmental challenges and the intention to contribute to mitigating environmental pollution. Therefore, it is worth investigating whether public environmental concern can transform residents’ green consumption willingness into actual purchasing power, and the direction and extent of their impact on residents’ green consumption warrant further investigation. Based on this, the main contributions and possible incremental contributions of this research are outlined below: This study uses panel data from 30 provinces and cities in China (excluding Tibet, Hong Kong, Macao, and Taiwan) from 2011 to 2023 to empirically analyze the impact of public environmental concern (PEC) on residents’ green consumption (RGC). It systematically analyzes how green technological innovation (GTI) and formal environmental regulation (ER) are intermediaries between PEC and RGC. The study also examines the regional, pollution emission, and innovation foundations in explaining the diversity of RGC. The study aims to uncover the “black box” of how PEC influences RGC and offer policy recommendations to guide the government in promoting RGC.
This paper is structured as follows: Section 2 surveys relevant literature and investigates PEC’s direct and indirect effects on RGC from a theoretical perspective. Section 3 focuses on constructing the indicator system for RGC and analyzing the measurement results. Section 4 outlines the research methodology and variable selection. Section 5 presents the findings from the empirical analysis, covering both mechanism analysis and robustness tests, endogeneity evaluations, and heterogeneity analysis. Section 6 presents a comparative discussion of the findings of this study with those from existing literature. Section 7 delivers a conclusion by highlighting the primary research insights and related policy recommendations.

2. Literature Review and Research Hypotheses

2.1. Research on Public Environmental Concern

Existing research on PEC mainly focuses on pollution control, corporate green technological innovation, and industrial transformation. Regarding pollution control, PEC strengthens the government’s supervisory role of the environment, encourages the mitigation of pollution and carbon emissions, and improves the efficiency of environmental governance [17]. Long et al. found that PEC helps narrow the urban–rural pollution gap [18]. Wang et al. revealed through the empirical study of urban areas in China that the role of PEC in encouraging carbon emission reduction is particularly significant in northern cities and those with resource regeneration [19]. Regarding corporate GTI, PEC substantially prevents the entry of environmentally harmful enterprises [8], forcing enterprises to internalize the externalities of pollution emissions and stimulating enterprises to boost their investment in GTI [20]. Li and Wang found through a survey of 151 automobile companies that PEC encourages all automobile companies to carry out GTI and has a particularly significant impact on the sustainability of innovation of medium and large enterprises [21]. Regarding industrial transformation, PEC has a significant role in promoting industrial structure optimization. Liu et al. found that the role of PEC in industrial structure optimization exhibits regional differences, which are connected to the level of environmental regulation in each region [22].

2.2. Research on Green Consumption

The discussion on green consumption in existing research mainly focuses on its influencing factors. Certain scholars employ the extended theory of planned behavior to assess the two elements of socio-demographic characteristics and psychological characteristics [23,24]. Regarding socio-demographic characteristics, there are significant differences in these aspects, including factors like age, income, and education level, in relation to the level of green consumption [25]. Most studies show that higher income and education levels are associated with increased green consumption [26,27]. Regarding psychological characteristics, environmental awareness is an important factor affecting green consumption. Akehurst et al. identified that consumers’ awareness and stance towards environmental protection positively affect green consumption [28]. Xie et al. revealed that environmental awareness enhances attitudes, subjective norms, and perceived behaviors related to green consumption, thereby promoting its growth [3]. Sun et al. found that environmental attitudes and awareness promote green consumption [27]. Hua and Pang found that environmental awareness is the internal factor that impacts green consumption levels the most [29].

2.3. Critical Review of the Literature

Consumers’ environmental awareness can be reflected through PEC, yet the influence of PEC on RGC remains underexplored in the literature. The limitations of current research are primarily manifested in the following two areas. First, RGC is usually statistically analyzed through questionnaires. Respondents may conceal their thoughts for reasons of “environmental correctness”, and questionnaire data is not conducive to time and space comparison. Second, existing studies mostly analyze the effect of PEC on the government, enterprises, or industries, ignoring the actions that the public may take, namely RGC. Green consumption serves as a key engine for advancing high-quality economic development. Studying the impact of PEC on RGC is significant to achieving the “dual carbon” goal.

2.4. Influence Mechanism and Research Hypothesis

The public is both a beneficiary of a good ecological environment and a victim of environmental pollution [30]. With sustained economic advancement in recent years, the standard of living among China’s population has significantly improved. The pursuit and aspiration for a better life have become increasingly common and urgent. From one perspective, public awareness of environmental governance has been continuously strengthening. Prompted by environmental awareness and a heightened sense of public responsibility, the public has spontaneously adopted more environmentally sustainable lifestyles [31,32]. Compared with the supervision of government and enterprises due to PECs, it is more feasible and enforceable for the public to purchase green products directly. Therefore, the public is more willing to take action on its own. Therefore, PEC can be directly transmitted through market mechanisms, leading to a shift in consumer preferences for green products [33]. Zheng et al. found that PEC can influence individuals’ green lifestyles by enhancing their environmental awareness [34]. Tong et al. conducted a questionnaire-based survey to examine the factors influencing Chinese consumers’ willingness to purchase and pay for environmentally friendly food. Their study revealed that consumers’ concern about environmental issues significantly increases their willingness to purchase green food [35]. From another perspective, based on the theory of planned behavior, the expectations and pressure from others or groups, namely subjective norms, will also affect individual consumption behavior [36,37]. When consumers are wavering between lower commodity prices and encouragement, as society’s overall attention to the environment increases, the public feels stronger expectations from others or social groups, and consumers tend to conform to subjective norms and buy more green products. Consumers’ willingness to pay extra for environmentally friendly products enhances their market competitiveness and encourages enterprises to adopt low-carbon transformation strategies. Xu et al. found that subjective norms influence RGC. When the majority of people purchase green products, individual consumers are more likely to develop a willingness to do the same. Moreover, among the components of subjective norms, descriptive norms exert a stronger positive effect on green consumption intention than injunctive norms [38].
Hypothesis 1:
PEC can enhance RGC.
The public plays a dual role as both beneficiaries and supervisors of policy implementation. From one perspective, PEC can serve as a channel for timely feedback to government authorities regarding environmental issues through platforms such as government portals, hotlines, and social media outlets (e.g., WeChat and Weibo), thereby enhancing the transparency of information disclosure [39]. Wu et al. found that PEC reduces the information asymmetry between the central government and local governments or enterprises, curbs collusive behavior between local governments and firms, and encourages local governments to strengthen ER and increase investment in environmental infrastructure, ultimately motivating enterprises to invest in environmental governance [40]. From another perspective, after environmental indicators were incorporated into the performance assessments of government officials, public dissatisfaction expressed through online platforms could exert pressure on the government, compelling it to strengthen environmental governance and enforce stricter environmental regulations [41]. According to the theory of public value [42], when formulating environmental policies, the government should respond to citizens’ collective needs and preferences to ensure the legitimacy of policy formulation and maximize its benefits. Therefore, the government will use environmental advocacy to steer the public towards eco-friendly behaviors and encourage the purchase of green products. Ma et al., using provincial-level data from China spanning the period from 2011 to 2020, conducted an empirical analysis of the mediating effects of PEC expressed through traditional and new media channels on environmental pollution. The study found that PEC not only has a direct inhibitory effect on environmental pollution but also indirectly reduces pollution by prompting the government to strengthen ER [43]. Similarly, Du et al. found that increased public attention to environmental issues leads local governments to adopt stricter formal regulatory measures and that ER serves as a mediating mechanism through which PEC suppresses pollution [8].
Hypothesis 2:
PEC can increase RGC by enhancing the intensity of ER.
The public serves both as consumers of products and as the primary driver of market demand. From one perspective, PEC has heightened the government’s focus on environmental issues and enhanced its regulatory efforts. As outlined by the Porter Hypothesis, an increase in environmental regulation, when appropriately managed, can encourage technological advancements by companies [44], encouraging them to produce low-carbon products that align more closely with consumer demands, thereby fostering growth in RGC. Li et al. found that PEC significantly enhances the level of GTI within firms as companies seek to meet the expectations of relevant stakeholders [45]. Chen et al., using panel data from 281 prefecture-level cities in China from 2004 to 2016, conducted an empirical study and found that environmental regulation has a positive impact on GTI [46]. From another perspective, PEC can also influence social opinion, altering the stance of polluting enterprises toward product production by triggering public opinion and “voting with money”. Due to the constraints imposed by the household registration system and decision-making mechanisms, the effectiveness of public expression of environmental demands through “voting with feet” and “voting with hands” in China is very limited [40]. As a result, “voting with money” has become the most efficient means for the public to engage in environmental protection in China. By “voting with money”, the public can reinforce the rewards for companies’ green environmental behaviors or the penalties for polluting production practices [47]. Faced with the dual pressure of reputational damage and rising emission reduction costs, companies will take the initiative to improve production processes, engage in GTI, and produce green products that meet consumer demands [48,49], thereby promoting the improvement of RGC. Li et al. found that public opinion can influence a firm’s image, which in turn affects its performance in the secondary market. As a result, under the pressure of public opinion, firms tend to consciously reduce polluting behaviors and actively assume responsibility for producing green products and fulfilling their environmental and social obligations [50].
Hypothesis 3:
PEC can increase RGC by fostering GTI in businesses.
Figure 2 illustrates the direct and indirect pathways through which PEC influences RGC.

3. Residents’ Green Consumption Measurement

3.1. Indicator System

Domestically and internationally, a mature RGC evaluation indicator system has not yet been fully established. Some scholars believe that green consumption primarily emphasizes low energy consumption, low emissions, and low pollution in the consumption process, which is reflected in key consumption areas covering clothing, food, housing, and transportation. Therefore, the focus is on constructing the indicator system with a focus on consumption patterns [51]. Shen et al. evaluated green consumption in relation to both direct and indirect consumption aspects, finding that urban public transportation volume, forest coverage rate, and per capita private vehicle ownership have the most significant impacts on green consumption [52]. Yao and Xia constructed an evaluation indicator system based on four aspects: ecological environment, consumption level, consumption structure, and consumption environment. By combining the entropy weight method and the TOPSIS method, they assessed green consumption across provinces. They demonstrated that the implementation of green finance policies has a positive impact on promoting the development of green consumption in China [53]. Wang et al. developed urban green consumption indicators based on production, lifestyle, and tourism consumption, while constructing rural green consumption evaluation indicators from an agricultural production perspective. They applied the entropy method to assign differentiated weights to urban and rural areas. Their study revealed that, from 2003 to 2019, green consumption levels across 30 Chinese provinces initially declined and then stabilized [4]. In 2018, the government of Suining City constructed the first municipal-level green consumption indicator system in China, which includes five dimensions: green consumption supply, production consumption, lifestyle consumption, consumption environment, and consumption foundation. Based on this framework, a comprehensive evaluation of Suining’s green consumption status was conducted, yielding a total green consumption index of 81.92, which indicates an overall favorable level of green consumption development [54].
This study, integrating previous research and data availability, constructs an evaluation indicator system from three subsystems: green manufacturing processes, sustainable lifestyles, and environmental ecosystems. Four secondary indicators are selected in the green manufacturing processes subsystem: fertilizer applied per unit of cultivated and irrigated land, per capita solar water heater area in rural areas, sulfur dioxide emissions relative to GDP, and energy consumption intensity. In the sustainable lifestyles subsystem, four secondary indicators were selected: daily energy consumption per person, per capita public bus and electric vehicle operations, per capita private car ownership, and per capita daily water consumption. Four indicators were selected in the environmental ecosystems subsystem: proportion of household waste subjected to harmless treatment, per capita park green space area, urban green coverage rate, and percentage of GDP spent on energy saving and environmental protection. Detailed information is presented in Table 1.

3.2. Data Sources

The study draws on data sourced from 30 different provinces and cities nationwide (with the exception of Tibet, Macao, Hong Kong, and Taiwan regions) from 2011 to 2023. The total energy consumption and daily energy consumption are obtained from the China Energy Statistical Yearbook, the China Statistical Yearbook, and local statistical yearbooks. The sulfur dioxide (SO2) data comes from the China Environmental Statistical Yearbook, while other data are sourced from the China Statistical Yearbook or the National Bureau of Statistics website. The absence of data was resolved by collecting additional information through local statistical yearbooks or interpolation methods.

3.3. Calculation Methods

The weighting method is a primary approach for constructing indicator systems and can be classified into subjective weighting, objective weighting, and a combination of both. Subjective weighting relies on human judgment to assess the relative importance of indicators, which inevitably introduces a degree of bias and lacks objectivity [4]. Although the combined weighting method leverages the strengths of objective approaches to compensate for the limitations of subjective assessments, the proportion between subjective and objective weights still depends on human judgment. Therefore, this study utilizes the objective weighting method—the entropy method—to construct the RGC indicator system. The process is as follows:
First, distinguish between positive and negative indicators and standardize the data.
Positive   indicators :   x i j * = x i j min ( x i j ) max ( x i j ) min ( x i j )
Negative   indicators : x i j * = max ( x i j ) x i j max ( x i j ) min ( x i j )
where x i j represents the i-th sample under the j-th indicator (where j = 1,2,…,12).
Next, the proportion, entropy value, and entropy weight of each indicator are calculated using the following formulas:
P i j = x i j * / i = 1 n x i j *
e j = 1 ln θ i = 1 n P i j ln P i j
W j = ( 1 e j ) / j = 1 12 ( 1 e j )
In calculating entropy values, to avoid taking the logarithm of zero, all standardized data are shifted by adding 1 to each value.

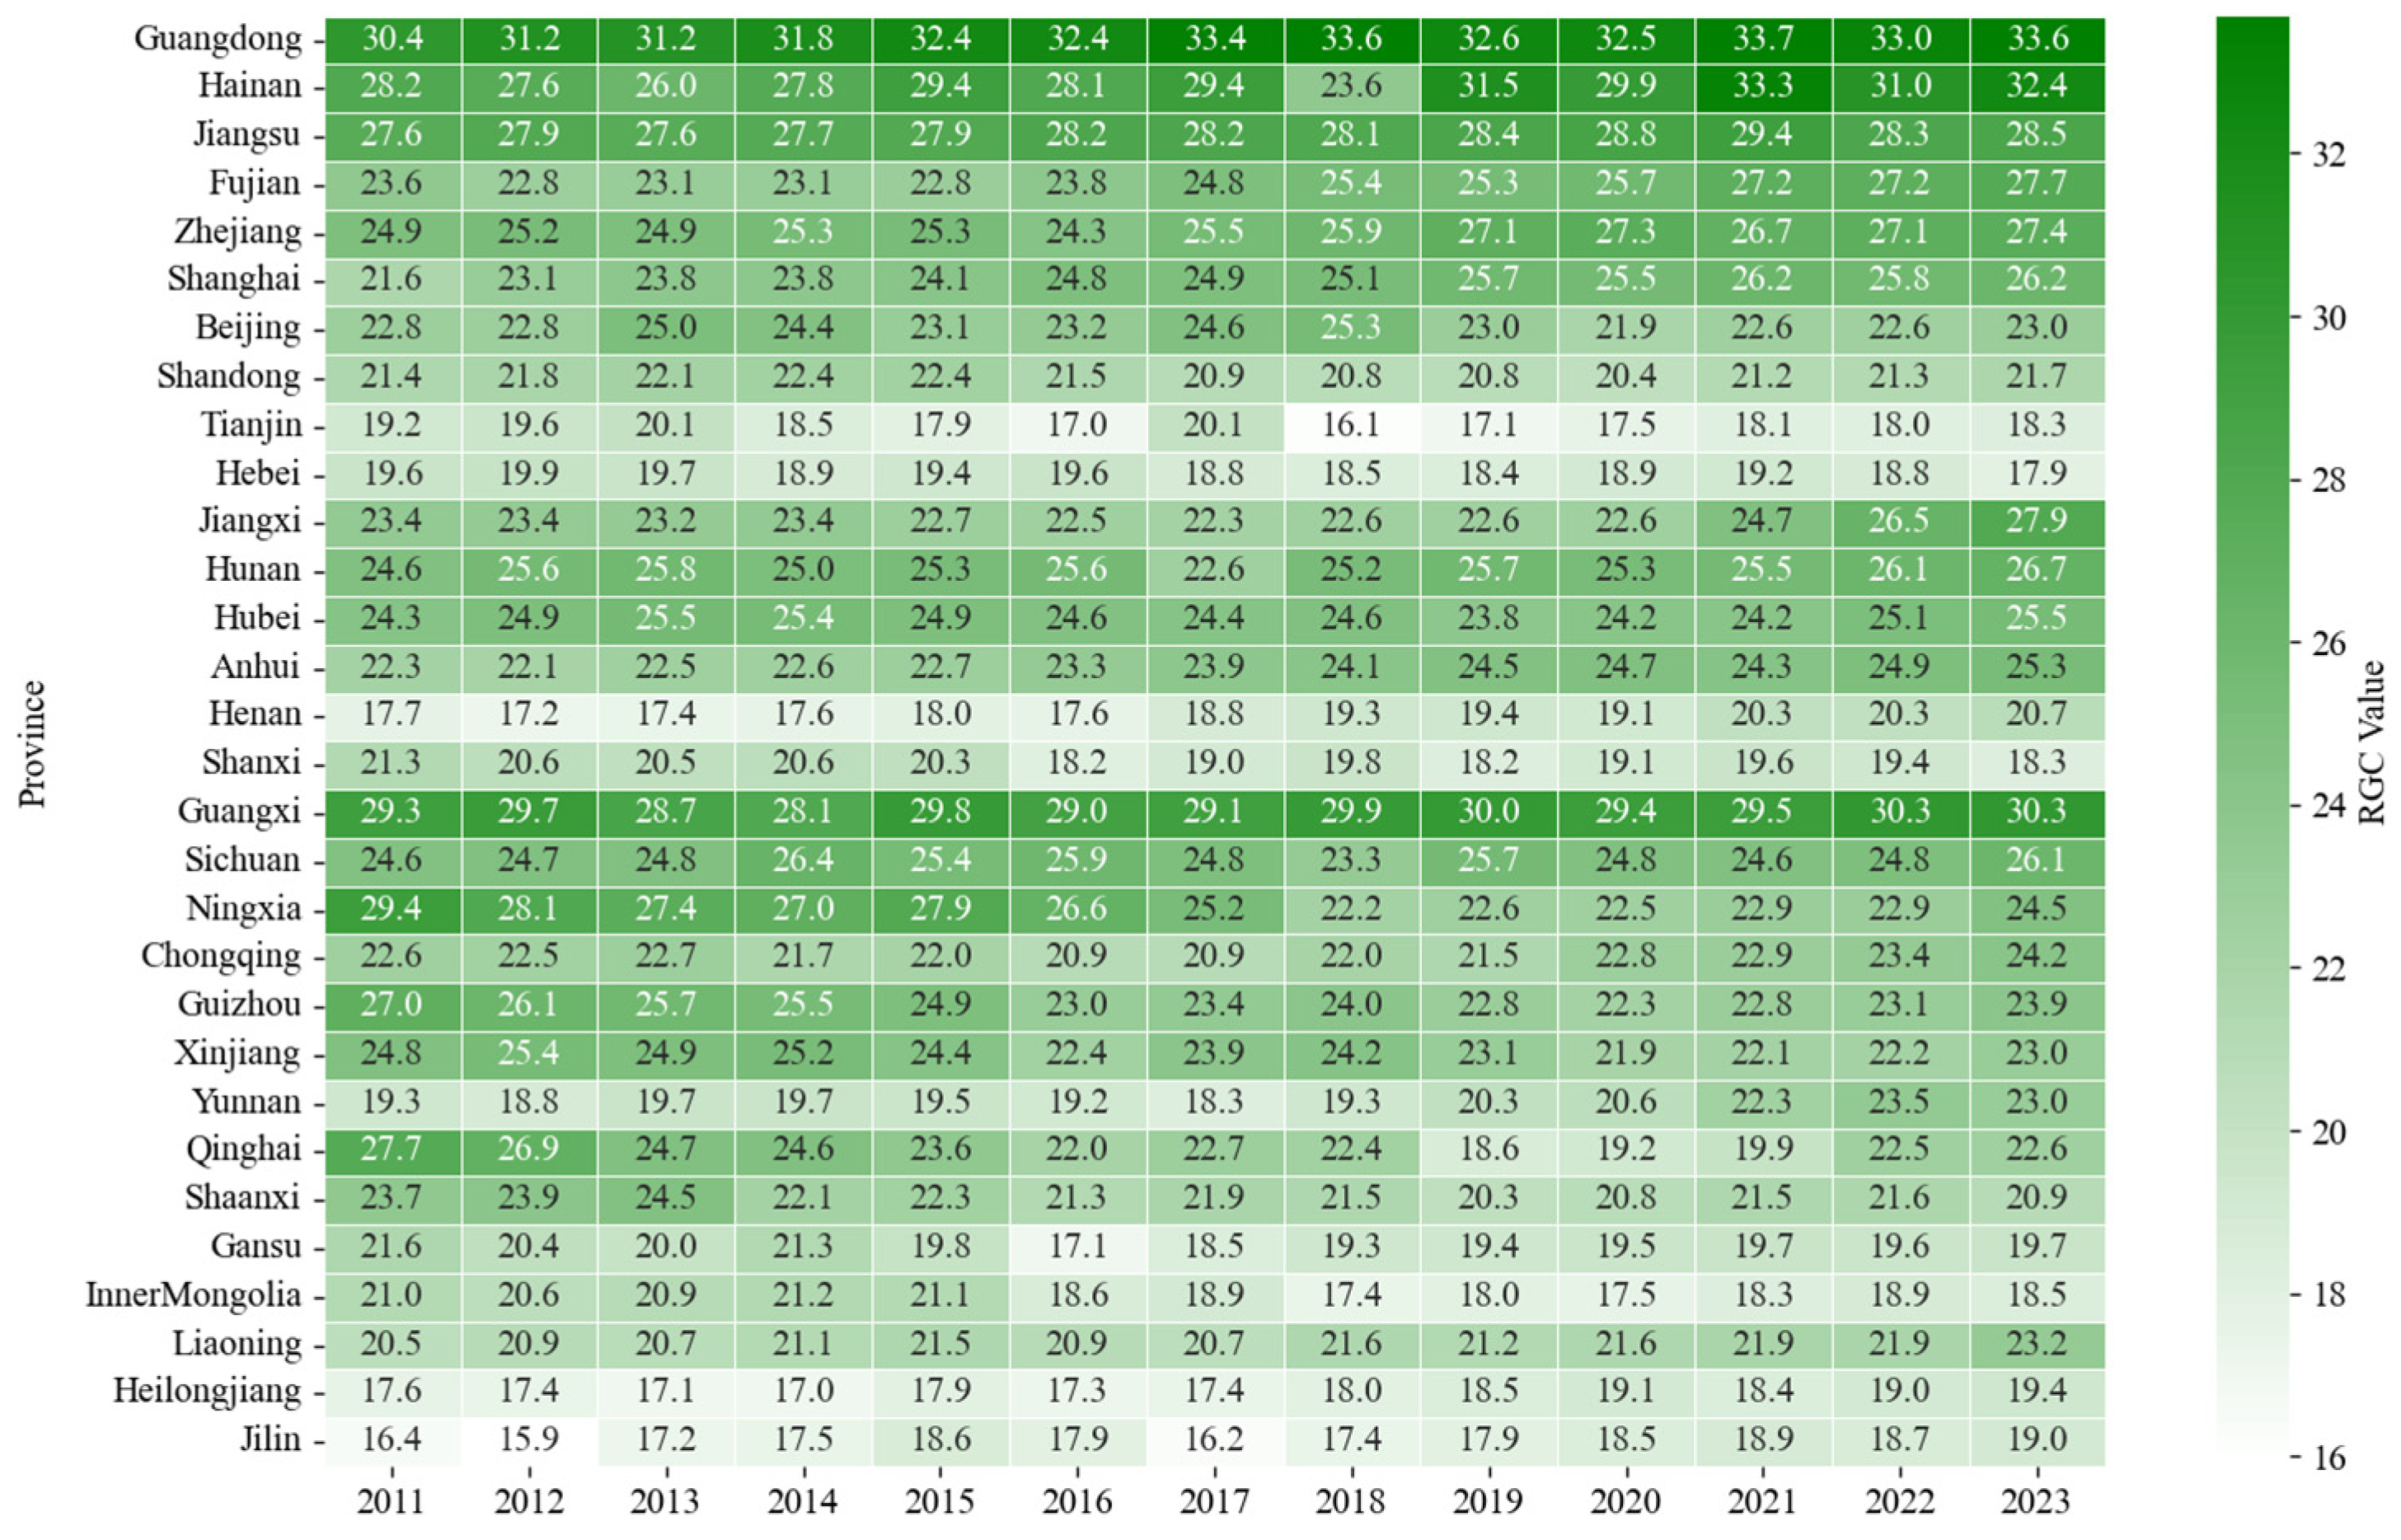
3.4. Current Development of RGC

The results of measuring RGC from 2011 to 2023 are shown in Figure 3. Overall, the national green consumption level has been rising. In 2023, the green consumption levels of residents in Guangdong, Hainan, Guangxi, Jiangsu, Jiangxi, Fujian, and Zhejiang ranked among the top nationwide (top 1/4). These regions are mainly concentrated in the more economically developed eastern areas, where local governments have invested heavily in environmental protection, green transformation began earlier, and residents have higher incomes, which enables stronger consumption capacity for green products. In contrast, provinces and municipalities such as Hebei, Shanxi, Tianjin, Inner Mongolia, Jilin, Heilongjiang, and Gansu (ranked in the bottom 1/4) generally show lower green consumption levels. Most of these areas are in less economically developed western and northeastern regions. In some areas, the focus is still on hosting industrial transfers from the eastern regions. The local governments’ environmental regulations are less stringent than in the eastern regions, and residents’ income levels are relatively lower, limiting their purchasing power for green products. Therefore, it is evident that RGC in different regions of China exhibits significant spatial heterogeneity.

4. Research Framework

4.1. Model Framework Design

This study aims to investigate the effect of PEC on RGC and sets up the baseline model as follows (Equation (6)):
R G C i t = α + β 1 P E C i t + γ X i t + μ i + η t + ε i t
RGC, indicating residents’ green consumption, is the dependent variable; PEC, representing public environmental concern, serves as the core independent variable; X represents the control variables; μ i , η t represent regional and time fixed effects, respectively, ε i t is the error term.

4.2. Variable Selection

Dependent Variable: Residents’ Green Consumption (RGC), as shown in Table 1.
Core Independent Variable: Public Environmental Concern (PEC). The measurement of PEC involves three main approaches in existing research: the number of NPC suggestions or CPPCC proposals on environmental issues [55], provincial environmental petitions [56], and searches related to environmental issues on Internet search engines. However, petitions are inefficient and costly, creating barriers to comprehensive public participation in environmental decision-making through petitions. Although NPC suggestions or CPPCC proposals are formed based on extensive consultation, they have a certain time lag and cannot provide timely feedback on public opinions. Therefore, this study follows the approach of Long et al. [57] and Ren et al. [58], employing the Baidu search index to measure interest, using “environmental pollution” as the key search term (which is derived from the sum of the PC and mobile search indices). There are two primary reasons for this decision. On the one hand, the advancement of the Internet has made it more convenient for the public to access and follow environmental issues online. By searching for environment-related keywords, PEC can be reflected, which is not affected by the scale of Internet users or cumulative search queries [16]. Being China’s most dominant search engine, Baidu’s search index more accurately and comprehensively reflects users’ behaviors. Analyzing the frequency, time, and regional distribution of searches for a given keyword makes it possible to assess PEC in different regions [59,60]. On the other hand, some existing studies have used “haze” as the keyword, but since the release of the Three-Year Plan to Win the Blue Sky Defense Battle by the State Council in 2018, a substantial decrease in haze days has been observed in China. Since the 13th Five-Year Plan, the PM2.5 concentration has decreased by 28.6%. Starting in 2018, the Baidu search index for the term “haze” began to show a downward trend, while PEC did not decrease with the reduction in haze days. Therefore, instead of “haze”, this study chose the more representative term “environmental pollution” as the keyword. As part of the robustness check, the study also re-measured PEC, taking “haze” as the keyword.
Control Variables:
Urbanization Level (URB): During the urbanization process, residents gain access to richer consumption patterns and channels, which promote the formation of green consumption behaviors [61]. This is calculated using the percentage of urban residents in comparison to the overall population.
Resident Income Level (RES): The extent to which consumers can act on their green consumption intentions is determined by their income level, measured by per capita disposable income.
Government Intervention (GOV): Government guidance and policy support for green consumption and low-carbon living affect consumer behavior and decision-making, captured by the local fiscal expenditure-to-GDP ratio.
Human Capital Level (EDU): Consumers with different education levels may demonstrate differences in green consumption concepts, affecting RGC. EDU can be measured in terms of the percentage of the population holding a college degree or higher as a percentage of the total population.
Logistics Efficiency (LE): Online shopping is one of today’s most common shopping methods. Logistics efficiency affects consumer satisfaction with online shopping, impacting consumption levels [51]. The total length of postal routes in a region serves as the measurement.
Industrial Structure Upgrading (IND): As industries transition toward low-carbon development, upgrading the industrial structure brings about product upgrades and innovations, providing consumers with more choices for green consumption [10]. IND is quantified by the proportion of value added in the tertiary industry as a percentage of the secondary industry.
All data are obtained from the China Statistical Yearbook or the National Bureau of Statistics website. All variables are logged to avoid heteroscedasticity in the data.

4.3. Descriptive Statistics

Descriptive statistics for the variables are shown in Table 2.

5. Empirical Results Examination

5.1. Baseline Regression

Table 3 presents the baseline regression results. Column (1) displays the findings without accounting for control variables, while columns (2) to (6) progressively add control variables one by one. The results in column (7) reflect the regression analysis after considering all control variables. Time and regional fixed effects are accounted for in both models. The regression analysis indicates that the regression coefficient of PEC is always positive and has passed the 1% significance level test. The coefficient of PEC indicates that a 1% increase in PEC corresponds to a 0.261% increase in RGC, thereby supporting the validity of Hypothesis 1.
All control variables except EDU exceeded the significance threshold. The results show that increases in residents’ income level, government intervention, logistics efficiency, and industrial structure upgrading significantly improve RGC. URB, however, has a negative effect on RGC, which could be due to the large amount of environmental pollution generated during the urbanization process. In the dilemma between economic growth and environmental protection, consumers may still prioritize economic benefits, leading to a lower rate of green product consumption.

5.2. Mechanism Analysis

As derived from the theoretical analysis above, PEC directly affects RGC, shapes government environmental policies through adequate supervision, and promotes technological innovation through a “money voting” mechanism. Therefore, this study draws on Baron and Kenny’s methodology [62] to establish models (7) and (8) to explore the mediating effects of GTI and ER.
M i t = α + β 2 P E C i t + γ X i t + μ i + η t + ε i t
R G C i t = α + β 3 P E C i t + β 4 M i t + γ X i t + μ i + η t + ε i t
In Equation (7), Mit denotes the mechanism variables—GTI and ER. The assessment of green technological innovation (GTI) is based on the number of green patent grants, drawing on the method proposed by Cheng et al. [63] and Zhang et al. [64]. Existing studies generally classify ER into two types: command-and-control (CER) and market-based incentive (MER) environmental regulation [65]. Different types of environmental regulation may exert varying impacts on RGC. CER primarily involves government intervention in corporate production through policy directives that restrict pollutant emissions. In contrast, MER provides economic incentives for environmentally responsible firms or imposes penalties on those that damage the environment [66]. Accordingly, this study draws on the classification framework proposed by Guo and Yuan [67], as well as Pan et al. [68], and measures CER using the ratio of investment in industrial pollution control to industrial value added. Following Liu et al., MER is measured by the ratio of pollution charges to industrial value added [65].
Table 4 presents the mechanism effect analysis of PEC on RGC. Column (1) displays the regression outcomes for GTI as a mechanism. The significant positive coefficient suggests that PEC significantly promotes GTI in regions. In column (2), the positive and statistically significant coefficient of GTI shows that it effectively improves RGC, confirming the existence of a mechanism effect for GTI, thereby validating Hypothesis 3.
Columns (3) and (4) present the mechanism analysis results for CER. Although the coefficient of CER is positive, it is not statistically significant, indicating that the mediating effect is not evident. Column (5) reports the results for MER, where the coefficient is significantly positive, indicating that PEC has a substantial impact on the level of ER. In column (6), the coefficient of MER remains significantly positive, indicating that MER effectively promotes RGC, thereby confirming the existence of a mediating effect for this type of regulation. When the government adopts CER, the effect of PEC on RGC is direct, suggesting that Hypothesis 2 does not hold in this context. However, when the government implements MER, PEC promotes RGE by improving the level of ER, supporting Hypothesis 2. This could be because, from a policy perspective, government policies are mainly formulated in a “top-down” manner, where public opinions are not fully incorporated. Thus, despite growing public awareness and demand for residents’ green products, such grassroots pressure has yet to translate into practical policy support. In contrast, MER, by introducing economic incentives or penalties, directly influences firms’ production and pollution behaviors. Driven by profit motives, firms are more likely to engage in technological innovation or product upgrading, thereby expanding the availability of green consumption options for residents.

5.3. Robustness Tests

5.3.1. Changing Sample Period

Drawing on the research of Lu et al. [69] and Chen et al. [70], while considering the impacts of the COVID-19 pandemic, which not only shifts public attention from environmental pollution but also alters consumption patterns, this study attempts to exclude samples from 2020 to 2022 and re-estimate the regression. Table 5, column (1) demonstrates that the role of PEC on RGC remains positive and is significant at the 1% threshold, confirming the robustness of the baseline regression findings.

5.3.2. Lagging Independent Variables

To account for potential lag effects, the study introduces a one-period lag for PEC and examines its impact on the subsequent period’s green consumption [19]. Table 5, column (2), demonstrates that the positive impact of PEC remains significant, providing further evidence for the robustness of previous conclusions.

5.3.3. Substituting the Independent Variable

Referencing the works of Wu et al. [40] and Guo et al. [33], in this study, the Baidu index for the keyword “haze” is used as the selected indicator (PEC2) to replace the explanatory variable with the “environmental pollution” total search index. Table 5, column (3), demonstrates that the effect of PEC on RGC is both positive and statistically significant.
The robustness tests suggest that the conclusion that PEC increases RGC is stable across different specifications.

5.4. Endogeneity Test

Considering that RGC may be influenced by the previous year’s RGC, which could lead to endogeneity issues and cause bias in the regression results, this research utilizes the methodology of Du et al. [8] and Wei et al. [71] by using the system GMM model to re-examine the baseline model. As shown in Table 6, column (1), the regression findings are displayed. The influence of PEC on RGC is significantly positive, with AR(1) < 0.05, AR(2) > 0.05, and Hansen Test > 0.05, passing the Arellano–Bond serial correlation test and the Hansen test.
Given that GMM estimation may still suffer from omitted variables or unobserved confounders that lead to biased results, this study further adds two control variables—economic development level (measured by GDP per capita) and the degree of openness (measured by the ratio of total imports and exports to GDP)—to the model. Additionally, interaction terms between individual and time-fixed effects are included for further robustness testing. As shown in column (2) of Table 6, the coefficient of PEC on RGC remains significantly positive.
In daily life, residents with a stronger preference for green consumption may also be more inclined to pay attention to environmental issues, which could lead to reverse causality and thus raise endogeneity concerns. To address this, following Wei et al. [71] and Lin et al. [72], this study adopts a two-stage instrumental variable (IV) approach. Environmental infrastructure investment is used as an instrumental variable. On the one hand, such investment reflects the regional intensity of environmental construction and public awareness campaigns, which can influence PEC. On the other hand, it does not directly affect individual consumption behavior, thereby satisfying both the relevance and homogeneity conditions for a valid instrument.
Columns (3) and (4) of Table 6 present the IV regression results. The first stage regression shows a significantly positive relationship between environmental infrastructure investment and PEC, indicating strong instrument relevance. In the second stage, the coefficient of PEC remains significantly positive, confirming its positive effect on RGC. Furthermore, diagnostic tests suggest that the instrumental variable is neither under-identified nor over-identified, confirming its validity.
To summarize, the endogeneity concern is addressed, and the baseline model’s regression results demonstrate robustness.

5.5. Heterogeneity Analysis

5.5.1. Regional Heterogeneity

China is extensive in territory, with regional development imbalances and pronounced differences in resource endowments and industrial structures across regions. Therefore, this study follows common regional classification standards, partitioning the 30 provincial-level areas into eastern and central–western regions. Table 7, columns (1) and (2), displays the regression results for the grouped regions. The coefficients for PEC are positive in both regions and satisfy the statistical significance criterion. However, PEC has a weaker impact on RGC in the eastern region than in the central–western regions. Several factors may explain this result. First, in contrast to the central and western regions, the eastern region has already established a normalized tripartite environmental governance system involving government, enterprises, and the public. For instance, in 2024, Shenzhen launched an ecological and environmental regulation platform based on big data, enabling broad public participation in environmental oversight. In comparison, PEC in the central–western regions tends to exert greater pressure on local governments and enterprises. Second, the central–western regions lag behind the eastern region in terms of economic development. These areas are currently undergoing rapid industrial growth and remain major destinations for relocating pollution-intensive industries from the east, thereby facing increased environmental pressure. As household income levels rise in these regions, public concern for environmental issues is expected to increase, stimulating greater demand for green products and significantly promoting green consumption. Finally, the Chinese government has recently intensified environmental investment in the central–western regions. For example, in 2021, an ecological compensation mechanism was implemented for the Yellow River Basin, and in 2022, Chongqing was approved as the first province-wide pilot zone for green finance reform and innovation. These policy efforts have created a favorable environment for GTI and are expected to contribute to the improvement of RGC in these regions, which could be attributed to the lower economic development level in the latter. Furthermore, the central–western regions still bear a large portion of the pollution-intensive industries transferred from the eastern region and are experiencing rapid economic growth. As residents’ income levels rise, PEC in the central–western regions will steadily increase, and demand for green products will show a sharp upward trend.

5.5.2. Pollution Emission Heterogeneity

Given increasing concerns about air quality due to haze and global climate change, the study categorizes the sample into groups based on high and low pollution emissions according to per capita sulfur dioxide emissions. As shown in Table 7, columns (3) and (4), PEC has a more significant effect on RGC in the high pollution group, as consumers in more polluted areas have a heightened awareness of environmental issues and demand for green products.

5.5.3. Innovation Foundation Heterogeneity

As the leading providers of green products, enterprises may increase R&D investment based on consumer preferences for environmentally friendly products. This study quantifies the innovation foundation using the ratio of invention patents granted to total patents [73]. The sample is sorted into groups according to high and low innovation foundations. As indicated in Table 7, columns (5) and (6), regions with higher innovation foundations experience a more pronounced effect from PEC, where enterprises are better equipped to meet the growing demand for green products.

6. Discussion

This study aims to explore the pathways through which PEC affects RGC. In recent years, as environmental pollution has intensified, countries around the world have placed increasing emphasis on environmental protection. Public awareness of environmental issues has also risen, accompanied by a growing desire to express environmental concerns. As a result, PEC has become one of the key mechanisms in global environmental governance [74]. Existing studies have primarily focused on the influence of PEC on environmental pollution [15,19,59] and corporate technological innovation [21,72]. However, relatively few have examined this issue from the perspective of individual residents, particularly in terms of how PEC affects RGC. Therefore, this study aims to explore the mechanisms by which PEC affects RGC. Specifically, it employs baseline regression and mediation effect models to analyze both the direct and indirect effects of PEC on RGC.
The results reveal that PEC not only has a significant direct positive effect on RGC but also exerts an indirect effect by promoting GTI. These findings are consistent with those of Wang et al. [75] and Feng et al. [76]. However, the mechanisms through which environmental regulation exerts its effects remain a subject of debate. While most existing studies suggest that PEC can indirectly reduce environmental pollution by strengthening ER [43,77], the heterogeneous nature of environmental regulatory tools complicates this relationship. Specifically, the effectiveness of regulation varies significantly depending on the type of policy instrument employed [67]. Current literature typically categorizes environmental regulation into three types: command-and-control, market-based incentives, and voluntary approaches. For example, Ren et al. found that, in eastern China, MER and voluntary environmental regulations significantly improve ecological efficiency. In central regions, both CER and MER are more effective, whereas in western regions, CER plays a dominant role in promoting ecological efficiency [66]. Since PEC is often regarded as a form of voluntary environmental regulation, this study further distinguishes between CER and MER in the analysis of mediation effects. The results suggest that MER has a more pronounced mediating role compared to CER, aligning with the conclusions of Guo and Yuan [67].
In the heterogeneity analysis, the effect of PEC on RGC is found to be more significant in central and western regions of China. Although some existing studies suggest that residents in economically developed eastern regions exhibit stronger environmental awareness and more effectively suppress pollution through PEC [77], few studies have directly examined its impact on RGC. The results of this study provide empirical support for the findings of Zhang and Zheng [78] and Li et al. [31]. In addition, this study finds that the impact of PEC on RGC is more pronounced in regions with higher levels of pollution emissions, which is consistent with the findings of Li et al. [79] and Yang et al. [80].

7. Conclusion and Recommendations

7.1. Research Conclusion

This study constructs an RGC indicator system from three subsystems: green manufacturing processes, sustainable lifestyles, and environmental ecosystems. It empirically investigates the influence of PEC on RGC across 30 provinces and cities in China. Further, this study investigates the mechanisms and the heterogeneity of the effect. The principal findings are summarized as follows. First, PEC effectively enhances RGC, and this conclusion is robust and reliable. Second, GTI and MER mediate the relationship between PEC and RGC, while the mediating effect of CER is insignificant. Third, considering the heterogeneity of regions, pollution emissions, and innovation foundation, PEC exerts a stronger influence on RGC across the central–western areas, areas with higher pollution emissions, and regions with better innovation infrastructure.

7.2. Policy Implications

Differentiated goals for green consumption transformation should be created depending on local conditions to advance China’s transition to green consumption and encourage sustainable and high-quality economic development. The following recommendations are put forward:
(1) Strengthen environmental protection outreach and increase public awareness of environmental issues. The government should effectively perform its environmental supervision duties, using a variety of social media channels to promote low-carbon living, continually enhancing residents’ environmental awareness, and incentivizing consumers to buy eco-friendly products. Relevant departments can also expand channels and means for public participation in environmental supervision, raising awareness of environmental issues among the public and boosting participation in governance.
(2) Strengthen GTI and actively promote corporate green transformation. The government can enact policies, including financial assistance and tax incentives, to reduce research and development costs for enterprises, encouraging them to prioritize investments in green product development and enhance innovation collaborations in enterprises. Thus, a virtuous cycle of “policy support–technological breakthroughs–industrial upgrading” will be formed. Given that PEC has a more significant positive effect on RGC in regions with high pollution emissions, the government should increase green technology subsidies in these areas. Such measures would not only yield higher marginal benefits in pollution reduction but also promote the transformation and upgrading of local enterprises. In the long run, this approach would contribute to environmental equity and foster coordinated regional development.
(3) Coordinate regional green transformation and develop differentiated industrial upgrading paths. Traditional industries can be guided to optimize and transform for the less economically developed central–western regions and areas with high pollution emissions. New economic growth poles can be cultivated in these regions. This will optimize the industrial structure while improving residents’ ecological and environmental quality. A “win–win” outcome combining economic prosperity with environmental sustainability can be created by advancing economic and environmental development.

7.3. Limitations and Future Research Directions

Finally, by comparing the findings of this study with existing literature, two limitations can be identified. First, the construction of the indicator system for RGC in this study relies on the entropy weight method, which is an objective weighting approach. However, this method does not capture consumers’ subjective preferences. Future research could incorporate survey data to reflect consumer attitudes better and thus address the limitations of relying solely on objective indicators. Second, this study focuses on 30 provinces in China, yet the impact of PEC on RGC is a globally relevant issue. Future studies may consider adopting a global perspective to explore regional differences in this relationship.

Author Contributions

Conceptualization, J.Z. and Y.L.; methodology, Y.L.; validation, T.W. and W.J.; formal analysis, J.Z.; investigation, T.W.; resources, W.J.; data curation, J.Z.; writing—original draft preparation, J.Z.; writing—review and editing, Y.L.; visualization, J.Z.; supervision, Y.L.; project administration, Y.L.; funding acquisition, J.Z. and Y.L. All authors have read and agreed to the published version of the manuscript.

Funding

This research was funded by the Jiangsu College Philosophy and Social Science Research Project (2022SJYB2281) and National Social Science Post Foundation of China (Grant number: 23FGLB024).

Institutional Review Board Statement

Not applicable.

Informed Consent Statement

Not applicable.

Data Availability Statement

Data used in this manuscript are provided by government agencies and the Baidu Index.

Conflicts of Interest

The authors declare no conflicts of interest.

References

  1. Yu, X.; Wang, P. Economic Effects Analysis of Environmental Regulation Policy in the Process of Industrial Structure Upgrading: Evidence from Chinese Provincial Panel Data. Sci. Total Environ. 2021, 753, 142004. [Google Scholar] [CrossRef] [PubMed]
  2. Song, Y.; Zhang, X.; Zhang, M. The Influence of Environmental Regulation on Industrial Structure Upgrading: Based on the Strategic Interaction Behavior of Environmental Regulation among Local Governments. Technol. Forecast. Soc. Chang. 2021, 170, 120930. [Google Scholar] [CrossRef]
  3. Xie, C.; Wang, R.; Gong, X. The Influence of Environmental Cognition on Green Consumption Behavior. Front. Psychol. 2022, 13, 988585. [Google Scholar] [CrossRef] [PubMed]
  4. Wang, D.; Yu, Z.; Liu, H.; Cai, X.; Zhang, Z. Green Consumption, Environmental Regulation and Carbon Emissions—An Empirical Study Based on a PVAR Model. Sustainability 2024, 16, 1024. [Google Scholar] [CrossRef]
  5. Elkington, J.; Hailes, J. The Green Consumer Guide: From Shampoo to Champagne—Highstreet Shopping for a Better Environment; Gollancz: London, UK, 1988. [Google Scholar]
  6. Yan, L.; Keh, H.T.; Chen, J. Assimilating and Differentiating: The Curvilinear Effect of Social Class on Green Consumption. J. Consum. Res. 2021, 47, 914–936. [Google Scholar] [CrossRef]
  7. Xi, J. The Governance of China, Volume I; Foreign Languages Press: Beijing, China, 2014; p. 101. [Google Scholar]
  8. Du, W.; Li, M.; Fan, Y.; Liang, S. Can Public Environmental Concern Inhibit the Market Entry of Polluting Firms: Micro Evidence from China. Ecol. Indic. 2023, 154, 110528. [Google Scholar] [CrossRef]
  9. Zhang, Y.; Wang, J.; Xue, Y.; Yang, J. Impact of Environmental Regulations on Green Technological Innovative Behavior: An Empirical Study in China. J. Clean. Prod. 2018, 188, 763–773. [Google Scholar] [CrossRef]
  10. Environmental Protection Law of the People’s Republic of China (2015 Revision). National People’s Congress. Available online: https://www.mee.gov.cn/ywgz/fgbz/fl/201404/t20140425_271040.shtml (accessed on 28 May 2025).
  11. General Office of the CPC Central Committee; General Office of the State Council. Guiding Opinions on Building a Modern Environmental Governance System. Available online: https://www.gov.cn/zhengce/2020-03/03/content_5486380.htm (accessed on 30 May 2025).
  12. Chen, J.; Pan, J.; Xu, Y. Sources of Authoritarian Responsiveness: A Field Experiment in China. Am. J. Political Sci. 2016, 60, 383–400. [Google Scholar] [CrossRef]
  13. Guo, Q.; Hong, J.; Rong, J.; Ma, H.; Lv, M.; Wu, M. Impact of Environmental Regulations on High-Quality Development of Energy: From the Perspective of Provincial Differences. Sustainability 2022, 14, 11712. [Google Scholar] [CrossRef]
  14. Wang, S.; Lin, W.; Zhang, Z.; Wang, H.; Liu, X.; Liu, B. Does the Environment Information Announcement Promote Green Innovation? A Quasi-Natural Experimental Evidence from the City-Level of China. Ecol. Indic. 2022, 136, 108720. [Google Scholar] [CrossRef]
  15. Li, W.; Yang, G.; Li, X. Correlation between PM2.5 Pollution and Its Public Concern in China: Evidence from Baidu Index. J. Clean. Prod. 2021, 293, 126091. [Google Scholar] [CrossRef]
  16. Huang, Y.; Zhu, S. Public Environmental Concerns, Environmental Regulations and Energy-Intensive Industrial Dynamics in China. J. Nat. Resour. 2020, 35, 2744. [Google Scholar] [CrossRef]
  17. Liu, X.; Ji, X.; Zhang, D.; Yang, J.; Wang, Y. How Public Environmental Concern Affects the Sustainable Development of Chinese Cities: An Empirical Study Using Extended DEA Models. J. Environ. Manag. 2019, 251, 109619. [Google Scholar] [CrossRef]
  18. Long, F.; Liu, J.; Zheng, L. The Effects of Public Environmental Concern on Urban-Rural Environmental Inequality: Evidence from Chinese Industrial Enterprises. Sustain. Cities Soc. 2022, 80, 103787. [Google Scholar] [CrossRef]
  19. Wang, Y.; Zhao, Z.; Shi, M.; Liu, J.; Tan, Z. Public Environmental Concern, Government Environmental Regulation and Urban Carbon Emission Reduction—Analyzing the Regulating Role of Green Finance and Industrial Agglomeration. Sci. Total Environ. 2024, 924, 171549. [Google Scholar] [CrossRef]
  20. Gu, Y.; Ho, K.C.; Yan, C.; Gozgor, G. Public Environmental Concern, CEO Turnover, and Green Investment: Evidence from a Quasi-Natural Experiment in China. Energy Econ. 2021, 100, 105379. [Google Scholar] [CrossRef]
  21. Li, Y.; Wang, Z. Will Public Environmental Concerns Foster Green Innovation in China’s Automotive Industry? An Empirical Study Based on Multi-Sourced Data Streams. Front. Energy Res. 2021, 9, 623638. [Google Scholar] [CrossRef]
  22. Liu, C.; Tang, C.; Liu, Z.; Huang, Y. How Does Public Environmental Supervision Affect the Industrial Structure Optimization? Environ. Sci. Pollut. Res. 2023, 30, 1485–1501. [Google Scholar] [CrossRef]
  23. Emekci, S. Green Consumption Behaviours of Consumers within the Scope of TPB. J. Consum. Mark. 2019, 36, 410–417. [Google Scholar] [CrossRef]
  24. Paul, J.; Modi, A.; Patel, J. Predicting Green Product Consumption Using Theory of Planned Behavior and Reasoned Action. J. Retail. Consum. Serv. 2016, 29, 123–134. [Google Scholar] [CrossRef]
  25. Zhang, M.; Guo, S.; Bai, C.; Wang, W. Study on the Impact of Haze Pollution on Residents’ Green Consumption Behavior: The Case of Shandong Province. J. Clean. Prod. 2019, 219, 11–19. [Google Scholar] [CrossRef]
  26. Lucas, S.; Salladarré, F.; Brécard, D. Green Consumption and Peer Effects: Does It Work for Seafood Products? Food Policy 2018, 76, 44–55. [Google Scholar] [CrossRef]
  27. Sun, Y.; Liu, N.; Zhao, M. Factors and Mechanisms Affecting Green Consumption in China: A Multilevel Analysis. J. Clean. Prod. 2019, 209, 481–493. [Google Scholar] [CrossRef]
  28. Akehurst, G.; Afonso, C.; Martins Gonçalves, H. Re-examining Green Purchase Behaviour and the Green Consumer Profile: New Evidences. Manag. Decis. 2012, 50, 972–988. [Google Scholar] [CrossRef]
  29. Hua, K.; Pang, X. Investigation into the Factors Affecting the Green Consumption Behavior of China Rural Residents in the Context of Dual Carbon. Sustainability 2024, 16, 5797. [Google Scholar] [CrossRef]
  30. Li, J. Public Participation in China: The Case for Environmental Enforcement. J. Chin. Gov. 2022, 7, 159–179. [Google Scholar] [CrossRef]
  31. Li, C.; Sun, Q.; Ma, X. Promotion or Inhibition? Understanding the Impact of Public Environmental Concerns on Energy Transition in China. Energy 2024, 313, 133768. [Google Scholar] [CrossRef]
  32. Buntaine, M.T.; Greenstone, M.; He, G.; Liu, M.; Wang, S.; Zhang, B. Does the Squeaky Wheel Get More Grease? The Direct and Indirect Effects of Citizen Participation on Environmental Governance in China. Am. Econ. Rev. 2024, 114, 815–850. [Google Scholar] [CrossRef]
  33. Guo, M.; Kuai, Y.; Liu, X. Stock Market Response to Environmental Policies: Evidence from Heavily Polluting Firms in China. Econ. Model. 2020, 86, 306–316. [Google Scholar] [CrossRef]
  34. Zheng, Q.; Wan, L.; Wang, S.; Chen, Z.; Li, J.; Wu, J.; Song, M. Will Informal Environmental Regulation Induce Residents to Form a Green Lifestyle? Evidence from China. Energy Econ. 2023, 125, 106835. [Google Scholar] [CrossRef]
  35. Tong, Q.; Anders, S.; Zhang, J.; Zhang, L. The Roles of Pollution Concerns and Environmental Knowledge in Making Green Food Choices: Evidence from Chinese Consumers. Food Res. Int. 2020, 130, 108881. [Google Scholar] [CrossRef] [PubMed]
  36. Gordon, W. Brand Green: Mainstream or Forever Niche? Green Alliance: London, UK, 2002. [Google Scholar]
  37. Ajzen, I. The Theory of Planned Behavior. Organ. Behav. Hum. Decis. Process. 1991, 50, 179–211. [Google Scholar] [CrossRef]
  38. Xu, Y.; Du, J.; Khan, M.A.S.; Jin, S.; Altaf, M.; Anwar, F.; Sharif, I. Effects of Subjective Norms and Environmental Mechanism on Green Purchase Behavior: An Extended Model of Theory of Planned Behavior. Front. Environ. Sci. 2022, 10, 779629. [Google Scholar] [CrossRef]
  39. Qu, W.; Qu, G.; Zhang, X.; Robert, D. The Impact of Public Participation in Environmental Behavior on Haze Pollution and Public Health in China. Econ. Model. 2021, 98, 319–335. [Google Scholar] [CrossRef]
  40. Wu, L.B.; Yang, M.M.; Sun, K.G. Impact of Public Environmental Attention on Environmental Governance of Enterprises and Local Governments. China Popul. Resour. Environ. 2022, 32, 1–14. [Google Scholar]
  41. Anderson, B.; Böhmelt, T.; Ward, H. Public Opinion and Environmental Policy Output: A Cross-National Analysis of Energy Policies in Europe. Environ. Res. Lett. 2017, 12, 114011. [Google Scholar] [CrossRef]
  42. Moore, M.H. Creating Public Value: Strategic Management in Government; Harvard University Press: Cambridge, MA, USA, 1995. [Google Scholar]
  43. Ma, P.; Song, Y.; Zhang, M. Mediating and Spatial Spillover Effects of Public Participation in Environmental Pollution Governance Mediated via Traditional and New Media. J. Environ. Manag. 2023, 342, 118046. [Google Scholar] [CrossRef]
  44. Porter, M.E.; van der Linde, C. Toward a New Conception of the Environment-Competitiveness Relationship. J. Econ. Perspect. 1995, 9, 97–118. [Google Scholar] [CrossRef]
  45. Li, Z.; Huang, Z.; Su, Y. New Media Environment, Environmental Regulation and Corporate Green Technology Innovation: Evidence from China. Energy Econ. 2023, 119, 106545. [Google Scholar] [CrossRef]
  46. Chen, Y.; Yao, Z.; Zhong, K. Do Environmental Regulations of Carbon Emissions and Air Pollution Foster Green Technology Innovation: Evidence from China’s Prefecture-Level Cities. J. Clean. Prod. 2022, 350, 131537. [Google Scholar] [CrossRef]
  47. El Ouadghiri, I.; Guesmi, K.; Peillex, J.; Ziegler, A. Public Attention to Environmental Issues and Stock Market Returns. Ecol. Econ. 2021, 180, 106836. [Google Scholar] [CrossRef]
  48. Gu, Y.; Ho, K.-C.; Xia, S.; Yan, C. Do Public Environmental Concerns Promote New Energy Enterprises’ Development? Evidence from a Quasi-Natural Experiment. Energy Econ. 2022, 109, 105967. [Google Scholar] [CrossRef]
  49. Neu, D.; Saxton, G.D.; Rahaman, A.S. Correction: Social Accountability, Ethics, and the Occupy Wall Street Protests. J. Bus. Ethics 2022, 180, 33. [Google Scholar] [CrossRef]
  50. Li, C.; Ma, X.; Fu, T.; Guan, S. Does Public Concern over Haze Pollution Matter? Evidence from Beijing-Tianjin-Hebei Region, China. Sci. Total Environ. 2021, 755, 142397. [Google Scholar] [CrossRef]
  51. Peng, J.; Li, K.; Gao, Y. How the Internet Affects China’s Green Consumption Development: Empirical Research Based on Baidu Index Data. Sustainability 2023, 15, 50. [Google Scholar] [CrossRef]
  52. Shen, Y.; Fu, Y.; Song, M. Coupling Relationship between Green Production and Green Consumption: Case of the Yangtze River Delta Area. Nat. Resour. Model. 2020, 33, e12239. [Google Scholar] [CrossRef]
  53. Yao, Z.Q.; Xia, J.C. Green Financial Policies and Green Consumption Development—Based on Green Financial Reform and Innovation Pilot Zones and Composite Control Method. China Bus. Mark. 2023, 8, 101–115. [Google Scholar]
  54. Suining Development and Reform Commission. Promoting Green Development through Green Consumption: Suining’s Green Consumption Evaluation Index System Passed the Review. Available online: https://sfzggw.suining.gov.cn/xinwen/show/202af0b9f0fe4c2fa188977e17381cc0.html (accessed on 27 May 2025).
  55. Zhang, G.; Deng, N.; Mou, H.; Zhang, Z.G.; Chen, X. The Impact of the Policy and Behavior of Public Participation on Environmental Governance Performance: Empirical Analysis Based on Provincial Panel Data in China. Energy Policy 2019, 129, 1347–1354. [Google Scholar] [CrossRef]
  56. Dong, Y.; Ishikawa, M.; Liu, X.; Hamori, S. The Determinants of Citizen Complaints on Environmental Pollution: An Empirical Study from China. J. Clean. Prod. 2011, 19, 1306–1314. [Google Scholar] [CrossRef]
  57. Long, Y.; Liu, L.; Yang, B. Different Types of Environmental Concerns and Heterogeneous Influence on Green Total Factor Productivity: Evidence from Chinese Provincial Data. J. Clean. Prod. 2023, 428, 139295. [Google Scholar] [CrossRef]
  58. Ren, X.; Ren, Y. Public Environmental Concern and Corporate ESG Performance. Financ. Res. Lett. 2024, 61, 104991. [Google Scholar] [CrossRef]
  59. Yang, J.; Yin, W.; Jin, Y. Analyzing Public Environmental Concerns at the Threshold to Reduce Urban Air Pollution. Sustainability 2023, 15, 15420. [Google Scholar] [CrossRef]
  60. Liu, N.; Liu, Y.; Yu, X. The Impact of Public Environmental Concern on Environmental Pollution: The Moderating Effect of Government Environmental Regulation. PLoS ONE 2023, 18, e0290255. [Google Scholar] [CrossRef]
  61. Zhao, Y.; Wang, J.; Pan, W. Regional Characteristics and Impact Mechanisms of New Urbanization and Green Development Level in China at the Provincial Level. Econ. Geogr. 2023, 43, 1–9. [Google Scholar]
  62. Baron, R.M.; Kenny, D.A. The Moderator–Mediator Variable Distinction in Social Psychological Research: Conceptual, Strategic, and Statistical Considerations. J. Pers. Soc. Psychol. 1986, 51, 1173–1182. [Google Scholar] [CrossRef]
  63. Cheng, P.; Wang, X.; Choi, B.; Huan, X. Green Finance, International Technology Spillover and Green Technology Innovation: A New Perspective of Regional Innovation Capability. Sustainability 2023, 15, 1112. [Google Scholar] [CrossRef]
  64. Zhang, W.; Zhang, S.; Chen, F.; Wang, Y.; Zhang, Y. Does Chinese Companies’ OFDI Enhance Their Own Green Technology Innovation? Financ. Res. Lett. 2023, 56, 104113. [Google Scholar] [CrossRef]
  65. Liu, L.; Jiang, J.; Bian, J.; Liu, Y.; Lin, G.; Yin, Y. Are Environmental Regulations Holding Back Industrial Growth? Evidence from China. J. Clean. Prod. 2021, 306, 127007. [Google Scholar] [CrossRef]
  66. Ren, S.; Li, X.; Yuan, B.; Li, D.; Chen, X. The Effects of Three Types of Environmental Regulation on Eco-Efficiency: A Cross-Region Analysis in China. J. Clean. Prod. 2018, 173, 245–255. [Google Scholar] [CrossRef]
  67. Guo, R.; Yuan, Y. Different Types of Environmental Regulations and Heterogeneous Influence on Energy Efficiency in the Industrial Sector: Evidence from Chinese Provincial Data. Energy Policy 2020, 145, 111747. [Google Scholar] [CrossRef]
  68. Pan, X.; Ai, B.; Li, C.; Pan, X.; Yan, Y. Dynamic Relationship among Environmental Regulation, Technological Innovation and Energy Efficiency Based on Large Scale Provincial Panel Data in China. Technol. Forecast. Soc. Chang. 2019, 144, 428–435. [Google Scholar] [CrossRef]
  69. Lu, H.; Hunt, A.; Morley, B. The Impact of Heterogeneous Environmental Regulation Tools on Economic Growth: Can Environmental Protection and Economic Growth Be Win-Win? Sustainability 2024, 16, 5585. [Google Scholar] [CrossRef]
  70. Chen, J.; Wu, L.; Hao, L.; Yu, X.; Streimikiene, D. Does the Import of Green Products Encourage Green Technology Innovation? Empirical Evidence from China. Technol. Forecast. Soc. Chang. 2024, 200, 123137. [Google Scholar] [CrossRef]
  71. Wei, J.; Wen, J.; Wang, X.-Y.; Ma, J.; Chang, C.-P. Green Innovation, Natural Extreme Events, and Energy Transition: Evidence from Asia-Pacific Economies. Energy Econ. 2023, 121, 106638. [Google Scholar] [CrossRef]
  72. Lin, B.; Li, B.; Zhang, D. ESG Implementation, Public Environmental Concern, and Corporate Green Technology Innovation: Analysis Based on the Background of China’s “Dual Carbon” Targets. Environ. Dev. Sustain. 2024, 1–38. [Google Scholar] [CrossRef]
  73. Ji, X.Y.; Gu, N.H. Does the Establishment of Intellectual Property Model Cities Affect Innovation Quality? J. Financ. Econ. 2021, 47, 49–63. [Google Scholar]
  74. Blundell, W.; Gowrisankaran, G.; Langer, A. Escalation of Scrutiny: The Gains from Dynamic Enforcement of Environmental Regulations. Am. Econ. Rev. 2020, 110, 2558–2585. [Google Scholar] [CrossRef]
  75. Wang, X.; Wu, S.; Qin, X.; La, M.; Zuo, H. Informal Environment Regulation, Green Technology Innovation and Air Pollution: Quasi-Natural Experiments from Prefectural Cities in China. Sustainability 2022, 14, 6333. [Google Scholar] [CrossRef]
  76. Feng, Q.; Teo, T.S.H.; Sun, T. Effects of Official and Unofficial Environmental Regulations on Environmental Quality: Evidence from the Yangtze River Economic Belt, China. Environ. Res. 2023, 226, 115667. [Google Scholar] [CrossRef]
  77. Yu, C.; Long, H.; Zhang, X.; Tan, Y.; Zhou, Y.; Zang, C.; Tu, C. The Interaction Effect between Public Environmental Concern and Air Pollution: Evidence from China. J. Clean. Prod. 2023, 391, 136231. [Google Scholar] [CrossRef]
  78. Zhang, J.; Zheng, T. Can Dual Pilot Policy of Innovative City and Low Carbon City Promote Green Lifestyle Transformation of Residents? J. Clean. Prod. 2023, 405, 136711. [Google Scholar] [CrossRef]
  79. Li, X.; Hu, Z.; Cao, J.; Xu, X. The Impact of Environmental Accountability on Air Pollution: A Public Attention Perspective. Energy Policy 2022, 161, 112733. [Google Scholar] [CrossRef]
  80. Yang, L.; Wu, S.; Li, G.; Yuan, Y. Explore Public Concerns about Environmental Protection on Sina Weibo: Evidence from Text Mining. Environ. Sci. Pollut. Res. 2023, 30, 104067–104085. [Google Scholar] [CrossRef]
Figure 1. Daily total index of Baidu searches for “environmental pollution” nationwide.
Sustainability 17 05352 g001
Figure 2. Impact mechanism diagram.
Sustainability 17 05352 g002
Figure 3. Heat map of RGC. Note: Data visualization using Python 3.13.3.
Sustainability 17 05352 g003
Table 1. Residents’ green consumption (RGC) indicator system.
Primary
Indicator
Secondary IndicatorUnitIndicator
Attribute
Weight
Green
manufacturing processes
Fertilizer applied per unit of cultivated and irrigated landTons per hectare0.0993
Per capita solar water heater area in rural areasSquare meters per person+0.1286
Sulfur dioxide emissions relative to GDPTons per RMB 1 billion 0.0438
Energy consumption intensityTons of standard coal per RMB 10,000 0.0459
Sustainable lifestylesDaily energy consumption per personTons of standard coal per person0.0558
Per capita public bus and electric vehicle operationsVehicles per 10,000 people+0.1189
Per capita private car ownershipVehicles per person0.1154
Per capita daily water consumptionLiters0.0810
Environmental ecosystemsProportion of household waste subjected to harmless treatment%+0.0556
Per capita park green space areaSquare meters per person+0.0891
Urban green coverage rate%+0.1015
Percentage of GDP spent on energy saving and environmental protection%+0.0651
Table 2. Descriptive statistics.
VariableNMeansdMinMax
Dependent VariableRGC3903.1280.1642.7653.517
Core Independent VariablePEC3904.5770.4312.8785.372
Control VariablesURB390−0.5190.194−1.049−0.110
RES39010.090.4439.04311.35
GOV390−1.4340.384−2.254−0.277
EDU3908.5951.0896.00412.16
LE39012.220.7539.41015.04
IND3900.2280.386−0.6401.739
Table 3. Baseline regression results.
Variables(1)(2)(3)(4)(5)(6)(7)
PEC0.107 ***0.222 ***0.226 ***0.307 ***0.308 ***0.313 ***0.261 ***
(0.0210)(0.0764)(0.0779)(0.0697)(0.0697)(0.0696)(0.0668)
URB −1.176 ***−1.145 ***−1.311 ***−1.314 ***−1.313 ***−1.287 ***
(0.113)(0.150)(0.134)(0.134)(0.134)(0.128)
RES −0.06350.401 **0.458 **0.444 **0.454 **
(0.203)(0.187)(0.194)(0.193)(0.184)
GOV 0.473 ***0.484 ***0.479 ***0.350 ***
(0.0493)(0.0501)(0.0501)(0.0522)
EDU −0.0372−0.0404−0.0346
(0.0321)(0.0321)(0.0305)
LE 0.01690.0188 *
(0.0104)(0.00994)
IND 0.219 ***
(0.0360)
Constant2.915 ***0.773 **1.380−2.794−3.038 *−3.103 *−3.210 *
(0.0986)(0.357)(1.976)(1.811)(1.822)(1.818)(1.730)
Time FixedYESYESYESYESYESYESYES
Region FixedYESYESYESYESYESYESYES
N390390390390390390390
adj. R20.0860.4090.4090.5340.5360.5390.584
Note: ***, **, and * denote statistical significance at the 1%, 5%, and 10% levels, respectively. Robust standard errors are included in parenthesis.
Table 4. Mechanism analysis regression results.
Variables(1)(2)(3)(4)(5)(6)
GTIRGCCERRGCMERRGC
PEC0.203 *0.233 ***1.1330.258 ***0.711 ***0.259 ***
(0.108)(0.0811)(10.79)(0.0875)(0.3232)(0.0915)
GTI 0.139 ***
(0.0364)
CER 0.00224 ***
(0.000647)
MER 0.00226 ***
(0.00106)
Constant−30.96 ***1.020−557.6 ***−2.023−470.1 **−2.435
(2.364)(2.551)(160.2)(2.263)(199.4)(4.739)
ControlsYESYESYESYESYESYES
Time FixedYESYESYESYESYESYES
Region FixedYESYESYESYESYESYES
N390390390390390390
adj. R20.9940.8460.6780.8500.8140842
Note: ***, **, and * denote statistical significance at the 1%, 5%, and 10% levels, respectively. Robust standard errors are included in parenthesis.
Table 5. Robustness tests.
Variables(1)(2)(3)
Changing
Sample Period
Lagging Independent VariablesReplacing Independent Variable
L.RGC
PEC0.217 ***
(0.0597)
L.PEC 0.221 ***
(0.0619)
PEC2 0.0624 **
(0.0270)
Constant1.961−2.7451.252
(1.823)(1.666)(1.463)
ControlsYESYESYES
Time FixedYESYESYES
Region FixedYESYESYES
N300360390
adj. R20.2510.5910.239
AR(1)
AR(2)
Hansen Test
Note: ***, **, and * denote statistical significance at the 1%, 5%, and 10% levels, respectively. Robust standard errors are included in parenthesis.
Table 6. Endogeneity tests.
Variables(1) SYS-GMM(2) Add Control Variables(3) First Stage(4) Second Stage
RGCRGCPECRGC
L.RGC0.554 ***
(0.0403)
PEC0.228 **0.223 ** 0.7084 ***
(0.0933)(0.0914) (0.2488)
IV 0.0004 ***
(0.0001)
Constant−0.0403−2.536
(0.442)(4.696)
ControlsYESYESYESYES
Time FixedYESYESYESYES
Region FixedYESYESYESYES
N360390390390
adj. R2 0.844
AR (1)0.005
AR (2)0.645
Hansen Test0.716
Kleibergen–Paap LM 14.34
Kleibergen–Paap rk Wald F 16.23
Hansen J 0.000
Note: ***, **, and * denote statistical significance at the 1%, 5%, and 10% levels, respectively. Robust standard errors are included in parenthesis.
Table 7. Heterogeneity regression results.
VariablesRegionPollution EmissionInnovation Foundation
(1) Eastern(2) Central–Western(3) High(4) Low(5) High(6) Low
PEC0.141 **0.405 ***0.276 ***0.0680.331 ***0.258 ***
(0.066)(0.092)(0.104)(0.064)(0.120)(0.073)
Constant−9.692 ***−2.6964.118−3.746−2.8683.772
(2.060)(2.859)(3.743)(2.273)(2.325)(2.671)
ControlsYESYESYESYESYESYES
Time FixedYESYESYESYESYESYES
Region FixedYESYESYESYESYESYES
adj. R20.54200.67540.72610.51030.48580.7138
N143247195195195195
Note: ***, **, and * denote statistical significance at the 1%, 5%, and 10% levels, respectively. Robust standard errors are included in parenthesis.
Disclaimer/Publisher’s Note: The statements, opinions and data contained in all publications are solely those of the individual author(s) and contributor(s) and not of MDPI and/or the editor(s). MDPI and/or the editor(s) disclaim responsibility for any injury to people or property resulting from any ideas, methods, instructions or products referred to in the content.

