Article

Spatiotemporal Evolution of Carbon Emissions and Carbon Allowance Prices in China: Implications for Sustainable Low-Carbon Transition

School of Economics and Management, Northeast Electric Power University, Jilin 132012, China
*
Author to whom correspondence should be addressed.
Sustainability 2025, 17(12), 5341; https://doi.org/10.3390/su17125341 (registering DOI)
Submission received: 24 April 2025 / Revised: 1 June 2025 / Accepted: 6 June 2025 / Published: 10 June 2025

Abstract

:
Guided by China’s “Dual Carbon” targets, the construction of its carbon market advances steadily. As a key policy mechanism for promoting emissions reduction and sustainable development, the emissions trading system plays a vital role in the national green transition strategy. Nonetheless, significant regional disparities exist in carbon emissions, and carbon allowance prices are subject to considerable fluctuations. This study examines the spatiotemporal evolution of China’s carbon emissions, investigating their distribution patterns across different regions. Furthermore, it analyzes the spatiotemporal changes in carbon allowance prices, focusing on their fluctuation patterns and spatial distribution, particularly regional differences in carbon market prices. This study focuses on the interplay between carbon emissions and carbon allowance prices, conducting an in-depth investigation into their interaction mechanisms. Using Shanghai as a case study, we construct a Vector Autoregression (VAR) model to empirically assess the dynamic impact of carbon emissions on carbon prices and their associated feedback effects. Subsequently, we propose policy recommendations for optimizing carbon market operations. This study enhances carbon markets’ functionality as climate governance tools, providing empirical and theoretical foundations for advancing low-carbon transitions and Sustainable Development Goals (SDGs).

1. Introduction

Against the backdrop of intensifying global climate change, advancing green, low-carbon development has become an international consensus. The UN 2030 Agenda for Sustainable Development incorporates core objectives, including climate action, responsible consumption and production, and sustainable cities and communities. Nations worldwide are implementing measures to reduce carbon emissions and achieve sustainable development. China has proactively responded to global climate governance initiatives by establishing carbon peaking and carbon neutrality targets, accelerating the construction of a national carbon emissions trading market. This market mechanism optimizes resource allocation, facilitates low-carbon transitions, and fosters synergistic advancement of ecological conservation and high-quality economic growth.
As a critical policy instrument for emissions reduction, carbon emissions trading employs price signals to incentivize corporate decarbonization while balancing efficiency and equity in carbon neutrality pathways. However, significant regional disparities in China’s economic development levels, industrial structures, and energy endowments have resulted in spatially uneven carbon emissions and volatile allowance prices with suboptimal market efficiency. These challenges undermine carbon market fairness and effectiveness, impeding sustainable low-carbon transitions. Therefore, rigorous investigation into the spatiotemporal evolution of carbon emissions and allowance prices, along with their interaction mechanisms, carries substantial theoretical and policy significance. Such research will inform the design of scientifically grounded carbon market frameworks essential for advancing China’s and global climate governance objectives.
Recently, both domestic and international scholars have conducted extensive research on the volume of carbon emissions, carbon allowance prices, and their interrelations. Current studies primarily focus on the factors influencing carbon emissions, their spatio-temporal distribution characteristics, and forecasting models. Conversely, research regarding carbon allowance prices has concentrated on price fluctuation characteristics, influencing factors, and analyses of market efficiency. Although some studies have explored the impact of carbon markets on enterprise emission reduction behaviors, systematic research detailing their spatio-temporal interactive relationship remains insufficient. Thus, this study aims to deepen the analysis of the interaction mechanism between carbon emissions and the price of carbon allowances in order to further expand the depth and perspective of related research.
Given this context, the study aims to address the following questions:
(1)
What are the spatio-temporal evolution characteristics of carbon emissions in China? What spatial distribution patterns of carbon emissions exist across different regions?
(2)
What are the spatio-temporal evolution characteristics of carbon allowance prices in China? What are the fluctuation characteristics and influencing factors of carbon market prices in various regions?
(3)
How do carbon emissions and carbon allowance prices interact? How do changes in carbon emissions affect carbon prices, and how, in turn, do carbon prices influence carbon emission behaviors?
To address these questions, this research employs a literature analysis method that integrates both quantitative and qualitative approaches. It utilizes carbon emission data from 30 provinces in China from 2012 to 2021, alongside carbon allowance price data from eight carbon trading pilot regions collected between 2014 and 2023. Firstly, spatial statistical analysis methods are deployed to uncover the spatio-temporal distribution characteristics of carbon emissions and carbon allowance prices. Secondly, econometric techniques are utilized to investigate the interactive relationship between carbon emissions and carbon allowance prices, examining how changes in carbon emissions impact prices and how shifts in carbon prices feedback on carbon emissions. Finally, based on the research findings, recommendations for optimizing carbon market operations will be proposed.
The subsequent sections of this paper are organized as follows: Section 2 reviews relevant literature and highlights the contributions of this study. Section 3 outlines the research design, detailing the methodological approach used to investigate the spatio-temporal evolution of carbon emissions and carbon allowance price in China. Section 4 presents an empirical analysis. Section 5 discusses the implications of the findings and offers management policy recommendations. Section 6 concludes the paper.

2. Literature Review

In recent years, research on carbon emissions and carbon allowance prices has attracted considerable attention from scholars worldwide. Current studies examine various aspects, including different industries and regions, as well as the relationship between these two factors.

2.1. Research on Carbon Emissions

Research on carbon emissions focuses on the characteristics of carbon emissions in key industries and the disparities in carbon emissions across various administrative regions and economic zones.
At the industry level, Wang et al. employed a spatiotemporal geographically weighted regression model to analyze carbon emissions in China’s thermal power sector, revealing an increase in total carbon emissions and a decrease in carbon emission intensity per kilowatt-hour [1]. Li et al. concluded that the power sector accounts for the highest proportion of carbon emissions among all sectors, categorized into direct carbon emissions from electricity production and indirect carbon emissions from electricity consumption, and reviewed the current methods used to account for both types of emissions [2]. Xu and Feng developed an extended Kaya identity model, indicating that the power structure and economic scale significantly influence carbon emissions within the thermal power sector. The effects of coal consumption and power intensity in the central and western regions are major contributors to the rise in carbon emissions [3]. In the agricultural sector, Qin et al. conducted a spatially explicit analysis of energy and carbon dioxide (CO2) emissions resulting from surface and groundwater extraction on a global scale. They predicted that the implementation of efficient, low-carbon irrigation methods could potentially reduce global CO2 emissions by as much as 55% [4]. In the construction sector, Zhang et al. applied a center of gravity migration model to examine carbon emissions from both temporal and spatial perspectives in the western region, uncovering a significant upward trend and marked regional variations [5]. Ni et al. explored the sources of spatial variation and spatial agglomeration patterns of carbon emission efficiency in the construction industry and found that there was a trend of increasing and then decreasing, with the eastern region having the highest carbon emission efficiency, followed by the central and northeastern regions, and the western region being the lowest; the greatest intra-regional and inter-regional differences were between the eastern and western regions [6]. Zhou et al. explored the spatiotemporal patterns and influencing mechanisms of carbon emissions in the construction industry, identifying notable spatiotemporal polarization and agglomeration effects, with the output intensity and structural effects of fixed asset investment as key influencing factors [7]. In the transportation sector, Gong and Fu employed the standard deviation ellipse method and spatial association network analysis to reveal the spatiotemporal evolution of transportation carbon emissions in the western region, indicating a slow growth trend in emissions and an uneven regional distribution characterized by “high emissions in the north and south and low in the middle” [8]. Ding and Liu analyzed the temporal and spatial evolution mechanism of carbon emission efficiency in the logistics industry through the global Malmquist–Luenberger index and spatial autocorrelation model, and the results showed that the average carbon emission efficiency value of the logistics industry in China is very low, with a diminishing distribution of spatial gradient [9].
At the regional level, Zhang et al. constructed a spatial Durbin model and discovered that the carbon emission efficiency of the Yangtze River Economic Belt is generally insufficient, exhibiting significant aggregation. Additionally, the spatial spillover effects of economic development level, industrial structure, and green technological innovation on efficiency are considerable [10]. In the western region, Yang et al. analyzed carbon emissions in Gansu Province from a multi-scale perspective, noting that at the county level, carbon emissions display a notable global spatial positive correlation, with an aggregation capacity that initially weakens before strengthening [11]. Miao et al. found that both the quantity and quality of green technology innovation can significantly contribute to the carbon emission efficiency of energy-consuming manufacturing enterprises, and the effect on carbon emission efficiency is particularly significant in the central region and declining enterprises [12]. In North China, Mo and Wang investigated carbon emissions in the Yellow River Basin using a spatial panel model, revealing that carbon emissions expanded outward from the whole area of Shandong and the border region of Shanxi, Gansu, Ningxia, and Mongolia, thereby forming a “high in the east and low in the west” emission pattern [13]. In South China, Xu utilized exploratory spatial data analysis and geographic detector analysis, uncovering significant spatial differentiation and correlation of carbon emissions in Anhui Province, which initially exhibited characteristics of “high in the north and low in the south” and “high in the west and low in the east”, before evolving into a clearer “core–periphery” structure [14]. Li et al. employed an extended STIRPAT model to investigate the driving factors behind carbon emissions in Fujian Province, finding that industrial structure is the primary influencing factor, along with the variable effects of population, per capita GDP, energy intensity, and energy structure [15]. Huang et al. investigated the spatial network structure of land use carbon emissions and carried out carbon balance zoning and found that land use carbon emissions in Jiangxi Province showed a spatial pattern of high in the northwest and low in the southeast, with the total amount showing an upward trend, and the interregional network showed an obvious spatial spillover effect [16]. Xie et al. explored the impact of intra- and inter-regional digital economy on carbon emissions, and the results showed that the digital economy and carbon emissions both exhibit spatial spillover effects, and the digital economy mitigates local and neighboring carbon dioxide emissions by adjusting structural deviations [17]. Wang et al. constructed a spatial difference model and a mechanism analysis model and found that the new energy demonstration city policy not only effectively reduces local carbon emissions but also exhibits significant spatial spillover effects and promotes carbon emission reduction in neighboring cities [18].
In summary, existing research predominantly focuses on individual industries and lacks a comprehensive analysis of carbon emission characteristics and driving mechanisms across various sectors. Furthermore, much of the research is limited to specific regions, resulting in an absence of systematic examinations of regional carbon emission disparities and their driving factors from a national perspective.

2.2. Research on Carbon Allowance Pricing

The study of carbon allowance pricing primarily examines the operational mechanisms of carbon trading markets and the factors influencing carbon allowance prices.
Regarding the operational mechanisms of these markets, Marco conducted an optimization study of existing market structures, creating an eight-step decision framework that proposes innovative approaches for developing a bottom-up system consistent with the Paris Agreement [19]. Wu et al. constructed a theoretical model that incorporates carbon market constraints, examining the synergy between market mechanisms and administrative interventions, and utilized this model to analyze the carbon emission intensities of eight pilot carbon markets. The results indicate that the collaboration of regional administrative interventions can enhance carbon reduction outcomes [20]. Zhang and Pang developed a Computable General Equilibrium (CGE) model to investigate twelve scenarios of carbon market policies, which included varying proportions of paid auctions in the allocation of carbon quotas and differing national carbon reduction ratios; their findings suggest that paid auctions have minimal effect on promoting the use of clean energy in the power sector [21]. Mahapatra et al. employed a nonlinear panel autoregressive distributed lag modeling framework, concluding that energy efficiency has an asymmetric long-term impact on carbon emissions, with short-term effects on both developed and developing economies [22]. Guan et al. utilized a Mendelian Randomization (MR) nonlinear estimation method and discovered that, following the establishment of the national carbon market, the carbon markets in Hubei, Chongqing, and Fujian achieved weak efficiency [23]. Rannou et al. explored the interaction between the European carbon and green bond markets, finding that electric power companies tend to abandon the carbon market in favor of issuing more green bonds to obtain resources for transitioning to clean energy production systems [24].
Concerning the factors influencing carbon allowance prices, Lin et al. employed a data-driven, non-parametric additive regression model and demonstrated that coal prices exhibit an inverted U-shaped nonlinear effect on carbon prices, implying that fluctuations in coal prices could help lower carbon prices in the long run [25]. Qu et al. identified significant internal and external factors influencing carbon allowance prices, noting that short-term impacts from corporate technological levels and energy prices are substantial, while climatic conditions exert more influence in the medium to long term [26]. Liu et al. developed a mixed-frequency multifactor GARCH-MIDAS model and found that the air quality index impacts government environmental regulatory policies, which subsequently influence corporate demand for carbon emissions, leading to long-term negative fluctuations in carbon prices [27]. Chen and Wang applied a Data Envelopment Analysis (DEA)-Managing By Project (MBP) model to estimate the cooperative effects of carbon prices and technological innovation across various reduction scenarios [28]. Cai et al. performed an empirical analysis using a Vector Autoregressive Model (VAR)–Multivariate GARCH (MVGARCH)–Dynamic Conditional Correlation (DCC) model, revealing a strong connection between carbon allowance prices and stock prices, particularly highlighting a robust linkage between carbon prices and the stock prices of power and energy firms [29].
These studies systematically elucidate the diversity and complexity of the operational mechanisms of carbon trading markets from various perspectives. However, they often overlook industry heterogeneity and differences in market mechanisms. Additionally, there is a lack of analysis concerning spatial spillover effects and regional interlinkages, which complicates the understanding of price transmission mechanisms between regions.

2.3. Research on the Relationship Between Carbon Emission Volume and Carbon Allowance Price

Recent investigations into the linkage mechanism between carbon emission volume and carbon allowance price have yielded various innovative perspectives and methodologies from both theoretical and empirical standpoints. Liu and Song employed the Hamilton–Jacobi–Bellman equation to reformulate the optimal control problem as a partial differential equation, thereby calculating the optimal reduction and trading volumes for enterprises. This analysis led to the derivation of the equilibrium price of carbon allowance and the optimal reduction volume for society as a whole [30]. Botong et al. utilized a time-varying double difference model to assess the synergistic benefits and mechanisms of carbon trading pilot policies on carbon and air pollutant emissions across national, electricity, industrial, transportation, and residential sectors. They investigated the impact and action paths of carbon trading policies across various industries using industry-level data and analyzed the intermediary effects of industrial structure, technological progress, and foreign direct investment on policy implementation [31]. Adamolekun’s study of a sample comprising 1591 companies from 23 European countries indicated a negative correlation between carbon prices and corporate greenhouse gas emissions, with the strength of this relationship diminishing at higher pricing levels [32]. Research by Digitemie and Ekemezie found that well-designed carbon pricing policies could significantly reduce emissions while fostering innovation and investment in clean technology [33]. Feng et al. implemented a quasi-natural experimental design using data from 272 prefecture-level cities in China spanning from 2007 to 2019, revealing that the introduction of carbon emission pricing policies can significantly encourage reductions in carbon emissions. Notably, differences emerged among cities in various geographical locations concerning the effects of carbon pricing policies on carbon reduction [34]. However, contrasting viewpoints exist; Green conducted a meta-analysis of ex-post quantitative assessments of global carbon pricing policies since 1990, concluding that the overall reduction effect of carbon pricing on emissions is restricted, typically ranging between 0% and 2% per year [35].
Evidently, existing research presents inconsistent conclusions regarding the relationship between carbon emission volume and carbon allowance price, lacking a unified theory, overlooking industry and regional disparities, and failing to accurately describe the impact mechanisms under varying market conditions while insufficiently addressing the influence of external factors such as policies and energy structure.
In recent years, significant progress has been made in the study of carbon emission volume and carbon allowance prices. However, current studies predominantly focus on specific regions, with a lack of comprehensive comparative analyses across regions. Furthermore, there is a dearth of research addressing nationwide patterns and regional differences in the linkage mechanisms between carbon emissions and prices. This study aims to explore the relationship between carbon emission volume and carbon allowance price in China through the lens of temporal and spatial evolution. By analyzing the regional characteristics of carbon emissions and the temporal and spatial evolution patterns of carbon prices in pilot carbon trading areas, this research will examine the linkage mechanism between carbon emission volume and carbon price. Ultimately, this study not only contributes to enriching the theoretical foundation of the carbon market but also provides valuable policy references for achieving the “Dual Carbon” goals.

3. Research Design

This study analyzes carbon emission data from 30 provinces in China spanning the years 2012 to 2021, along with carbon allowance price data from eight carbon trading pilot areas between 2014 and 2023. The primary focus is on the relationship between carbon emissions and carbon allowance prices, aiming to investigate their temporal and spatial evolutionary characteristics and linkage mechanisms and reveal the intrinsic logic of carbon market operations and their implications for promoting sustainable low-carbon transformation.
Firstly, the study examines the temporal and spatial evolution of carbon emissions in China. By analyzing the trends of temporal fluctuations in carbon emissions and comparing emission disparities across various regions, it investigates the evolutionary features of carbon emission patterns, revealing spatial agglomeration effects and evolutionary pathways.
Secondly, in conjunction with the growth of the carbon trading market, the study assesses the fluctuation characteristics and spatial distribution of carbon allowance prices. Through an analysis of typical carbon trading pilot markets, it investigates temporal changes in carbon prices across different regions, regional linkage effects, and variations in market mechanisms.
Lastly, the study explores the direct impact of changes in carbon emission volumes on carbon allowance prices. This includes evaluating how fluctuations in emission volumes drive changes in carbon prices and how supply–demand dynamics in the market influence carbon price levels. It analyzes the feedback effects of carbon prices on corporate emission behaviors and examines regional differences in the effects of carbon price signals, revealing the actual impact of the carbon market on promoting emission reductions.
This study reveals the historical trajectory of carbon emissions and carbon price evolution in the temporal dimension, demonstrates their regional distribution characteristics in the spatial dimension, and explores the supporting role of the carbon market in achieving the strategic goals of “carbon peaking” and “carbon neutrality” through mechanism analysis. The research results contribute to optimizing carbon market design and enhancing its effectiveness in promoting sustainable low-carbon transformation. The framework is illustrated in Figure 1.

4. Empirical Analysis

4.1. Data Sources

This study selected carbon emission data from 30 provinces in China for the period 2012 to 2021 as the research sample based on the feasibility and completeness of data acquisition. Notably, the analysis excludes Tibet, Taiwan, Hong Kong, and Macau due to data availability constraints. The data were obtained from the China Carbon Accounting Database (CEADs), which is derived from nighttime light data collected via DMSP/OLS and NPP/VIIRS satellite systems provided by the National Geophysical Data Center (NGDC). This database offers significant advantages, including consistent statistical standards and robust continuity. At the same time, the total carbon emissions of typical years were cross-accounted using the emission accounting method recommended by IPCC, aiming at verifying the reasonableness and accuracy of the data and ensuring the robustness of the study results.
Additionally, carbon trading prices were analyzed for eight regions participating in carbon trading pilot programs from 2014 to 2023, specifically Beijing, Shanghai, Tianjin, Chongqing, Hubei, Guangdong, Shenzhen, and Fujian. The carbon price data comprise the average transaction prices of carbon emission quotas, which were sourced from multiple platforms, including the Shanghai Environment and Energy Exchange, the Beijing Electronic Trading Platform for Carbon Allowance, the Tianjin Emission Trading Exchange, the Sichuan United Environmental Exchange, the Hubei Carbon Emission Trading Center, the Guangzhou Carbon Emission Trading Exchange, the Shenzhen Green Exchange, and the Fujian Carbon Emission Trading Network.

4.2. Methods

4.2.1. Time Series Analysis

To ensure the scientific validity and comparability of the research results, the methods employed in this paper were chosen based on the prevailing international research paradigms and the specific characteristics of the study area. The carbon emission accounting method utilizes the emission factor approach recommended in the IPCC Guidelines for National Greenhouse Gas Inventories. This method offers strong data accessibility and is applicable to macro-regional measurements, making it widely used in carbon accounting research across various countries. The formula is expressed as follows:
C t = i = 0 n ( E i × F i )
where C t represents the total carbon emissions, E i denotes the consumption of type i energy, and F i is the carbon emission factor corresponding to the type i energy.

4.2.2. Spatial Autocorrelation Analysis

For spatial autocorrelation analysis, Moran’s I index is a commonly used spatial correlation index in geostatistical analysis, which is suitable for revealing the clustering and heterogeneity of regional emission patterns. Compared with other methods, this index has clear calculation and strong explanatory power and is suitable for identifying the spatial clustering phenomenon of carbon emissions in different regions. Considering the reality of uneven regional development in China, this method can help to reveal the spatial structural characteristics of carbon emissions. This study employs Moran’s I index to investigate the spatial correlation and heterogeneity of carbon emissions in China, with its values ranging from −1 to 1. The global Moran’s I index is used to measure the overall spatial autocorrelation of carbon emissions across provinces and regions. The calculation formula is presented as follows:
I = n i = 1 n j = 1 n w i , j ( C i C ¯ ) ( C j C ¯ ) i = 1 n j = 1 n w i , j ( C i C ¯ ) 2
where n represents the number of provincial regions, w i , j denotes the spatial weights between provincial region i and provincial region j , C i and C j represent the carbon emissions of provincial regions 1 and 2, respectively, while C ¯ denotes the average carbon emissions of these regions. The spatial weights w i , j are constructed based on the neighbor relationship. When two provinces have a common boundary, w i , j   = 1; otherwise, w i , j   = 0. The diagonal elements w i , j are all set to 0. At the same time, in order to enhance the comparability and standardization of the calculation, the spatial weight matrix is row-standardized, i.e., the sum of the weights of each row is 1. This approach can effectively reflect the effect of the spatial adjacency relationship between provinces on the spatial dependence of carbon emissions.
The local Moran’s I index is employed to quantify the spatial auto-correlation between individual provinces and their neighboring regions, and its calculation formula is presented as follows:
I i = ( C i C ¯ ) j = 1 n w i , j ( C j C ¯ )

4.3. Results

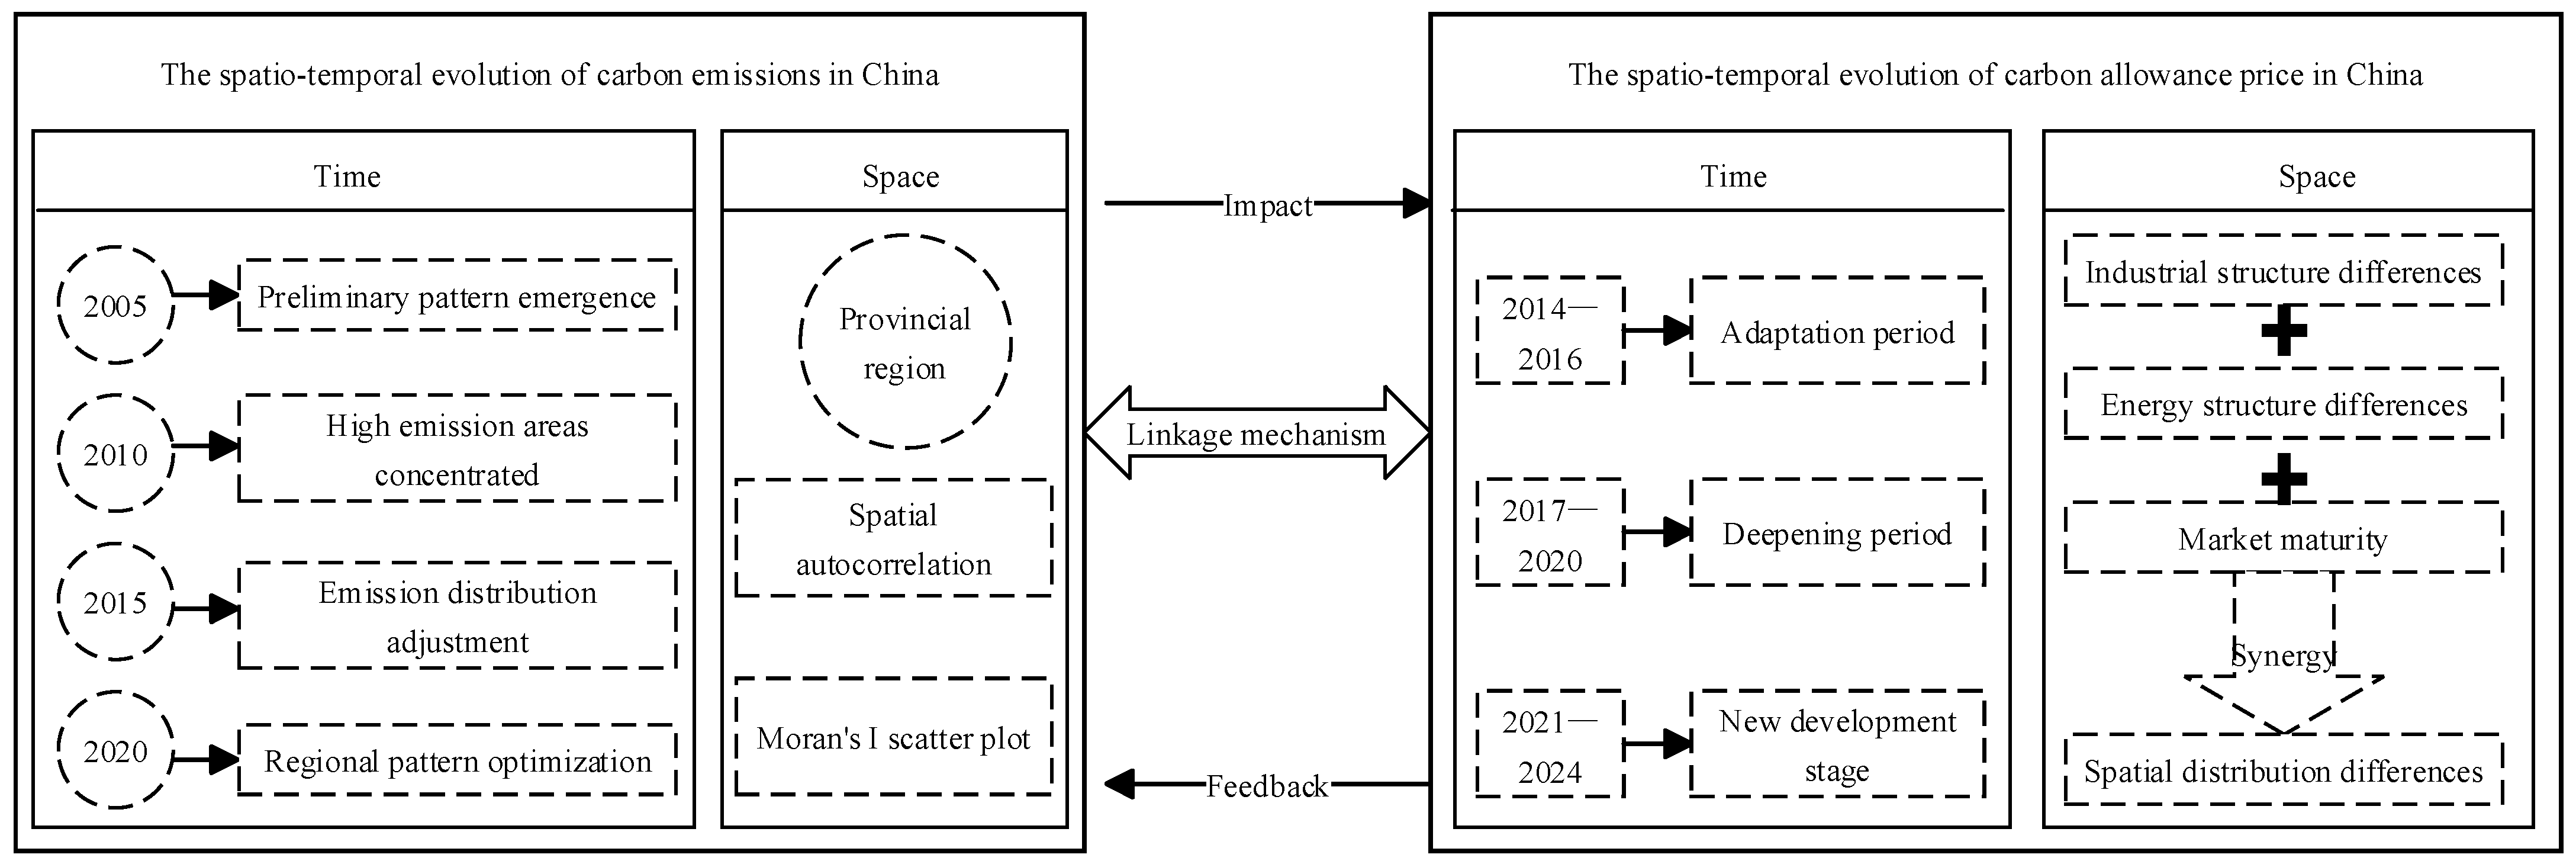
4.3.1. Analysis of the Spatio-Temporal Evolution of Carbon Emissions in China

(1)
Temporal evolution characteristics of carbon emissions
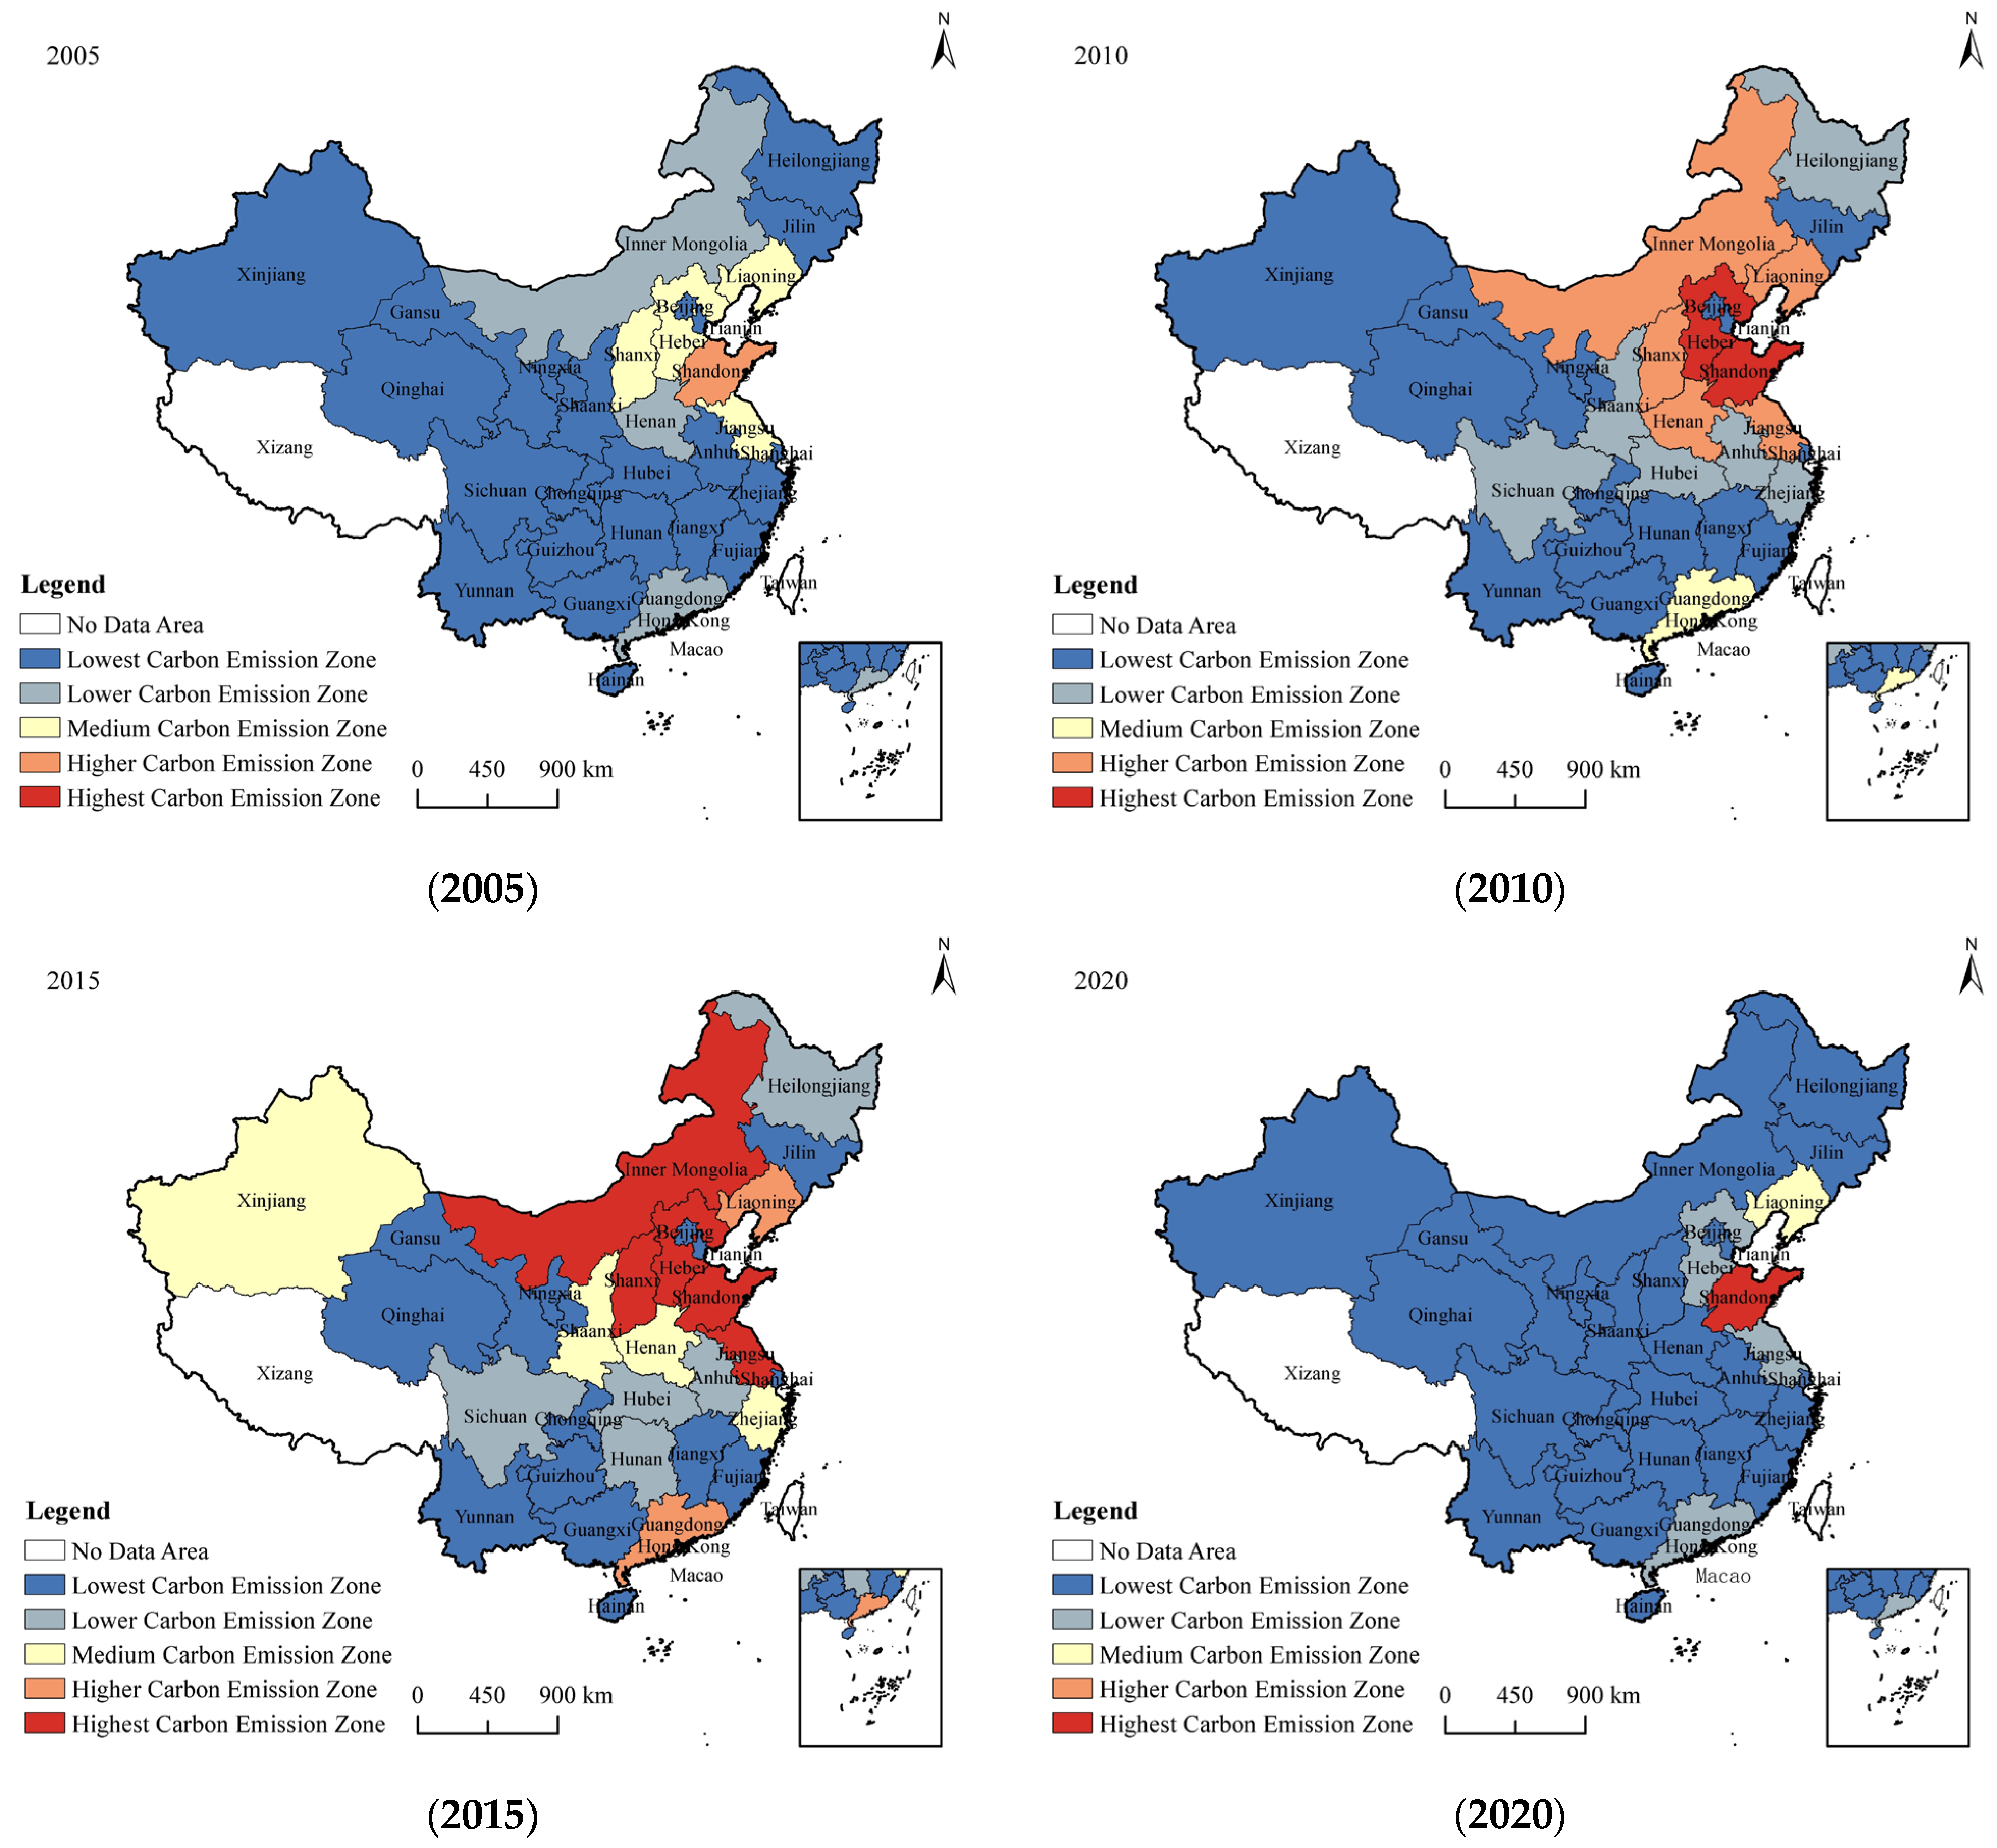
This study employed ArcGIS 10.7 software to identify observation points for the years 2005, 2010, 2015, and 2020, categorizing the 30 provinces into five carbon emission zones: Lowest Carbon Emission Zone, Lower Carbon Emission Zone, Medium Carbon Emission Zone, Higher Carbon Emission Zone, and Highest Carbon Emission Zone. The results of the analysis are illustrated in Figure 2.
Around 2005, the initial patterns of carbon emissions emerged, with regional disparities gradually widening. In 2005, the spatial distribution of carbon emissions in China displayed significant coastal aggregation characteristics. As illustrated in Figure 2, emissions were predominantly concentrated in economically developed regions such as Beijing–Tianjin–Hebei, the Yangtze River Delta, and the Pearl River Delta. During this period, the national economy was in the mid-stages of industrialization, with energy-intensive industries heavily concentrated in coastal provinces. High-carbon sectors, including steel, cement, and chemicals, became the primary contributors to carbon emissions, resulting in significantly elevated emission levels in these regions compared to the central and western regions. The comparatively lower emission levels in the central and western regions were primarily attributed to their industrial structures, which remained predominantly agrarian, preventing large-scale energy consumption. Due to China’s heavy reliance on coal for energy supply, carbon emission intensity increased in northern areas rich in coal resources, such as Shanxi and Inner Mongolia, although these regions had not yet become the core areas of national carbon emissions.
Around 2010, high carbon emission areas became increasingly concentrated, and spatial agglomeration effects intensified. The spatial pattern and aggregation effects of carbon emissions in China experienced significant changes during this period. As shown in Figure 2, the center of carbon emissions expanded from the eastern coastal regions to North China, Northeast China, and parts of the central and western regions. Resource endowments played a pivotal role in this transformation, as industries such as coal, steel, and electricity experienced agglomeration effects driven by energy supply and policy support. The implementation of the Western Development Strategy has expedited the industrialization process in provinces such as Sichuan and Guizhou, resulting in heightened energy consumption and a subsequent increase in carbon emissions. North China and Northeast China evolved into new high-carbon emission zones due to their abundant coal resources and enhanced energy supply guarantees. In provinces like Shanxi and Inner Mongolia, increased energy development based on the coal industry significantly raised carbon emissions, creating new high-emission areas. The Beijing–Tianjin–Hebei region, characterized by a robust industrial base and high energy consumption demand, exacerbated its carbon emissions, thus transforming the northern region into a high-density emission area.
Around 2015, industrial transfer and policy-driven adjustments resulted in changes to carbon emission distribution. During this period, China’s carbon emission patterns further evolved, as illustrated in Figure 2, displaying characteristics of intensified polarization and regional differentiation. On the one hand, northern regions, notably Beijing–Tianjin–Hebei, Shandong, Shanxi, and Henan, continue to witness an increase in carbon emissions, establishing themselves as the most carbon-intensive areas in the country. Despite the national implementation of energy structural adjustments and energy-saving emission reduction policies, industries such as coal, steel, and electricity in these regions remain in a phase of peak development, hindering effective reductions in carbon emissions. On the other hand, coastal regions, including the Yangtze River Delta and the Pearl River Delta, are accelerating industrial upgrades and promoting the development of high-end manufacturing and services, resulting in a slowdown in the growth of carbon emissions. In the southwest, emissions continued to rise due to the influence of energy development and infrastructure construction. The spatial patterns of carbon emissions began to reflect regional differentiation, with emissions in the eastern coastal and some central provinces stabilizing or declining, while significant pressures persisted in northern heavy industrial bases and resource-dependent provinces.
Around 2020, the low-carbon transition accelerated, and regional carbon emission patterns were optimized. During this period, new changes emerged in the spatial distribution of carbon emissions in China, as illustrated in Figure 2, indicating an overall trend of convergence. This improvement can be attributed to the promotion of low-carbon technologies, adjustments to the energy structure, and the establishment of a carbon trading market. In regions represented by Shanghai, Jiangsu, and Guangdong, the industrial structure increasingly shifted toward a green economy and intelligent manufacturing, resulting in a decrease in carbon emissions. In addition, the green financial reform and innovation pilot projects carried out in Zhejiang, Jiangxi, and Guangdong since 2017 have also had a positive effect on promoting carbon emission reduction in some areas by guiding the flow of financial resources to green industries, further promoting the optimization of regional structures. Concurrently, influenced by national policies aimed at achieving carbon peak and carbon neutrality, traditional high-emission areas such as Beijing–Tianjin–Hebei and Shandong accelerated energy-saving renovations and eliminated outdated production capacity, leading to an initial turning point in emissions. However, resource-oriented regions such as Shanxi, Inner Mongolia, and Shaanxi, where coal industries still predominate, did not exhibit significant short-term declines in carbon emissions. Throughout this period, the carbon emissions pattern in China exhibited a more optimized trend, particularly with notable progress in low-carbon transitions in developed coastal regions, although resource-dependent areas continued to face substantial emissions pressure.
In conclusion, the evolution of carbon emissions in China over time is characterized by distinct phases and region-specific differences. From 2005 to 2020, the distribution of carbon emissions in China experienced a northward shift, a diffusion into central and western regions, and a coexistence of convergence and differentiation. This change was influenced by adjustments in industrial structures, shifts in energy consumption patterns, and the comprehensive impact of regional economic development, policy regulation, and technological advancements.
(2)
Spatial distribution characteristics of carbon emissions
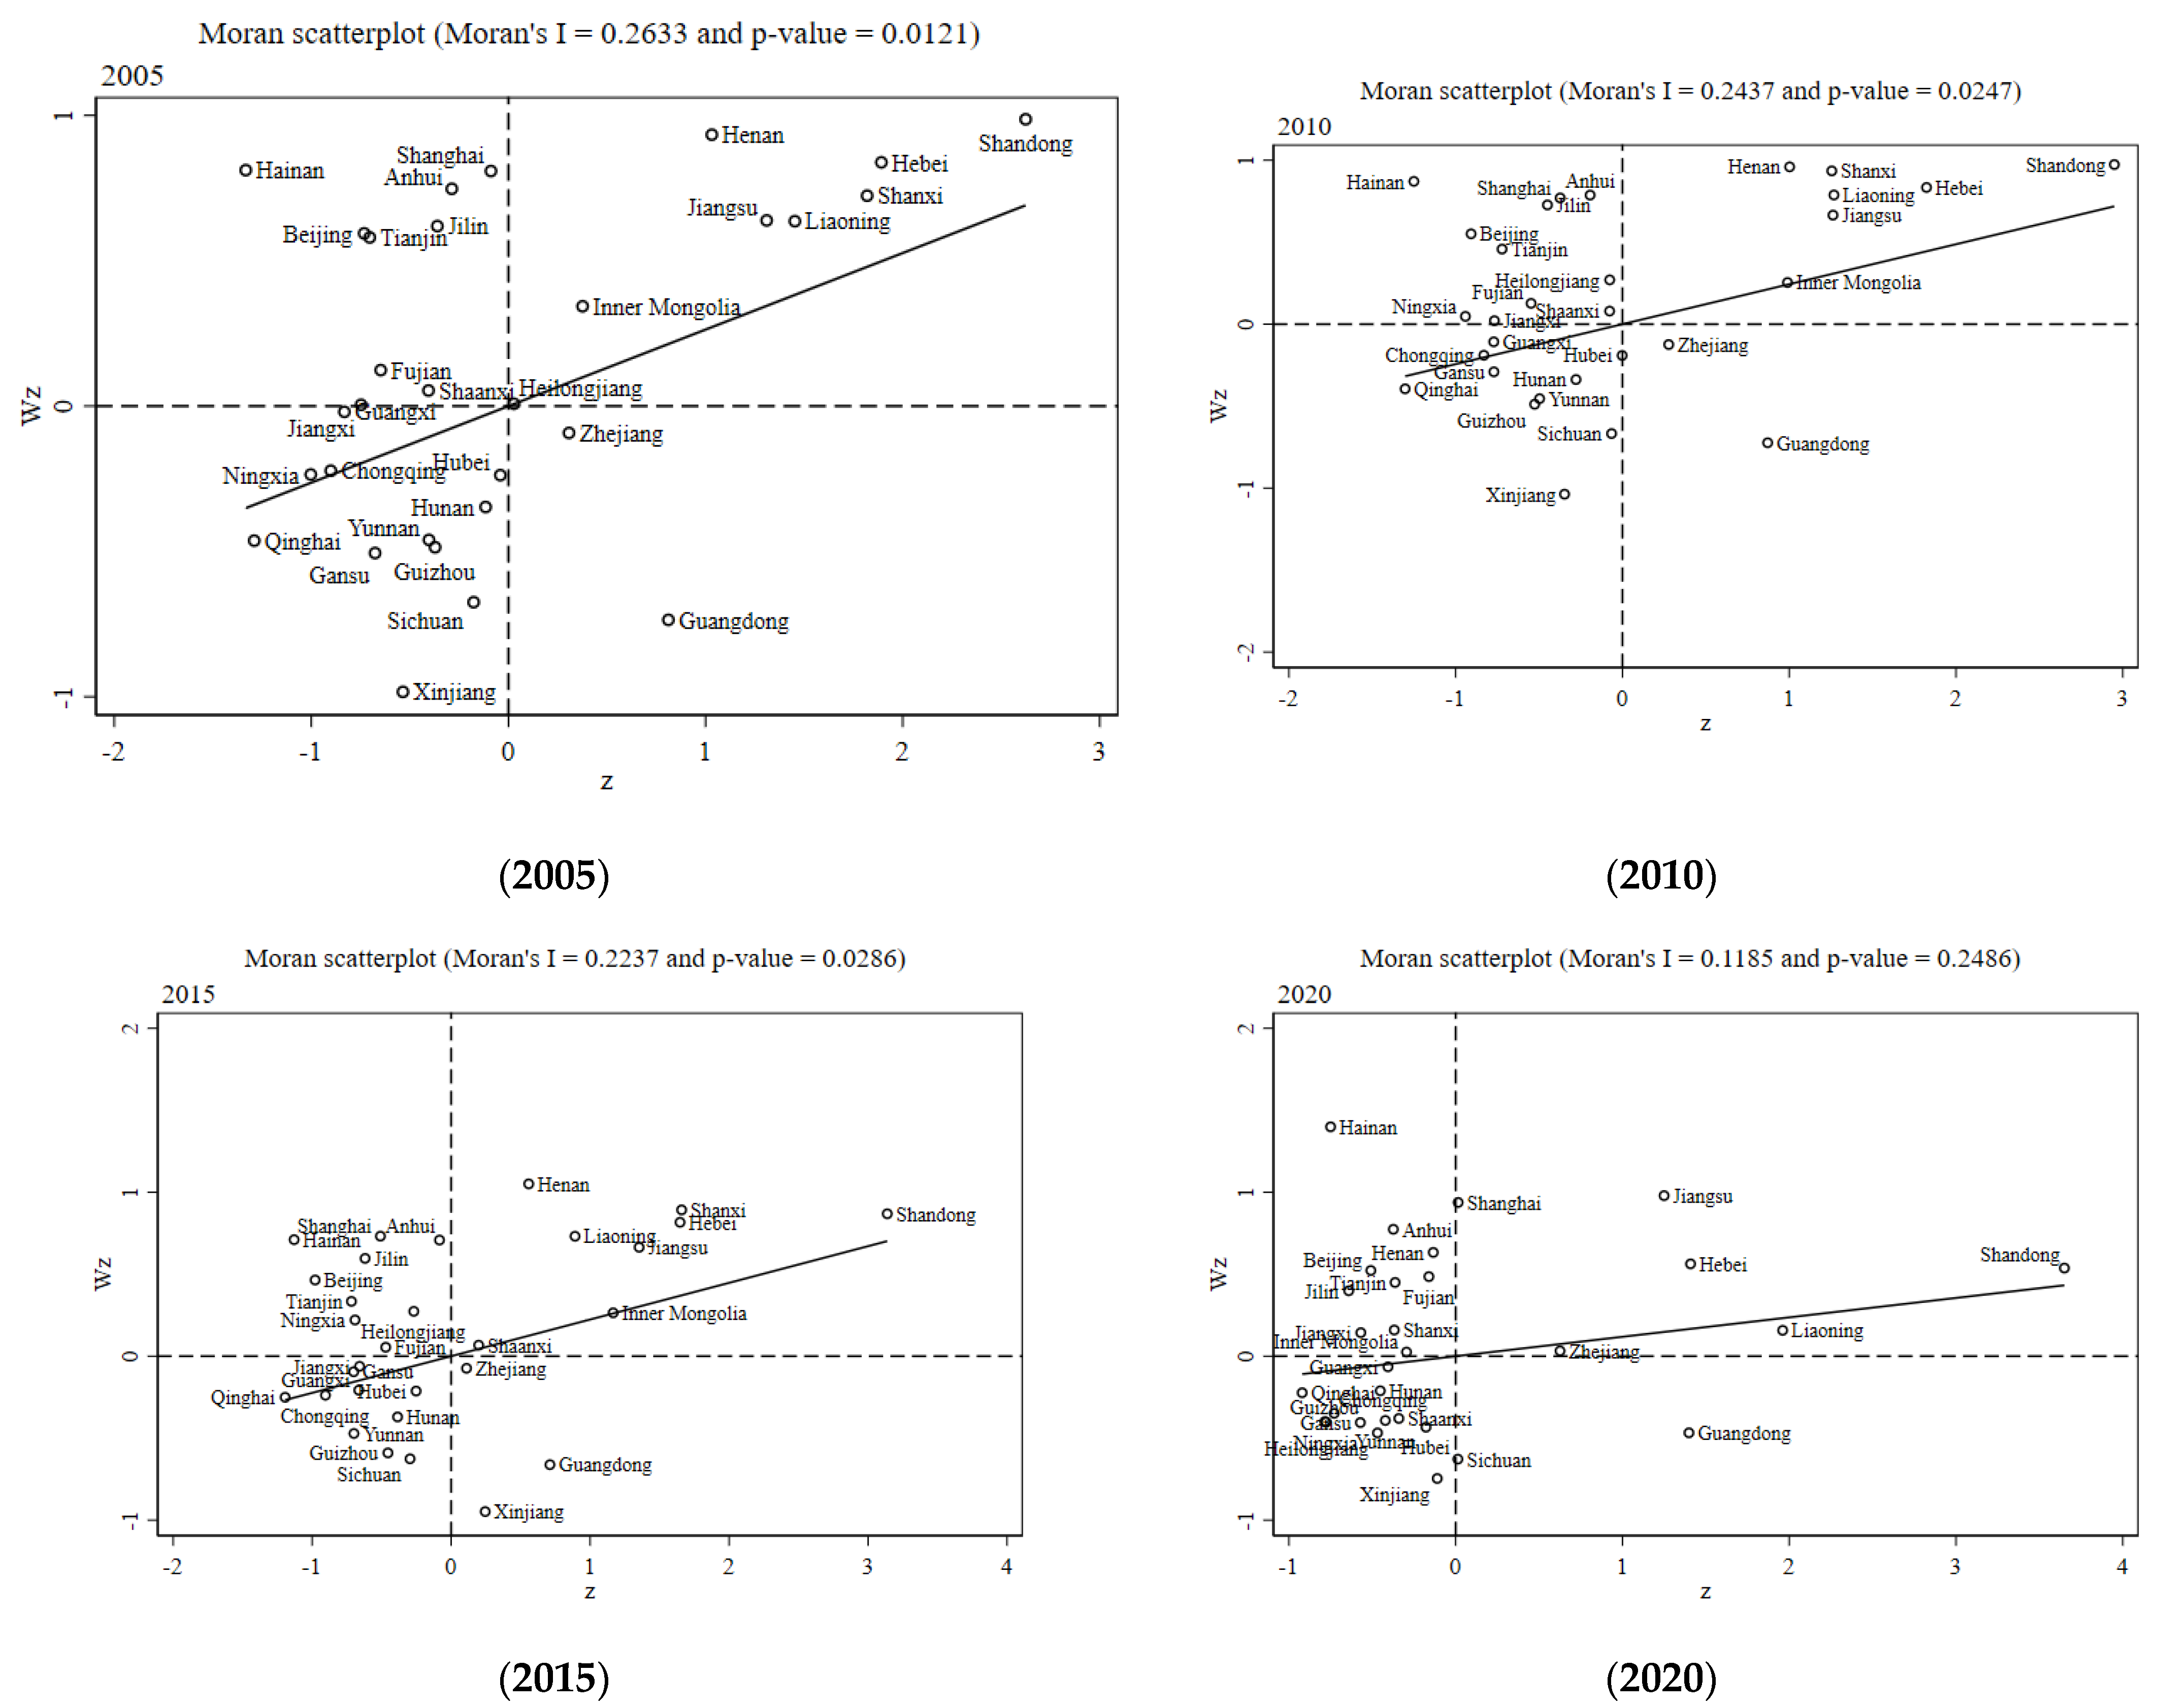
The values of Moran’s I and P presented in Figure 3 indicate that the spatial correlation of carbon emissions gradually diminishes over time, highlighting the growing regional disparities and imbalances in carbon emissions across various regions. From 2005 to 2020, the spatial distribution of carbon emissions demonstrates distinct aggregation effects, with spatial auto-correlation and regional differences exhibiting continuous variability from year to year.
The horizontal coordinate (z) represents the standardized value of a variable within a specific region, indicating its deviation relative to all regions.
The vertical coordinate (Wz) indicates the spatial lag value for that region, defined as the weighted average of the variable among its neighboring regions.
Around 2005, the spatial aggregation effect of carbon emissions began to emerge. As illustrated in Figure 3, Moran’s I index stands at 0.2633, with a p-value of 0.0121, indicating a significant positive spatial correlation in carbon emissions across China in 2005. There exists a degree of clustering between geographic areas of high and low carbon emissions. Coastal provinces such as Shandong, Jiangsu, and Liaoning are situated in high–high clustering areas, characterized by relatively high self-observed values and adjacency to high-value regions, where neighboring areas also exhibit elevated carbon emission volumes. This pattern reflects characteristics of industrial concentration and energy-intensive consumption. In contrast, western and certain central regions, including Xinjiang, Guizhou, and Gansu, reside in low–low clustering areas, exhibiting low self-observed values alongside neighboring areas. These regions primarily focus on agriculture and primary industries, resulting in lower carbon emission levels. The spatial heterogeneity of carbon emissions during this period is pronounced, with coastal provinces in the east exhibiting a tendency towards high energy consumption industries, while western provinces generally show lower emissions. The clustering effect of carbon emissions is primarily influenced by energy consumption, industrial structure, and regional economic development, which establishes a foundation for subsequent spatial expansion and regional differentiation.
Around 2010, spatial expansion and clustering effects strengthened. The spatial distribution of carbon emissions demonstrated significant expansion, with Moran’s I index at 0.2437 and a p-value of 0.0247, indicating that the spatial aggregation effect of carbon emissions nationwide remains significant, with increasingly pronounced clustering effects. As highlighted in Figure 3, regions with high carbon emissions are no longer confined to eastern and coastal areas; regions such as North China and Northeast China have also experienced a substantial increase in carbon emissions, particularly in Shanxi and Inner Mongolia, where high-carbon-emission industries, such as coal and steel, dominate. This trend has resulted in notable growth in carbon emissions. Furthermore, the promotion of the Western Development policy has led to rising carbon emissions in areas like Sichuan and Guizhou, indicating a notable trend of spatial expansion. Although carbon emissions in coastal eastern regions remain elevated, noticeable increases in emissions have also begun to emerge in northern and central-western areas. The spatial aggregation effect of carbon emissions in China has been further enhanced, revealing significant regional disparities and imbalances, particularly with rising emissions in central–western regions, pointing to a spatial expansion trend in carbon emissions.
Around 2015, regional disparities intensified, accompanied by a slight decrease in spatial auto-correlation. The spatial distribution characteristics of carbon emissions underwent further change, with a Moran’s I index of 0.2237 and a p-value of 0.0286, indicating a decrease in auto-correlation compared to the prior two years. Provinces exhibiting high carbon emissions are predominantly concentrated in economically developed regions such as Beijing–Tianjin–Hebei, the Yangtze River Delta, and the Pearl River Delta. Notably, carbon emissions in Shandong, Shanxi, and Henan continue to rise, establishing these areas as major sources of carbon emissions. Traditional energy and high-energy-consuming industries remain highly concentrated in these regions, sustaining a pronounced spatial aggregation effect for carbon emissions. In contrast, the growth rate of carbon emissions in some coastal areas, such as Jiangsu, Zhejiang, and Guangdong, has decelerated, largely due to industrial structural adjustments and the promotion of green, low-carbon technologies. During this period, regional disparities have intensified, with carbon emissions in eastern coastal and certain central regions stabilizing or declining, while carbon emissions pressures in northern and resource-based areas remain high, highlighting evident spatial differentiation.
Around 2020, the optimization of carbon emission patterns occurred alongside a weakening of spatial correlation. The carbon emission pattern in China has been further optimized, with Moran’s I value decreasing to 0.1185 and a p-value of 0.2486, indicating a significant reduction in spatial auto-correlation, along with increasingly evident regional disparities. Since 2017, China has launched pilot green financial reform and innovation programs in Zhejiang, Jiangxi, and Guangdong, guiding the flow of resource allocation to green and low-carbon industries through green credit, green bonds, and other financial instruments. This mechanism has significantly facilitated the low-carbon transformation of some developed coastal regions, promoting the accelerated upgrading of their industrial structure to smart manufacturing and green services. Because of this, the growth rate of carbon emissions in places such as Shanghai, Jiangsu, and Guangdong has slowed down significantly or even shown a downward trend. Traditional high-carbon emission areas such as Beijing–Tianjin–Hebei and Shandong face considerable pressure for emissions reduction. Influenced by national carbon peaking and carbon neutrality policies, carbon emissions in these regions have slowed. Resource-based regions such as Shanxi, Inner Mongolia, and Shaanxi are still at a high carbon emission level due to the fact that coal and other high-carbon industries are still dominant, and the penetration of green financial mechanisms is limited. Overall, the spatial distribution of carbon emissions in 2020 exhibits a clear trend towards optimization, with further reductions in emissions in developed eastern areas, while certain resource-based regions in the central–west still experience substantial carbon emission pressures.

4.3.2. Analysis of the Spatio-Temporal Evolution of Carbon Allowance Price in China

(1)
Temporal evolution characteristics of carbon allowance prices
Since the implementation of the pilot program, China’s carbon emissions trading market has transitioned from initial exploration to gradual deepening, ultimately leading to the establishment of a unified national market. The temporal evolution of carbon allowance prices is influenced by various factors, including policy direction, market supply and demand, and macroeconomic cycles. The expansion of the scope of market participants at different stages and the trend towards the financialization of carbon allowances would also have an impact on the price formation mechanism and volatility characteristics. As illustrated in Figure 4, the carbon trading market remained immature during its early stages, exhibiting significant price fluctuations and distinct experimental characteristics across regional markets. With continuous improvements in the carbon market, the trading mechanism has been progressively optimized, resulting in a discernible upward trend in overall carbon prices.
In 2014–2016: The carbon market was in its infancy, characterized by low prices and minimal fluctuations. As shown in Figure 4, the carbon allowance prices in various pilot cities remained relatively low, reflecting the market’s early stage of development. The trading mechanisms across different regional carbon markets were still being explored, resulting in low market activity and price levels that were quite similar across areas. During this period, significant regional price disparities emerged; Beijing and Shenzhen exhibited relatively higher prices, indicating more mature market mechanisms, whereas prices in Hubei and Guangdong were lower, suggesting that these markets were still undergoing supply–demand adjustments. The market’s immaturity resulted in pronounced price volatility; for instance, the carbon price in Beijing reached 54.95 CNY/ton in 2014 but dropped to 47.56 CNY/ton in 2015, with significant declines also observed in Guangdong. During this phase, market mechanisms had not yet been fully established, the scope of market participants was narrower, the trading volume was smaller, and the carbon price was mainly affected by the quota allocation and the willingness of enterprises to participate.
In 2017–2020: Market mechanisms improved, accompanied by rising prices and significant regional differentiation. The gradual enhancement of market mechanisms led to a general increase in price levels and noticeable price differentiation across regions. As illustrated in Figure 4, the carbon allowance prices in Beijing, Shanghai, and Guangdong displayed increased volatility, with market transactions becoming more active. The average and median prices in some regions rose, indicating a growing market demand. However, prices in Fujian and Chongqing remained low, reflecting disparities in the development of carbon markets across various regions. During this period, some areas began to introduce paid quota trading, which increased trading volumes and progressively moved carbon allowance prices toward supply–demand equilibrium. Some pilot regions had begun to explore the use of carbon quotas as financial assets for financing collateral or derivative product design, and the financial attributes of carbon quotas had been gradually enhanced, increasing the market’s sensitivity to price and volatility. The acceleration of global climate governance and domestic energy restructuring bolstered expectations regarding carbon emission costs, further driving up carbon prices. This upward trend indicates that these regions established relatively stable quota allocation mechanisms and market operation rules during the pilot phase, with market demand gradually expanding due to policy encouragement.
From 2021 to Present: The national carbon market was initiated, experiencing rising prices and increased volatility. As shown in Figure 4, market prices in Beijing, Shanghai, and other regions have significantly increased, with further expansion in price volatility; notably, the gap between the highest and lowest prices in Beijing has widened, reflecting a more mature market mechanism and increased trading activity. The mechanism for forming national carbon prices is gradually being unified, and the trading rules across regional carbon markets are becoming more consistent, enhancing market liquidity and broadening participation, which collectively contributes to an overall increase in carbon prices. Following the national targets for carbon peaking and carbon neutrality, the trading mechanisms in pilot markets continue to improve, leading to significant increases in companies’ demand for carbon quotas. After 2022, prices rebounded again, particularly in Beijing, Guangdong, and Shanghai, all of which reached new highs, demonstrating that the functioning of the national carbon market has revealed its incentive effects on local markets. Differences in the allocation of allowances, the pace of sectoral inclusion, and the use of financial instruments in different regions continue to influence carbon price movements during this period. The establishment of a unified national carbon market will have profound long-term impacts on market trends, although further convergence of prices across regions may still require time.
(2)
Spatial distribution characteristics of carbon allowance prices
Significant differences exist in the spatial distribution of carbon allowance prices across various regions in China, as illustrated in Figure 5. This regional characteristic is influenced not only by market supply and demand dynamics but is also closely related to industrial structure, energy structure, and market maturity. Variations in industrial structure determine the intensity of demand within the carbon market, while energy structure affects the supply levels. Additionally, market maturity influences trading activity and price stability in the carbon market.
Differences in industrial structure directly affect carbon prices. In regions such as Beijing, Shanghai, and Guangdong, robust economic development and the concentration of energy-intensive industries lead to strong demand in the carbon market. As shown in Figure 5, carbon prices have consistently remained high. In 2023, the carbon price in Beijing reached 101.14 CNY/ton, while prices in Shanghai, Guangdong, and other regions ranged from 60 to 75 CNY/ton. In contrast, regions like Hubei and Chongqing primarily consist of traditional manufacturing and energy industries, resulting in higher carbon emissions and a relatively low number of market participants, which contributes to lower carbon prices. In 2023, the carbon prices in Hubei and Chongqing were 45.79 CNY/ton and 35.10 CNY/ton, respectively.
Differences in energy structure also influence the spatial distribution of carbon prices. Coastal regions have a relatively optimized energy structure, with a higher proportion of non-fossil energy. This situation results in higher carbon emission costs and increased pressure on companies to reduce emissions, leading to robust demand in the carbon market and sustained high carbon prices. Conversely, the central and western regions primarily depend on coal as their major energy source. Although these regions exhibit high carbon emissions, the slow pace of industrial upgrading and lower participation in carbon trading lead to reduced market activity and lower carbon prices. With the advancement of the national carbon market, carbon prices in the central and western regions are gradually increasing, and a trend toward market integration is beginning to emerge.
Market maturity is another critical factor influencing regional differences in carbon prices. The carbon markets in the eastern coastal regions were established earlier, boasting more refined trading rules and numerous market participants, which contribute to lower price volatility. In contrast, the carbon markets in the central and western regions remain in the development stage, characterized by fewer market participants and insufficient liquidity, resulting in greater price volatility. Furthermore, regulatory oversight and policy enforcement by local governments significantly impact carbon prices. In cities like Beijing and Shanghai, government regulation of the carbon market is relatively stringent, allowing carbon prices to remain elevated over time. Conversely, in regions where policy enforcement is weaker, maintaining high carbon prices presents more challenges.
As the national carbon market continues to deepen, regional disparities in carbon prices may gradually diminish. However, due to substantial differences in industrial foundations and energy structures across regions, the differentiation in carbon prices is likely to persist for an extended period. In the future, as carbon market mechanisms improve, carbon prices in the central and western regions are expected to gradually converge with those in the eastern regions, resulting in a more balanced development of the carbon market.

4.3.3. Analysis of the Interaction Mechanism Between Carbon Emissions and Carbon Allowance Prices

(1)
Analysis of Theoretical mechanisms
  • The Correlation Analysis between Carbon Emission Volumes and Carbon Prices
The relationship between carbon emission volumes and carbon prices demonstrates complex dynamic characteristics within a market economy. Theoretically, carbon allowances, as tradable assets, have their prices primarily dictated by market supply and demand. Changes in carbon emissions directly impact the supply and demand relationship for carbon allowances, indicating a significant correlation between these two factors. However, the development of the carbon market in China has introduced multiple influencing factors, leading to instability in their interaction.
From a temporal perspective, the correlation between carbon emission volumes and carbon prices during the early stages of China’s carbon market was relatively weak. This weakness was primarily attributed to underdeveloped market mechanisms and delayed supply mechanisms for carbon allowances, which hindered the effective reflection of actual changes in carbon emissions through carbon prices. Following the launch of the pilot market in 2013, carbon allowances were allocated based on historical emission levels, resulting in a surplus and relatively stable fluctuations in carbon prices. Nevertheless, as the carbon market evolved, increases in carbon emissions gradually heightened market demand, leading to greater price volatility, particularly during the preparation phase of the national carbon market in 2017, when significant fluctuations in carbon prices were noted in some pilot regions.
From a spatial perspective, the correlation between carbon emission volumes and carbon prices exhibits significant regional variations. Areas with higher carbon emissions, such as Guangdong and Hubei, tend to have higher carbon allowance prices. Conversely, in regions with lower carbon emissions, like Shenzhen, the prices of carbon allowances display stronger characteristics of market regulation. This disparity is closely associated with regional industrial structures, energy consumption patterns, and the intensity of policy implementation. In Guangdong Province, where manufacturing is concentrated in cities such as Guangzhou and Foshan, carbon emissions are relatively high, resulting in active market transactions and pronounced price fluctuations. In contrast, Shenzhen’s industrial structure is more aligned with low-carbon development, leading to a more stable supply and demand in the carbon market and relatively smaller fluctuations in carbon prices.
  • The impact mechanism of changes in carbon emissions on carbon allowance prices.
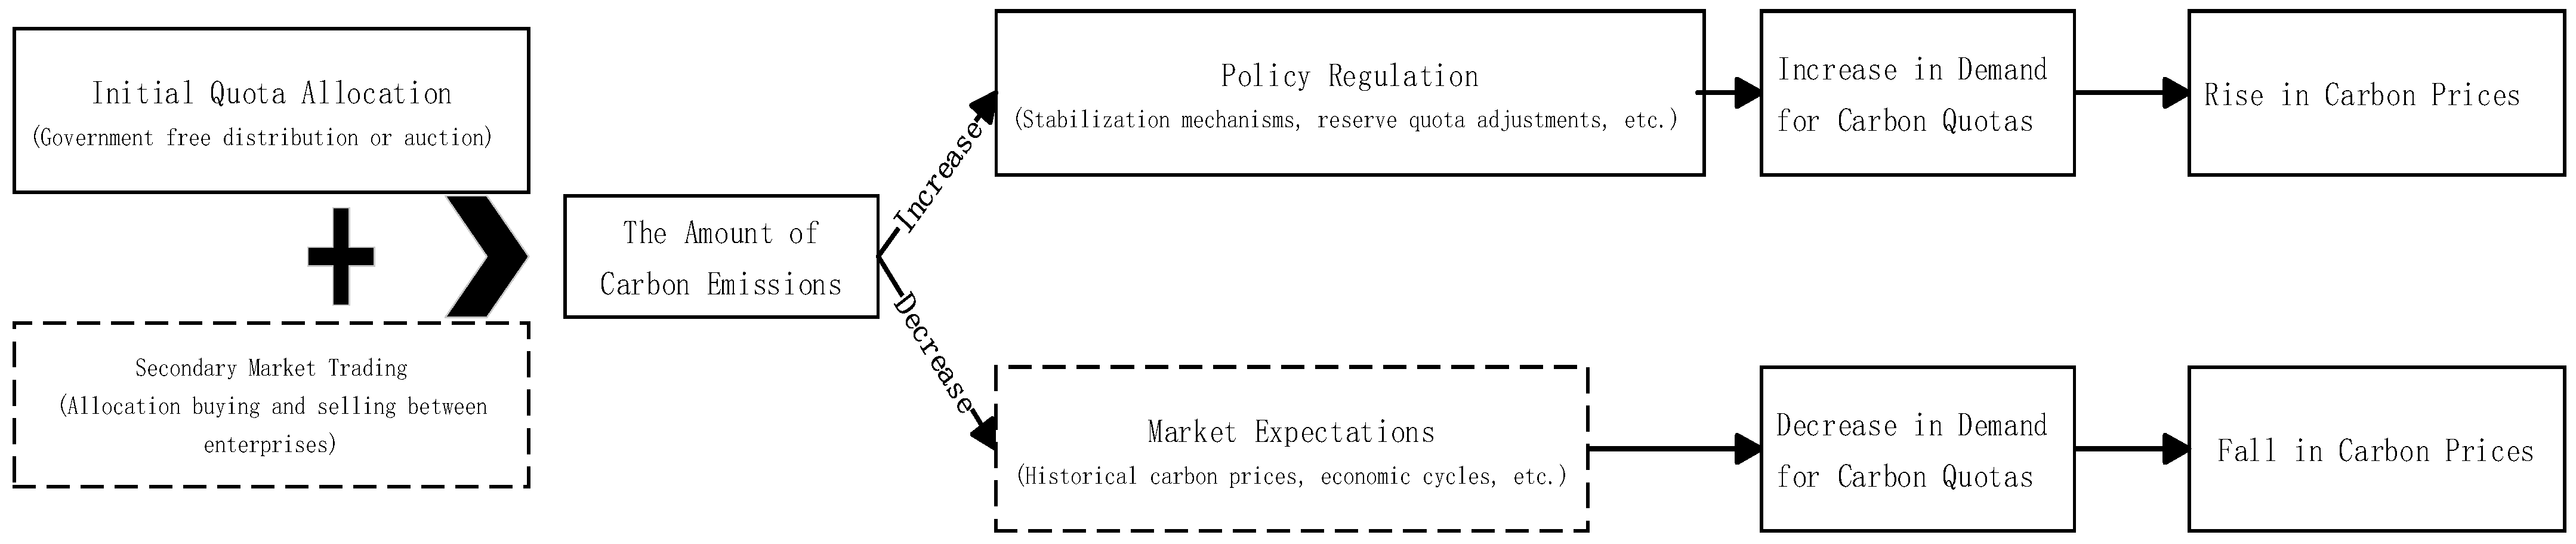
Changes in carbon emissions serve as direct drivers of the supply and demand dynamics within the carbon market, playing a crucial role in shaping carbon allowance prices. In a well-functioning market, an increase in carbon emissions signals a rise in market demand for carbon allowances, subsequently driving up carbon prices. Conversely, a decrease in carbon emissions may result in reduced market demand, exerting downward pressure on carbon prices. However, the actual operation of the carbon market in China reveals that this relationship is not linear and is influenced by a multitude of factors, including policy decisions, market expectations, and trading behaviors. The impact mechanism is illustrated in Figure 6:
Policy regulation plays a significant role in shaping the relationship between variations in carbon emissions and carbon prices. During the early stages of the carbon market’s operation, carbon allowances were primarily distributed at no cost, resulting in relatively low pressure on enterprises to reduce carbon emissions. Even with increases in carbon emissions, this did not necessarily trigger a corresponding rise in carbon prices. As the market mechanism evolved, the government gradually introduced paid allowance trading and enhanced carbon reduction assessments, thereby establishing a more direct relationship between changes in carbon emissions and carbon prices. Following the official launch of the national carbon market in 2021, the power industry was among the first sectors integrated into the market. Due to its substantial carbon emissions, market demand surged, driving carbon prices up from an average of CNY 30 per ton during the pilot phase to nearly CNY 60 per ton.
Market expectations are crucial in this context. Prior to the launch of the national carbon market, concerns over tightening carbon allowances led some enterprises to preemptively purchase large quantities of allowances, thereby increasing both market demand and carbon prices. Furthermore, market expectations can amplify price volatility. When enterprises anticipate a rise in carbon prices, they tend to accumulate allowances, further driving up prices; conversely, if they expect a decline in carbon prices, they may liquidate their holdings, resulting in price fluctuations. Additionally, market expectations influence enterprises’ investment decisions related to emissions reductions. If long-term increases in carbon prices are anticipated, companies may boost their investments in low-carbon technologies to mitigate future compliance costs. Ultimately, market expectations not only affect short-term price volatility but also shape long-term price trends in the carbon market to a considerable extent.
  • The feedback effect of changes in carbon allowance price on carbon emission volumes.
Carbon allowance price serves as a crucial regulatory instrument within the carbon market, influencing not only the trading behavior of enterprises but also generating feedback effects on overall carbon emissions, as illustrated in Figure 7. An increase in carbon prices may incentivize enterprises to expedite their emissions reduction efforts, whereas fluctuations in carbon prices can induce more cautious decision-making regarding emissions reductions among companies.
As carbon prices continue to rise, the cost of carbon emissions for enterprises increases, directly promoting the adoption of low-carbon technologies and the optimization of industrial structures. In the Guangdong carbon market, high-carbon-emission industries such as steel and electricity have accelerated energy-saving renovations and technological upgrades in response to rising carbon prices. Some enterprises have reduced carbon emission intensity by improving energy utilization efficiency, thereby decreasing the demand for carbon allowances, which results in a suppressive effect of carbon prices on emissions. However, if carbon prices rise too rapidly, enterprises may face excessive short-term emission reduction pressures, negatively impacting their production and operations and potentially triggering market fluctuations. Therefore, reasonable control of carbon price volumes and the assurance of stable carbon market operations are crucial for achieving long-term emission reduction targets.
The impact of carbon price fluctuations on enterprises’ carbon emission decisions is intricate. In situations of significant market volatility, some enterprises may opt to delay carbon reduction investments to mitigate the operational pressures arising from short-term cost increases. During the initial phase of the national carbon market’s launch, some enterprises chose to curtail trading rather than actively pursue emission reduction measures, primarily due to uncertainty regarding carbon price trends. This, to some extent, weakened the regulatory impact of the carbon market. Thus, stabilizing expectations within the carbon market and minimizing the magnitude of carbon price fluctuations is essential for enhancing the market’s regulatory effectiveness.
(2)
Empirical test results
In order to further verify the linkage mechanism between carbon emissions and carbon allowance price, this study selects the data of carbon emissions and carbon allowance price of Shanghai from 2013 to 2024 and constructs the Vector Autoregressive (VAR) model to carry out empirical research.
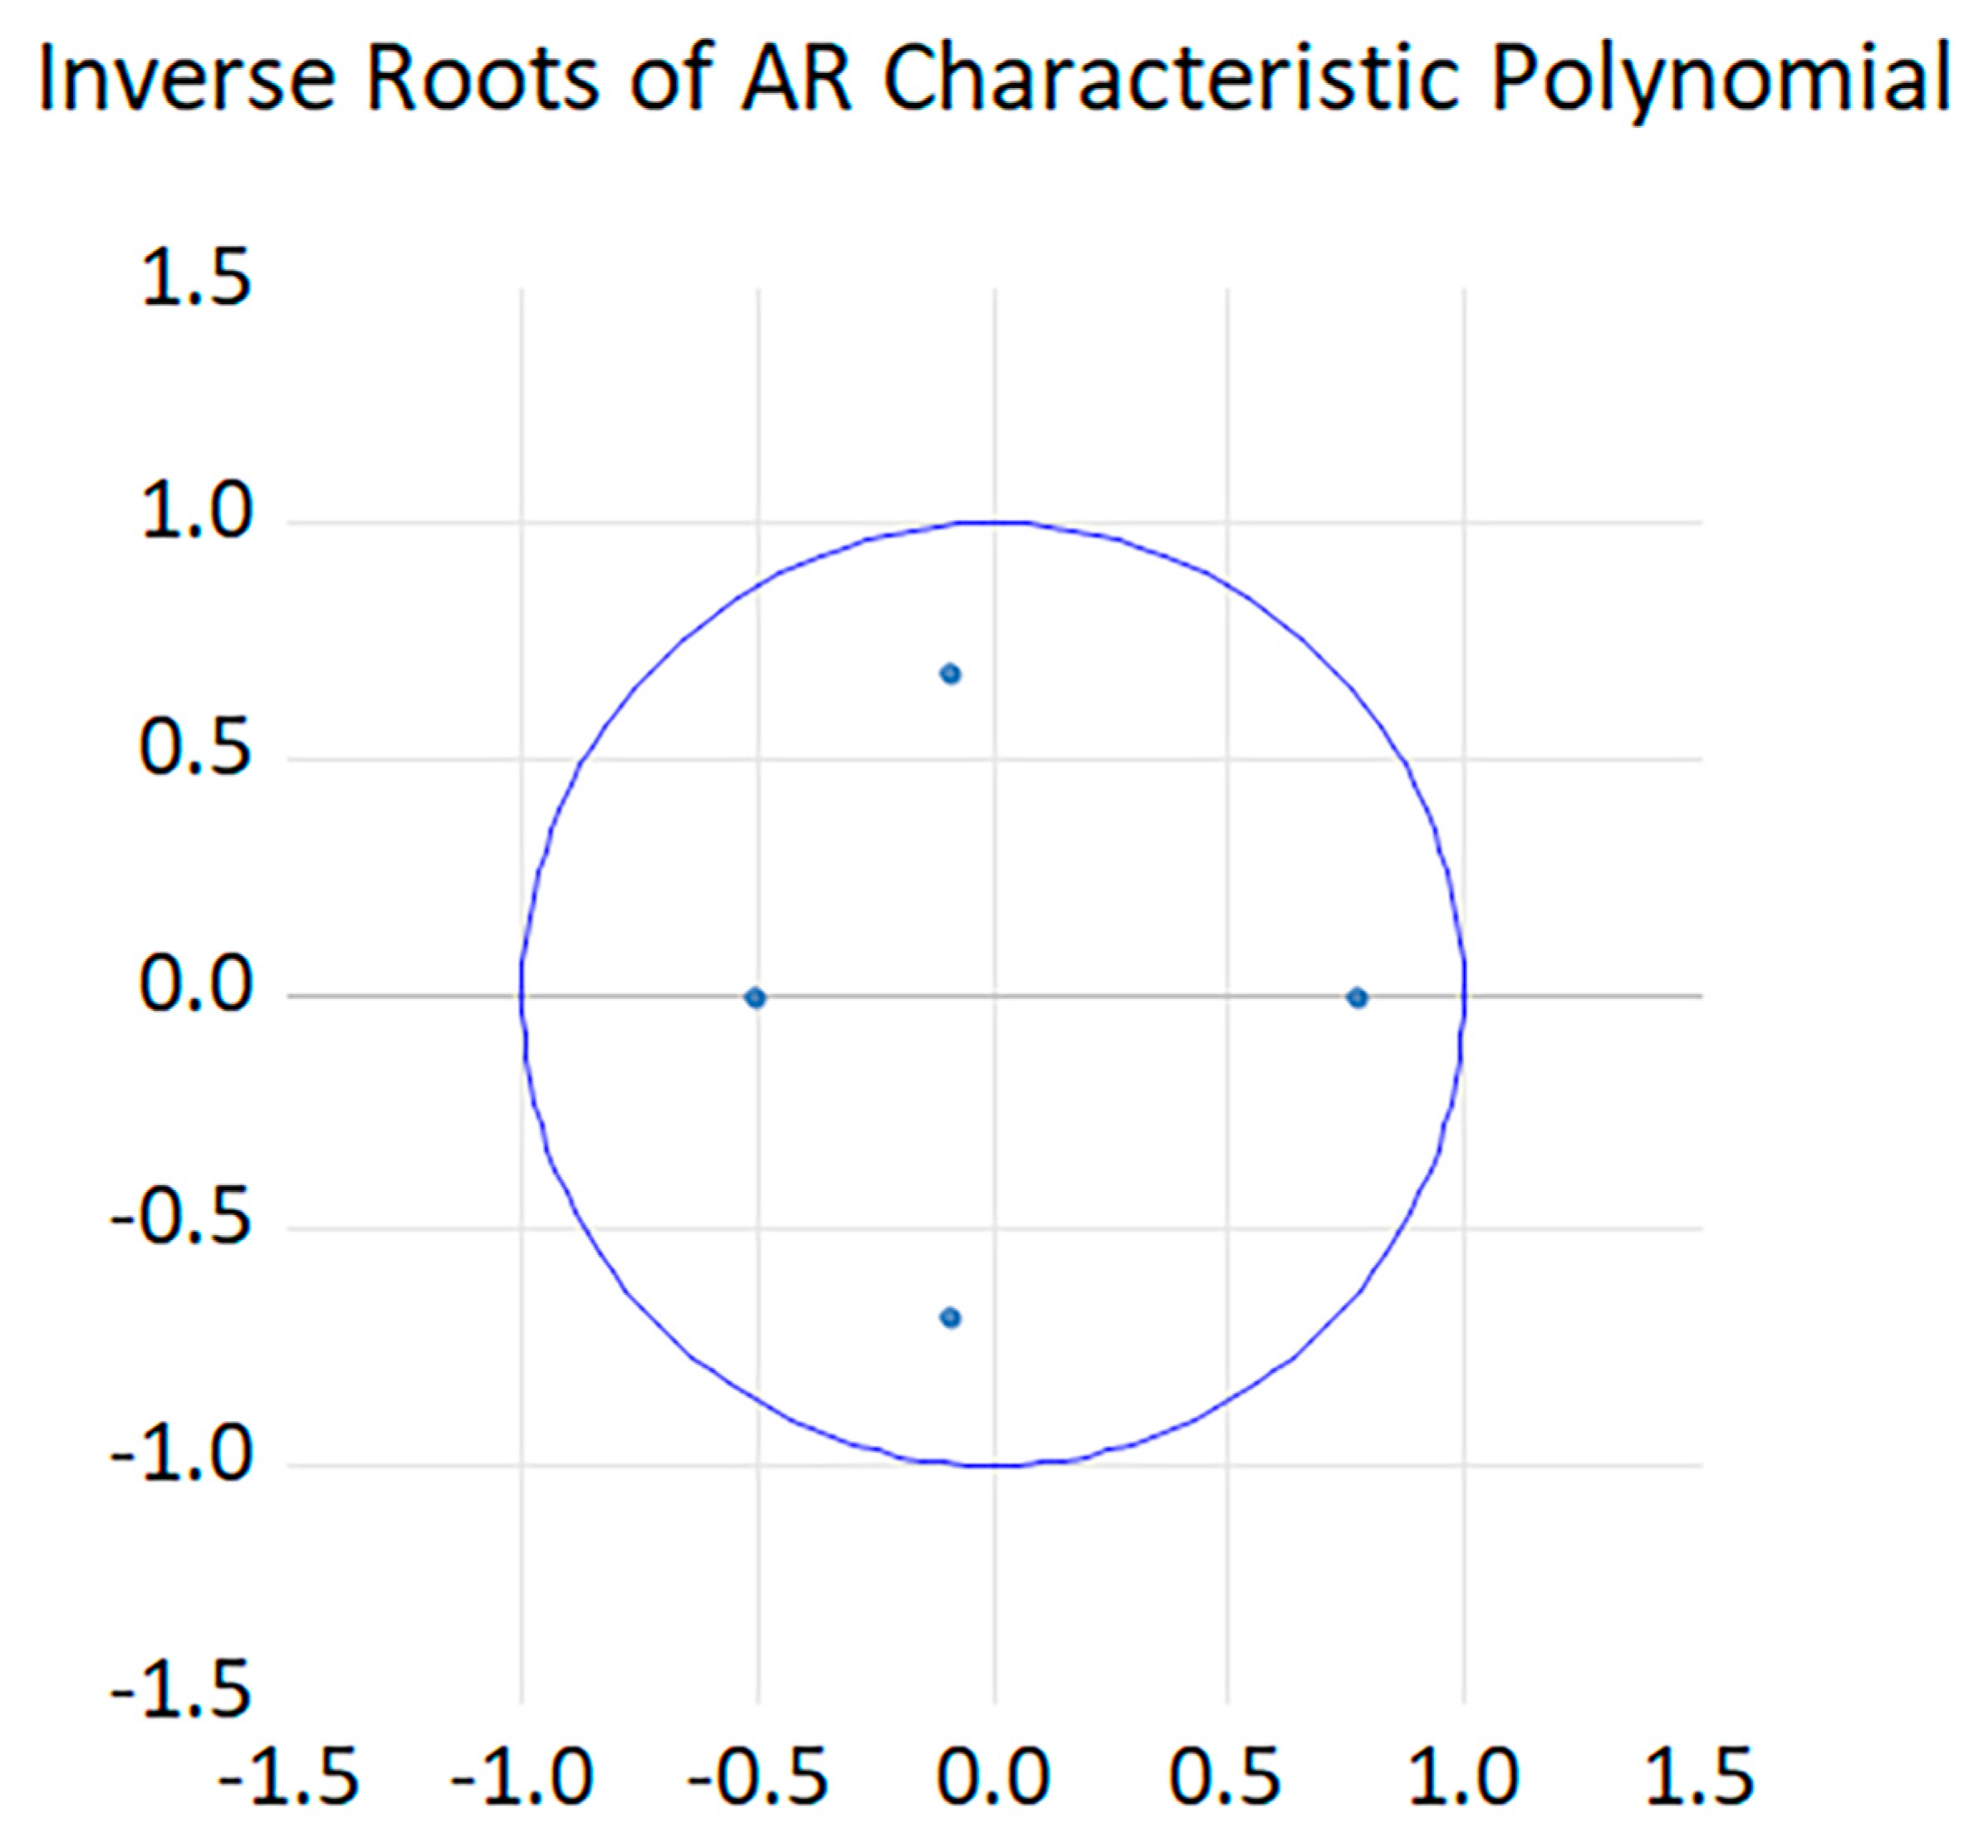
First, the VAR model is constructed after the smoothness test of the variables, and the inverse root plots of the AR characteristic polynomials, as shown in Figure 8, are used to test the model stability. All characteristic roots are located within the unit circle, indicating that the model is stable and feasible.
Subsequently, a variance decomposition analysis is conducted to explore the explanatory structure between carbon emissions and carbon prices. The results of the decomposition are shown in Figure 9, which shows that the explanatory ability of carbon allowance price to the fluctuation of carbon emission increases period by period: it is about 30% in the first period and then rises to more than 60% after the fifth period, which indicates that the change in carbon price plays a more and more important role in the fluctuation of carbon emission. Correspondingly, the degree of explanation of carbon emissions on carbon price fluctuations reaches more than 50% in the first period and remains stable in the later period, reflecting the continuous influence of carbon emission levels on price expectations in the carbon market. This result suggests a strong bi-directional explanatory relationship between the two.
To further elucidate the dynamic transmission mechanism, this paper conducts a shock response analysis. As illustrated in Figure 10, when the carbon price experiences a positive shock, carbon emissions exhibit a negative response in the first period, reach their maximum inhibitory effect in the second to fourth periods, and subsequently level off. This trend indicates that an increase in carbon prices can effectively inhibit carbon emission behavior, demonstrating the efficacy of the carbon market price mechanism in regulating enterprises’ emission reduction activities and validating the carbon price feedback effect mechanism proposed in the theoretical framework. Conversely, when carbon emissions undergo positive shocks, the carbon price begins to rise in the second period and gradually declines in the subsequent periods. This outcome aligns with the mechanism whereby carbon emissions influence the supply and demand for carbon allowances, thereby driving up the carbon price, as outlined in the theoretical section. Furthermore, fluctuations in carbon emissions positively impact carbon prices by shaping market expectations regarding future quota constraints, reflecting the dual mechanism of supply, demand, and expectations within the carbon market.
In summary, there is a significant linkage mechanism between the carbon allowance price and carbon emissions in Shanghai, and the carbon price can not only guide the emission reduction behavior but also be affected by the fluctuation of emission level. As one of the regions with more complete trading mechanisms in the domestic pilot market, Shanghai’s carbon trading mechanism is more mature, and its data quality and market activity are at the forefront of the pilot cities. Its carbon emission behavior is more sensitive to the feedback of carbon price, which can better reflect the operating characteristics of the market mechanism. Therefore, taking Shanghai as an example to carry out impulse response and variance decomposition analysis helps to reveal the linkage mechanism between carbon emissions and carbon allowance price and also provides valuable experience reference for the improvement of the national carbon market.

5. Discussion and Application

Currently, China’s carbon market is undergoing continuous improvement, necessitating further optimization of both carbon emission management and carbon trading mechanisms. Given the spatio-temporal evolution characteristics of carbon emissions and carbon allowance prices, along with the linkage mechanisms between the two, it is essential to employ a combination of market mechanisms, policy regulation, and regional coordination to enhance the stability and effectiveness of the carbon market, thereby meeting the goals of carbon peak and carbon neutrality, helping to achieve green, low-carbon, and sustainable development. More specific policy recommendations are as follows:
To address the spatio-temporal evolution characteristics of carbon emissions, it is crucial to strengthen the control of total carbon emissions and promote regional collaborative governance. Spatially, carbon emissions are concentrated in regions with well-developed energy and manufacturing industries, warranting the establishment of a benefit compensation mechanism for carbon allowance trading among regions. This can guide high-emission regions to purchase carbon quotas from low-emission regions, encouraging low-carbon regions to achieve carbon reduction benefits through technology exports. Temporally, the cyclical fluctuations in carbon emissions require improvements to the dynamic regulatory mechanisms of the carbon market. A rolling adjustment mechanism for carbon quotas should be implemented, allowing for dynamic adjustments in total quotas based on economic cycles and emission volume changes to prevent drastic market fluctuations. It can also strengthen the role of green financial tools in carbon emission reduction by guiding investment in low-carbon technologies, restricting the financing channels of high-carbon industries, gradually compressing the living space of high-emission industries, promoting the rapid development of green and low-carbon industries, and realizing a “win–win” situation for economic development and carbon emission reduction.
Regarding the spatio-temporal evolution of carbon allowance prices, further refinement of the market pricing mechanism is necessary to enhance market liquidity and price discovery capabilities. Prices within China’s carbon market are significantly affected by policy regulation, and the activity of market trading requires improvement. It is advisable to gradually decrease administrative intervention to increase the flexibility of market-driven pricing. First, a price stability mechanism should be introduced, establishing upper and lower limits for carbon prices. In instances of excessively low market prices, carbon allowances can be retained; conversely, when prices are excessively high, reserved allowances should be released to mitigate price fluctuations. Second, financial institutions and enterprises should be encouraged to actively participate in the carbon market. Utilizing derivative trading tools, such as carbon futures and options, can bolster market depth and improve the stability and predictability of carbon prices. Third, enhancing the transparency of carbon market information is vital by improving the monitoring, reporting, and verification systems for carbon emissions data, ensuring that market participants can promptly access information regarding carbon price changes, thereby reducing market uncertainty.
With regard to the linkage mechanism between carbon emissions and prices, it is necessary to reinforce policy synergy to promote the organic integration of market and administrative regulation. The operational mechanism of the carbon market establishes a dynamic feedback relationship between carbon emissions and carbon prices, necessitating the development of a scientific policy intervention framework. First, different regions should be encouraged to pilot hybrid policy tools that integrate carbon taxes with the carbon market. Carbon taxes should be introduced in high-emission industries to increase emissions costs, enabling enterprises to optimize their emission reduction pathways through the carbon trading market. Second, differentiated quota management by industry should be actively promoted, with specific emission reduction targets set for sectors such as electricity, steel, and cement to facilitate technological upgrades in high-carbon industries and accelerate the development of low-carbon sectors. Third, collaboration with the energy market should be strengthened, integrating carbon markets with renewable energy subsidy policies to enhance the market competitiveness of low-carbon energy, ultimately promoting the optimization and upgrading of the energy structure and fundamentally promoting the optimization of China’s energy structure and low-carbon transition.

6. Conclusions

This study investigates the spatiotemporal evolution characteristics of China’s carbon emissions and carbon allowance prices, as well as the mechanisms linking the two. The primary findings can be summarized as follows:
First, the volume of carbon emissions in China exhibits stage-specific fluctuations over time, with an overarching trend closely associated with economic growth and industrial restructuring. Spatially, carbon emissions show significant regional agglomeration effects, characterized by relatively low carbon emission intensity in the eastern coastal regions and rapidly increasing emissions in the central and western regions.
Second, the carbon allowance prices have substantial differences across various carbon trading pilot markets, with spatial distributions reflecting certain regional linkage characteristics. However, the mechanisms of price transmission between these markets are still inadequate. Additionally, a degree of linkage exists between carbon emissions and carbon allowance prices, indicating that variations in carbon emissions can influence price fluctuations, while price signals can have feedback effects on enterprises’ carbon emission behaviors.
The contributions of this study primarily manifest in three aspects: First, this study systematically characterizes the temporal and spatial evolution of carbon emissions in China and extends the analysis to the prices of carbon allowance. It reveals the regional characteristics and heterogeneity of carbon market development from a pricing perspective, a viewpoint that is rarely addressed in the existing literature. Second, it thoroughly explores the interactive mechanism between carbon emissions and carbon allowance prices, indicating a potential bidirectional relationship where changes in carbon emissions influence carbon price fluctuations, while conversely, price signals also affect corporate carbon emission behaviors. This exploration provides new insights for understanding the operational logic of the carbon market. Third, by integrating microdata from multiple carbon trading pilots in China, this research analyzes market disparities across different regions and, in the context of policies such as green finance, offers practical policy recommendations for constructing a unified national carbon market.
As the national carbon market advances, future research could further explore the impact of market integration on regional carbon price fluctuations. Additionally, more sophisticated econometric models could be employed to investigate the determinants of carbon allowance prices and the mechanisms through which market expectations influence carbon prices. Furthermore, carbon trading behaviors across different industries may exhibit significant heterogeneity, suggesting that future analyses could refine industry-level studies to enhance the policy guidance value of this research.

Author Contributions

G.Q.: put forward the idea and main framework of the paper, provided relevant theoretical guidance, and polished the main content and framework of the paper; C.G.: wrote the main content of the paper, completed the model construction and empirical analysis, and put forward conclusions and suggestions; J.C.: supplemented the model construction method and optimized the suggestion part. All authors have read and agreed to the published version of the manuscript.

Funding

This research received no external funding. The APC was funded by the authors.

Institutional Review Board Statement

Not applicable.

Informed Consent Statement

Not applicable.

Data Availability Statement

The data presented in this study are available on request from the corresponding author.

Conflicts of Interest

The authors declare no conflicts of interest.

References

  1. Wang, Y.X.; Yu, Z.; Huang, H.Q.; Li, S.W.; Dong, M.Q.; Wang, P.F.; Wang, D. Analysis of the Spatiotemporal Evolution and Driving Factors of Carbon Emissions in China’s Thermal Power Industry. J. Environ. Pollut. Control 2024, 46, 1662–1668+1678. [Google Scholar]
  2. Liu, Y.; Yang, X.; Zhang, S.; Du, E.; Li, Y.; Yang, C.; Liu, C.; Zhang, N. A review on carbon emission accounting approaches for the electricity power industry. Appl. Energy 2024, 359, 122681. [Google Scholar] [CrossRef]
  3. Xu, G.Q.; Feng, S.W. Spatiotemporal Evolution Characteristics of Carbon Emissions from Energy Consumption in China’s Thermal Power Industry. Ecol. Econ. 2024, 40, 30–38. [Google Scholar]
  4. Qin, J.; Duan, W.; Zou, S.; Chen, Y.; Huang, W.; Rosa, L. Global energy use and carbon emissions from irrigated agriculture. Nat. Commun. 2024, 15, 3084. [Google Scholar] [CrossRef]
  5. Zhang, X.S.; Nie, D.W.; Chen, Z.Z.; Wang, R.Z.; Su, J. Analysis of the Spatiotemporal Evolution Characteristics and Influencing Factors of Carbon Emissions in the Construction Industry of Western Regions. Environ. Sci. 2024, 1–22. [Google Scholar] [CrossRef]
  6. Ni, G.D.; Fang, Y.Q.; Niu, M.M.; Lv, L.; Song, C.F.; Wang, W.S. Spatial differences, dynamic evolution and influencing factors of China’s construction industry carbon emission efficiency. J. Clean. Prod. 2024, 448, 141593. [Google Scholar] [CrossRef]
  7. Zhou, Y.; Jin, H.; Li, C.; Ding, L. Spatio-temporal patterns and impact mechanisms of CO2 emissions from China’s construction industry under urbanization. Sustain. Cities Soc. 2024, 106, 105353. [Google Scholar] [CrossRef]
  8. Gong, H.X.; Fu, W. The Shift of Transportation Carbon Emission Focus and Its Spatiotemporal Evolution Characteristics in Western Regions. Sci. Technol. Rev. 2024, 1–11. Available online: http://kns.cnki.net/kcms/detail/11.1421.N.20241030.0942.002.html (accessed on 1 June 2025).
  9. Ding, H.; Liu, C. Carbon emission efficiency of China’s logistics industry: Measurement, evolution mechanism, and promotion countermeasures. Energy Econ. 2024, 129, 107221. [Google Scholar] [CrossRef]
  10. Zhang, N.; Sun, F.C.; Hu, Y.L. Research on the Spatiotemporal Evolution, Regional Differences, and Influencing Factors of Carbon Emission Efficiency in the Yangtze River Economic Belt. Resour. Environ. Yangtze River Basin 2024, 33, 1325–1339. [Google Scholar]
  11. Yang, L.Q.; Zhao, R.F.; Kang, L.F.; Liu, F.S.; Ren, X.T. Multi-Scale Analysis of Carbon Emissions and Their Influencing Factors in Gansu Province. Environ. Sci. 2024, 1–18. [Google Scholar] [CrossRef]
  12. Miao, C.; Chen, Z.; Zhang, A. Green technology innovation and carbon emission efficiency: The moderating role of environmental uncertainty. Sci. Total Environ. 2024, 938, 173551. [Google Scholar] [CrossRef] [PubMed]
  13. Mo, H.B.; Wang, S.J. Spatiotemporal Pattern Evolution of Carbon Emissions in County Regions of the Yellow River Basin and the Mechanism of Spatial Effects. Geogr. Sci. 2021, 41, 1324–1335. [Google Scholar]
  14. Xu, J. Study on spatiotemporal distribution characteristics and driving factors of carbon emission in Anhui Province. Sci. Rep. 2023, 13, 14400. [Google Scholar] [CrossRef]
  15. Li, X.; Lin, C.; Lin, M.; Jim, C. Drivers, scenario prediction and policy simulation of the carbon emission system in Fujian Province (China). J. Clean. Prod. 2024, 434, 140375. [Google Scholar] [CrossRef]
  16. Huang, H.; Jia, J.; Chen, D.; Liu, S. Evolution of spatial network structure for land-use carbon emissions and carbon balance zoning in Jiangxi Province: A social network analysis perspective. Ecol. Indic. 2024, 158, 111508. [Google Scholar] [CrossRef]
  17. Xie, B.; Liu, R.; Dwivedi, R. Digital economy, structural deviation, and regional carbon emissions. J. Clean. Prod. 2024, 434, 139890. [Google Scholar] [CrossRef]
  18. Wang, X.; Long, R.; Sun, Q.; Chen, H.; Jiang, S.; Wang, Y.; Li, Q.; Yang, S. Spatial spillover effects and driving mechanisms of carbon emission reduction in new energy demonstration cities. Appl. Energy 2024, 357, 122457. [Google Scholar] [CrossRef]
  19. Schletz, M.; Franke, L.; Salomo, S. Blockchain application for the paris agreement carbon market mechanism–a decision framework and architecture. Sustainability 2020, 12, 5069. [Google Scholar] [CrossRef]
  20. Wu, Y.Y.; Qi, J.; Xian, Q.; Chen, J.D. Research on the Carbon Reduction Effects of China’s Carbon Market: A Perspective on the Synergistic Effects of Market Mechanisms and Administrative Interventions. China Ind. Econ. 2021, 8, 114–132. [Google Scholar]
  21. Zhang, N.; Pang, J.; Feng, X.Z. Economic Impacts of Introducing a Quota Auction Mechanism in the National Carbon Market: An Analysis Based on the CGE Model. China Environ. Sci. 2022, 42, 1901–1911. [Google Scholar]
  22. Mahapatra, B.; Irfan, M. Asymmetric impacts of energy efficiency on carbon emissions: A comparative analysis between developed and developing economies. Energy 2021, 227, 120485. [Google Scholar] [CrossRef]
  23. Guan, H.S.; Wang, P.; Wang, Q. Research on the Effectiveness of China’s Carbon Emission Trading Market. Financ. Econ. 2020, 11, 8–17. [Google Scholar]
  24. Rannou, Y.; Boutabba, M.A.; Barneto, P. Are Green Bond and Carbon Markets in Europe complements or substitutes? Insights from the activity of power firms. Energy Econ. 2021, 104, 105651. [Google Scholar] [CrossRef]
  25. Lin, B.; Xu, B. A non-parametric analysis of the driving factors of China’s carbon prices. Energy Econ. 2021, 104, 105684. [Google Scholar] [CrossRef]
  26. Qu, G.; Guo, C.; Cui, J. Influencing Factors and Formation Mechanism of Carbon Allowance Prices in Shanghai, China. Sustainability 2024, 16, 9081. [Google Scholar] [CrossRef]
  27. Liu, J.Y.; Yang, F.J.; Li, Y.B. Study on Long-term Factors Affecting the Fluctuations of Carbon Emission Trading Prices in China: Based on Carbon Prices from the Beijing Environment Exchange. Stat. Theory Pract. 2020, 3, 11–16. [Google Scholar]
  28. Chen, M.; Wang, K. The combining and cooperative effects of carbon price and technological innovation on carbon emission reduction: Evidence from China’s industrial enterprises. J. Environ. Manag. 2023, 343, 118188. [Google Scholar] [CrossRef]
  29. Cai, T.J.; Lin, R.H.; Zhang, X. A Comparative Study of Marketization in Carbon Emission Trading between China and Europe: A National Financial Perspective. Res. Financ. Econ. 2023, 38, 127–143. [Google Scholar]
  30. Liu, N.; Song, F.T. Study on the Optimal Emission Reduction Quantity and Equilibrium Price of Carbon Allowance in the Carbon Trading Market. Oper. Res. Manag. 2023, 32, 65–70. [Google Scholar]
  31. Xian, B.T. Assessment of the co-benefits of China’s carbon trading policy on carbon emissions reduction and air pollution control in multiple sectors. Econ. Anal. Policy 2024, 81, 1322–1335. [Google Scholar] [CrossRef]
  32. Adamolekun, G. Carbon price and firm greenhouse gas emissions. J. Environ. Manag. 2024, 349, 119496. [Google Scholar] [CrossRef] [PubMed]
  33. Digitemie, W.N.; Ekemezie, I.O. Assessing the role of carbon pricing in global climate change mitigation strategies. Magna Sci. Adv. Res. Rev. 2024, 10, 22–31. [Google Scholar] [CrossRef]
  34. Feng, X.; Zhao, Y.; Yan, R. Does carbon emission trading policy has emission reduction effect?—An empirical study based on quasi-natural experiment method. J. Environ. Manag. 2024, 351, 119791. [Google Scholar] [CrossRef]
  35. Green, J.F. Does carbon pricing reduce emissions? A review of ex-post analyses. Environ. Res. Lett. 2021, 16, 043004. [Google Scholar] [CrossRef]
Figure 1. Research framework for the spatio-temporal evolution of carbon emissions and carbon allowance price in China.
Sustainability 17 05341 g001
Figure 2. Spatio-temporal evolution of carbon emissions in Chinese counties from 2005 to 2020.
Sustainability 17 05341 g002
Figure 3. Moran scatter plot of carbon emissions in Chinese counties from 2005 to 2020.
Sustainability 17 05341 g003
Figure 4. Box plot of carbon allowance prices in eight pilot areas from 2014 to 2023.
Sustainability 17 05341 g004
Figure 5. Distribution of carbon allowance prices in eight pilot areas from 2014 to 2023: (a) 3D area chart; (b) 3D line chart to illustrate the same dataset from a sequential trend perspective.
Sustainability 17 05341 g005
Figure 6. The impact mechanism of carbon emission changes on carbon allowance prices. The “+” symbol represents the combination of initial quota allocation and secondary market trading, which determine the total amount of carbon emissions.
Sustainability 17 05341 g006
Figure 7. Feedback effects of carbon allowance price changes on carbon emissions. Colors denote: Green—long-term positive outcome (e.g., market stability); Red—potential negative outcome (e.g., increased market volatility); Blue—government intervention or regulation.
Sustainability 17 05341 g007
Figure 8. AR root test results. Dots represent inverse characteristic roots. All roots must lie inside the unit circle (dashed blue line) for model stability.
Sustainability 17 05341 g008
Figure 9. Variance decomposition of AR root test results. (a) Degree to which PSH explains CSH. (b) Degree to which CSH explains PSH. PSH is the price of carbon credits in Shanghai; CSH is the carbon emissions in Shanghai.
Sustainability 17 05341 g009
Figure 10. Impulse response diagram. (a) Response of CSH to PSH. (b) Response of PSH to CSH. PSH is the price of carbon credits in Shanghai; CSH is the carbon emissions in Shanghai.
Sustainability 17 05341 g010
Disclaimer/Publisher’s Note: The statements, opinions and data contained in all publications are solely those of the individual author(s) and contributor(s) and not of MDPI and/or the editor(s). MDPI and/or the editor(s) disclaim responsibility for any injury to people or property resulting from any ideas, methods, instructions or products referred to in the content.

