Article

Optothermal Modeling for Sustainable Design of Ultrahigh-Concentration Photovoltaic Systems

1
Mechanical and Energy Engineering Department, Imam Abdulrahman Bin Faisal University, Dammam 31441, Saudi Arabia
2
Laboratory of Thermal and Energy Systems Studies (LESTE), National Engineering School of Monastir, University of Monastir, Monastir 5000, Tunisia
*
Author to whom correspondence should be addressed.
Sustainability 2025, 17(12), 5262; https://doi.org/10.3390/su17125262 (registering DOI)
Submission received: 18 April 2025 / Revised: 23 May 2025 / Accepted: 4 June 2025 / Published: 6 June 2025

Abstract

:
The development of ultrahigh-concentration photovoltaic (UHCPV) systems plays a pivotal role in advancing sustainable solar energy technologies. As the demand for clean energy grows, the need to align concentrated photovoltaic (CPV) system design with high-efficiency solar cell production becomes critical for maximizing energy yield while minimizing resource use. Despite some experimental efforts in UHCPV development, there remains a gap in integrating Fresnel lens-based systems with the comprehensive thermal modeling of key components in improving system sustainability and performance. To bridge this gap and promote more energy-efficient designs, a detailed numerical model was established to evaluate both the thermal and optical performance of a UHCPV system. This model contributes to the sustainable design process by enabling informed decisions on system efficiency, thermal management, and material optimization before physical prototyping. Through COMSOL Multiphysics simulations, the system was assessed under direct normal irradiance (DNI) ranging from 400 to 1000 W/m2. Optical simulations indicated a high theoretical optical efficiency of ~93% and a concentration ratio of 1361 suns, underscoring the system’s potential to deliver high solar energy conversion with minimal land and material footprint. Moreover, the integration of thermal and optical modeling ensures a holistic understanding of system behavior under varying ambient temperatures (20–50 °C) and convective cooling conditions (heat transfer coefficients between 4 and 22 W/m2.K). The results showed that critical optical components remain within safe temperature thresholds (<54 °C), while the receiver stage operates between 78.5 °C and 157.4 °C. These findings highlight the necessity of an effective cooling mechanism—not only to preserve system longevity and safety but also to maintain high conversion efficiency, thereby supporting the broader goals of sustainable and reliable solar energy generation.

1. Introduction

Concentrated photovoltaic (CPV) systems are currently the focus of research as they are able to accomplish the highest cell efficiency amongst all photovoltaic (PV) technologies. Combining an achromatic silicon-on-glass (SOG) Fresnel lens of 95% transparency and the four-junction solar cell of 46% efficiency has allowed the CPV system to achieve 43% electricity conversion efficiency [1]. SOG Fresnel lenses are used in CPV system designs due to their affordability and high optical efficiency [2], ranging between 80 and 90% [3]. The curing process of silicon is achieved through the injection process of uncured optical silicon into a rigid glass and curing at a certain temperature level. This process of injecting silicon has proven to be affordable and highly scalable, permitting large dimension lenses. SOG Fresnel lens efficiency depends on the materials they are composed of, where silicon offers high precision and minimizes the inactive area amongst facets due to draft angles.
However, SOG Fresnel lenses suffer optically from the geometrical defects of the silicon grooves and edges during the manufacturing injection process. The refractive index of silicon materials depends on the lens temperature, as a higher temperature elongates the focal distance and maximizes the focal spot size compared to its optimum size. Further, the attainable maximum concentration ratio for SOG is challenged by the sun divergence angle of ±0.27° and the chromatic aberration, resulting in a wider focal spot. Two materials have been integrated to fabricate a Fresnel lens named Achromatic Doublet on Glass (ADG) to overcome the chromatic aberration effect, resulting in maximizing the concentration ratio theoretically concerning an identical SOG [4]. However, ADG design is currently not commercially available. As a result, the practice of using a mirror as a secondary reflective stage is an alternative approach to achieve an ultrahigh (UH) concentration ratio, which also overcomes the limits of achromatic aberration beyond 1000 suns incorporated with the SOG Fresnel lens [5,6].
Multiple optical interfaces need to be incorporated into a singular system; however, the optical performance of every optical interface, besides the errors in the manufacturing and alignment, considerably influences the overall optical output. Therefore, the system design should aim for a higher geometrical concentration ratio design anticipating high optical losses. Karp et al. [7] proposed a method based on a planar micro-optic solar collector to concentrate solar irradiance up to 2500 suns, assuming an optical efficiency of no less than 80%. Coughenour et al. [8] presented a high concentration dish coupled with Kohler optics, offering a concentration ratio of 1000 suns with an optical efficiency of 80%. Dreger et al. [9] designed a mini-Cassegrain CPV system to concentrate sun rays by a geometrical concentration ratio of 1037 suns into a receiver size of 1 mm2, achieving an effective concentration ratio of 800 suns with an optical efficiency of 80%. Ferrer-Rodriguez et al. [10] designed a Cassegrain–Koehler UHCPV with a geometrical concentration ratio of up to 6000 suns and an optical efficiency of 80%, employing ray-tracing simulations. In this study, a one-cell prototype with a geometrical concentration ratio of 3015 suns was characterized indoors to effectively achieve 938 suns, corresponding with an optical efficiency of 31%. Shanks et al. [2] designed a UHCPV system with a geometrical concentration ratio of 5800 suns based on four Fresnel lenses as a primary optical interface that concentrates sun rays into a single central solar cell. Two simulation approaches were conducted, one with ADG grouped with a ~ 97 % reflective mirror and another with a standard SOG Fresnel lens and a reflective mirror. This resulted in an optical efficiency between 75 and 55%, which translates to an optical concentration ratio of no less than 3000 suns. This last study is promising due to the use of commercially available SOG Fresnel lens primaries and flat reflector secondaries, but further studies are required to authenticate the UHCPV system. These should include the mechanical design and manufacturing aspects, optothermal numerical simulations to observe ultrahigh-concentration photovoltaic (UHCPV) system capacities and limitations, and indoor and outdoor testing to experimentally validate the ultrahigh system design. Recent studies have focused on Multiphysics simulation techniques for evaluating CPV systems under realistic environmental conditions [11]. These include parametric investigations of cooling technologies, concentration geometry optimization, and durability under outdoor scenarios [12]. As highlighted by Stsepuro et al. [13], the integration of sustainability metrics and adaptive design principles into CPV research is vital for the deployment of next-generation solar concentrators. Additionally, the increasing relevance of hybrid systems with passive and active cooling underscores the need for holistic optothermal modeling frameworks.
Increasing the concentration ratio on the surface of the multijunction solar cell tends to increase the solar cell conversion efficiency, reduce the necessary size of the solar cell, and reduce the cost share of the photovoltaics to the whole system investment. However, an affordable, low-efficiency solar cell is still preferred over the CPV, regardless of its higher efficiency and lower utilization of space [14,15,16,17]. This increase in cell conversion efficiency for the multijunction solar cell is challenged by the level of the concentration ratio and its operating temperature. Some multijunction solar cells exhibit an increase in the cell efficiency up to 1000 suns, at which the cell efficiency drops significantly as resistive loss dominates [18,19]. The temperature impact is substantial at UH concentrations; a high-performing cooling mechanism is necessary. For instance, the multijunction Azur Space assembly for Enhanced Fresnel Assembly (EFA) (Model 3C44A—5.5 × 5.5 mm2) presents the lowest cell conversation efficiency of about 39.5% at 1500 suns with the requirement of not having an operating temperature exceeding 110 °C on the cell junction and a maximum temperature not exceeding 175 °C on the multijunction assembly [20]. A variety of attempts have been made to design and investigate different passive cooling configurations to maintain the temperature of the solar cell, but with the limitation of preserving the cell at the safe operating temperature at a particular concentration factor [21,22,23,24,25,26]. Recently, two papers have discussed the performance of flat-plate heat sinks [27] and different microscale pin-fin configurations for an ultrahigh concentration ratio up to 10,000 suns. The latter study found that the coupling of a microscale pin-fin with a flat-plate heatsink can allow the cell to operate safely at a concentration ratio of up to 12,000 suns, but only with the solar cell size not exceeding 1 × 1   m m 2 . Although the achieved level of concentration is promising, such a cell size will surely challenge the system’s alignments and tracking accuracy.
In this paper, an optothermal numerical investigation is performed to evaluate the system’s performance and anticipate the temperature limits in correlation with optical input power and concentration ratio. Different levels of direct normal irradiance (DNI), ranging from 400 to 1000 W/m2 in 100 W/m2 increments, were simulated to reflect a wide array of geographic and climatic conditions, supporting the design of regionally adaptable and efficient solar energy solutions. The thermal model further incorporates the influence of wind and ambient temperature through natural convective heat transfer coefficients (4–22 W/m2.K) and outdoor temperatures (20 °C to 50 °C), providing valuable insight into thermal regulation strategies across diverse environmental contexts. By correlating thermal behavior with optical input power and concentration ratio, the model enables the prediction of operational temperature thresholds that directly impact energy efficiency, component lifespan, and overall system sustainability.
The remainder of the paper is structured as follows: Section 2 describes the optothermal modeling framework used for simulating the UHCPV system. Section 3 outlines the material geometry and thermophysical properties used in the simulations. Section 4 provides the governing equations for optical and thermal modeling. Section 5 discusses the boundary conditions for both the optical and thermal models. Section 6 presents the validation of the numerical model. Section 7 discusses the results, highlighting temperature and irradiance behavior across optical elements. Finally, Section 8 summarizes key conclusions and recommendations.

2. Optical and Thermal Modeling for UHCPV System

The design of the UHCPV system needs to be investigated numerically to optically and thermally estimate the performance. The modeling results can build a clear understanding of the achieved level of concentration ratio in comparison to the geometrical level and the resultant temperature profile over each optical interface. The modeling can help further interpret the system under an expected range of environmental conditions, given the optical dimensions and configurations within the system design and material properties. An optothermal numerical model was established using COMSOL Multiphysics software version 6.2. The study was carried out using a bidirectionally coupled ray tracing. This type of study requires the rays to be traced first, and then heat transfer in a solid model can be calculated. The amount of deposited ray power in a domain can generate enough heat to considerably influence the geometry, usually according to the temperature level.

3. Material Geometry and Thermophysical Properties

The optical and thermal performance of a UHCPV system is reliant on the selected material and its surface formation and dimensions. In this study, ray-tracing models were built based on three optical interfaces subsequent to the primary refractive optic (silicon-on-glass (SOG) Fresnel lens). The Fresnel lens was designed in SOLIDWORK software, taking into consideration the actual plane of the active area of 21 cm × 21 cm and its produced focal length of 42 cm. This focal length was identified experimentally under a WACOM AAA-rated solar simulator capable of a constant solar irradiance of 1000 W/m2 at an AM1.5 spectrum coincidence. The identification of the focal length helps to define the position of every optical stage simultaneously for the optimum optical and thermal output. The simulative positioning for the incorporated optics in the UHCPV system will be applied experimentally, especially during the stage of optical adjustment and alignment. Although the scope of this work is not to design the Fresnel lens, the Fresnel lens geometry details are provided in Table 1.
The secondary, tertiary, and receiver stage materials were modeled as circular aluminum flat plates. Figure 1 shows the detailed dimensions of optics, location, and the ray paths. In addition, the successful movement of the rays between the optics also depends on the focal length produced from the Fresnel lens, which sets the longest path for the rays. As rays reflect from one optical stage to another, the concentration ratio increases with relatively homogeneous flux, and the divergence angle diminishes [28]. Determining the distance between optics and moving optics by a millimeter or an angle has a considerable influence on the results. Repeated alignment adjustments were carried out until the model revealed the maximum optical simulated concentration ratio at which the distances between optics were ascertained. It should be noted that alignment such as this, for ultrahigh concentration levels, is very time-consuming, and future manufacturing will need to incorporate accurate placement and testing technology. The optimum distance was found to be 24 cm between the Fresnel lens and the secondary optic, 16 cm between the third central reflective optic and the Fresnel lens, and a gap of 2.5 cm between the third central mirror and the central receiver. The defined positioning of the optics was used to carry out both the optical and thermal analysis, as shown in Figure 1.
The system materials were added from the optical material library in COMSOL Multiphysics software. The selected material for the optics utilizes an optical dispersion model specified by the producer to identify the refractive index. Once the optics materials are assigned, the optical dispersion model coefficients are automatically loaded. The Fresnel lens was selected as silica glass material, and subsequent optics were selected to be aluminum.
It is necessary to recognize that the optical refractive index (n) given by the manufacturers is more likely to be correlated to air at a specific pressure and temperature. Thus, a reference temperature (Tr) and pressure (Pr) were selected in the model to measure the refractive index. Since the reference pressure is absolute, the refractive index conversion from relative (nr) to absolute (na) is calculated based on the refractive index of air (nair), as shown in Equation (1).
n a = n r × n a i r
To compensate for ( n a i r ) , the refractive index of air needs to be solved as a function of wavelength ( λ ) , temperature ( T ) , and pressure (P), as shown in Equation (2):
n a i r λ ,   T ,   P = n a i r , s   λ 1   1 + 3.4785 × 10 3   T r T s t   × P r P s t
where n a i r , s is the refractive index of air at standard temperature and pressure, T s t is the standard temperature at 15   ° C , and P s t is the standard pressure at 101.325   P a . However, the n a i r , s as a function of λ is computed based on Equation (3).
n a i r , s   λ = 1 + 10 8 ×   6432.8 + 2,949,810 λ 2 146 λ 2 1 + 25,540 λ 2 41 λ 2 1
The thermal properties for the materials assigned to domains are listed in Table 2, which is necessary to find a solution for the heat transfer in the solid model.

4. The Governing Equations

To model the effect of the sun rays’ concentration and then the temperature level on the optics, the model needs to first solve the geometrical optics interface to compute the ray trajectories. Afterwards, the output of the geometrical optics model as a boundary heat source will be used to solve the heat transfer in the solid model to compute the temperature level on the lenses.

4.1. Optical Model

In the ray optics model derived from the electromagnetic module under geometrical optics physics, the ray trajectories are simulated. First-order ordinary differential equations are solved, as shown in Equations (4) and (5):
d q d t = ω k
d k d t = ω q
where q   ( m ) is the ray spot, k   ( r a d / m ) is the wave vector, ω   ( r a d / s ) is the angular frequency, and t   ( s ) is time. In the isotropic medium, k and ω are further correlated as shown in Equation (6):
ω = c   k n   ( q )
where c is the speed of light ( c = 2.99792458 × 10 8 m / s ) and n (dimensionless) is the refractive index.
The geometrical optics interface controls reflection and refraction for the concentrated rays between different media using a deterministic ray-splitting approach. The refracted ray propagation is based on the reflective index of the material, applying Snell’s law, as shown in Equation (7). If the concentrated rays undergo total internal reflection, then no refracted rays are generated, and no secondary rays need to be discharged.
n 1 sin   ( θ 1 ) = n 2 sin   ( θ 2 )
Here, θ 1 and θ 2 denote the angle of incidence and refraction, respectively.
The deposited ray power sub-node computes the total concentrated energy flux on a surface relying on the incident ray’s power, which is assigned for all the subsequent optics, including the Fresnel lens, as shown in Equation (8):
Q s = 1 A i   Q j
where Q s is the heat source ( W / m 2 ) , A i is the surface area ( m 2 ) subjected to the concentrated rays, and Q j is the sum of the amount of power transferred by the ray ( W ) onto the surface area. While the optical model assumes ideal surfaces and perfect alignment, real-world systems inevitably suffer from optical losses due to surface roughness, material defects, alignment tolerances, and scattering effects. Such imperfections, particularly in Fresnel lenses and reflective mirrors, can contribute to optical efficiency losses. Additionally, manufacturing deviations in prism geometry and surface waviness can introduce optical aberrations, reducing focal precision. The current COMSOL model focuses on deterministic ray tracing to estimate an upper-bound optical performance. Future work will incorporate stochastic scattering models and experimentally derived surface loss factors to provide a more conservative and realistic efficiency estimate.

4.2. Thermal Model

In this model, the heat transfer rate on every optical stage is governed based on the energy conservation equation for the steady-state condition, as shown in Equation (9). The heat source term ( Q s ) is based on Equation (8), which was solved in the optical model for the subsequent optics of the Fresnel lens.
Q s = Q c o n d . Q c o n v . Q r a d .
Q c o n d . is the conduction heat transfer, Q c o n v . is the convection heat transfer, and Q r a d . is the radiation heat transfer.
The amount of Q c o n d . through a domain is processed based on Fourier’s law, where the conduction is proportional to the temperature gradient ( T ) ( ° C ) . The proportionality coefficient is the thermal conductivity k   W / m . K .
Q c o n d . =   L k     T
Here, L (m) is the domain thickness and identifies a solution for the conduction heat transfer in three dimensions ( x , y , z ) . The heat transfer rate is influenced by the product of ( L / k ) , which is the material thermal resistance. The thermal conductivity and the thermal resistance are inversely correlated.
The wind speeds and the ambient temperature considerably affect the amount of Q c o n v . . Newton’s law of cooling solves the rate of Q c o n v . considering both the ambient temperature ( T a ) and convective heat transfer coefficient ( h ), which is dependent on the wind speed, as shown in Equation (11):
Q c o n v . =     h   T
where T is between the domain surface temperature and T a .
The level of temperature due to the concentrated solar irradiance encourages the transfer of energy in the process of electromagnetic waves. Q r a d . is governed by Stefan–Boltzmann’s law and is strongly correlated with the temperature of the emitting domain, as shown in Equation (12):
Q r a d .   = ε σ     T s 4 T s u r . 4
where σ is the Stefan–Boltzmann constant 5.67 × 10 8   W / m 2 . K 4 , ε is the emissivity product, T s is the surface temperature, and T s u r . is the surrounding temperature.

5. The Optical and Thermal Model Boundary Conditions

5.1. Optical Model Description

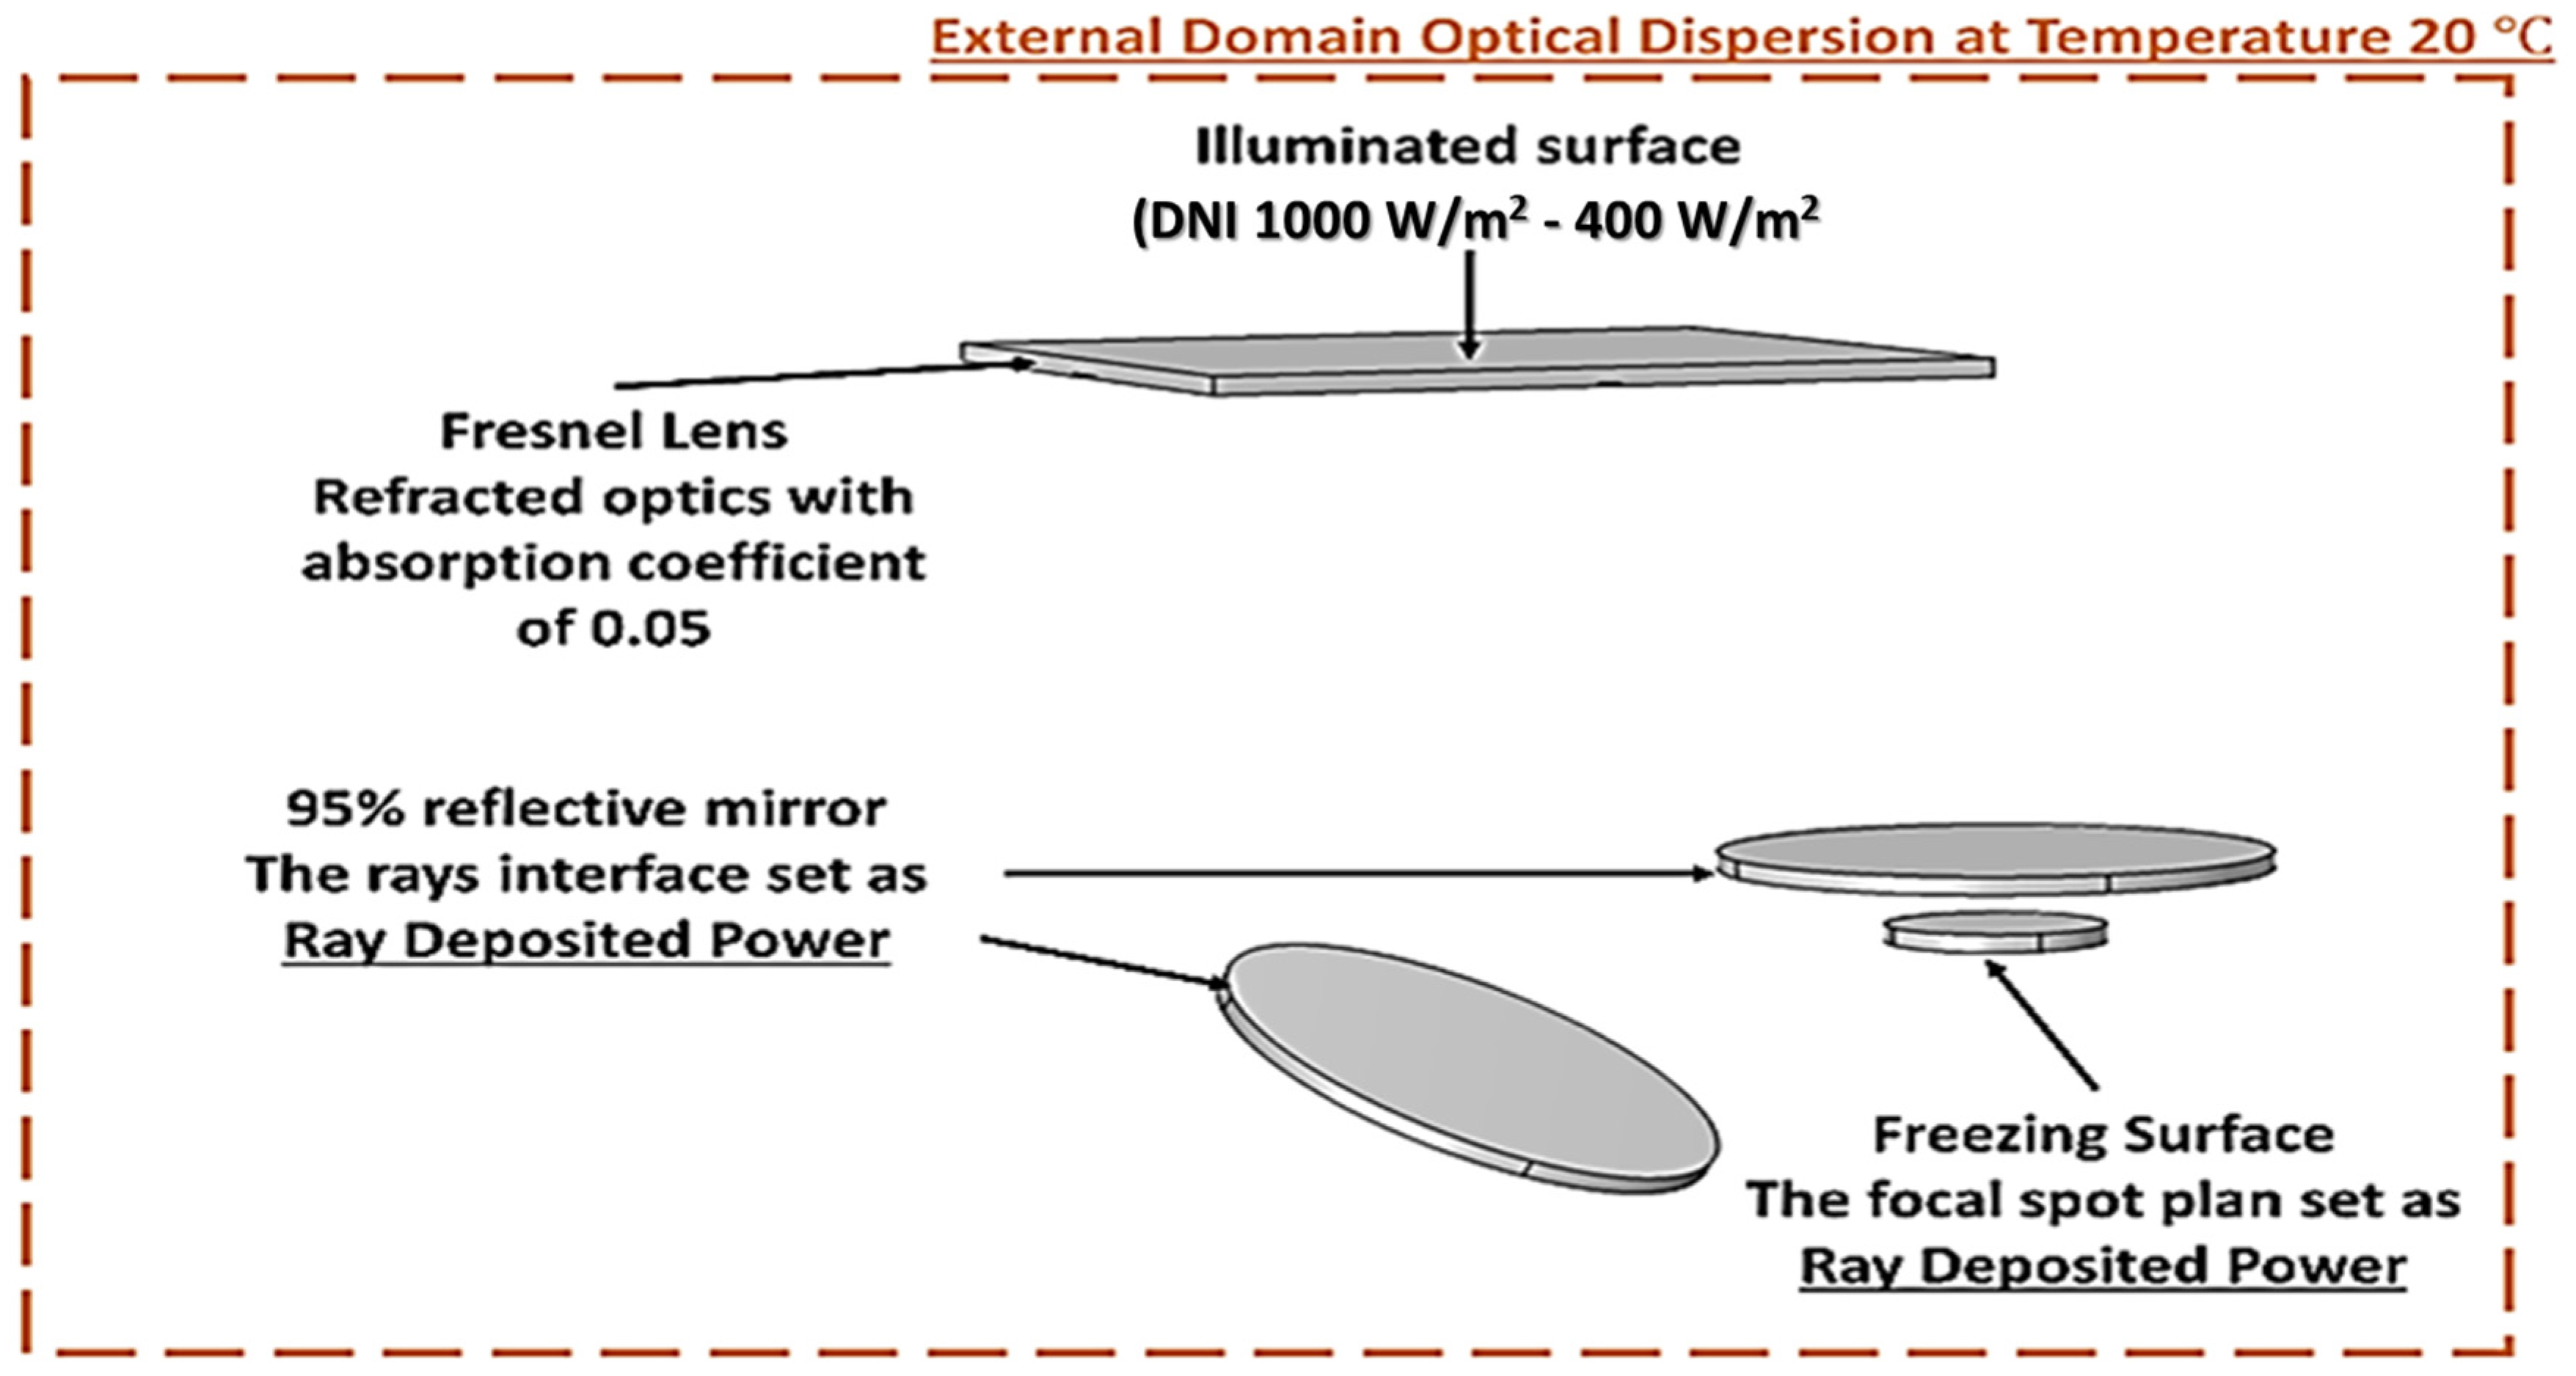
The Fresnel lens domain is selected as an illuminated surface for direct normal irradiance (DNI) in the range of 1000–400   W / m 2 , assuming that the released rays are reflected from an exterior radiation source. The Fresnel lens was established with a transmissivity of 95% and illuminated with 30,000 rays. Both secondary and tertiary reflective optics are established as a specular reflection wall of 95%, meaning the incident angle is equal to the reflection angle. The model was set up to compute both the intensity and power of the concentrated rays on the optics, interfering with the concentrated rays. The heat source calculation is carried out in the secondary and tertiary reflective optical stage, and the receiver uses the deposited ray power function. The receiver is established as a freezing domain. The freezing domain identifies that the ray’s position and vector wave are fixed at the point of immediate contact to the domain, where the ray intensity is normally recovered. The optical dispersion for the external domain is kept at the initial temperature of 20 °C. The optical model assumes that there is no chromatic aberration effect and that the optical dispersion of the SOG Fresnel lens is negligible. Figure 2 details the boundary conditions for the optical model.

5.2. Thermal Model Description

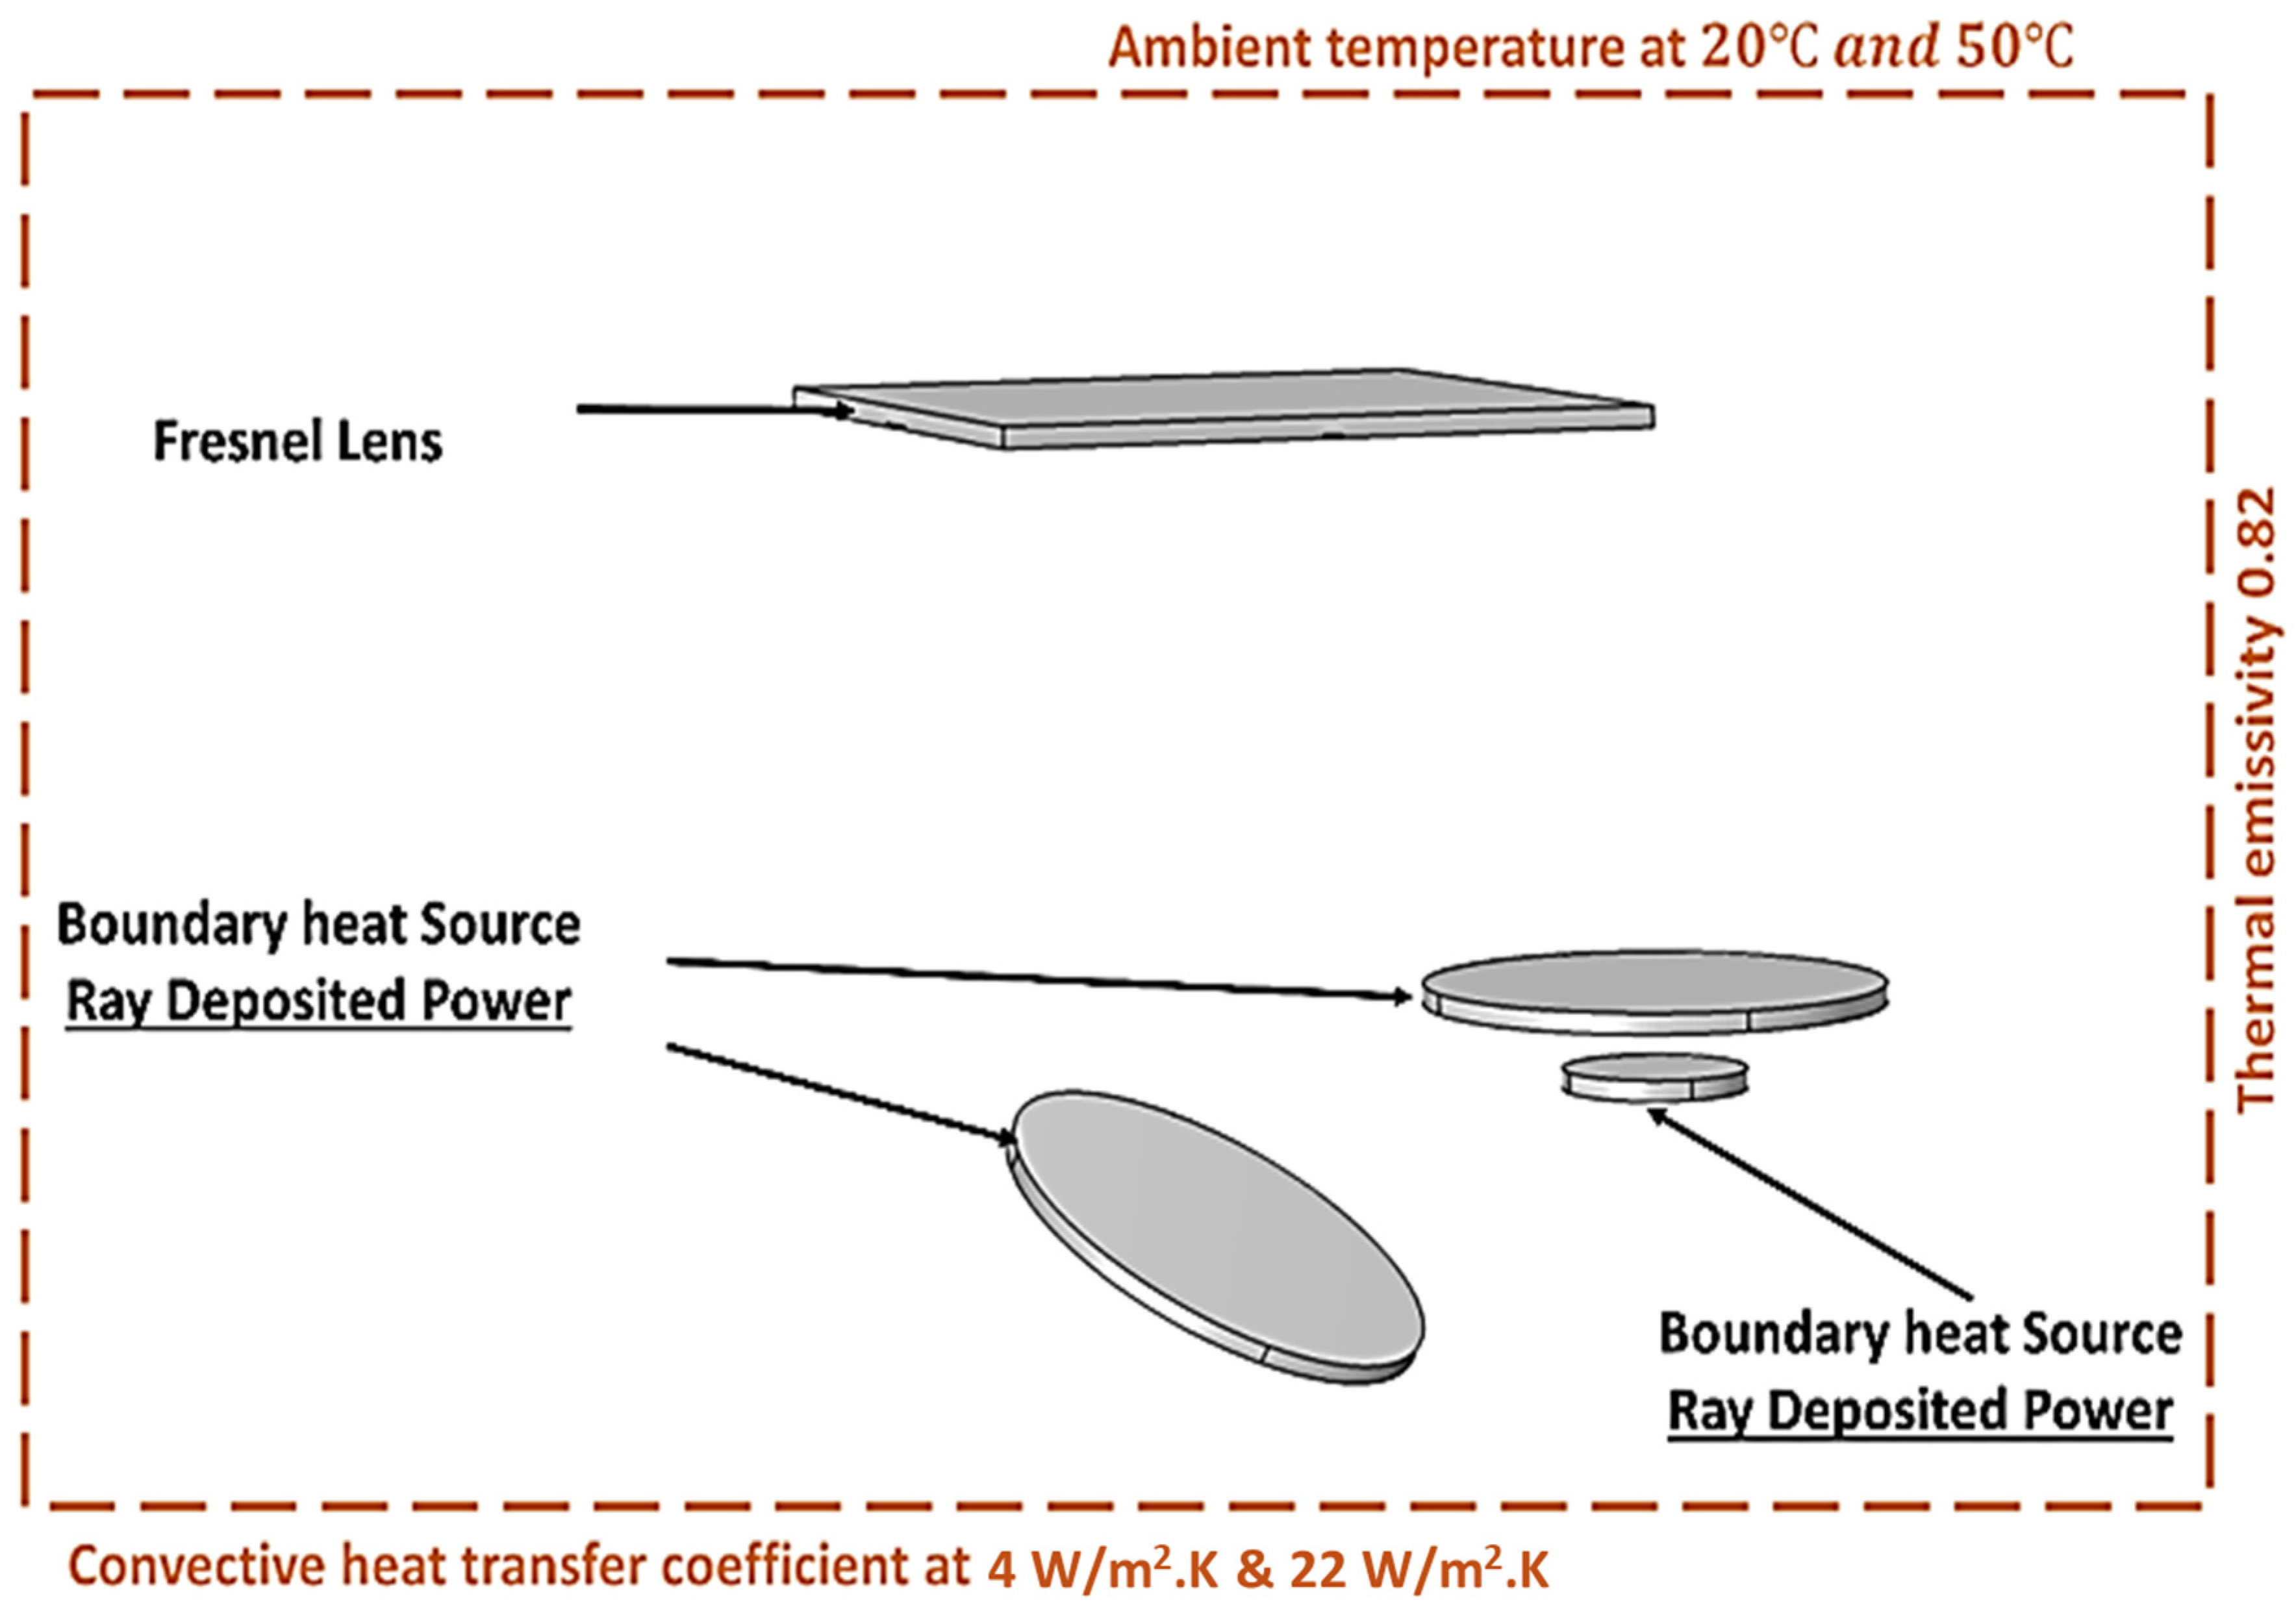
To establish the boundary conditions for the heat transfer in the solid model, all optics were assigned for heat flux ( Q c o n v . ) and surface-to-ambient radiation ( Q r a d . ). Within the heat flux, the model was investigated with a parametric sweep for ambient temperatures at 20   ° C and 50   ° C and convective heat transfer coefficients at 4 W/m2.K and 22 W/m2.K. This parametric sweep study aimed to observe the thermal model in relatively excellent weather conditions for the combination of 20   ° C   a n d   22   W / m 2 . K and for extreme weather conditions, modeled as a hot, stagnant desert-like environment with an ambient temperature of 50 °C and low convective cooling (4 W/m2.K, representing minimal wind speeds). This scenario approximates calm arid climates, whereas the parametric sweep up to 22 W/m2.K covers higher wind and turbulence levels typical of various European and coastal settings. The radiation heat transfer model has an emissivity product of 0.82 for the aluminum surfaces [29]. Boundary heat source nodes were selected for all optics subsequent to the Fresnel lens. Through these nodes, the calculated deposited ray power in the optical model was interlinked with the boundary heat source in the thermal model to find a solution. The thermal model has no thermal insulation selections. Figure 3 illustrates the boundary conditions of the thermal model.

6. Validation

The numerical model was customized to only account for the Fresnel lens and a 10 × 10 mm2 solar cell. Afterward, the model carried out the same numerical approach by solving the model optically and thermally. The boundary heat source results are clearly influenced by the counterbalance between the mesh size and the number of rays. Therefore, the analysis was carried out to check whether the meshing resolution was sufficient to avoid inaccuracy.
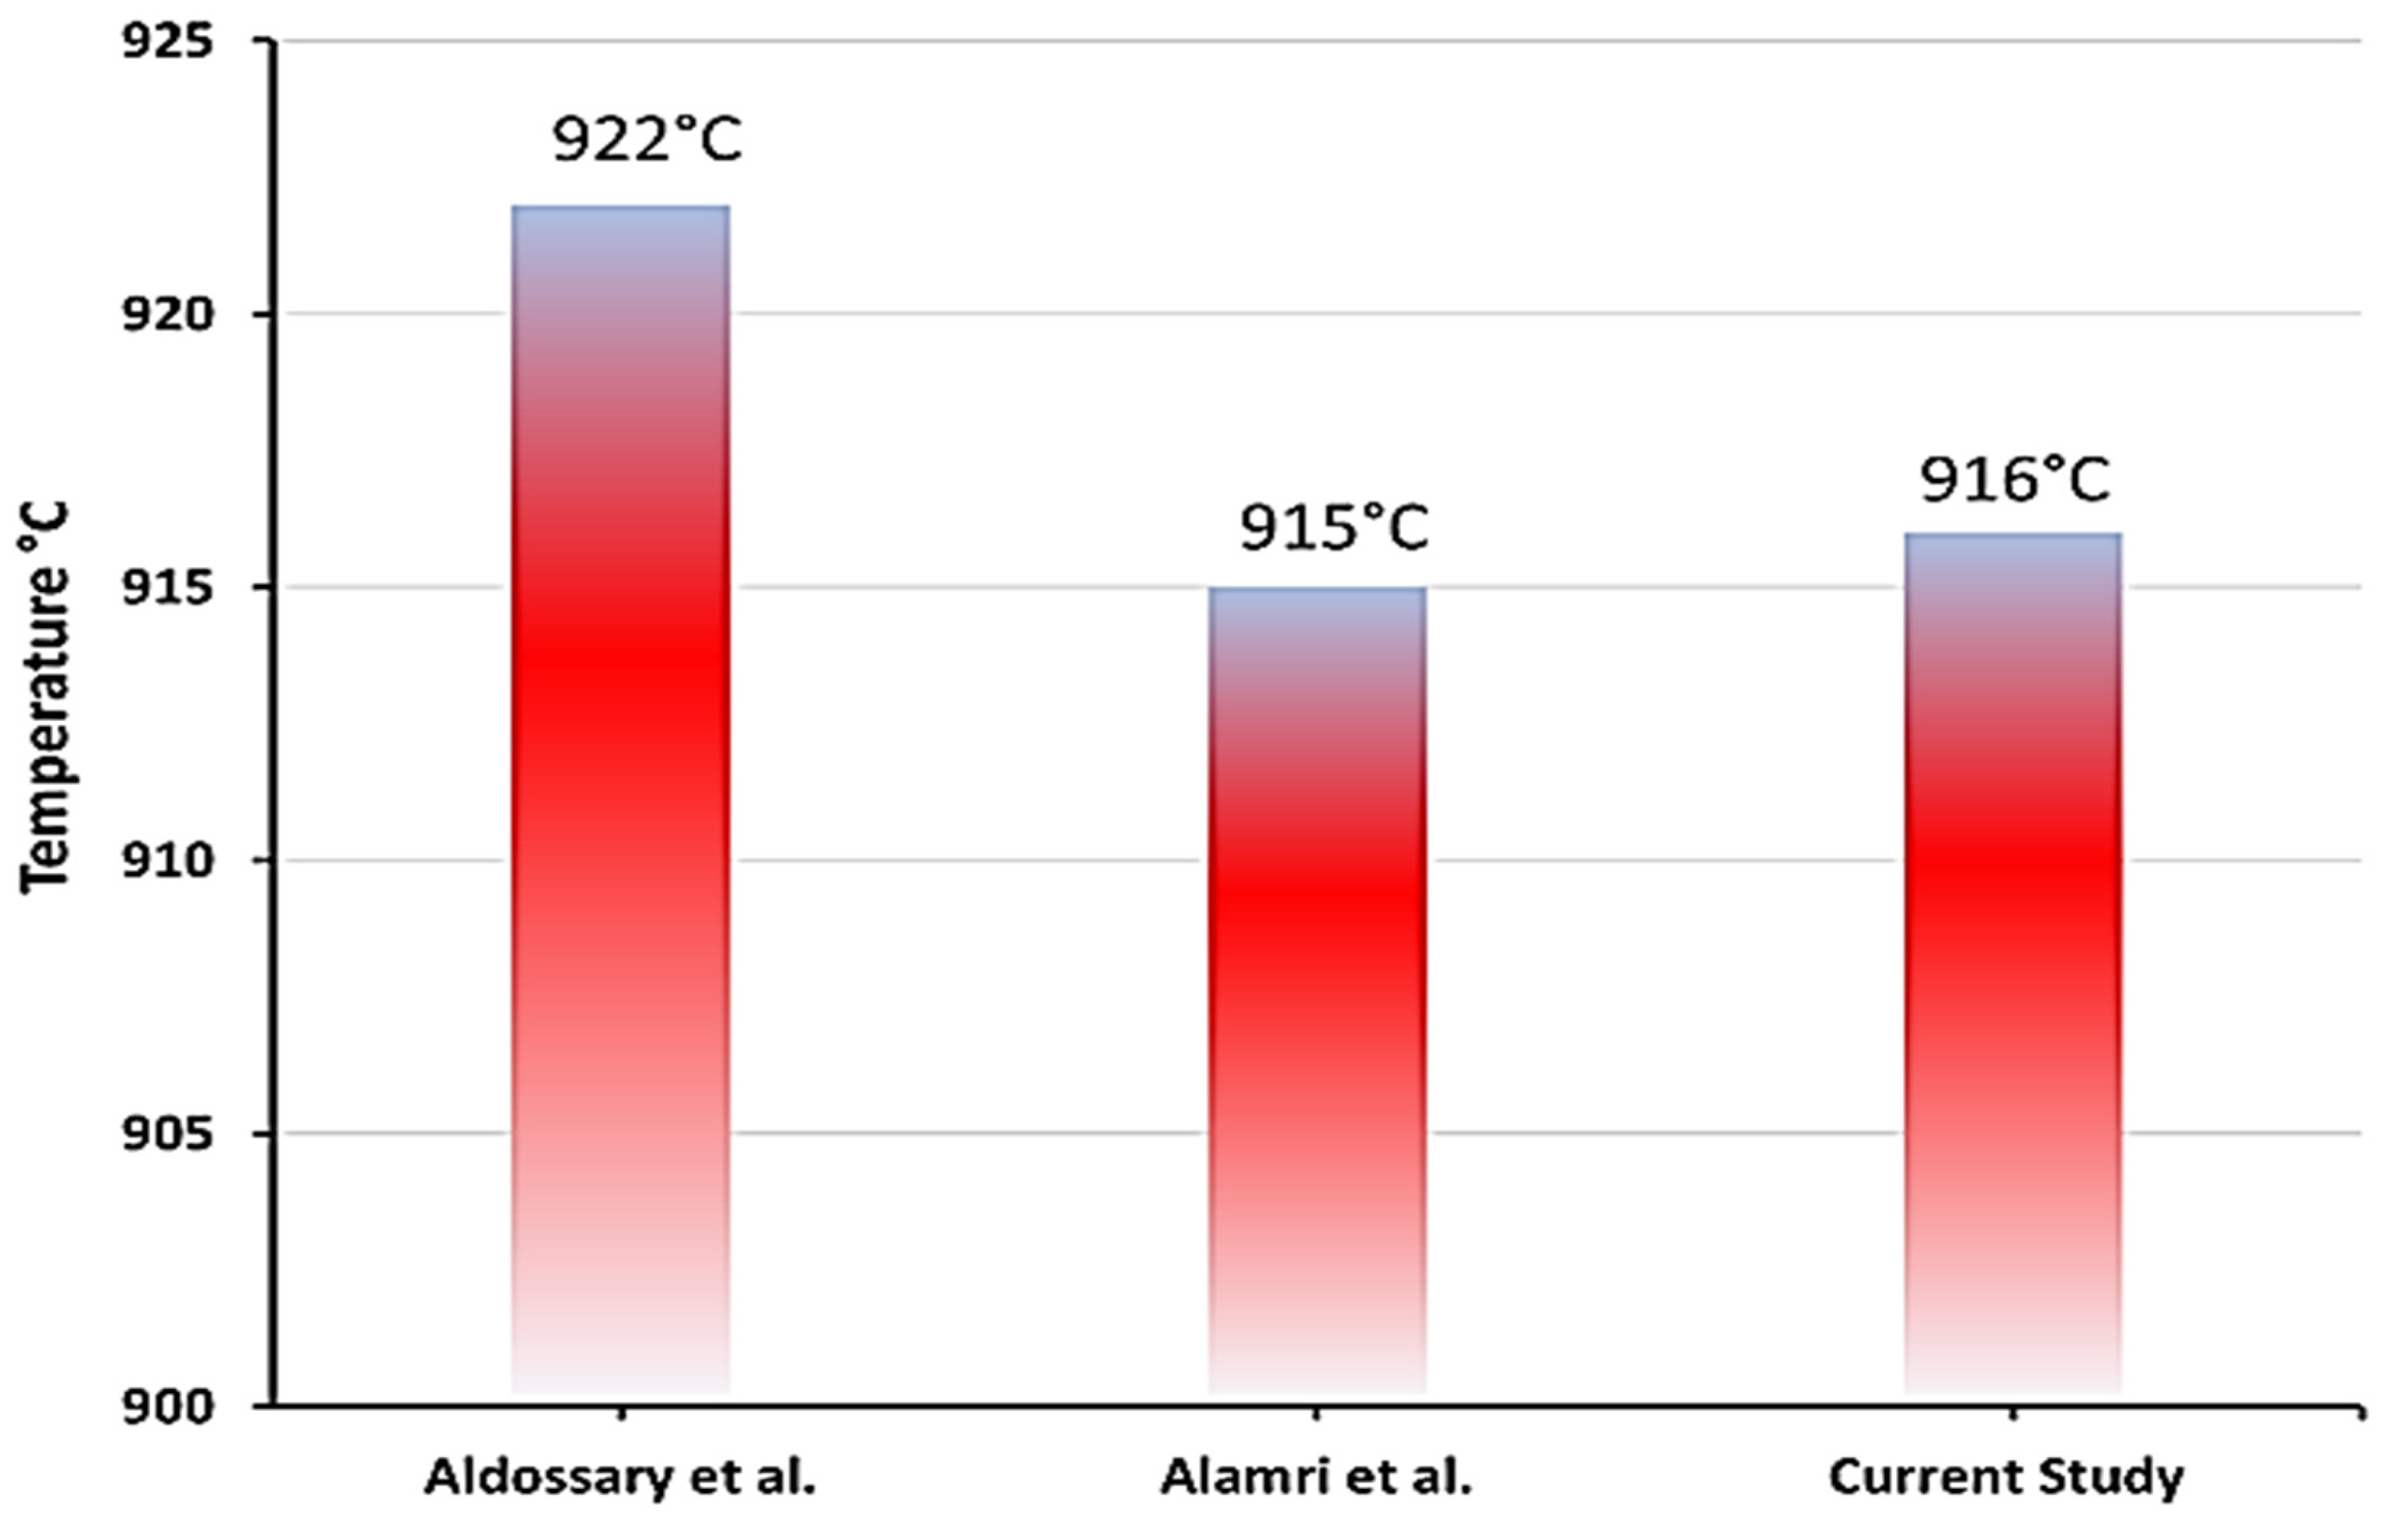
The model was validated thermally with Aldossary et al. [30] and Alamri et al. [31] utilizing a Fresnel lens of 441×, an ambient temperature of 25 °C, and a solar intensity of 1000 W/m2. Figure 4 shows the ray trajectory and the 3D temperature distribution highlighting the maximum temperature results.
The validation shows excellent agreement between the current study and both Aldossary et al. [30] and Alamri et al. [31], with a maximum discrepancy of 0.65% and 0.11%, respectively, as presented in Figure 5.

7. Results and Discussion

In this model, the influence of the direct normal irradiance, which is the main driver for the optical and thermal output, was established to test the UHCPV system in a representative range of solar irradiance in actual conditions from 400 W/ m 2 to 1000 W / m 2 . The UHCPV system was exposed to worst-case and optimistic conditions, assuming the typical temperature range of Saudi Arabia/India and some European countries, respectively. The respective convective heat transfer coefficients are 4   W / m 2 . K and 22   W / m 2 . K , while the ambient temperature, T a , for each case, ranged between 20 °C and 50 °C. These ranges of temperature and natural convective heat transfer coefficients establish the thermal boundaries of the safety operation limits.

7.1. Quarter of UHCPV Optical System

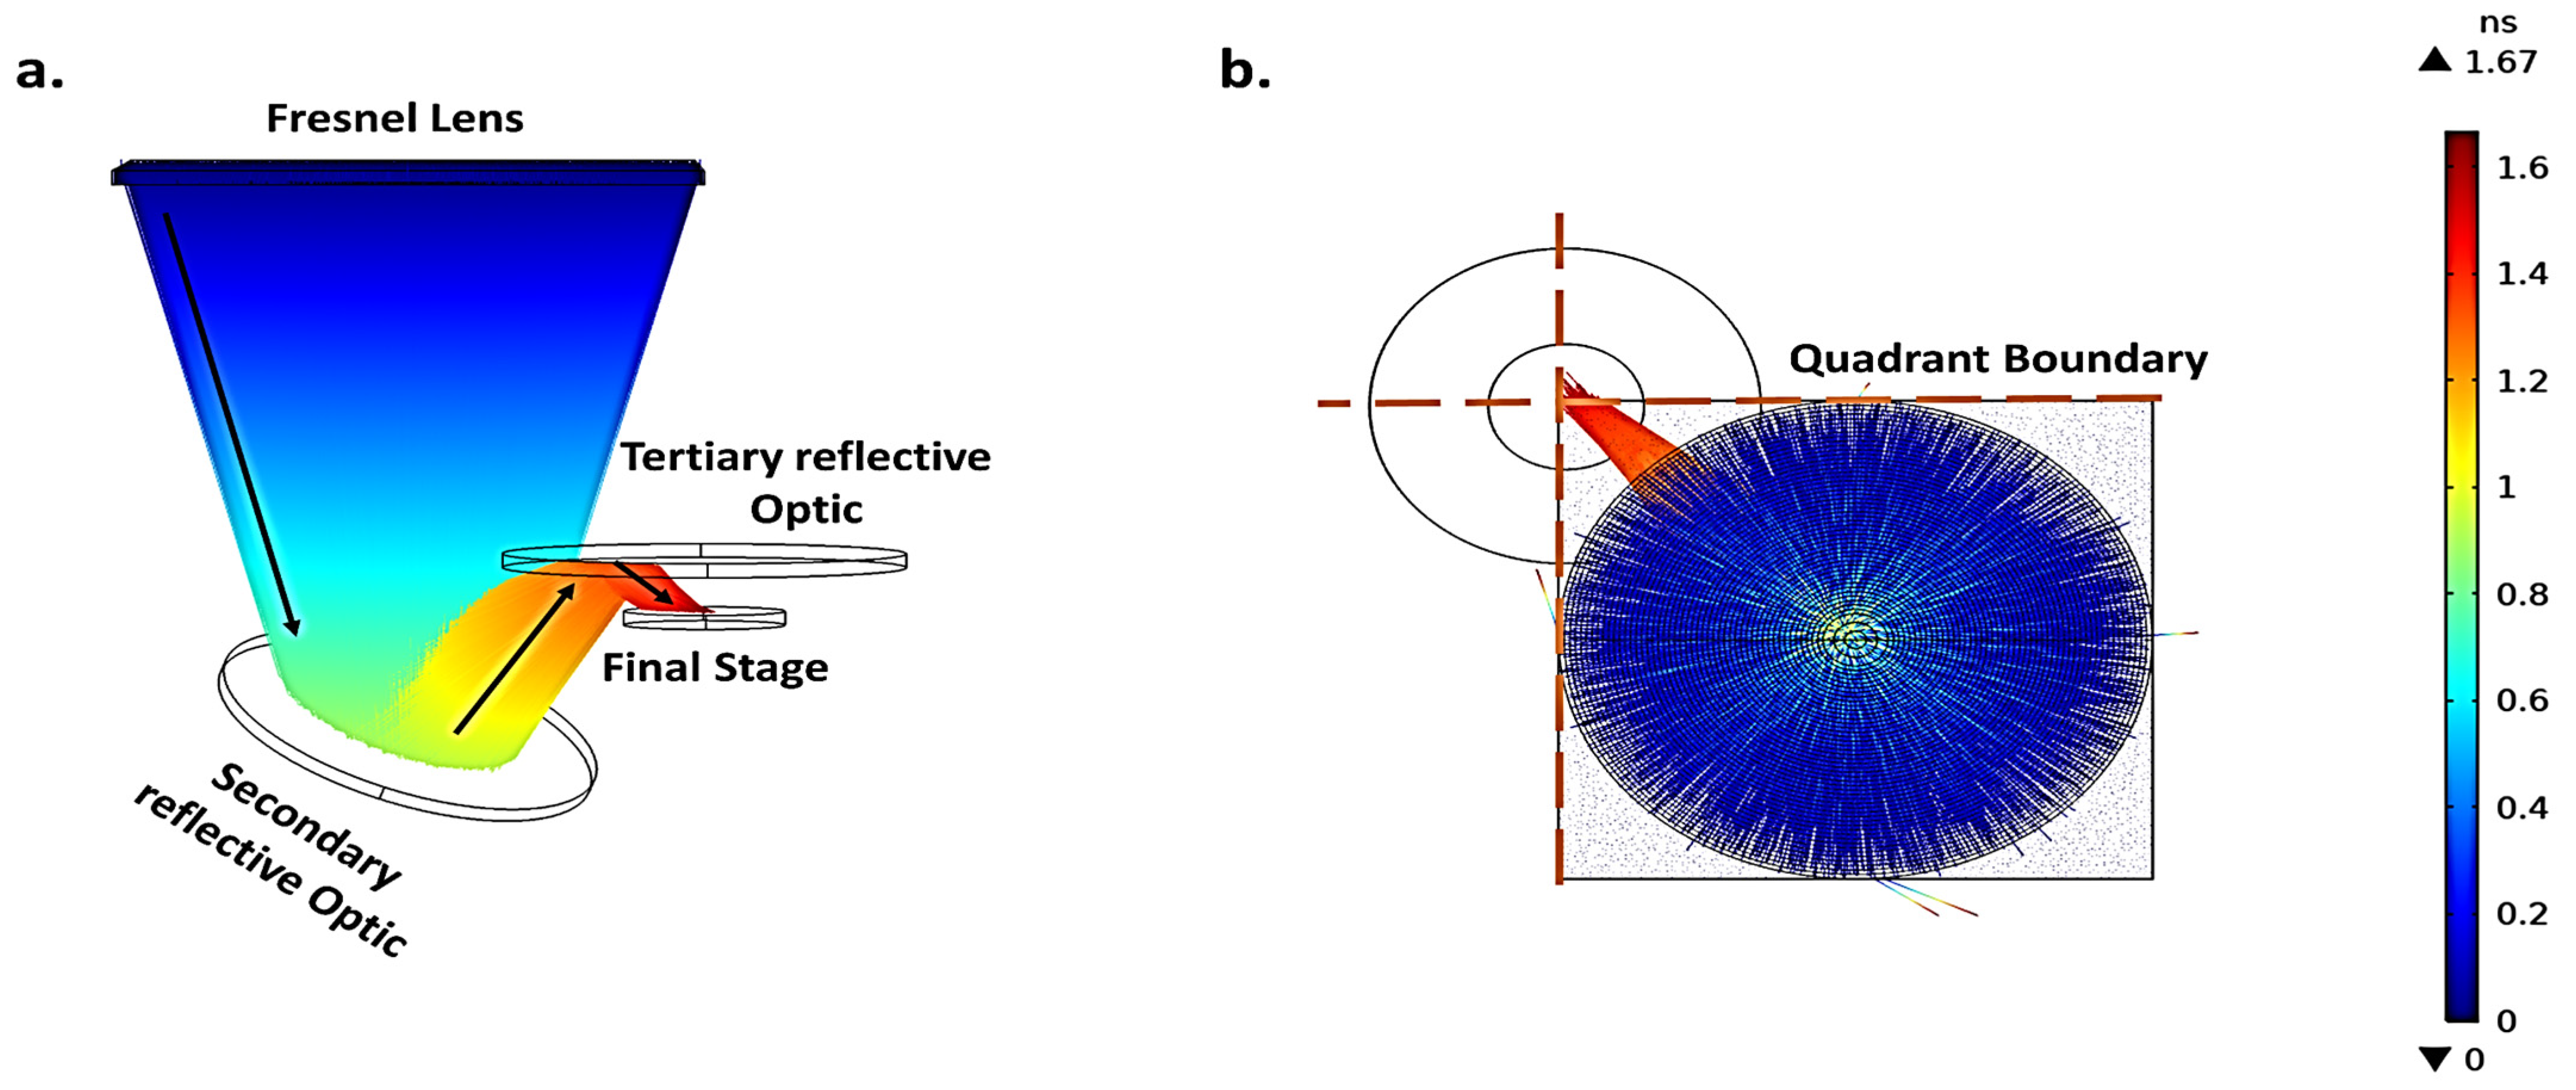
Since the design of the UHCPV system is based on four asymmetric quadrants, only a quarter of the UHCPV system is simulated, but despite this, the system was designed to be symmetrical across all quadrants. Thus, the optical and thermal behavior of the full system is accurately captured through quadrant modeling, offering computational efficiency without a loss of precision. The ray trajectories showed the concentrated solar irradiance being refractive from the primary optics and then reflected from the secondary optics all the way to the receiver with 1.67 nanoseconds (ns), as shown in Figure 6.
The optical performance can be evaluated through the optical concentration ratio and the optical efficiency, where the optical efficiency of the UHCPV system is related to the attainable simulated concentration ratio ( C s i m ) based on the designed geometrical concentration ratio ( C g = A r e a c o n c e n t r a t o r A r e c e i v e r ) ,   a s   s h o w n   i n   E q u a t i o n   ( 13 ) . The geometrical concentration ratio for a quarter of the UHCPV system is found to be 1458 suns for a solar cell area of 5.5   m m × 5.5   m m .
η s i m u l a t i v e   o p t i c a l = C s i m C g
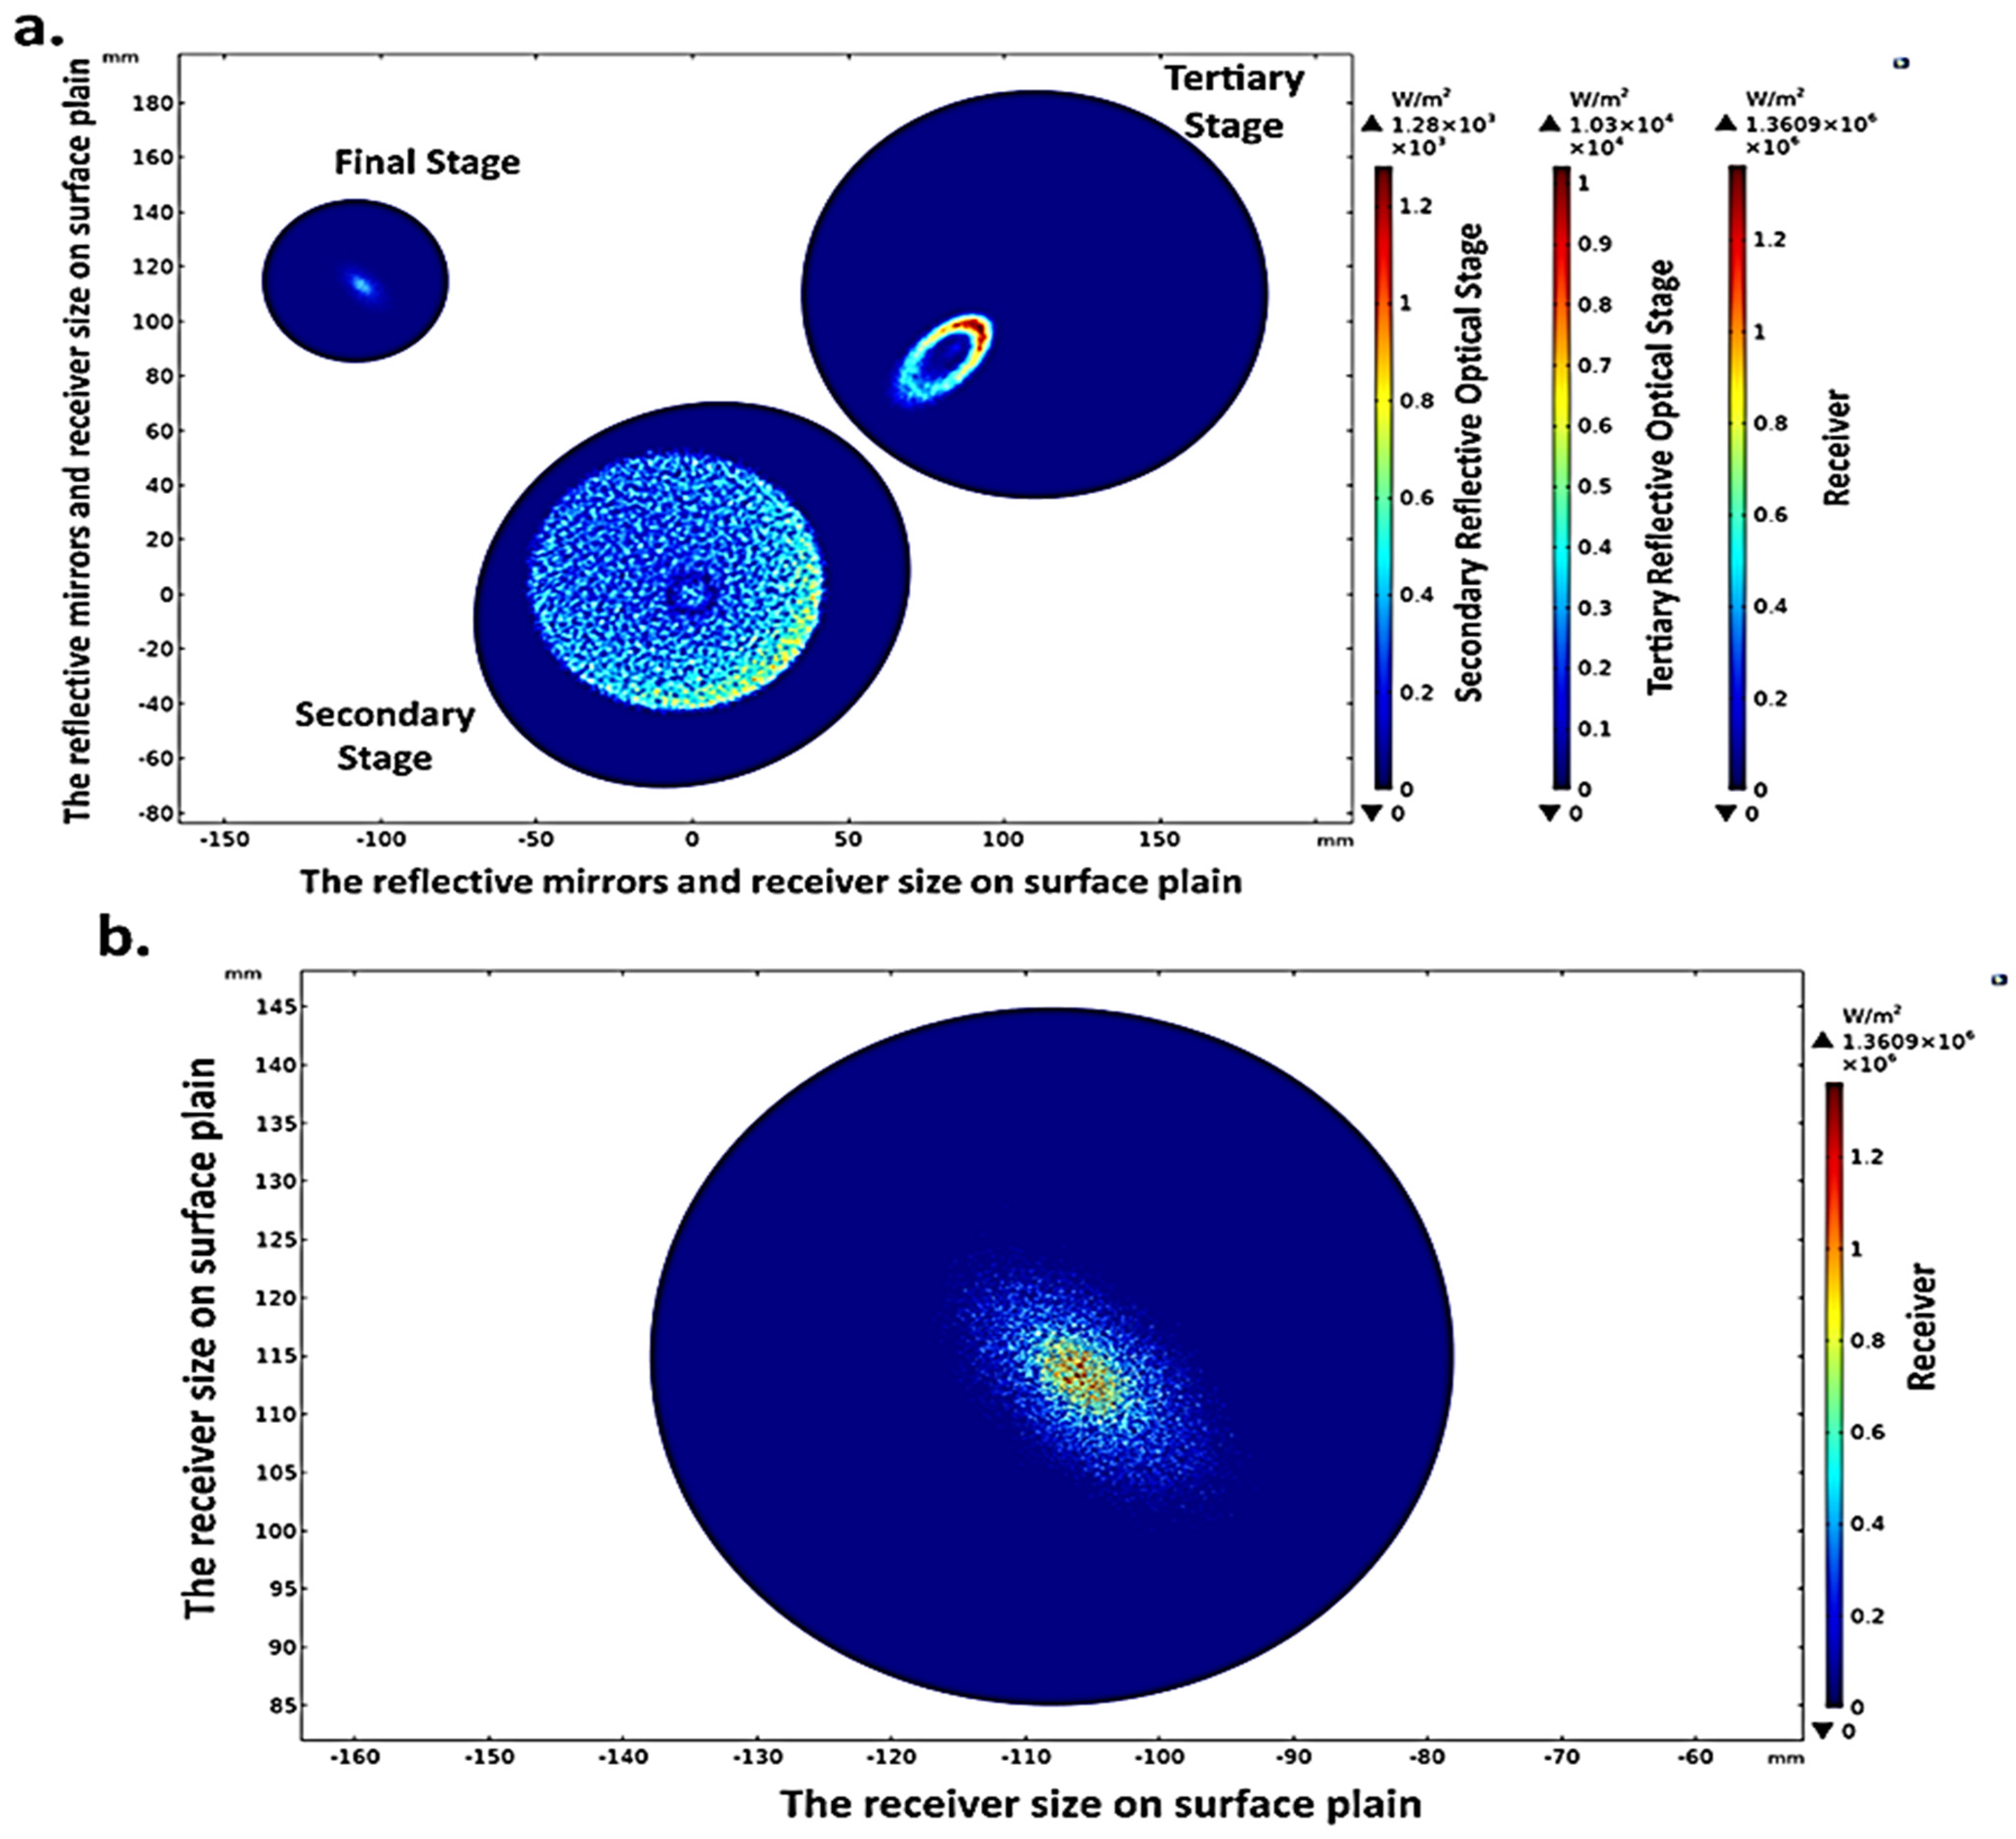
The deposited ray power was assessed on every optical stage subsequent to the Fresnel lens. Knowing the boundary heat source on the optics prior to the receiver illustrates the losses in the boundary source power of concentrated rays. At a DNI of 1000   W / m 2 , the boundary heat source on the optical interfaces was found to be 1.28 × 10 3   W / m 2   ( 1   s u n ) , 10 × 10 3   W / m 2   ( 10   s u n s ) , and 1.361 × 10 6   W / m 2   ( 1361   s u n s ) on the surface of the secondary mirror, the tertiary mirror, and the receiver, respectively. The boundary heat source on the final receiver resulted in a simulated optical efficiency ( η s i m u l a t i v e   o p t i c a l = 93%). The irradiance distribution on the optics influenced by the angular reflection of concentrated rays is given in Figure 7a, and the magnified irradiance distribution on the receiver is given in Figure 7b.
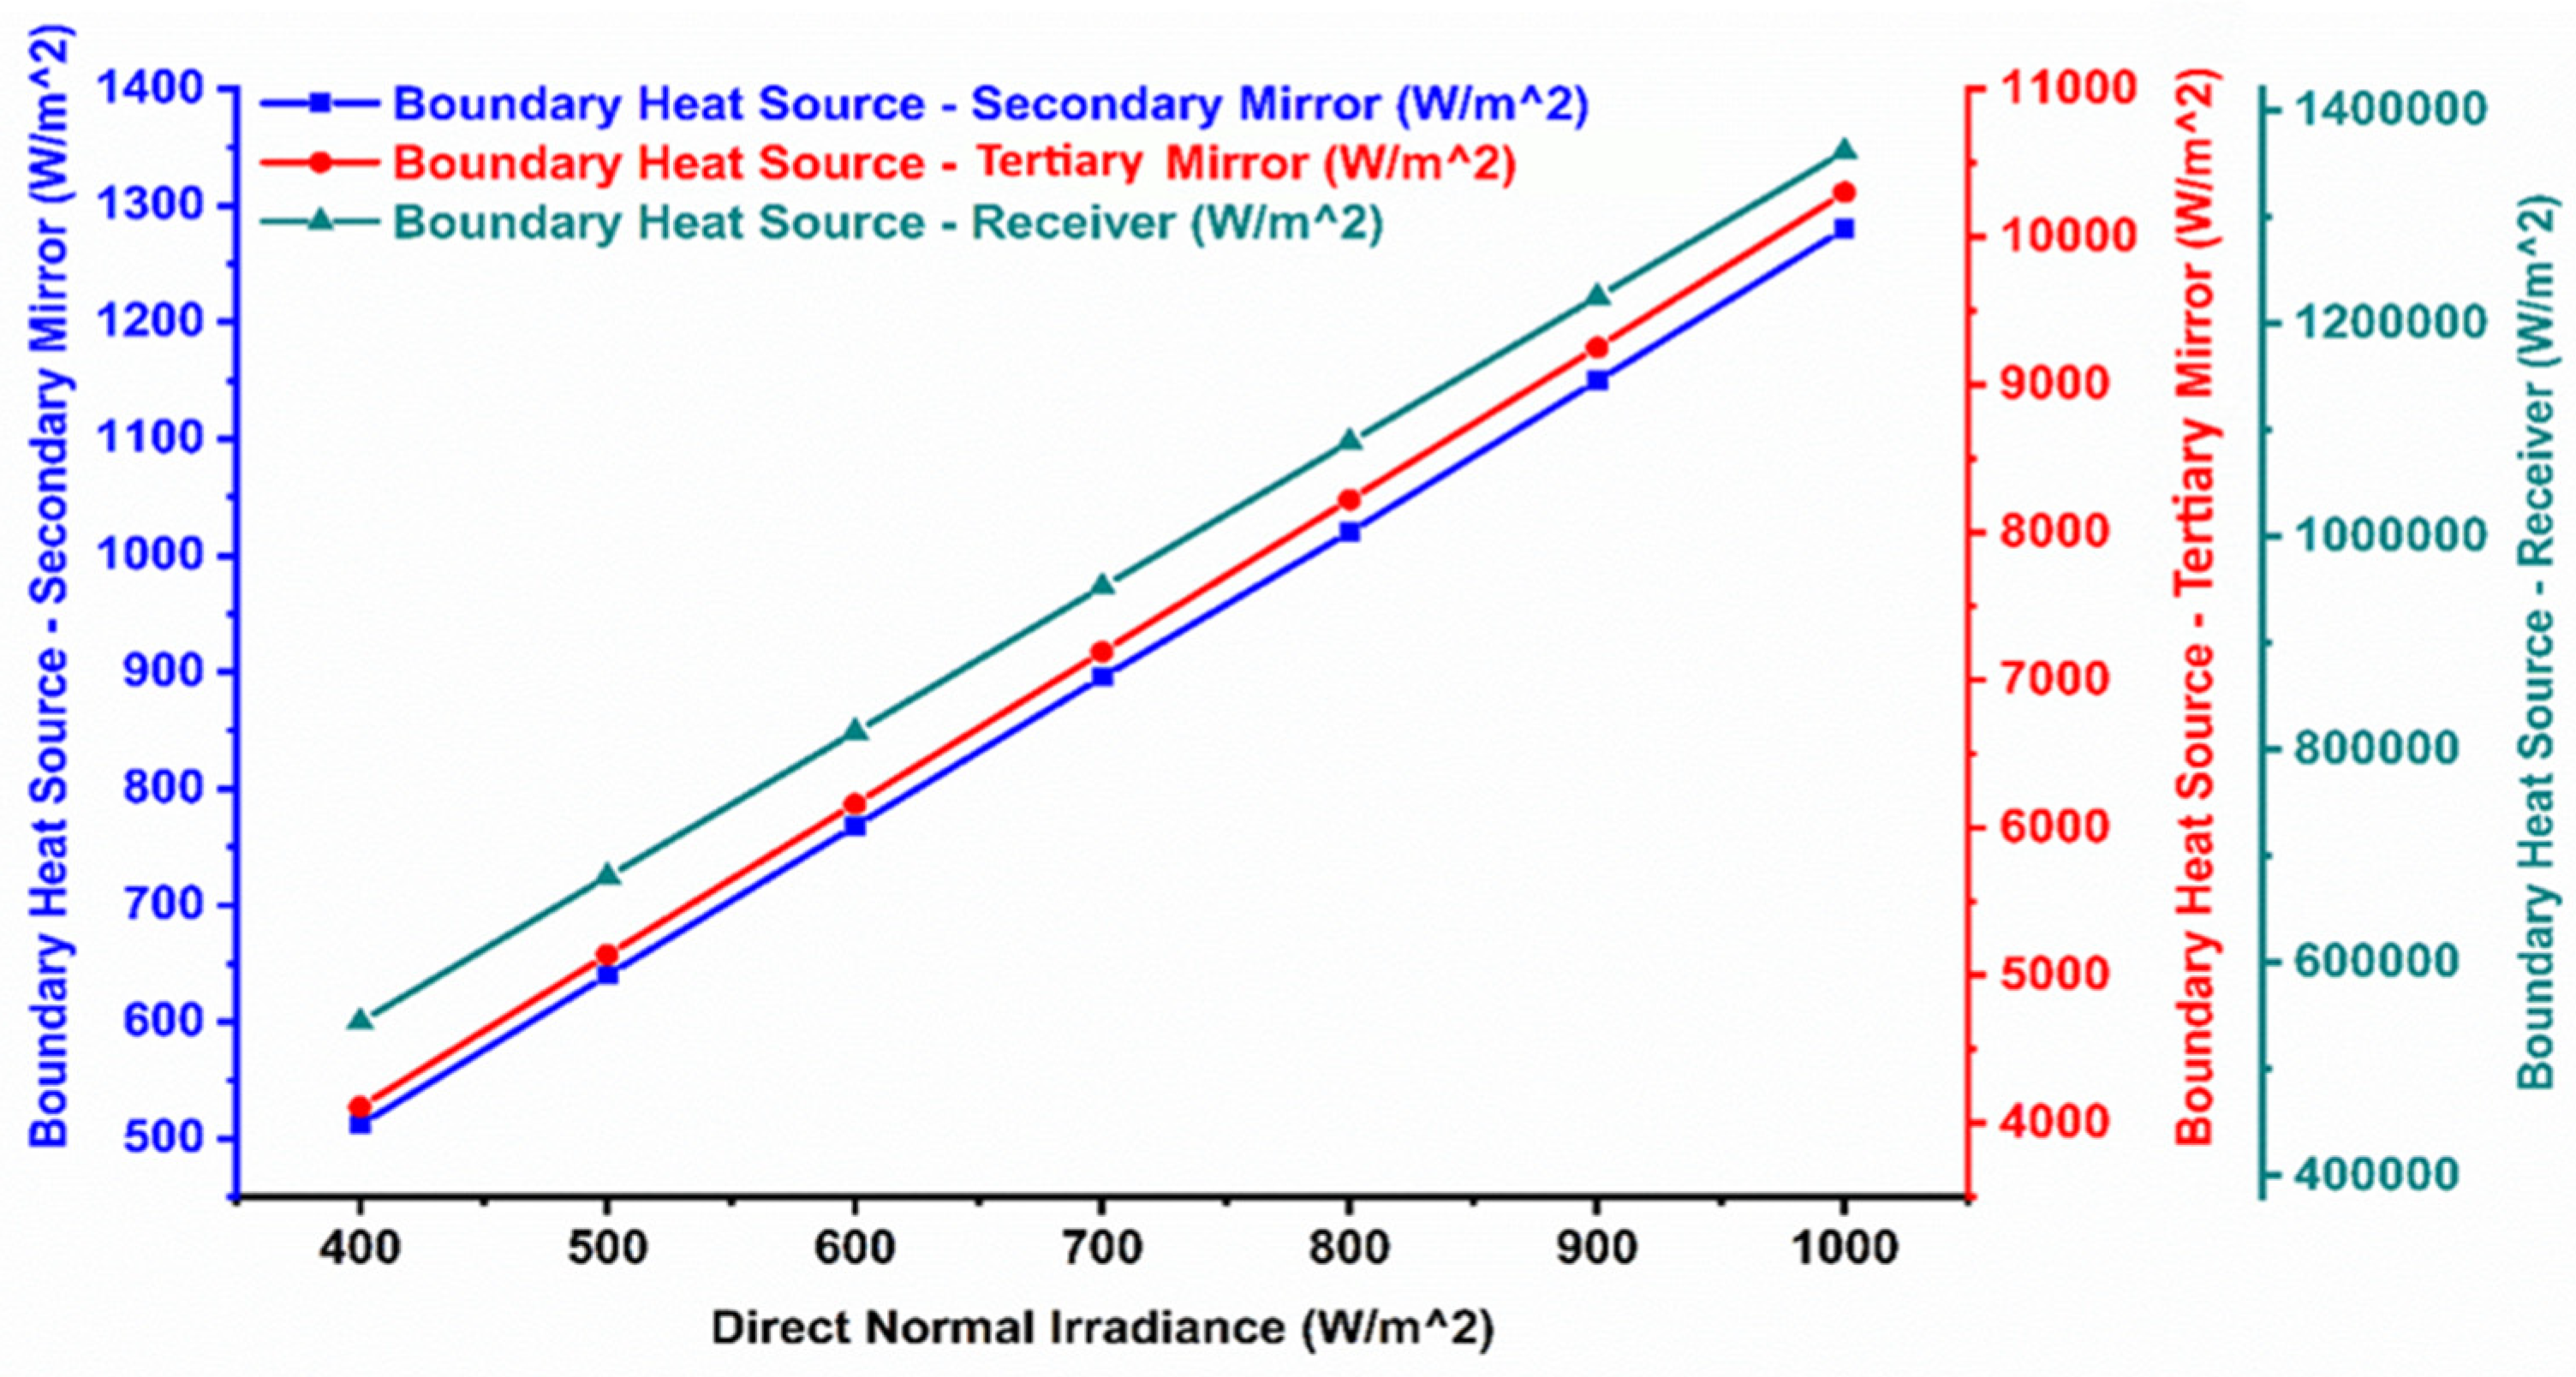
In the range of a DNI of 400 W / m 2 1000   W / m 2 , the boundary heat source was predicted to be in the range of 1.28 × 10 3   W / m 2 5.12 × 10 2   W / m 2 for the secondary reflective mirror, in a range of 1.03 × 10 4   W / m 2 4.11 × 10 3   W / m 2 for the tertiary reflective mirror, and in the range of 1.361 × 10 6   W / m 2 5.44 × 10 5   W / m 2 for the receiver corresponding to simulated concentration ratio of 1361 suns to 544 suns. The correlation between the boundary heat source and the input power (DNI) is strongly linear, as expected, and is shown in Figure 8.

Solar Divergence Angle

To establish light cones at the points of sun rays, the sun divergence angle of 4.65   m r a d   ( 0.27 ° ) is considered, which is the approximation of the solar disk size when observed from Earth. The solar radiation from the solar disk center has a tendency to be greater in solar intensity than solar radiation from the edges of the sun disk which is known as the limb darkening phenomenon. There is a strong inverse correlation between the divergence angle and the concentration ratio. The attained simulative concentration ratio is limited to 1361 suns due to the sun angular size of 0.27 ° , as shown in Figure 9a. To account for a relatively wider optical tolerance when tracking the sun, a sun angular size of 1 ° resulted in a wider focal spot and hence a concentration ratio of 610 suns ( η s i m u l a t i v e   o p t i c a l = 42 % ) , as shown in Figure 9b. This shows the sensitivity of the system to scattering during the optical stages.

7.2. Thermal Analysis of ¼th of UHCPV System

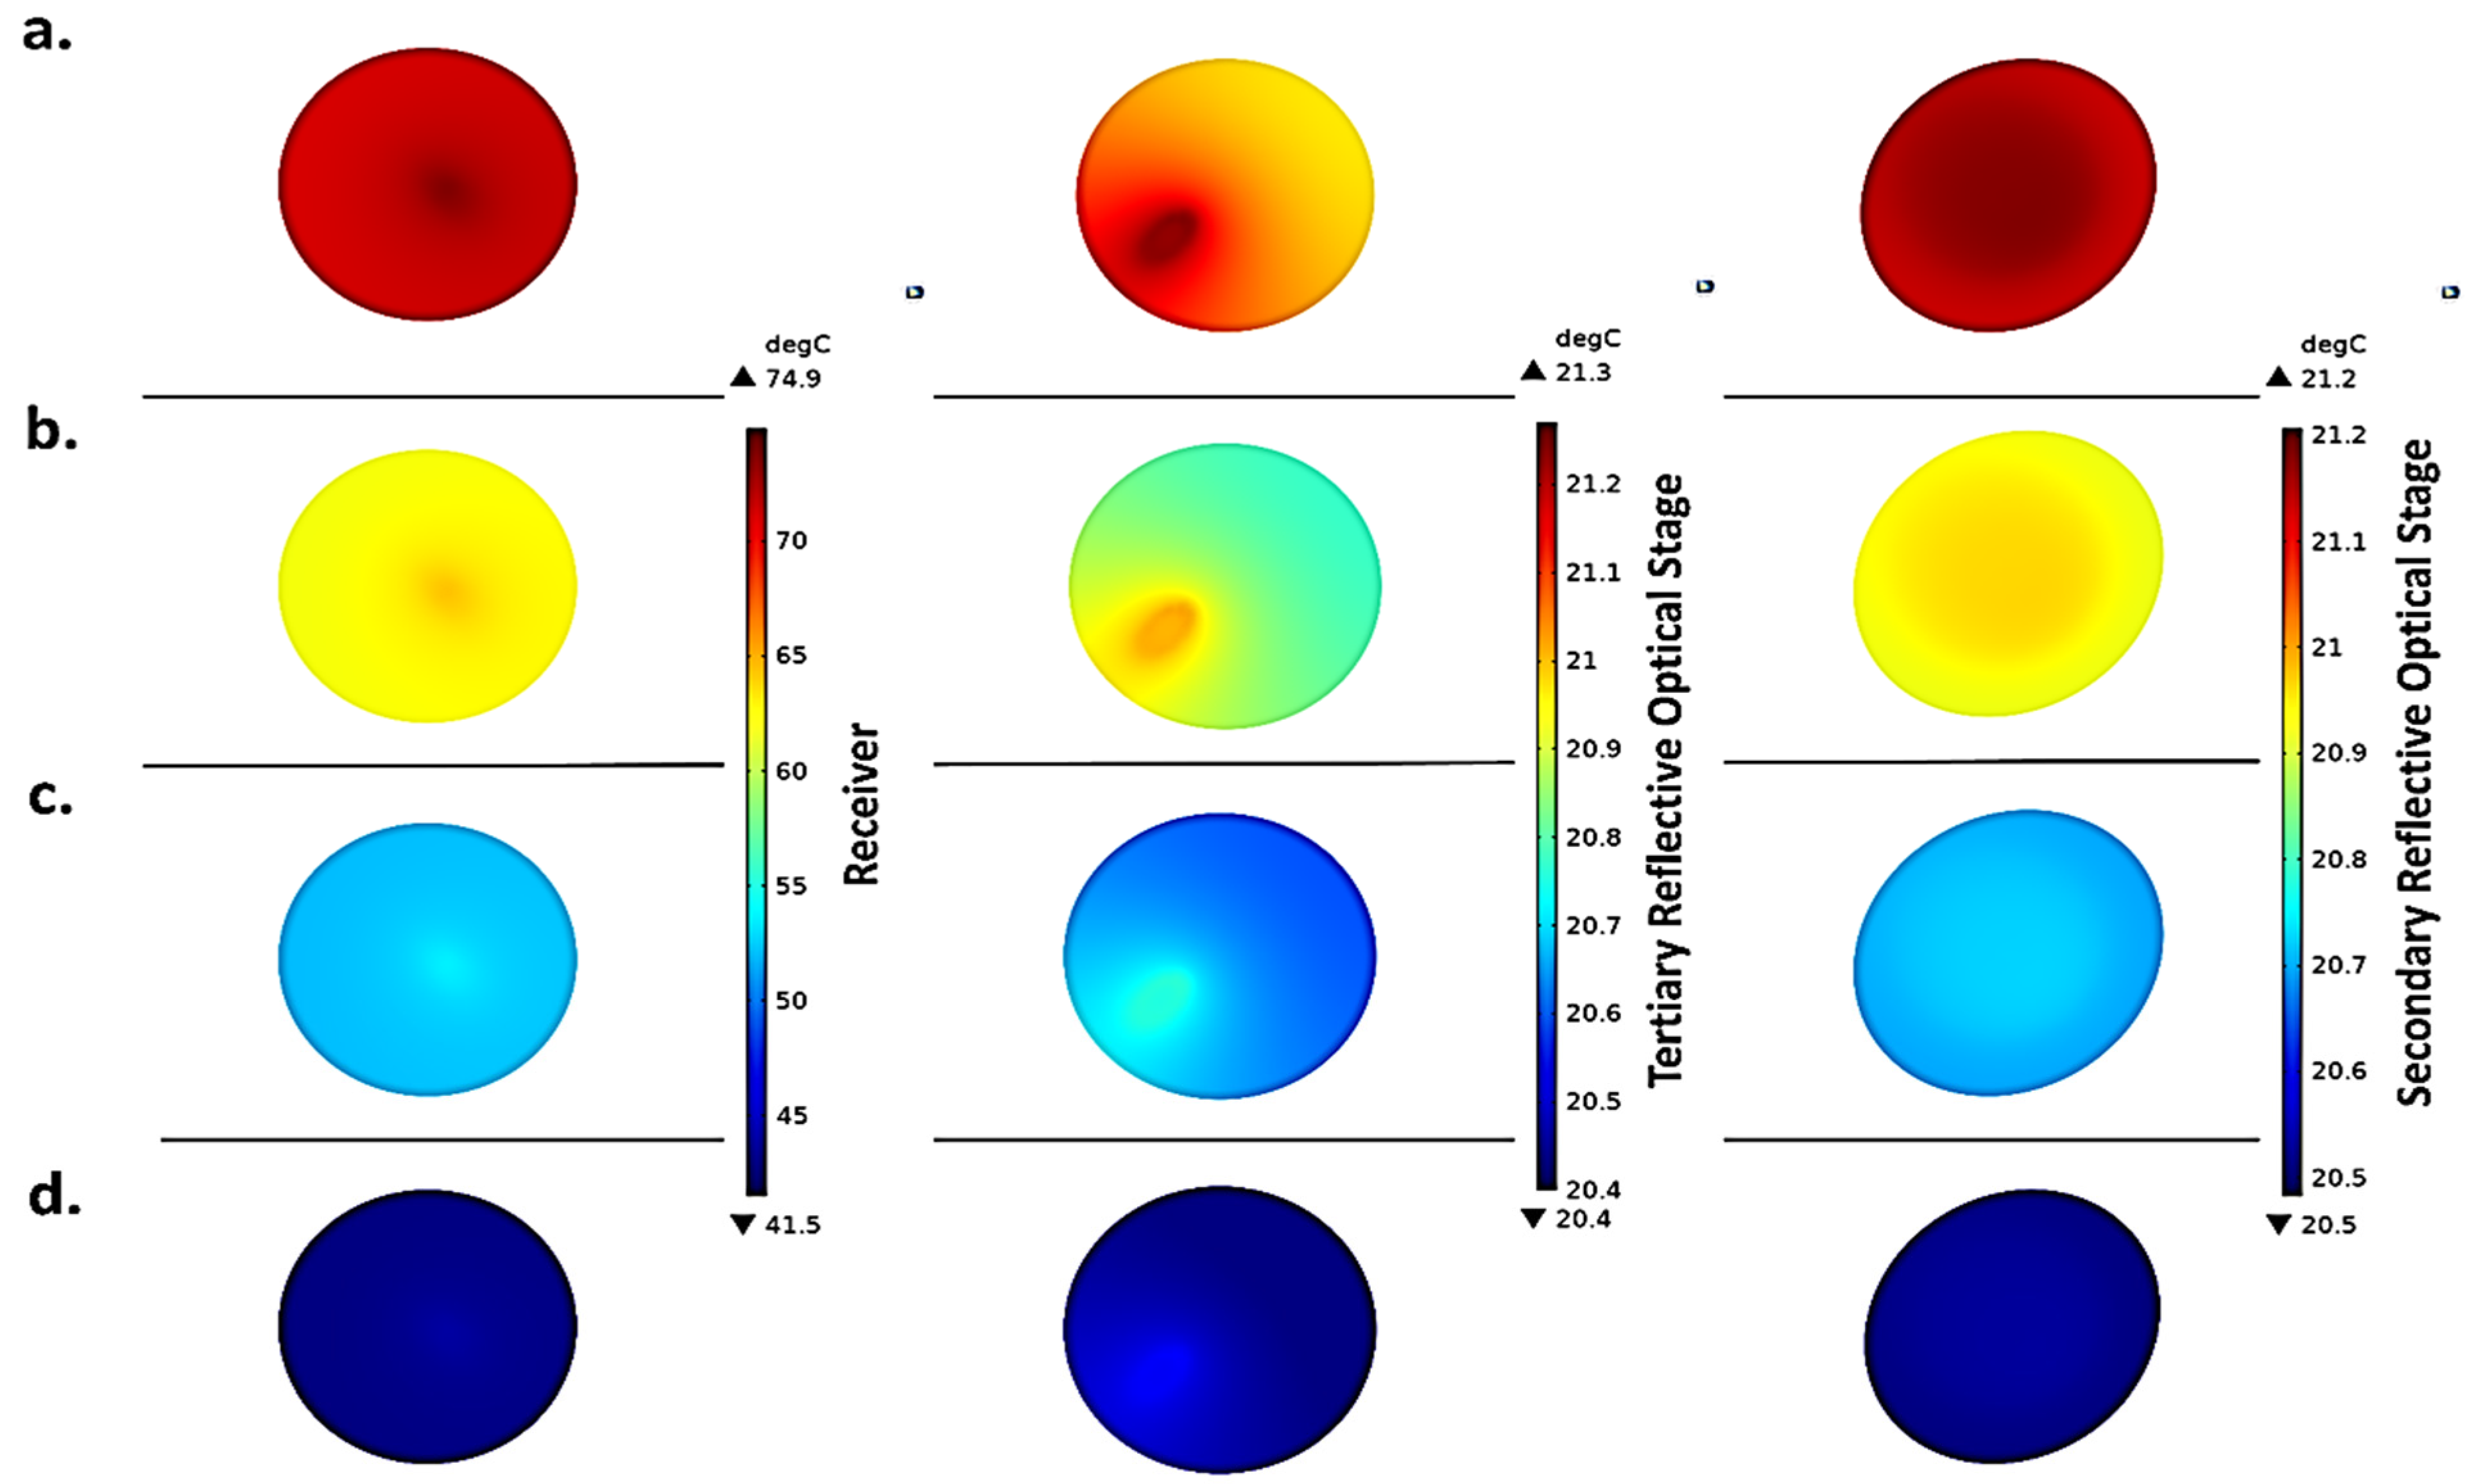
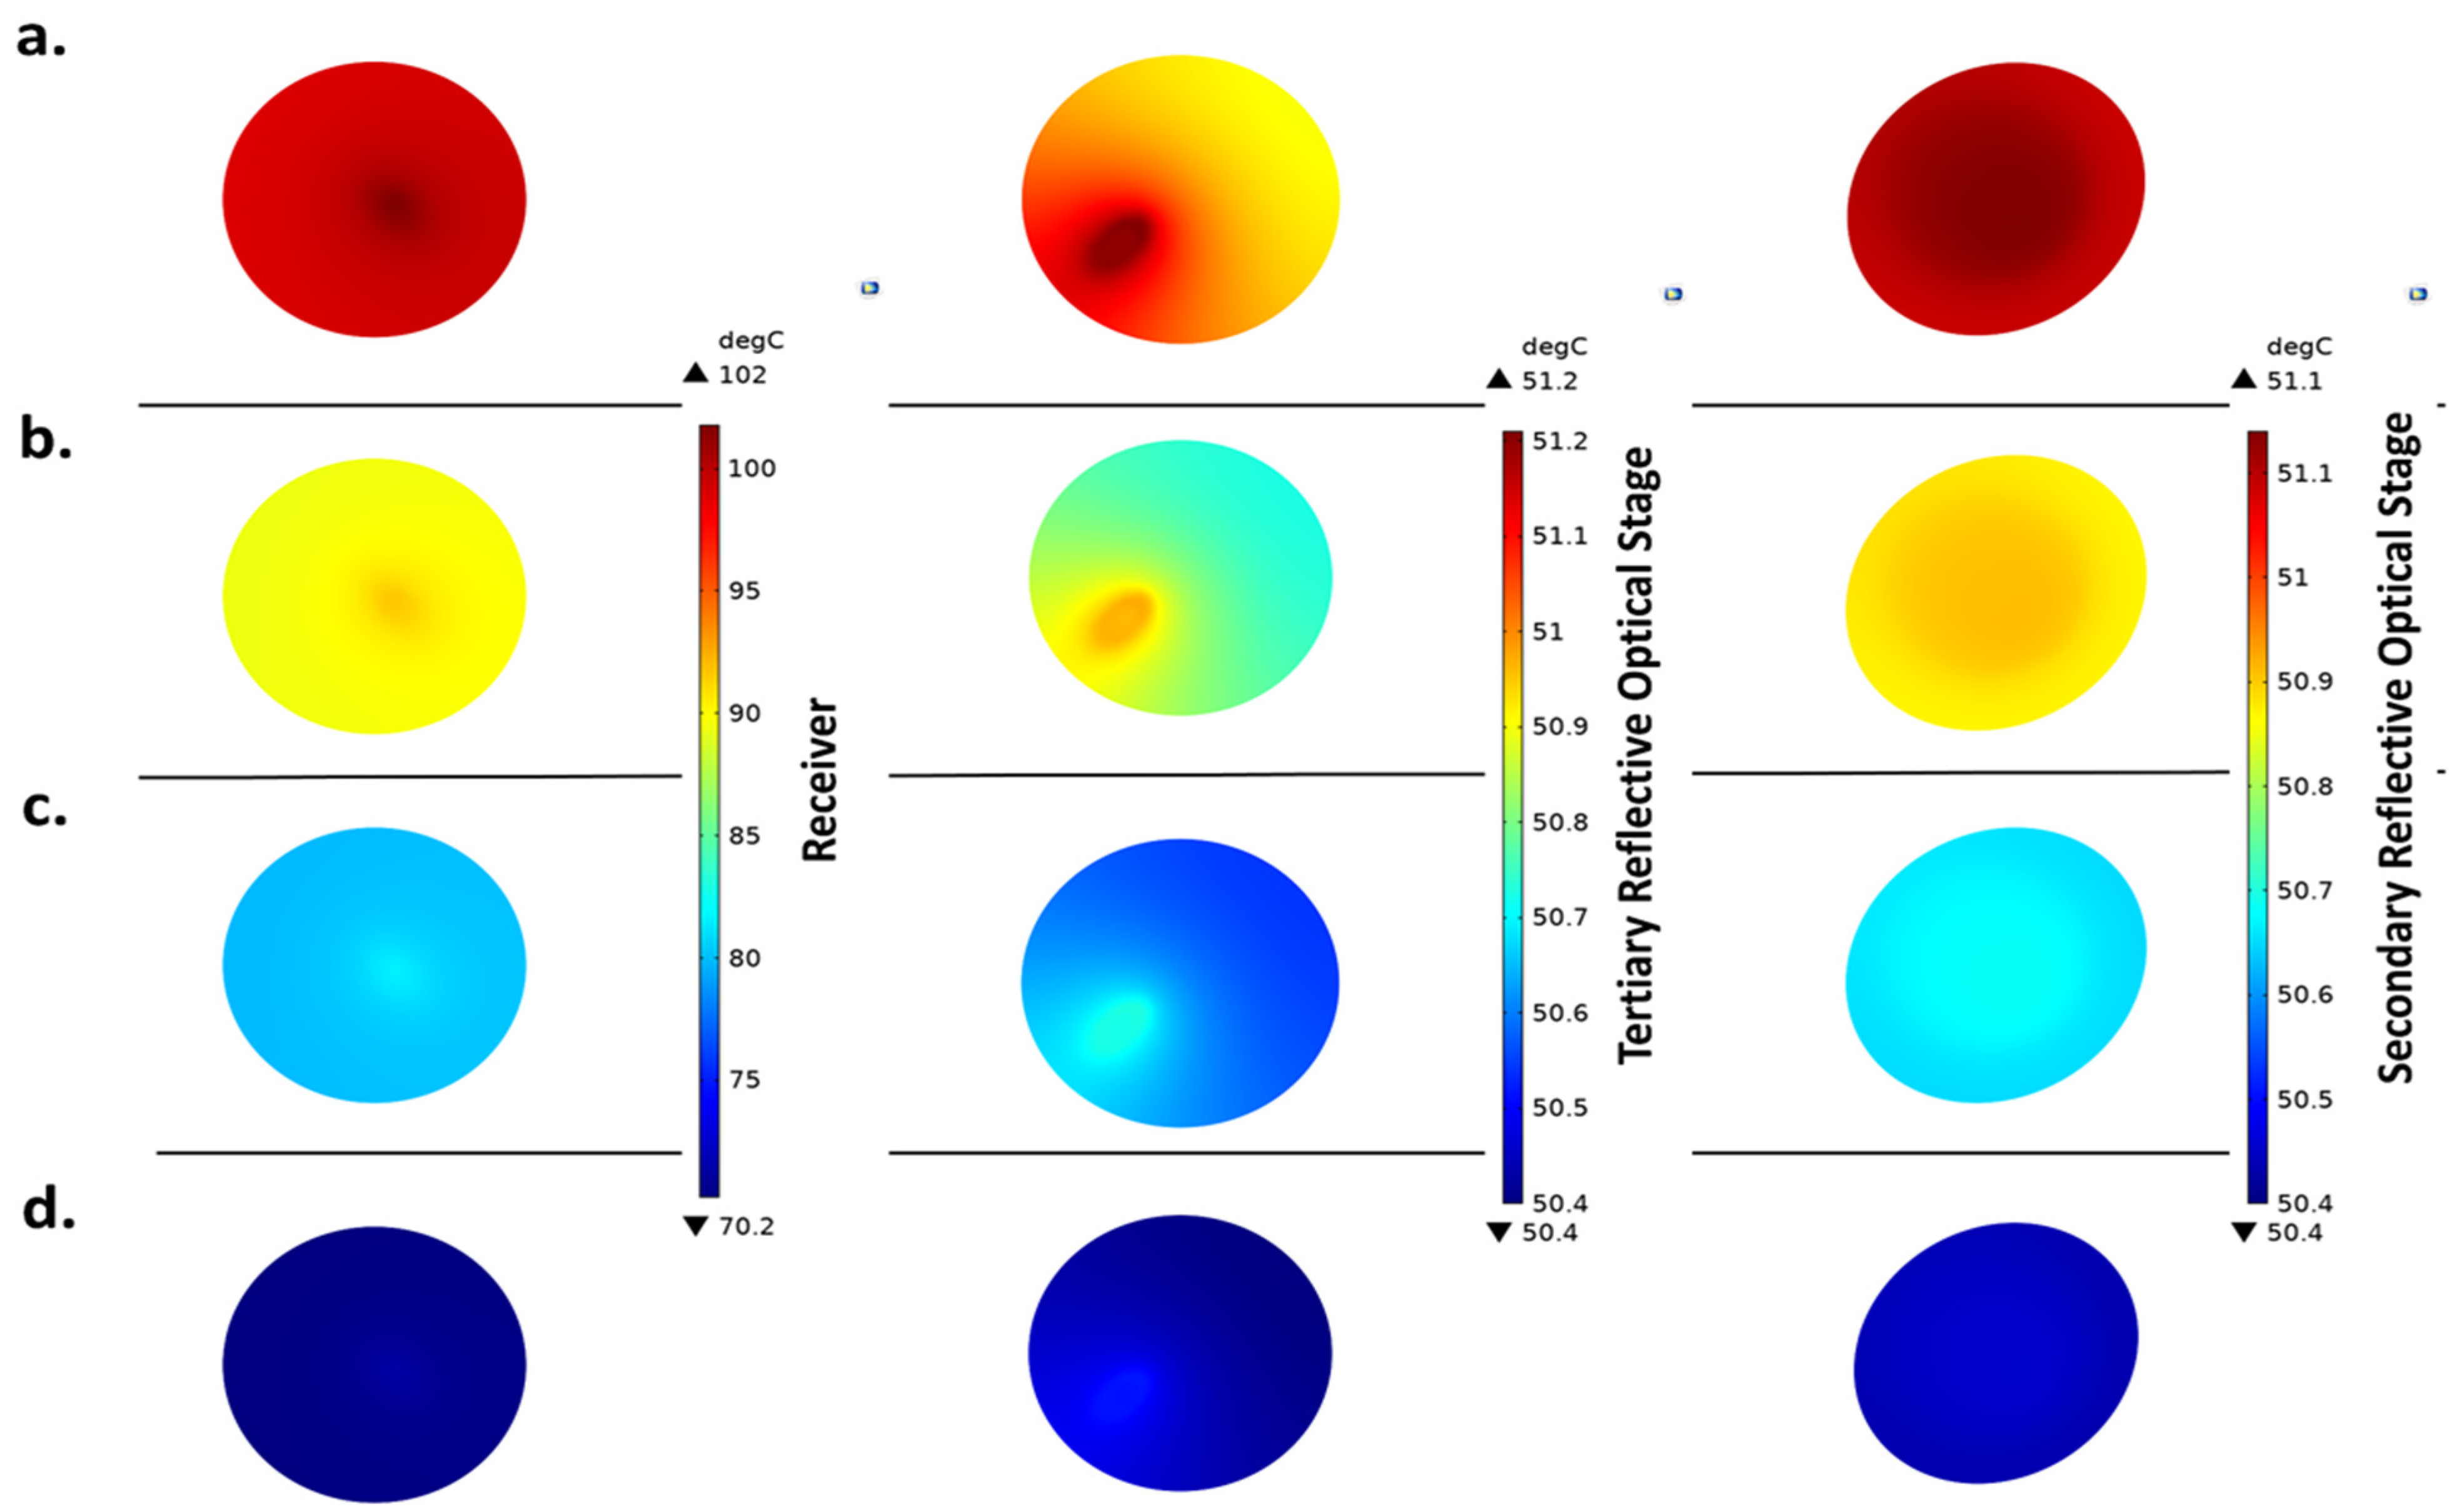
The temperature changes contribute to thermal expansion on the optical surfaces. This thermal deformation and the changes in the optical reflectivity influence the overall system performance, as high accuracy is needed to achieve the ultrahigh concentration ratio. In addition to this, the thermal expansion might cause permanent structural surface deformation, hindering the system’s reliability. Therefore, the prediction of temperature aims to expose the system model to a wide range of environmental conditions to ensure safe operation in practical applications. The temperature of the optics is reliant on the thermal properties of the material and the optical geometries. The deposited power density in the optical model was coupled to solve the heat transfer in the solid model. As a result, the maximum surface temperature at an ambient temperature in a range between 20   ° C and 50 °C with a convective heat transfer coefficient of 4   W / m 2 . K was found for the combination of 50 °C and 4 W / m 2 . K . Certainly, the maximum temperature (worst operation) was exhibited on the receiver with a magnitude of 157.4 °C. Figure 10 and Figure 11 show the temperature distribution profile at different DNIs with an interval of 200 W / m 2 for 20 °C and 4 W / m 2 . K and 50 °C and 22 W / m 2 . K , respectively.
The results of Figure 10 and Figure 11 were combined into one linear graph (Figure 12) to demonstrate the linear correlation with the shading pattern to observe the working range within the selected ambient temperature in accordance with the convective heat transfer coefficient. An obvious discrepancy between the model with ambient temperatures of 20 °C and 50 °C at 4 W / m 2 . K shows average values of 18%, 56.9%, and 56.7% for the receiver, secondary mirror, and tertiary mirror, respectively. To enhance clarity and provide a concise comparison, Table 3 summarizes the average temperature discrepancies observed at key optical components between the low-temperature (20 °C) and high-temperature (50 °C) scenarios under a convective heat transfer coefficient of 4 W/m2.K. This tabular comparison reinforces the significant thermal gradients experienced by the system under varying environmental conditions and highlights the need for effective cooling strategies.
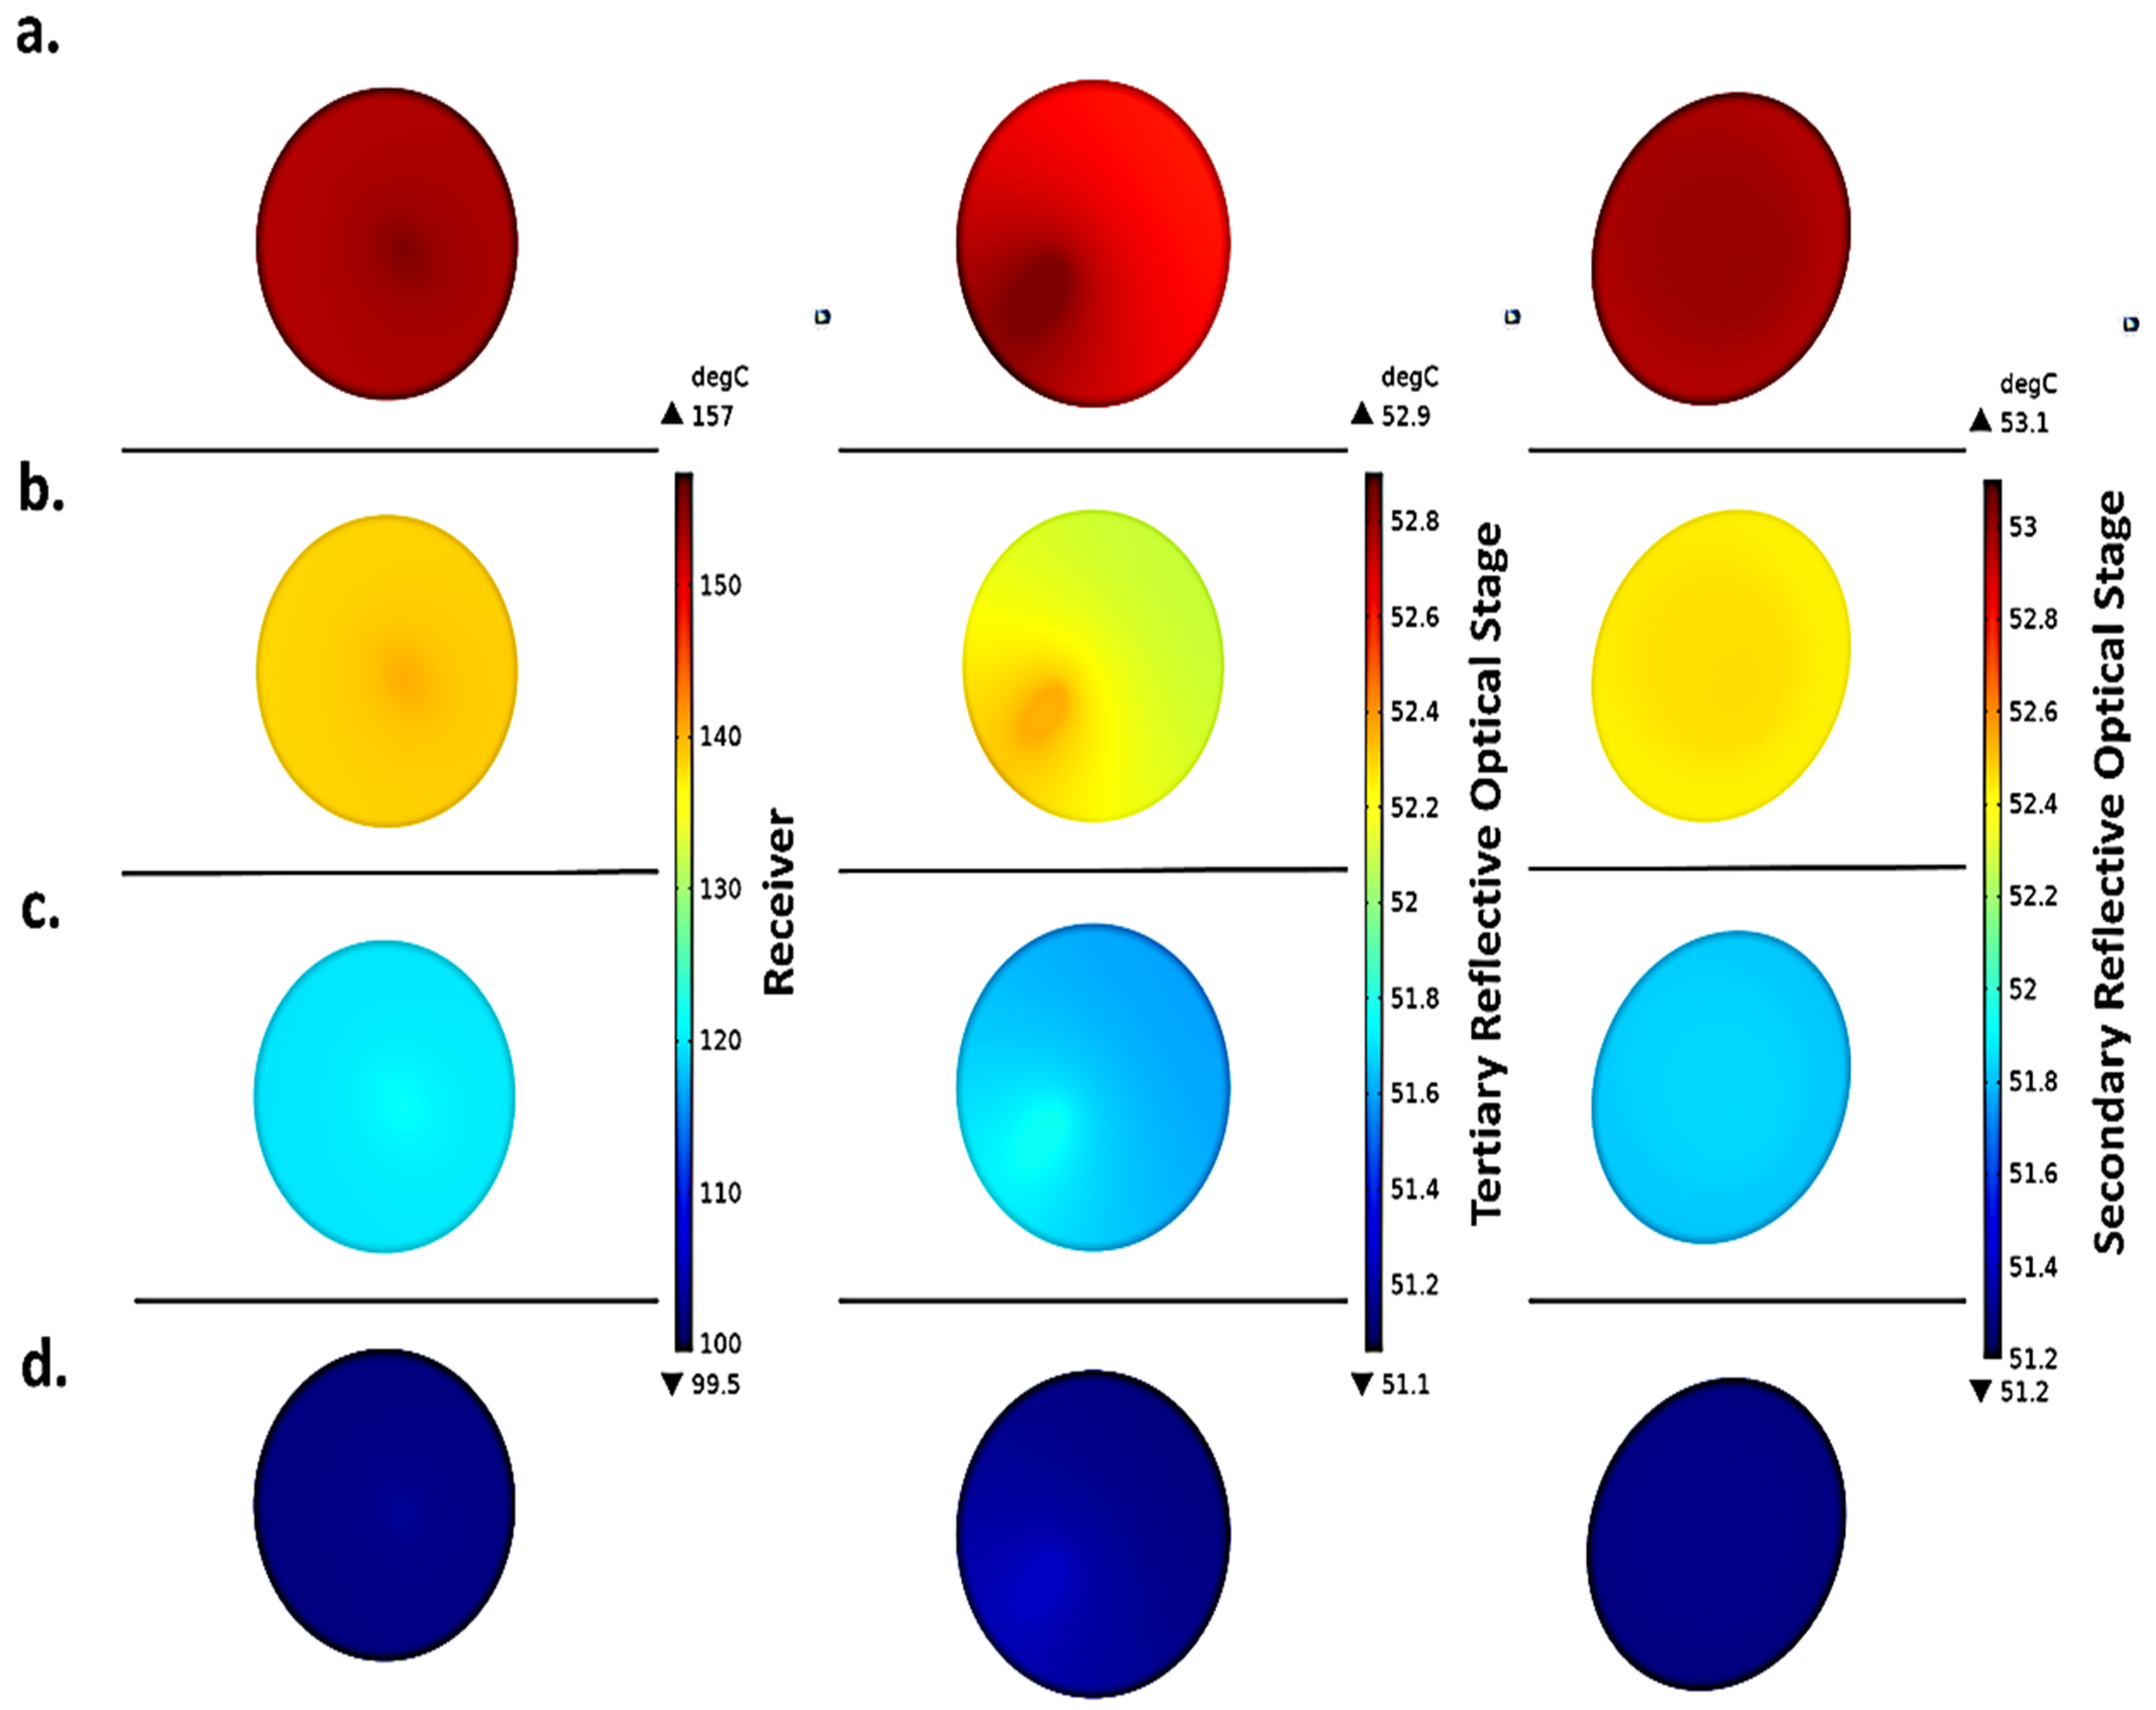
At ambient temperatures of 20   ° C and 50 °C and a convective heat transfer coefficient of 22   W / m 2 . K , the maximum surface temperature was found on the receiver with a value of 101.8 °C. Both Figure 13 and Figure 14 show the temperature stratification on a plain surface with DNI in an interval of 200 W / m 2 . The lowest temperature (safe operation) is at a weather condition of 20 °C at 22 W / m 2 . K , showing a maximum temperature of 74.9 °C.
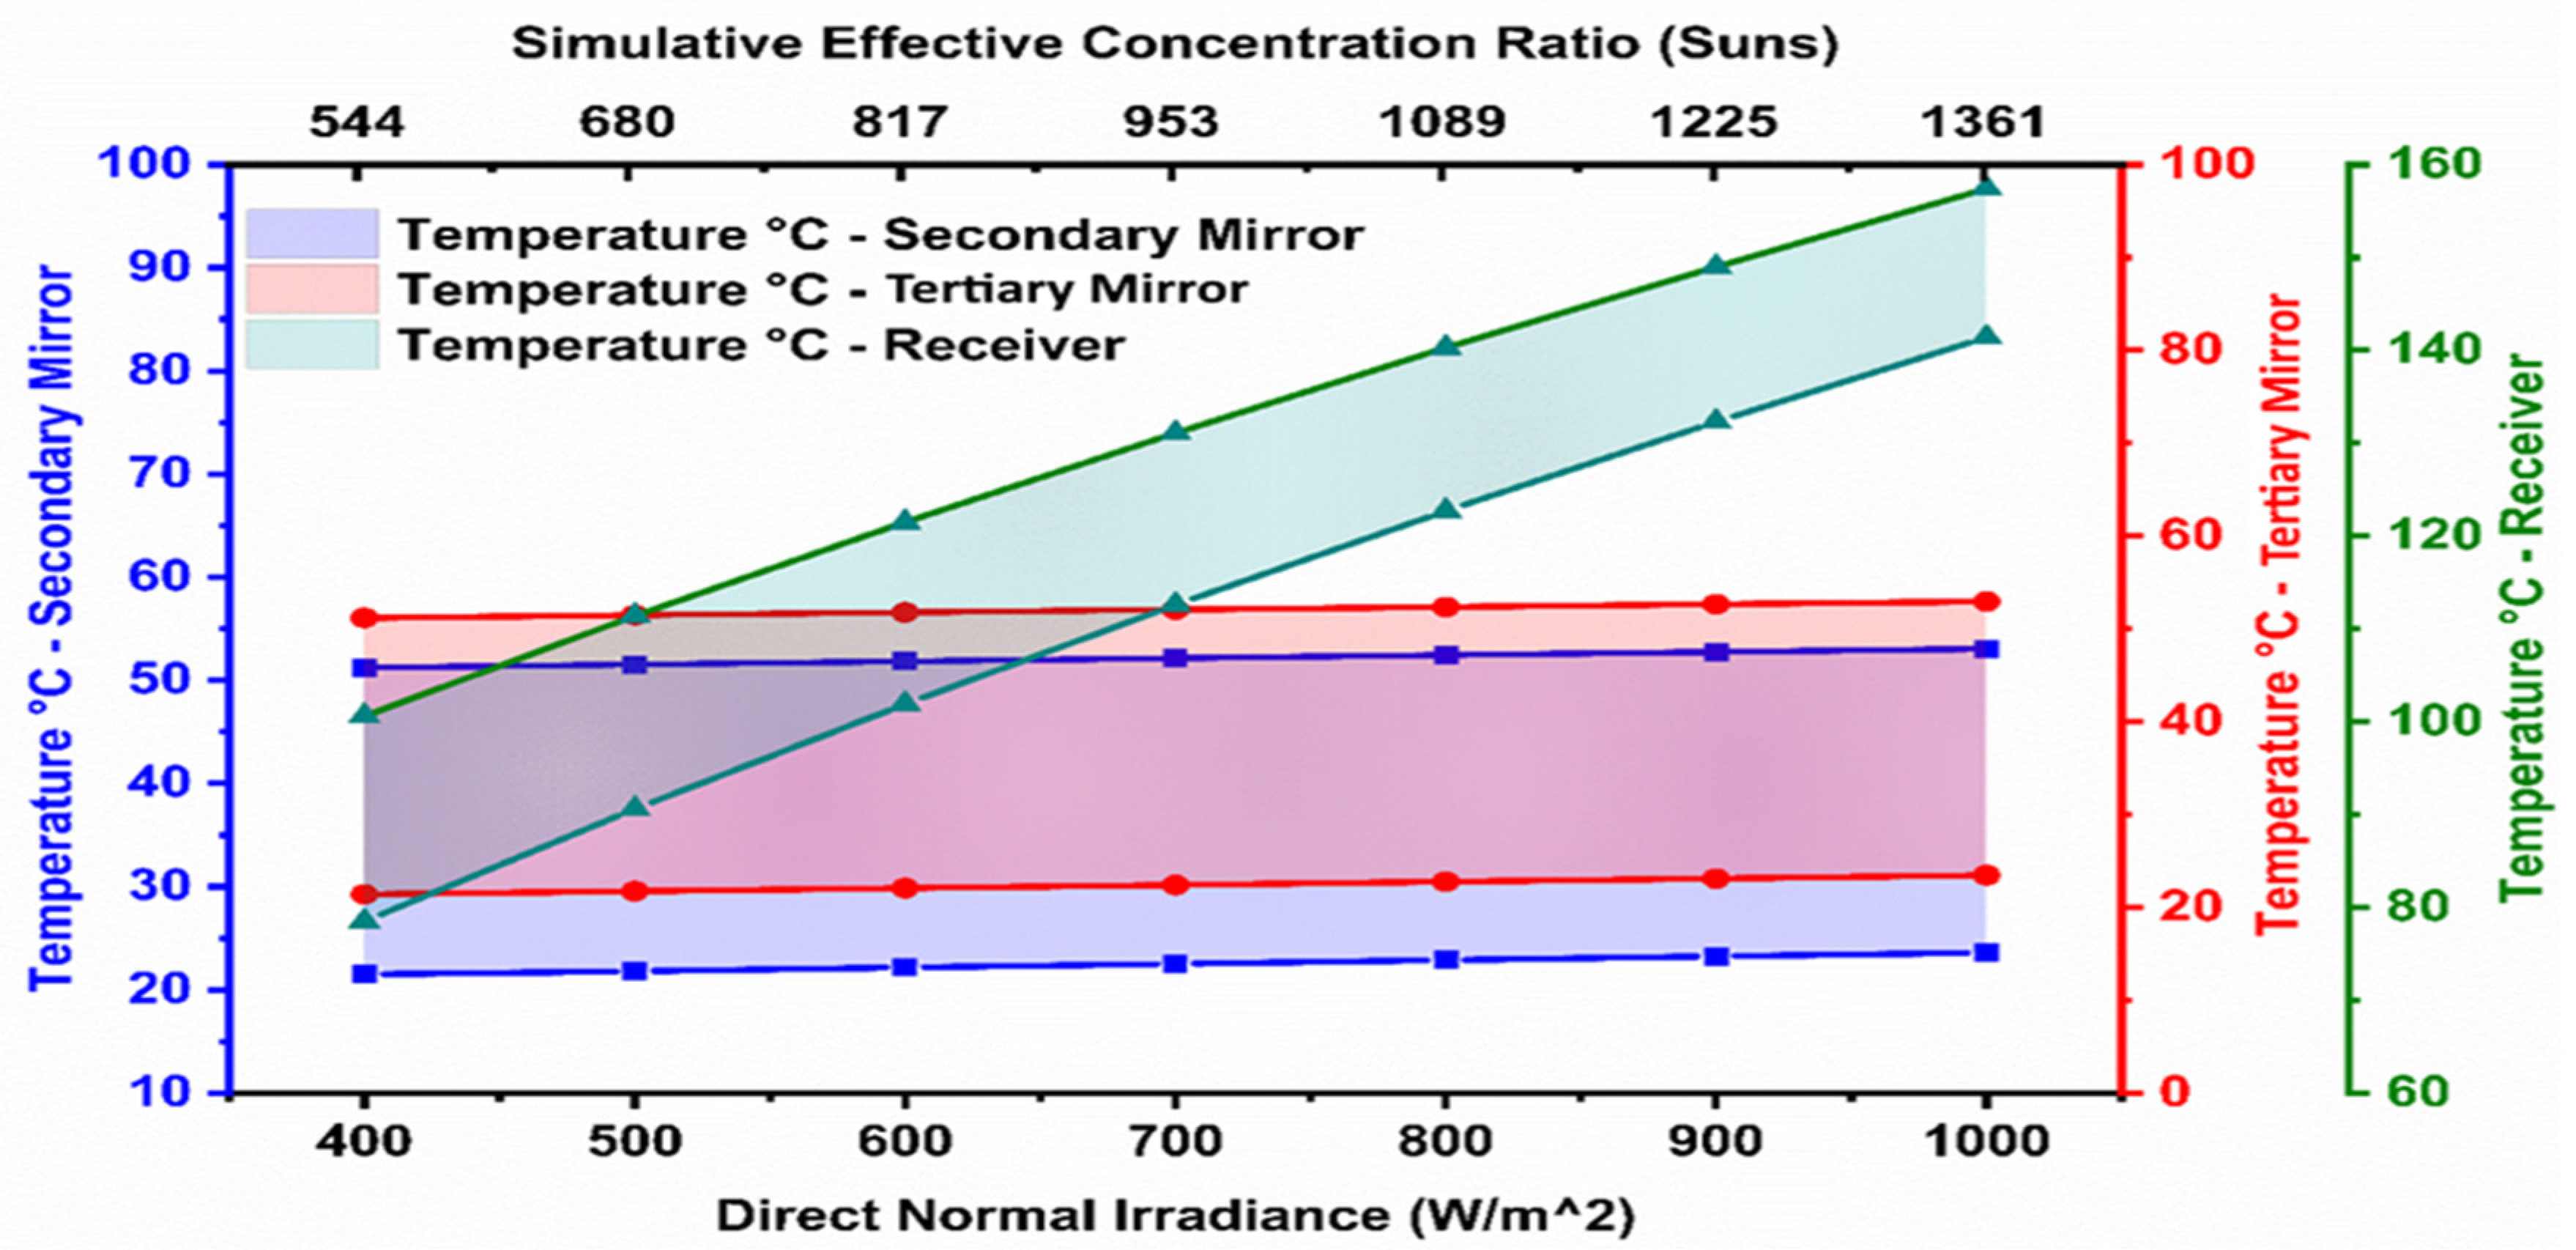
The results of Figure 13 and Figure 14 were combined into one graph (Figure 15) to demonstrate the strong linear correlation with the shading pattern to observe the working range within the selected ambient temperature in accordance with the convective heat transfer coefficient. A clear discrepancy between a model with ambient temperatures of 20 °C and 50 °C at 22 W / m 2 . K shows average values of 49%, 58.9%, and 59% for the receiver, secondary mirror, and tertiary mirror, respectively. Figure 15 represents a strong linear correlation between the output power (effective concentration) and the maximum temperature on the optics.

8. Conclusions

Ensuring the sustainability and long-term viability of ultrahigh-concentration photovoltaic (UHCPV) systems requires a comprehensive and coherent simulation approach. In this study, COMSOL Multiphysics was employed to assess both the optical and thermal behavior of the UHCPV system, providing critical insights into its energy performance under realistic and diverse operating conditions. Direct normal irradiance (DNI) levels were simulated across a broad range, from 400 W/m2 to 1000 W/m2, reflecting various geographic and climatic scenarios. This approach enables the evaluation of optical performance and concentration efficiency in a manner that supports adaptable, location-specific, and sustainable energy solutions. To further enhance the system’s environmental adaptability, a wide spectrum of ambient temperatures and natural convective heat transfer coefficients was explored, considering both optimal and extreme meteorological conditions. This ensures that the system is robust, safe, and efficient under real-world scenarios, which is essential for sustainable deployment. The thermal performance data informs the design of an appropriate passive or active cooling mechanism that is aimed at minimizing energy losses and extending the system’s lifespan. The simulation results showed that the secondary and tertiary reflective optical elements operate within a safe thermal range, avoiding excessive stress that could lead to material degradation. However, the receiver, subjected to temperatures ranging between 74.8 °C and 157 °C depending on solar intensity, requires an effective heat extraction solution. Integrating a sustainable thermal management strategy at this stage is critical to maintaining solar cell efficiency, ensuring system reliability, and supporting the broader goals of clean energy and sustainable power generation. Although this study modeled natural convection to evaluate baseline thermal behavior, previous work by the authors has validated serpentine-based liquid cooling solutions for high-concentration systems. These designs successfully maintained safe operating temperatures (<110 °C) and demonstrated their suitability for integration with UHCPV receivers under extreme thermal loads.

Author Contributions

Conceptualization, T.M., M.A., S.E.A. and S.A.; methodology, T.M., M.A. and S.A.; software, T.M., M.A., S.E.A. and S.A.; validation, T.M., M.A., S.E.A. and S.A.; analysis, T.M., M.A., S.E.A. and S.A.; investigation, T.M., M.A., S.E.A. and S.A.; resources, T.M., M.A., S.E.A. and S.A.; data curation, T.M., M.A., S.E.A. and S.A.; writing—original draft preparation, T.M., M.A., S.E.A. and S.A.; supervision, T.M. and M.A.; project administration, T.M. and M.A.; funding acquisition, M.A. All authors have read and agreed to the published version of the manuscript.

Funding

This research received no external funding.

Institutional Review Board Statement

Not applicable.

Informed Consent Statement

Not applicable.

Data Availability Statement

Data are contained within the article.

Acknowledgments

The authors would like to acknowledge the support provided by Imam Abdulrahman Bin Faisal University (IAU), Dammam, Saudi Arabia.

Conflicts of Interest

The authors declare no conflicts of interest.

References

  1. Steiner, M.; Siefer, G.; Schmidt, T.; Wiesenfarth, M.; Dimroth, F.; Bett, A.W. 43% Sunlight to Electricity Conversion Efficiency Using CPV. IEEE J. Photovolt. 2016, 6, 1020–1024. [Google Scholar] [CrossRef]
  2. Shanks, K.; Ferrer-Rodriguez, J.P.; Fernández, E.F.; Almonacid, F. A > 3000 Suns High Concentrator Photovoltaic Design Based on Multiple Fresnel Lens Primaries Focusing to One Central Solar Cell. Sol. Energy 2018, 169, 457–467. [Google Scholar] [CrossRef]
  3. Wiesenfarth, M.; Steiner, M.; Wolf, J.; Schmidt, T.; Bett, A.W. Investigation of Different Fresnel Lens Designs and Methods to Determine the Optical Efficiency. AIP Conf. Proc. 2014, 1616, 97–101. [Google Scholar] [CrossRef]
  4. Vallerotto, G.; Victoria, M.; Askins, S.; Herrero, R.; Domínguez, C.; Antón, I.; Sala, G. Design and Modeling of a Cost-Effective Achromatic Fresnel Lens for Concentrating Photovoltaics. Opt. Express 2016, 24, A1245. [Google Scholar] [CrossRef] [PubMed]
  5. Shanks, K.; Senthilarasu, S.; Mallick, T.K. High-Concentration Optics for Photovoltaic Applications. In High Concentrator Photovoltaics: Fundamentals, Engineering and Power Plants; Springer: Cham, Switzerland, 2015; pp. 85–113. [Google Scholar]
  6. Vallerotto, G.; Askins, S.; Victoria, M.; Antón, I.; Sala, G. A Novel Achromatic Fresnel Lens for High Concentrating Photovoltaic Systems. In AIP Conference Proceedings; AIP Publishing: Melville, NY, USA, 2016; Volume 1766. [Google Scholar] [CrossRef]
  7. Karp, J.H.; Tremblay, E.J.; Hallas, J.M.; Ford, J.E. Orthogonal and Secondary Concentration in Planar Micro-Optic Solar Collectors. Opt. Express 2011, 19, A673. [Google Scholar] [CrossRef]
  8. Coughenour, B.M.; Stalcup, T.; Wheelwright, B.; Geary, A.; Hammer, K.; Angel, R. Dish-Based High Concentration PV System with Köhler Optics. Opt. Express 2014, 22, A211. [Google Scholar] [CrossRef]
  9. Dreger, M.; Wiesenfarth, M.; Kisser, A.; Schmid, T.; Bett, A.W. Development and Investigation of a CPV Module with Cassegrain Mirror Optics. In AIP Conference Proceedings; AIP Publishing: Melville, NY, USA, 2014; pp. 177–182. [Google Scholar]
  10. Ferrer-Rodríguez, J.P.; Saura, J.M.; Fernández, E.F.; Almonacid, F.; Talavera, D.L.; Pérez-Higueras, P. Exploring Ultra-High Concentrator Photovoltaic Cassegrain-Koehler-Based Designs up to 6000×. Opt. Express 2020, 28, 6609. [Google Scholar] [CrossRef]
  11. Variava, J.M.; Ratnadhariya, J.K.; Siddiqui, M.I.H.; Sadasivuni, K.K. 3D Numerical Model of a Concentrated Photovoltaic Thermal (CPV/T) System for Thermal and Electrical Performance Optimization. Case Stud. Therm. Eng. 2024, 61, 104823. [Google Scholar] [CrossRef]
  12. Nwokolo, S.C.; Eyime, E.E.; Obiwulu, A.U.; Meyer, E.L.; Ahia, C.C.; Ogbulezie, J.C.; Proutsos, N. A Multi-Model Approach Based on CARIMA-SARIMA-GPM for Assessing the Impacts of Climate Change on Concentrated Photovoltaic (CPV) Potential. Phys. Chem. Earth Parts A/B/C 2024, 134, 103560. [Google Scholar] [CrossRef]
  13. Stsepuro, N.; Kovalev, M.; Podlesnykh, I.; Kudryashov, S. A New Approach to Designing Multi-Element Planar Solar Concentrators: Geometry Optimization for High Angular Selectivity and Efficient Solar Energy Collection. Optics 2025, 6, 6. [Google Scholar] [CrossRef]
  14. Alzahrani, M.; Shanks, K.; Mallick, T.K. Advances and Limitations of Increasing Solar Irradiance for Concentrating Photovoltaics Thermal System. Renew. Sustain. Energy Rev. 2021, 138, 110517. [Google Scholar] [CrossRef]
  15. Kiran, M.; Arunachala, U.C.; Varun, K. Effective Thermal Management of Photovoltaic Modules Equipped with Innovative Concentrating Techniques. Int. J. Sustain. Eng. 2025, 18, 2484219. [Google Scholar] [CrossRef]
  16. Attia, M.E.H.; Zayed, M.E.; Kabeel, A.E.; Khelifa, A.; Arıcı, M.; Abdelgaied, M. Design and Performance Optimization of a Novel Zigzag Channeled Solar Photovoltaic Thermal System: Numerical Investigation and Parametric Analysis. J. Clean. Prod. 2024, 434, 140220. [Google Scholar] [CrossRef]
  17. Mouaici, K.; Fersadou, B.; Arslan, K.; Kahalerras, H.; Traiche, M. Technological Limit of Solar Concentration Technique Applied to Hybrid Photovoltaic-Thermal Solar Collector Equipped with Thermoelectric Generator Incorporating Ternary Nanofluid. J. Sol. Energy Eng. 2025, 147, 140220. [Google Scholar] [CrossRef]
  18. Sharaf, O.Z.; Orhan, M.F. Concentrated Photovoltaic Thermal (CPVT) Solar Collector Systems: Part I—Fundamentals, Design Considerations and Current Technologies. Renew. Sustain. Energy Rev. 2015, 50, 1500–1565. [Google Scholar] [CrossRef]
  19. Obaideen, K.; Olabi, A.G.; Al Swailmeen, Y.; Shehata, N.; Abdelkareem, M.A.; Alami, A.H.; Rodriguez, C.; Sayed, E.T. Solar Energy: Applications, Trends Analysis, Bibliometric Analysis and Research Contribution to Sustainable Development Goals (SDGs). Sustainability 2023, 15, 1418. [Google Scholar] [CrossRef]
  20. Azur Space Solar Power GMBH. Enhanced Fresnel Assembly—EFA Type: 3C42A—With 10 × 10mm2 CPV TJ Solar Cell Application: Concentrating Photovoltaic (CPV) Modules; Azure Space Solar Power GMBH: Heilbronn, Germany, 2014; pp. 1–4. [Google Scholar]
  21. Micheli, L.; Sarmah, N.; Fernandez, E.F.; Reddy, K.S.; Mallick, T.K. Technical Issues and Challenges in the Fabrication of a 144-Cell 500× Concentrating Photovoltaic Receiver. In Proceedings of the 2014 IEEE 40th Photovoltaic Specialist Conference (PVSC), Denver, CO, USA, 8–13 June 2014; IEEE: Piscataway, NJ, USA, 2014; pp. 2921–2925. [Google Scholar]
  22. Abo-Zahhad, E.M.; Ookawara, S.; Radwan, A.; El-Shazly, A.H.; Elkady, M.F. Numerical Analyses of Hybrid Jet Impingement/Microchannel Cooling Device for Thermal Management of High Concentrator Triple-Junction Solar Cell. Appl. Energy 2019, 253, 113538. [Google Scholar] [CrossRef]
  23. Abo-Zahhad, E.M.; Ookawara, S.; Radwan, A.; El-Shazly, A.H.; El-Kady, M.F.; Esmail, M.F.C. Performance, Limits, and Thermal Stress Analysis of High Concentrator Multijunction Solar Cell under Passive Cooling Conditions. Appl. Therm. Eng. 2020, 164, 114497. [Google Scholar] [CrossRef]
  24. Alzahrani, M.; Baig, H.; Shanks, K.; Mallick, T. Estimation of the Performance Limits of a Concentrator Solar Cell Coupled with a Micro Heat Sink Based on a Finite Element Simulation. Appl. Therm. Eng. 2020, 176, 115315. [Google Scholar] [CrossRef]
  25. Shohdy, A.; Emam, M.; Sekiguchi, H.; Hassan, H. Performance of New Hybrid Heat Sink with Trimmed Fins and Microchannels for Thermal Control of a Triple-Junction Concentrator Photovoltaic Cell. Appl. Therm. Eng. 2024, 252, 123695. [Google Scholar] [CrossRef]
  26. Gupta, A.; Chougule, S.S.; Saha, S.K. Cooling of Highly Concentrated Photovoltaic Cells with Confined Jet Impingement by Introducing Channel Configurations. Renew. Energy 2024, 237, 121600. [Google Scholar] [CrossRef]
  27. Valera, A.; Fernández, E.F.; Rodrigo, P.M.; Almonacid, F. Feasibility of Flat-Plate Heat-Sinks Using Microscale Solar Cells up to 10,000 Suns Concentrations. Sol. Energy 2019, 181, 361–371. [Google Scholar] [CrossRef]
  28. Zhang, Y.; Xiao, G.; Luo, Z.; Ni, M.; Yang, T.; Xu, W. Comparison of Different Types of Secondary Mirrors for Solar Application. Optik 2014, 125, 1106–1112. [Google Scholar] [CrossRef]
  29. Shurtz, R.C. Total Hemispherical Emissivity of Metals Applicable to Radiant Heat Testing; Sandia National Lab.: Albuquerque, NM, USA; Livermore, CA, USA, 2018. [Google Scholar]
  30. Aldossary, A.; Mahmoud, S.; Al-dadah, R. Technical Feasibility Study of Passive and Active Cooling for Concentrator PV in Harsh Environment. Appl. Therm. Eng. 2016, 100, 490–500. [Google Scholar] [CrossRef]
  31. Alamri, Y.A.; Albaik, I.; Mahmoud, S.; Al-Dadah, R.; Ismail, M.A. Integration of Concentrated Multi-Junction Solar Cells with Small-Scale Organic Rankine Cycle. Energy Convers. Manag. 2021, 239, 114235. [Google Scholar] [CrossRef]
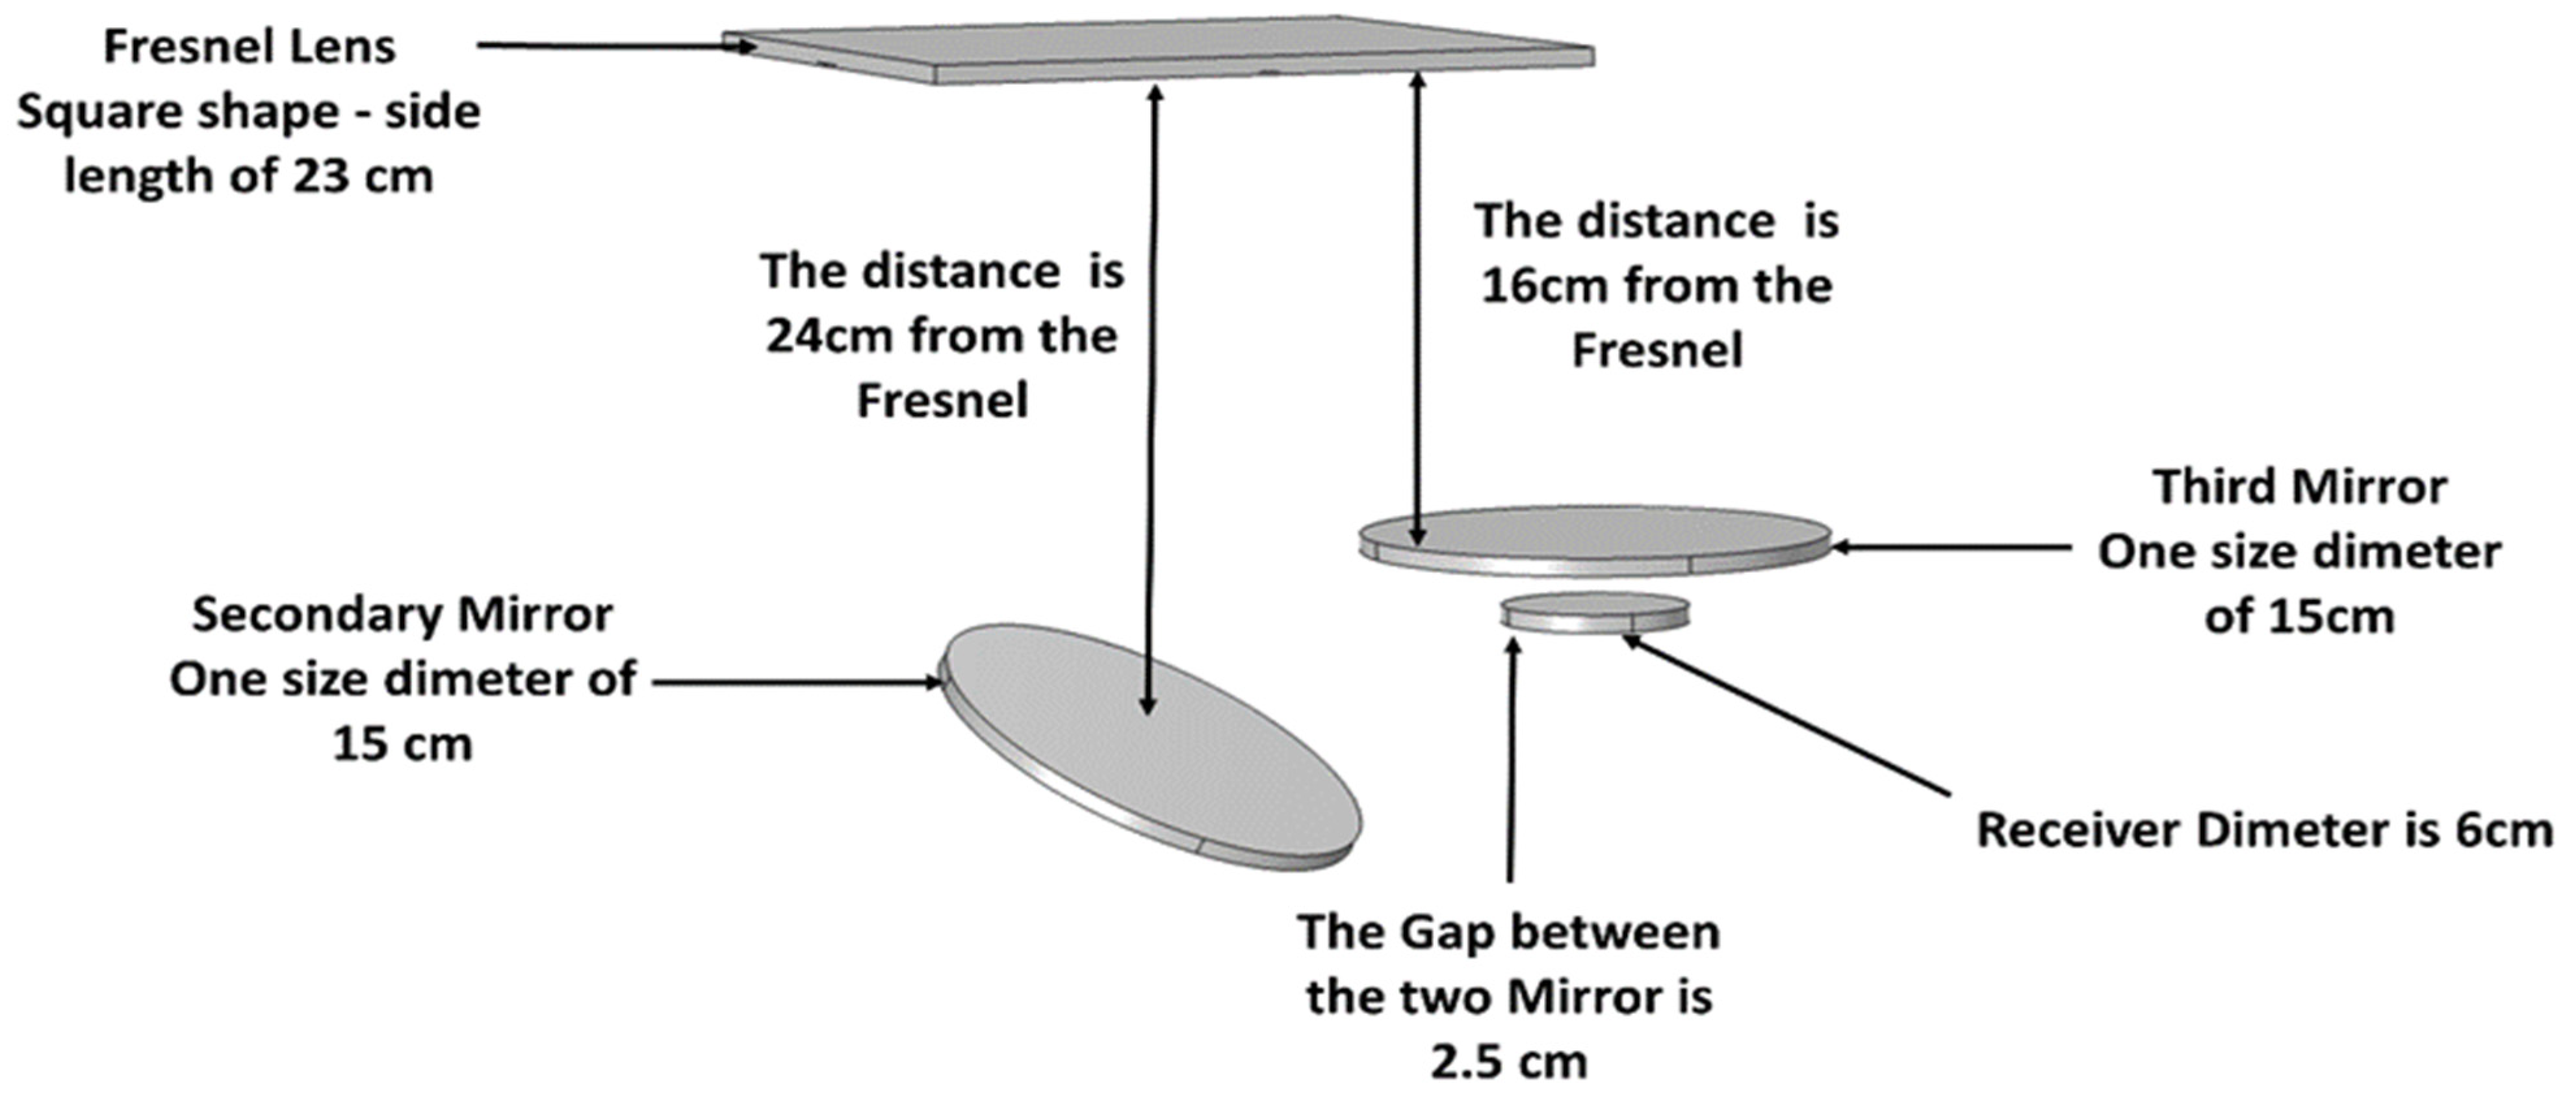
Figure 1. Asymmetric view of ¼ of the UHCPV system with geometrical illustration and optimum position for the highest optical performance.
Sustainability 17 05262 g001
Figure 2. The optical boundary condition in the COMSOL software for 1/4th of the UHCPV system.
Sustainability 17 05262 g002
Figure 3. The thermal boundary condition in the COMSOL software for 1/4th of the UHCPV system.
Sustainability 17 05262 g003
Figure 4. (a) Ray trajectory; (b) 3D temperature distribution.
Sustainability 17 05262 g004
Figure 5. Validation of the numerical model.
Sustainability 17 05262 g005
Figure 6. (a) The ray trajectories for 1/4th of the UHCPV system in a side view and (b) the ray trajectories for 1/4th of the UHCPV system in a top view.
Sustainability 17 05262 g006
Figure 7. Irradiance distribution at 1000 W / m 2 (a) on the optical interfaces and (b) on the magnified receiver.
Sustainability 17 05262 g007
Figure 8. The boundary heat source correlated with the input power on the secondary optics, tertiary optics, and the receiver.
Sustainability 17 05262 g008
Figure 9. Focal spot size at divergence angles of (a) 0.27 ° and (b)   1 ° .
Sustainability 17 05262 g009
Figure 10. The temperature stratification of a plain surface at an ambient temperature of 20   ° C   and a convective heat transfer coefficient of 4 W m 2 . K , where (a) is at 1000 W m 2 ,   b   i s   a t   800   W m 2 ,   c   i s   a t   600   W / m 2 , and d   i s   a t   400   W / m 2 .
Sustainability 17 05262 g010
Figure 11. The temperature stratification of a plain surface at an ambient temperature of 50   ° C and a convective heat transfer coefficient of 4 W / m 2 . K , where (a) is at 1000 W m 2 ,   b   i s   a t   800   W / m 2 ,   ( c )   i s   a t   600   W / m 2 , and d   i s   a t   400   W / m 2 .
Sustainability 17 05262 g011
Figure 12. The linear correlation between the concentration ratio and the temperature at an ambient temperature in a range between 50 °C and 20 °C, and the convective heat transfer coefficient of 4 W / m 2 . K .
Sustainability 17 05262 g012
Figure 13. The temperature stratification of a plain surface at an ambient temperature of 20   ° C and a convective heat transfer coefficient of 22 W / m 2 . K , where (a) is at 1000 W m 2 ,   b   i s   a t   800   W m 2 ,   c   i s   a t   600   W / m 2 , and d   i s   a t   400   W / m 2 .
Sustainability 17 05262 g013
Figure 14. The temperature stratification of a plain surface at an ambient temperature of 50   ° C and a convective heat transfer coefficient of 22 W / m 2 . K , where (a) is at 1000 W m 2 ,   b   i s   a t   800   W m 2 ,   c   i s   a t   600   W / m 2 ,   and d   i s   a t   400   W / m 2 .
Sustainability 17 05262 g014
Figure 15. The linear correlation between the concentration ratio and the temperature at an ambient temperature in a range between 50 °C and 20 °C and the convective heat transfer coefficient of 22 W / m 2 . K .
Sustainability 17 05262 g015
Table 1. The geometry details for the Fresnel lens design.
MaterialSilicon Diameter (Active Area)Focal LengthFresnel Lens Prism SpacingFresnel Lens Prism per LengthFresnel Prism Height IncreaseFresnel Constant AngleAverage Prism AngleTotal Number of GroovesEstimated Optical Edge Loss
Silicon on Glass (SOG)21 cm × 21 cm420 mm0.01 mm4 mm0.04 mm0.55°1.2°525~4%
Table 2. The thermal properties for the optics to solve the heat transfer in the solid model.
Optical and Thermal PropertiesSilica GlassAluminum
Reflective index, real part [dimensionless]1.45-
Thermal conductivity [ W / ( m . K ) ]1.38238
Density [kg/m3]22032700
Heat capacity [J/(kg.K)]703900
Table 3. Average temperature discrepancies between 20 °C and 50 °C scenarios at h = 4 W/m2.K.
Optical ElementAvg. Temp @ 20 °C (°C)Avg. Temp @ 50 °C (°C)% Increase
Receiver89.2157.476.5%
Secondary Mirror37.558.956.9%
Tertiary Mirror 36.957.956.7%
Disclaimer/Publisher’s Note: The statements, opinions and data contained in all publications are solely those of the individual author(s) and contributor(s) and not of MDPI and/or the editor(s). MDPI and/or the editor(s) disclaim responsibility for any injury to people or property resulting from any ideas, methods, instructions or products referred to in the content.