Article

Optimizing Metro-Based Logistics Hub Locations for Sustainable Urban Freight Distribution

1
School of Logistics, Beijing Wuzi University, Beijing 101149, China
2
CCCC Water Transportation Consultants Co., Ltd., Beijing 100007, China
*
Author to whom correspondence should be addressed.
Sustainability 2025, 17(10), 4735; https://doi.org/10.3390/su17104735
Submission received: 1 April 2025 / Revised: 9 May 2025 / Accepted: 19 May 2025 / Published: 21 May 2025
(This article belongs to the Section Sustainable Transportation)

Abstract

:
The fast growth of global e-commerce has made cargo transportation and package delivery more important in cities. However, the limited resources for urban road traffic have made urban logistics distribution less efficient. The global movement toward green sustainability, energy conservation, and emission reduction has heightened awareness of the necessity to enhance urban mobility and transportation. This work further investigates the optimization of distribution hub locations based on subway systems, informed by research on urban distribution modes and the current state of underground logistics. This work presents two unique models: a metro-integrated evaluation model and a distribution hub location model, aimed at identifying the ideal subway logistics station and establishing the distribution center with minimal total logistics costs. A heuristic method, the jellyfish search algorithm (JS) in particular, is carefully explained in order to find a good answer for the model. From an empirical perspective, the district of Chaoyang in Beijing, China, was taken as a case to simulate the progress of identifying an ideal metro station as a city distribution hub, aimed at minimizing total logistical costs. The results indicate that the subway system can be used for city deliveries, and the proposed model and method are very useful for improving the location of delivery hubs in the city. Consequently, when subway facilities allow, we should fully utilize the extensive capacity of the subway transit system to enhance the efficient, environmentally friendly, and sustainable advancement of urban logistics.

1. Introduction

The State Post Bureau of China has announced that by 2024, the volume of express delivery services in China will have reached 174.5 billion items, representing an annual rise of 21.5%. In the same year, the overall amount of same-city express delivery services performed was 15.64 billion items, displaying a 14.6% growth compared to the previous year [1]. The rising demand for e-commerce and logistics, along with the need for speed in the supply chain [2], necessitates convenient, efficient, and effective methods for cargo transportation, which are essential for improving logistics services in urban areas and enhancing residents’ quality of life. Currently, traditional logistics transportation relies on fuel-powered vehicles, including three-wheeled motorcycles and small trucks, for ground goods conveyance. However, ongoing population growth in urban areas and the increase in motor vehicle numbers have resulted in issues such as traffic congestion and urban environmental degradation. These issues also limit the effectiveness of urban logistics distribution. At the same time, in response to governmental mandates for energy conservation and emission reduction, green sharing has become the future trend in city logistical development. Some researchers have previously proposed answers to this issue. Using emerging technologies (such as cargo bikes, autonomous vehicles, and drones) and traditional vehicle collaboration, Perboli and Rosano [3] integrated urban parcel delivery business and operation modes. Schomakers [4] discussed a novel way of freight transportation, specifically employing Ducktrains for last-mile delivery to address urban freight transportation challenges and its potential benefits. This paper proposes the metro logistics system (M-ULS), namely, the subway as a means of urban cargo transportation.
The metro logistics system (M-ULS) uses the available transportation capacity of the metro system during off-peak passenger periods to deliver freight. This strategy not only ensures the safety and punctuality of logistics operations but also aims to enhance the quality of logistics services and increase customer satisfaction [5]. The system is composed of a distribution center, metro stations (i.e., distribution sites), the metro network, and end customers, as depicted in Figure 1. In the first part of the metro logistics system, from the distribution center to the distribution site, distribution can be executed via the metro system or traditional freight trucks. A crisscrossing metro network and most hub stations form the backbone of the system. Workers temporarily store goods at distribution sites near metro stations. In the final phase, specifically from the distribution center to the end consumers, couriers use above-ground transportation tools to collect and send the products to the customers.
The location of distribution centers has always been an important problem in optimizing the logistics system [6]. The logistics distribution center serves as a bridge connecting the distribution hub and the end-users, and it is also a crucial node in the logistics system, greatly impacting the system’s overall effectiveness and operational quality. Finding suitable distribution hub sites in urban regions is difficult due to considerations such as limited land resources and complex urban planning. Furthermore, an inconvenient site can result in greater transit distances, longer delivery times, higher logistics costs, and inefficient distribution networks, all of which greatly decrease the overall efficiency and effectiveness of the urban logistics system. It is essential to position metro logistics hubs in a way that alleviates urban traffic congestion, reduces transportation expenses, minimizes environmental pollution, and promotes sustainable and intelligent urban logistics development [7]. However, the majority of metro stations can function as distribution points. Consequently, selecting an optimization model for the placement of logistics distribution hubs to address these practical challenges has become a key focus in logistics studies. This topic continues to be of considerable interest to numerous scholars [8]. In this paper, we concentrate on two core research questions. Two scientifically sound models are to be developed, one for precise assessment of the feasibility of subway stations as distribution hubs and the other for minimizing urban distribution costs. The second approach involves employing an enhanced heuristic algorithm to address the model and provide an acceptable plan for logistics distribution hubs situated at subway stations.
The next part of this paper is organized as follows: Section 2 discusses the relevant literature from two perspectives: advancements in underground logistics systems and challenges related to the site selection of distribution hubs. In Section 3, we introduce two models: the metro-integrated evaluation model and the site selection model for distribution centers. This subsection includes the influencing variables of the models, model assumptions, objective functions, and constraint conditions. A jellyfish search algorithm solves this model in Section 4. Section 5 delineates the selection of appropriate logistics hub locations. It takes the Beijing Chaoyang Metro Network as a case study and presents analytical views of the findings. Section 6 finishes with an analysis of the present circumstances and offers solutions to mitigate this research’s shortcomings.

2. Literature Review

Over the past decade, city logistics has developed efficient and effective ways to transport goods in urban areas. Consequently, the total number of studies on urban logistics issues has increased dramatically. These studies have presented a wide range of innovative solutions for effective cargo distribution in traffic-congested urban areas. The M-ULS model signifies a comparatively innovative methodology. This section gives a literature review from two viewpoints: Initially, we outline the sustainability and advantages of the M-ULS; secondly, we turn to the matter of how to determine the distribution hubs’ location.
In the 19th century, the telegraph system in London, the United Kingdom, laid the foundation for underground cargo transportation. Many nations in Asia, Europe, and other regions have taken steps to create subterranean cargo transit systems for various uses over the years [9]. For example, in the 20th century, Japan planned a city-wide ULS (underground logistics system) network to alleviate traffic congestion, shifting urban ground transportation to underground transportation [10]. The Dutch government collaborated to develop dedicated tunnels for underground transportation to carry special goods [11]. Yiqun Fan et al. [12] primarily considered the integration of ULS with ports to address traffic congestion caused by container trucks in port cities. In the early 21st century, in the face of the increasingly prominent contradiction between the decline in traditional transportation efficiency and the surge in logistics demand, most research scholars began to explore the feasibility of using subways as a mode of underground logistics transportation [13,14,15]. Researchers believe that the remarkable advantage of utilizing subways for urban freight transit lies in their eco-friendliness and sustainability in the conveyance of commodities. It can reduce resource waste and pollutant emissions generated by the logistics industry, thus promoting urban logistics and green and sustainable development. For example, Zhen Di [16] and his colleagues optimized the subway freight capacity through a mathematical programming model and simulated traffic flow to calculate the saved TFC. The findings indicate that, without impacting passengers, a portion of freight demand can be shifted from vehicles to subways during non-peak times, thus significantly decreasing traffic-related carbon emissions. By building a model and studying the Madrid scenario, Villa et al. [17] found that the M4G metro system is a more sustainable and environmentally friendly way to distribute products in cities.
The selection of nodes in the subway logistics distribution network and the pursuit of more effective solutions have emerged as major research topics for scholars recently. The selection of nodes is of vital importance in the subway logistics system, as it plays a crucial role in determining the location of distribution hubs. Researchers use various models and indicators to evaluate subway stations. For instance, scholars such as Laijun Zhao et al. [18] constructed a metro-integrated logistics system that assessed the significance of each metro station. They employed the TOPSIS model to prioritize all metro stations according to logistical criteria. Shukang Zheng et al. [19] Considering the differences between various subway stations, several elements, including node degree, inner centrality, and nearby centrality, are suggested as evaluative criteria, and an enhanced fuzzy analytic hierarchy process alongside the entropy weight approach is employed to determine index weights. Zhouyang Du et al. [20] have put forward an enhanced Topological Potential Model Considering Entropy (ITPE) to consolidate several metrics by incorporating various centrality measures for assessing the significance of nodes in the metro network. Zheng et al. [21] devised a methodology for site selection of subterranean logistics facilities utilizing the metropolitan metro system. They applied this method to a cost-minimization model for metro transport during off-peak hours. Based on the aforementioned literature and previous studies, this paper considers the dynamic characteristics of logistics demand. By incorporating complex network metrics and subway station passenger flow data, we constructed a metro-integrated evaluation model to determine alternative distribution hub locations. This approach reduces the complexity of the multi-depot location problem and reflects actual logistics service demand across different periods more accurately.
Scholars have employed traditional methods, including the center-of-gravity method [22,23] and the analytic hierarchy process [24,25], to address the site selection problem for various alternative distribution centers. As the quantity of elements in the site selection model grows and constraints get more complicated, standard methods fail to handle the problem quickly and accurately. Consequently, different scholars have proposed a range of heuristic and optimization algorithms, such as the walrus optimization algorithm, Harris hawks optimization, etc. Mengxiao He et al. [26] proposed two novel models related to logistics and distribution center layout, and they compared the convergence of an original bat-inspired algorithm with an improved version, demonstrating the reliability of the models. Siying Zhang et al. [7] used the bilevel programming method to create a location selection model for cold-chain logistics facilities that took consumer preferences and low carbon emissions into account. The model was addressed through the application of the cloud particle swarm optimization algorithm. Wanjie Hu et al. [27] proposed an enhanced multi-objective cooperative co-evolutionary optimization method for the M-ULS network design issue, accounting for unknown demand and costs.
Although research on M-ULS has gradually matured, most studies focus on a single cost factor when constructing models, rarely accounting for total system costs. In addition, for this NP-hard problem, this paper utilizes the JS algorithm, which has superior optimization performance to solve the model. To prevent the algorithm from falling into local optima during the solving process, which may lead to low solution accuracy, the original JS algorithm is slightly improved. This paper addresses these gaps through optimizations in two key aspects: model formulation and algorithm design. This paper’s primary contributions are as follows:
  • The model for locating distribution hubs establishes centers around the subway system and aims to minimize overall costs, incorporating comprehensive cost considerations along with various factors and parameters. In practice, it reflects an operational cost structure while also adapting to diverse operating environments and company needs.
  • The effectiveness of the improved JS algorithm was verified in this paper through a comparison with the original JS algorithm.

3. Model Design

3.1. Metro-Integrated Evaluation Model

This study posits that assessing the significance of subway stations within an urban subway network based exclusively on a singular indicator inadequately evaluates the importance of each particular station. Therefore, we conduct a comprehensive assessment of the importance of subway stations by integrating three metrics specific to each metro station: the degree of its node, the centrality of its betweenness, and the passenger flow of the station itself. This approach helps to evaluate subway stations by indicating alternative distribution center locations, refines the parameters for alternative site selection strategies, simplifies the resolution process of multi-distribution center site selection models, and strengthens the efficiency of addressing subway-related distribution center site selection strategies.
  • Degree of the metro node
In urban logistics networks, the degree value of a node indicates its characteristics within the network. From a network topology perspective, a higher degree value signifies a more critical role for the node in the overall network. If i is a node, its degree value D C i reflects the total number of edges directly connected to it (Equation (1)). Thus, the degree of a node represents the amount of neighboring nodes it has.
D C i = k i
The degree of connectedness, or “node degree”, at a metro station can be determined by counting the number of stations directly adjacent to it, which serves as an indicator of the station’s accessibility. In an urban subway transit network, a node degree of 1 represents an endpoint, which can be either the metro line’s origin or terminus. A node with a degree of 2 typically represents a mid-line position, whereas nodes with degrees greater than 2 represent transfer points within the metro system. Moreover, the higher the degree value is, the greater the quantity of subway lines passing through the station will be. Such an arrangement makes travel at the subway station more convenient, and the station will also handle a larger passenger flow. Therefore, such a subway station generally has a relatively high level of importance. Figure 2 depicts the requirements for defining a node’s degree.
  • Node betweenness
Node betweenness measures how often a node appears in all the shortest paths within a network. A higher median value for a node indicates its greater significance as a bridging element; in other words, more shortest paths utilize that node as an essential waypoint. Equation (2) indicates the proportion of all shortest paths between the two points in the metro network that pass through a certain node, represented by i [18].
B C i = s i t σ s t i σ s t
where σ s t i represents the quantity of shortest pathways traversing node i within the shortest path connecting any two nodes s and t . σ s t represents the total of shortest paths between s and t .
  • Metro station passenger flow
The concept of customer flow in a metro station refers to the total number of passengers entering and exiting the station within a designated period. This metric represents the real operations at the site and functions as a crucial indication for evaluating the operational efficiency and significance of metro stations [28]. Increased passenger traffic indicates a greater significance of the hub. Because subway stations lack fixed entrances and exits, we count all passengers passing through the station to determine the overall traffic.
  • Metro-integrated evaluation model
To rectify dimensional differences among these three indicators, we standardize them utilizing the standard deviation approach. We will utilize Equation (3) to examine the data related to these indicators in a dimensionless manner.
Z = X X ¯ S
where X are the unprocessed data regarding the values of each indicator. X ¯ is the mean value for each indication. S denotes the standard deviation of the data for every parameter value, while Z represents the outcome of a dimensionless quantity.
To simplify the calculation process, Equation (4) is used for the arithmetic summation of dimensionless data. It serves as a composite indicator to evaluate metro stations’ significance.
Z i = Z D C i + Z B C i + Z A i
where Z i is the outcome of a comprehensive evaluation of the metro station. Z D C i is the degree of the node that undergoes dimensionless processing. Z B C i is the betweenness centrality value of the node for dimensionless processing, and Z A i is the value of passenger flow at the site that has been processed dimensionless.
Ultimately, by arranging the comprehensive importance values of each subway station based on the equation, we can determine the ranked significance of metro stations within each network, allowing for the selection of stations with greater comprehensive importance as potential distribution hub sites.

3.2. Site Selection Model

3.2.1. Model Assumptions

To address issues such as urban traffic congestion and logistics distribution difficulties, this paper designs a diversified urban logistics distribution system featuring “urban distribution centers + urban delivery centers (relying on subway stations) + end-demand points”. This system aims to contribute to the green and sustainable development of city logistics. It leverages rail transit, specifically the subway transportation system, to handle part of the urban freight transportation demands and carry out urban logistics distribution. Therefore, the study of determining hub site locations in this model must thoroughly evaluate the distribution of terminal demand spots, the configuration of metro stations and lines, and the adjacent traffic conditions, along with the principles of reducing transfers and optimizing proximity. Consequently, we have established the subsequent assumptions:
  • The transit between the urban logistics distribution center and hub sites exemplifies a one-to-many relationship.
  • A hub site can accommodate numerous demand points, establishing a one-to-many interaction.
  • The distribution center is unable to supply directly to the terminal demand points in the logistics transportation chain.
  • The total demand of endpoints served by the same distribution center must not exceed the center’s maximum capacity, and the center’s capacity must be sufficiently substantial. Therefore, when estimating the transportation volume of the distribution center, it is advisable to assume 1.2 times the total logistics demand.
  • The hub sites are located within the city and possess designated logistics and distribution zones, thereby restricting the reach of their logistics and distribution services.
  • Establishing a hub site incurs operational expenses; hence, an increase in distribution locations results in a higher overall cost.

3.2.2. Symbol Description

A collection of urban distribution centers, alternative hub sites, and end demand points are designated as V H , V D and V C , respectively. A collection of all nodes is V , V = V H V D V C . The relevant symbols and variables of the spot in the model are listed in Table 1 and Table 2.

3.2.3. Model Components

  • Logistics and transportation costs between distribution centers and hubs C 1
This article only considers urban distribution relying on the subway transportation system. The transportation cost refers to expenses related to subway stations, subway transit, and interline transfer fees. The cost associated with entering and exiting subway stations, as well as the transfer costs across subway lines, is directly proportional to the volume of logistical distribution. The cost of subway transportation is directly proportionate to the quantity of deliveries and the distance covered. Therefore, the calculation of subway-based distribution logistics costs is as follows:
C 1 = i V H j V D u 1 q i j + u 2 q i j N i j + u 3 q i j d i j x j
where u 1 shows the price for each piece of commodities entering and leaving the metro station, u 2 denotes the transfer cost per unit of goods between metro lines, u 3 is the metro operating expense per unit of goods per unit distance, and N i j denotes number of transfers between distribution centers i and hub sites j .
  • Operating expenses for the distribution hub C 2
The operational expenses of the distribution center C 1 cover fixed operating costs C 2 1 (including rent, utilities expenses, etc.) and variable operating costs C 2 2 (such as handling, loading and unloading, sorting expenses, etc.). The variable operational expenses of urban transportation hubs are directly proportional to the volume of logistical activities. The precise equations are as follows:
C 2 = C 2 1 + C 2 2
C 2 1 = j V D x j C j
C 2 2 = u 4 j V D Q j
Q j = k V C q k y j k
where u 4 is the dynamic operating expense per unit of items in the hub site, C j denotes the fixed operating costs of hub sites j , and Q j is the total logistics operation of hub site j .
  • Logistics transportation cost between distribution hubs and end demand points C 3
Given that the power consumption cost of new energy freight vehicles is lower than the fuel consumption cost of traditional fuel-powered freight vehicles, which leads to reduced transportation expenses, this paper opts to utilize new energy vehicles as logistics distribution tools from the distribution hub to end-demand points. The transportation expense associated with the end-use of new-energy freight vehicles is directly related to both the end-transportation volume and the distribution distance. We outline the formula below:
C 3 = j V D k V C u 5 q k d j k y j k
using C 3 to denote the logistics transportation costs between hub sites and end demand points, and u 5 symbolizes the terminal transportation cost per unit distance for express delivery.

3.2.4. Model Construction

The objective of the location model is to lower the expenses in connection with urban logistics. This category includes the expenditures associated with metro logistics transportation, the operational expenses of hub locations, and the terminal transportation costs. Equation (11) delineates the objective function as follows:
M i n C T = C 1 + C 2 + C 3 = C 1 + C 2 1 + C 2 2 + C 3 = i V H j V D u 1 q i j + u 2 q i j N i j + u 3 q i j d i j x j + j V D x j C j + u 4 j V D k V C q k y j k + j V D k V C u 5 q k d j k y j k
The constraints for the location model are summarized below:
y j k L , j V D , k V C
j V D x j N D
i V H q i j = Q j = k V C q k y j k
x j = M a x y j k , j V D , k V C
x j = 0 , 1 , j V D
y j k = 0 , 1 , j V D , k V C
where constraint Equation (12) defines the limitations on the logistics service area for the hub site. Constraint Equation (13) imposes constraints on the total number of hub sites. Constraint Equation (14) reflects the overall operating capacity of the hub, ensuring it meets the total demand at the demand point and aligns with the total distribution volume across all hubs. Constraint Equation (15) specifies that a hub site should be established when logistics activities take place between the hub and the demand point. Constraint Equations (16) and (17) set the decision variables to either 0 or 1, outlining their specific conditions.

4. Artificial Jellyfish Search Algorithm

4.1. Algorithm Principle

Jellyfish are among the most common marine organisms. They live in waters of varied depths and temperatures all over the world and come in a diverse range of colors, sizes, and shapes. These traits illustrate the remarkable adaptability of jellyfish to the marine ecosystem. Additionally, jellyfish are capable of controlling their movements. Their abdomens contract like umbrellas, pushing water out to propel their bodies forward. Despite having this ability, they mostly drift in the water. Jellyfish can only create swarms when living conditions are good.
Various elements, such as ocean currents, oxygen consumption rates, and predation, influence the emergence of a jellyfish swarm. Of these factors, ocean currents are the most critical. The primary drivers of ocean currents are solar heating and wind acting on the ocean surface. This feature, together with the unique movement of each jellyfish within the swarm and its evolution in accordance with ocean currents, allows jellyfish to emerge almost anywhere in the sea. Because the amount of food changes from location to location, comparing it at each site might help establish the ideal position. In 2020, Chou et al. [29] introduced the Jellyfish Optimization Algorithm based on the aforementioned jellyfish movement and nutrition hunting procedures.

4.2. Algorithm Design

We employ the jellyfish search algorithm, known for its superior optimization features, to deal with the logistics hub site location problem. The precise stages are outlined below, and the algorithmic flow is illustrated in Figure 3.
Stage 1: initializing the population. The jellyfish search algorithm relies on a more efficient and quickly randomized logistic map to augment population variety, as the limited diversity of the initial population can result in a sluggish convergence rate or predispose the model to local optima. Equation (18) reads as follows:
X i + 1 = η X i 1 X i , 0 X i 1
among them, X i is the logistic chaotic value of the position of the i -th jellyfish, and the value range of i is 1 , 2 , , N P ; η is a control parameter, and the value is 4.
In the code, initialize the jellyfish populations with a population size of N P and a maximum amount of iterations m . The fitness value for each individual is calculated using the fitness function and is stored in f x . The current set of individual optimal fitness values is f p b e s t = f x 1 , f x 2 , f x 3 , f x N P . Following this, we need to identify the location of the best jellyfish at the start.
Stage 2: time control mechanism. Over time, the algorithm must implement a temporal control mechanism to regulate the transition between movement modes. C t represents the temporal control functions, which are stochastic values that vary between 0 and 1 across time [30]. Equation (19) reads as follows:
C t = 1 t m × 2 × r a n d 0 , 1 1
Stage 3: The value of C t determines the population’s migration. If C t 0.5 , jellyfish movement aligns with the ocean current, then the position update algorithm is delineated in Equation (20). Vice versa for intra-cluster movement and perform step four calculations.
X i t + 1 = X i t + r a n d 0 , 1 × X β × r a n d 0 , 1 × μ
In the formula, t is the literation number, X is the optimal position of the current jellyfish population, μ is the average position of all jellyfish, and β is a distribution coefficient ( β = 3 ).
Stage 4: simulation of jellyfish swarms. In the initial stage of jellyfish swarm formation, most jellyfish exhibit passive behaviors. However, as time goes by, an increasing number of jellyfish display active behaviors. If C t < 0.5 and r a n d 0 , 1 > 1 C t , the jellyfish population exhibits passive movement with the following Equation (21) [29].
X i t + 1 = X i t + γ × r a n d 0 , 1 × U b L b
where U b and L b are the upper and lower bounds of the delimited area, respectively, and γ is a motion coefficient. Gradually, 1 C t rises from 0 to 1, resulting in r a n d 0 , 1 1 C t prompting jellyfish to transition from a passive to an active mode of locomotion during internal movement 13. This means the revised position of each jellyfish can be seen as follows (Equation (22)):
X i t + 1 = X i t + r a n d 0 , 1 × X j t X i t
where X i is the original jellyfish, and X j is the randomly selected jellyfish.
Stage 5: boundary constraints. Boundary control is executed utilizing Equations (23) and (24) [12], while the fitness value and the optimal position of each jellyfish are computed.
X i , d = X i , d U b , d + L b d ,   if   X i , d > U b , d
X i , d = X i , d L b , d + U d ,   if   X i , d < L b , d
where X i , d is the position of the i -th jellyfish in the d-dimension, X i , d is the updated position of the i -th jellyfish in the d-dimension, and U b , d and L b , d are the upper and power boundaries of the delimited region, respectively.
Stage 6: Reiterate Steps 2 to 5 until the termination criteria are satisfied, which include reaching the maximum number of iterations and identifying an optimal solution.
The jellyfish search algorithm exhibits rapid convergence and strong optimization ability, yet it is prone to slow convergence in certain instances and may readily become trapped in a local optimum. To enhance the efficacy of the jellyfish search algorithm, we opted to modify the position and velocity of jellyfish via Lévy flight trajectories. The following Formula (25) is used by the improved algorithm to replace the old algorithm’s method for updating speed and location.
x i t + 1 = x i t + L λ x i t x
where x i t is the spatial position of the jellyfish in the search t . x is the position of the best jellyfish in this group. Lévy λ represents the random searching vector where the step size of the walk is subject to Lévy distribution. λ is the scale parameter.

5. Case Study

5.1. Screening of the Alternate Metro Hub Site

  • The degree of Chaoyang region metro nodes
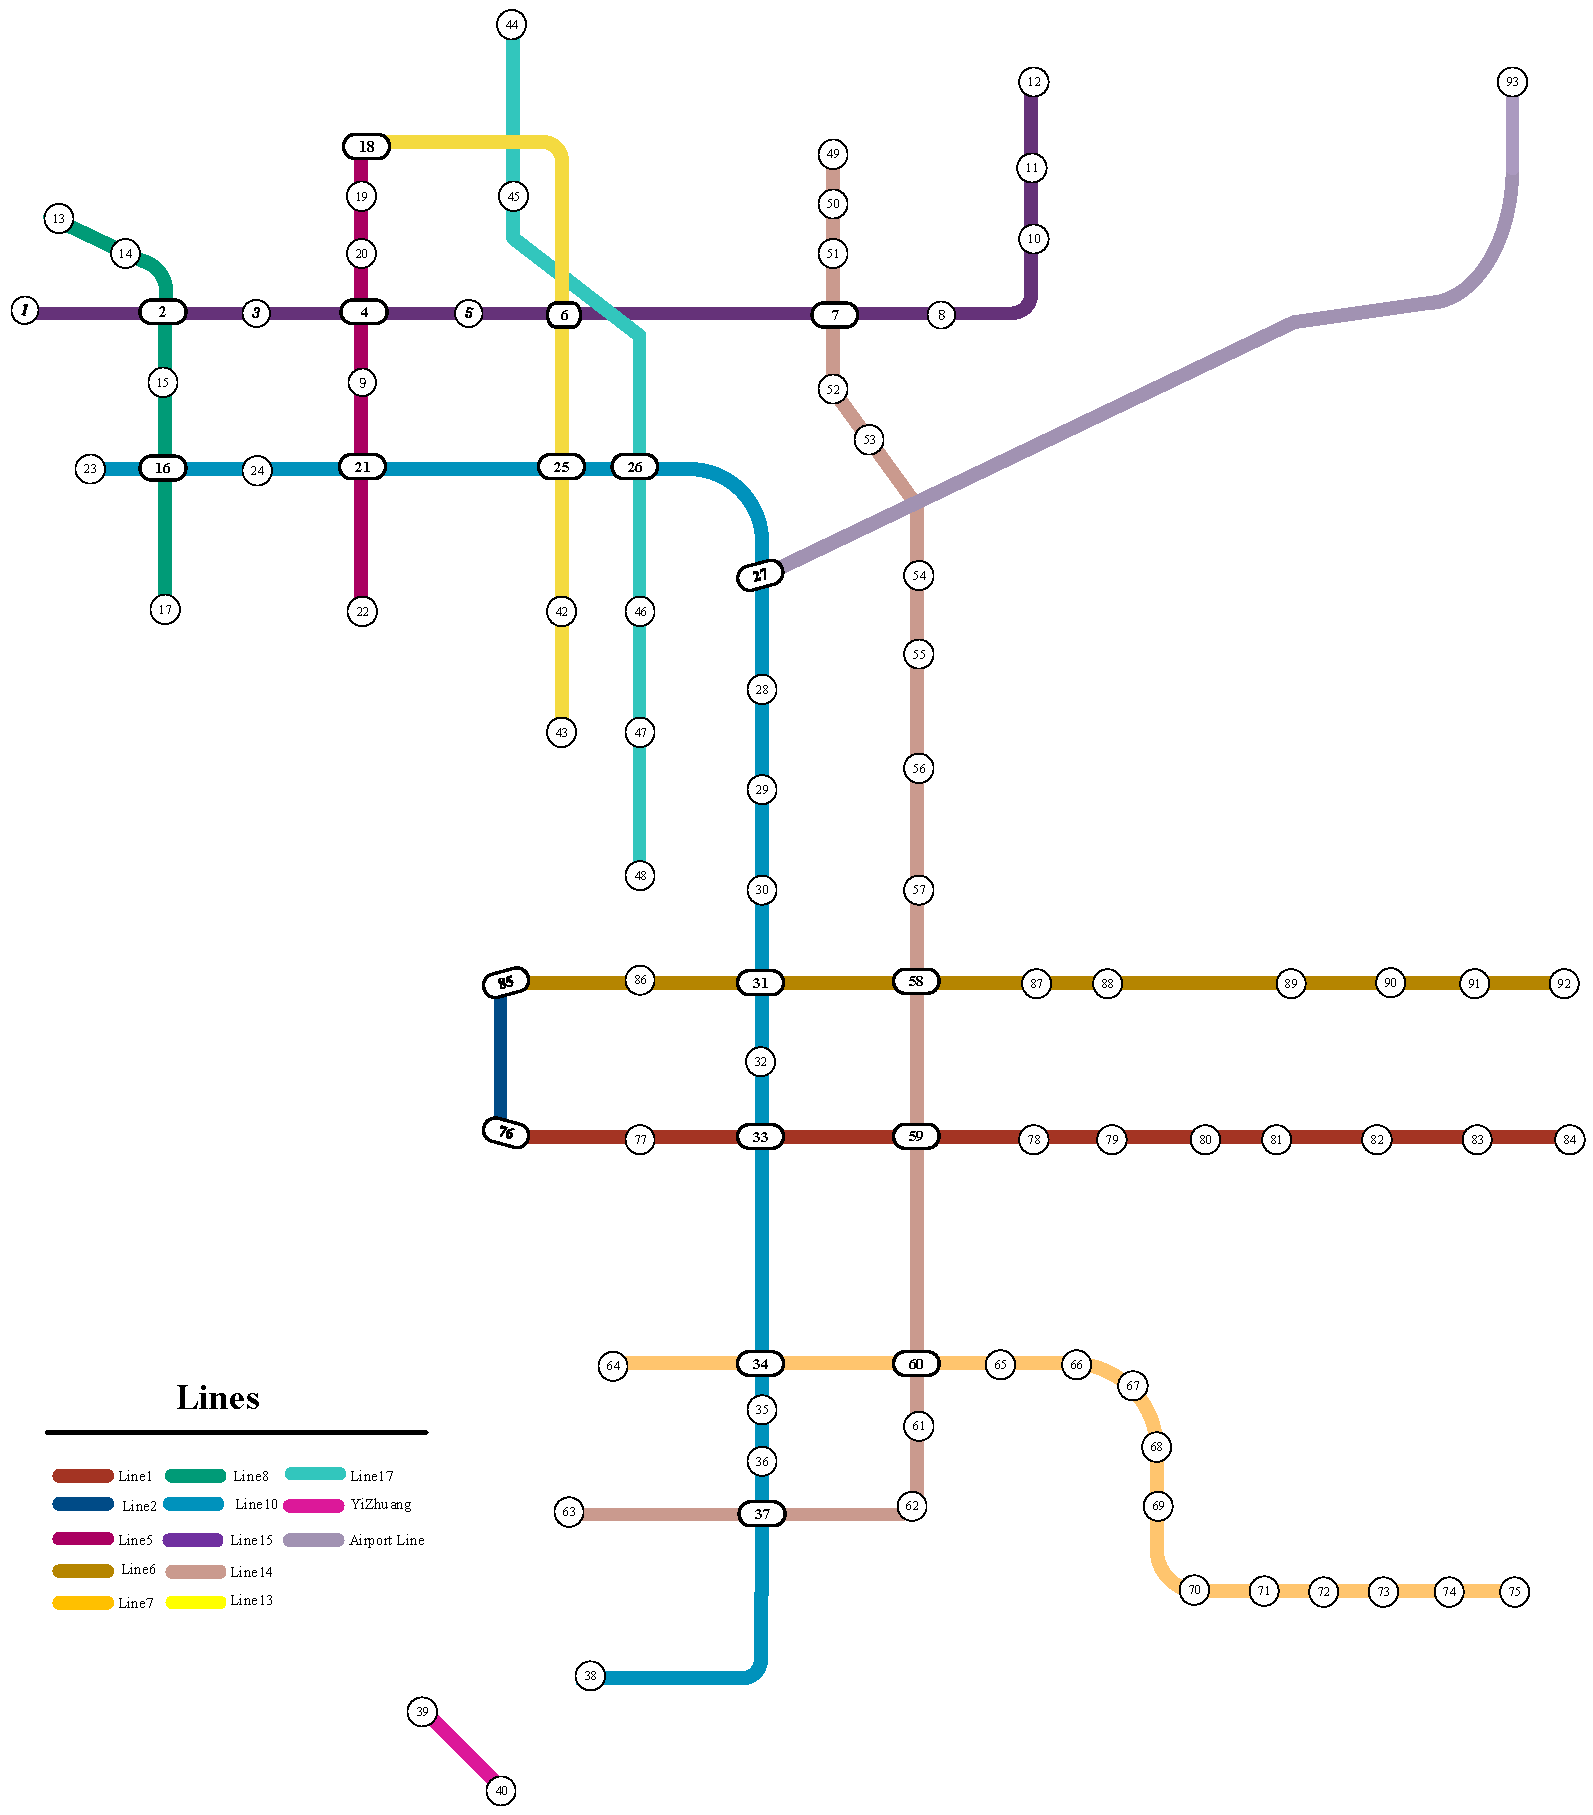
The official websites of Beijing Metro and Beijing MTR indicate that Chaoyang District, Beijing, has 13 subterranean lines and 93 metro stops. The degree values of the metro station nodes listed in Table 3 can be computed using Equation (1) and the topology map of the Chaoyang metro network depicted in Figure 4.
  • The node betweenness of the Chaoyang region metro
The topological map of the Chaoyang metro network and Equation (2) reveal 93 metro nodes along with their betweenness values, as presented in Table 4. It directly shows that some of the 93 metro nodes, like nodes 15, 31, and 57, have relatively high betweenness values. A high betweenness rating, on the one hand, implies that the related node is an important transit point in the metro system. On the other hand, it highlights the key role of these stations in terms of linkage and flow regulation in urban distribution.
  • The passenger flow of Chaoyang region metro station nodes
Due to the sensitive nature of passenger flow data at each Beijing underground station, we are restricted to accessing flow statistics for each subway line alone. We classify the 93 metro stations into three levels, with each level denoting a specified percentage of the passenger traffic for the respective subway line. This classification enables us to assess the patronage for each station. Table 5 highlights the stages of metro passenger flow.
Level 1: Numerous metro intersections function as transfer stations, comprising 50% of the overall passenger flow.
Level 2: Within a three-kilometer radius, commercial or enterprise parks constitute 30% of the overall ridership.
Level 3: Alternative stations comprise 20% of the overall passenger traffic.
Official data from Beijing and the Beijing–Hong Kong metros indicate that the average daily passenger flow of the Chaoyang metro lines in 2023 is presented in Table 6.
  • The integrated evaluation of Chaoyang metro station nodes
The previously mentioned three indications have been rendered dimensionless using Equation (3), and all data can be derived using Equation (4). The integrated evaluation values of ninety-three metro stations are presented in Table 7.
In conclusion, the node values of 2, 7, 27, 31, 33, 36, 58, and 59 are ranked higher among the 93 metro station nodes, corresponding to the Olympic Park, Wangjing, Sanyuanqiao, Hujialou, Guomao, Panjiayuan, Jintailu and Dawanglu metro stations, respectively. These metro nodes serve as alternative hub sites for researching the greatest rational locations in the Chaoyang District of Beijing.

5.2. Data Acquisition

  • Distribution center
Consultation of the logistics Waybill Information, Beijing Planning, and Gaode map reveals the existence of a large distribution center in Chaoyang District, Beijing, namely the Beijing transit center. The coordinate details of the neighboring subway station, including longitude and latitude, are presented in Table 8 below.
  • Alternative hub sites and end demand points
The integrated importance evaluation analysis of subway stations in Section 5.1 indicates that in Chaoyang District, Beijing, stations such as Olympic Park, Wangjing, Sanyuanqiao, Hujialou, Guomao, Panjiayuan, Jintailu, and Dawanglu are key to the subway system and play a vital role in improving logistics in Chaoyang District. Consequently, this report designates the aforementioned subway stations as the sites for alternative distribution hubs. Table 9 presents the fundamental information, including the latitude and longitude coordinates of these metro stations.
The current development models of urban logistics indicate a gradual shift towards collaboration and sharing in last-mile delivery. In the case study, the last-mile demand points, which are the places where customer needs come together, focus on express terminal outlets, express collection sites, and smart lockers. Therefore, based on the population density, the following 26 end demand points are selected as the research targets, and their basic information is presented in Table 10 as follows.
  • Distance and transfer times between different regions
The distances between the Beijing transit center and alternative hub stations, along with the number of interchanges between subway nodes, were calculated using the latitude, longitude, and the Beijing subway route map, as presented in Table 11.
For the sake of simplifying mathematical calculations, the Earth is regarded as an ideal sphere. Subsequently, we compute the distance metrics between various hub locations and final demand points utilizing their coordinates, as shown in Table 12.

5.3. Case Study Solution

This research employs MATLAB R2024a and the jellyfish search algorithm to tackle this location model. We conduct an analogical evaluation based on factors such as subway ticket prices, the pricing of express delivery fees by multiple large-scale express delivery companies, and the consumption of new energy freight vehicles. Then, we define the subsequent expenses: The fee for entering and exiting a metro station is RMB 0.2 per transaction; the charge for transferring between metro lines is RMB 0.1 per transaction; the expense of metro transportation is RMB 0.01 per item for each kilometer; the operational cost of a distribution center is RMB 0.01 per piece; and the expense for end-of-line transport per unit of distance per unit of cargo is RMB 0.01 per piece per kilometer. The relevant parameters of the algorithm are presented in the following Table 13.
Considering that the locations of the hub sites are all in Chaoyang District, the differences in rental costs and utility costs will not be so huge that the fixed operating costs of the hub sites are all set at 80,000 RMB/year, and the maximum coverage of the hub sites is set at 13 km. According to the related data and demand forecast, we assumed 5.06 billion pieces as the Chaoyang demand of average annual express. But the transportation volumes q i j between distribution center i and hub sites j and the logistics demands q k of end demand point k are obtained difficultly. In this case, based on real conditions, we make a rational assumption for q i j and q k in Table 14 and Table 15, the capacities of eight alternative hub sites and the cargo demand volumes of 26 end demand points, respectively.
Utilizing the jellyfish search algorithm and MATLAB R2024a software, we conducted calculations based on the aforementioned data. 
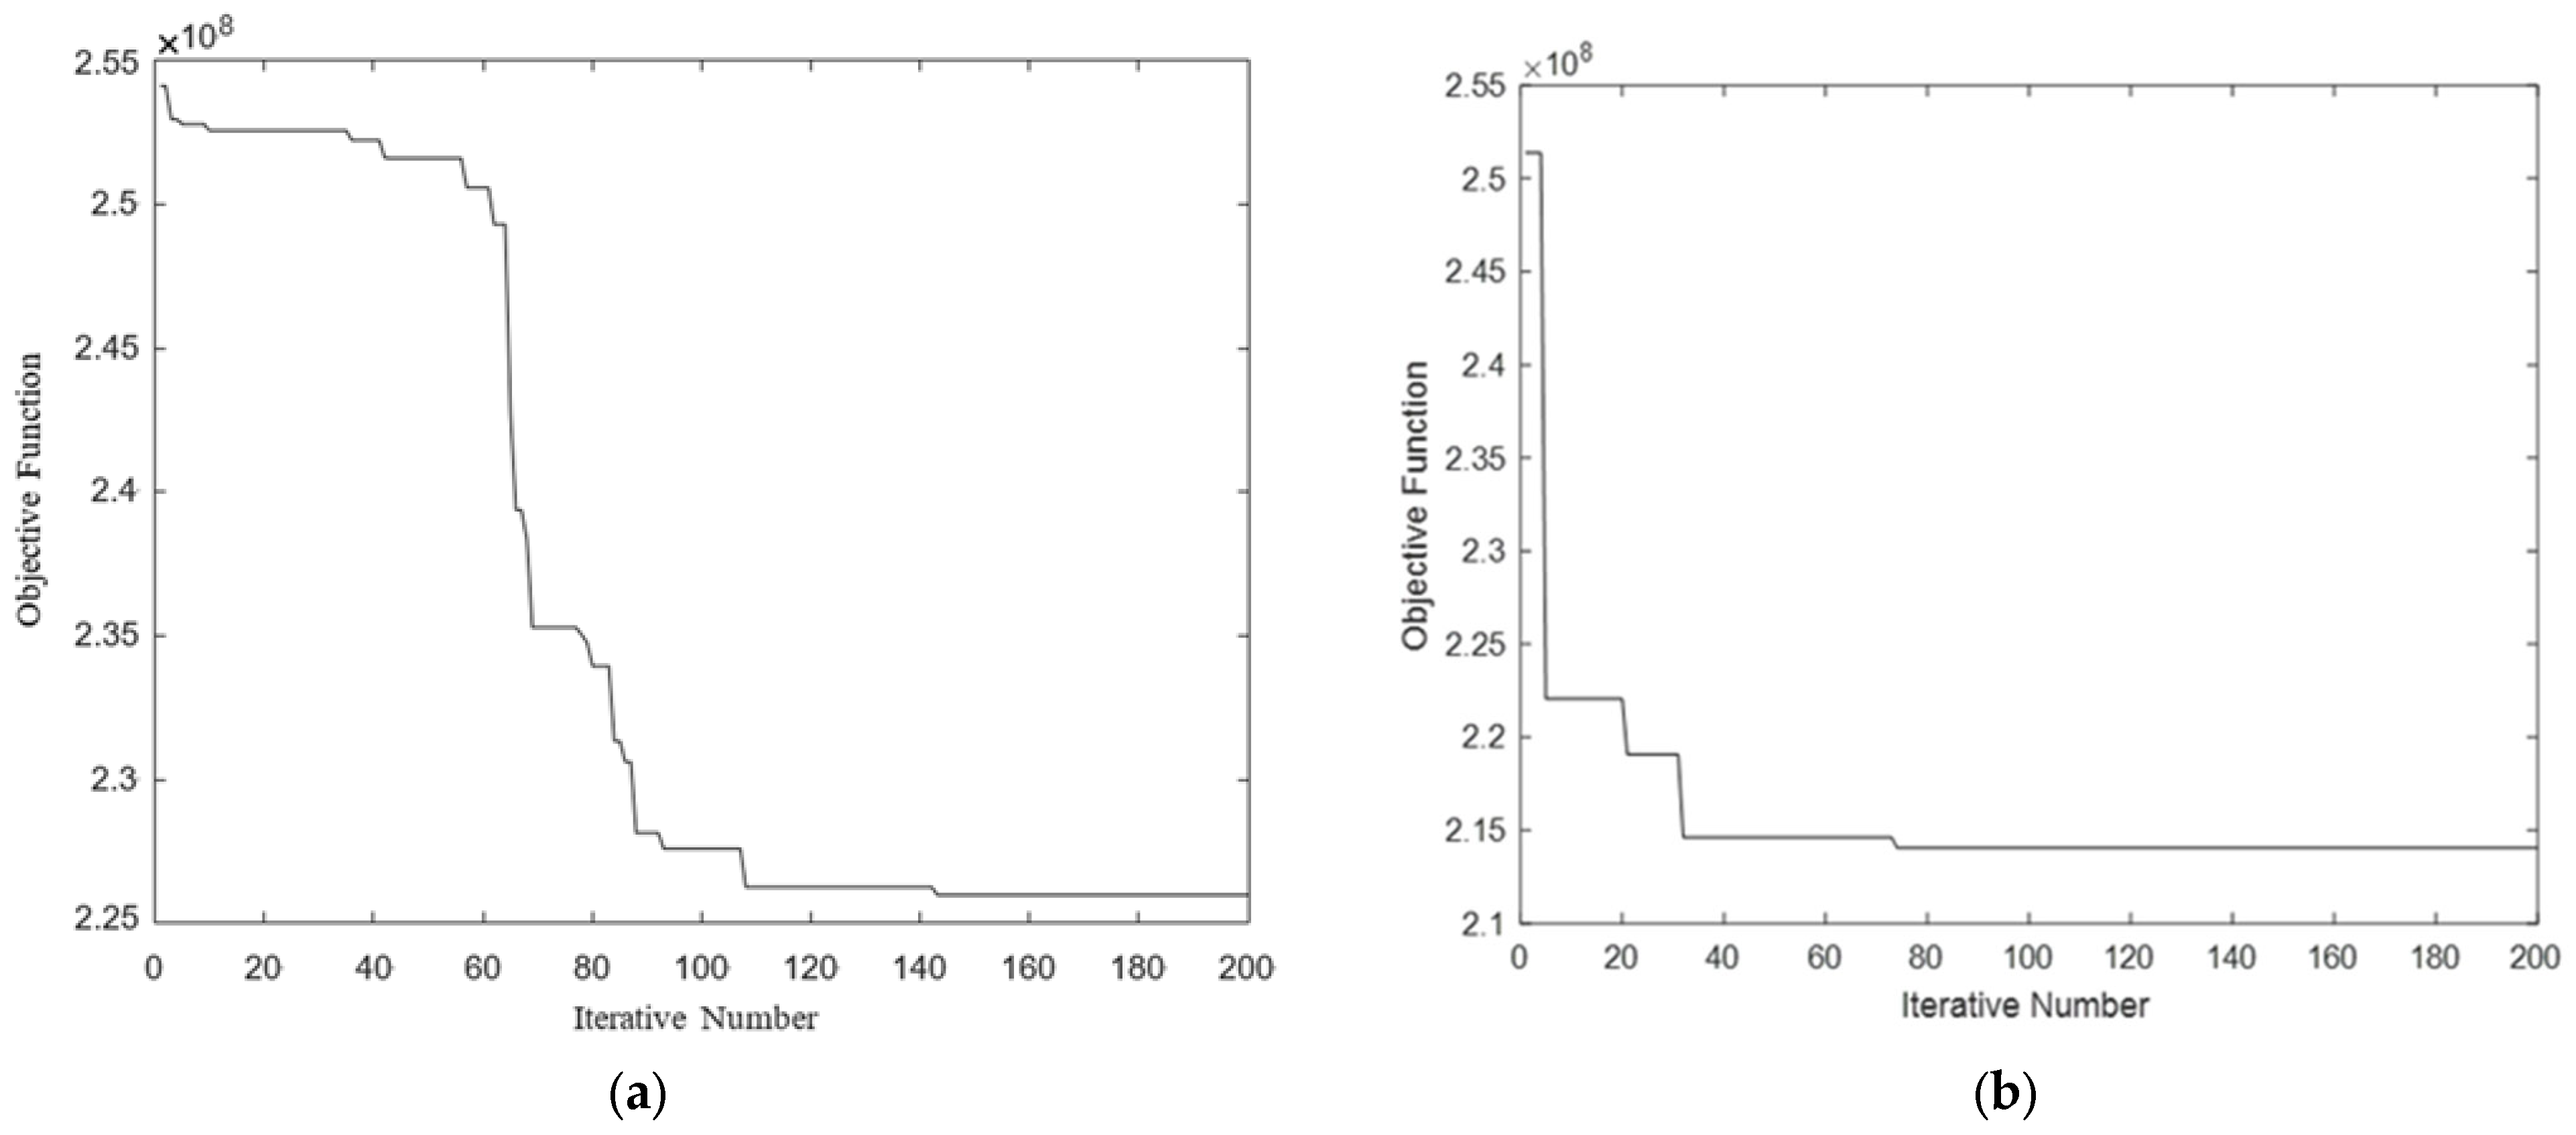
Figure 5 presents a comparative study of the jellyfish search algorithm’s operational procedures before and after enhancements. The two subgraphs clearly demonstrate the variation in objective function values as iteration rates increase, which is essential for assessing the efficacy of algorithms related to the selection of distribution hubs for subway stations.
The convergence diagram above shows that in the early iterations of Figure 5b particularly from the start to approximately the 40th iteration, the value of the objective function experienced a substantial decline, and by the 80th iteration, the value stabilized, exhibiting only minor fluctuations. The objective function value of Figure 5a experienced a substantial drop in a ladder-like structure between the 40th and 80th iterations, while the decrease nearly stopped by the 100th iteration as the process continued. The improved jellyfish search algorithm can reach a steady and low objective function value in fewer iterations and also avoids getting stuck in local optima during the process.
To assess the algorithm’s convergence limitations and lessen the risk of premature termination, the first iteration count is established at 1000. The model tends to converge after approximately 80 iterations. Thus, the iteration number is set to N = 200 to ensure that we find the approximate optimal solution. Meanwhile, we calculated the total cost C T to be 214,061,140.00 CNY, the transportation cost C 1 between the distribution center and hub sites to be 175,690,100.00 CNY, the running cost C 2 of the hub sites to be 5,260,900.00 CNY, and the cost of the end demand points C 3 to be 33,110,140.00 CNY.
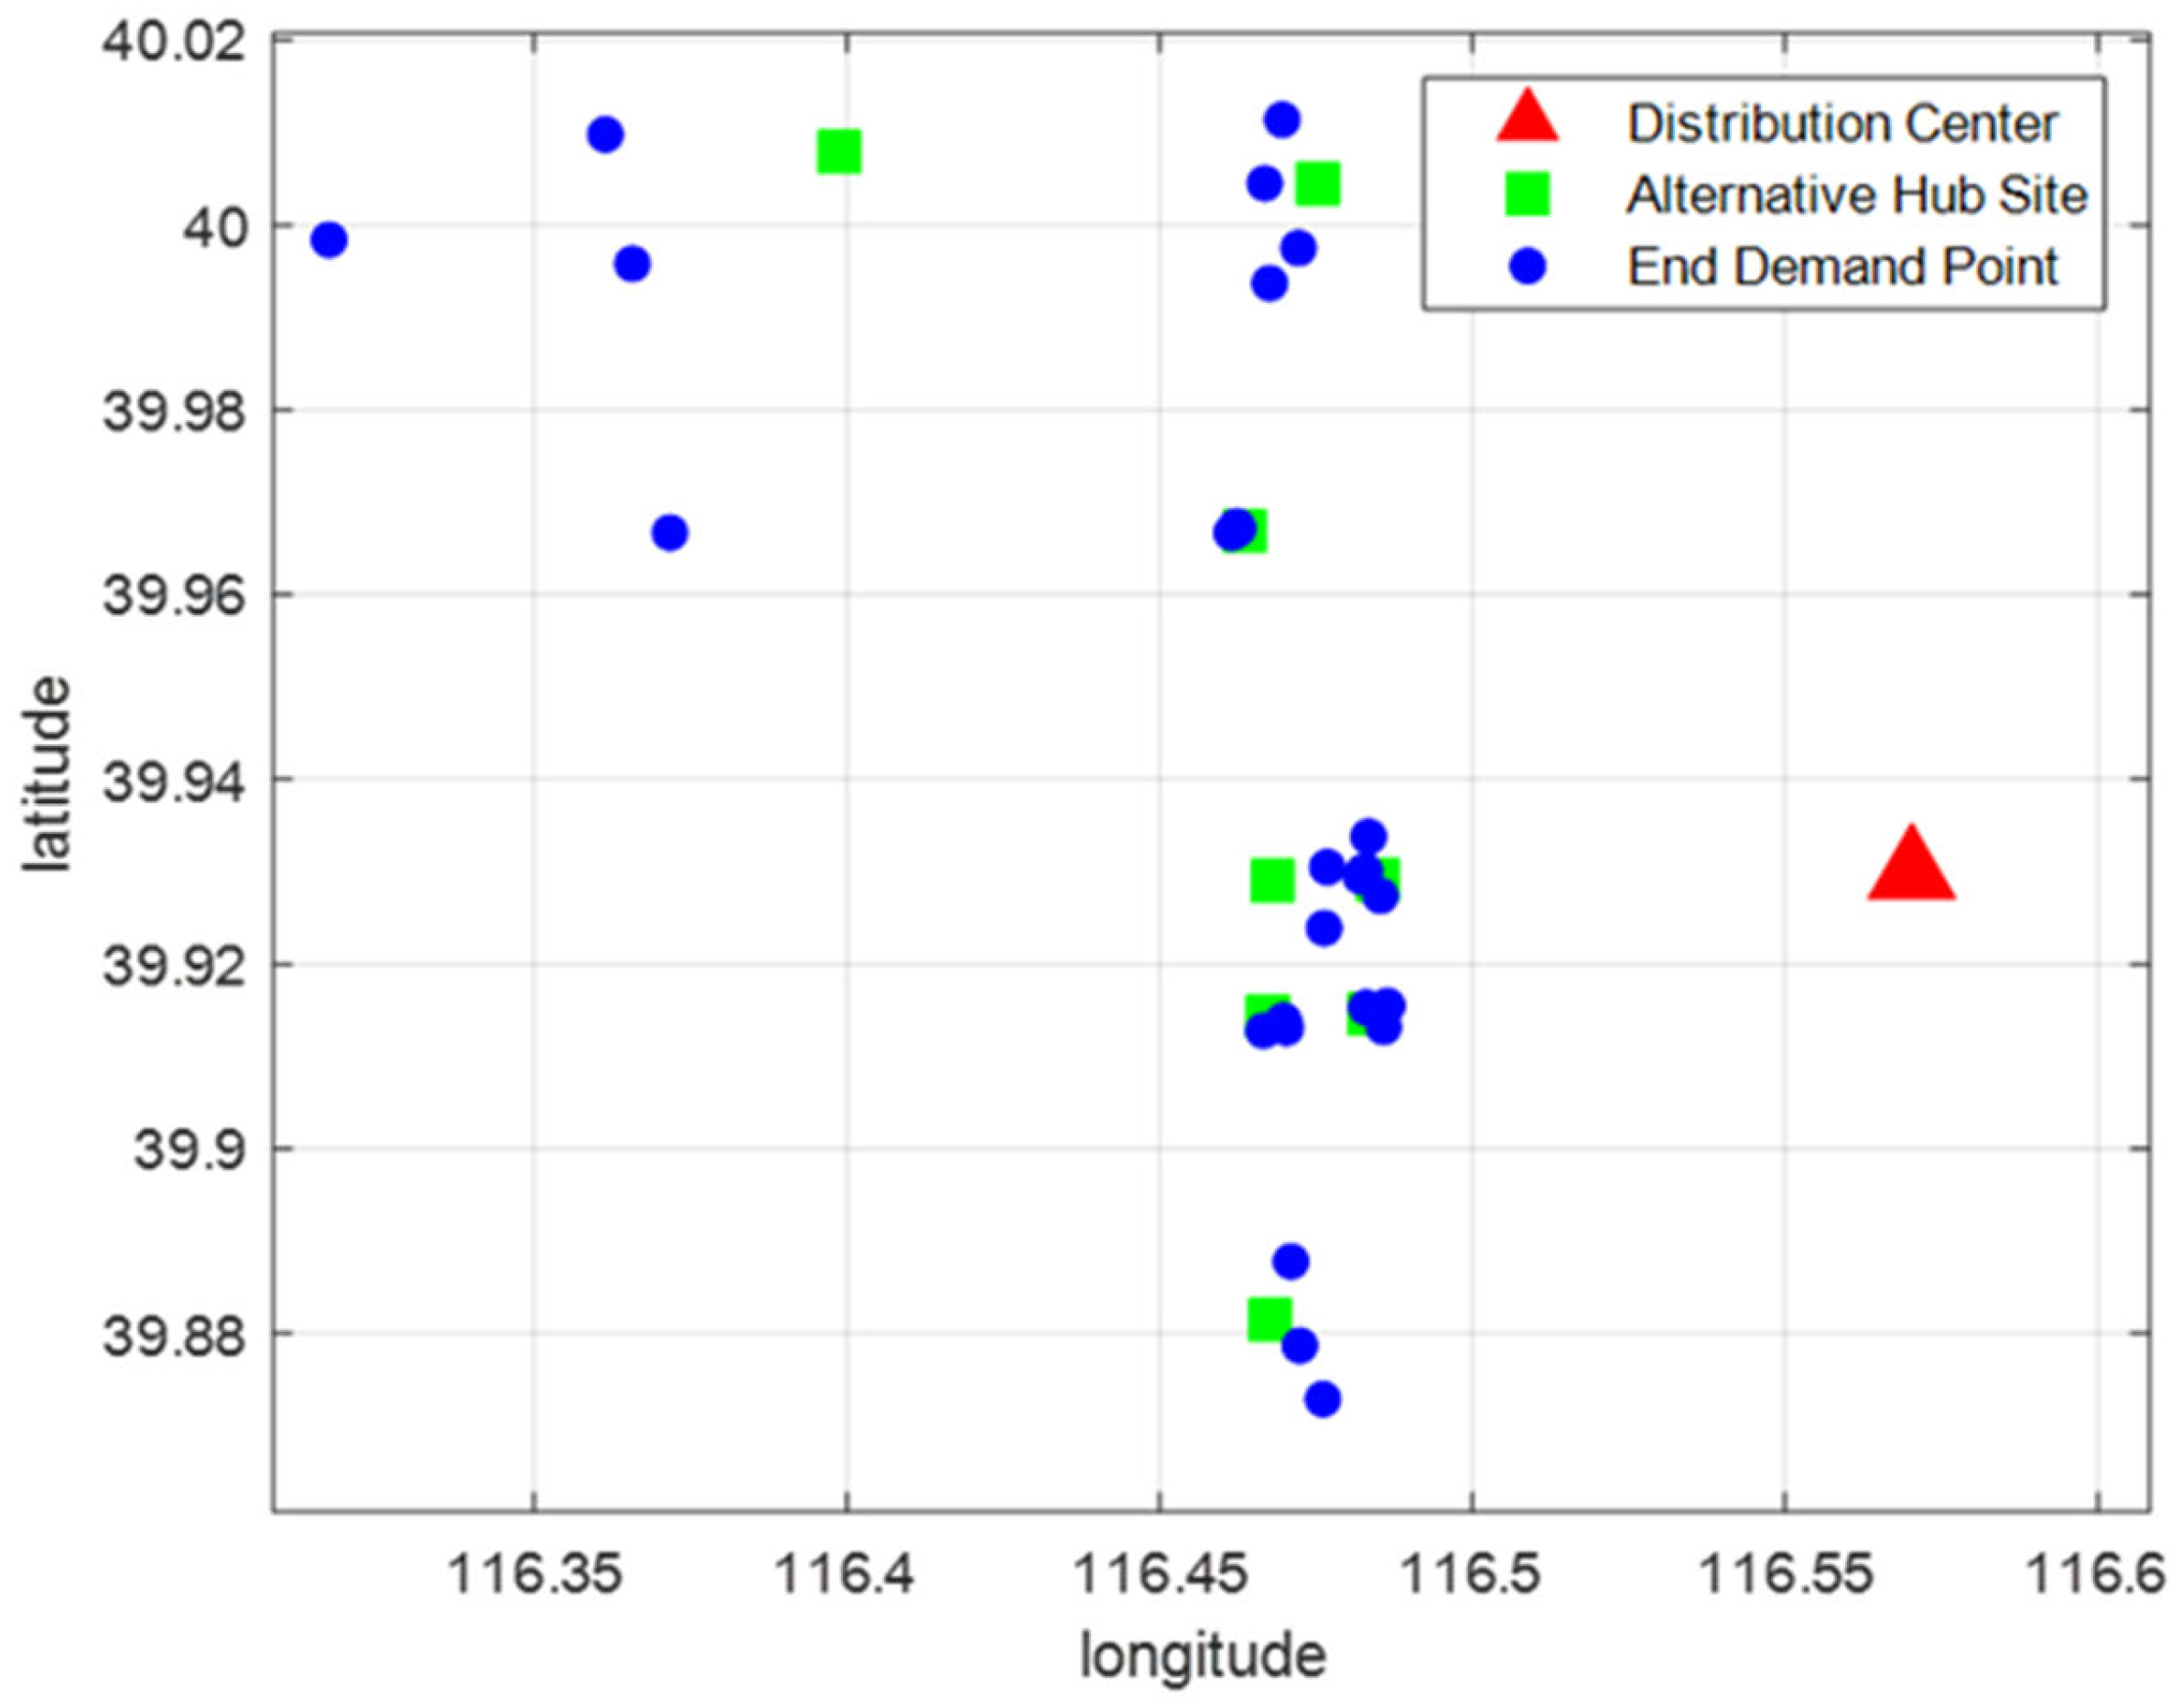
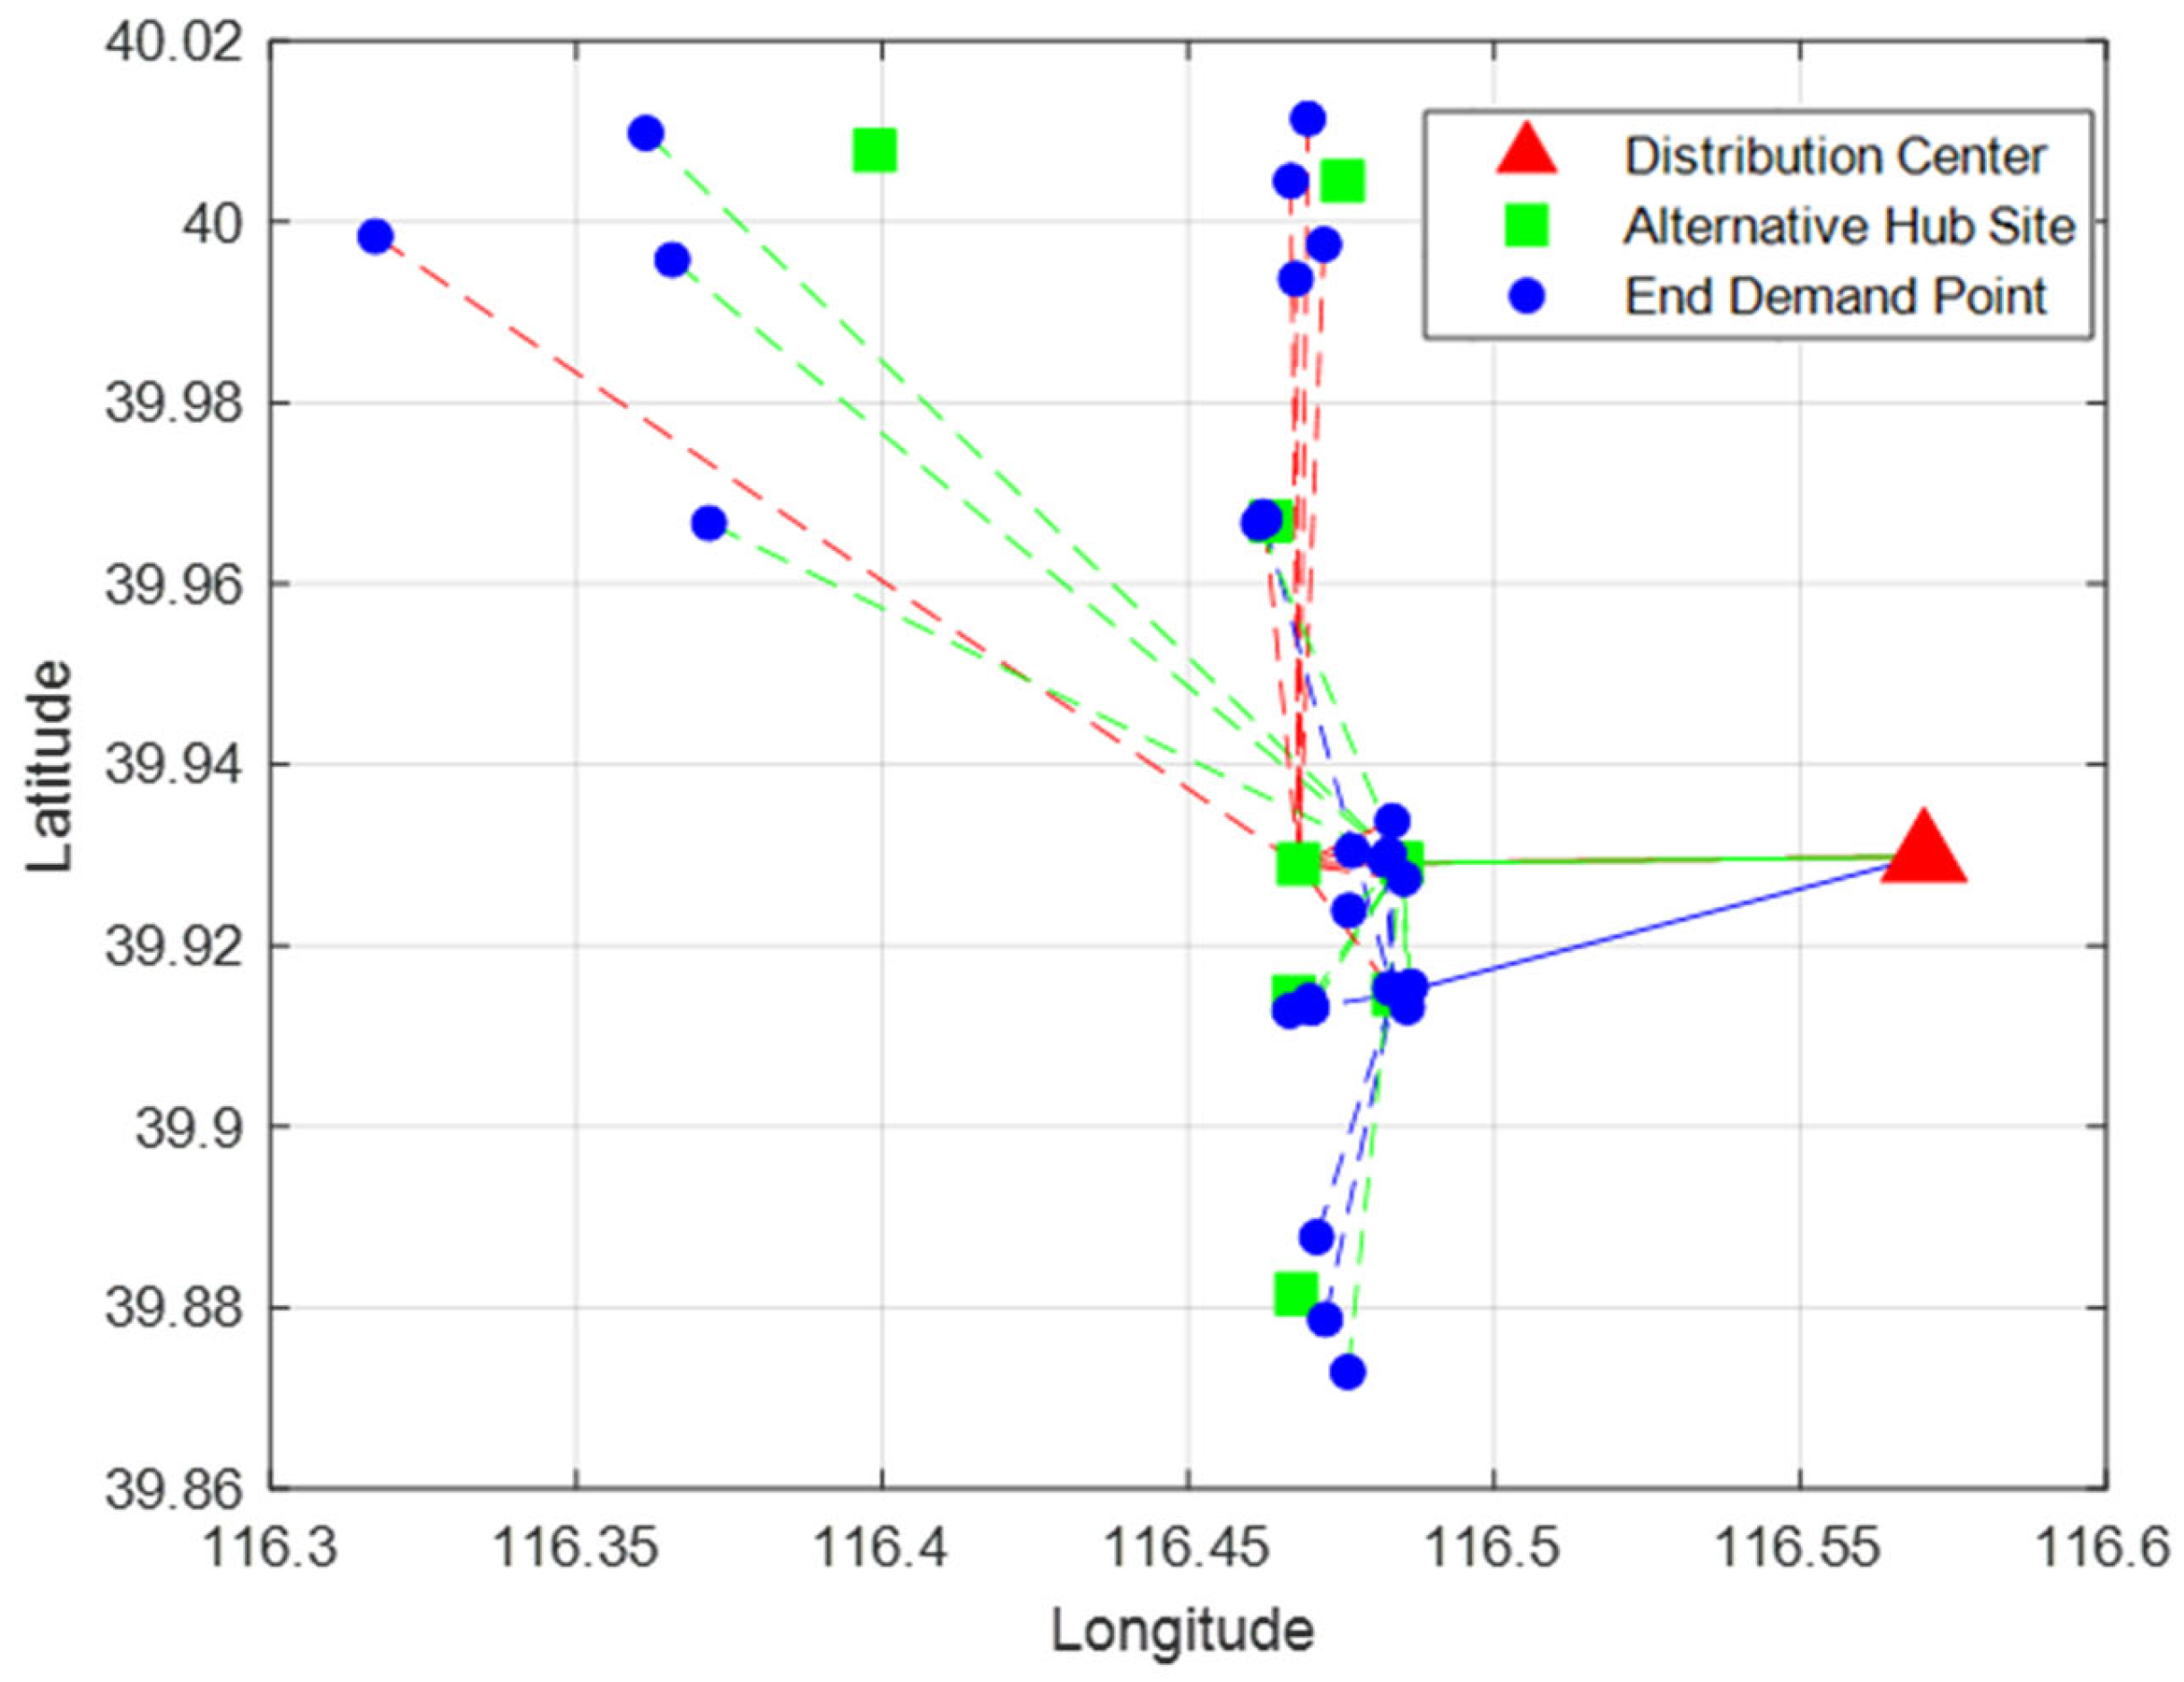
We will choose Hujialou, Jintailu, and Dawanglu as the hub sites for metro logistics in the Chaoyang District, specifically selecting locations 4, 7, and 8. Furthermore, Hujialou encompasses 10 demand points: 3, 5, 6, 7, 8, 9, 12, 14, 23, and 24. The hub site at Jintailu will manage the delivery tasks for 10 end demand points: 1, 2, 4, 11, 13, 15, 16, 19, 25, and 26. Dawanglu will manage the allocation of six demand points: 10, 17, 18, 20, 21, and 22. All delivery relationships are depicted in Figure 6 and Figure 7 below.

6. Conclusions

After studying the sustainable urban supply distribution system that uses the subway, we developed a model and an algorithm to help find distribution hubs. This paper first creates a metro-integrated evaluation model using complex network theory. The model takes into account passenger flow, node degree, and node betweenness to provide better options for choosing urban metro distribution hubs. The metro’s internal route selection mode is based on the idea of minimizing transfers. The location model of the distribution hub is established by considering the costs of entering and leaving the subway, transferring lines, subway transportation, the fixed and variable operational costs of the distribution center, and the transportation costs to and from the terminal. The location model constitutes a complex combinatorial optimization challenge. A jellyfish search method is used to give a rough solution to the location model of subway distribution hubs. The model and algorithm’s usefulness and operability to work are finally verified by the real logistics distribution situations and progress in Beijing’s Chaoyang District.
While this study yields valuable findings, several limitations warrant discussion. The proposed integrated evaluation model provides a more comprehensive assessment of subway stations’ potential as distribution hubs than traditional single-index methods. However, additional refinements could further improve its practical applicability. Future studies should incorporate additional metrics such as the H-index and policy environment factors to improve evaluation accuracy. Secondly, the model of locating distribution hubs effectively reduces urban logistics costs, but it ignores essential societal considerations. For example, the model does not assess whether selected areas are consistent with municipal development plans or consider potential community impacts, which could jeopardize implementation viability. Future studies should incorporate these socio-environmental considerations into the optimization approach. While the enhanced jellyfish search algorithm proposed in this study demonstrates improvements over its original version, significant limitations emerge in practical applications. Convergence speed may be significantly reduced when dealing with the large-scale and complex subway distribution hub location problem. When the maximum number of iterations is reached, it still does not converge to a satisfactory result, which affects the timeliness of the location decision. Subsequent research may combine the jellyfish search algorithm with other algorithms with complementary advantages to form a hybrid algorithm. These features will help it jump out of the local optimal solution and improve the probability of finding the global optimal solution.
In addition, the M-ULS proposal highlights the dual potential of subway systems: serving passenger mobility while simultaneously facilitating parcel transportation. To achieve a scientifically sound and balanced integration of these functions, in-depth discussions are required. Specialized parcel storage and sorting facilities will be constructed at the metro station. Designated locations will be furnished with suitable storage racks and sorting equipment. To guarantee the proper functioning of the subway system, we need to set a weight limit for each package. It must be established based on the load capacity of the subway vehicle, the structural integrity of the station, and the safety of the surrounding environment.

Author Contributions

Z.B. and H.W. wrote the main manuscript text, K.Y. collected and organized data, and H.W. prepared Figures and Tables. All authors reviewed this manuscript. All authors have read and agreed to the published version of the manuscript.

Funding

This research was supported by Beijing Natural Science Foundation (grant number: L231026), R & D Program of Beijing Municipal Education Commission (grant number: KM202410037001), and the Youth Research Fund of Beijing Wuzi University (grant number: 2024XJQN20).

Institutional Review Board Statement

Not applicable.

Informed Consent Statement

Not applicable.

Data Availability Statement

These data were derived from the official website of Beijing MTR and Beijing subway, and the data presented in this study are available upon reasonable request from the corresponding author.

Conflicts of Interest

Authors Kai Yang were employed by China Communications Water Transportation Planning and Design Institute Co., Ltd. The remaining authors declare that the research was conducted in the absence of any commercial or financial relationships that could be construed as a potential conflict of interest.

References

  1. China Federation of Logistics and Purchasing, National Logistics Operation Status Report. Available online: https://www.gov.cn/lianbo/bumen/202502/content_7005007.htm (accessed on 23 February 2025).
  2. Savelsbergh, M.; Van Woensel, T. City logistics: Challenges and opportunities. Transp. Sci. 2016, 50, 579–590. [Google Scholar] [CrossRef]
  3. Perboli, G.; Rosano, M. Parcel delivery in urban areas: Opportunities and threats for the mix of traditional and green business models. Transp. Res. Part C Emerg. Technol. 2019, 99, 19–36. [Google Scholar] [CrossRef]
  4. Schomakers, E.; Klatte, M.; Lotz, V.; Biermann, H.; Kober, F.; Ziefle, M. Analysis of the potential of a new concept for urban last-mile delivery: Ducktrain. Transp. Res. Interdiscip. Perspect. 2022, 14, 100579. [Google Scholar] [CrossRef]
  5. Zheng, C.; Zhang, C.; Ma, J.; Wu, F.; Sun, K. Location Selection of Metro-Based Distribution Nodes for Underground Logistics System with Bi-Level Programming Model. Symmetry 2022, 14, 2411. [Google Scholar] [CrossRef]
  6. Rao, C.; Goh, M.; Zhao, Y.; Zheng, J. Location selection of city logistics centers under sustainability. Transp. Res. Part D 2015, 36, 29–44. [Google Scholar] [CrossRef]
  7. Zhang, S.; Chen, N.; She, N.; Li, K. Location optimization of a competitive distribution center for urban cold chain logistics in terms of low-carbon emissions. Comput. Ind. Eng. 2021, 154, 107120. [Google Scholar] [CrossRef]
  8. Özmen, M.; Aydoğan, E.K. Robust multi-criteria decision making methodology for real life logistics center location problem. Artif. Intell. Rev. 2020, 53, 725–751. [Google Scholar] [CrossRef]
  9. Visser, J.G.S.N. The development of underground freight transport: An overview. Tunn. Undergr. Space Technol. 2018, 80, 123–127. [Google Scholar] [CrossRef]
  10. Koshi, M. An automated underground tube network for urban goods transport. J. Int. Assoc. Traffic Saf. Sci. 1992, 16. Available online: https://trid.trb.org/view/517394 (accessed on 18 May 2025).
  11. Pielage, B.J. Underground Freight Transportation. A new development for automated freight transportation systems in the Netherlands. In Proceedings of the ITSC 2001, 2001 IEEE Intelligent Transportation Systems, Proceedings (Cat. No.01TH8585), Oakland, CA, USA, 25–29 August 2001; pp. 762–767. [Google Scholar] [CrossRef]
  12. Fan, Y.; Liang, C.; Hu, X.; Li, Y. Planning connections between underground logistics system and container ports. Comput. Ind. Eng. 2020, 139, 106199. [Google Scholar] [CrossRef]
  13. Dampier, A.; Marinov, M. A Study of the Feasibility and Potential Implementation of Metro-Based Freight Transportation in Newcastle upon Tyne. Urban Rail Transit 2015, 1, 164–182. [Google Scholar] [CrossRef]
  14. Dong, J.; Hu, W.; Yan, S.; Ren, R.; Zhao, X. Network Planning Method for Capacitated Metro-Based Underground Logistics System. Adv. Civ. Eng. 2018, 2018, 6958086. [Google Scholar] [CrossRef]
  15. Dong, J.; Xu, Y.; Hwang, B.-G.; Ren, R.; Chen, Z. The Impact of Underground Logistics System on Urban Sustainable Development: A System Dynamics Approach. Sustainability 2019, 11, 1223. [Google Scholar] [CrossRef]
  16. Di, Z.; Li, L.; Li, M.; Zhang, S.; Yan, Y.; Wang, M.; Li, B. Research on the contribution of metro-based freight to reducing urban transportation exhaust emissions. Comput. Ind. Eng. 2023, 185, 109622. [Google Scholar] [CrossRef]
  17. Villa, R.; Monzón, A. Sustainable e-commerce urban distribution in LEZ areas: A greening Metro-based solution (M4G: Metro For Goods). Transp. Res. Procedia 2023, 72, 3363–3370. [Google Scholar] [CrossRef]
  18. Zhao, L.; Li, H.; Li, M.; Sun, Y.; Hu, Q.; Mao, S.; Li, J.; Xue, J. Location selection of intra-city distribution hubs in the metro-integrated logistics system. Tunn. Undergr. Space Technol. 2018, 80, 246–256. [Google Scholar] [CrossRef]
  19. Zheng, S.; Yang, H.; Hu, H.; Liu, C.; Shen, Y.; Zheng, C. Station Placement for Sustainable Urban Metro Freight Systems Using Complex Network Theory. Sustainability 2024, 16, 4370. [Google Scholar] [CrossRef]
  20. Du, Z.; Tang, J.; Qi, Y.; Wang, Y.; Han, C.; Yang, Y. Identifying critical nodes in metro network considering topological potential: A case study in Shenzhen city-China. Phys. A Stat. Mech. Its Appl. 2020, 539, 122926. [Google Scholar] [CrossRef]
  21. Zheng, C.; Zhao, X.; Shen, J. Research on Location Optimization of Metro-Based Underground Logistics System With Voronoi Diagram. IEEE Access 2020, 8, 34407–34417. [Google Scholar] [CrossRef]
  22. Zhang, J.; Weng, Z.; Guo, Y. Distribution Center Location Model Based on Gauss-Kruger Projection and Gravity Method. J. Phys. Conf. Ser. 2021, 1972, 012075. [Google Scholar] [CrossRef]
  23. Cai, C.; Luo, Y.; Cui, Y.; Chen, F. Solving Multiple Distribution Center Location Allocation Problem Using K-Means Algorithm and Center of Gravity Method Take Jinjiang District of Chengdu as an example. IOP Conf. Ser. Earth Environ. Sci. 2020, 587, 12120. [Google Scholar] [CrossRef]
  24. Rios, R.V.; Duarte, S. Selection of ideal sites for the development of large-scale solar photovoltaic projects through Analytical Hierarchical Process—Geographic information systems (AHP-GIS) in Peru. Renew. Sustain. Energy Rev. 2021, 149, 111310. [Google Scholar] [CrossRef]
  25. Paul, A.; Deshamukhya, T.; Pal, J. Investigation and utilization of Indian peat in the energy industry with optimal site-selection using Analytic Hierarchy Process: A case study in North-Eastern India. Energy 2022, 239, 122169. [Google Scholar] [CrossRef]
  26. He, M.; Sun, L.; Zeng, X.; Liu, W.; Tao, S. Node layout plans for urban underground logistics systems based on heuristic Bat algorithm. Comput. Commun. 2020, 154, 465–480. [Google Scholar] [CrossRef]
  27. Hu, W.; Dong, J.; Yang, K.; Ren, R.; Chen, Z. Network planning of metro-based underground logistics system against mixed uncertainties: A multi-objective cooperative co-evolutionary optimization approach. Expert Syst. Appl. 2023, 217, 119554. [Google Scholar] [CrossRef]
  28. Su, S.; Wang, Z.; Li, B.; Kang, M. Deciphering the influence of TOD on metro ridership: An integrated approach of extended node-place model and interpretable machine learning with planning implications. J. Transp. Geogr. 2022, 104, 103455. [Google Scholar] [CrossRef]
  29. Chou, J.; Truong, D. A novel metaheuristic optimizer inspired by behavior of jellyfish in ocean. Appl. Math. Comput. 2021, 389, 125535. [Google Scholar] [CrossRef]
  30. Li, P.; Fan, X. The Application of the Improved Jellyfish Search Algorithm in a Site Selection Model of an Emergency Logistics Distribution Center Considering Time Satisfaction. Biomimetics 2023, 8, 349. [Google Scholar] [CrossRef]
Figure 1. Metro-based logistics system network.
Sustainability 17 04735 g001
Figure 2. Schematic diagram of node’s degree.
Sustainability 17 04735 g002
Figure 3. Flow chart of jellyfish research algorithm.
Sustainability 17 04735 g003
Figure 4. Sketch map of Beijing Chaoyang metro network.
Sustainability 17 04735 g004
Figure 5. Iterations process. (a) Jellyfish search algorithm running results (not improved). (b) Improved jellyfish search algorithm running results.
Sustainability 17 04735 g005
Figure 6. The location of a distribution center, alternative hub sites, and end demand points.
Sustainability 17 04735 g006
Figure 7. The relationship among points.
Sustainability 17 04735 g007
Table 1. The definition of basic symbols.
Basic SymbolSymbol Description
i Distribution centers in various cities, i V H
j Various alternative hubs, j V D
k End demand points, k V C
N S The number of distribution centers
N D The number of alternative hub sites
N D The actual number of hubs
N C The number of end demand points
q i j The volume of transportation between the hub center i and hub site j
d i j The distance of transportation between the hub center i and hub site j
d j k The distance of transportation between the hub site j and end demand point k
q k The requirement of end demand points k
L The maximum service coverage of urban distribution hub sites
Table 2. The definition of decision variables.
Decision VariablesSymbol Description
x j Whether to build hub site j , set to 0 or 1, with a value of 1 to build hub site and 0 otherwise
y j k Whether the demand point k is served by hub j , set to 0 or 1, with a value of 1 that the demand point is served by hub j and 0 otherwise
Table 3. The degree value of metro station nodes.
NodeNode Degree ValueNodeNode Degree ValueNodeNode Degree ValueNodeNode Degree ValueNodeNode Degree ValueNodeNode Degree ValueNodeNode Degree Value
11152292431572712852
24164302441584722862
32171314452594732872
44182322462604742882
52192334472612751892
64202344481622762902
74214352491631772912
82221362502641782921
92231374512652792931
102242381522662802
112254391532672812
121264401542682822
131273412552692832
142282422562702841
Table 4. The betweeness values of metro nodes.
NodeNode BetweenessNodeNode BetweenessNodeNode BetweenessNodeNode BetweenessNodeNode BetweenessNodeNode BetweenessNodeNode Betweeness
10.0000150.0980290.0178430.0483570.0842710.0147850.0084
20.0500160.0215300.0354440.0042580.0047720.0258860.0493
30.0980170.0153310.0792450.0092590.0042730.0353870.0357
40.0585180.0215320.0134460.0372600.0050740.0159880.0142
50.0157190.0215330.0153470.0000610.0751750.0369890.0368
60.0182200.0450340.0153480.0050620.0268760.0357900.0182
70.0181210.0500350.0144490.0143630.0823770.0050910.0098
80.0152220.0157360.0142500.0762640.0183780.0000920.0050
90.0212230.0481370.0142510.0050650.0142790.0183930.0000
100.0216240.0000380.050520.0145660.0293800.0193
110.0151250.050390.0000530.1526670.0000810.0268
120.6514260.0156400.0142540.0393680.0050820.0351
130.5156270.0248410.0154550.0050690.0159830.0482
140.1541280.0581420.0541560.0000700.0149840.0187
Table 5. The level of each metro station.
NodeLevelNodeLevelNodeLevelNodeLevelNodeLevelNodeLevelNodeLevel
13152292431572712852
21161302441581722863
33173311452591732873
41183322462601742882
52193331472612751892
61202341481622762902
71211352491631772912
82223362502641782923
93233371512652792933
103242381522662802
112251391532672812
123261401542682822
133271412552692832
143283422562702843
Table 6. The average daily passenger flow of metro lines.
Metro LinesDaily Ridership (Thousands of People)Metro LinesDaily Ridership (Thousands of People)Metro LinesDaily Ridership (Thousands of People)
1100.7864.51713.5
270.31018.6yizhuang21.7
583.91352.6aerodrome2.4
6101.41487.4
755.51542.7
Table 7. The integrated evaluation of metro nodes.
NodeIntegrated ValueNodeIntegrated ValueNodeIntegrated ValueNodeIntegrated ValueNodeIntegrated ValueNodeIntegrated ValueNodeIntegrated Value
10.0692152.1423292.1953431.1652572.6221712.1622852.1322
23.1823161.1523302.1562441.1965583.5033722.1622861.2230
30.0565173.1652313.1896452.1965593.5161732.1652871.1233
40.1516183.1652322.1965462.1965601.5162742.1623882.5113
52.1523193.1526333.5161472.1623612.1562751.1238892.1562
61.1522202.123341.1651481.1623622.1653762.1231902.1652
73.1652211.1622352.1652491.1695631.6511772.1523912.1632
82.1562223.1626363.1568502.1968641.5196782.1325921.6316
93.1622233.1562371.1565512.1965652.1562792.1253931.1562
103.5162242.1523381.6152522.1953662.1563802.1531
112.5196251.1532391.6232532.153672.1565812.1652
123.1622261.1652401.1653542.1563682.1595822.1652
130.1220274.1623412.1565552.1652692.1562832.1522
143.2122282.1653422.5135562.6156702.1652841.1254
Table 8. The information of Beijing transit center.
Distribution CenterNeighboring Metro StationMetro Station Coordinates
LongitudeLatitude
Beijing Transit CenterLine 6 Talianpo Station116.5702639.929826
Table 9. The information on alternative hub sites.
Serial NumberMetro StationMetro Station Coordinates
LongitudeLatitude
D 1 Olympic Park116.398840.0079
D 2 Wangjing116.475340.0045
D 3 Sanyuanqiao116.463639.9669
D 4 Hujialou116.468139.9290
D 5 Guomao116.467339.9144
D 6 Panjiayuan116.467739.8815
D 7 Jintailu116.484939.9291
D 8 Dawanglu116.483639.9146
Table 10. The location of end demand points.
Serial NumberMetro Station CoordinatesSerial NumberMetro Station Coordinates
LongitudeLatitudeLongitudeLatitude
C 1 116.361440.0098 C 14 116.483439.9338
C 2 116.365739.9958 C 15 116.469839.9139
C 3 116.317239.9984 C 16 116.470239.9131
C 4 116.371739.9667 C 17 116.466639.9128
C 5 116.466840.0045 C 18 116.472439.8787
C 6 116.472239.9975 C 19 116.476139.8729
C 7 116.467639.9937 C 20 116.471039.8878
C 8 116.469640.0114 C 21 116.482839.9301
C 9 116.462539.9671 C 22 116.482139.9295
C 10 116.462339.9674 C 23 116.485339.9274
C 11 116.461539.9667 C 24 116.483039.9153
C 12 116.476839.9305 C 25 116.486439.9155
C 13 116.476339.9239 C 26 116.485839.9132
Table 11. The information between alternative hub sites and Beijing transit center.
Alternative Hub SitesBeijing Transit Center
d i j (km) N i j (times)
D 1 Olympic Park251
D 2 Wangjing211
D 3 Sanyuanqiao181
D 4 Hujialou120
D 5 Guomao111
D 6 Panjiayuan161
D 7 Jintailu90
D 8 Dawanglu101
Table 12. The distance between alternative hub sites and end demand points.
d i j D 1 D 2 D 3 D 4 D 5 D 6 D 7 D 8
C 1 3.190.721.374.301.370.720.918.23
C 2 3.121.3713.4813.484.306.071.370.72
C 3 7.0313.484.304.3013.484.304.304.30
C 4 5.139.784.307.031.374.307.036.36
C 5 5.800.726.361.376.077.036.076.36
C 6 6.360.821.370.721.371.374.306.07
C 7 6.071.376.074.301.3713.481.376.07
C 8 6.040.910.820.821.376.071.371.37
C 9 7.074.306.040.728.366.076.046.04
C 10 7.044.270.7210.176.074.306.046.04
C 11 7.044.3610.8713.4810.1710.1710.176.07
C 12 10.878.2310.8710.8711.446.078.3610.87
C 13 11.448.961.3713.481.3710.8710.8711.44
C 14 10.957.8910.8710.8711.441.378.3610.87
C 15 12.0810.0913.4811.441.371.3712.0813.48
C 16 12.1710.178.361.3710.1710.176.0712.08
C 17 12.0510.2210.8716.3912.0810.8710.8710.87
C 18 15.6813.9916.398.366.0710.1712.088.36
C 19 16.3914.638.3616.3912.081.376.0716.39
C 20 14.7012.9816.3916.391.3712.0816.3911.44
C 21 11.238.304.411.378.3610.876.078.36
C 22 11.248.364.4516.3910.171.379.949.94
C 23 11.608.624.778.3610.171.379.948.36
C 24 12.559.945.971.371.3710.1710.1716.39
C 25 12.709.946.0416.398.369.948.361.37
C 26 12.8810.196.268.3616.391.379.9416.39
Table 13. Parameter settings.
ParameterParameter DescriptionValue
M Population size80
N Iteration number1000
u 1 The price for each piece of commodities entering and leaving the metro station0.2
u 2 The transfer cost per unit of goods between metro lines0.1
u 3 The metro operating cost per unit of goods per unit distance0.01
u 4 The dynamic operating cost per unit of goods in hub site0.01
u 5 The end transportation cost per unit of goods per unit distance0.01
Table 14. The capacity of alternative hub sites.
Alternative Hub Site D 1 D 2 D 3 D 4 D 5 D 6 D 7 D 8
q i j /108 piece2.0242.0752.0672.0512.0432.0962.0372.086
Table 15. The requirement of end demand points.
End Demand Point q i j /107 PieceEnd Demand Point q i j /107 Piece
C 1 1.946 C 14 1.937
C 2 1.934 C 15 1.924
C 3 1.897 C 16 1.952
C 4 1.953 C 17 1.931
C 5 1.942 C 18 1.951
C 6 1.958 C 19 1.892
C 7 1.975 C 20 1.917
C 8 1.912 C 21 1.953
C 9 1.931 C 22 1.916
C 10 1.899 C 23 1.920
C 11 1.904 C 24 1.915
C 12 1.924 C 25 1.947
C 13 1.918 C 26 1.961
Disclaimer/Publisher’s Note: The statements, opinions and data contained in all publications are solely those of the individual author(s) and contributor(s) and not of MDPI and/or the editor(s). MDPI and/or the editor(s) disclaim responsibility for any injury to people or property resulting from any ideas, methods, instructions or products referred to in the content.

