Article

An Evaluation of Sustainable Development in Chinese Counties Based on SDGs

College of Environmental Science and Engineering, Nankai University, 38 Tongyan Road, Jinnan District, Tianjin 300350, China
*
Author to whom correspondence should be addressed.
Sustainability 2025, 17(10), 4704; https://doi.org/10.3390/su17104704
Submission received: 8 April 2025 / Revised: 16 May 2025 / Accepted: 19 May 2025 / Published: 20 May 2025

Abstract

:
With the increasingly urgent demand for the localization of the United Nations’ sustainable development goals (SDGs), the construction of an evaluation system and the practice paths of counties, as important spatial units of China’s sustainable development, urgently need to be deepened. Based on the articulation of the SDGs and China’s national conditions, this study innovatively designed an indicator delivery framework covering the United Nations level to the county level; constructed a county-level sustainable development evaluation indicator system that includes three dimensions, including economic development, social culture, and ecological environment; adopted the entropy weight method to determine the weights of indicators; and introduced a dynamic evaluation and analysis model utilizing three analytical methods, namely coupling coordination analysis, obstacle analysis, and Dagum decomposition, to evaluate the level of sustainable development of 76 counties in the 2010–2021 period considering both time and space. The results show that (1) the national county sustainable development index (CSDI) was significantly improved, regional differences were narrowed, the central region has the best overall performance, and the western region has the fastest growth rate; (2) economic development has become the main driving force, and the economic gap between regions has gradually narrowed, but the spatial heterogeneity of the environmental and social dimensions is still prominent; (3) the eastern region has generated positive spillover effects on the central and western regions through industrial transfer and technology diffusion, while the northeastern region develops relatively slowly due to the lagging industrial transformation; and (4) the degree of coupling coordination rises as a whole, but the differences in synergistic ability between regions are obvious. This study provides a scientific basis for the formulation of differentiated sustainable development policies for counties and emphasizes the key role of regional synergy mechanisms in narrowing the development gap.

1. Introduction

With the development of the global economy and the intensification of the impact of human activities on the natural environment, countries around the world are facing a series of serious challenges [1], including climate change, resource shortages, the loss of biodiversity, and many other issues. Against this backdrop, the United Nations adopted the 2030 Agenda for Sustainable Development in 2015, proposing 17 sustainable development goals (SDGs), which aim to address social, economic, and environmental issues in an integrated manner. The United Nations are committed to realizing a sustainable future and ensuring that, by 2030, the planet can achieve a more equitable, inclusive, and prosperous future [2,3,4].
In January 2020, the United Nations launched the Decade of Action, which emphasizes action at the global, local, and individual levels, with a focus on local governments making the necessary transformations in accordance with local policy and institutional and regulatory frameworks [5,6,7]. The UN SDG Report 2024 and the SDSN SDG Index Report 2024 both point to the key role of the global, national, and local levels in ensuring that the SDGs are “localized”. This means that implementing the SDGs is not only a global task but also requires countries to make specific strategic adjustments to implement them according to their unique national conditions and local characteristics [8,9,10,11].
As the basic unit of China’s administrative division, the county area is an important cornerstone of the modernization of the country’s governance system and governance capacity and occupies a fundamental strategic position in China’s sustainable development [12,13,14]. Geospatially, counties cover the transition zone between urban and rural areas and vast rural areas, and they are important for maintaining the integrity of ecosystems [15]. Numerous mountains, rivers, forests, wetlands, and other natural ecological elements are widely distributed within a county, and these ecosystems not only provide ecological services to the residents of the county but are also an important part of the national ecological security pattern [16,17]. Regarding economic and social development, the county contains a rich variety of industrial forms [18], including traditional agricultural cultivation and breeding, as well as emerging rural e-commerce, rural tourism, and other specialty industries [19]. The county also carries a large number of people [20,21], is an important carrier of regional culture and folk customs, and plays a key role in improving residents’ quality of life and promoting social harmony and stability. A beautiful county environment can enhance residents’ happiness and sense of belonging, attract the inflow of talent and capital, and inject vitality into the sustainable development of the county’s economy. The SDGs provide a comprehensive reference system for the county to formulate policies [22], which can be more scientific and sustainable based on actual situations [23].
Currently, relevant studies on regional sustainable development focus on the provincial and municipal levels. Xu et al. established an evaluation system containing fifty indicators in three dimensions, namely innovation vitality, public services, and living environment, which was used to assess the level of Shenzhen’s sustainable development from 2005 to 2019 and to identify potential bottlenecks in the city’s development. Wang et al. constructed a regional sustainable development index using hierarchical clustering and principal component analysis [24] to quantify China’s progress in achieving the SDGs at the local level from 2013 to 2020; it can track the implementation of the SDGs and spatial and temporal dynamics [25]. Wang et al. selected 15 sub-goals and 20 specific indicators from the UN SDGs and established a sustainable development assessment framework to quantitatively assess the progress in achieving the SDGs in the counties of the northern slopes of the Kunlun Mountains [26]. Song et al. proposed a localized SDG assessment framework for China’s provincial level, which assesses SDG progress through regionalized indicator selection and target setting and combines average targets with regional equity considerations to provide more consistent and meaningful results for local governments, emphasizing the importance of continuous monitoring and policy interventions [27]. Jia et al. constructed a localized evaluation framework for urban sustainable development, including 37 specific indicators, and analyzed the spatial and temporal changes and target homogeneity of sustainable development in Shandong Province using the 2011–2020 scores of the province as an example [28]. Ricciolini, E. et al. selected 40 indicators against 17 SDGs to assess the progress of 28 countries in Europe in 3 key years, namely 2007, 2012, and 2017, showing that Northern European countries generally achieved good levels of global sustainability, while Eastern European countries, especially Romania, Bulgaria, and Greece, remained at poor levels [29]. Using 22 countries in the Middle East region, Cameron Allen et al. explored the indicators that these countries need to prioritize in order to reach the SDGs [30]. McArthur, J. W. et al. categorized 169 specific goals in the SDGs and concluded that 78 of the indicators were suitable for quantitative assessment at the national level; of these, 70 indicators were selected to assess 61 goals and Canada’s progress towards achieving the SDGs, concluding that Canada is only safely on track to achieve SDG1 [31]. Firoiu, D. et al. identified 107 indicators to assess the SDGs’ implementation in Romania, with projections for 40 indicators revealing that Romania is likely to reach the EU average for those indicators by 2030 [32].
Regarding the current construction situation, although the SDGs provide a global perspective for county studies, most existing studies focus on the macro level, and most current studies do not measure sustainable development at the national and subnational levels, lacking the systematic theoretical construction of SDG localization in counties [33]. This contradiction has led to obstacles in the transmission of the UN SDGs to the local and individual levels [18]. There is an urgent need to break through the bottlenecks of indicator generalization, data fragmentation, and insufficient policy synergies [34] and to establish a coherent governance framework of “Global Goals-National Strategies-Local Actions”, using counties as the pivot point. On the one hand, the current SDG monitoring system takes cities as the smallest statistical unit, county indicators are often “averaged out”, resulting in a distorted transmission of indicators, and it is difficult for a single national indicator to adapt to regional differences. On the other hand, there is a disconnect between county practice innovation and the policy system. Although some county practices are groundbreaking, it is difficult to promote them due to the lack of a standardized indicator system, and the interactive mechanism from local innovation to national norms is also missing. The gradual enrichment of data on counties in China makes it possible to carry out this study. This study measures the level of sustainable development in China’s counties, revealing the time dynamic heterogeneity, which will help in the design of sustainable development policies [35]. The innovative contributions of this study at the theoretical and methodological levels can be summarized as shown in Table 1.

2. Materials and Methods

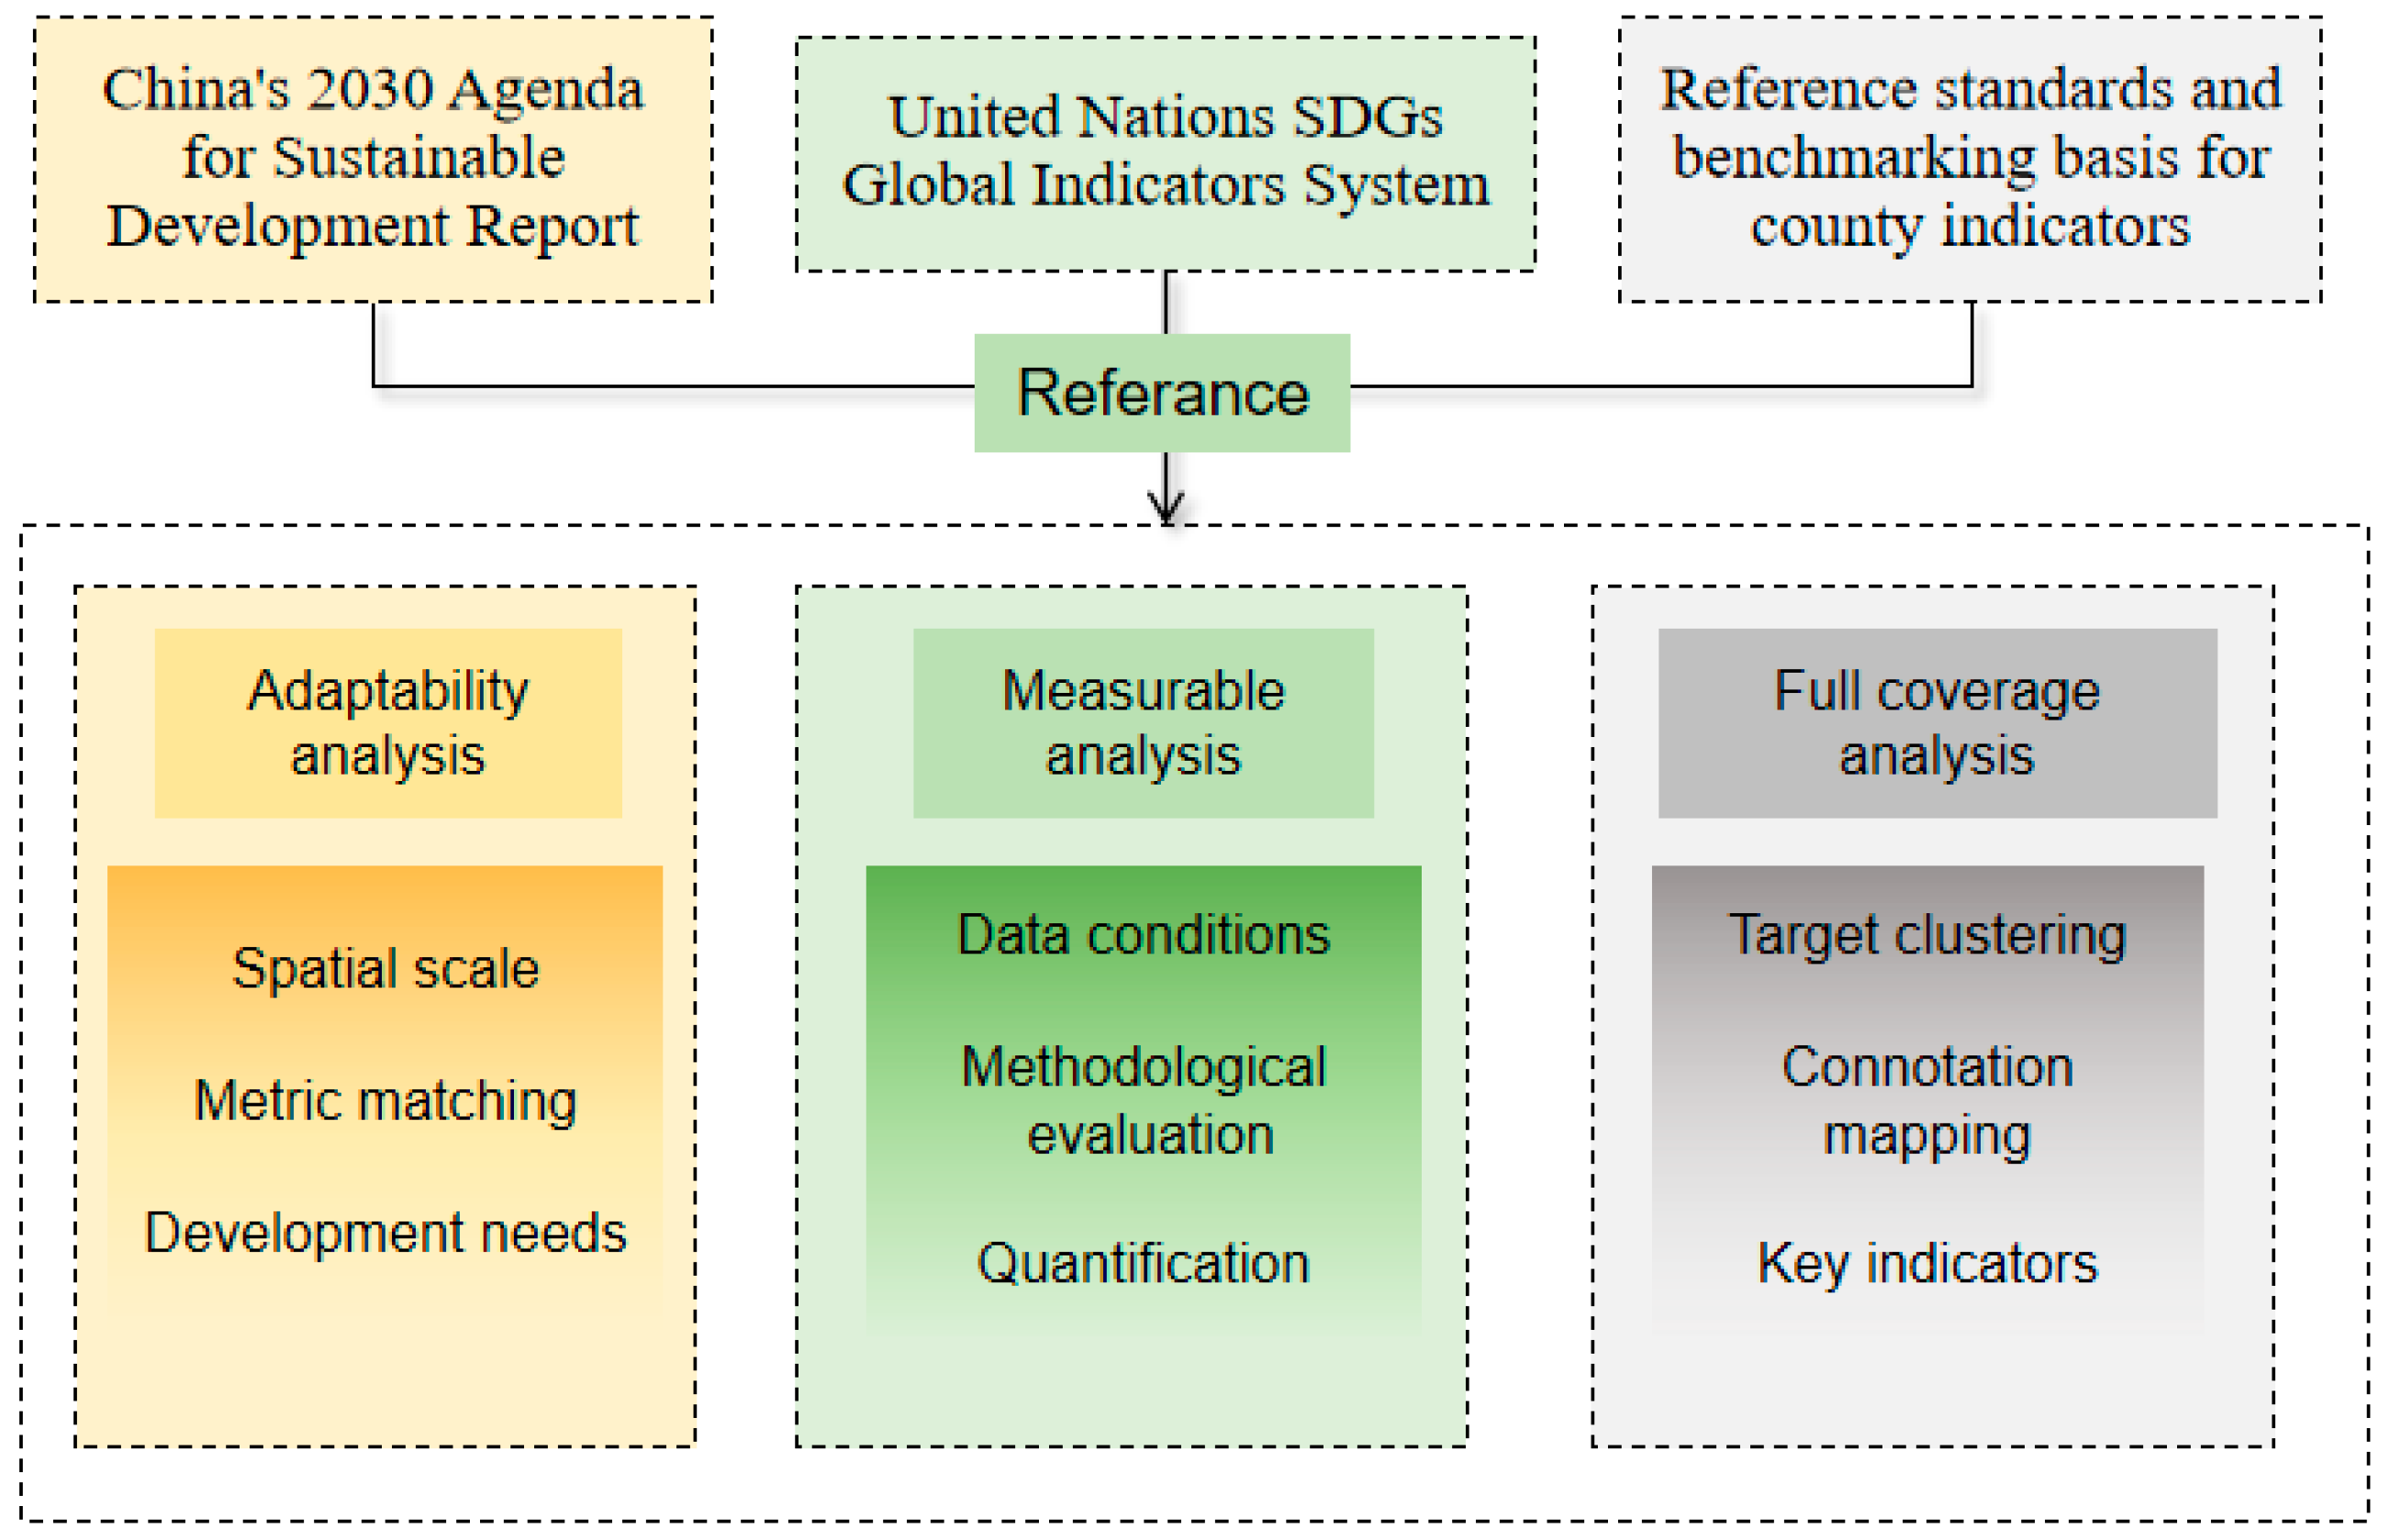
2.1. System of Indicators for Evaluating Sustainable Development of Counties

This study systematically considers the conditions underlying the assessment of 17 objectives, 169 sub-objectives, and 232 indicators in the context of the SDGs and retains the indicators for which counties have reliable data sources. Indicators that cannot be used directly are replaced with reference to China’s country programs for the implementation of the 2030 Agenda for Sustainable Development and the benchmarking basis for county indicators. Considering the special characteristics of Chinese counties, new indicators are introduced to meet county-level assessment needs, the basic connotation of the SDGs is mapped to specific indicators of county construction, and key indicators closely related to sustainable development are identified. Adaptability analysis, measurable analysis, and full-coverage analysis are carried out on the indicators to ensure their applicability on the spatial scale from the global level to the county level and to ensure data quality and availability to finalize the evaluation index system of sustainable development in the county. Figure 1 illustrates the above-mentioned indicator transfer scheme from the United Nations to the county level.
Combined with the United Nations 2030 sustainable development goals, the evaluation index system is constructed by selecting the goals closely related to county development (see Table 2) to ensure that the index system is consistent with the global sustainable development trend and adapted to the actual needs of China’s county development. According to the three system layers of the “sustainable economic development index”, “sustainable social and cultural development index”, and “sustainable ecological environment utilization index”, an evaluation index system for determining the sustainable development of counties based on the SDGs is established. The connotation of the sustainable development of counties based on the SDGs can be summarized as follows: (1) economic development, which involves the optimization and upgrading of the industrial structure of counties based on the composition of production factors and the correlation and complementarity of different industries; (2) social culture, which involves narrowing the urban-rural gap due to long-term urban-rural fragmentation and governance, promoting urban-rural integration, realizing social fairness and justice, and building a harmonious society; and (3) ecological environment, which involves exploring and making efficient use of the county’s advantageous natural resource endowment, improving the quality of the county’s economic development, and optimizing the county’s ecological environment.

2.2. Evaluation Area

Nationwide, 76 county-level administrative districts were selected for evaluation, which were evenly distributed proportionally across 31 provinces and 4 major economic regions (the eastern, central, western, and northeastern regions), covering counties at different levels of development to ensure that the selected counties were representative of the natural environments and levels of economic development of different regions in China. It is worth noting that the subjects of this study refer to counties and county-level cities involved in agriculture and do not include the urban districts of cities. The specific requirements are as follows: (1) balanced regional distribution—the sample counties were evenly selected in 31 provinces in China according to certain geographic distance and population size to ensure that the sample in each region can fully represent the overall characteristics of the region; (2) balanced economic level—the sample counties were evenly selected within each level according to the different levels of economic development (e.g., high, medium, and low) so that counties with different economic levels have an appropriate share in the sample; (3) rich industrial structure—different industrial structure characteristics are covered to reflect the impact of different economic development modes and industrial layout on the overall development of the county; and (4) complete and available data—the selected counties have complete and available data. It is ensured that the statistical data of the selected counties cover all aspects required for the evaluation, and there are no key data points missing.

2.3. Data Sources

Out of concern for the scientific, authoritative, and complete nature of the data, the data sources used in this study are as follows: (1) public statistical databases, including the China Statistical Yearbook, China County Statistical Yearbook, China Urban Statistical Yearbook, China Hygiene and Health Statistical Yearbook, China Land and Resource Statistical Yearbook, and China Environmental Statistical Yearbook; (2) data on China’s county carbon emissions and sinks, obtained from Chen et al. [36], which can be downloaded from https://doi.org/10.6084/m9.figshare.13090370 (accessed on 18 May 2025); and (3) the administrative division codes of China in 2020, obtained from http://xzqh.mca.gov.cn/map (accessed on 18 May 2025). Administrative boundary data are from the National Geographic Information Center of China (https://cloudcenter.tianditu.gov.cn/administrativeDivision, accessed on 18 May 2025). Since this study involves more indicators and has a large time span, individual years and indicators are missing in the process of data collection, and the missing data are mainly fitted and supplemented according to the characteristics of the data from previous years by extrapolating the index trend, averaging the data from recent years, and carrying out interpolation to ensure the reliability of the data filled under different trends.

2.4. Assessment and Analytical Methods

2.4.1. Indicator Weights

Since the focus of sustainable development construction in counties is different from that in cities, and there are different development levels among SDG targets, the average assignment method is not in line with the actual situation, and other scientific assignment methods are proposed. Commonly used objective weighting methods include the entropy weighting method, coefficient of variation, principal component analysis, etc. [37]. To consider the influence of indicators and more reasonably allocate weights to the indicators, we utilize the principle of information entropy and adopt the entropy weighting method to determine the combination of the indicators’ weights.
Firstly, it is necessary to standardize positive and negative indicators using the deviation standardization method.
Positive indicators:
x i = x i m i n ( x i ) max x i m i n ( x i ) × 100
Negative indicators:
x i = max x i x i max x i m i n ( x i ) × 100
where xi represents the raw data of the indicator; x′i represents the normalized data; and max/min indicate the upper/lower bounds for the data. The value is set to 0 and 100 when the raw data exceed the lower and upper bound, respectively.
Entropy weighting is adopted to determine the combination weights of the indicators, and the relationship matrix is constructed based on the standardized values of the indicators as follows:
R = a 11 a 1 j a i 1 a i j
The information entropy, ei, of the ith indicator value is as follows:
f i j = a i j j = 1 n a i j
e i = ( 1 ln n ) × j = 1 n f i j l n ( f i j )
The weight of the entropy weighting method, wi, for the ith indicator is as follows:
w i = 1 e i i = 1 m ( 1 e i )

2.4.2. Coupling Coordination Analysis

In the evaluation system, there are interactions in different systems that affect each other [38,39,40]. We utilize the coupling coordination degree model to respond to the coordination relationship between different systems in the process of county sustainable development construction.
The coupling degree calculation function is
C = ( f A x f B x f c x [ ( f A x + f B x + f c x ) / 3 ] 3 ) 1 / 3
where C is the coupling degree and fA (x), fB (x), and fC (x) denote the value of the county sustainable development level after standardizing the economic development system, social and livelihood system, and ecological and environmental system, respectively (the range is [0, 1]).
The degree of coupling coordination is designed to reflect the degree of coordination between systems. The calculation method is shown below:
D = f ( x ) × C
f x = α f A x + β f B x + γ f c x
where D is the coupling coordination degree; f (x) is the comprehensive score of each system; and α, β, and γ are the pending parameters for the sustainable development of the county. The three systems are equally important, so the pending parameter is set to α = β = γ = 1/3.

2.4.3. Barrier Degree Analysis

In this study, we identify the barriers to the sustainable development of counties by calculating three indicators, namely indicator deviation, factor contribution, and barrier degree [41], and then finding the root causes of the obstacles to development to adjust the strategic direction of county construction.
Indicator deviation, Iij, refers to the gap between the target and the indicator, expressed as the difference between the standardized indicator value and 1.
I i j = 1 a i j
The factor contribution, Uj, refers to the weighted impact of specific indicators on the overall objective.
U j = w i w i
The obstacle degree, Mij, indicates the degree to which the indicator affects the sustainable development of the county.
M i j = U j × I i j i = 1 m U j × I i j × 100 %
N b j = M i j
where aij is the standardized indicator, wi is the weight of the ith indicator in the system layer, wi’ is the weight of the system layer, Mij is the barrier degree of the ith indicator, and Nbj is the barrier degree of the system layer indicator.

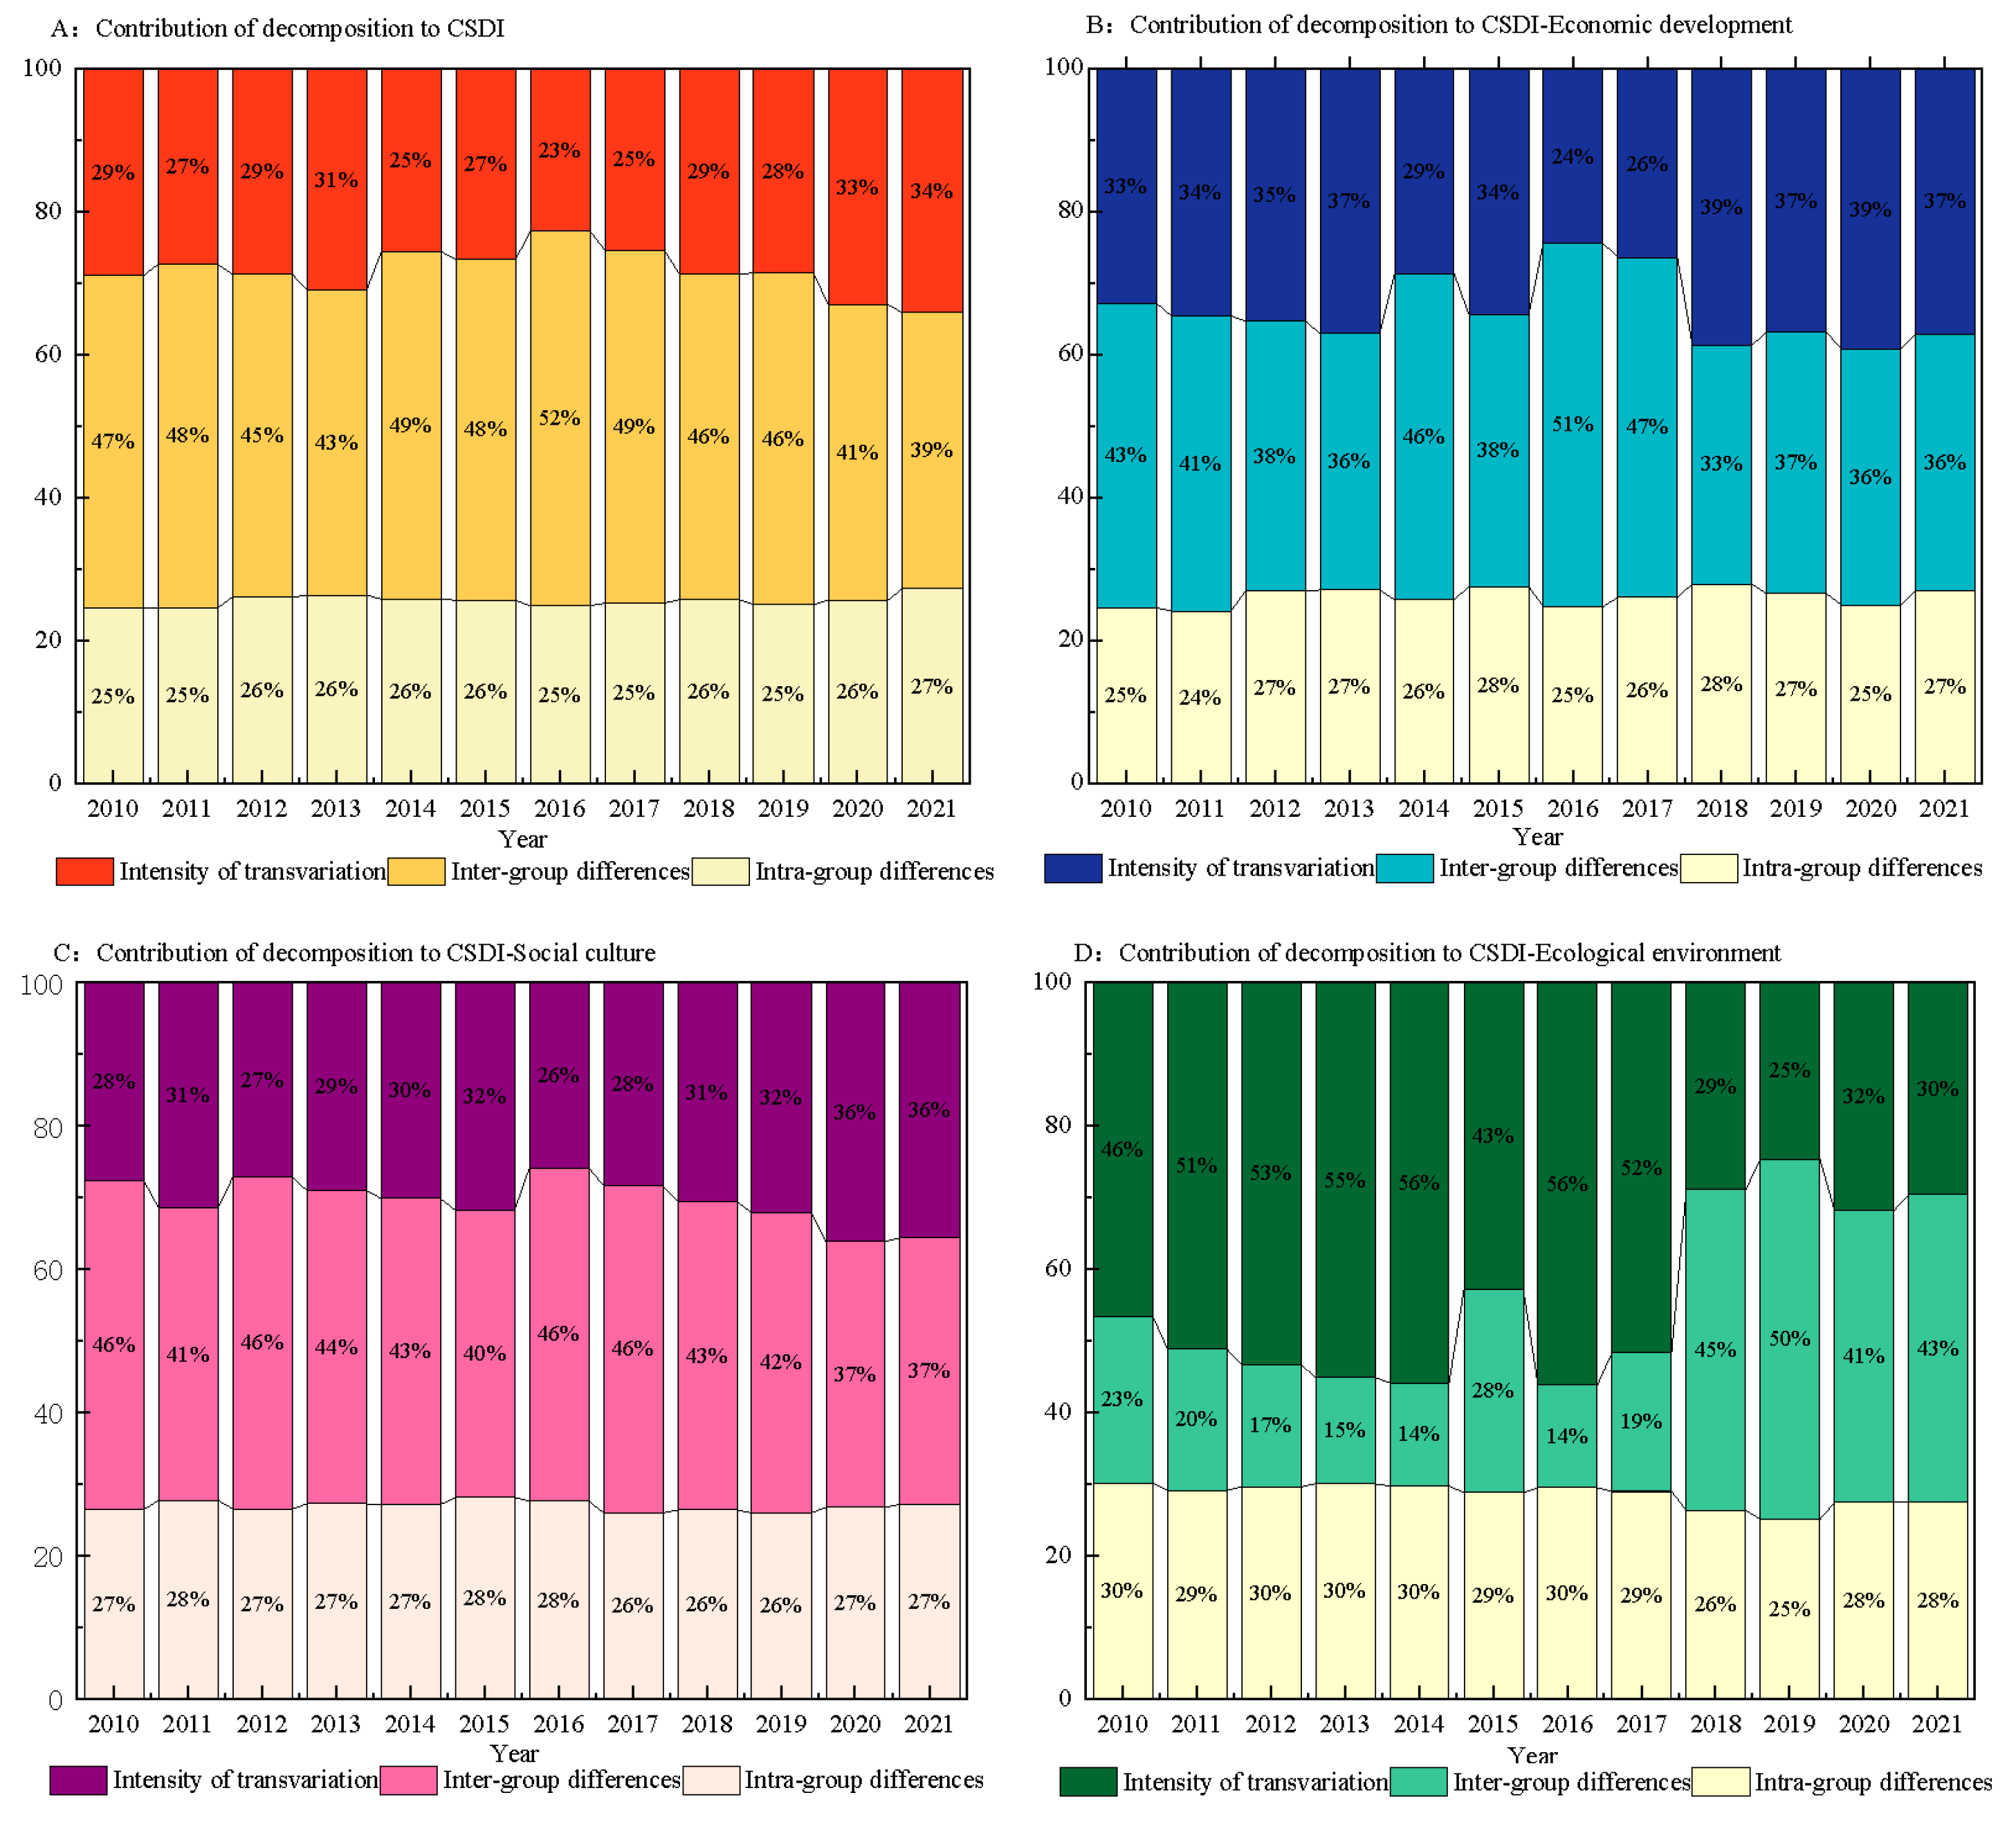
2.4.4. Dagum Gini Coefficient Decomposition

We applied the Dagum Gini coefficient along with its decomposition method to assess the magnitude and origins of sustainable development disparities at the county level. The formula used to calculate the overall Gini coefficient across all subgroups is outlined below (Equation (14)) [42,43]:
G i n i = j = 1 k h = 1 k i = 1 n j r = 1 n h E j i E h r 2 n 2 E a v e
The Gini coefficient represents overall inequality, with higher values indicating greater disparities. j and h indicate the number of subgroups, while i and r refer to the districts within each sub-cluster and k indicates the total number of subgroups. The variables nj and nh represent the number of counties within the jth and hth areas; Eji and Ehr correspond to the CSDI of county i in the jth area and county r in the hth area; the total number of counties is denoted by n; and Eave is the mean value of the CSDI of all counties.
The overall Gini coefficient is then decomposed into inter-subgroup disparities (Gnb), intra-subgroup gaps (Gw), and hypervariable densities (Gt). This decomposition satisfies the following relationship: Gini = Gnb + Gw + Gt. Detailed formulas are provided in Equations (15)–(22):
G j j = 1 2 E a v e j i 1 n j r 1 n h E j i E h r n 2 j
G w = j 1 k G j j p j s j = j 1 k G j j n j n n j n E a v e j E
G j h = i 1 n j r 1 n h E j i E h r n j n h E a v e j + E a v e h
G n b = j = 1 k 1 h = j + 1 k G j h p j s h + p h s j D j h
G t = j = 2 k h = 1 j 1 G j h p j s h + p h s j 1 D j h
D j h = d j h p j h d j h + p j h
d j h = 0 d   F j E 0 E F j E x d F h x
p j h = 0 d   F h E 0 E F j E x d F j x
where Gjj represents the Gini coefficient of region j, Gjh represents the Gini coefficient between region j and h, Djh represents the relative influence of the ecological security index between region j and h, and djh represents the difference in the ecological security index between regions. Fj and Fh denote the cumulative distribution functions of the ecological safety index for regions j and h, respectively.

3. Results

3.1. Sustainable Development in China’s Counties

Figure 2 depicts the trends in the CSDI from 2010 to 2021 for the four major economic regions at the national level. During this period, all regions show a clear upward trend in CSDI values, with the national average rising sharply from 62.1 in 2010 to 72.38 in 2021. The eastern region continues to lead from 2010 to 2016 and maintains a relatively small score difference with the central region before being overtaken by the latter in 2017. The western region saw the largest increase in score, rising from 58.48 in 2010 to 71.32 in 2021, representing an increase of more than 22 percent, which was close to the national average score in 2021. The northeast region, which saw six consecutive years of declining scores after 2013, shows significant increases in 2020 and 2021 but still falls short of the other three regions.
Based on the CSDI indicator system, we examined the trends of economic development, social culture, and ecological environment in different regions. From 2010 to 2021, China’s CSDI showed positive trends in these areas. Nationally, the CSDI for economic development rose from 59.41 in 2010 to 71.23 in 2021, with the northeast showing a relatively large decline from 64.51 to 53.10 in the 2013–2016 period, mainly due to the impact of a series of national decapacitation policies, which shut down a number of iron and steel mills, coal mines, and other enterprises in the face of overcapacity in traditional industries. There was a greater impact on county economy in the northeast region as it relies on traditional heavy industry. Both the eastern and central regions are at a superior level of performance in the field of economic development, and the trend changes in these two regions show a high degree of consistency, reflecting the effectiveness of China’s policy of coordinated regional development; the two regions have formed a good synergistic development relationship in industry. The western region saw the most significant growth, from 53.50 to 69.89. As a key node of the Silk Road Economic Belt, the western region has become an important participant in and beneficiary of the “One Belt, One Road” initiative.
China’s CSDI is the highest for ecology and environment among the three systems, with a score rising from 68.54 in 2010 to 75.67 in 2021 and with a slight drop to 67.18 in 2015, showing a sharp upward trend starting from 2016, with an average annual growth rate of about 2%. In 2015, China began to strengthen the implementation of environmental policies, which, in the short term, affected the economic-environmental balance. However, from 2016 onwards, the effects of environmental governance became apparent, and the environmental quality of counties improved, driving a significant increase in the score in the environmental domain. These changes are most evident in the western and central regions, reflecting China’s emphasis on environmental governance in inland areas. In the CSDI socio-cultural area, the national score rose from 57.63 in 2010 to 69.88 in 2021, with the eastern and central regions consistently scoring higher than the national average and the western and northeastern regions lagging behind despite improvements, highlighting the disparities between regions regarding social investment and cultural facilities. The northeastern part of the region shows a relatively large fluctuation from 2017 to 2020, which is consistent with changes in the region’s economic sector, and there is a certain lag in changes in the social sector, reflecting the decisive influence of economic construction on social development.

3.2. Coupling Coordination Results

Figure 3 shows that the coupling coordination of Chinese provinces continues to improve, with the central region performing optimally, but there are significant differences in the transition speed between regions, with fluctuations prominent in resource-dependent regions. China’s provincial coupling coordination scores showed consistent improvement during the 2010–2021 period, with the national average rising from 0.67 to 0.76. Most provinces showed continuous optimization, with a total of 12 provinces reaching a coupling coordination score of 0.8 or above in 2021, showing a high level of coupling. Six provinces are in the central region, indicating that they are in the leading position regarding their ability to develop in a balanced manner. Some provinces showed obvious fluctuations in individual years, such as Chongqing, whose score rose to 0.65 in 2013, dropped sharply to 0.52 in 2015, and then rose gradually to 0.804 in 2021, which shows that the Chongqing Municipality is facing an adjustment in its development model and changes in resource and environmental constraints at different stages, resulting in obvious fluctuations in the coordination score of each system. Ningxia and Hainan made the greatest progress in coordinated development, with scores of less than 0.5 in 2010 and scores of more than 0.6 in 2021, gradually adjusting from being on the verge of dislocation to a state of initial coordination. From a regional perspective, the overall score of the eastern region is relatively high and shows a fluctuating upward trend, and the good economic foundation provides a good basis for the coordinated development of the eastern provinces. The fluctuating scores of the northeast region are more obvious as the region’s traditional industries account for a large proportion of the total, and it faces challenges in the process of economic transformation, making coordinated development in various fields difficult.

3.3. Analysis of Degree of Obstacles

Figure 4 demonstrates the CSDI scores and obstacle degree of each system in thirty-one provinces in China in 2021, revealing that the distribution of shortcomings in the three systems of economic development, social culture, and ecological environment in each province presents significant regional heterogeneity, and there is an obvious difference in the intensity of constraints between systems. In the economic field, resource-dependent provinces, such as Shanxi, and areas with a single industrial structure, such as Hainan and the northeast, have a high degree of economic obstacles, revealing problems such as irrational industrial structure and a lack of transformation momentum. On the contrary, developed eastern provinces such as Jiangsu, Zhejiang, and Beijing have a low degree of obstacles to economic development and a high degree of obstacles in the social sphere; despite their strong economic strength, the imbalance between population agglomeration and the distribution of social resources is prominent. In the environmental field, industrially developed provinces such as Shandong and resource development-dependent regions such as Jiangxi have significantly high barriers, with prominent conflicts between development and environment and a mismatch between environmental governance capacity and industrial development needs. The differentiation of barrier types and intensity between regions maps out the multi-level imbalance of China’s county development.

3.4. Dagum Decomposition

Figure 5 presents the results of the Dagum decomposition, showing a structural evolution of county sustainability differences: intergroup differences remain higher in the environmental and social dimensions compared to the economic dimension. Overall, from 2010 to 2021, the between-group variance shows an inverted U-shaped trajectory, occupying 52% (2016) of the variance at its peak, and the within-group variance increases slightly, rising continuously from 24.57% in 2010 to 27.38% in 2021, with a fluctuating hypervariance density. When analyzing the specific dimensions, it can be seen that in the economic domain, the intra-group difference fluctuates from 24.23% to 28.03%, reflecting the instability of the economic differences within the region, and the inter-group difference decreases from 42.61% to 35.92%, indicating that the economic disparity between the regional groups has been gradually narrowing, which may be driven by the coordinated development policies. The hypervariable density increases significantly (32.67–37.00%), reflecting the increased mobility of the county’s economy and the continued reshaping of the competitive landscape. In the environmental domain, the inter-group difference is persistently high (23.36–56.10%), highlighting the significant disparity in the level of environmental governance between regions due to differences in resource endowment and industrial structure; the intra-group difference is relatively stable (25.15–30.19%), indicating that the intra-group environmental difference exists in the long term. In the social domain, inter-group differences (37.07–47.71%) are more prominent, reflecting the uneven distribution of social resources (e.g., public service provision); the fluctuation in the hypervariable density (25.82–35.53%) suggests a dynamic change in the trajectory of social development. These results highlight the complexity of spatial inequality in the economic, social, and environmental dimensions in the county and emphasize the need to formulate differentiated policies for different areas to reduce development disparities.

4. Discussion and Conclusions

4.1. Conclusions

We constructed a sustainable development evaluation system for Chinese counties based on the SDGs, covering the dimensions of economy, social culture, and ecology, and assessed the sustainable development levels of 76 counties in time and space from 2010 to 2021 through coupling coordination analysis, barrier degree analysis, and the Dagum decomposition method. The following findings were revealed: (1) The CSDI improved from 62.1 in 2010 to 72.38 in 2021, with regional differences showing a narrowing trend. The central region had the highest overall score, the western region grew at a significant rate, and the northeastern region fluctuated markedly due to industrial restructuring. Overall, China’s county-level sustainable development is experiencing an upward trend, and the ranking of county-level sustainable development in 2021 will be central>east>west>northeast. (2) There was a significant inter-regional spillover effect. The eastern region generated positive spillovers to the central and western regions through the gradient transfer of industries and technology diffusion [44], especially the “Belt and Road” region, which is the most important region in China [45]. The “Belt and Road” initiative promotes the western region to become an important beneficiary, and its economic growth rate (53.50–69.89) is significantly higher than the national average; the central region, as a hub connecting the east and west, plays the role of a bridge in industrial synergism and policy radiation and drives the balanced development of neighboring counties. The northeast region is lagging behind, and the spillover effect is weak. (3) The economic dimension has become the main driving force, and inter-regional economic differences have gradually been reduced through policy coordination and industrial transfer, but the spatial heterogeneity of the environmental and social dimensions is still prominent and the contradictions between resource-dependent regions and traditional industrial bases are significant. (4) The mean value of the degree of coupling coordination rose from 0.67 to 0.76, and 12 provinces have entered into the stage of high-level coordination, but the synergy capacity between regions has been significantly differentiated. The barrier degree analysis showed that the problems in the economic field are concentrated in resource-dependent counties, that there is an imbalance in the distribution of social resources in the developed eastern region, and that there is a sharp contradiction in environmental governance in the industrial-intensive area. Dagum decomposition showed that the difference between groups in the economic dimension is narrowing (42.61–35.92%), the difference between groups in the environmental dimension continues to be high (23.36–56.10%), and the difference between groups in the social dimension is the most significant (37.07–47.71%), reflecting the uneven distribution of public services. (5) Compared with international leaders, China’s counties are in an advantageous position regarding poverty eradication (SDG1), with a faster rate in achieving this goal than other developing countries, such as India [46]; additionally, its infrastructure development regarding SDG9 exceeds the European Union average for rural areas [47]. However, the proportion of ICU beds in China’s county hospitals is still low, and the Gini coefficient is generally high, reflecting the fact that China still needs to put more effort into social security and integrated urban-rural development [48].

4.2. Innovations and Limitations

This study connects the United Nations SDGs with China’s national conditions, takes the county as the key node, and innovatively establishes the indicator delivery framework of “global goals-national strategies-local actions”. This provides a solid foundation for the construction of an integrated, whole-process SDG delivery mechanism from the global level to the individual level. In addition, based on the assessment of the sustainable development level of counties, this study introduces the coupling coordination degree-obstacle degree-Dagum decomposition triple dynamic assessment model, which provides a basis for exploring the coordinated development of counties, core obstacles, and inter-group differences among provinces. These analyses support the development of county-level sustainable development measures and the implementation of the SDGs in China, and these findings may be useful to policymakers.
This study’s limitation is that the constructed evaluation index system can only reflect the level of sustainable development of counties, and the deep-seated reasons for this phenomenon need further investigation. In this study, a unified evaluation index system is adopted for counties with different geographic locations and resource endowments. This standardized evaluation method may produce certain evaluation bias due to the differences in the functional positioning of counties; for example, for economically strong counties in the east, standardization may weaken their absolute advantages and reduce the sensitivity of structural conflicts, such as income inequality, and for counties in the west with a low level of development, standardization may magnify their progress and hide their shortcomings in basic service capacity. The core value of this study, however, is that it systematically reveals the commonalities and characteristics of the state of sustainable development in different regions through comparable data benchmarks. It is worth noting that the phenomena reflected in the evaluation results do not in themselves amount to problems but provide a scientific basis for further diagnosis and differentiated policy formulation. Therefore, this standardized evaluation is essentially a research tool for identifying problems and differences, and its diagnostic value needs to be realized through subsequent in-depth analysis.

4.3. Recommendations

Based on the systematic evaluation of the current situation of county sustainable development and the localization demand analysis of SDGs, we identified five core target areas that require focused attention for SDG implementation at the county level. By analyzing the main bottlenecks and challenges in these areas and integrating advanced domestic and international practical experiences, targeted differentiated development recommendations are proposed to provide actionable implementation pathways for county-level sustainable development, as shown in Table 3.
(1)
Building mechanisms for regional differentiated development
Eastern counties should take scientific and technological innovation as the core driving force; reconstruct the industrial chain based on artificial intelligence, industrial Internet, and other technologies; strengthen the research and development and application of green technologies; promote the transformation of traditional industries to low-carbon ones; push the county’s transition from a factor-driven economy to an innovation-driven economy; and set up a special support program with reference to Germany’s ”Industry 4.0 Small and Medium-sized Enterprises Transformation Fund” [49,50]. Central counties need to undertake the spillover of technology in the east, focusing on upgrading equipment manufacturing, modern agriculture, and other pillar industries; implementing the traditional industry renewal project; and optimizing traditional industrial processes empowered by Internet technology. They should also learn Japan’s “mother factory system” through the technology pivot factory, driven by surrounding counties, to form a three-tier supporting system. Western counties should rely on the advantages of wind and water resources to build national clean energy bases, build supporting infrastructure, and explore the path of realizing the value of ecological products to transform resource endowments into sustainable competitive advantages.
(2)
Promoting synergy between ecological protection and economic development
Referring to relevant United Nations practices on environmental-economic accounting, counties should be encouraged to utilize natural resource asset accounting and GEP assessment to transform ecological value into development capital [51]. In eastern coastal counties, mountain ecological restoration and agricultural surface source management have been strengthened, and the green economy has been activated through the “ecology + culture and tourism” model. In northeastern industrial-intensive areas, the construction experience of “waste-free cities” has been promoted, and industries with high water consumption and emissions have been strictly limited. In western ecologically fragile areas, central financial transfer payments have been increased to ensure that inputs for returning farmland to forests and rocky desertification treatment are sustainable.
(3)
Improvements in policy synergy and long-term guarantee mechanism
A three-level policy synergy network of “target-assessment-incentive” should be constructed to ensure institutional balance between ecological protection and economic development goals; establish a platform to monitor progress in achieving the SDGs at the county level, such as digital management systems for indicator tracking, specialized monitoring technology platforms, etc.; integrate multi-dimensional data on economy, ecology, and society; dynamically assess the effectiveness of policies; and optimize the allocation of resources. At the same time, local legislation will be promoted to clarify the provisions of ecological red line control and green development incentives, forming a full-cycle closed-loop governance involving “target synergy-process supervision-result accountability” to effectively guarantee the implementation of the SDGs at the county level.

Author Contributions

Conceptualization, Y.Z.; software, Y.Z.; validation, Y.Z.; formal analysis, Y.Z.; data curation, X.Z.; writing—original draft preparation, Y.Z.; writing—review and editing, C.S. and Y.Z.; visualization, Y.Z.; supervision, C.S. All authors have read and agreed to the published version of the manuscript.

Funding

This research was funded by National Key R&D Program of China (NO. 2022YFC3802900) and Science and Technology Strategy Consulting Project of Local Research Institutes of the Chinese Academy of Engineering (NO. 2024-DFZD-30-04).

Institutional Review Board Statement

Not applicable.

Informed Consent Statement

Not applicable.

Data Availability Statement

The data used to support the findings of this study will be made available by the corresponding authors upon request.

Acknowledgments

The authors would like to thank the anonymous reviewers and the editor for their constructive comments and suggestions for this paper.

Conflicts of Interest

The authors declare no conflicts of interest.

References

  1. Hu, Z.G.; Wu, Q.; Li, J. The localization of SDGs in China: System construction, status assessment and development reflection. Ecol. Indic. 2023, 154, 110514. [Google Scholar] [CrossRef]
  2. Xu, Z.C.; Chau, S.N.; Chen, X.Z.; Zhang, J.; Li, Y.J.; Dietz, T.; Wang, J.Y.; Winkler, J.A.; Fan, F.; Huang, B.R.; et al. Assessing progress towards sustainable development over space and time. Nature 2020, 577, 74–78. [Google Scholar] [CrossRef]
  3. Pradhan, P.; Costa, L.; Rybski, D.; Lucht, W.; Kropp, J.P. A Systematic Study of Sustainable Development Goal (SDG) Interactions. Earths Future 2017, 5, 1169–1179. [Google Scholar] [CrossRef]
  4. Scoones, I.; Stirling, A.; Abrol, D.; Atela, J.; Charli-Joseph, L.; Eakin, H.; Ely, A.; Olsson, P.; Pereira, L.; Priya, R.; et al. Transformations to sustainability: Combining structural, systemic and enabling approaches. Curr. Opin. Environ. Sustain. 2020, 42, 65–75. [Google Scholar] [CrossRef]
  5. Biermann, F.; Hickmann, T.; Sénit, C.A.; Beisheim, M.; Bernstein, S.; Chasek, P.; Grob, L.; Kim, R.E.; Kotzé, L.J.; Nilsson, M.; et al. Scientific evidence on the political impact of the Sustainable Development Goals. Nat. Sustain. 2022, 5, 795–800. [Google Scholar] [CrossRef]
  6. Fonseca, L.M.; Domingues, J.P.; Dima, A.M. Mapping the Sustainable Development Goals Relationships. Sustainability 2020, 12, 3359. [Google Scholar] [CrossRef]
  7. D’Adamo, I.; Di Carlo, C.; Gastaldi, M.; Rossi, E.N.; Uricchio, A.F. Economic Performance, Environmental Protection and Social Progress: A Cluster Analysis Comparison towards Sustainable Development. Sustainability 2024, 16, 5049. [Google Scholar] [CrossRef]
  8. Liu, D.F.; Li, F.X.; Qiu, M.L.; Zhang, Y.; Zhao, X.; He, J.H. An integrated framework for measuring sustainable rural development towards the SDGs. Land Use Policy 2024, 147, 107339. [Google Scholar] [CrossRef]
  9. Warchold, A.; Pradhan, P.; Thapa, P.; Putra, M.; Kropp, J.P. Building a unified sustainable development goal database: Why does sustainable development goal data selection matter? Sustain. Dev. 2022, 30, 1278–1293. [Google Scholar] [CrossRef]
  10. Wu, X.T.; Fu, B.J.; Wang, S.; Song, S.; Li, Y.J.; Xu, Z.C.; Wei, Y.P.; Liu, J.G. Decoupling of SDGs followed by re-coupling as sustainable development progresses. Nat. Sustain. 2022, 5, 452–459. [Google Scholar] [CrossRef]
  11. ElMassah, S.; Mohieldin, M. Digital transformation and localizing the Sustainable Development Goals (SDGs). Ecol. Econ. 2020, 169, 106490. [Google Scholar] [CrossRef]
  12. Liu, C.; Hu, S.G.; Wu, S.; Song, J.R.; Li, H.Y. County-level land use carbon emissions in China: Spatiotemporal patterns and impact factors. Sustain. Cities Soc. 2024, 105, 105304. [Google Scholar] [CrossRef]
  13. Xu, J.C.; Bai, J.J.; Chen, J. An Improved Indicator System for Evaluating the Progress of Sustainable Development Goals (SDGs) Sub-Target 9.1 in County Level. Sustainability 2019, 11, 4783. [Google Scholar] [CrossRef]
  14. Cheng, Z.; Wang, M.; Li, Y.; Wang, Q.; Tang, A.N. Spatial Pattern, Classification, and Influencing Factors of High-Quality County Development in China. J. Urban Plan. Dev. 2025, 151, 05024041. [Google Scholar] [CrossRef]
  15. Liu, S.Y.; Bai, J.J.; Chen, J. Measuring SDG 15 at the County Scale: Localization and Practice of SDGs Indicators Based on Geospatial Information. Isprs Int. J. Geo-Inf. 2019, 8, 515. [Google Scholar] [CrossRef]
  16. Qiu, Y.; Zhao, X.S.; Fan, D.Q.; Li, S.N. Geospatial Disaggregation of Population Data in Supporting SDG Assessments: A Case Study from Deqing County, China. Isprs Int. J. Geo-Inf. 2019, 8, 356. [Google Scholar] [CrossRef]
  17. He, R.; Huang, X.T.; Ye, X.Y.; Pan, Z.; Wang, H.; Luo, B.; Liu, D.M.; Hu, X.X. County Ecosystem Health Assessment Based on the VORS Model: A Case Study of 183 Counties in Sichuan Province, China. Sustainability 2022, 14, 11565. [Google Scholar] [CrossRef]
  18. Wang, Y.J.; Wang, M.J.; Huang, B.; Li, S.C.; Lin, Y.H. Evaluation and Analysis of Poverty-Stricken Counties under the Framework of the UN Sustainable Development Goals: A Case Study of Hunan Province, China. Remote Sens. 2021, 13, 4778. [Google Scholar] [CrossRef]
  19. Xu, W.T.; Wang, S.J. Analysis of the Impact of County-Levelization on Economic Growth and Public Service Development Based on Panel Data. Discret. Dyn. Nat. Soc. 2023, 2023, 6500191. [Google Scholar] [CrossRef]
  20. Zhou, R.C.; Guo, Y.; Wu, Y.Z.; Amado, M. Exploration on the Innovation Model of County Urbanization Development with the Resource Constraints in China. Sustainability 2023, 15, 16129. [Google Scholar] [CrossRef]
  21. Cao, P.; Tao, H.J. Sustainable Development in Gansu Province: Theil Index and Cluster Analysis. Sustainability 2024, 16, 4518. [Google Scholar] [CrossRef]
  22. Wang, M.J.; Wang, Y.J.; Teng, F.; Li, S.C.; Lin, Y.H.; Cai, H.F. China’s poverty assessment and analysis under the framework of the UN SDGs based on multisource remote sensing data. Geo-Spat. Inf. Sci. 2024, 27, 111–131. [Google Scholar] [CrossRef]
  23. Zhang, X.Y.; Zhang, L.; Bai, L.Y.; Liao, J.J.; Chen, B.W.; Yan, M. Assessment of Localized Targets of Sustainable Development Goals and Future Development on Hainan Island. Sustainability 2023, 15, 8551. [Google Scholar] [CrossRef]
  24. Xu, S.J.; Zheng, S.Y.; Huang, Z.Q.; Song, L.; Long, Y.; Zhan, X.J.; Jiang, L.J.; Wang, Y.M.; Shu, Y.Q.; Zheng, C.M. Assessing progress towards sustainable development in Shenzhen 2005–2019. J. Clean. Prod. 2022, 349, 131496. [Google Scholar] [CrossRef]
  25. Wang, C.; Wang, L.; Zhai, J.; Feng, T.; Lei, Y.; Li, S.; Liu, Y.; Liu, Y.; Hu, Z.; Zhu, K.; et al. Assessing progress toward China's subnational sustainable development by Region Sustainable Development Index. Sustain. Horiz. 2024, 11, 100099. [Google Scholar] [CrossRef]
  26. Wang, T.; Zhou, D.; Fan, J. Spatial differences of Sustainable Development Goals (SDGs) among counties (cities) on the northern slope of the Kunlun Mountains. Reg. Sustain. 2024, 5, 100108. [Google Scholar] [CrossRef]
  27. Song, W.; Cao, S.S.; Du, M.Y.; Lu, L.L.; Guo, H.D.; Wang, S.R.; Liu, Y.; Li, X.X. Provincial localization framework for SDGs in China: Enhancing support for sustainable governance. Appl. Geogr. 2025, 175, 103505. [Google Scholar] [CrossRef]
  28. Jia, K.; Sheng, Q.Y.; Liu, Y.H.; Yang, Y.Z.; Dong, G.L.; Qiao, Z.; Wang, M.; Sun, C.H.; Han, D.R. A framework for achieving urban sustainable development goals (SDGs): Evaluation and interaction. Sustain. Cities Soc. 2024, 114, 105780. [Google Scholar] [CrossRef]
  29. Ricciolini, E.; Rocchi, L.; Cardinali, M.; Paolotti, L.; Ruiz, F.; Cabello, J.M.; Boggia, A. Assessing Progress Towards SDGs Implementation Using Multiple Reference Point Based Multicriteria Methods: The Case Study of the European Countries. Soc. Indic. Res. 2022, 162, 1233–1260. [Google Scholar] [CrossRef]
  30. Allen, C.; Metternicht, G.; Wiedmann, T. Prioritising SDG targets: Assessing baselines, gaps and interlinkages. Sustain. Sci. 2019, 14, 421–438. [Google Scholar] [CrossRef]
  31. McArthur, J.W.; Rasmussen, K. Classifying Sustainable Development Goal trajectories: A country-level methodology for identifying which issues and people are getting left behind. World Dev. 2019, 123, 104608. [Google Scholar] [CrossRef] [PubMed]
  32. Firoiu, D.; Ionescu, G.H.; Bandoi, A.; Florea, N.M.; Jianu, E. Achieving Sustainable Development Goals (SDG): Implementation of the 2030 Agenda in Romania. Sustainability 2019, 11, 2156. [Google Scholar] [CrossRef]
  33. Xu, H.; Deng, H.; Zhang, D.W. Fine-grained sustainability assessment: County sustainable development in China from 2000 to 2017. J. Clean. Prod. 2023, 425, 138798. [Google Scholar] [CrossRef]
  34. Zhong, J.; Li, X. Interlinkages among County-Level Construction Indicators and Related Sustainable Development Goals in China. Land 2022, 11, 2008. [Google Scholar] [CrossRef]
  35. Liao, W.; Qu, Q.; Liang, S.; Jiang, W. Using granular computing to measure the similarity of sustainable development in China: Addressing goals 1, 3, 8, 10 and 15 of the SDGs. Environ. Dev. 2023, 47, 100886. [Google Scholar] [CrossRef]
  36. Chen, J.D.; Gao, M.; Cheng, S.L.; Hou, W.X.; Song, M.L.; Liu, X.; Liu, Y.; Shan, Y.L. County-level CO2 emissions and sequestration in China during 1997–2017. Sci. Data 2020, 7, 391. [Google Scholar] [CrossRef]
  37. Zhou, J.; Chen, K.; Liu, J.S. A clustering algorithm based on the weighted entropy of conditional attributes for mixed data. Concurr. Comput. -Pract. Exp. 2021, 33, e6293. [Google Scholar] [CrossRef]
  38. Sun, K.; Han, J.M.; Wu, Q.R.; Xie, W.S.; He, W.B.; Yang, Z.Z.; Wang, Y.B.; Liu, J.C.; Shi, E.H. The coupling coordination and spatiotemporal evolution of industrial water-energy-CO2 in the Yellow River Basin. Sci. Total Environ. 2024, 912, 169012. [Google Scholar] [CrossRef]
  39. Wang, Z.Q.; Wang, F.; Ma, S.L. Research on the Coupled and Coordinated Relationship Between Ecological Environment and Economic Development in China and its Evolution in Time and Space. Pol. J. Environ. Stud. 2025, 34, 3333–3342. [Google Scholar] [CrossRef]
  40. Hou, C.; Chen, H.; Long, R. Coupling and coordination of China’s economy, ecological environment and health from a green production perspective. Int. J. Environ. Sci. Technol. 2022, 19, 4087–4106. [Google Scholar] [CrossRef]
  41. Che, S.F.; Zhang, X.; Shu, W.J. Evaluation of internal coupling and coordination degree and diagnosis of obstacle factors for high-quality regional economic development: Evidence from Chongqing’s “One District, Two Groups”. PLoS ONE 2024, 19, e0312820. [Google Scholar] [CrossRef] [PubMed]
  42. Gao, K.; Yuan, Y.J. Spatiotemporal pattern assessment of China’s industrial green productivity and its spatial drivers: Evidence from city-level data over 2000-2017. Appl. Energy 2022, 307, 118248. [Google Scholar] [CrossRef]
  43. Zhang, T.; Guo, Y. Spatiotemporal heterogeneity of green total factor productivity in Chinese cities under technological heterogeneity. Energy Rep. 2024, 11, 1535–1543. [Google Scholar] [CrossRef]
  44. Hu, B.; Yuan, K.; Niu, T.; Zhang, L.; Guan, Y. Study on the Spatial and Temporal Evolution Patterns of Green Innovation Efficiency and Driving Factors in Three Major Urban Agglomerations in China-Based on the Perspective of Economic Geography. Sustainability 2022, 14, 9239. [Google Scholar] [CrossRef]
  45. Wei, L.; Zeng, B. Urban Technology Transfer, Spatial Spillover Effects, and Carbon Emissions in China. Sustainability 2024, 16, 9662. [Google Scholar] [CrossRef]
  46. Klimczuk, A.; Gawron, G.P.; Toczyski, P. Editorial: Towards 2030: Sustainable development goal 1: No poverty. A sociological perspective. Front. Sociol. 2024, 9, 1487228. [Google Scholar] [CrossRef] [PubMed]
  47. Singh, S.; Ru, J. Goals of sustainable infrastructure, industry, and innovation: A review and future agenda for research. Environ. Sci. Pollut. Res. 2023, 30, 28446–28458. [Google Scholar] [CrossRef] [PubMed]
  48. Ma, X.; Wang, F.; Chen, J.; Zhang, Y. The Income Gap Between Urban and Rural Residents in China: Since 1978. Comput. Econ. 2018, 52, 1153–1174. [Google Scholar] [CrossRef]
  49. Hajoary, P.K.; Balachandra, P.; Garza-Reyes, J.A. Industry 4.0 maturity and readiness assessment: An empirical validation using Confirmatory Composite Analysis. Prod. Plan. Control 2024, 35, 1779–1796. [Google Scholar] [CrossRef]
  50. Hager, C.; Hamagami, N. Local Renewable Energy Initiatives in Germany and Japan in a Changing National Policy Environment. Rev. Policy Res. 2020, 37, 386–411. [Google Scholar] [CrossRef]
  51. King, S.; Agra, R.; Zolyomi, A.; Keith, H.; Nicholson, E.; de Lamo, X.; Portela, R.; Obst, C.; Alam, M.; Honzak, M.; et al. Using the system of environmental-economic accounting ecosystem accounting for policy: A case study on forest ecosystems. Environ. Sci. Policy 2024, 152, 103653. [Google Scholar] [CrossRef]
Figure 1. Indicator transfer scheme from SDGs to counties.
Sustainability 17 04704 g001
Figure 2. National and regional levels of sustainable development at the district level.
Sustainability 17 04704 g002
Figure 3. The CSDI coupling harmonization score by province in China in the 2010–2021 period.
Sustainability 17 04704 g003
Figure 4. Analysis of CSDI barrier degree by province in China, 2021.
Sustainability 17 04704 g004
Figure 5. Decomposition contribution to CSDI and sub-CSDI.
Sustainability 17 04704 g005
Table 1. Comparative analysis of SDG research progress and this study’s theoretical contributions.
DimensionsCategoryExisting Research StatusKey Contributions of This Study
Study areaNational/Sub-nationalWell established-
Urban/ProvincesExtensive-
Rural/CountyLimited (mostly rural)Establish a “three-tier SDGs delivery framework” at county level
Areas of concernEconomic DevelopmentWell establishedIncorporate urban-rural gap assessment in economic development system
Social SustainabilityUrban-focusedFocus on coordinated urban-rural societal progress
Environment ResourcesExtensive-
Analytical perspectiveSpatiotemporal analysisMature methodsDevelop “coordination-obstacle-Dagum decomposition” triple dynamic evaluation model
Regional differencesProvincial divisionsAdopt four-region division (east/central/west/northwest) aligning with national strategy
System coordination Mostly economy-environmentConduct three-system (economic-environmental-social) Dagum Gini decomposition
Table 2. Evaluation index system for sustainable development of counties.
No.DimensionIndicatorsSDGsWeights
1Economic developmentMinimum standard salary20.0386
2Urban and rural basic public service expenditure as share of fiscal expenditure60.0382
3Number of social welfare adoption units80.0774
4Beds in health-care facilities90.0226
5Pupil division ratio90.0097
6Gender ratio of men to women100.0111
7Average annual GDP growth 110.0361
8GDP per capita110.0538
9Ratio of income between urban and rural areas160.0168
10Ecological environmentGrain production per unit area10.0286
11Domestic sewage treatment rate10.0075
12Water consumption per 10,000 GDP30.0469
13Gas penetration rate30.0093
14Green space coverage in built-up areas40.0194
15Non-hazardous treatment rate of domestic waste50.0120
16PM2.5 annual average concentration80.0566
17Agricultural fertilizer use 80.0422
18Net carbon emissions per capita100.0462
19Forest cover20.0502
20Social culturalGross power of agricultural machinery60.0258
21Water supply penetration60.0028
22Labor productivity70.0437
23Number of industrial enterprises above scale110.0495
24Total retail sales of consumer goods per capita110.0379
25Gini coefficient (a measure of statistical dispersion)110.0422
26Area occupied by construction land per unit of GDP120.0772
27Urbanization rate of resident population130.0271
28Financial self-sufficiency rate150.0706
Sources: Compiled by the authors.
Table 3. Identification of key SDGs and policy recommendations for counties.
Key SDGsExisting ProblemsDevelopment Proposals
SDG 7: Affordable and Clean EnergyUnderutilized clean energy resources in western regionsEstablish national clean energy bases in western counties
SDG9: Industry, Innovation and InfrastructureLow innovation levels and R&D investment in countiesEast: build AI innovation hubs; central: adopt eastern tech spillovers; west: develop cross-regional clean energy transmission
SDG11: Sustainable Cities and CommunitiesInadequate public services (education and health-care) and rural infrastructureCreate a three-tier service network: “county-key town-village”
SDG 13: Climate Action, SDG 15: Life on LandInsufficient ecological restoration in fragile western areas; high industrial emissions in the eastWest: cross-province eco-compensation; east: carbon labeling for key industries
SDG 16: Peace, Justice and Strong Institutions, SDG 17: Partnerships for the GoalsFragmented governance and lack of inter-regional collaborationEstablish cross-county industrial alliances to share technology, market, and ecological governance experience
Disclaimer/Publisher’s Note: The statements, opinions and data contained in all publications are solely those of the individual author(s) and contributor(s) and not of MDPI and/or the editor(s). MDPI and/or the editor(s) disclaim responsibility for any injury to people or property resulting from any ideas, methods, instructions or products referred to in the content.

