
Evaluation of Urban Rail Transit System Planning Based on Integrated Empowerment Method and Matter-Element Model

 ,
,
Abstract
1. Introduction
2. Research Status
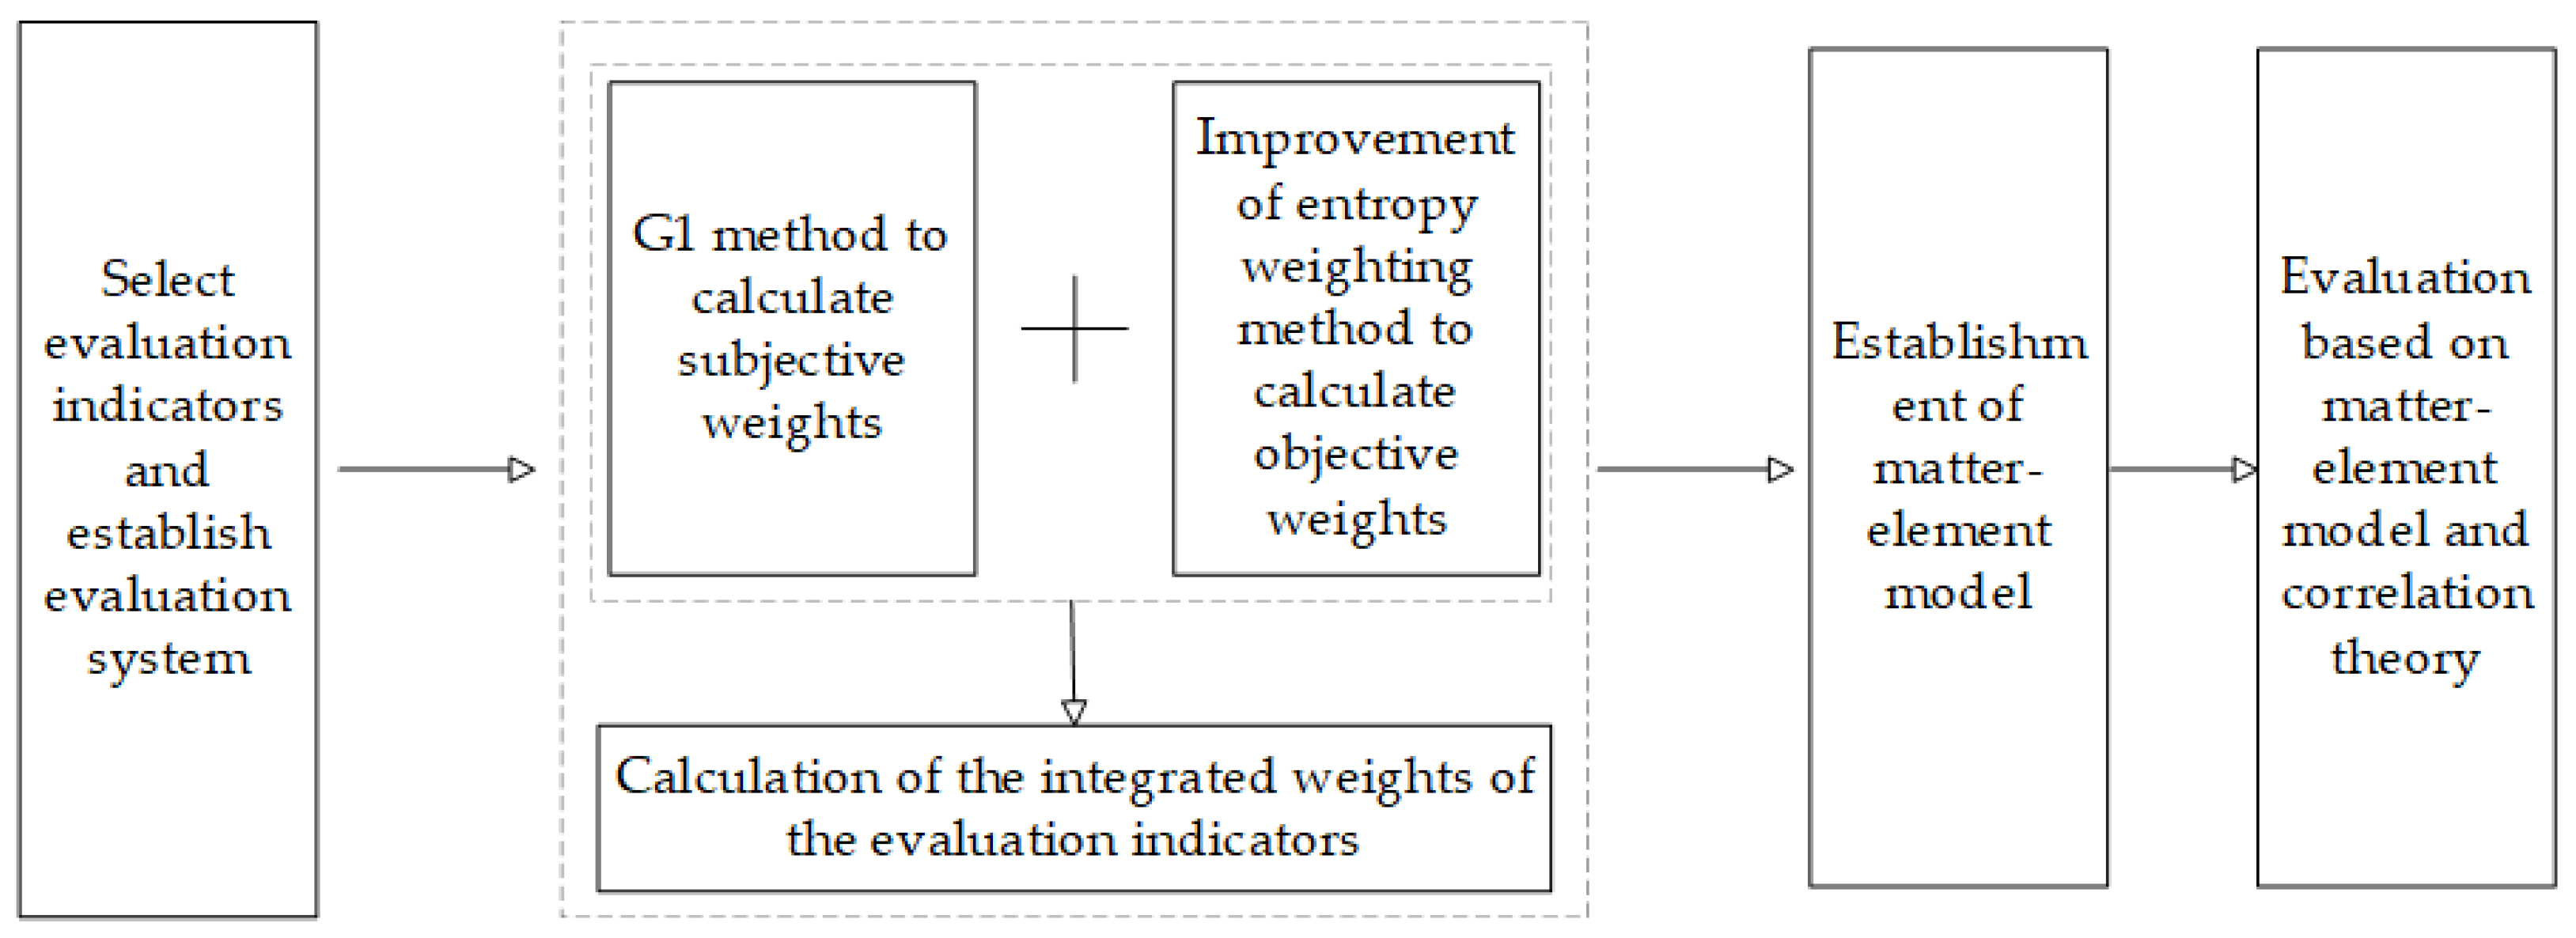
3. Methodology
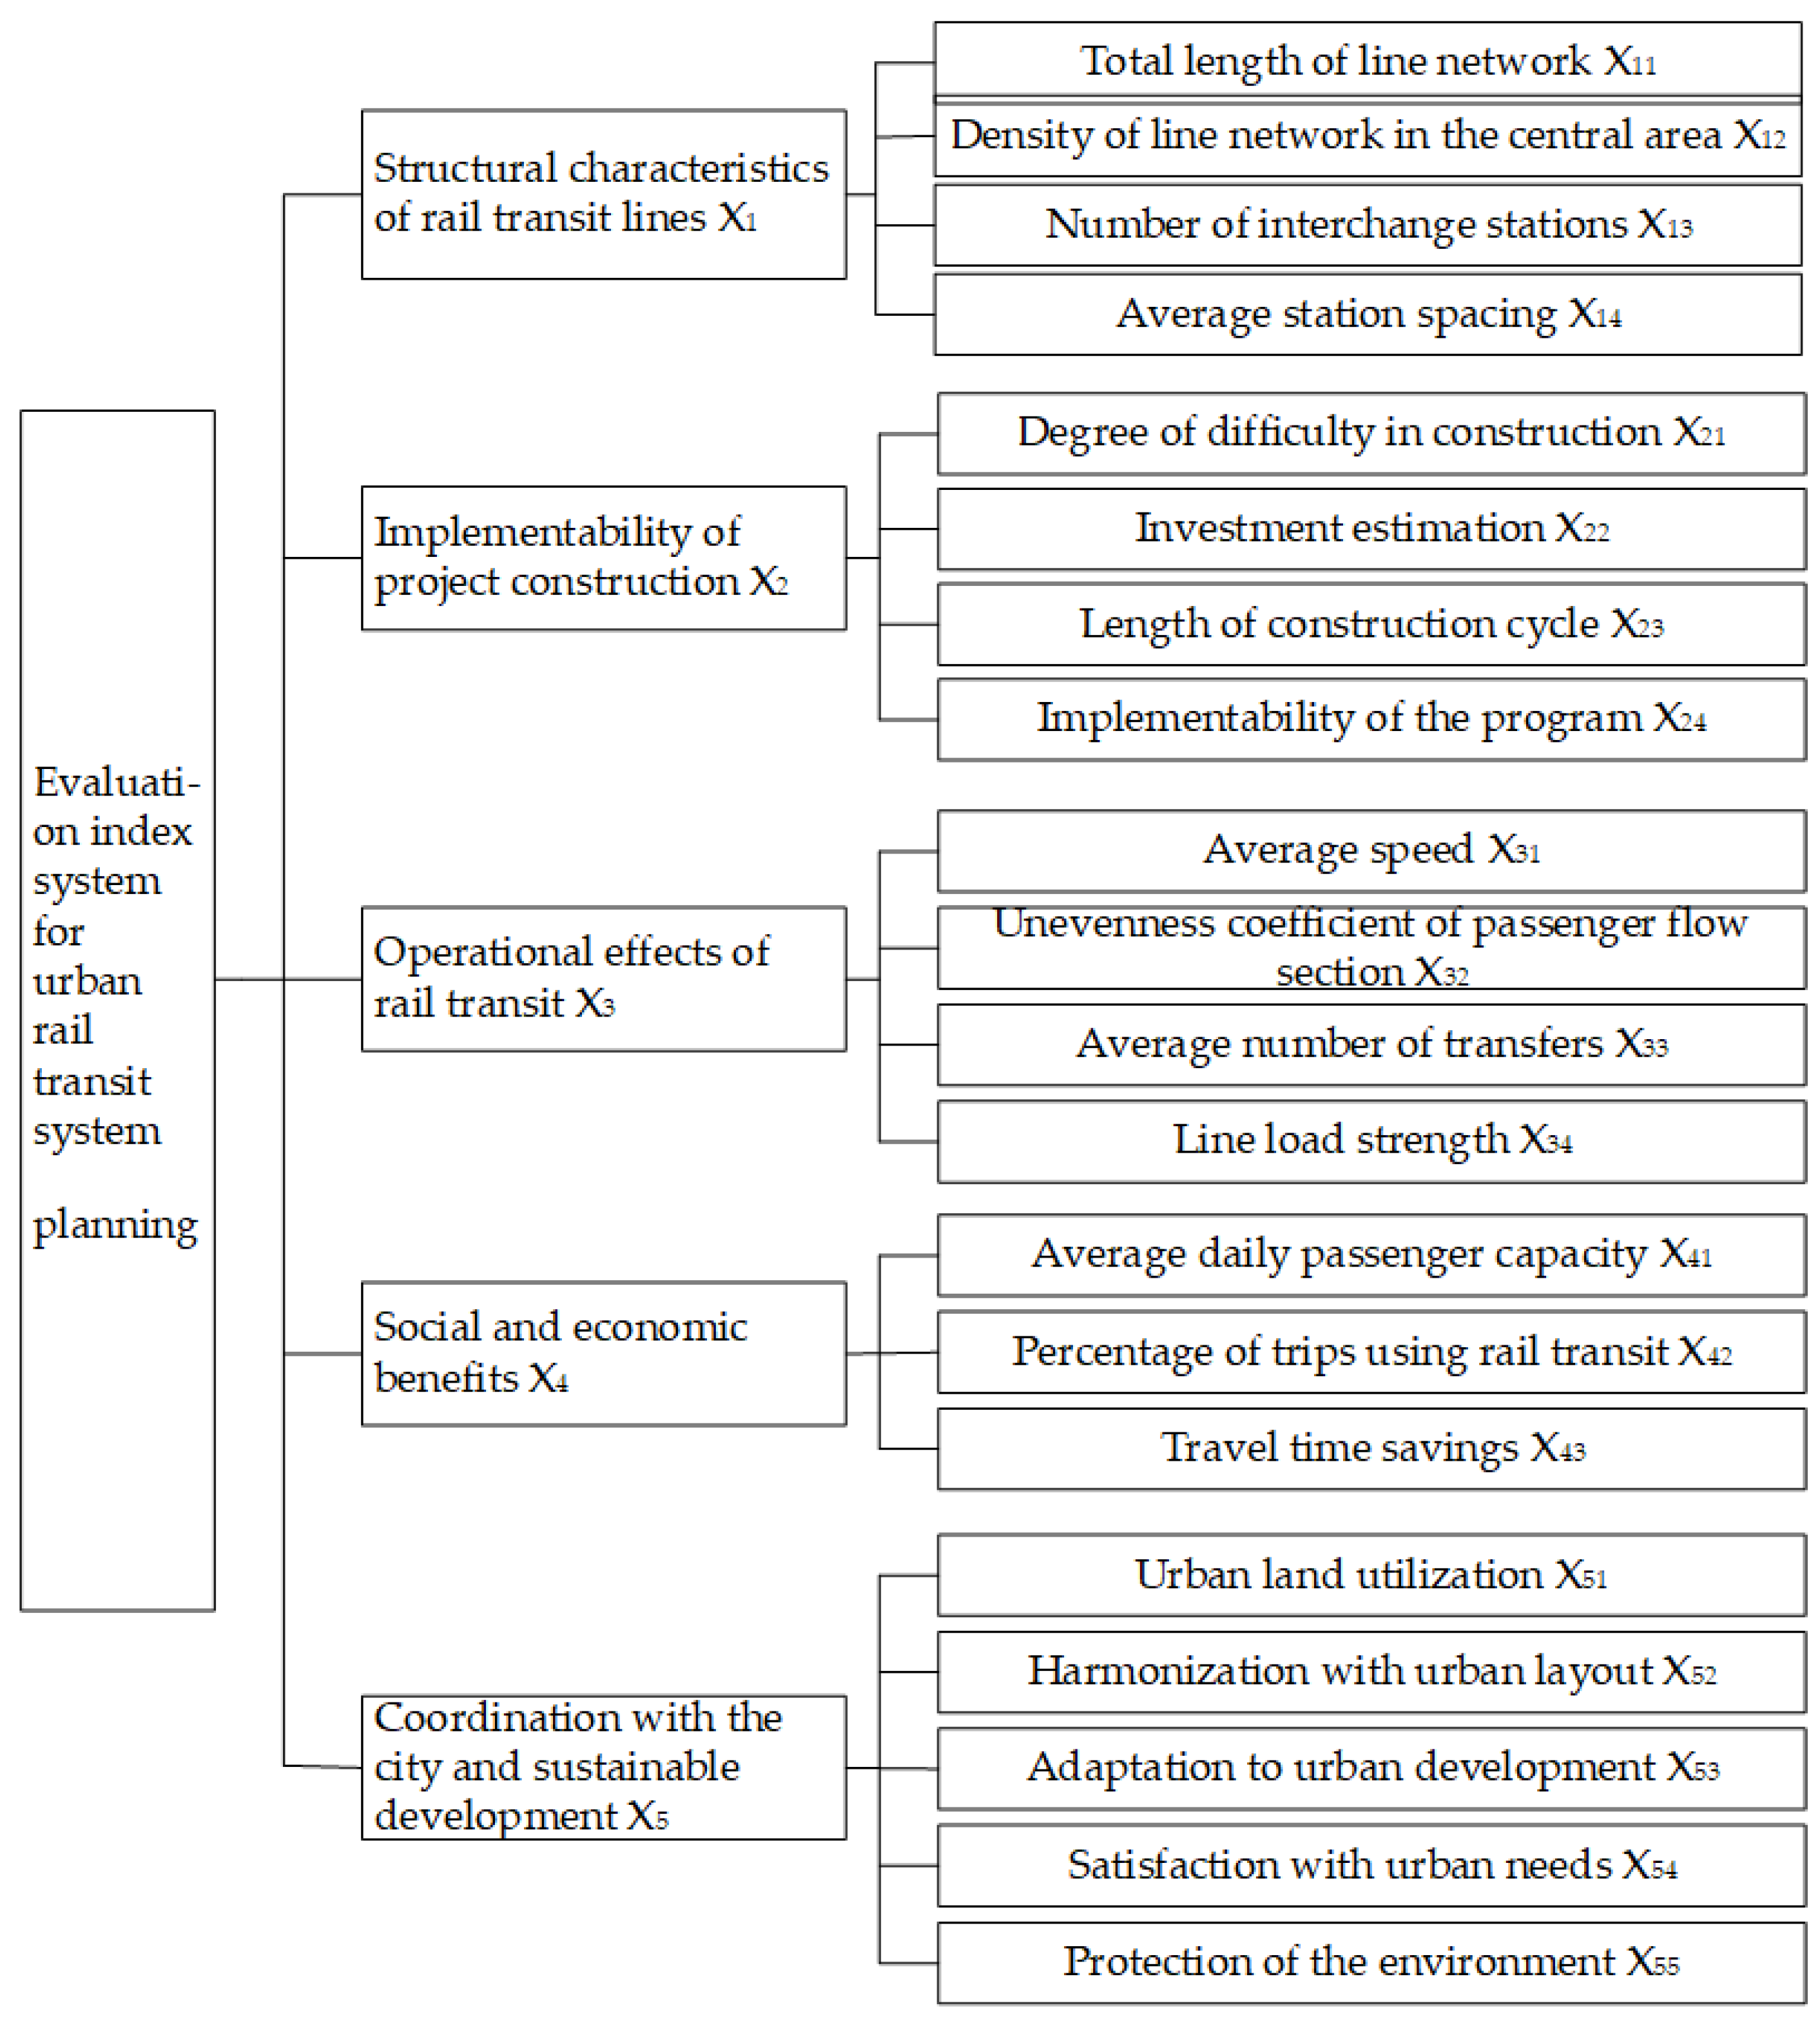
3.1. Establishment of the Evaluation System

| City | Evaluation Indicators | Category |
|---|---|---|
| Guangzhou | Total length of line network Density of line network in the central area Non-linear coefficient Number of transfer nodes Rate of area covered Connection with large passenger distribution points | Wire network structure |
| Transfer coefficient Line network load intensity Daily passenger volume | Operational analysis | |
| Difficulty of project implementation Implementability of the project Engineering construction cycle | Construction analysis | |
| Development value of land along the route Savings in average travel time Adaptation of line network development | Social benefit | |
| Beijing | Fringe group Accessibility to external transportation hubs and major passenger distribution points | Strategic development |
| Area coverage area Line density by region Directness of travel and ease of transfer | Wire network structure | |
| Passenger transportation effectiveness Total time of travel Ease of travel | Service level | |
| Difficulty of the project Interface with existing wired networks Construction cost | Project construction | |
| Nanjing | Passenger flow Saving running time Interchange volume | Traffic function |
| Construction cost Operating income Operating cost | Economic benefit | |
| Line efficiency Equalization of lines Adaptation of lines | Operational efficiency | |
| Wuhan | Harmonization with the urban layout Coordination with urban transportation facilities Regularization of the construction of field station facilities | Infrastructure |
| Wireline coverage Savings in travel time Convenience of traveling | Quality of service | |
| Implementability of the program Difficulty of construction Investment budget | Concrete construction | |
| Japan | People’s lives Regional economy Regional security | Impact evaluation |
| Implementability of the project Feasibility of the project Technical level | Evaluation of implementation | |
| Relative efficiency Project benefit | Earnings evaluation |
3.2. Determination of Evaluation Indicator Weights
3.2.1. Subjective Weights
- (1)
- Determine the ranking relationship between indicators and rank the importance of each indicator in the evaluation indicator system according to the importance of each evaluation indicator, taking into account the recommendations of experts:
- (2)
- The relative importance between neighboring indicators is judged by experts:
- (3)
- Calculate the weighting factors:
3.2.2. Objective Weights
3.2.3. Integrated Weights
3.3. Constructing Matter-Element Models
- (1)
- Evaluation of object element and object-element matrix
- (2)
- Determine the classical domain of the object element, the section domain, and the object element to be evaluated
- (1)
- Classical domainThe urban rail transit system planning scheme is classified into three levels, excellent, good, and poor, where excellent is level 1, good is level 2, and poor is level 3. The three levels represent three objects, and their object-element matrix, , are as follows:In the equation, is the range of values of with respect to , , and is the range of values of each indicator of the given level of the planning scheme of the urban rail transit system, which is called the classical domain.
- (2)
- Section domainAll classes of urban rail transit systems are planned with physical elements:is the maximum range of values of the n characteristic indicators for each level of urban rail transit system planning and evaluation. N is the level of all the urban rail transit system planning schemes. is the range of values of N with respect to . , where is called the section domain of the planning object element of the urban rail transit planning system.
- (3)
- The object element to be evaluatedDefine the element to be evaluated at the level of each planning scheme for the planning of the urban rail transit system as follows:where is the level of the urban rail transit system planning scheme to be evaluated. is the characteristic parameter of , and is the specific real value of .
3.4. Evaluation of Urban Rail Transit System Planning Schemes Based on Matter-Element Model
4. Case Analysis
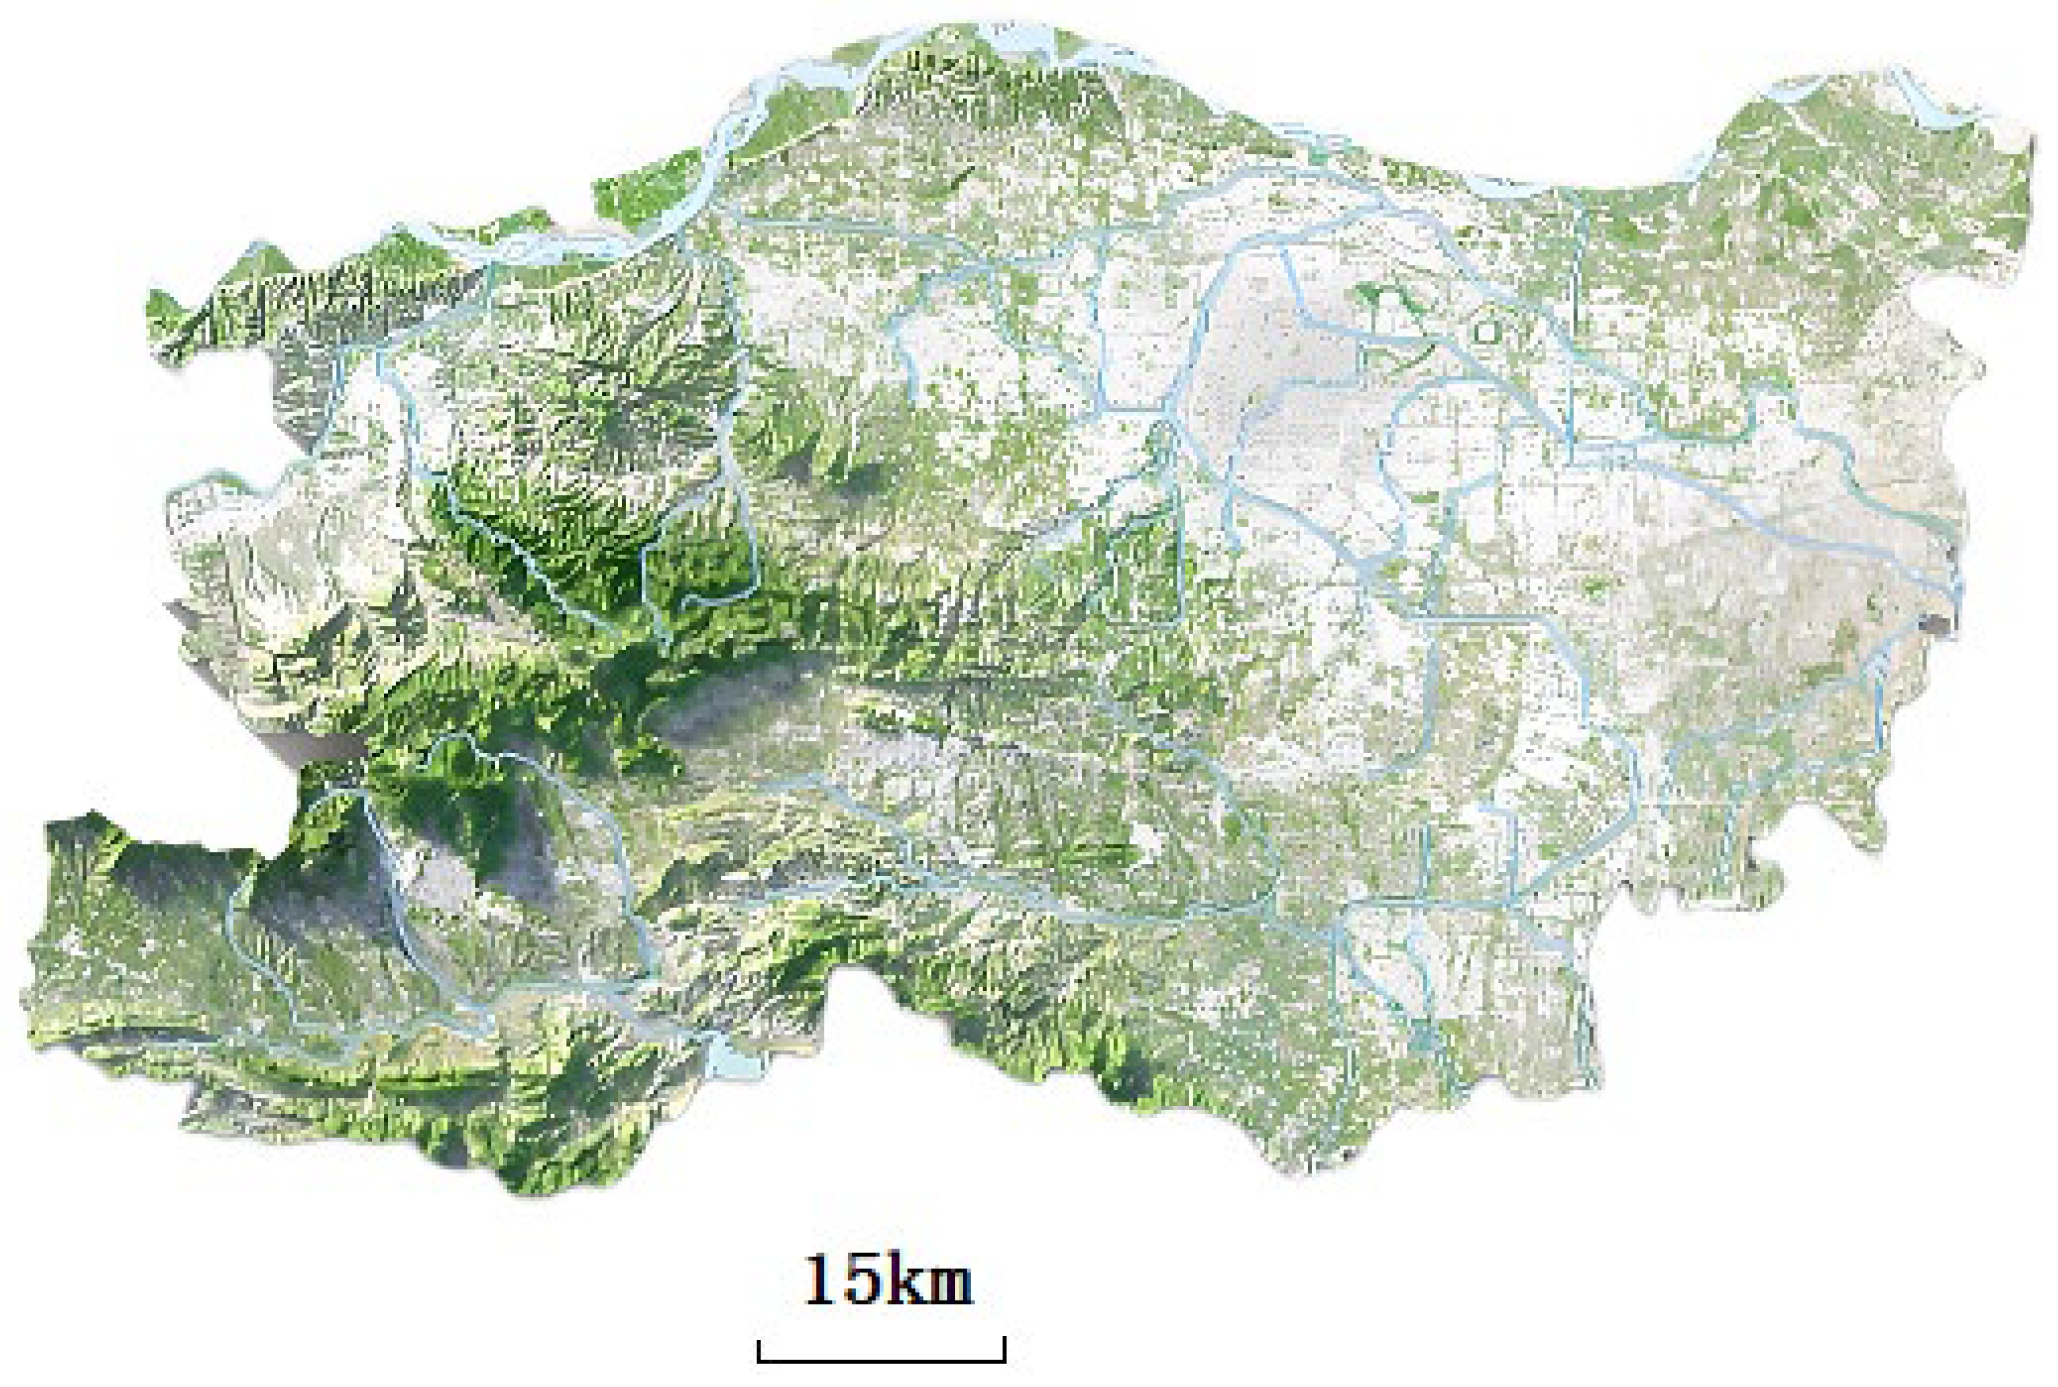
4.1. Case Selection
4.2. Specific Values of Evaluation Indicators and Criteria for Their Delineation
4.2.1. Specific Values
4.2.2. Delineation Criteria
4.3. Calculation of the Integrated Weights of Evaluation Indicators
4.4. Establishment of Matter-Element Model and Evaluation Results
- (1)
- Establishment of matter-element model
- (2)
- Evaluation results
4.5. Analysis of Evaluation Results
5. Summary
- (1)
- By comparing and analyzing the existing evaluation indices of rail transit system planning at home and abroad, a set of systematic, reasonable, and comprehensive evaluation index systems has been established based on the concept of sustainable green transportation, which lays a solid theoretical foundation for the subsequent research.
- (2)
- The integrated empowerment method and the improved entropy weight method are used to combine the evaluation indices, and the integrated empowerment method and the matter-element model evaluation method for urban rail transit network planning evaluation are established by applying the theory of matter-element model and correlation function in topology. This evaluation method combines subjectivity and objectivity, which significantly improves the scientific and practical adaptability of planning evaluation.
- (3)
- The established evaluation method is applied to evaluate the urban rail transit planning scheme of Zhengzhou City as an example. The evaluation results of the example verify the reliability and scientificity of the proposed method. According to the methodology proposed in this study, through an integrated weights and correlation analysis, planning authorities can identify the shortcomings in key indicators and prioritize the allocation of resources to optimize weak links. The dynamic threshold design of the matter-element model can adapt to the differentiated needs of different cities. Planners can adjust the classical domain scope based on local data and flexibly balance the goals of the economy, social benefit, and environmental protection. In the future, the planning department can embed this model into the decision support system and iteratively optimize it with real-time data to enhance the scientific and adaptive nature of urban rail transit planning.
Author Contributions
Funding
Institutional Review Board Statement
Informed Consent Statement
Data Availability Statement
Conflicts of Interest
References
- Wei, Y.; Yang, X.; Xiao, X.; Ma, Z.; Zhu, T.; Dou, F.; Wu, J.; Chen, A.; Gao, Z. Understanding the Resilience of Urban Rail Transit: Concepts, Reviews, and Trends. Engineering 2024, 41, 7–18. [Google Scholar] [CrossRef]
- Hao, F.J. Research on Optimization and Control of Flexible Traction Power Supply System for Urban Rail Transit. Master’s Thesis, Beijing Jiaotong University, Beijing, China, 2020. [Google Scholar]
- Floridan, M. A Traffic Equilibrium Model of Travel by Car an Public Transit Modes. Transp. Sci. 1977, 11, 166–179. [Google Scholar] [CrossRef]
- Shih, H.-C.; Hsu, Y.-T.; Lai, Y.-C. Modeling non-compensatory strategies on path choices in a complex urban rail transit network considering characteristics of transfer passengers and trips. Travel Behav. Soc. 2024, 35, 100733. [Google Scholar] [CrossRef]
- Tian, Y.; Zhu, W.; Song, F. Route Choice Modelling for an Urban Rail Transit Network: Past, Recent Progress and Future Prospects. Eur. Transp. Res. Rev. 2024, 16, 52. [Google Scholar] [CrossRef]
- Johnston, R.A.; DeLuchi, M.A. Evaluation methods for rail transit projects. Transp. Res. Part A 1989, 4, 317–325. [Google Scholar] [CrossRef]
- Miao, Y.Y. Urban rail transit network. Res. Urban Rail Transit Stud. 1998, 1, 29–33. [Google Scholar]
- Lobo, A.; Coppola, P. Improving Citizens’ Quality of Life and Societal Transitions: Highlights of the 49th European Transport Conference. Eur. Transp. Res. Rev. 2023, 15, 46. [Google Scholar] [CrossRef]
- Cai, Z.Y.; Yan, J.W. The planning and design of road network structure in urban railway transit hub areas. Int. J. Low-Carbon Technol. 2018, 13, 198–203. [Google Scholar] [CrossRef]
- Ma, Y.Q. Optimization Algorithm of Urban Rail Transit Network Route Planning Using Deep Learning Technology. Comput. Intell. Neurosci. 2022, 2022, 2024686. [Google Scholar] [CrossRef]
- Yin, P.; Peng, M. Station Layout Optimization and Route Selection of Urban Rail Transit Planning: A Case Study of Shanghai Pudong International Airport. Mathematics 2023, 11, 1539. [Google Scholar] [CrossRef]
- Huang, Z.; Ma, C. Symmetry-Based Urban Rail Transit Network Planning Using Two-Stage Robust Optimization. Symmetry 2024, 16, 1149. [Google Scholar] [CrossRef]
- Du, Z.; Pan, J.; Wang, X.; Chu, S.; Ni, S. Enhancing Urban Rail Transit Train Routes Planning Using Surrogate-Assisted Fish Migration Optimization. J. Bionic Eng. 2025. [Google Scholar] [CrossRef]
- Chen, J.X. The multi-level urban rail traffic safety based on fuzzy TOPSIS evaluation research. IOP Conf. Ser. Mater. Sci. Eng. 2019, 688, 022010. [Google Scholar] [CrossRef]
- Esposito Amideo, A.; Starita, S.; Scaparra, M.P. Assessing Protection Strategies for Urban Rail Transit Systems: A Case-Study on the Central London Underground. Sustainability 2019, 11, 6322. [Google Scholar] [CrossRef]
- Wu, S.J.; Zhu, Y.; Li, N.; Wang, Y.Z.; Wang, Y.J. Urban Rail Transit System Network Reliability Analysis Based on a Coupled Map Lattice Model. J. Adv. Transp. 2021, 2021, 5548956. [Google Scholar] [CrossRef]
- Ma, S.X.; Tian, Q.; Zou, C.; Yang, G.Y. Quality Risk Evaluation of Urban Rail Transit Construction Based on AHP–FCE Method. Adv. Civ. Eng. 2023, 2023, 2187071. [Google Scholar] [CrossRef]
- Yin, X.; Chen, J.; Li, Y. Simulation-Based Resilience Evaluation for Urban Rail Transit Transfer Stations. Sustainability 2024, 16, 3790. [Google Scholar] [CrossRef]
- Chuwang, D.D.; Chen, W. Forecasting Daily and Weekly Passenger Demand for Urban Rail Transit Stations Based on a Time Series Model Approach. Forecasting 2022, 4, 904–924. [Google Scholar] [CrossRef]
- Dong, N.; Li, T.; Liu, T.; Tu, R.; Lin, F.; Liu, H.; Bo, Y. A method for short-term passenger flow prediction in urban rail transit based on deep learning. Multimed. Tools Appl. 2024, 83, 61621–61643. [Google Scholar] [CrossRef]
- Li, D.; Du, S.; Hou, Y. Long-Term Passenger Flow Forecasting for Rail Transit Based on Complex Networks and Informer. Sensors 2024, 24, 6894. [Google Scholar] [CrossRef]
- Zhang, G.L.; Mao, S.; Zhang, S.X.; Yin, J.; Yang, L.; Gao, Z. EF-former for short-term passenger flow prediction during large-scale events in urban rail transit systems. Inf. Fusion 2025, 117, 102916. [Google Scholar] [CrossRef]
- Xing, X.; Wang, B.; Ning, X.; Wang, G.; Tiwari, P. Short-term OD flow prediction for urban rail transit control: A multi-graph spatiotemporal fusion approach. Inf. Fusion 2025, 118, 102950. [Google Scholar] [CrossRef]
- Chen, Z.-S.; Wang, Y.; Chen, Y.-H.; Mardani, A.; Pedrycz, W.; Martínez, L. Towards a collective opinion generation approach with multiple objectives for evaluating rail transit station accessibility in urban areas. Knowl.-Based Syst. 2024, 294, 111721. [Google Scholar] [CrossRef]
- Luo, X.; Kang, K.; Lu, L.; Yu, C.; Li, C.; Li, B.; Hu, S.; Qi, X.; Zhou, Y. Resilience evaluation of low-carbon supply chain based on improved matter-element extension model. PLoS ONE 2024, 19, e0301390. [Google Scholar] [CrossRef]
- Li, G.H.; Deng, H.N.; Yang, H. A multi-factor combined traffic flow prediction model with secondary decomposition and improved entropy weight method. Expert Syst. Appl. 2024, 255, 124424. [Google Scholar] [CrossRef]
- Bezdan, A.; Bezdan, J.; Marković, M.; Mirčetić, D.; Baumgertel, A.; Salvai, A.; Blagojević, B. An objective methodology for waterlogging risk assessment based on the entropy weighting method and machine learning. Catena 2025, 249, 108618. [Google Scholar] [CrossRef]
- Guo, X.C.; Kong, Z. Evolution Mechanism and Generation Method of Urban Rail Transit Networks; Science Press: Beijing, China, 2023. [Google Scholar]
- Circular of the Ministry of Transportation and Communications on the Issuance of the Assessment and Evaluation Indicator System for Public Transportation Cities. Available online: https://xxgk.mot.gov.cn/2020/jigou/ysfws/202006/t20200623_3314986.html (accessed on 5 May 2025).
- National Academies of Sciences, Engineering, and Medicine; KFH Group, Inc.; Texas A&M Transportation Institute; Transportation Research, Board; Transit Cooperative Research, Program; Kittelson & Associates, Inc.; Parsons Brinckerhoff. Transit Capacity and Quality of Service Manual, 3rd ed.; The National Academies Press: Washington, DC, USA, 2013. [Google Scholar] [CrossRef]
- Analysis Report on Evaluation Indicators for the Effectiveness of Urban Rail Transit. 2022. Available online: https://www.camet.org.cn/xytj/tjxx/12359.shtml (accessed on 5 May 2025).
- Hu, B.S.; Xiao, C. Evaluation Study on Railway Transportation Networking Planning in Urban Agglomerations. J. Railw. Eng. 2022, 39, 7–13. [Google Scholar]
- Wen, X.; Si, B.; Wei, Y.; Cui, H. Resilience assessment of urban rail transit systems: A literature review. Public Transp. 2025. [Google Scholar] [CrossRef]
- Qin, X.; Zha, X.; Wu, Z.; Zhang, L. Grey Fuzzy Comprehensive Evaluation of Bridge Risk during Periods of Operation Based on a Combination Weighting Method. Appl. Sci. 2023, 13, 8964. [Google Scholar] [CrossRef]
- Banadkouki, M.R.Z. Selection of strategies to improve energy efficiency in industry: A hybrid approach using entropy weight method and fuzzy TOPSIS. Energy 2023, 279, 128070. [Google Scholar] [CrossRef]
- Lu, D.Y. Research on Core Competitiveness of Third-Party Logistics Enterprises Based on Improved Entropy Power Approach. Master’s Thesis, North China Electric Power University, Beijing, China, 2017. [Google Scholar]
- Feng, T.; Liu, Y.; Chen, C.; Liu, K.; Huang, C. Traffic Safety Evaluation of Downstream Intersections on Urban Expressways Based on Analytical Hierarchy Process–Matter-Element Method. Sustainability 2024, 16, 6887. [Google Scholar] [CrossRef]
- Geng, X.; Ye, J.; Xia, Z.; Mu, Y.; Zhu, L. An Improved Algorithm of Nearness Degree of Incidence Based on Grey Neural Network. IEEE Access 2020, 8, 207044–207053. [Google Scholar] [CrossRef]
- Luo, R.X.; Liu, S.M.; You, M.N.; Lin, J.C. Load Forecasting Based on Weighted Grey Relational Degree and Improved ABC-SVM. J. Electr. Eng. Technol. 2021, 16, 2191–2200. [Google Scholar]
- Zhang, C.M. Research on Comprehensive Benefit Evaluation of Green Buildings Based on AHP-Objective Topology Modeling. Master’s Thesis, Jiangxi University of Science and Technology, Ganzhou, China, 2022. [Google Scholar]
| Research Dimension | Author (Year) | Research Content |
|---|---|---|
| Planning and design | Cai et al. (2018) [9] | Planning and designing the road network of Tianjin Roundabout Hub Area based on TOD mode and land utilization rate of the hub area |
| Ma et al. (2022) [10] | Establishment of a deep-learning-based optimization algorithm for urban rail transit line network planning | |
| Yin et al. (2023) [11] | Cost-oriented station spacing optimization model based on HDBSCAN algorithm | |
| Huang et al. (2024) [12] | A hybrid evolutionary algorithm with chromosomes having a two-layer coding structure is designed, and a line network planning model based on two-stage robust optimization is established | |
| Du et al. (2025) [13] | A two-layer algorithm based on SA-FMO is proposed to solve the train path optimization problem for urban rail transit | |
| Operation and management | Chen (2019) [14] | Evaluation of safety of urban rail transit using TOPSIS methodology |
| Annunziata Esposito Amideo et al. (2019) [15] | A sequential approach using single asset metrics and a combination of RFP were used to assess the City of London’s rail transit system safety and protection strategy | |
| Wu et al. (2021) [16] | Establishment of a dynamic model of Shanghai urban rail transit network based on a coupled tug model | |
| Ma et al. (2023) [17] | Comprehensive evaluation of metro project construction quality risk based on AHP-FCE method | |
| Yin et al. (2025) [18] | A two-level fuzzy evaluation model was established by combining the G1 weighting method with Anylogic simulation technique | |
| Passenger flow prediction | Dung David Chu Wang et al. (2025) [19] | Constructed a model for forecasting daily and weekly passenger demand for urban rail transit |
| Dong et al. (2024) [20] | A TSN-LSTM model was developed to predict short-duration passenger flow in urban rail transit | |
| Li et al. (2024) [21] | A proposed method for long-term passenger flow prediction by fusing complex networks and Informer models | |
| Zhang et al. (2025) [22] | A multi-step passenger flow prediction model based on deep learning is proposed | |
| Xing et al. (2025) [23] | A spatio-temporal fusion network for predicting OD flows in urban rail transit trips established |
| Typology | Method | Characteristic |
|---|---|---|
| Subjective empowerment method | Analytic hierarchy process (AHP) | Structured decision-making; highly interpretable; highly subjective; requires multiple consistency tests and is inefficient when there are too many indicators |
| Ordinal relationship method (G1) | No consistency test required; highly adaptable; rely on expert ranking; not utilizing objective data to dynamically adjust weights | |
| Expert scoring method | Direct prioritization of indicators through two-by-two comparisons without complex matrix calculations; relative evaluation only; suitable for evaluation systems with a small number of indicators | |
| Logogram method | Direct aggregation of expert opinion, applicable to urgent or ad hoc evaluations; high degree of subjectivity and arbitrariness; lack of data support | |
| Objective empowerment method | Entropy weight method | Strong mathematical theoretical basis; relies on data distribution, high objectivity; sensitive to outliers |
| Principal component analysis (PCA) | Eliminate indicator redundancy; suitable for high-dimensional data; physical significance of principal components unclear; suitable for scenarios where evaluation indicators are highly correlated | |
| Coefficient of variation method | Reflects the discriminatory power of the indicator; ignores independence of the indicator; does not reflect the experience of experts |
| Scheme 1 | Scheme 2 | |
|---|---|---|
| Operating lines | 6 lines | 5 lines |
| Total length | 206.3 km | 187.8 km |
| Number of Interchange Stations | 17 | 15 |
| Line density | 0.66 km/km2 | 0.51 km/km2 |
| Average station spacing | 2.10 km | 2.14 km |
| Estimated costs | 79,848 million | 76,532 million |
| Planning map | 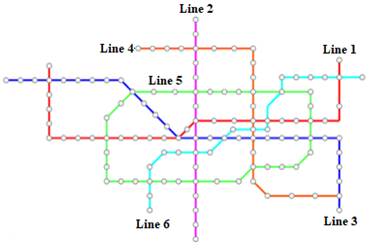 | 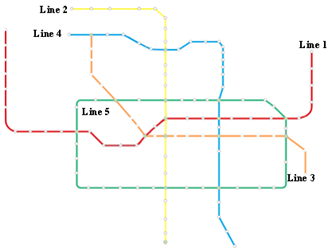 |
| X11 (km) | X12 (%) | X13 (Number) | X14 (km) | X21 (Score) | |
| Scheme 1 | 206.3 | 31 | 17 | 2.10 | 7.10 |
| Scheme 2 | 187.8 | 29 | 15 | 2.14 | 7.21 |
| X22 (100 million) | X23 (year) | X24 (score) | X31 (km/h) | X32 (%) | |
| Scheme 1 | 798.48 | 9 | 8.21 | 80 | 2.38 |
| Scheme 2 | 765.32 | 7 | 7.12 | 75 | 2.59 |
| X33 (time) | X34 (thousands of people/day·km) | X41 (thousands of people) | X42 (%) | X43 (h) | |
| Scheme 1 | 1.36 | 3.89 | 125.23 | 28 | 10.28 |
| Scheme 2 | 1.29 | 3.49 | 121.31 | 24 | 9.38 |
| X51 (score) | X52 (score) | X53 (score) | X54 (score) | X55 (score) | |
| Scheme 1 | 8.56 | 7.94 | 8.74 | 8.34 | 8.01 |
| Scheme 2 | 8.16 | 8.19 | 7.69 | 8.01 | 7.23 |
| Name of the Index (Unit) | |||
|---|---|---|---|
| Total length of line network (km) | (190, 200) | (200, 210) | (210, 220) |
| Density of line network in the central area (%) | (30, 35) | (25, 30) | (20, 25) |
| Number of interchange stations (number) | (15, 20) | (10, 15) | (5, 10) |
| Average station spacing (km) | (1.0, 1.5) | (1.5, 2.0) | (2.0, 2.5) |
| Degree of difficulty in construction (score) | (8, 10) | (7, 8) | (6, 7) |
| Investment estimation (100 million) | (600, 700) | (700, 800) | (800, 900) |
| Length of construction cycle (year) | (3, 6) | (6, 10) | (10, 13) |
| Implementability of the program (score) | (8, 10) | (7, 8) | (6, 7) |
| Average speed (km/h) | (80, 100) | (60, 80) | (40, 60) |
| Unevenness coefficient of passenger flow section (%) | (1.5, 2.0) | (2.0, 2.5) | (2.5, 3.0) |
| Average number of transfers (time) | (1.2, 1.3) | (1.3, 1.4) | (1.4, 1.5) |
| Line load strength (thousands of people/day·km) | (4, 5) | (3, 4) | (1, 2) |
| Average daily passenger capacity (thousands of people) | (130, 140) | (120, 130) | (110, 120) |
| Percentage of trips using rail transit (%) | (30, 35) | (25, 30) | (20, 25) |
| Travel time savings (h) | (15, 20) | (10, 15) | (5, 10) |
| Urban land utilization (score) | (8, 10) | (7, 8) | (6, 7) |
| Harmonization with urban layout (score) | (8, 10) | (7, 8) | (6, 7) |
| Adaptation to urban development (score) | (8, 10) | (7, 8) | (6, 7) |
| Satisfaction with urban needs (score) | (8, 10) | (7, 8) | (6, 7) |
| Protection of the environment (score) | (8, 10) | (7, 8) | (6, 7) |
| Evaluation Indicators | Subjective Weights | Objective Weights | Integrated Weights | Evaluation Indicators | Subjective Weights | Objective Weights | Integrated Weights |
|---|---|---|---|---|---|---|---|
| X11 | 0.04675 | 0.04997 | 0.04836 | X33 | 0.04535 | 0.04996 | 0.04766 |
| X12 | 0.06670 | 0.04996 | 0.05833 | X34 | 0.04172 | 0.04996 | 0.04584 |
| X13 | 0.05951 | 0.04996 | 0.05474 | X41 | 0.06327 | 0.05068 | 0.05698 |
| X14 | 0.04754 | 0.04996 | 0.04875 | X42 | 0.05814 | 0.04997 | 0.05406 |
| X21 | 0.06159 | 0.04996 | 0.05578 | X43 | 0.04959 | 0.04996 | 0.04978 |
| X22 | 0.05294 | 0.04996 | 0.05145 | X51 | 0.04642 | 0.04996 | 0.04819 |
| X23 | 0.05078 | 0.04996 | 0.05037 | X52 | 0.05275 | 0.04996 | 0.05136 |
| X24 | 0.05078 | 0.04996 | 0.05037 | X53 | 0.04431 | 0.04996 | 0.04714 |
| X31 | 0.05079 | 0.04997 | 0.05038 | X54 | 0.03798 | 0.04996 | 0.04397 |
| X32 | 0.04353 | 0.04996 | 0.04675 | X55 | 0.02954 | 0.04996 | 0.03975 |
| Name of the Index (Unit) | |||
|---|---|---|---|
| Total length of line network (km) | −0.3150 | 0.3700 | −0.2162 |
| Density of line network in the central area (%) | 0.2000 | −0.2000 | −0.6000 |
| Number of interchange stations (number) | 0.4000 | −0.4000 | −0.7000 |
| Average station spacing (km) | −0.6000 | −0.2000 | 0.2000 |
| Degree of difficulty in construction (score) | −0.4500 | 0.1000 | −0.0833 |
| Investment estimation (100 million) | −0.4924 | 0.0152 | −0.0147 |
| Length of construction cycle (year) | −0.4286 | 0.2500 | −0.2000 |
| Implementability of the program (score) | 0.1050 | −0.1050 | −0.4033 |
| Average speed (km/h) | 0.0000 | 0.0000 | −0.5000 |
| Unevenness coefficient of passenger flow section (%) | −0.3800 | 0.2400 | −0.1622 |
| Average number of transfers (time) | −0.3000 | 0.4000 | −0.2000 |
| Line load strength (thousands of people/day·km) | −0.0902 | 0.1100 | −0.6300 |
| Average daily passenger capacity (thousands of people) | −0.2441 | 0.4770 | −0.2602 |
| Percentage of trips using rail transit (%) | −0.2222 | 0.4000 | −0.3000 |
| Travel time savings (h) | −0.4720 | 0.0560 | −0.0504 |
| Urban land utilization (score) | 0.2800 | −0.2240 | −0.5200 |
| Harmonization with urban layout (score) | −0.0300 | 0.0600 | −0.3264 |
| Adaptation to urban development (score) | 0.3700 | −0.0300 | −0.5800 |
| Satisfaction with urban needs (score) | 0.1700 | −0.1700 | −0.4467 |
| Protection of the environment (score) | 0.0200 | −0.0050 | −0.3367 |
| Comprehensive correlation | −0.0190 | 0.0065 | −0.0592 |
| Name of the Index (Unit) | |||
|---|---|---|---|
| Total length of line network (km) | −1.3120 | −1.2200 | −1.1100 |
| Density of line network in the central area (%) | −0.1429 | 0.2000 | −0.4000 |
| Number of interchange stations (number) | 0.0000 | 0.0000 | −0.5000 |
| Average station spacing (km) | −0.6400 | −0.2800 | 0.2800 |
| Degree of difficulty in construction (score) | −0.3950 | 0.2100 | −0.1479 |
| Investment estimation (100 million) | −0.3266 | 0.3468 | −0.2084 |
| Length of construction cycle (year) | −0.2000 | 0.2500 | −0.4286 |
| Implementability of the program (score) | −0.4400 | 0.1200 | −0.0600 |
| Average speed (km/h) | −0.1667 | 0.2500 | −0.3750 |
| Unevenness coefficient of passenger flow section (%) | −0.5900 | −0.1800 | 0.1800 |
| Average number of transfers (time) | 0.1000 | −0.1000 | −0.5500 |
| Line load strength (thousands of people/day·km) | 0.2525 | 0.4900 | −0.4967 |
| Average daily passenger capacity (thousands of people) | −0.4345 | 0.1310 | −0.1038 |
| Percentage of trips using rail transit (%) | −0.6000 | −0.2000 | 0.2000 |
| Travel time savings (h) | −0.5620 | −0.1240 | 0.1240 |
| Urban land utilization (score) | 0.0800 | −0.0800 | −0.3867 |
| Harmonization with urban layout (score) | 0.0950 | −0.0950 | −0.3967 |
| Adaptation to urban development (score) | −0.1550 | 0.3100 | −0.2899 |
| Satisfaction with urban needs (score) | 0.0050 | −0.0500 | −0.5050 |
| Protection of the environment (score) | −0.3850 | 0.2300 | −0.1575 |
| Comprehensive correlation | −0.0501 | 0.0020 | −0.0544 |
Disclaimer/Publisher’s Note: The statements, opinions and data contained in all publications are solely those of the individual author(s) and contributor(s) and not of MDPI and/or the editor(s). MDPI and/or the editor(s) disclaim responsibility for any injury to people or property resulting from any ideas, methods, instructions or products referred to in the content. |
© 2025 by the authors. Licensee MDPI, Basel, Switzerland. This article is an open access article distributed under the terms and conditions of the Creative Commons Attribution (CC BY) license (https://creativecommons.org/licenses/by/4.0/).
Share and Cite
Peng, H.; Chen, Y.; Shangguan, L.; Zhou, S.; Li, Y.; Wang, Q. Evaluation of Urban Rail Transit System Planning Based on Integrated Empowerment Method and Matter-Element Model. Sustainability 2025, 17, 4569. https://doi.org/10.3390/su17104569
Peng H, Chen Y, Shangguan L, Zhou S, Li Y, Wang Q. Evaluation of Urban Rail Transit System Planning Based on Integrated Empowerment Method and Matter-Element Model. Sustainability. 2025; 17(10):4569. https://doi.org/10.3390/su17104569
Chicago/Turabian StylePeng, Han, Yike Chen, Linjian Shangguan, Shengnan Zhou, Yanchi Li, and Qianyu Wang. 2025. "Evaluation of Urban Rail Transit System Planning Based on Integrated Empowerment Method and Matter-Element Model" Sustainability 17, no. 10: 4569. https://doi.org/10.3390/su17104569
APA StylePeng, H., Chen, Y., Shangguan, L., Zhou, S., Li, Y., & Wang, Q. (2025). Evaluation of Urban Rail Transit System Planning Based on Integrated Empowerment Method and Matter-Element Model. Sustainability, 17(10), 4569. https://doi.org/10.3390/su17104569