Article

Spatiotemporal Distribution and Obstacle Factors of New-Quality Productivity in Water Conservancy in China Based on RAGA-PP and Obstacle Degree Model

1
Beijing Key Lab of Urban Hydrological Cycle and Sponge City Technology, College of Water Science, Beijing Normal University, Beijing 100875, China
2
Bureau of Comprehensive Development, Ministry of Water Resources, Beijing 100053, China
3
Key Laboratory of Land and Sea Ecological Governance and Systematic Regulation of the Ministry of Ecology and Environment, Shandong Academy for Environmental Planning, Jinan 250101, China
4
College of Sciences, North China University of Science and Technology, Tangshan 063210, China
*
Author to whom correspondence should be addressed.
Sustainability 2025, 17(10), 4534; https://doi.org/10.3390/su17104534
Submission received: 12 April 2025 / Revised: 12 May 2025 / Accepted: 12 May 2025 / Published: 15 May 2025
(This article belongs to the Special Issue Sustainable Water Management in Rapid Urbanization)

Abstract

:
Developing new-quality productivity in water conservancy (NQPWC) is vital for advancing economic and social development, with a focus on sustainability. An evaluation of NQPWC and the identification of key barriers can help define the challenges and guide the development of targeted solutions. This study established an evaluation indicators system for NQPWC through four dimensions (3H1G): High-technology, High-efficiency, High-quality, and Green. Utilizing a multi-attribute decision approach based on the Real-Code Accelerated Genetic Algorithm Projection Pursuit model (RAGA-PP model), an evaluation of NQPWC at the provincial level in China from 2011 to 2022 was conducted. The results revealed a curvilinear upward trend in NQPWC in most regions, with southeastern coastal provinces (cities) outperforming those in the northwest. Further, the major obstacles affecting NQPWC’s development were identified through an Obstacle Degree Model (ODM), with High-technology being the most significant dimension, followed by High-quality, Green, and High-efficiency.

1. Introduction

The world is currently experiencing unprecedented changes characterized by numerous opportunities and challenges [1]. The interplay of globalization, technological advancements, and political transformations has created a complex and dynamic international landscape [2]. To address these significant challenges, innovation in productivity and its high-quality development are urgently required [3,4,5]. China’s concept of new-quality productivity (NQP) [6] is a key approach that integrates technological advancement, innovation, and institutional reform to optimize production methods and service levels [7,8]. NQP has garnered significant attention, prompting the extensive exploration of its development and application across sectors [9,10].
Water conservancy serves as a fundamental support for human societal development, and it is deeply interconnected with economic, social, and ecological systems [11,12,13,14,15,16]. Approximately 71% of the Earth’s surface is covered by water. However, the majority of this water is seawater. The freshwater resources truly available for human use only account for 2.5% of the total global water volume, and the majority of this freshwater exists in the form of glaciers at the poles. Although agricultural water use accounts for about 70% of freshwater consumption, industrial water use (approximately 20%) and domestic water use (approximately 10%) are the main sectors driving the increasing demand for freshwater. However, traditional approaches to water resource management are proving inadequate to meet contemporary demands, exacerbated by rapid urbanization, population growth, and climate change. In response, the NQP concept into the water conservancy sector was proposed, emphasizing technological innovation as a driving force, supported by next-generation information technology, aiming to achieve high-technology, high-efficiency, and high-quality water conservancy in alignment with new development philosophies. Subsequently, scholars have conducted in-depth analyses of the connotations, development pathways, and evolutionary processes of new-quality productivity in water conservancy (NQPWC) [17,18,19]. Ref. [20] utilized entropy methods, coupling coordination degree and the Ellison–Glaeser (E–G) index to calculate NQPWC levels across Chinese provinces. Ref. [21] elaborated on the importance of developing NQPWC from various perspectives and proposed a development framework. Liu et al. [22] investigated the dynamic evolutionary process of NQPWC in the Yellow River Basin. These studies provide important support for theoretical research into NQPWC. However, a fundamental issue that needs to be addressed is how to quantitatively evaluate NQPWC and identify the factors hindering its development, which are crucial for the high-quality development of the water conservancy industry. China’s water resources are characterized by a spatial distribution pattern where there is more water in the south than in the north and more in the east than in the west. However, this distribution pattern does not fully align with the economic and social development landscape. By researching the spatiotemporal distribution of new-quality productivity in water conservancy, analyzing the hindering factors, and identifying the key issues that restrict the development of new-quality productivity in water conservancy in different regions, we can clearly understand the development levels and potentials of new-quality productivity in water conservancy in various areas.
Projection Pursuit (PP) [23,24,25,26] is used to handle the analysis of high-dimensional data. When dealing with high-dimensional data, due to the high dimensionality and complex structure of the data, traditional data analysis methods often struggle to effectively extract useful information from the data. The core idea of Projection Pursuit is to project high-dimensional data onto a low-dimensional subspace. By finding a projection direction with certain optimal characteristics, the projected data can maximally reflect the structure and features of the original data, thereby achieving a dimensionality reduction and the analysis of high-dimensional data. Traditional genetic algorithms have problems such as slow convergence speeds and a tendency to get trapped in local optima. The Real-Code Accelerated Genetic Algorithm (RAGA) is an improvement over traditional genetic algorithms [27,28,29]. It uses real-number coding instead of traditional binary coding, avoiding the precision loss and the complexity of the encoding and decoding associated with binary coding. Meanwhile, by introducing acceleration convergence mechanisms, such as the strategy of retaining the optimal individuals, adaptive crossover, and mutation probabilities, the convergence speed and search efficiency of the algorithm are improved. Applying the RAGA to the PP model gives rise to the Real-Code Accelerated Genetic Algorithm Projection Pursuit (RAGA-PP) model [30,31]. This model utilizes the Real-Code Accelerated Genetic Algorithm to optimize the projection direction in Projection Pursuit, overcoming the drawbacks of traditional Projection Pursuit methods, such as large computational requirements and a tendency to get trapped in local optima when searching for the optimal projection direction. As a result, the computational efficiency and accuracy of the model are enhanced.
In light of this, this study attempts to explore the connotation of NQPWC from four dimensions (3H1G)—High-technology, High-efficiency, High-quality, and Green—and construct an NQPWC evaluation indicator system. Then, using the Real-Code Accelerated Genetic Algorithm Projection Pursuit (RAGA-PP) model coupled with the obstacle factor diagnosis model, we analyze the spatiotemporal evolution characteristics of NQPWC in China, identify the main obstacle factors affecting its development, and provide scientific support for the further development of NQPWC.

2. Materials and Methods

2.1. Study Area and Data Sources

The study area comprised 30 provinces (cities) in China (excluding Hong Kong, Macau, Taiwan, and Tibet) (Figure 1). The data utilized in this study were obtained from the “China Science and Technology Statistical Yearbook 2012–2023”, “Water Resources Bulletin of China and Its Provinces 2012–2023”, “China Water Resources Bulletin 2011–2022”, and “China Industrial Enterprises Activity Statistical Yearbook 2012–2023”.

2.2. Methods

The evaluation framework of NQPWC in this study consisted of three steps: (1) establishing an evaluation indicator system based on four dimensions, 3H1G: High-technology, High-efficiency, High-quality, and Green; (2) determining the indicator weights and the development levels of NQPWC in various provinces (cities) using the RAGA-PP model; (3) identifying the obstacle factors affecting the development of NQPWC based on the Obstacle Degree Model.

2.2.1. Evaluation Indicator System for NQPWC

NQPWC refers to the ability to enhance water utilization efficiency, improve water environmental quality, and optimize water resource allocation through multi-dimensional approaches such as technological innovation, management innovation, and institutional innovation [32,33,34]. This integrated approach not only ensures the efficient use of water resources but also strengthens ecological protection, promotes social equity, and bolsters disaster prevention and mitigation capabilities. Together, these outcomes contribute to sustainable economic and social development [35]. Based on relevant research [18,19,21,22,33,35], the evaluation indicator system for NQPWC was constructed from four dimensions (3H1G), as seen in Table 1: High-technology (Ht), High-efficiency (He), High-quality (Hq), and Green (Gr).
The High-technology (Ht) dimension referred to the application of advanced technologies and methods in production processes [18,21,33,35]. The indicators for high-technology development included the financial expenditure of water conservancy research and development institutions, the number of new product development projects, patents held by water conservancy industrial enterprises for the technological transformation of water conservancy technology, and the introduction of foreign water conservancy technology. Financial expenditure reflected the importance degree attached to technological investment. High expenditures typically indicate support for scientific and technological development, which aids in promoting innovation. The number of new product development projects demonstrates the ability of scientific achievements to be transformed into marketable products and the competitiveness of these achievements. Patent applications and grants reflect the strength of technological innovation. The number of patents held by water conservancy industrial enterprises was a key indicator for evaluating technological innovation. Technological acquisition and transformation drive technological progress and industrial upgrading, enhancing the technical level and competitiveness of enterprises. The introduction of foreign water conservancy technology complements domestic technological deficiencies, accelerating technological progress and industrial development. These indicators can provide a comprehensive reflection of the actual situation of a country or region in terms of scientific and technological innovation, technology application, and industrial development.
The High-efficiency (He) dimension referred to exceptional performance in resource utilization, achieving the maximum output with the least amount of resources [18,21,35]. The indicators for assessing the efficiency of water conservancy included water consumption per CNY 104 of GDP, water consumption per CNY 104 of industrial value added, and per capita water consumption. Water consumption per CNY 104 of GDP and water consumption per CNY 104 of industrial value added reflect the amount of water resources consumed relative to economic output or industrial value added. Lower water consumption indicates higher efficiency in water resource utilization during economic growth, suggesting a reduced dependency on water resources. Per capita water consumption reflects the consumption of water resources by the population. Lower per capita water consumption is typically associated with the effective utilization and conservation of water resources, representing an important aspect of high efficiency in water conservancy.
The High-quality (Hq) dimension referred to possessing outstanding value and sustainability. The indicators for assessing the scale and investment level of the water conservancy industry included the number of enterprises and financial expenditure [20,21,35]. A large number of enterprises and substantial financial expenditure generally indicate the development potential and vitality of the water conservancy industry. The quality of personnel in higher education institutions is a key indicator for evaluating high-quality development. A highly qualified talent pool can provide strong intellectual support for enterprise development. The extent of science popularization reflects the public’s understanding of scientific knowledge and attention to technology. Extensive science popularization can enhance the technology and overall literacy of society, creating a cultural and social environment that supports economic development.
The Green (Gr) dimension emphasized achieving environmental protection, resource conservation, and sustainability during production processes to minimize negative impacts on the environment [21,35]. Key indicators for green development include chemical oxygen demand (COD) and ammonia nitrogen emissions, which are used to measure environmental quality and the degree of water pollution; their reduction reflects the effectiveness of environmental protection and water resource management. Additionally, flood control and soil erosion are critical evaluation indicators of natural disaster risk and ecological safety. Effective disaster prevention and soil conservation measures contribute to mitigating disaster losses and maintaining ecological balance. The state of afforestation serves as an important indicator for assessing ecological environment quality and ecosystem service functions. Increasing forested areas can enhance the environment and reduce the risk of natural disasters. The generation of industrial solid waste reflects the efficiency of resource utilization; proper waste management contributes to improving water quality and overall ecological environment quality. Furthermore, industrial wastewater discharge is crucial for the purification and protection of water environments, with high-quality wastewater treatment systems effectively improving water quality and environmental standards. In summary, these indicators collectively reflected the actual level of a region or country in terms of environmental protection, green ecological construction, and natural resource management.

2.2.2. Real-Coded Accelerated Genetic Algorithm for Projection Pursuit (RAGA-PP)

The RAGA-PP model is an optimization algorithm commonly used for solving continuous parameter optimization, such as hyperparameter tuning in machine learning and parameter adjustment in engineering optimization [30,36,37]. It performs parameter searches in high-dimensional spaces and is capable of identifying optimal solutions within complex spaces. Due to the characteristics of the RAGA, the PP model is also applicable to nonlinear optimization problems, including complex non-convex optimization issues. It is based on the principles of genetic algorithms, augmented by acceleration mechanisms and projection operations, which enhance its efficiency, stability and adaptability compared to traditional models. By seeking the optimal projection directions to determine the weights of indicators, it addresses the “curse of dimensionality” problem in high-dimensional data and mitigates the influence of subjective factors.
The projection values obtained from the RAGA-PP can reflect the characteristics of composite indicators. By using the constructed eigenvalues and the projection indicator function of the dependent variable, optimal projection values can be derived. A higher projection value indicated a higher level of NQPWC. Based on these values, the spatial ranking of the development level of NQPWC could be determined.
The specific process proceeded as follows:
(1) Standardize the evaluation indicator data. Let { x i j | i = 1 , 2 ,   , m ; j = 1 , 2 ,   , n } denote the value of the indicator j for the sample i, where m represents the total number of samples and n represents the number of indicators. To eliminate the effects of variability in the range of indicators and the influence of different units of measurement, the sample values of each indicator are standardized using Equations (1) and (2):
For positive indicators,
x i j = x i j x min , j x max , j x min , j
For negative indicators,
x i j = x max , j x i j x max , j x min , j
where x max , j represents the maximum value of the indicator j, x min , j represents the minimum value of the indicator j, and x i j is the standardized value of the x i j .
(2) Construct the projection indicator function Q ( a ) . The RAGA-PP model consolidates n -dimensional indicators into a single-dimensional projection value as follows:
z i = j = 1 n a j x i j
where a j denotes the weight of each indicator, representing the projection direction vector. Therefore, the projection function is expressed as follows:
Q ( a ) = S z ( a ) D z ( a )
S z = i n [ z i E ( z ) ] 2 n 1
D z = i = 1 n j = 1 n ( R r i j ) μ ( R r i j )
E = 1 n i = 1 m j = 1 n a j x i j
r i j = | z i z j | = | k = 1 n a k ( x i k x j k ) |
where SZ represents the standard deviation of the comprehensive projection value of z i ; DZ denotes the local density of the projection values; E is the mean of the projection values; r i j is the distance between the projection value z i and z j ; and R is the window radius for local density, which can be determined through experimentation. This value should be chosen such that the average number of projection points within the window is not too small, in order to reduce the sliding average bias, while ensuring that R does not increase excessively with n . μ ( t ) is a unit step function, satisfying μ ( t ) = 1 when t 0 and μ ( t ) = 0 when t < 0 .
(3) Optimize the projection index function. Given the data of indicator values in a sample set, the projection index function Q ( a ) varies with changes in the projection direction a . Different projection directions reflect distinct data structural characteristics, and the optimal projection direction is the one that most effectively reveals certain feature structures of the high-dimensional data. Therefore, the optimal projection direction can be estimated by solving the problem of maximizing the projection index function, specifically, as in the following equations:
Objective function:
max Q z ( a ) = S z ( a ) D z ( a )
Constraint:
j = 1 n a j 2 = 1
(4) Solve for the indicator weights and the level of development of new-quality productivity in water conservancy. By substituting the optimal projection direction a * (indicator weights) obtained in step (3) into Equation (3), the projection values (representing the level of new-quality-oriented water productivity development) of each sample can be obtained.

2.2.3. Obstacle Degree Model (ODM)

To investigate the factors affecting the development of NQPWC, the ODM was utilized for analysis. The formula for ODM is given by
Z j = a j ( 1 x i j ) j = 1 n a j ( 1 x i j )
where Z j represents the obstacle degree of indicator j , a j denotes the optimal projection direction for indicator j , and x i j is the standardized sample value of the j indicator in province (city) i .

3. Results and Discussion

3.1. Indicator Projection Directions for NQPWC

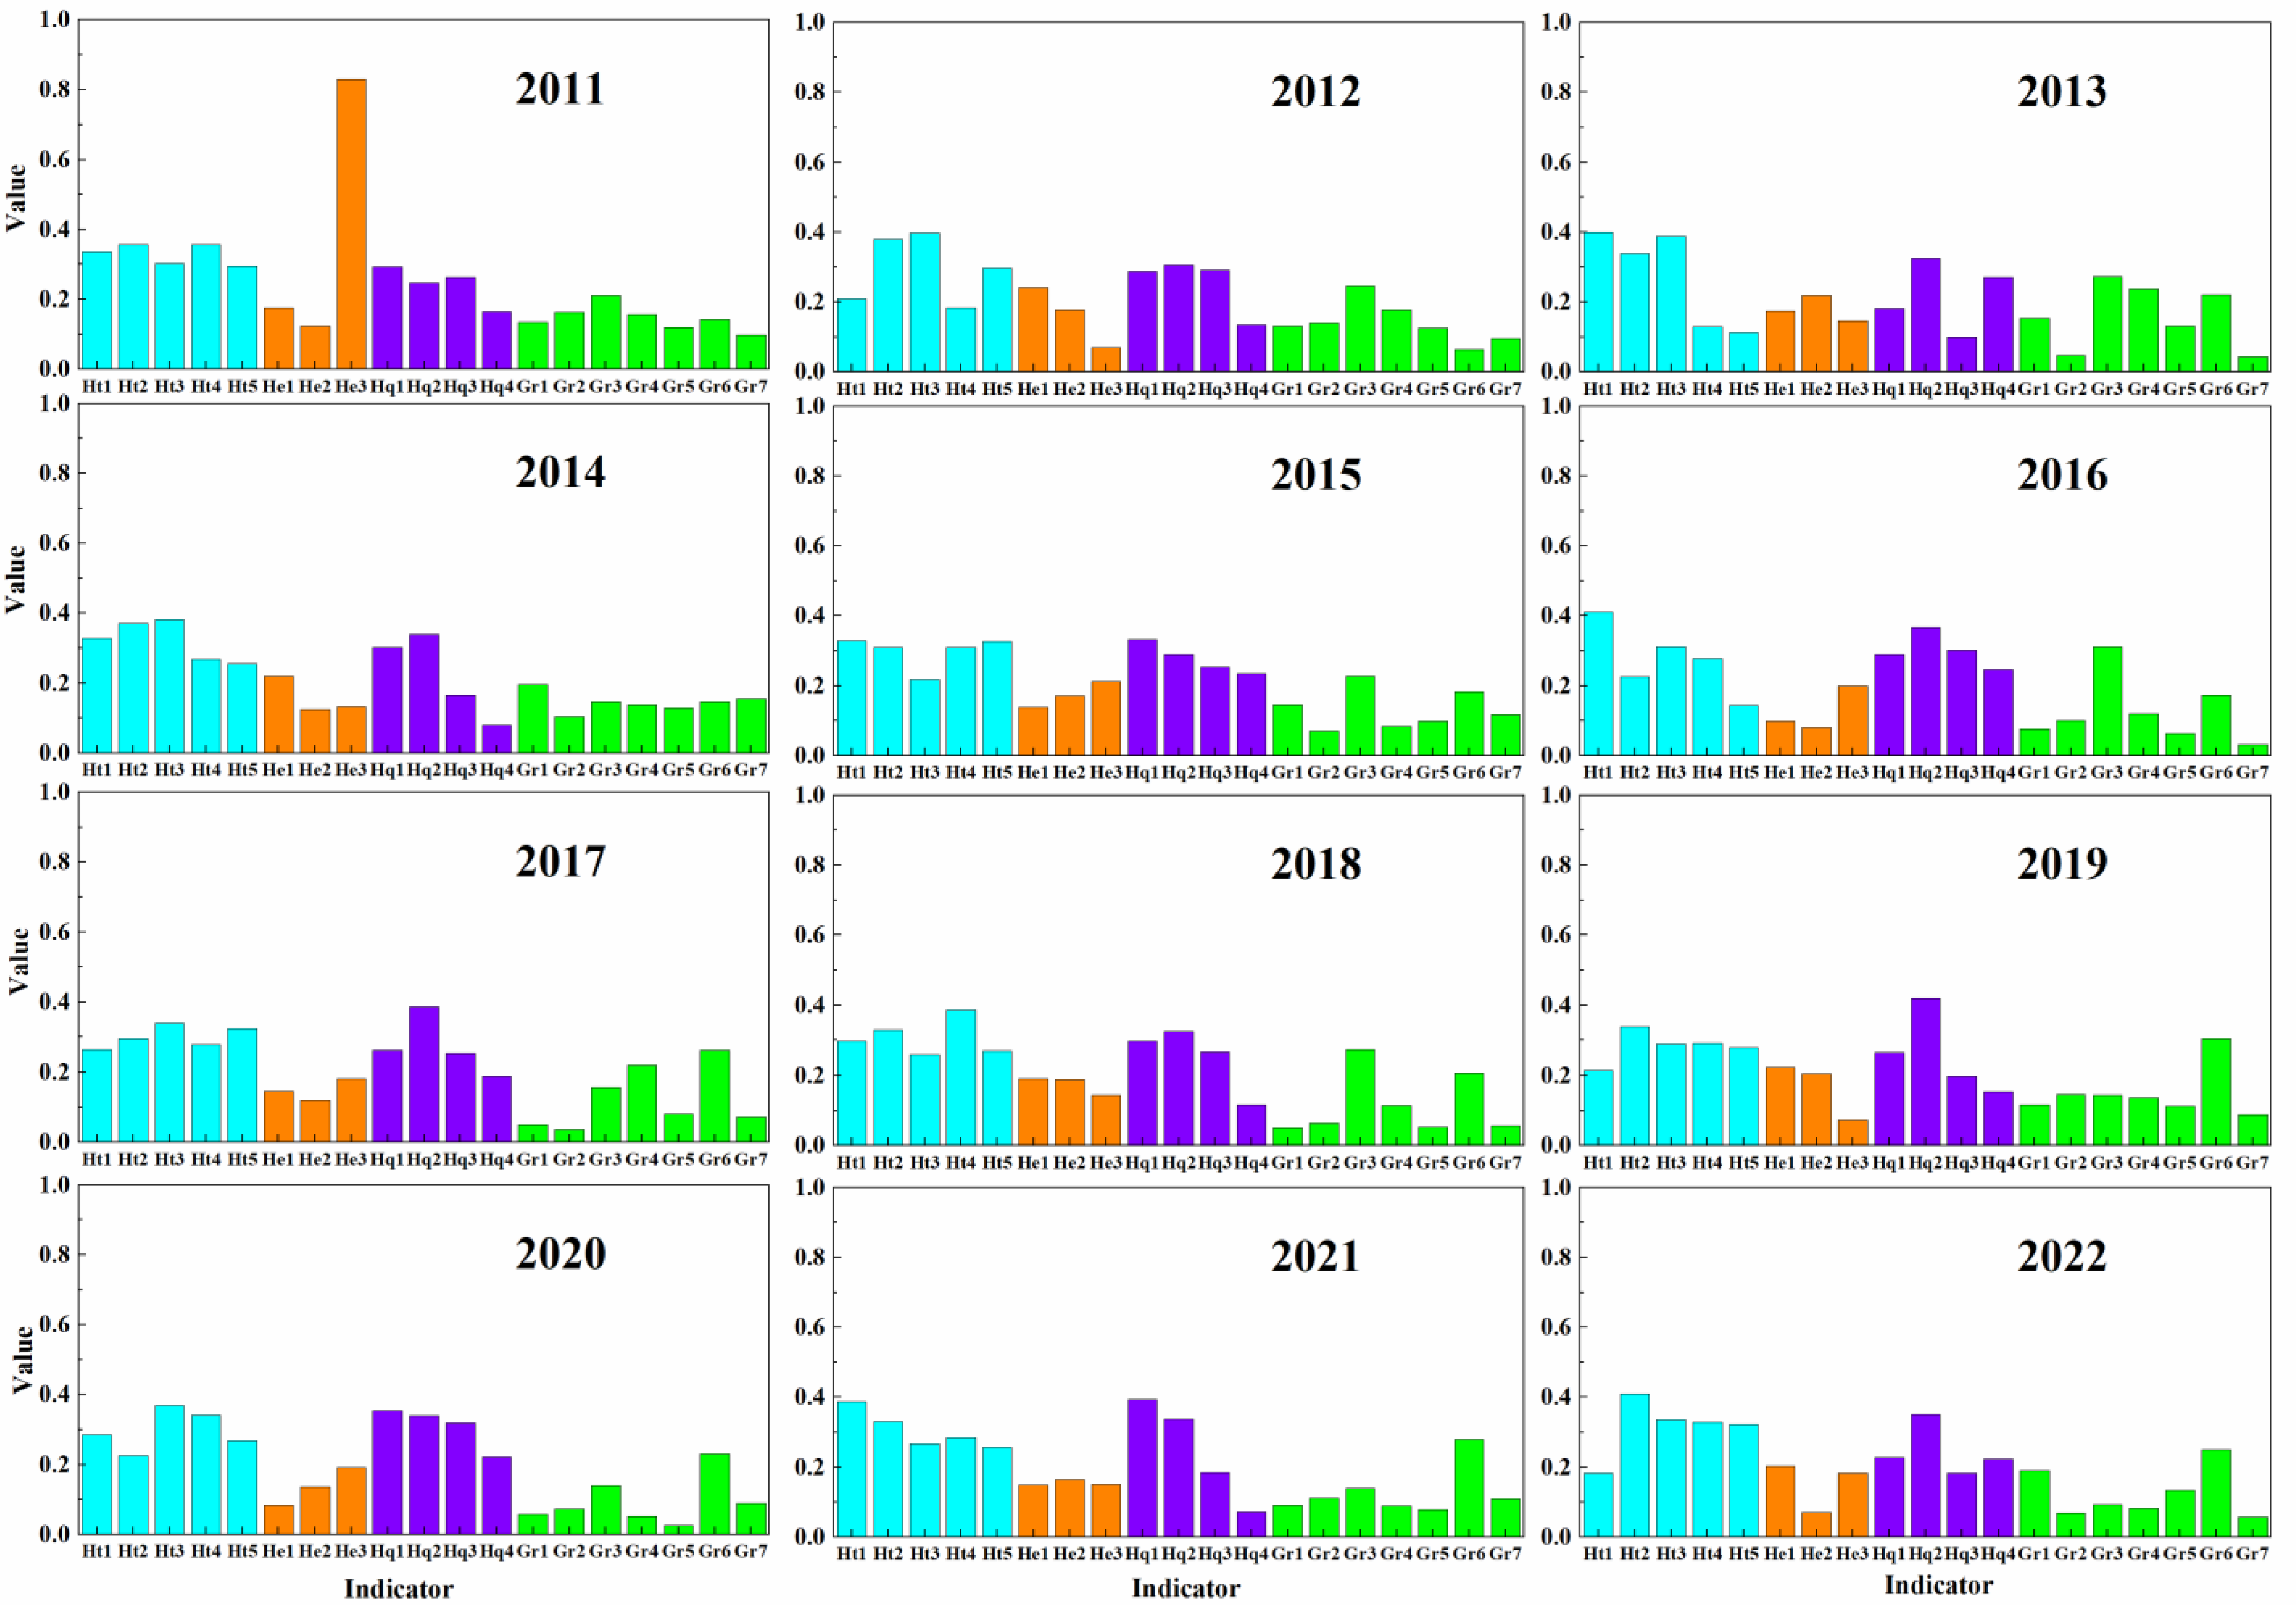
The selection of the projection direction is the key to Projection Pursuit. Its objective is to find an optimal projection direction so that the projected data can maximally reflect the characteristics of the original data. RAGA is used to search for the optimal projection direction, which can search for the optimal projection direction more efficiently. During the iteration process, the values of the projection direction are continuously adjusted to increase the projection index until the convergence condition is met. Based on the evaluation system of new-quality productivity in water conservancy constructed in Table 1, this study calculated the optimal projection directions for each indicator from 2011 to 2022 according to the RAGA-PP method described in Section 2.2.2. The results are shown in Figure 2.
As shown in Figure 1, the five indicators under the High-technology dimension rank among the top 10 indicators for the development of new-quality productivity in water conservancy (NQPWC), underscoring the pivotal role that technological innovation plays in enhancing NQPWC. In contrast, indicators with lower contribution rates are predominantly found within the “Green” criteria. However, this should not imply that technological development alone is sufficient, nor that the ecological aspects of green development can be neglected. Overlooking green sustainability could undermine the long-term prospects of NQPWC, posing risks to both ecological balance and human survival. Therefore, while technological advancements must drive NQPWC, green development is essential to safeguard the sustainability of water conservancy systems and support balanced economic and social progress. Therefore, these dual forces ensure a harmonious pathway toward high-quality and sustainable development. Failure to do so may pose a threat to the sustainable development of NQPWC and jeopardize the balance of the ecosystem and human survival. Therefore, the development of NQPWC must be driven by high-technology productivity, with green productivity serving as a safeguard to achieve sustainable economic and social development.
Using Equation (3), the comprehensive projection values of NQPWC for each province in China from 2011 to 2022 were obtained, as shown in Figure 3.
According to Figure 3, it can be observed that two-thirds of the provinces (cities) in China show a curvilinear upward trend in the development of NQPWC, while the upward trends in Zhejiang, Hubei, Hunan, Hainan, Chongqing, Gansu, Qinghai, Ningxia, Anhui, and Fujian are not significant. This result is consistent with those in reference [38], which also indicate that the development level of new-quality productivity in water conservancy in China shows an overall upward trend. The southeastern coastal regions, such as Zhejiang, Jiangsu, and Guangdong, are leading in the development level of NQPWC, whereas provinces like Qinghai, Guizhou, and Xinjiang are, relatively, lagging behind.
Based on the evaluation results of the new-quality productivity in water conservancy across various provinces in China, the overall situation shows a trend of positive development along with an imbalance. There are significant differences among different provinces (cities), and the phenomenon of unbalanced development is quite prominent. At the regional level, southeastern coastal areas such as Zhejiang, Jiangsu, and Guangdong lead in the development level of new-quality productivity in water conservancy. This can be attributed to their developed economies, sufficient capital investment, advanced technologies, and abundant human resources. In contrast, provinces like Qinghai, Guizhou, and Xinjiang lag behind, relatively, possibly due to the constraints of multiple factors such as natural conditions and the level of economic development. The insignificant upward trends of new-quality productivity in water conservancy in provinces like Zhejiang, Hubei, and Hunan imply that these provinces have encountered bottlenecks during the development process, such as insufficient technological innovation, inadequate policy support, and irrational resource allocation. In the follow-up to this investigation, in-depth analysis of the specific reasons is required, and targeted measures should be taken to promote the sustainable development of new-quality productivity in water conservancy.

3.2. Diagnosis of Obstacle Factors in Development of NQPWC

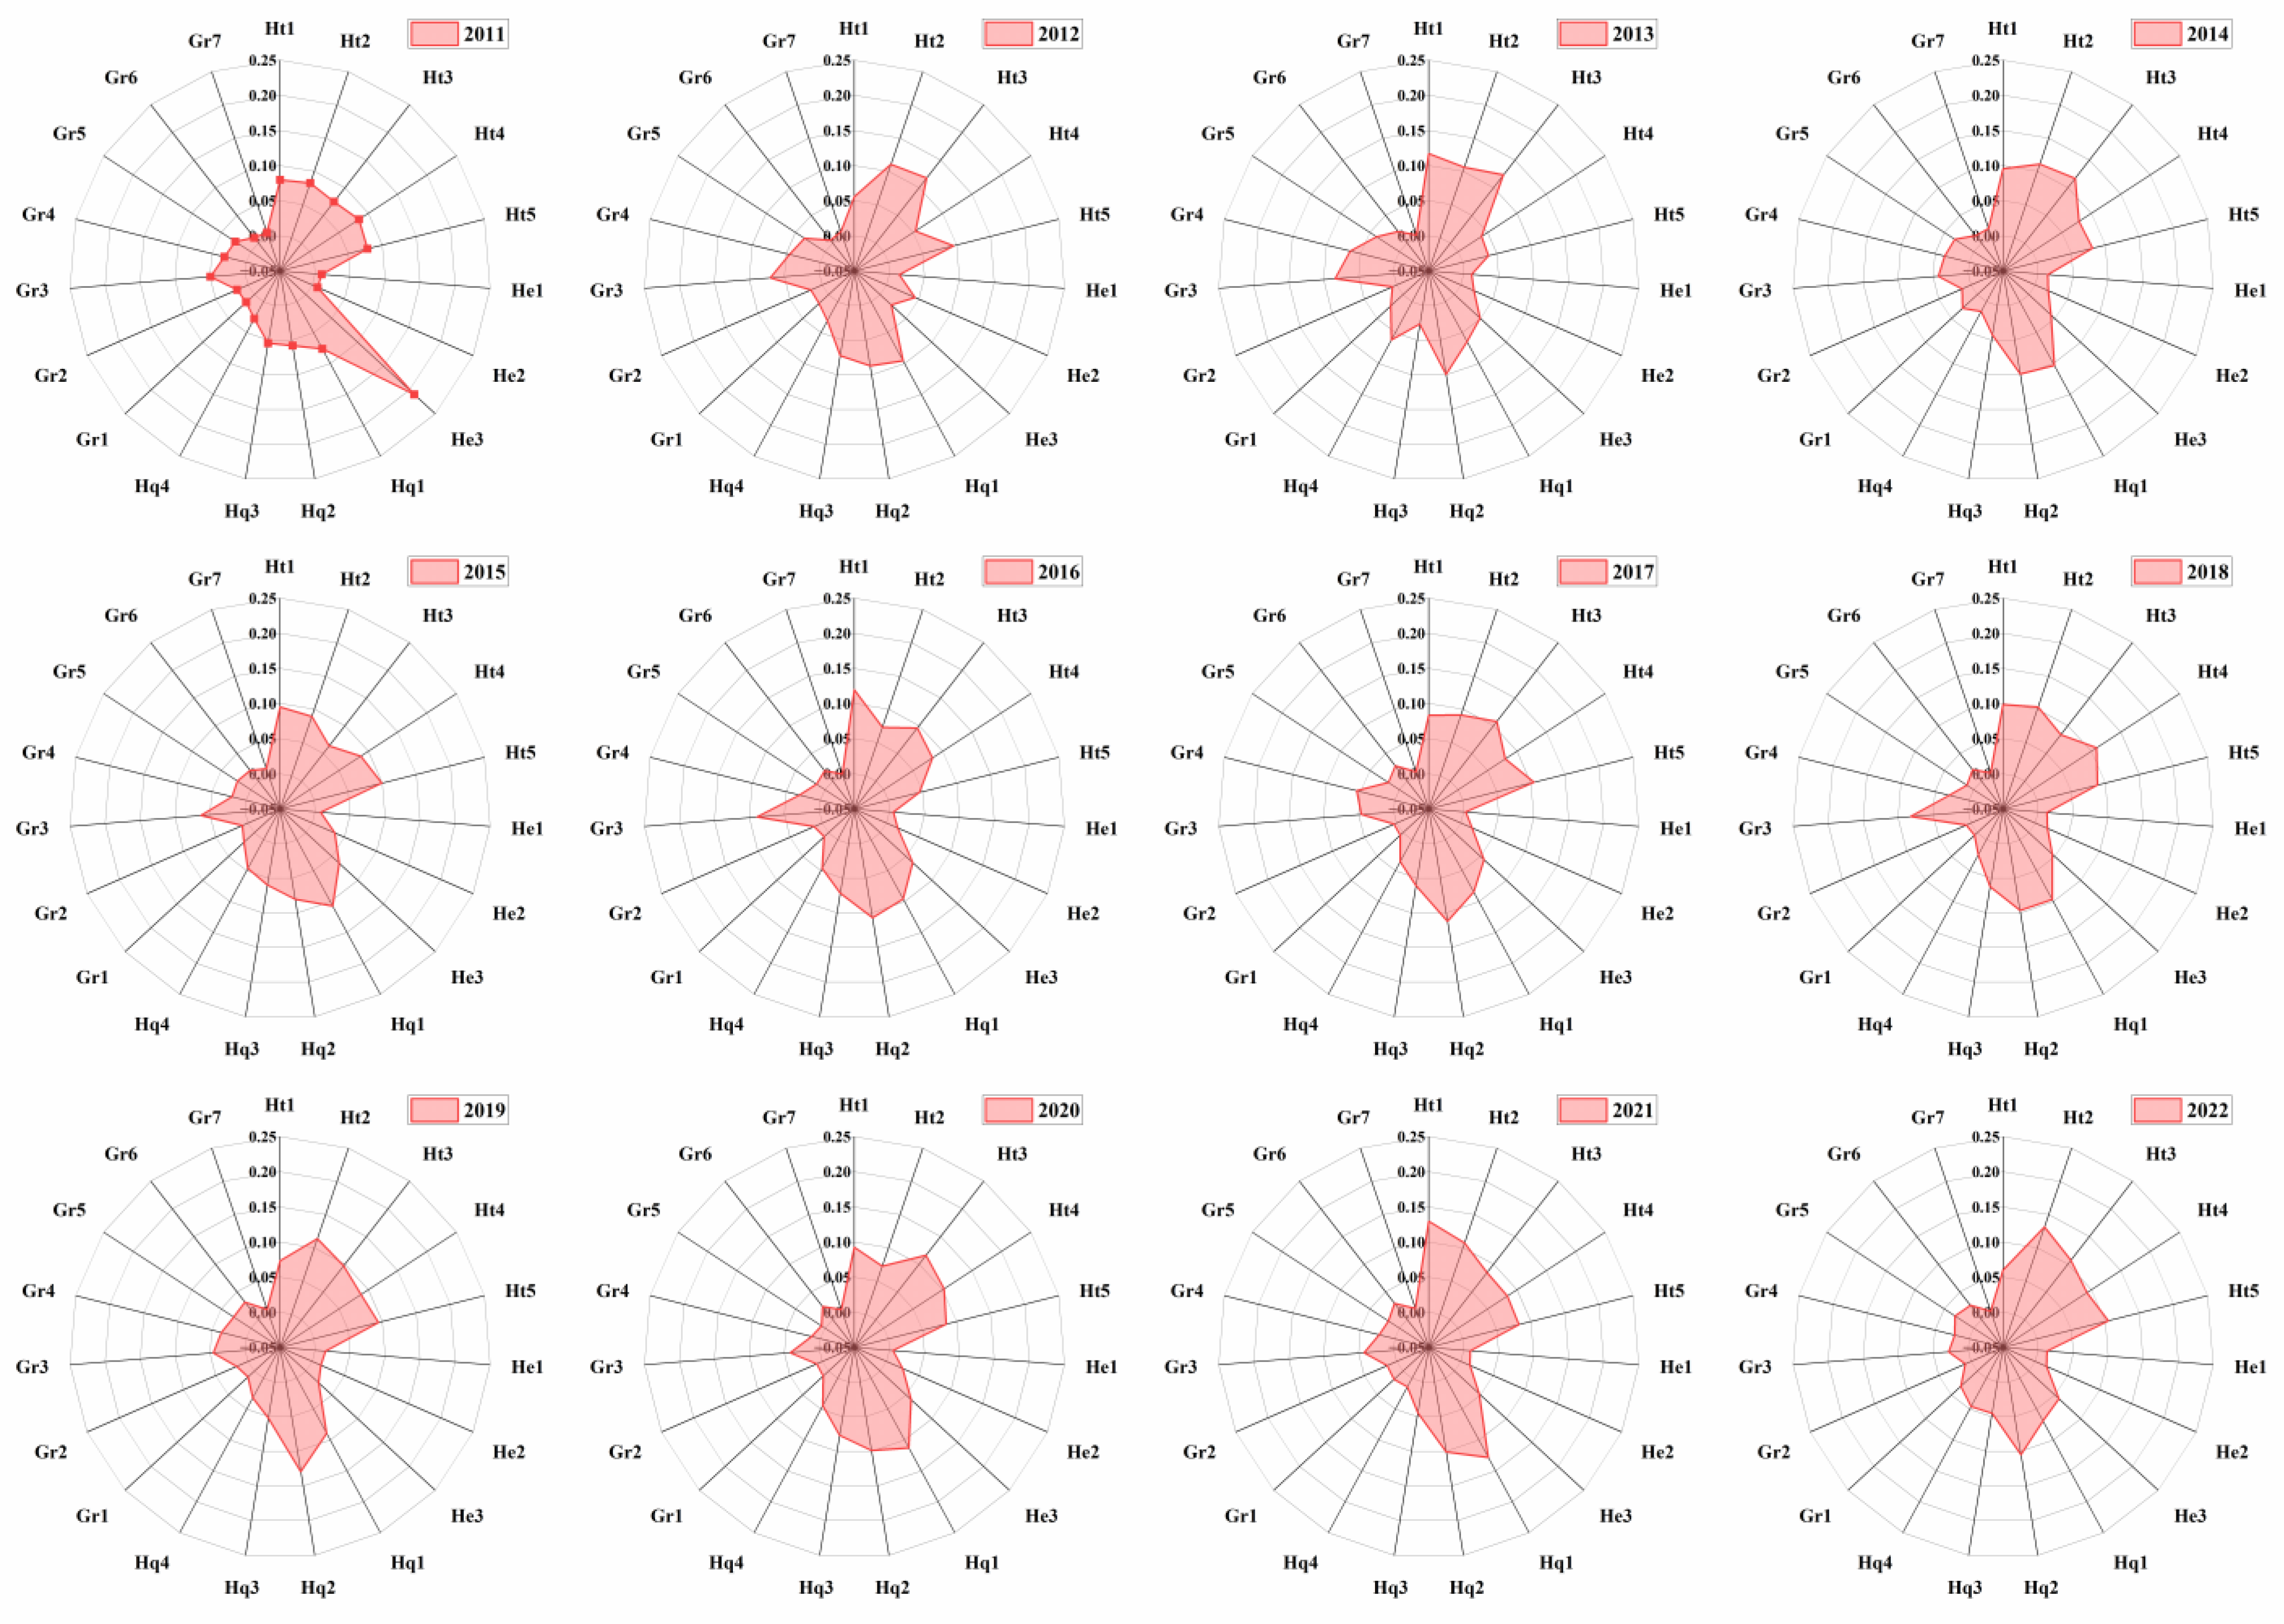
The obstacle degree of indicator layers in China (excluding Hong Kong, Macau, Taiwan, and Tibet) over the years is shown in Figure 4.
Figure 4 shows that, except for in 2013 and 2016, the five indicators in the High-technology criterion are among the top nine indicators in terms of obstacle degree, which indicates that all these indicators require significant attention and that improving the NQPWC must prioritize enhancing the technological development level in the water conservancy sector [39]. Additionally, the indicators primarily affecting NQPWC development are Hq1 (number of enterprises), Hq2 (enterprise expenditure), and Hq3 (personnel in higher education institutions). The obstacle degree of the indicators in the High-efficiency and Green criterion layers is relatively low, indicating that they pose less resistance to the development of NQPWC. Although the obstacle degrees of the indicators in the High-efficiency and Green criterion layers are relatively low, they play a crucial role in enhancing resource utilization, ensuring project operation, maintaining the ecological balance, and achieving sustainable development. They are indispensable elements for the development of new-quality productivity in water conservancy. While developing high-tech productivity, attaching importance to the coordinated development of High-efficiency and Green aspects is an inevitable requirement for achieving sustainable development and is conducive to the continuous development of new-quality productivity in water conservancy.

3.3. Analysis of Effects of NQPWC

According to Figure 1, the indicators with relatively low contributions to NQPWC are mainly primarily concentrated within the “Green” dimension. Despite their lower contribution rates, the importance of ecological sustainability cannot be overlooked. Neglecting green development poses significant risks to the long-term sustainability of NQPWC, potentially jeopardizing both ecosystems and human survival. Thus, the advancement of NQPWC must prioritize high technological productivity, while ensuring that green development serves as a critical foundation. This integrated approach is essential for achieving sustainable water conservancy and fostering balanced long-term economic and ecological progress.
The development of NQPWC shows an upward trend across most provinces (cities) in China (Figure 3). However, regions such as Qinghai, Guizhou, and Xinjiang exhibit relatively lower levels of NQPWC. But Qinghai and Guizhou also possess abundant water resources, and Guizhou is rich in hydropower potential. These provinces are characterized by underdeveloped economic and social conditions, fewer higher education and research institutions, insufficient research funding, and incomplete innovation and ecological systems, which contribute to their lagging NQPWC development. In contrast, provinces in the southeastern coastal regions, such as Zhejiang, Jiangsu, and Guangdong, exhibit leading development levels in NQPWC. These regions benefit from a high concentration of advanced research institutions and universities, abundant water resources, and extensive experience in water conservancy. Furthermore, rapid economic development and intensive industrial and agricultural activities have heightened the demand for water. Consequently, these regions have a pressing need for advancements in water conservancy technology, which has contributed to their elevated levels of NQPWC.
Based on Figure 5, the development levels of NQPWC in China’s provincial regions display a clear spatial imbalance [40]: the southern coastal areas exhibit relatively higher levels of NQPWC, while the northwest regions show a sluggish performance. The southern coastal areas benefit from their coastal location, which affords them abundant water resources, well-established economic infrastructure, industrial diversity, and a skilled labor force. These factors allow them to continuously attract substantial investment and talent, further accelerating their NQPWC growth. In contrast, the northwest regions face harsh geographical conditions, resource scarcity, and relatively underdeveloped infrastructure and industrial development, all of which constrain productivity improvements in these areas.
The spatial imbalance in productivity development in China is the result of the interaction of multiple complex factors. To address this issue, it is necessary to prioritize improvements in infrastructure, industrial restructuring, and human resource development to foster the growth of NQPWC. Meanwhile, policy frameworks should be designed to incentivize and guide capital inflows into the northwest, facilitating the orderly transfer of productivity from the southeastern regions to the northwest. Such measures aim to bridge the development gap and promote a more balanced regional growth trajectory.

3.4. Analysis of Obstacles in Development of NQPWC

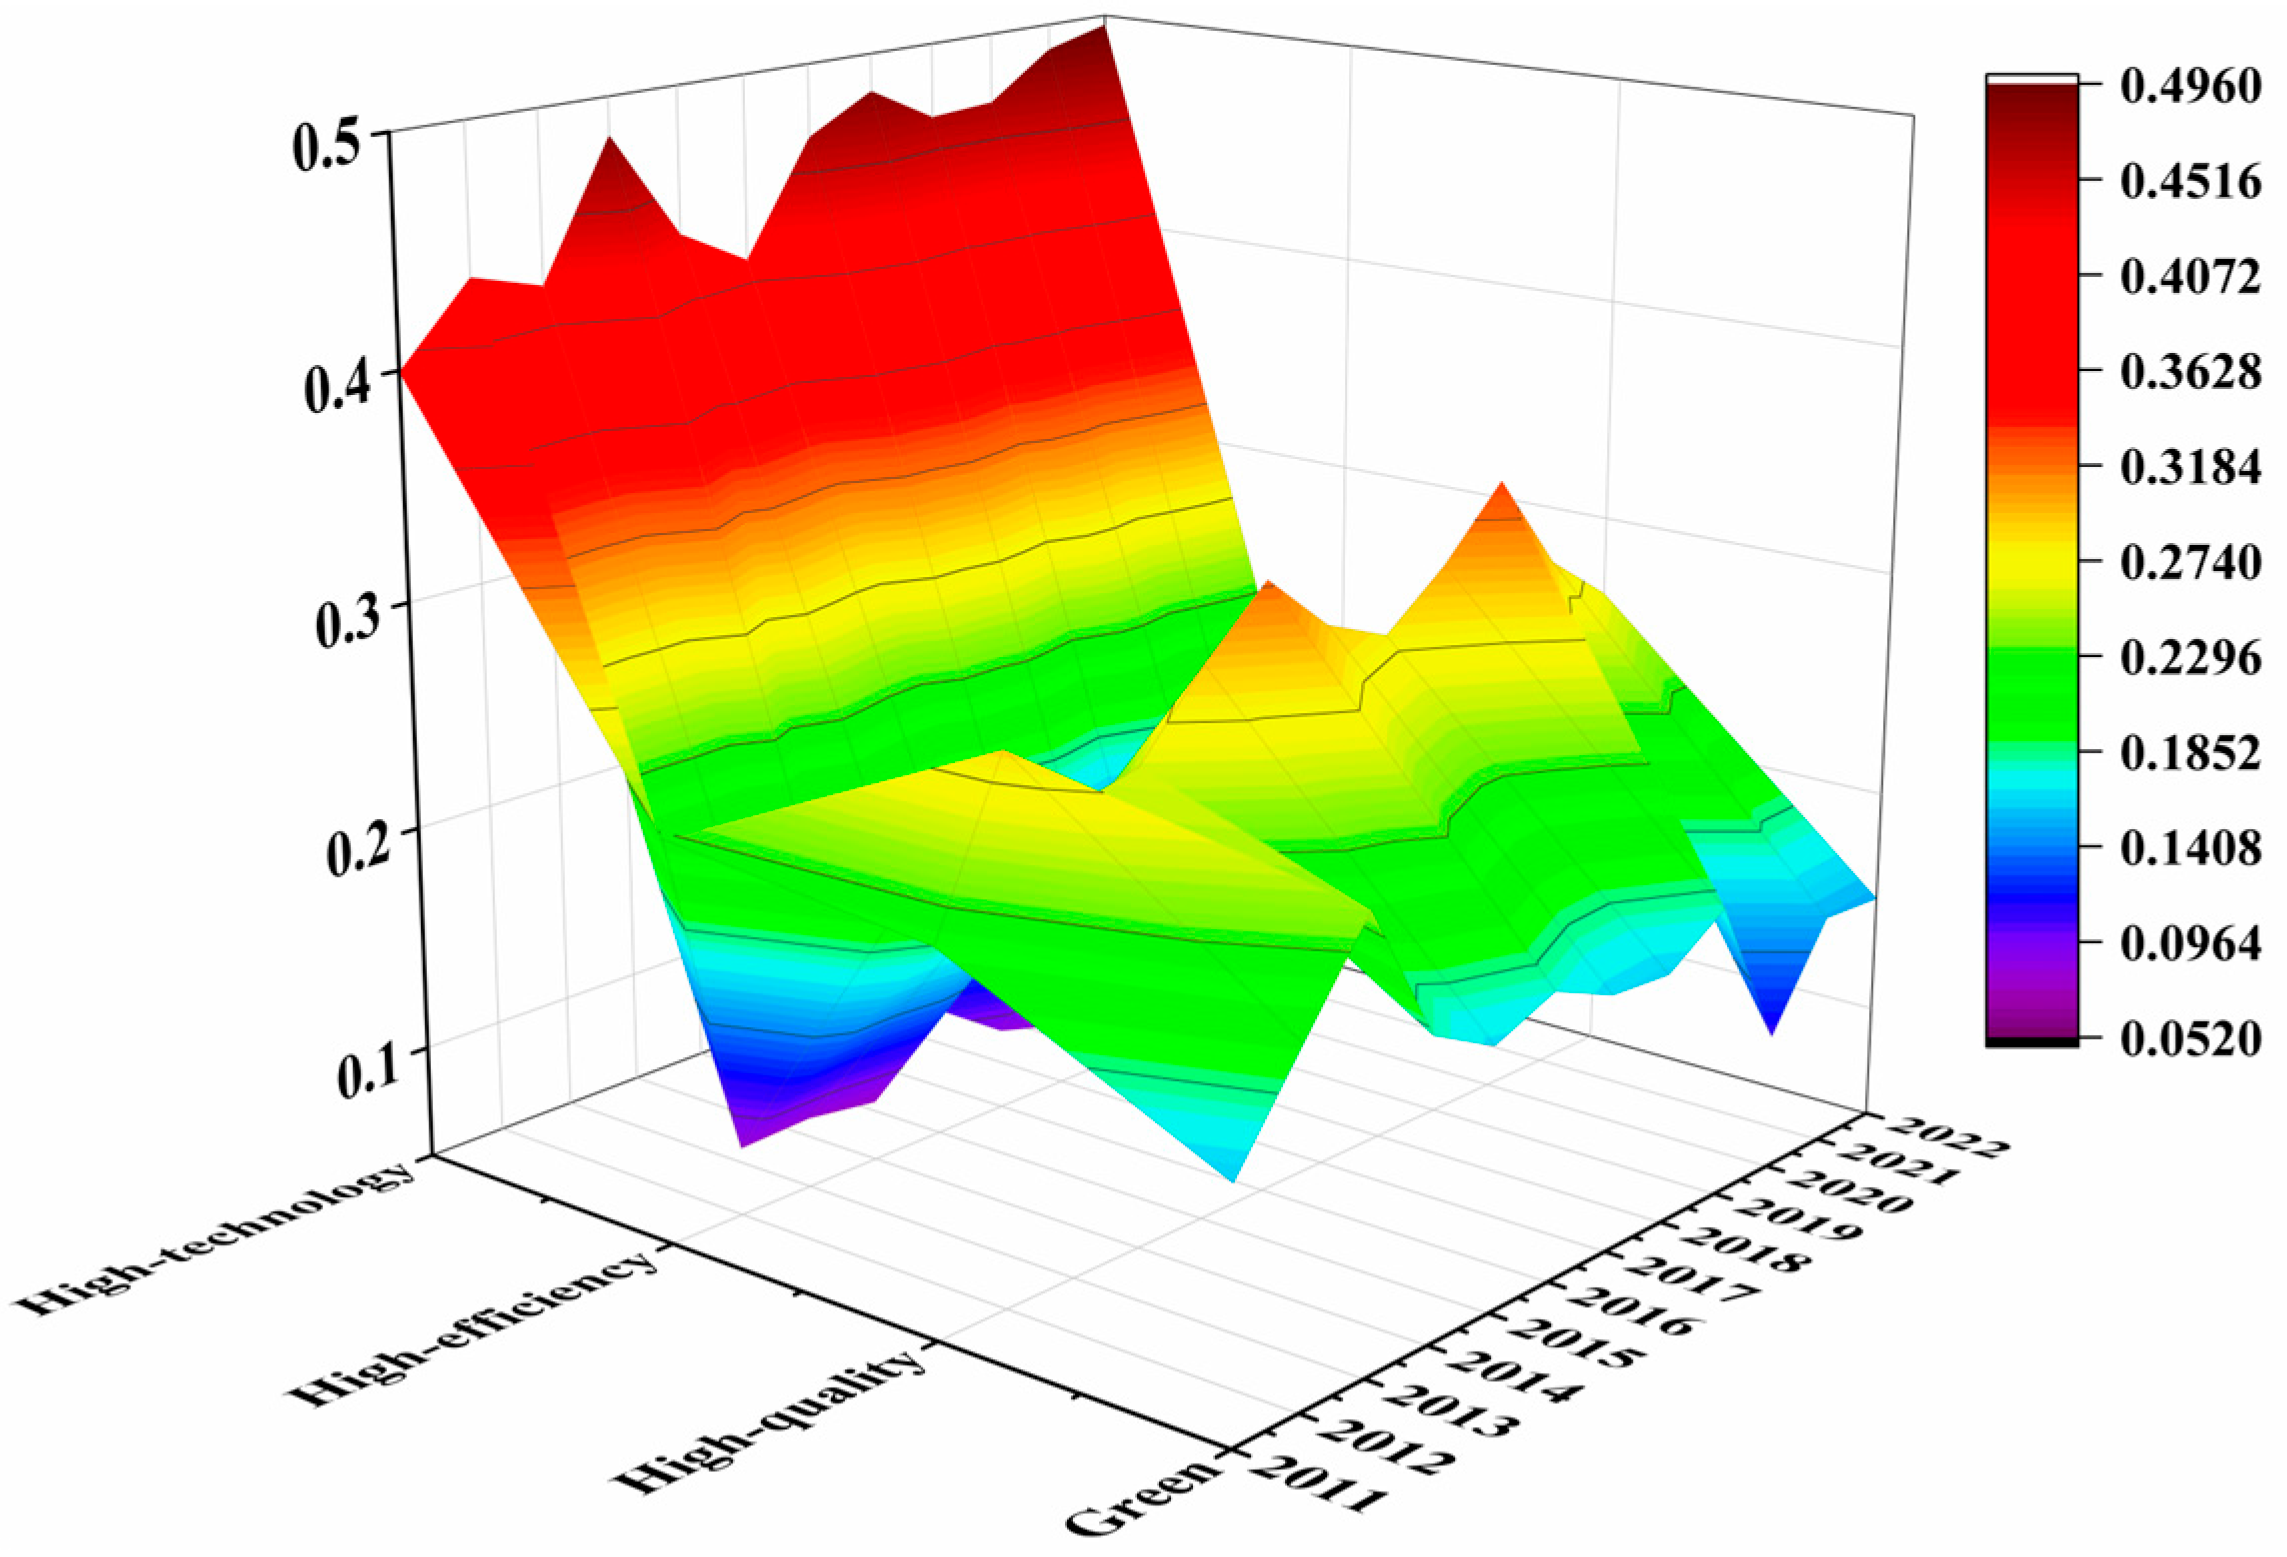
The obstacles at the criterion level were analyzed, as shown in Figure 6.
Figure 6 shows that, in 2011, the ranking of obstacle degrees at the criterion level was High-technology > High-efficiency > High-quality > Green, while in subsequent years it shifted to High-technology > High-quality > Green > High-efficiency. The consistent highest obstacle degree for High-technology indicates that it is the most critical factor restricting the development of NQPWC. Modern water conservancy engineering relies on advanced technological methods for design, construction, and management. For instance, technologies such as sophisticated sensors and remote sensing enable the real-time monitoring and regulation of water resources, improving both operational efficiency and disaster preparedness. Innovations like smart pumps and water quality sensors are pivotal for precise control and environmental monitoring, while cutting-edge water treatment technologies advance water purification and enhance ecological conditions.
The High-technology dimension plays an indispensable role in optimizing water resource management, advancing water productivity, and driving the overall development of NQPWC. To overcome existing limitations, the continued promotion of technological innovation and its integration with the water industry is essential for addressing challenges in water resource governance and ensuring sustainable productivity growth. The obstacle degree of High-quality ranks second to High-technology; thus, efforts should be made to enhance talent cultivation and technology transfer. By investing in the training and education of water-resource professionals, their ability to master and apply advanced water conservancy technologies can be developed. Strengthening international cooperation and resource sharing between relevant enterprises and universities is also crucial. Through international cooperation platforms and resource sharing, global collaboration and exchange in water resource management and high-technology applications can be promoted. This approach not only helps address common challenges related to climate change and water resource management but also accelerates the rapid development of NQPWC worldwide. Traditional approaches to water conservancy often result in waste and inefficiencies, underscoring the necessity of shifting toward more scientific, rational methods of water management to ensure ecosystem stability and support sustainable human development.
Additionally, widespread water pollution continues to threaten aquatic ecosystems and the long-term viability of agriculture and industry. As climate change intensifies the frequency and severity of water-related disasters, water resource management must prioritize stronger protective measures to mitigate such risks. The deterioration of ecosystem services further complicates the sustainable use of water resources, highlighting the need for comprehensive ecosystem restoration and management to ensure long-term productivity growth. Consequently, green ecological development emerges as the third critical factor for improving water productivity. Addressing these challenges will require integrated approaches that combine scientific resource management, environmental protection, and ecological restoration to ensure the sustainable development of NQPWC.

4. Conclusions and Prospects

4.1. Conclusions

This study constructs a measurement indicator system to assess the development level of NQPWC in four dimensions (3H1G): High-technology, High-efficiency, High-quality, and Green. Utilizing data from 30 provinces (cities) in China from 2011 to 2022, and based on the RAGA-PP model and the Obstacle Degree Model (ODM), the study analyzes the level of NQPWC in China. The main conclusions include the following:
(1) The High-technology dimension is the most influential factor in promoting the development of new-quality productivity in water conservancy, while the Green dimension has the least impact. However, green ecological development is crucial for long-term sustainability, and it is necessary to balance technological progress and green productivity.
(2) There is a spatial imbalance in the development of new-quality productivity in water conservancy among 30 provinces (cities) in China (excluding Hong Kong, Macao, Taiwan, and Tibet). The southeastern region has a relatively high development level, while the northwestern region lags behind. This is related to the differences in resource endowments, economic bases, etc., between the two regions.
(3) The High-technology dimension has long been the biggest obstacle to the development of new-quality productivity in water conservancy, indicating insufficient technological innovation and its application and promotion. It is necessary to strengthen the research into and development of new technologies, promote technology transfer and international cooperation, and improve employees’ ability to apply new technologies through education and training.

4.2. Prospects

During the application process of the RAGA-PP model and the Obstacle Degree Model (ODM), there may be situations where the models’ assumptions do not fully align with the actual situation. These models are constructed based on certain theories and assumptions. In reality, the development of new-quality productivity in water conservancy is comprehensively influenced by a variety of complex factors, and the models may not be able to fully and accurately capture these complex relationships. Therefore, in the next step, it is necessary to conduct an in-depth exploration of the influence relationships among factors, so as to provide a more practical and reliable basis for the improvement of new-quality productivity in water conservancy in China and even around the world.

Author Contributions

Conceptualization, W.W. and Y.Y.; methodology, W.W. and Y.L.; software, A.L.; validation, W.W. and Y.L.; formal analysis, X.Z.; writing—original draft preparation, W.W.; writing—review and editing, W.W.; visualization, Y.Y.; supervision, Y.Y.; funding acquisition, Y.Y. All authors have read and agreed to the published version of the manuscript.

Funding

This research was funded by the National Key Research and Development Program of China, grant number: 2023YFC3205600 and the National Natural Science Foundation of China, grant number: 52279005.

Institutional Review Board Statement

Not applicable.

Informed Consent Statement

Not applicable.

Data Availability Statement

Data will be made available upon request to the corresponding author.

Conflicts of Interest

The authors declare no conflicts of interest.

References

  1. Schmitt, T.; Bejarano, R.; Assuad, C. Challenges and opportunities of automated data pipelines for environmental sustainability applications in industrial manufacturing. Procedia CIRP 2024, 122, 623–628. [Google Scholar] [CrossRef]
  2. Rosário, A.T.; Dias, J.C. How has data-driven marketing evolved: Challenges and opportunities with emerging technologies. Int. J. Inf. Manag. Data Insights 2023, 3, 100203. [Google Scholar] [CrossRef]
  3. Hassan, S.T.; Wang, P.; Khan, I.; Zhu, B. The impact of economic complexity, technology advancements, and nuclear energy consumption on the ecological footprint of the USA: Towards circular economy initiatives. Gondwana Res. 2023, 113, 237–246. [Google Scholar] [CrossRef]
  4. Kihombo, S.; Ahmed, Z.; Chen, S.; Adebayo, T.S.; Kirikkaleli, D. Linking financial development, economic growth, and ecological footprint: What is the role of technological innovation? Environ. Sci. Pollut. Res. 2021, 28, 61235–61245. [Google Scholar] [CrossRef] [PubMed]
  5. Ahmad, M.; Jiang, P.; Majeed, A.; Umar, M.; Khan, Z.; Muhammad, S. The dynamic impact of natural resources, technological innovations and economic growth on ecological footprint: An advanced panel data estimation. Resour. Policy 2020, 69, 101817. [Google Scholar] [CrossRef]
  6. Pu, Q.; Huang, Y. Generation logic, theoretical innovation and time value of general secretary Xi Jinping’s important exposition on new quality productivity. J. Southwest Univ. Soc. Sci. Ed. 2023, 49, 1–11. [Google Scholar]
  7. Fagerberg, J. Technological progress, structural change and productivity growth: A comparative study. Innovation, Economic Development and Policy. Struct. Change Econ. Dyn. 2000, 11, 393–411. [Google Scholar] [CrossRef]
  8. Bustos, P.; Bruno, C.; Jacopo, P. Agricultural productivity and structural transformation: Evidence from Brazil. Am. Econ. Rev. 2016, 106, 1320–1365. [Google Scholar] [CrossRef]
  9. Zhu, D.; Ye, L. Agricultural new quality productive force in China: Level measurement and dynamic evolution. Stat. Decis. 2024, 40, 24–30. [Google Scholar]
  10. Song, H.; Zhang, X. Enabling New Quality Productivity Through Digital Transformation: Mechanisms, Challenges and path selection. J. Beijing Inst. Technol. Soc. Sci. Ed. 2024, 26, 41–51. [Google Scholar]
  11. Wu, F.; Song, Y.; Huang, R. Construction of evaluation index system of new quality productive forces of water conservancy under new development concept. Water Resour. Prot. 2025, 41, 85–91. [Google Scholar]
  12. Zuo, Q. National multi-level guarantee system for the water ecological health. J. Water Conserv. Eng. 2021, 52, 1347–1354. [Google Scholar]
  13. Chen, J.; Wang, Y.; Zhang, X. Study on the strategy of water supply security in the Yangtze River Economic Belt. J. Water Conserv. Eng. 2021, 52, 1369–1378. [Google Scholar]
  14. Giannetti, B.; Agostinho, F.; Eras, J.; Yang, Z.; Almeida, C. Cleaner production for achieving the sustainable development goals. J. Clean. Prod. 2020, 271, 122127. [Google Scholar] [CrossRef]
  15. Núñez-López, J.; Rubio-Castro, E.; Ponce-Ortega, J.M. Optimizing resilience at water-energy-food nexus. Comput. Chem. Eng. 2022, 160, 107710. [Google Scholar] [CrossRef]
  16. Wang, H.; Liu, Y.; Zhang, L. Implementation path of green development and high-quality development of watershed eco-cities under carbon peaking and carbon neutrality goals. Water Resour. Prot. 2024, 40, 16–24. [Google Scholar]
  17. Wu, Z. New quality productive forces empower Chinese path to modernization: Theoretical logic, dynamic mechanism and future path. Soc. Sci. Xinjiang 2024, 2, 20–28+148. [Google Scholar]
  18. Tang, H. Logical mechanism and key path of developing new quality productive forces to enhance capability of safeguarding water security. China Water Resour. 2024, 8, 1–5. [Google Scholar]
  19. Peng, J. Developing new quality productive forces by sci-tech innovation of water conservancy. China Water Resour. 2024, 6, 1–5. [Google Scholar]
  20. Liu, Y.; He, Z. Synergistic industrial agglomeration, new quality productive forces and high-quality development of the manufacturing industry. Int. Rev. Econ. Financ. 2024, 94, 10337. [Google Scholar] [CrossRef]
  21. Zuo, Q.; Qin, X.; Ma, J. Understanding of new quality productive forces of water conservancy and thoughts on its development. China Water Resour. 2024, 6, 21–25. [Google Scholar]
  22. Liu, J.; Min, J.; Wang, H. The dynamic evolution of new quality productive forces level and diagnosis of obstacle factors in the Yellow River Basin. Yellow River 2024, 46, 1–7+14. [Google Scholar]
  23. Bickel, P.J.; Kur, G.; Nadler, B. Projection pursuit in high dimensions. Proc. Natl. Acad. Sci. USA 2018, 115, 9151–9156. [Google Scholar] [CrossRef] [PubMed]
  24. Huang, P.; Ding, T.; Luo, Q.; Hou, D.; Yu, J.; Zhang, G. Defect localisation and quantitative identification in multi-layer conductive structures based on projection pursuit algorithm. Nondestruct. Test. Eval. 2019, 34, 70–86. [Google Scholar] [CrossRef]
  25. Ouyang, X.; Wang, J.; Chen, X.; Ye, H.; Watson, A.E.; Wang, S. Applying a projection pursuit model for evaluation of ecological quality in Jiangxi Province, China. Ecol. Indic. 2021, 133, 108414. [Google Scholar] [CrossRef]
  26. Gong, J.; Jiang, C.; Tang, X.; Zheng, Z.; Yang, L. Optimization of mixture proportions in ternary low-heat Portland cement-based cementitious systems with mortar blends based on projection pursuit regression. Constr. Build. Mater. 2020, 238, 117666. [Google Scholar] [CrossRef]
  27. Chen, Q.; Zhong, D.; Zhang, Y.H.; Liu, Z.; Pu, Y.; Zhang, L. Research on artificial intelligence based on projection pursuit and real coded genetic algorithm. In Proceedings of the 2023 4th International Seminar on Artificial Intelligence, Networking and Information Technology (AINIT), Nanjing, China, 21 August 2023; pp. 575–578. [Google Scholar]
  28. Liu, F.; Yang, L.; Xiao, S.; Zhang, D. Application of RAGA based on SA in calculating critical water depth of open channel. In Proceedings of the 2010 Sixth International Conference on Natural Computation, Yantai, China, 23 September 2010; pp. 2296–2300. [Google Scholar]
  29. Wang, L.; Wan, J.; Gao, X. Toward the health measure for open source software ecosystem via projection pursuit and real-coded accelerated genetic. IEEE Access 2019, 7, 87396–87409. [Google Scholar] [CrossRef]
  30. Niu, H.; Liu, Z. Measurement on carbon lock-in of China based on RAGA-PP model. Carbon Manag. 2021, 12, 451–463. [Google Scholar] [CrossRef]
  31. Yu, F.; Pei, L. The application of RAGA-PP model in environmental accounting information disclosure of enterprises in heavy pollution industries. Results Eng. 2024, 21, 101663. [Google Scholar] [CrossRef]
  32. Sigalla, O.Z.; Tumbo, M.; Joseph, J. Multi-stakeholder platform in water resources management: A critical analysis of stakeholders’ participation for sustainable water resources. Sustainability 2021, 13, 9260. [Google Scholar] [CrossRef]
  33. Li, Q.; Shan, W.; Yu, T.; Wang, T. Mathematical Methodology in the Seismic Resilience Evaluation of the Water Supply System. Appl. Math. Nonlinear Sci. 2022, 8, 45–54. [Google Scholar]
  34. Ahmad, I.; Waseem, M.; Lei, H.; Yang, H.; Yang, D. Harmonious level indexing for ascertaining human-water relationships. Environ. Earth Sci. 2018, 77, 1–9. [Google Scholar] [CrossRef]
  35. Zuo, Q.; Qin, X.; Ma, J. New quality productivity of water conservancy: Connotation interpretation, theoretical framework and implementation path. J. North China Univ. Water Resour. Electr. Power Nat. Sci. Ed. 2024, 45, 1–8. [Google Scholar]
  36. Wang, Q.; Zhan, L. Assessing the sustainability of the shale gas industry by combining DPSIRM model and RAGA-PP techniques: An empirical analysis of Sichuan and Chongqing, China. Energy 2019, 176, 353–364. [Google Scholar] [CrossRef]
  37. Yang, J.; Mao, Y.; Ma, Y.Q.; Wu, W.; Bai, Y. Integrated RAGA-PP water demand forecast model (case study: Shaanxi Province, China). Water Supply 2021, 21, 1806–1816. [Google Scholar] [CrossRef]
  38. Shi, Y.; Yang, S.; Chen, W.; Fan, Y.; Lu, L. Evaluation of development level of new quality productivity of water conservancy in China and analysis of its spatial and temporal evolution and driving factors. Water Resour. Prot. 2024, 40, 122–138. [Google Scholar]
  39. Ma, H.; Xiang, H.; Pang, Q. The impact of new quality productivity development on water resource utilization efficiency in China. Resour. Sci. 2025, 47, 485–500. [Google Scholar]
  40. Jing, X.; Tian, G.; Cheng, F. Logical mechanism and collaborative path of patient capital promoting development of new quality productive forces of water conservancy. Water Resour. Prot. 2025, 41, 99–106. [Google Scholar]
Figure 1. Study area.
Sustainability 17 04534 g001
Figure 2. Indicator projection direction.
Sustainability 17 04534 g002
Figure 3. Comprehensive projection value.
Sustainability 17 04534 g003
Figure 4. Obstacle degrees of indicator layers.
Sustainability 17 04534 g004
Figure 5. Temporal and spatial distribution of NQPWC in China.
Sustainability 17 04534 g005aSustainability 17 04534 g005b
Figure 6. Obstacles at the criterion level.
Sustainability 17 04534 g006
Table 1. The 3H1G evaluation indicator system for NQPWC.
Objective LayerCriteria LayerIndicator LayerUnitAttribute
NQPWCHigh-technology(Ht)Situation of Water Conservancy Research and Development Institutions—Expenditure (Ht1)104 CNY+
New Product Development and Sales—Number of Development Projects (Ht2)Item+
Patents of Water Conservancy Industrial Enterprises (Ht3)Project+
Acquisition and Technological Transformation of Water Conservancy Technology (Ht4)104 CNY+
Introduction of Foreign Water Conservancy Technology (Ht5)Item
High-efficiency(He)Water Consumption per CNY 104 of GDP (He1)m3/104 CNY
Water Consumption per CNY 104 of Industrial Value Added (He2)m3/104 CNY
Per Capita Water Consumption (He3)L/d+
High-quality(Hq)Number of Enterprises (Hq1)Piece+
Enterprise Expenditure (Hq2)104 CNY+
Personnel in Higher Education Institutions (Hq3)Person+
State of Science Popularization (Hq4)Person+
Green(Gr)Chemical Oxygen Demand (Gr1)Ton
Ammonia Nitrogen Emissions (Gr2)Ton
Area of Flood Prevention (Gr3)103 ha+
Area of Soil Erosion (Gr4)103 ha+
Afforestation Status (Gr5)103 ha+
Total Generation of General Industrial Solid Waste (Gr6)104 tons
Total Industrial Wastewater Discharge (Gr7)104 tons
Disclaimer/Publisher’s Note: The statements, opinions and data contained in all publications are solely those of the individual author(s) and contributor(s) and not of MDPI and/or the editor(s). MDPI and/or the editor(s) disclaim responsibility for any injury to people or property resulting from any ideas, methods, instructions or products referred to in the content.