Article

Assessing Water Use Efficiency and Stress in Thailand’s River Basins: Trends, Challenges, and Policy Strategies

by
Chaiyapong Thepprasit
1,
Bawornrat Sukrakanchana
2 and
Nitirach Sa-nguanduan
3,*
1
Research Center for Sustainable Development, Department of Irrigation Engineering, Faculty of Engineering at Kamphaeng Saen, Kasetsart University, Kamphaeng Saen Campus, Nakhon Pathom 73140, Thailand
2
Office of the National Water Resources, Bangkok 10210, Thailand
3
Department of Irrigation Engineering, Faculty of Engineering at Kamphaeng Saen, Kasetsart University, Kamphaeng Saen Campus, Nakhon Pathom 73140, Thailand
*
Author to whom correspondence should be addressed.
Sustainability 2025, 17(10), 4477; https://doi.org/10.3390/su17104477
Submission received: 7 April 2025 / Revised: 10 May 2025 / Accepted: 12 May 2025 / Published: 14 May 2025

Abstract

:
Water use efficiency (WUE) and water stress (WS) are keys indicators of water sustainability, particularly in regions with rising demand and limited supply. In Thailand, increasing water use across sectors and climate variability have raised concerns about long-term availability. This study applied Sustainable Development Goal (SDG) indicators 6.4.1 (WUE) and 6.4.2 (WS) at the river basin level, covering 22 basins from 2015 to 2022, to provide a more localized perspective than national assessments. A modified version of the FAO’s monitoring framework was applied, using standardized formulas based on sectoral water withdrawals and economic productivity. Supplementary data were gathered through estimation techniques, field surveys, and stakeholder consultations. The results showed a 21.0% decline in WUE and a rise in WS from 9.68% to 13.8%, indicating increased pressure on water resources. A very strong negative correlation was found between WUE and WS (r = −0.97, p < 0.001), although causation could not be inferred. Regional differences were evident: basins such as Tha Chin and Chao Phraya showed worsening conditions, while the Peninsula–West Coast remained relatively stable. These findings suggest the need for targeted policies to improve water use efficiency, especially in agriculture, and to enhance monitoring systems. Increasing wastewater reuse and implementing efficiency measures could help to reduce stress in vulnerable basins and support Thailand’s progress to achieving SDG 6.4.

1. Introduction

Water is a vital yet limited resource that is essential for economic development and environmental stability. The growing demand for water, driven by population increases, urbanization, and industrial growth, has intensified pressure on water availability, especially in rapidly developing countries such as Thailand [1,2,3,4]. This demand–supply imbalance has led to rising water stress (WS), raising concerns about long-term water security [5,6].
These challenges can be addressed through the key strategies of improving water use efficiency (WUE) and mitigating WS that are widely emphasized in global water management. These two indicators are central to Sustainable Development Goal (SDG) 6.4, which aims for sustainable water use [7]. SDG indicator 6.4.1 measures WUE, reflecting the economic productivity of water use, while SDG indicator 6.4.2 measures WS, assessing the extent of water withdrawals relative to available resources [8,9]. However, applying these indicators remains challenging due to data gaps, inconsistent monitoring methods, and regional hydrological differences [9,10,11]. While the link between WUE and WS is understood, it remains underexplored at the subnational level, where regional variations in water use can be large [12].
River basin-level management has become a recommended approach, given the complexity of water issues. This “Think globally, act locally” strategy promotes adaptive decision-making, ensuring that water allocation reflects local conditions and sectoral needs [13,14].
Thailand is experiencing increasing water availability risks, influenced by climate variability, economic growth, and demographic changes [15,16]. The country has committed to advancing SDG 6 through integrated water resources management (IWRM), encouraging stakeholder participation and decentralized governance at the river basin level. Yet Thailand lacks systematic assessments of WUE and WS at the basin level, which limits targeted interventions. While agriculture consumes the most water, it contributes less to economic output compared to other sectors. Therefore, assessing WUE and WS at a localized scale is crucial for ensuring sustainable resource use.
WUE and WS are fundamental indicators for assessing water sustainability. These two indicators are widely used in global water assessments; however, their implementation varies due to differences in data availability, hydrological conditions, and monitoring frameworks [10,17]. While numerous studies have assessed SDG 6.4 indicators at the national level or across transboundary basins such as the Mekong, there is a notable lack of research applying these indicators at the subnational river basin level within individual developing countries.
Studies have shown that there is a complex relationship between WUE and WS. Improving efficiency, such as in irrigation, can sometimes lead to increased water consumption due to expanded agricultural activity. Conversely, regions with low WUE may not experience high WS if they have abundant water resources or effective management [14]. Despite these complexities, both indicators remain vital for identifying inefficiencies and guiding water allocation policies. They play a critical role in shaping sustainable water management strategies.
This study aims to assess trends in water use efficiency (WUE) and water stress (WS) at the river basin level in Thailand, applying SDG indicators 6.4.1 and 6.4.2 over the period 2015–2022. By disaggregating data at the basin scale, the current study seeks to identify spatial patterns, efficiency gaps, and stress hotspots that are not visible in national-level assessments. The research addresses three main questions: (1) What are the spatial and temporal trends of WUE and WS across Thailand’s 22 river basins? (2) How does sectoral water use influence efficiency and stress outcomes? (3) What targeted policy recommendations can be derived from basin-level analysis to support more sustainable water governance? These findings provide location-specific insights and support more effective policy formulation for enhancing water sustainability under Thailand’s evolving socio-environmental context.

2. Study Area and Methods

2.1. Study Area

Thailand, located in Southeast Asia, shares borders with Lao People’s Democratic Republic, the Kingdom of Cambodia, Malaysia, the Republic of the Union of Myanmar, and the Andaman Sea. The country spans 510,890 km2, and has an average annual rainfall of approximately 1590 mm [18], although rainfall patterns vary substantially across regions and seasons. About 80% of annual precipitation occurs during the wet season from May to October [1].
Thailand faces major challenges regarding water availability, exacerbated by economic growth, climate variability, and shifting land use patterns [15,16]. The country’s renewable water resources are estimated at approximately 250 billion m3 annually [1], but seasonal river flow fluctuations and increasing demand from agriculture, industry, and domestic sectors place stress on these supplies. Agriculture, which accounts for the largest share of water use, contributes little to the country’s economic output compared to the industrial and service sectors, underscoring the need for more efficient irrigation and water management strategies [6]. In particular, provinces dealing with climate change and population growth—such as those in the Tigris River Basin—highlight the importance of improving WUE through better irrigation and municipal management [19].
While Thailand has made progress in implementing IWRM, decentralization of water management remains challenging. Provincial-level administration still retains overall control, which complicates efforts to manage water resources at the basin level. Additionally, issues with fragmented data and inconsistent reporting methods hinder the country’s ability to monitor WUE and WS at more localized levels [9,14]. These data gaps must be addressed to deliver effective improvement in water management policies.
In response to these challenges, the Thai government revised its river basin management framework, consolidating the system from 25 to 22 river basins in 2021 (Figure 1). The Office of the National Water Resources (ONWR) oversees policy formulation and monitoring; however, the assessment of water resources is hindered by outdated and inconsistent data across agencies, particularly regarding small-scale agricultural irrigation [20]. Despite these challenges, the country has committed to sustainable water management practices, actively participating in transboundary water governance, particularly through its role in the Mekong River Commission (MRC) [21].
Efforts to enhance water use efficiency and sustainability are critical as Thailand faces growing economic and environmental pressures. Effective monitoring and improved data collection are essential for informed decision-making to ensure water security and long-term sustainability.

2.2. Research Framework

This study applied a systematic approach to assess WUE and WS at the river basin level in Thailand from 2015 to 2022. The methodology was adapted from the FAO’s monitoring framework for SDG indicators 6.4.1 [22] and 6.4.2 [23], which was originally designed for national-level assessments. To enable river basin-level application, the framework was modified to incorporate regionally disaggregated data on water withdrawals, economic productivity, and sectoral classifications. Basin-specific estimation techniques were also developed to address data gaps and variations in resource availability and use. The adapted framework consisted of four main steps.
(1)
Data Collection
Water resource data were aggregated from official sources, including the Office of the National Water Resources (ONWR), the Royal Irrigation Department (RID), the Department of Local Administration (DLA), the Department of Industrial Works (DIW), the Department of Livestock Development (DLD), the Wastewater Management Authority (WMA), the Department of Groundwater Resources (DGR), and the Department of Water Resources (DWR). Missing or inconsistent data were identified, and technical meetings with relevant agencies were conducted to validate the compiled datasets and ensure consistency across sources.
(2)
Supplementary Data Acquisition
Estimation techniques were employed to address missing or incomplete data. Area-weighted adjustments were applied to disaggregate annual governmental data, such as value-added figures, from the provincial to basin levels based on the proportion of each province’s area located within each river basin.
Field surveys, in-depth interviews, and questionnaire-based assessments were conducted to supplement and validate water use information, especially for small-scale and decentralized supply systems where formal records were limited or unavailable. For village waterworks—the primary water source in rural communities—data were collected from 143 local administrative organizations and 773 village systems across 17 provinces, selected to ensure wide geographic coverage nationwide. For each system, information such as water sources (surface or groundwater), production volume, service area, and household coverage was gathered to estimate national-scale village water use and support service-sector disaggregation.
In addition, for large municipal waterworks independently operated by local governments, official requests were sent to 29 municipalities identified as major providers. Responses were received from 27 (93.1%), including data on water production, water sold, household connections, and served populations.
Sampling was purposively designed based on data gaps and the relevance of stakeholders to the study focus. Sample sizes were intended to be statistically appropriate for validation. Interview content was tailored by sector—for example, focusing on irrigation practices, industrial withdrawals, or household-level water provision. Indirect estimation methods were also applied, including deriving irrigation water use from electricity subsidies allocated to local administrative organizations. These estimates were calculated using budget records, adjusted where necessary based on provincial comparisons and field interviews, and cross-checked with irrigated areas to approximate water volumes. Industrial water use outside designated zones was estimated using machinery horsepower data.
(3)
Indicator Computation
WUE and WS were calculated using standardized formulas, with adjustments based on local sectoral water use data. The results were verified and refined to reflect basin-specific water use patterns, accounting for seasonal and sectoral variations.
(4)
Evaluation and Interpretation
The results were cross-compared between national and river basin levels to identify key trends. Particular focus was placed on variations in WUE across economic sectors and their implications for WS.
Water use was categorized into three primary economic sectors following the International Standard Industrial Classification (ISIC) Rev. 4 [24], as detailed in Table 1. The agriculture sector included agriculture, forestry, and fishing (ISIC A). The industry sector comprised mining and quarrying (ISIC B); manufacturing (ISIC C); electricity, gas, steam, and air conditioning (ISIC D); and construction (ISIC F). The services sector encompassed all service sectors (ISIC E and ISIC G–T). This classification allowed for sector-specific insights into water use efficiency and stress levels, supporting the development of targeted policy recommendations.

2.3. Calculation of Indicators

WUE and WS were calculated based on formulas set out by the SDG indicators 6.4.1 [22] and 6.4.2 [23], respectively, for the analysis period 2015–2022 at both the national and river basin levels.

2.3.1. Calculation of Water Use Efficiency

WUE was calculated using Equation (1):
W U E   ( U S D / m 3 ) = A w e × P a + M w e × P m + S w e × P s
where
Awe = water use efficiency in the agricultural sector (USD/m3);
Mwe = water use efficiency in the industrial sector, also referred to as MIMEC (USD/m3);
Swe = water use efficiency in the services sector (USD/m3);
Pa, Pm, and Ps = the proportion of water used by agriculture, industry, and services, respectively.
This equation reflects the weighted average of sectoral water use efficiencies based on their respective water use shares in each basin.
The largest variations in Awe (agricultural water efficiency) were observed in the early years of the study period. These fluctuations reflect shifts in water-intensive agricultural practices, climatic variability, and irrigation efficiency improvements over time.
Similarly, WUE in the industrial sector declined steadily, reflecting inefficiencies in water-intensive production processes, increased water withdrawals, and slower-than-expected improvements in industrial water recycling technologies. This trend had a major influence on the overall decline in national WUE during the study period.

2.3.2. Calculation of Water Stress

WS was calculated using Equation (2):
W S   ( % ) = T F W W ( T R W R E F R ) × 100
where
TFWW = total freshwater withdrawal (m3/year) − the sum of annual water extraction for agriculture, industry, and services.
TRWR = total renewable freshwater resources (m3/year) − the annual volume of naturally replenished surface and groundwater resources.
EFR = environmental flow requirements (m3/year) − the volume of water that must remain in rivers and aquifers to sustain ecosystems.
TFWW accounts for all water extracted for agriculture, industry, and services, excluding withdrawals from non-conventional sources such as wastewater treatment and desalination. Official records of non-conventional water use remain limited in Thailand, necessitating adjustments to the TFWW estimates.
TRWR includes both internal renewable water resources (IRWRs) and external renewable water resources (ERWRs), with the Mekong River contributing to ERWRs in some basins. Given Thailand’s reliance on transboundary water flows, any upstream alterations in the Mekong River system could have serious impacts on water availability in the affected basins [23].
The EFR values were determined using a Flow Duration Curve (FDC) approach, ensuring a minimum flow rate was maintained for 90% of the analysis period. This method corresponds to Q90—a commonly used ecological benchmark—which represents the flow exceeded 90% of the time. The selection of this method was based on its applicability under conditions of limited long-term hydrological data and its alignment with the national water resource database developed by ONWR in 2020 under the 22-basin framework. The resulting dry-season EFRs for each basin were derived from daily river discharge data and are consistent with the national baseline reported in the ONWR dataset.
The FDC-based EFR estimates ranged from 0.00 to 1642 million m3 per year across the 22 river basins. These values correspond well with ecological management classifications (EMC) reported in national assessments—for example, the Chao Phraya River being categorized as Class C (moderately modified), while the Tha Chin basin includes Class D segments. Although the FDC method assumes constant minimum flow, it offers practicality for comparative assessments at the basin scale, especially in data-scarce contexts.
We acknowledge that seasonal variation, specific downstream water needs (e.g., salinity control, navigation), and ecological thresholds may require dynamic EFR estimates. These issues are flagged for future research that could incorporate hydrological-ecological modeling or scenario-based EMC integration for site-specific precision.

2.4. Data Limitations and Uncertainty Considerations

While this study relied on official governmental reports, several data limitations affected the robustness of findings:

2.4.1. Gaps in Historical Data

Some records, particularly for agricultural water use and small-scale withdrawals, were incomplete or inconsistent across agencies. To address this, missing data were estimated using area-weighted adjustments and cross-validated with stakeholder interviews.

2.4.2. Sectoral Water Use Reporting Issues

Industrial and service sector water use is often aggregated, making it difficult to distinguish between municipal, commercial, and industrial withdrawals. Disaggregated estimations were used where possible.

2.4.3. Transboundary Water Availability Uncertainty

There is uncertainty associated with basins where water supply relies on external sources (such as the Mekong River) due to upstream water management decisions. This study assumed constant external renewable water resources (ERWRs); however, future studies should explore dynamic variability scenarios.
Given the susceptibility of the North Khong and Northeast Khong Basins to changes in Mekong River flows, enhanced collaboration with the Mekong River Commission (MRC) is recommended to improve data sharing, joint planning, and transboundary risk mitigation.

2.4.4. Environmental Flow Requirement (EFR) Approximation

The EFR estimates were based on long-term flow data rather than real-time ecological assessments. While this approach aligned with national guidelines, further refinement is needed to capture seasonal variations. Future studies are recommended to adopt more ecologically detailed methods, such as the Variable Monthly Flow (VMF) method or the Building Block Methodology (BBM), to enhance the precision of EFR estimation and better reflect seasonal ecological needs.
Although estimation techniques and validation efforts were applied, uncertainties in some datasets may influence the precision of WUE and WS calculations. Future research should conduct sensitivity analyses to systematically evaluate the robustness of the findings. Additionally, while rainfall anomalies such as those in 2016–2017 were noted, interannual climate variability was not fully controlled in this study; standardized climate indices, such as the Standardized Precipitation Index (SPI), should be incorporated in future analyses. To further improve data reliability, advanced estimation methods such as multiple imputation and remote sensing validation are also recommended.

3. Results and Discussion

3.1. Water Use Efficiency

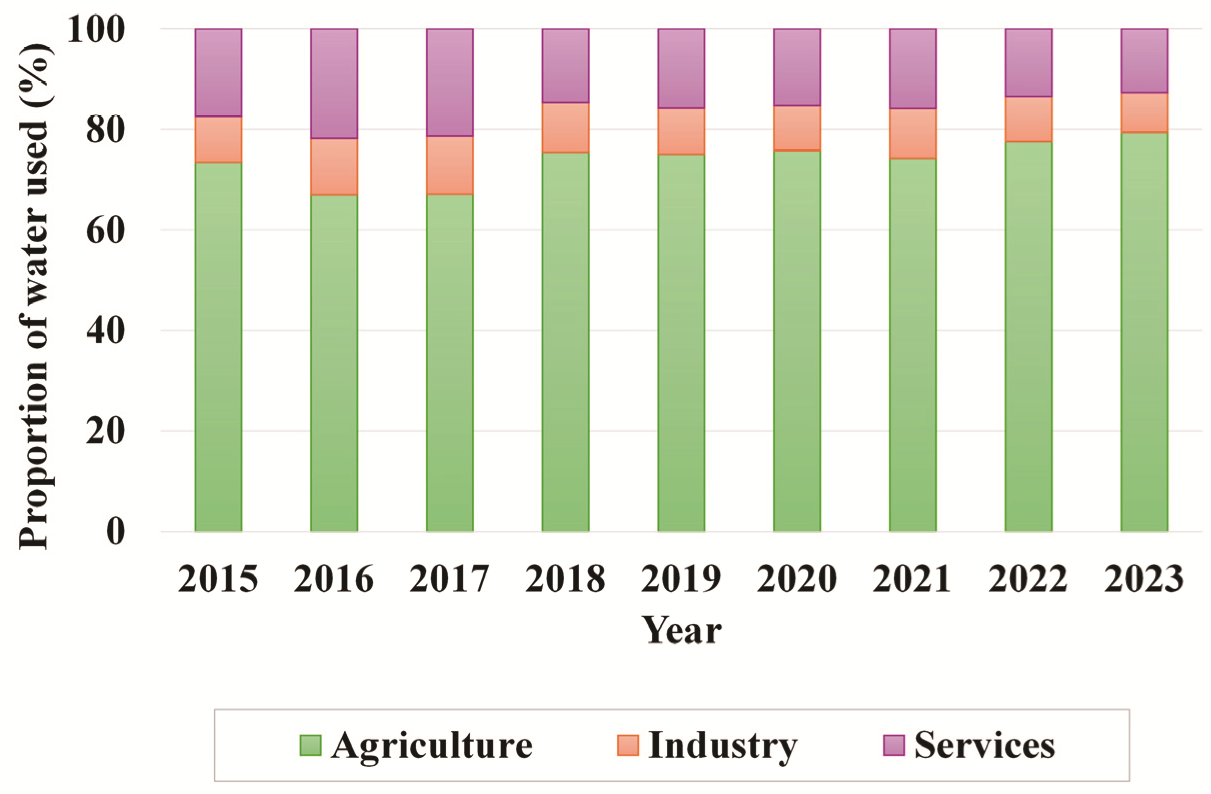
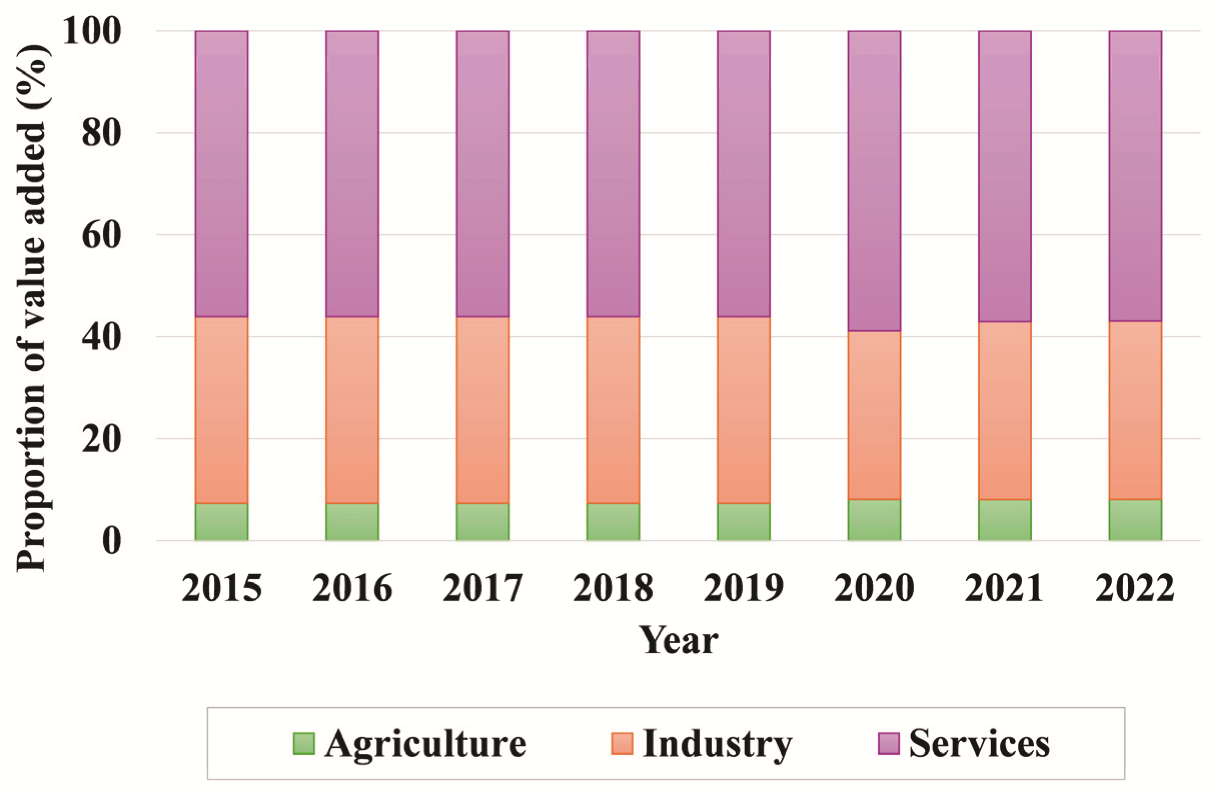
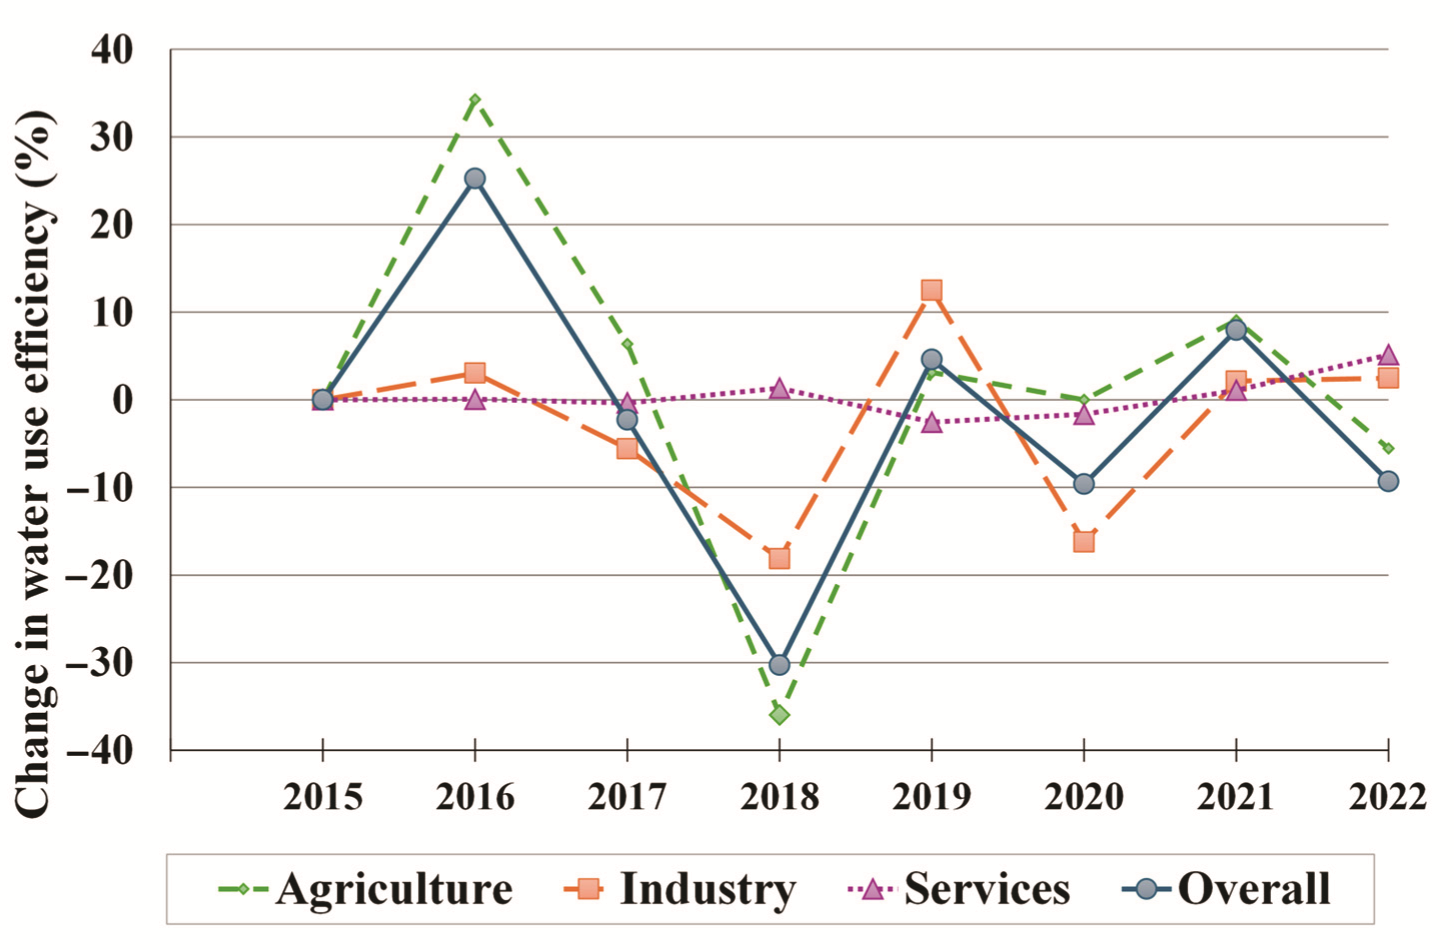
3.1.1. National-Level Water Use Efficiency

Between 2015 and 2022, water allocation in Thailand remained heavily skewed toward the agricultural sector, which accounted for approximately 75% of total water consumption. The service and industrial sectors followed, consuming around 16% and 9%, respectively (Figure 2). Despite this distribution, the economic contribution of each sector had an inverse trend, with the service sector contributing approximately 57% to gross value added (GVA), followed by industry (35%) and agriculture (only 8%), as shown in Figure 3. While economic output increased overall, WUE fluctuated, with GVA growth lagging behind water withdrawals, particularly in agriculture (Figure 4). These trends highlight the inefficiencies in water usage and potential concerns regarding water security’s role in economic sustainability.
The national WUE during the study period ranged from 6.63 to 10.51 USD/m3 (Table 2), classifying it as low efficiency. Sectoral analysis revealed that agriculture consistently had the lowest WUE values (0.32–0.50 USD/m3) and the industrial sector had the highest efficiency in 2015–2017 and 2019, whereas the service sector led in 2018 and from 2020 to 2022. In 2021, Thailand’s sectoral WUE was considerably lower than global benchmarks: the service sector reached only 25% of the global average, followed by agriculture (54%) and industry (72%). Compared with other studies [11,25], these results confirmed that Thailand’s WUE has remained low, particularly in agriculture, where efficiency improvements have been slower than anticipated.
Table 2 illustrates the annual variation in WUE across Thailand, highlighting a general decline over the study period. Notably, the largest variations in Awe were in the early years of the study, reflecting shifts in irrigation efficiency, rainfall fluctuations, and rising temperatures during the study period. Higher temperatures increased evapotranspiration rates, reducing soil moisture and requiring greater irrigation inputs. This trend was particularly evident in basins with extensive irrigated farmland, where inefficient water application further exacerbated water loss. In addition, industrial WUE showed a decreasing trend, likely due to inefficiencies in water-intensive production processes, increased withdrawals, and slow adoption of water-saving technologies. The declining efficiency in the industrial sector greatly contributed to the overall national WUE decline.
SDG indicator 6.4.1, which tracks “change in water use efficiency over time”, was assessed in terms of both annual fluctuations (CWUE) and long-term trends (TWUE), as shown in Figure 5. The year-on-year WUE changes were highly variable, ranging from −30.3% in 2018 to +25.3% in 2016. The agricultural and industrial sectors experienced the greatest fluctuations, with WUE changing from −35.0% to +35.1% in agriculture and from −18.2% to +12.5% in industry. In contrast, there was greater stability in the service sector, with changes ranging from −2.5% to +5.2%, indicating more consistent water usage practices in this sector.
Considering long-term trends, Thailand’s total WUE declined by 21.0% between 2015 and 2022, primarily driven by a 21.4% efficiency decrease in industry. These trends were influenced by water demand shifts, economic disruptions, and external factors. For example, above-average rainfall in 2016–2017 led to reduced agricultural withdrawals (Figure 4b), temporarily improving WUE. Conversely, the economic slowdown during the COVID-19 pandemic (2020) reduced the value added (Figure 4d), further impacting efficiency measures.

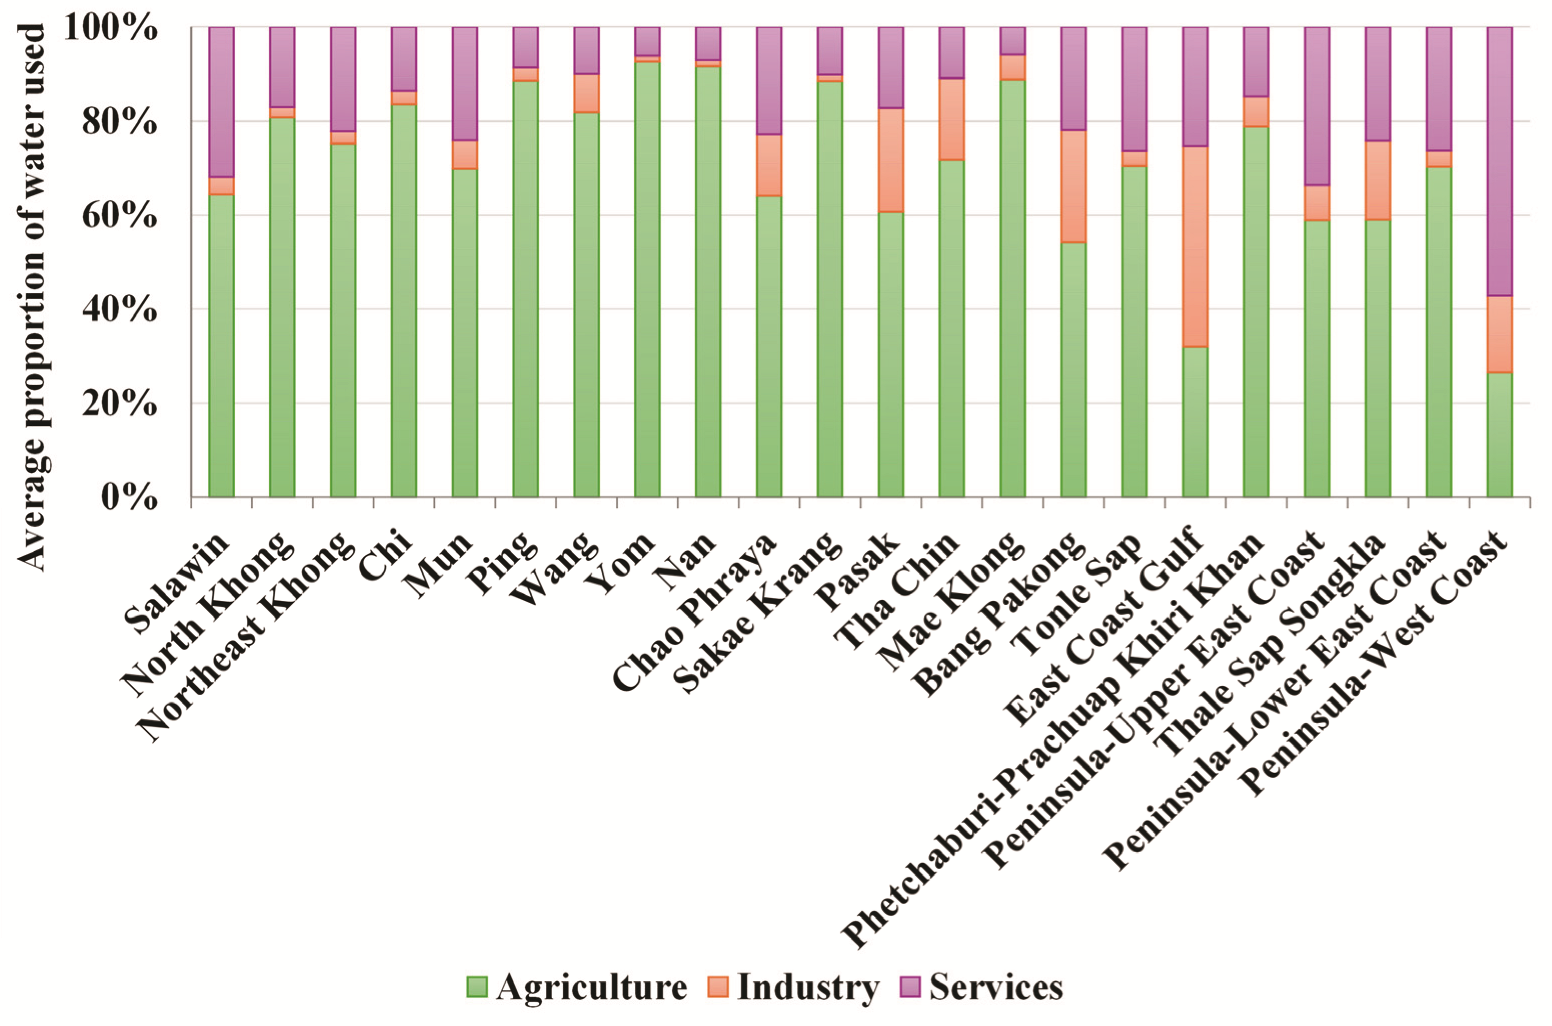
3.1.2. Water Use Efficiency at the River Basin Level

Water use patterns at the river basin level largely mirrored national trends, with agriculture dominating withdrawals in most basins, except for the East Coast Gulf and Peninsula–West Coast Basins, where industry and services, respectively, accounted for the highest shares of water use (Figure 6). Basins with higher industrial or service activity had better WUE outcomes. This observation is consistent with the findings of Döffinger and Hall [12], who reported similar sectoral impacts on WUE at regional scales. Economic value added followed a similar pattern, with 18 basins reflecting the national sectoral distribution, while the East Coast Gulf, Tha Chin, Bang Pakong, and Pasak Basins had higher industrial contributions to GVA (Figure 7). Notably, the Chao Phraya, Bang Pakong, and East Coast Gulf Basins collectively generated 64.5% of national GVA while consuming only 31.3% of national water resources (Figure 8).
There is a clear negative correlation between agricultural water use proportions (Pa) and overall WUE, with a Pearson’s correlation coefficient of −0.897 (p < 0.01). Basins with predominant industrial or service activity had higher WUE values than agriculture-dominated basins. The four highest-WUE basins—East Coast Gulf (24.8 USD/m3), Peninsula–West Coast (19.8 USD/m3), Bang Pakong (16.5 USD/m3), and Chao Phraya (15.9 USD/m3)—were classified as moderately efficient (Figure 9).
WUE values in most basins declined from 2015 to 2022, consistent with national patterns, based on observed year-to-year reductions. The Peninsula–Lower East Coast basin had the sharpest drop, from 10.45 USD/m3 to 2.95 USD/m3 (−71.7%), reflecting reduced efficiency across all sectors. The Chao Phraya basin was the sole exception, improving from 13.93 USD/m3 to 14.88 USD/m3 (+6.8%), driven by increasing efficiencies in agriculture and services.
A sectoral breakdown of the average WUE across basins (Table 3) highlighted key variations. The Chao Phraya, Bang Pakong, and Peninsula–West Coast Basins achieved higher service sector WUE than the national average, though still below global benchmarks. Five basins—Chao Phraya, Chi, Ping, Bang Pakong, and East Coast Gulf—exceeded global averages for industrial WUE. In addition, ten basins, predominantly in southern Thailand, surpassed the global agricultural WUE standard, suggesting potential for more sustainable irrigation practices.
Overall, these findings reinforced the importance of sector-specific interventions at the basin level to enhance WUE. Strategies, such as targeted efficiency improvements in industry, wastewater reuse in services, and irrigation optimization in agriculture, are crucial for improving Thailand’s overall water sustainability. However, notably, some basin-level interpretations were constrained by data gaps, particularly regarding small-scale agricultural water use and sector-specific disaggregation of withdrawals. Although estimations and adjustments were applied, these limitations could have influenced the accuracy of the basin-level efficiency comparisons.

3.2. Water Stress

3.2.1. National-Level Water Stress

The contribution of non-conventional water sources to Thailand’s total water supply remains minimal. Desalinated water use accounted for only 3.6 million m3 per year (0.007% of total withdrawals), while treated wastewater contributed 27.4 million m3 per year (0.05% of total withdrawals). Given these negligible proportions, Thailand remains largely reliant on conventional freshwater sources for meeting its demand.
Thailand’s WS levels fluctuated between 8.0% in 2016 and 13.8% in 2022, indicating that the country falls within the “no water stress” category (WS < 25%) according to global classification standards [9]. However, a gradual increase in WS was observed during the study period, with an average annual rise of 0.63% between 2015 and 2023. This trend surpassed the global WS growth rate of 0.08% per year (2015–2021), as shown in Table 4. This rising stress aligned with OECD [15] concerns regarding increasing water competition and the need for proactive management. Notably, in 2022, Thailand’s WS value exceeded the long-term optimal global threshold of 12.5% [27], suggesting an emerging need for proactive water management strategies to prevent future stress conditions.
The increasing trend in WS highlights growing competition among water users and underscores the potential challenges in securing sustainable freshwater supplies. While Thailand’s overall WS remains lower than global levels, the accelerated rate of increase signals a risk of future WS if current withdrawal patterns continue unchecked.

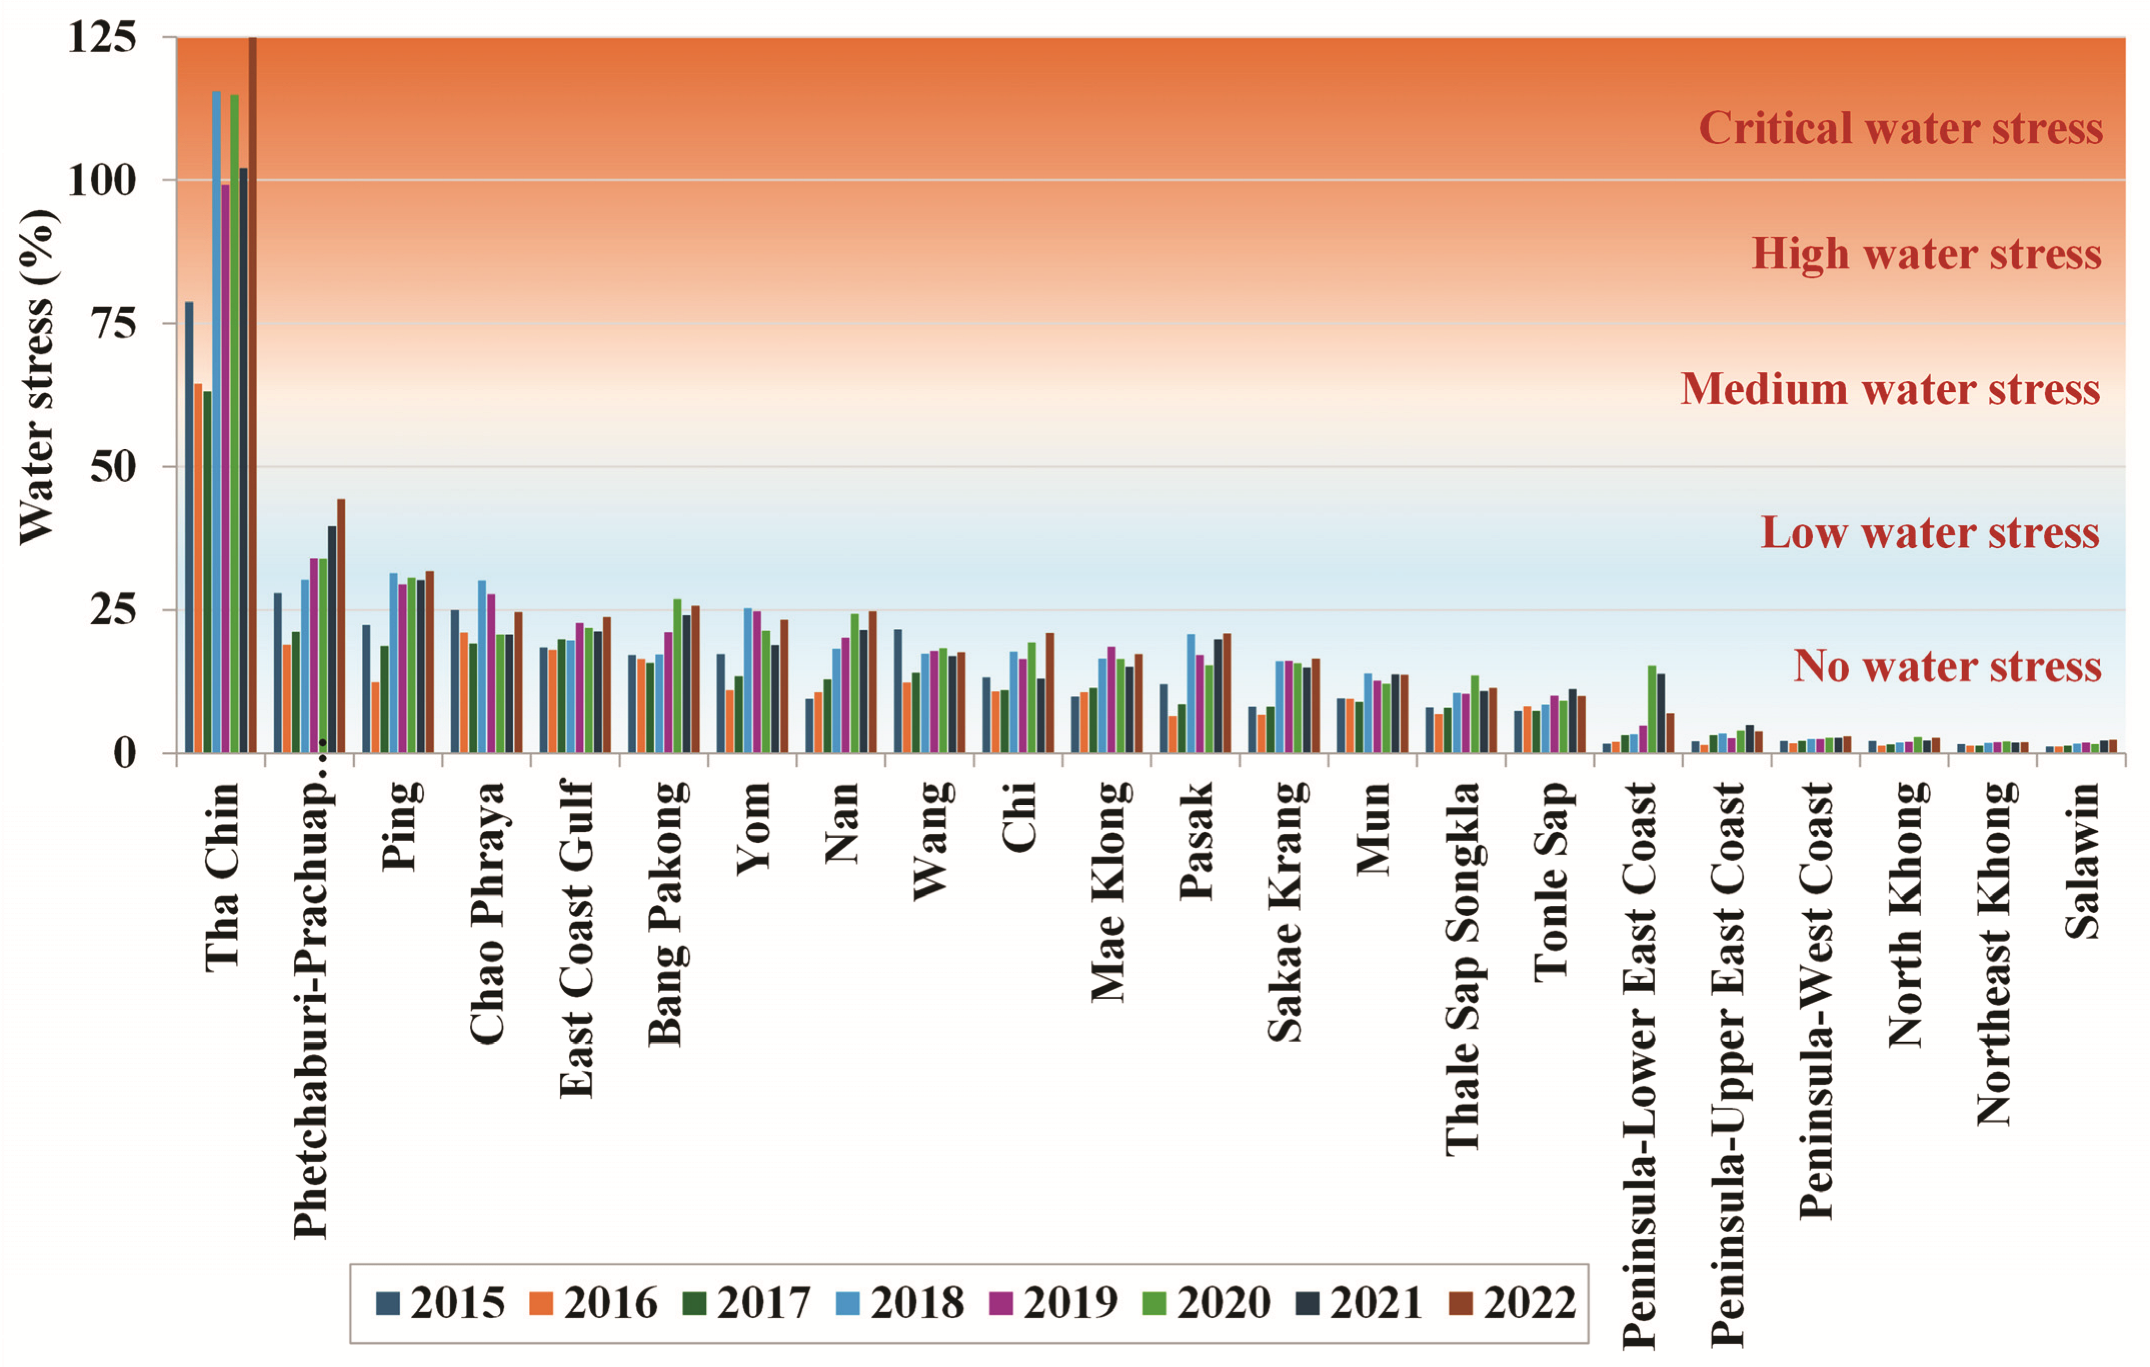
3.2.2. Water Stress at River Basin Level

While Thailand’s national WS remains below the stress threshold, variations exist across river basins, with certain regions experiencing critical WS levels (>100%). Among these, the Tha Chin Basin had the highest stress levels, surpassing 100% in 2018 and from 2020 to 2022 (Figure 10). This extreme stress level indicates that water withdrawals in this basin exceeded locally available renewable water resources, necessitating reliance on external water sources from interconnected irrigation systems such as the Chao Phraya and Mae Klong Basins.
By 2022, WS in the Chin Basin had peaked at 124.9%, reinforcing the urgent need for IWRM strategies. In addition to Tha Chin, Phetchaburi–Prachuap Khiri Khan, Ping, and Chao Phraya Basins experienced moderate WS, with the Chao Phraya Basin being particularly notable due to its economic importance and population density [28].
Several other river basins have encountered periodically low WS levels (25–50%), indicating emerging stress conditions. Notably, the Phetchaburi–Prachuap Khiri Khan Basin experienced low WS levels from 2015 and between 2018 and 2022. The Bang Pakong Basin exhibited similar patterns in 2020 and 2022, while the Ping Basin showed low WS between 2018 and 2022. The Yom Basin experienced low WS in 2018, while the Chao Phraya Basin showed low WS between 2018 and 2019.
In contrast, the North Khong and Northeast Khong Basins depend on external water sources from the Mekong River, making them vulnerable to transboundary water management decisions. If access to Mekong River water was restricted (ERWR = 0), their WS levels would escalate substantially, rising from 2.7% to 18.2% in the North Khong Basin and from 2.0% to 8.4% in the Northeast Khong Basin. These figures underscore the critical dependency of these basins on the Mekong River flow. To mitigate these transboundary water risks, closer engagement with the Mekong River Commission (MRC) through cooperative frameworks, joint monitoring programs, and contingency planning is strongly recommended.
Additionally, limited adoption of non-conventional water sources was observed at the basin level. As of 2023, the Chao Phraya Basin reported direct reuse of treated wastewater at 0.28% of total water use. The Peninsula–Upper East Coast and East Coast Gulf Basins incorporated desalinated water, accounting for 0.21% and 0.15% of withdrawals, respectively.
Although desalination remains a costly alternative, its role as an emergency supply source during severe droughts highlights its potential for future expansion. Current reliance on conventional freshwater sources underscores the need for greater investment in alternative water supplies to enhance resilience against water stress conditions.
To promote wider adoption of non-conventional water sources in Thailand, several strategies could be considered. For wastewater reuse, expanding decentralized treatment facilities in urban and peri-urban areas would enable localized recycling of municipal wastewater, reducing pressure on freshwater supplies. Economic incentives, such as tax reductions or subsidies for industries and housing developments that adopt treated wastewater systems, could encourage broader implementation. For desalination, investment should focus on small- to medium-scale solar-powered desalination units in coastal and drought-prone rural regions, which offer lower operational costs compared to conventional desalination technologies. Public–private partnerships (PPPs) could also be promoted to mobilize investment and technical expertise in non-conventional water infrastructure development.
Limited data on non-conventional water use (such as treated wastewater or desalination) at the basin level may also affect the interpretation of WS in certain areas. Future studies with more complete datasets could provide greater clarity.
The summary of key findings from this study highlights several critical trends affecting Thailand’s water sustainability. Nationally, water stress (WS) is increasing at an average annual rate of 0.63%, exceeding the global rate of increase. The Tha Chin Basin experiences extreme WS conditions, consistently surpassing 100%, indicating a heavy reliance on external water sources and urgent management needs. Additionally, three other basins—Phetchaburi–Prachuap Khiri Khan, Ping, and Chao Phraya—exhibit moderate WS, suggesting the necessity for close monitoring and proactive interventions. Basins dependent on the Mekong River, such as the North Khong and Northeast Khong Basins, are highly vulnerable to external water availability risks, underlining the importance of strengthened transboundary management strategies. Furthermore, non-conventional water sources, including treated wastewater reuse and desalination, remain underutilized across the country, although limited adoption has been observed in select basins. Expanding investment in alternative water supply technologies and implementing incentive frameworks could significantly enhance resilience against growing water stress.
In response to these findings, several policy recommendations are proposed. Integrated water management strategies should be prioritized in high-stress basins, especially in the Tha Chin and Chao Phraya Basins. Expansion of wastewater reuse and desalination infrastructure is also necessary to diversify and secure water supply sources. Furthermore, strengthening transboundary water governance mechanisms is critical to safeguarding access to Mekong River flows for the North Khong and Northeast Khong Basins. Lastly, enhancing water demand management, particularly within the agricultural sector, remains essential to address the largest water consumption demands sustainably.
Overall, these findings emphasize the need for proactive water management policies to mitigate increasing WS trends and ensure sustainable water use in Thailand.

3.3. Water Use Efficiency Versus Water Stress

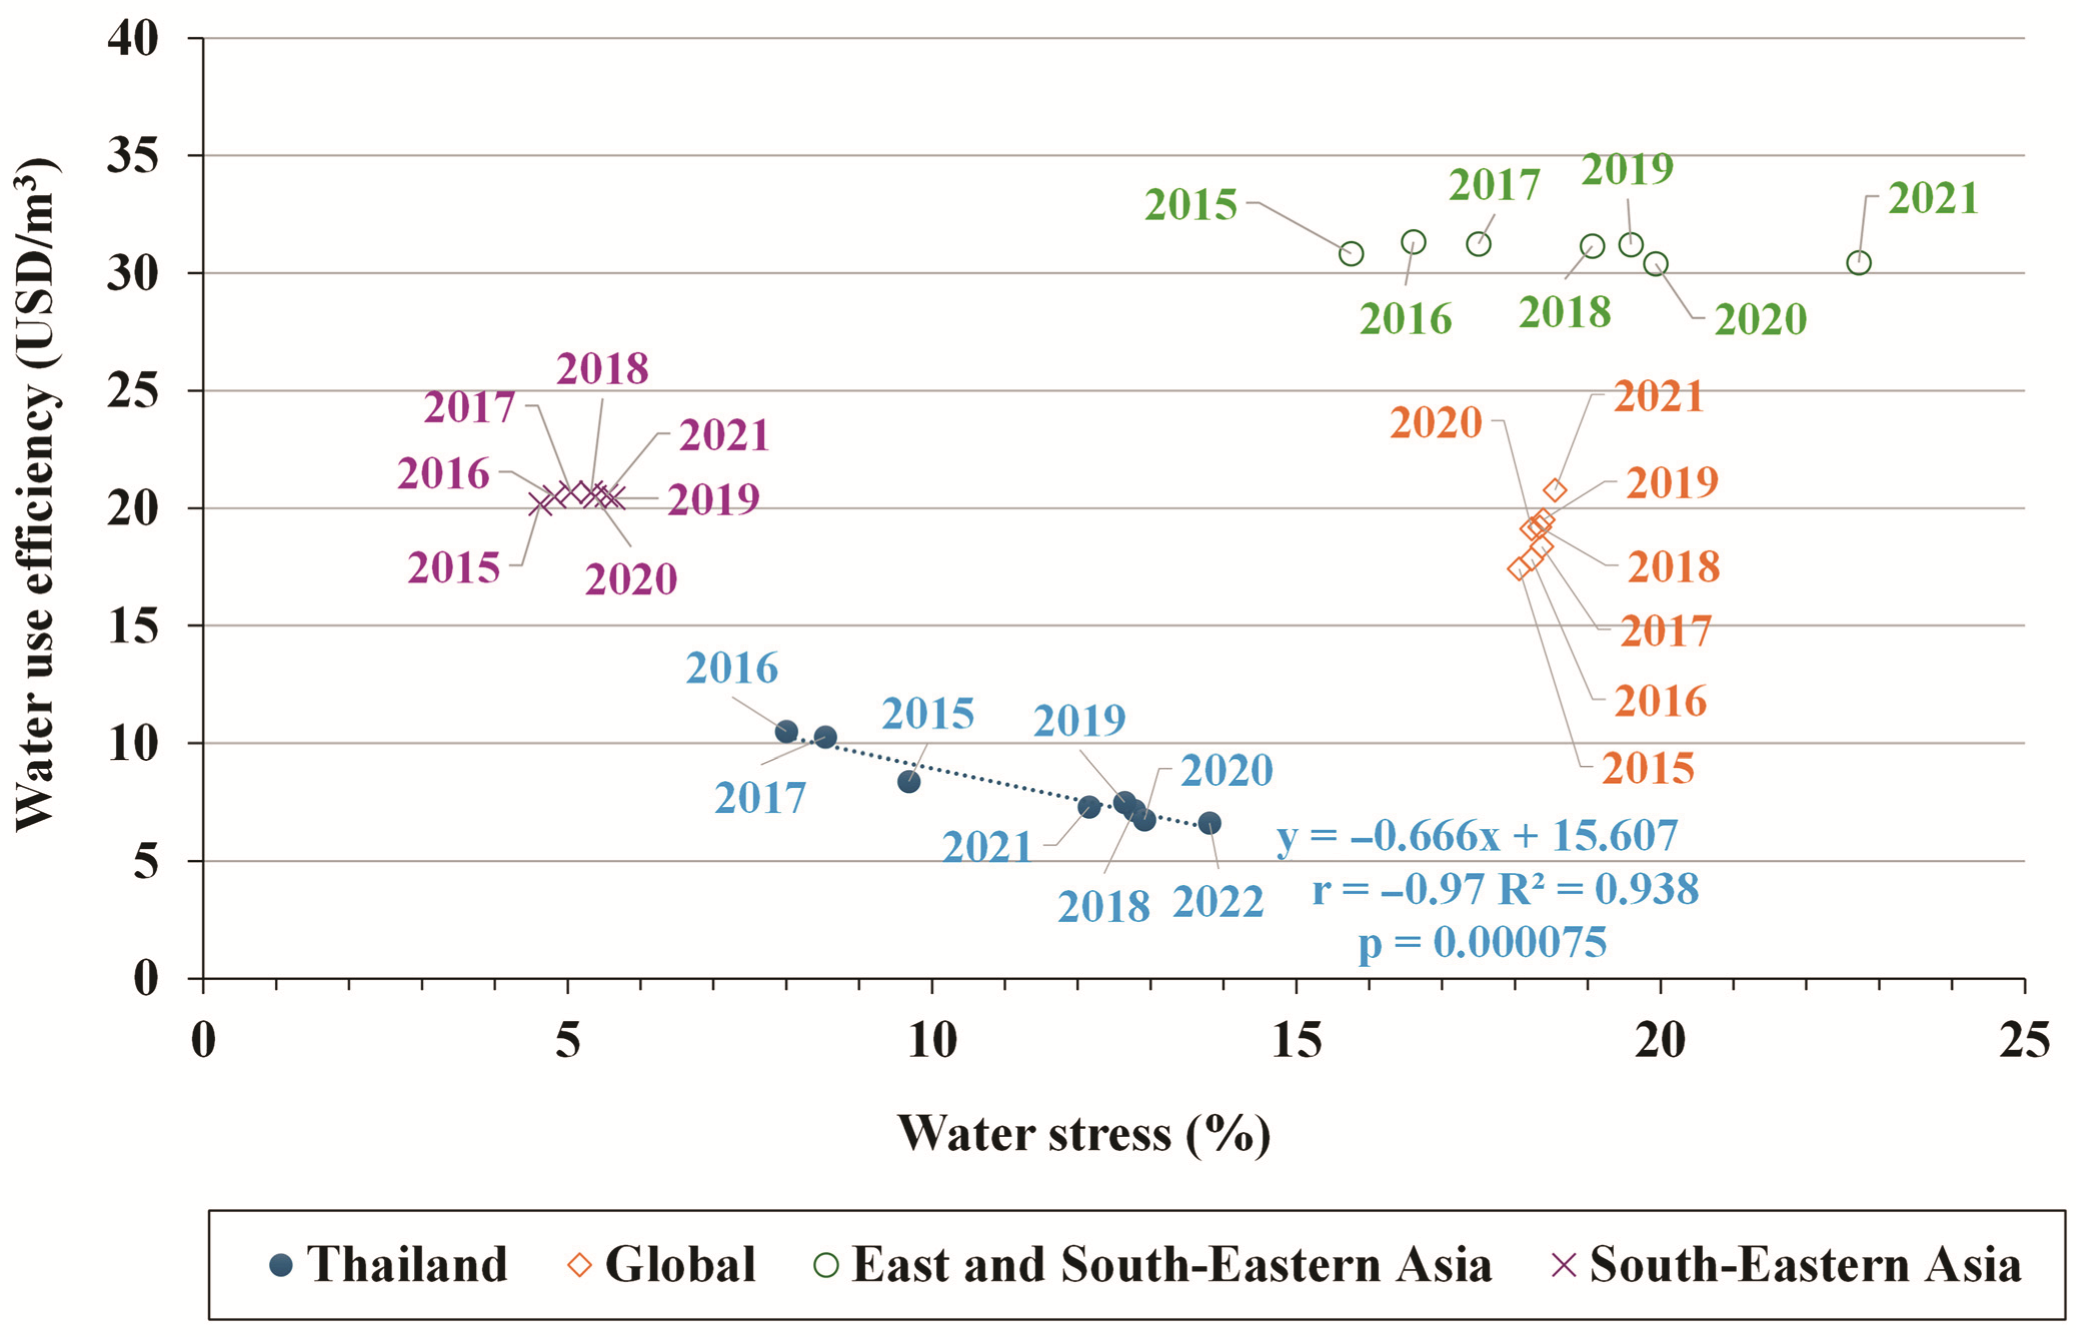
3.3.1. National-Level Analysis

WUE and WS serve as complementary indicators for evaluating water resource sustainability [29]. From 2015 to 2022, Thailand experienced a decline in WUE, coinciding with an increase in WS (Figure 11). This trend was particularly evident in the agricultural and industrial sectors, where inefficient irrigation practices and increased manufacturing withdrawals have led to higher overall water demand. In high-stress regions, such as the Tha Chin and Chao Phraya Basins, water withdrawals continued to increase despite declining WUE, exacerbating WS conditions.
The Pearson’s correlation coefficient (r) of −0.97 indicates a very strong negative correlation between WUE and WS, with a p-value of 0.000075, confirming the very high statistical significance of this relationship. While this result validates the inverse relationship between declining WUE and increasing WS, it does not imply causation, as other external influences such as climate variability, policy shifts, and economic activities may also influence both indicators. This distinction is essential to prevent overinterpretation of correlation as evidence of direct cause.
The current analysis has highlighted the urgent need for efficiency improvements in high-stress basins, as lower WUE correlates strongly with worsening WS. Addressing these inefficiencies through targeted policy interventions, technological advancements, and strategic water allocation is essential for ensuring long-term sustainability.
To assess the sensitivity of WUE to changes in economic value added and water use, a scenario-based analysis was conducted. The results demonstrated that national-level WUE remained relatively stable under moderate changes, but increased substantially when both value added and water savings rose sharply. For example, a 100% increase in value added coupled with 90% water savings yielded a 149.9% rise in WUE. This reinforces the robustness of observed trends and highlights that while small improvements yield modest WUE gains, synergistic actions combining efficiency and productivity yield greater benefits.
Globally, WUE has remained relatively stable, consistently above 17 USD/m3, despite fluctuations in WS. This stability reflects more effective water management practices, particularly in balancing economic productivity with water consumption [13]. Additionally, Southeast Asia has WUE values in the range of 20–25 USD/m3 that are higher than for Thailand, but with lower variations in WS. The region’s more balanced approach to water resource management suggests greater resilience in mitigating water stress compared to Thailand.
Thailand’s WUE and WS trends underscore the considerable challenges in maintaining water resource efficiency under increasing stress conditions. The observed decline in WUE, coinciding with rising WS, signals the need for targeted water management strategies. These strategies should focus on optimizing water allocation, promoting efficiency in agriculture and industry, and strengthening resilience to climatic and economic pressures to ensure long-term water sustainability.

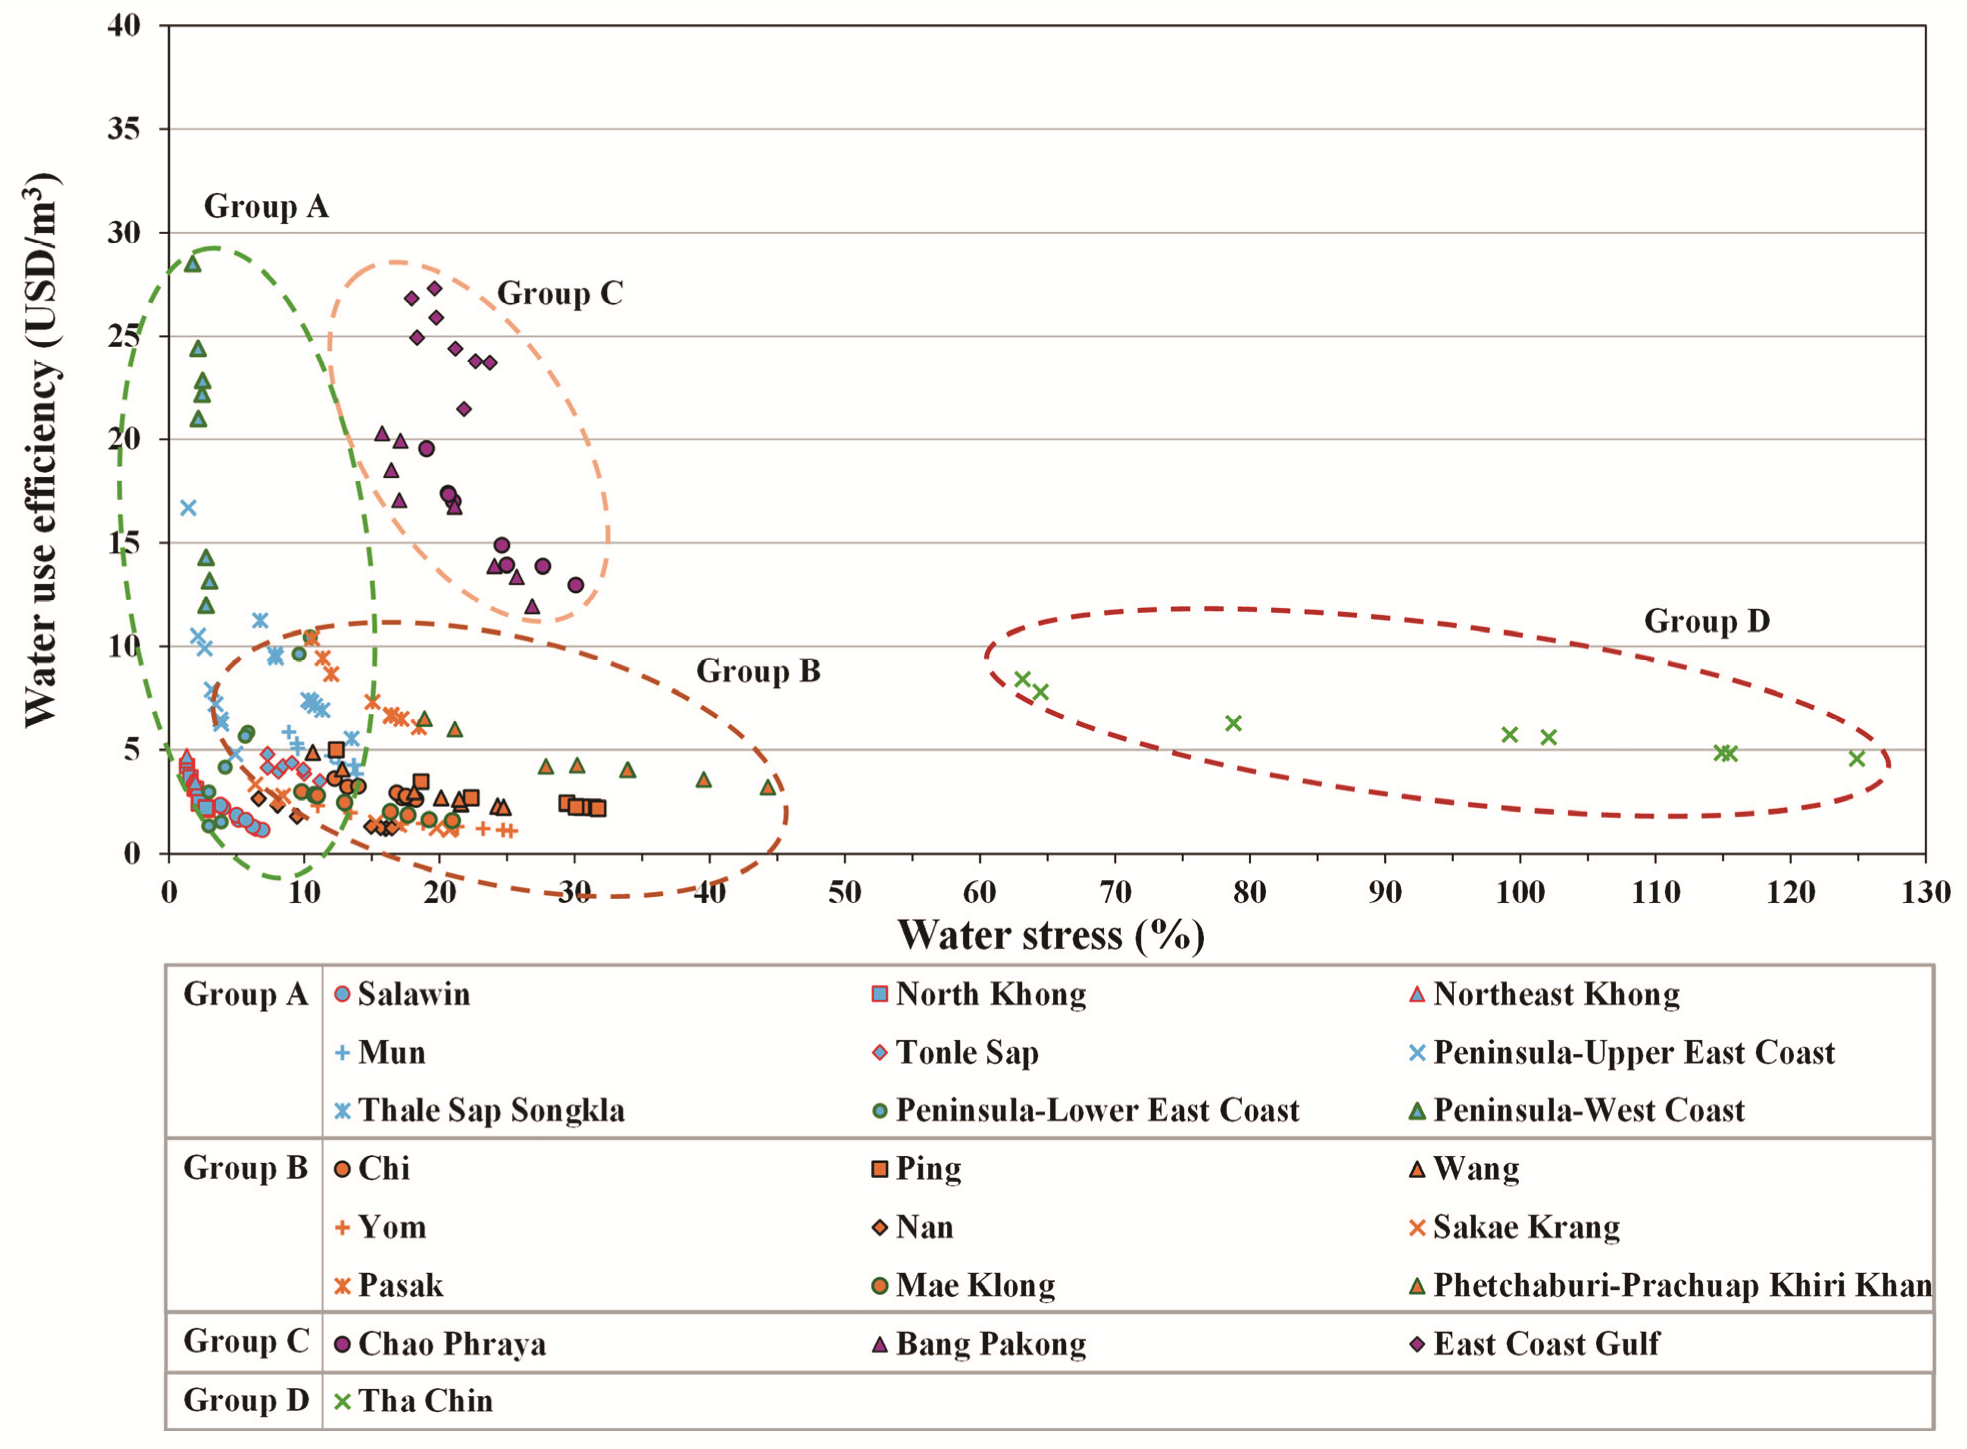
3.3.2. River Basin-Level Analysis

Figure 12 illustrates the distribution of WUE and WS across Thailand’s 22 river basins over the period 2015–2022. While all basins follow the national trend, the strength of the WUE-WS relationship varies. A time-series trend analysis from 2015 to 2022 revealed that WUE significantly declined on an annual basis by 0.46 units per year (coefficient of determination, R2 = 0.538, p = 0.038), while WS increased at a rate of +0.75 units per year (R2 = 0.673, p = 0.013). These trends confirm a progressive efficiency loss and worsening WS over time, reinforcing the urgent need for improved water management strategies. Consistently, the Tha Chin Basin exhibited the highest WS, while basins with lower WS values had more clustered and stable conditions. Based on the interplay between WUE and WS, the studied basins were grouped into four categories using practical thresholds of sustainability indicators. Specifically, basins with WS below 12.5% were considered low-stress, while those with WS exceeding 100% were classified as critically stressed.
Sensitivity analysis was also conducted to examine the effect of varying environmental flow requirement (EFR) assumptions on WS in selected basins. Using the Chao Phraya and Tha Chin Basins as case studies, the impact of doubling and tripling EFR values (relative to Q90-based baselines) was evaluated. Results showed that even under higher EFR assumptions, WS increased moderately—e.g., in 2022, WS in the Chao Phraya Basin rose from 24.6% (baseline) to 25.7% and 26.9% under 2× and 3× EFR assumptions, respectively. In the Tha Chin Basin, WS increased from 124.9% to 128.9% and 133.1%, respectively. These results confirm that while WS levels are sensitive to EFR estimation, overall patterns and classifications remain robust.
  • Group A: Basins with no water stress
This group contained nine basins located primarily along Thailand’s borders: Salawin, North Khong, Northeast Khong, Mun, and Tonle Sap Basins in the northern and northeastern regions, and the Peninsula–Upper East Coast, Thale Sap Songkla, Peninsula–Lower East Coast, and Peninsula–West Coast Basins in the southern region.
These Basins had consistently low WS levels (<12.5%), with minor fluctuations, while their WUE values ranged from low to moderate, indicating diverse water management practices. Among them, the Peninsula–West Coast Basin had the highest potential for sustainability, with average WS of 2.43% and WUE of 19.8 USD/m3. The dominance of the services sector (63% of total economic value added) and the limited agricultural water consumption (26.5%) contributed to this basin’s sustainable water use profile.
  • Group B: Basins with tentative-to-low WS and low WUE
This group contained nine basins—Chi, Ping, Wang, Yom, Nan, Sakae Krang, Pasak, Mae Klong, and Phetchaburi–Prachuap Khiri Khan—where over 50% of water use is allocated to agriculture.
These basins are particularly vulnerable due to their high dependence on agricultural water withdrawals. Continuous monitoring is essential to ensure long-term sustainability, particularly by reducing excessive water use in agriculture. Encouraging the cultivation of high-value, low-water-demand crops could enhance WUE while reducing overall withdrawals.
  • Group C: Basins with tentative-to-low WS and moderate WUE
The Chao Phraya, Bang Pakong, and East Coast Gulf Basins are in this group, characterized by their high economic importance and moderate WUE. These basins make major value-added contributions to the national economy, with strong potential for improving water efficiency through advanced management strategies.
The services sector in the Chao Phraya Basin contributes 76.7% of the value-added total to the national economy. Thus, the emphasis should be on prioritizing efficiency improvements within urban and commercial water use. Expanding wastewater reuse in Bangkok, which has eight central wastewater treatment plants with a combined capacity of 1.11 × 10⁶ m3/day, represents a viable strategy for reducing freshwater withdrawals.
In the Bang Pakong and East Coast Gulf Basins, where industrial activities are prominent, the focus should be on improving industrial WUE through water-saving technologies and expanding treated wastewater reuse in both the industrial and services sector.
  • Group D: Basins with high WS and low WUE
Consistently, the Tha Chin Basin experienced critical WS (>100%), indicating excessive water withdrawals relative to available resources. Urgent interventions are required to reduce consumption and improve WUE, particularly in the dominant agricultural sector. Additionally, industrial WUE in this basin remains below the national average, necessitating targeted policies to enhance efficiency in manufacturing and processing sectors.
The key findings and implications from the river basin-level analysis highlight important variations in water use sustainability across Thailand. Thailand’s water use efficiency (WUE) has steadily declined while water stress (WS) has increased, emphasizing the urgent need for improved water resource management strategies at localized levels. Significant variability across basins was observed, with basins such as Tha Chin facing extreme WS conditions, while others like the Peninsula–West Coast Basin demonstrated more sustainable water use practices. Agricultural water consumption emerged as a major factor contributing to inefficiencies, as basins dominated by agricultural water use tended to exhibit lower WUE, suggesting the need for enhanced irrigation efficiency and appropriate crop selection strategies. Moreover, basins with strong economic activities, such as Chao Phraya and East Coast Gulf, offer opportunities to improve sustainability through the promotion of wastewater recycling and industrial water conservation measures. Immediate management interventions are particularly necessary in high-stress basins, with the Tha Chin Basin requiring urgent actions to reduce excessive water withdrawals and to enhance efficiency in both agricultural and industrial sectors.
To support sustainable water management, several strategic actions are recommended. Expanding wastewater reuse and alternative water sources, particularly in urban–industrial regions with high water demand, is necessary. Enhancing irrigation efficiency and promoting water-saving agricultural practices are also critical to reduce withdrawals in high-consumption basins. Strengthening industrial water conservation initiatives, including investments in closed-loop recycling systems, will further support sustainable water management. Implementing targeted basin-specific policies, particularly for high-stress basins such as Tha Chin, remains a priority. Additionally, improving data collection and monitoring is essential to refine future water management strategies and align efforts with SDG indicators 6.4.1 and 6.4.2.
These findings emphasize the urgent need for sector-specific interventions to mitigate rising WS and enhance long-term WUE across Thailand’s river basins.

3.4. Policy Implications

The findings from the current study provide critical insights for policymakers, water resource managers, and industry stakeholders seeking to improve water sustainability in Thailand. Given the observed decline in WUE and rising WS across multiple basins, a set of targeted policy interventions is necessary. The regression analysis (R2 = 0.938, p < 0.001) confirmed that WUE improvements could produce significant reductions in WS, reinforcing the importance of efficiency-focused strategies.
In Thailand, river basin-level water governance is overseen primarily through the River Basin Committees (RBCs) under the coordination of the Office of the National Water Resources (ONWR), following the 2018 Water Resources Act. This decentralized structure is intended to promote integrated water resource management (IWRM) at the basin level, ensuring that local conditions and sectoral needs are addressed. The current study’s findings align with the objectives of this governance model, emphasizing the need for basin-specific interventions to tackle declining WUE and rising WS. Strengthening the role and capacity of RBCs, including better data access and stakeholder engagement, would be crucial for implementing targeted efficiency strategies.
In formulating policy recommendations, this study draws upon both domestic initiatives and international best practices. For instance, expanding wastewater reuse systems is consistent with Thailand’s National Water Resources Management Strategy, while successful examples from countries such as Singapore and Australia highlight the importance of incentives, decentralized treatment, and public–private partnerships in promoting water reuse and desalination technologies. Similarly, strengthening real-time data collection mirrors global moves toward digital water governance, such as those promoted under the UN Water Action Decade. These targeted approaches will help Thailand align its river basin management more closely with international standards while addressing local vulnerabilities.
Furthermore, while this study focused on Thailand’s river basins, future research could enhance policy insights by systematically comparing basin-level WUE and WS trends with those observed in other countries. Such cross-country analyses would help identify shared challenges and successful strategies in managing water stress under different climatic and socio-economic contexts.
While this study focuses on improving water use efficiency within existing sectoral structures, achieving long-term sustainability may also require broader structural economic adjustments. Future research could explore how economic diversification and sectoral transitions could further balance water demand and productivity at the basin level.

3.4.1. Targeted Interventions at the Basin Level

The major variation in WUE and WS across the studied river basins in Thailand underscores the importance of basin-specific policies rather than a one-size-fits-all approach to addressing water-based issues. High-stress basins, such as Tha Chin and Chao Phraya, require urgent intervention, including improved irrigation efficiency and stricter industrial regulations. Severe WS conditions can be alleviated by addressing inefficiencies in agricultural and industrial water use. In contrast, moderate-stress basins, such as Bang Pakong and East Coast Gulf, require a focus on economic incentives for industrial water-saving technologies and wastewater reuse, ensuring a balance between economic growth and sustainable water management.
The strong correlation between the WUE and WS trends emphasizes that enhancing efficiency at the basin level can effectively mitigate water stress. Policymakers should prioritize interventions in high-stress basins while promoting adaptive management strategies in moderate-stress basins.
Regarding the next steps, the National Water Resource Committee, the ONWR, and the River Basin Committee should develop basin-level water allocation plans with efficiency-focused objectives. In parallel, the Ministry of Natural Resources and Environment should enforce sector-specific conservation measures to reduce WS and improve WUE.

3.4.2. Expanding Non-Conventional Water Sources

Despite increasing demand, desalination and wastewater reuse remain underutilized in Thailand. Policies should focus on integrating treated wastewater into industrial and municipal water supplies, encouraging decentralized wastewater treatment at household and municipal levels, and supporting closed-loop water systems in industries to reduce discharge and maximize reuse.
The Ministry of Industry should mandate water reuse policies for large industrial operations, while local governments should incentivize municipal and community-level wastewater treatment projects.

3.4.3. Strengthening Data Collection and Monitoring

Reliable, real-time data are essential for evidence-based water management. However, Thailand’s fragmented water data infrastructure limits effective policy implementation. Investments should be made in satellite and IoT-based water monitoring to enable accurate tracking of withdrawals and availability. The deployment of smart metering systems in agriculture and industry is also necessary to improve water use accountability. Furthermore, the development of a centralized water database that integrates national and basin-level data will be critical for effective monitoring and planning.
Moreover, the ONWR and the Royal Irrigation Department should lead the development of a national water database, while the National Statistics Office should oversee standardized data collection across agencies to ensure consistency and comparability.
While this study has presented a detailed assessment of water use and stress in Thailand, interpretations have been limited by data quality issues, especially regarding small-scale and sector-specific reporting. Policymakers should be aware of these limitations when designing interventions. Improved data collection, real-time monitoring, and standardized reporting will be essential to support future analyses and strengthen policy effectiveness.
Finally, these findings have highlighted the need for policymakers to focus on basin-specific actions supported by reliable, up-to-date data. Strengthening data infrastructure and applying targeted management strategies will be crucial steps toward improving water sustainability in Thailand.

3.4.4. Climate Adaptation in Water Resource Management

Climate variability has exacerbated WS, particularly in agricultural regions. Drought cycles and temperature increases have heightened irrigation demand, reducing WUE and increasing reliance on groundwater and reservoir withdrawals.
Key adaptation strategies include promoting drought-resistant crops and water-efficient irrigation technologies. Investing in climate-resilient infrastructure, such as multipurpose reservoirs and managed aquifer recharge systems, is also essential to bolster resilience against climate impacts. Additionally, the use of seasonal climate forecasts to inform water allocation decisions can improve preparedness and optimize water resource management.
Finally, the Meteorological Department should collaborate with the Ministry of Agriculture to integrate climate forecasting into water allocation planning. Furthermore, the River Basin Committee should implement long-term drought contingency plans to strengthen basin-level adaptive capacity.

3.5. Implementation Roadmap

Table 5 presents the main organizations and agencies responsible for carrying out WUE improvements and WS reduction measures. Each actor has specific roles, from developing policy frameworks to implementing practical solutions. In addition, the table outlines suggested actions for key sectors, including agriculture, industry, climate adaptation, and water reuse. It should be noted that this roadmap serves only as a tentative guideline. The actual actions and implementation will depend on the policies, priorities, and capacities of each organization. Clear role definitions and collaborative efforts across national, provincial, and local levels are essential for addressing water management challenges effectively.

4. Conclusions

This study carried out a comprehensive evaluation of water use efficiency (WUE) and water stress (WS) trends in Thailand from 2015 to 2022, offering critical insights into the challenges and opportunities in water resource management. The findings emphasize the growing disparities among river basins, underscoring the need for targeted interventions rather than a uniform national strategy.
A time-series analysis revealed that WUE declined by −0.46 units per year (p = 0.038), while WS increased by +0.75 units per year (p = 0.013), confirming worsening water conditions over time. The very strong negative correlation (r = −0.97, p < 0.001) further confirmed the inverse relationship between WUE and WS, highlighting the need for efficiency improvements to alleviate stress. Additionally, regression analysis (R2 = 0.938, p < 0.001) demonstrated that enhancing WUE could significantly mitigate WS, reinforcing the importance of efficiency-driven water management strategies.
During the study period (from 2015 to 2022), at the national level, Thailand experienced a 21.0% decline in WUE, while WS increased from 9.68% to 13.8%, indicating an increasing imbalance between water consumption and resource availability. However, trends at the basin level varied significantly, highlighting the limitations of national-scale assessments in addressing localized water issues. Critical high-stress basins, such as Tha Chin and Chao Phraya, exhibited rising WS and declining WUE, necessitating urgent intervention to enhance water conservation and efficiency. In contrast, basins with moderate WS and relatively stable WUE, such as the Peninsula–West Coast and East Coast Gulf, demonstrated more sustainable water management practices, which could serve as models for other regions.
Overall, the current study reinforces the need for context-specific water management strategies that account for basin-level variation in both supply and demand dynamics.
A key takeaway from this study is the underutilization of non-conventional water sources, including desalinated water and treated wastewater. Despite their potential to supplement freshwater resources, their contribution remains minimal. Expanding these alternative sources, especially in drought-prone regions, could greatly improve water security.
Additionally, data gaps and fragmented water monitoring systems continue to hinder evidence-based policymaking. The lack of real-time, basin-level water data complicates the ability to track water withdrawal, making it difficult to implement adaptive water management strategies effectively. These limitations have been considered in interpreting the results and underscore the need for more robust data infrastructure.
Several key policy actions are needed to address these challenges. Basin-specific water management should be prioritized through customized interventions in high-risk basins such as Tha Chin and Chao Phraya, including the implementation of efficient irrigation systems, stricter industrial water use regulations, and demand-side conservation strategies. Expansion of non-conventional water sources is necessary by increasing investments in wastewater reuse and desalination projects, and by integrating them into urban, industrial, and agricultural water supply systems. Enhanced data collection and monitoring are also essential, involving the development of a centralized national water database, the deployment of IoT-based real-time monitoring systems, and the standardization of basin-level reporting to support improved decision-making. Finally, climate adaptation strategies should be promoted, such as encouraging drought-resistant crops, advancing irrigation technologies, and investing in climate-resilient infrastructure, while integrating seasonal climate forecasts into water allocation frameworks.
In conclusion, the findings provide an important scientific basis for enhancing Thailand’s water sustainability. Future research should build on this framework by exploring the causal drivers of water use efficiency and stress, evaluating the effectiveness of implemented policies, and conducting comparative analyses with other developing countries to strengthen global knowledge on sustainable water management. Building on this foundation, implementing the targeted policy recommendations proposed in this study can enhance Thailand’s water security, economic resilience, and long-term sustainability. A coordinated effort among government agencies, industries, and research institutions will be crucial in translating these recommendations into effective action.

Author Contributions

Conceptualization, C.T., B.S. and N.S.-n.; methodology, C.T., B.S. and N.S.-n.; data collection, C.T., B.S. and N.S.-n.; data analysis, C.T., B.S. and N.S.-n.; writing—original draft preparation, N.S.-n.; writing—review and editing, B.S. and C.T.; graphic editing and formatting, N.S.-n. and C.T. All authors have read and agreed to the published version of the manuscript.

Funding

This research received no external funding. The APC was funded by the Faculty of Engineering at Kamphaeng Saen, Kasetsart University.

Institutional Review Board Statement

Ethical review and approval were waived for this study due to the Kasetsart University’s Announcement on Guidelines for Human Research Ethics Review. (https://sites.google.com/ku.th/kurec/Home, accessed on 7 April 2025).

Informed Consent Statement

Since this study did not involve collecting sensitive personal data, no formal informed consent form (blank form) was used. However, participants were informed about the study objectives before their participation.

Data Availability Statement

The original contributions presented in this study are included in the article; further inquiries can be directed to the corresponding author.

Acknowledgments

The authors wish to express their sincere thanks to the Office of the National Water Resources (ONWR) for their support.

Conflicts of Interest

The authors declare no conflicts of interest.

References

  1. Babel, M.S.; Chapagain, K.; Shinde, V.R.; Prajamwong, S.; Apipattanavis, S. A disaggregated assessment of national water security: An application to the river basins in Thailand. J. Environ. Manag. 2022, 321, 115974. [Google Scholar] [CrossRef] [PubMed]
  2. Liu, W.; Wang, Y.; Huang, J.; Zhu, W. Assessment on the sustainability of water resources utilization in Central Asia based on water resources carrying capacity. J. Geogr. Sci. 2023, 33, 1967–1988. [Google Scholar] [CrossRef]
  3. Mueller, S.A.; Carlile, A.; Bras, B.; Niemann, T.A.; Rokosz, S.M.; McKenzie, H.L.; Kim, H.C.; Wallington, T.J. Requirements for water assessment tools: An automotive industry perspective. Water Resour. Ind. 2015, 9, 30–44. [Google Scholar] [CrossRef]
  4. Musie, W.; Gonfa, G. Fresh water resource, scarcity, water salinity challenges and possible remedies: A review. Heliyon 2023, 9, e18685. [Google Scholar] [CrossRef] [PubMed]
  5. Huang, Z.; Yuan, X.; Liu, X. The key drivers for the changes in global water scarcity: Water withdrawal versus water availability. J. Hydrol. 2021, 601, 126658. [Google Scholar] [CrossRef]
  6. Kanchanapiya, P.; Tantisattayakul, T. Wastewater reclamation trends in Thailand. Water Sci. Technol. 2022, 86, 2878–2911. [Google Scholar] [CrossRef] [PubMed]
  7. United Nations. Transforming Our World: The 2030 Agenda for Sustainable Development; UN: New York, NY, USA, 2015; Available online: https://daccess-ods.un.org/access.nsf/Get?OpenAgent&DS=A/RES/70/1&Lang=E (accessed on 19 September 2023).
  8. Vanham, D.; Hoekstra, A.Y.; Wada, Y.; Bouraoui, F.; De Roo, A.; Mekonnen, M.M.; Van De Bund, W.J.; Batelaan, O.; Pavelic, P.; Bastiaanssen, W.G.M.; et al. Physical water scarcity metrics for monitoring progress towards SDG target 6.4: An evaluation of indicator 6.4.2 “Level of water stress”. Sci. Total Environ. 2018, 613–614, 218–232. [Google Scholar] [CrossRef] [PubMed]
  9. FAO; UN-Water. Global Status and Acceleration Needs for SDG Indicator 6.4.2. Progress on Level of Water Stress; FAO: Rome, Italy, 2021. [Google Scholar] [CrossRef]
  10. Callejas Moncaleano, D.C.; Pande, S.; Rietveld, L. Water Use Efficiency: A Review of Contextual and Behavioral Factors. Front. Water 2021, 3, 685650. [Google Scholar] [CrossRef]
  11. Giupponi, C.; Gain, A.K.; Farinosi, F. Spatial assessment of water use efficiency (SDG Indicator 6.4.1) for regional policy support. Front. Environ. Sci. 2018, 6, 141. [Google Scholar] [CrossRef]
  12. Doeffinger, T.; Hall, J.W. Water Stress and Productivity: An Empirical Analysis of Trends and Drivers. Water Resour. Res. 2020, 56, e2019WR025925. [Google Scholar] [CrossRef]
  13. Galli, A.; Đurović, G.; Hanscom, L.; Knežević, J. Think globally, act locally: Implementing the sustainable development goals in Montenegro. Environ. Sci. Policy 2018, 84, 159–169. [Google Scholar] [CrossRef]
  14. Krantz, V.; Gustafsson, S. Localizing the sustainable development goals through an integrated approach in municipalities: Early experiences from a Swedish forerunner. J. Environ. Plan. Manag. 2021, 64, 2641–2660. [Google Scholar] [CrossRef]
  15. OECD. Multi-Dimensional Review of Thailand (Volume 2): In-Depth Analysis and Recommendations; OECD Development Pathways; OECD Publishing: Paris, France, 2019. [Google Scholar] [CrossRef]
  16. Eckstein, D.; Künzel, V.; Schäfer, L. Global Climate Risk Index 2021: Who Suffers Most from Extreme Weather Events? Weather-Related Loss Events in 2019 and 2000 to 2019; Germanwatch: Bonn, Germany, 2021; Available online: https://www.germanwatch.org/en/node/19777 (accessed on 8 September 2023).
  17. Hellegers, P.; Van Halsema, G. SDG indicator 6.4.1 “change in water use efficiency over time”: Methodological flaws and suggestions for improvement. Sci. Total Environ. 2021, 801, 149431. [Google Scholar] [CrossRef] [PubMed]
  18. Thai Meteorological Department. Annual Mean Rainfall in Thailand (mm) 30 Years. Available online: https://www.tmd.go.th/en/ClimateChart/annual-mean-rainfall-in-thailand-mm-30-years (accessed on 9 April 2023).
  19. Saeed, F.H.; Al-Khafaji, M.S.; Al-Faraj, F.A.M.; Uzomah, V. Sustainable Adaptation Plan in Response to Climate Change and Population Growth in the Iraqi Part of Tigris River Basin. Sustainability 2024, 16, 2676. [Google Scholar] [CrossRef]
  20. Bilalova, S.; Newig, J.; Tremblay-Lévesque, L.-C.; Roux, J.; Herron, C.; Crane, S. Pathways to water sustainability? A global study assessing the benefits of integrated water resources management. J. Environ. Manag. 2023, 343, 118179. [Google Scholar] [CrossRef] [PubMed]
  21. MRC. Agreement on the Cooperation for the Sustainable Development of the Mekong River Basin; Walter de Gruyter: Vientiane, Laos, 1995. [Google Scholar]
  22. GEMI. Step-by-Step Monitoring Methodology for SDG Indicator 6.4.1; Integrated Monitoring Initiative for SDG 6, Version 20 ed.; FAO: Rome, Italy, 2019. [Google Scholar]
  23. GEMI. Step-by-Step Methodology for Monitoring Water Stress (6.4.2); Integrated Monitoring Initiative for SDG 6, Version 4 ed.; FAO: Rome, Italy, 2019. [Google Scholar]
  24. United Nations. International Standard Industrial Classification of All Economic Activities. Statistical Papers, Revision 4 ed.; UN: New York, NY, USA, 2008. [Google Scholar]
  25. FAO; UN-Water. Progress on Change in Water-Use Efficiency. Global Status and Acceleration Needs for SDG Indicator 6.4.1, 2021; FAO: Rome, Italy, 2021. [Google Scholar] [CrossRef]
  26. UN-Water. SDG 6 Data Portal. Available online: https://www.unwater.org/our-work/sdg-6-data-portal (accessed on 8 September 2023).
  27. Sachs, J.D.; Lafortune, G.; Fuller, G.; Drumm, E. Implementing the SDG Stimulus. Sustainable Development Report 2023; Dublin University Press: Dublin, Ireland, 2023. [Google Scholar]
  28. Abhishek; Kinouchi, T.; Sayama, T. A comprehensive assessment of water storage dynamics and hydroclimatic extremes in the Chao Phraya River Basin during 2002–2020. J. Hydrol. 2021, 603, 126868. [Google Scholar] [CrossRef]
  29. Vanham, D.; Mekonnen, M.M. The scarcity-weighted water footprint provides unreliable water sustainability scoring. Sci. Total Environ. 2021, 756, 143992. [Google Scholar] [CrossRef] [PubMed]
Figure 1. Thailand’s river basins.
Sustainability 17 04477 g001
Figure 2. Proportion of water used in Thailand from 2015 to 2022.
Sustainability 17 04477 g002
Figure 3. Proportion of value added by sectors (agriculture, industry, and services) from 2015 to 2022.
Sustainability 17 04477 g003
Figure 4. Water withdrawals and value added: (a) total, (b) agriculture, (c) industry, and (d) services sectors from 2015 to 2022.
Sustainability 17 04477 g004
Figure 5. Annual change in WUE from 2015 to 2022.
Sustainability 17 04477 g005
Figure 6. Average proportion of water used across river basins from 2015 to 2022.
Sustainability 17 04477 g006
Figure 7. Economic value added by sector (agriculture, industry, and services) across river basins from 2015 to 2022.
Sustainability 17 04477 g007
Figure 8. Distribution of economic value added and water usage percentages across river basins.
Sustainability 17 04477 g008
Figure 9. WUE across river basins in Thailand from 2015 to 2022.
Sustainability 17 04477 g009
Figure 10. WS across river basins in Thailand from 2015 to 2022.
Sustainability 17 04477 g010
Figure 11. Relationship between WUE and WS from 2015 to 2022.
Sustainability 17 04477 g011
Figure 12. Change in WUE and WS across 22 river basins in Thailand from 2015 to 2022.
Sustainability 17 04477 g012
Table 1. Categorization of water use across economic sectors.
AgricultureIndustryServices
Water for irrigated cultivation
-
Large/medium-scale irrigation projects
-
Irrigation pumping projects
-
Small-scale irrigation projects
-
Water resource development projects of the Department of Water Resources
Water for livestock
Water for freshwater aquaculture
Water for manufacturing
-
Water used in industrial estates/industrial parks
-
Water used outside industrial estates
Water used in power factories **
Water used for construction
Water produced by the Metropolitan Waterworks Authority
Water produced by the Provincial Waterworks Authority
Water produced by a large municipality Village waterworks
Domestic (household) use * (e.g., drinking, sanitation, personal use)
* Environmental water use is not included in sectoral withdrawals but is accounted for as environmental flow requirements (EFRs) in the WS calculation. ** Energy-related water use, such as for hydropower and thermal plant cooling, is categorized under industry for consistency with national data systems.
Table 2. Comparison of WUE (USD/m3) between Thailand and global values.
YearThailand *Global *
AweMweSweWUEAweMweSweWUE
20150.3534.7228.368.390.5028.42104.3917.42
20160.4735.7828.3810.510.5228.95103.6617.83
20170.5033.7928.2810.270.5330.35105.8318.37
20180.3227.6628.667.160.5532.58108.4419.19
20190.3331.1227.937.490.5733.27108.7119.51
20200.3326.0727.476.770.6232.86104.2519.12
20210.3626.6327.777.310.6737.16111.0120.77
20220.3427.2929.206.630.5731.94106.6118.89
Average0.3830.3828.268.070.5731.94106.6118.89
Change, 2015–2022−2.9%−21.4%3.0%−21.0%14.0%12.4%2.1%8.4%
* Thailand’s values are national-level estimates from this study. Global values are sourced from UN Water [26].
Table 3. Average proportion of water use (%) and WUE (USD/m3) across river basins in Thailand from 2015 to 2022.
Basin NamePa (%)Pm
(%)
Ps
(%)
Awe
(USD/m3)
Mwe
(USD/m3)
Swe
(USD/m3)
WUE
(USD/m3)
1Salawin64.43.731.90.348.810.55.4
2North Khong80.72.217.00.322.913.02.9
3Northeast Khong75.22.722.10.331.711.73.7
4Chi83.52.913.60.240.012.13.0
5Mun69.95.924.20.424.512.34.7
6Ping88.62.78.60.733.215.22.8
7Wang81.98.110.00.614.813.43.0
8Yom92.61.26.20.321.915.11.5
9Nan91.71.37.00.230.315.01.6
10Chao Phraya64.113.122.90.326.953.515.9
11Sakae Krang88.51.310.10.321.213.41.9
12Pasak60.722.017.31.019.616.07.7
13Tha Chin71.717.510.80.321.718.06.0
14Mae Klong88.85.35.90.417.816.92.3
15Bang Pakong54.224.021.80.539.031.516.5
16Tonle Sap70.53.126.40.925.610.44.1
17East Coast Gulf32.042.625.40.841.527.124.8
18Phetchaburi–Prachuap Khiri Khan78.96.314.80.924.015.14.5
19Peninsula–Upper East Coast58.97.433.71.027.818.08.7
20Thale Sap Songkla61.415.722.90.920.217.28.1
21Peninsula–Lower East Coast70.33.326.30.828.313.95.2
22Peninsula–West Coast26.516.457.11.418.328.419.8
Abbreviations: Pa = proportion of water used by agriculture (%); Pm = proportion of water used by industry (%); Ps = proportion of water used by services (%); Awe = agricultural water use efficiency (USD/m3); Mwe = industrial water use efficiency (USD/m3); Swe = services water use efficiency (USD/m3); WUE = total water use efficiency (USD/m3).
Table 4. WS levels in Thailand compared to global trends.
Year201520162017201820192020202120222023
Thailand WS (%)9.78.08.512.812.612.912.213.814.7
Global WS * (%)18.118.218.418.318.418.218.6 --
* data from UN Water [27].
Table 5. Key organizations and their responsibilities in implementing water efficiency and stress reduction actions (tentative suggestions based on current study findings).
Policy AreaAction NeededResponsible EntityPriority
Basin-Level ManagementImplement stricter water allocation policies in high-stress basins (Tha Chin, Chao Phraya).ONWR, River Basin CommitteeHigh—urgent (short-term)
Efficient Water Use in AgriculturePromote drip irrigation, precision farming, and crop selection based on water availability.Ministry of Agriculture and CooperativesHigh—large impact, moderate feasibility (medium-term)
Industrial Water EfficiencyEnforce water recycling and closed-loop systems in manufacturing.Ministry of Industry, Industrial Estate Authority of ThailandMedium—high impact, requires regulation enforcement (medium-term)
Wastewater Reuse and DesalinationExpand treated wastewater use in industrial and urban areas.Local Governments, Public Utilities, Industrial ZonesMedium—scalable, moderate cost (medium- to long-term)
Climate Adaptation in Water PlanningInvest in drought-resilient infrastructure and integrate seasonal forecasts.Meteorological Department, Ministry of Natural Resources & EnvironmentLow—high investment, long-term implementation (long-term)
Disclaimer/Publisher’s Note: The statements, opinions and data contained in all publications are solely those of the individual author(s) and contributor(s) and not of MDPI and/or the editor(s). MDPI and/or the editor(s) disclaim responsibility for any injury to people or property resulting from any ideas, methods, instructions or products referred to in the content.

