Abstract
This study posits the need for a conceptual multi-risk management approach for fresh produce, an essential product category for societal resilience and one constantly affected by climate change, policy volatility, and geopolitical disruptions. The research started with a literature-informed typological risk mapping, leading to Gephi ver 0.10.1 visualizations of networks related to this trade. Network analysis using 2024 bilateral trade data revealed a core–periphery topology, with the United States, Spain, and the Netherlands as central hubs. A gravity-based simulation model was, lastly, used to address the following question: what structural vulnerabilities and flow-based sensitivities define the global fresh produce trade, and how do they respond to simulated multi-risk disruptions? The model used the case of the USA as a global trade hub and induced two compounding risks: a protectionist tariff policy shock and a climate-related shock to its main supplier. The conclusion was that the fragility in the fresh produce trade enhances the cascading effects that any risk event may have across the environmental, economic, and social sustainability dimensions. This paper emphasizes the need for anticipatory governance, the diversification of trade partners, and investment in cold chain resilience, offering a means for policymakers to acknowledge the risk and mitigate the threats to the increasingly fragile fresh produce trade.
1. Introduction
Before being able to become hunters, humans were gatherers, so fresh produce has been an intrinsic part of human evolution and a staple of our diet for millennia. Even in modern times, its role remains foundational to human health and nutritional well-being. And yet, more than “1.7 million deaths worldwide are being attributed to low fruit and vegetable consumption” [1]. Fresh produce, defined as “fresh fruits and vegetables […] that is likely to be sold to consumers in an unprocessed or minimally processed (i.e., raw) form” [2], is essential for global health and nutritional security and central to achieving the Sustainable Development Goals SDG 2 (Zero Hunger) and SDG 3 (Good Health and Well-Being).
It is also a significant part of the international agri-food trade, with the revenue in 2025 amounting to USD 1653.56 billion (USD 875.19 billion from fresh vegetables and USD 778.37 billion from fresh fruit) [3,4]. Both markets are expected to grow annually by more than 6% (CAGR 2025–2030: 6.68% for vegetables and 6.28% for fruits) [3,4]. This significant growth is supported by complex supply chains that enable year-round and worldwide access to products that are seasonal and regional.
However, fresh produce is perishable, with a short shelf life, temperature and other sanitary and phytosanitary (SPS) sensitivities, and seasonal availability. Thus, its logistics are complex and specific and require specialized infrastructure, most notably cold chain systems and rapid distribution networks. These characteristics distinguish it from other commodities, but they also increase the vulnerability of its supply chain to local as well as systemic disruptions. Of particular importance is the fact that, unlike cereals or processed foods, fresh produce depends on cold chains and, thus, has little buffer time, which means its trade is more affected by even minor delays or disruptions.
At the same time, the structure of the global trade in produce is growing in complexity. Studies from the past decade have mentioned that it displays scale-free and small-world topologies [5,6], with concentrated flows amongst several hubs, such as the USA, the Netherlands, and China. Among these hubs, the USA stands out as a major consumer market equivalent to a gravitational center, a status quo that increases the systemic stakes of any unilateral disruption originating there.
Still, there is also a growing role of intermediary countries that may redistribute flows across trade corridors to enhance connectivity [7]. These additions, however, increase the network’s complexity, which may make it more efficient but also increase the associated risks and creates fragility. This is also due to the fact that chokepoints and central nodes can propagate shocks rapidly across the network and expose downstream actors to cascading effects [7,8,9]. Although the perception of risk events as siloed makes them easier to handle, particularly in research, the interconnection of risks (as has also been considered by the World Economic Forum in its yearly Global Risks Reports) is becoming ever more relevant, as the result is often non-linear amplification, generating disruptions that exceed the sum of their parts.
The fragility of the structure adds to the fragility of the produce, affected mainly by climate change, water availability, and increased postharvest spoilage [10]. But there are other types of risks to take into consideration, from crop diseases to price surges due to export bans or tariffs, nutrient loss, and geopolitical tensions (such as the war in Ukraine) impacting trade and exposing import-reliant regions like sub-Saharan Africa to critical supply shocks. All these disruptions, many as they may be, are exacerbated by the scale-free, core–periphery nature of global fresh produce networks, in which just a few central hubs handle disproportionately high volumes of trade. Most analytical models isolate these risks, focusing only on one at a time, and often fail to capture the compound effects and flow-sensitive risks which are so relevant for this type of commodity.
Although the literature on the topic is substantial and growing, most studies focus either on cereals (wheat and maize) or food in general and predominantly employ single-risk modeling [9,11,12]. Very few analyses provide integrated multi-risk models, and even fewer are based on fresh produce, which highlights a lack of hybrid modeling frameworks that integrate trade flow forecasting (via gravity models) with the network-based mapping of the structural and dynamic vulnerabilities for this particular type of commodity.
In this context, this paper aims to fill this literature gap by proposing a hybrid model meant to answer this research question:
“Using a hybrid approach (integrating various methodologies), what structural vulnerabilities and flow-based sensitivities define the global fresh produce trade, and how do they respond to simulated multi-risk disruptions, including climate volatility and policy shocks?”
The model will, thus, (a) map structural vulnerabilities in the global fresh produce trade, (b) analyze flow-based sensitivities under compound, systemic shocks, and (c) simulate responses to multi-risk scenarios.
Theoretically, this study advances trade modeling by linking it to a risk assessment that econometrically captures both the structural and dynamic dimensions of trade risk. Empirically, this study provides a perspective on fresh produce, which, in turn, may equip policymakers with insights relevant to potential mitigations of country-specific risks, enhancements of food system resilience, and/or trade diversification. If food system resilience is often referred to in logistical terms, in this study, we consider it from a broader sustainability perspective, considering environmental (waste and spillage), social (access to nutritious food), and economic (cost and market stability) aspects. To conclude, the study integrates typological, network-based, and econometric perspectives to assess structural and dynamic vulnerabilities in the global fresh produce trade system, framing them as potentially eroding factors for sustainability.
This paper contributes to the current knowledge pool on the topic by adding at least six new elements, which can be clustered into two categories:
- -
- Academic contributions, mainly enhancing the theoretical understanding of the agri-food trade’s fragility under compound risks:
- ○
- A triangulated hybrid model that integrates typological risk mapping, network analysis, and gravity-based simulation, tailored to the fresh produce trade;
- ○
- New empirical insights into core–periphery vulnerabilities and risk propagation patterns;
- ○
- A multi-risk simulation specifically applied to fresh produce trade flows;
- ○
- A systematic literature-based risk typology matrix.
- -
- Policy contributions:
- ○
- The identification of structural trade hubs and critical vulnerabilities linked to perishability and flow sensitivity within global supply networks;
- ○
- Scenario-based insights based on the current case of escalating trade and climate disruptions.
Although the three-pronged approach to the topic (through typological mapping, network analysis, and gravity-based simulation) may appear too complex in the beginning, the three angles serve a single, coherent research question. They yield more impactful insights together than in isolation and reflect the fact that the complex and vulnerable structure of the fresh produce trade cannot be grasped in its intricacy using a single method. Addressing this topic from only one perspective, although it may reduce the length of this research paper, would risk oversimplifying its structural and systemic vulnerabilities.
To address the central research question, this paper is structured in a linear manner, with Section 2 presenting the hybrid model methodology and data sources, Section 3 reviewing the relevant literature to inform a typological risk mapping, Section 4 detailing the results for the hybrid model, and, lastly, Section 5 concluding the study, including sustainability, resilience, and governance implications and directions for future work.
2. Materials and Methods
As the search term “fresh produce trade vulnerability” yielded more than 338,000 results on Google Scholar (as of March 2025) and “fresh produce trade network vulnerability” returned roughly 226,000, of which 14,700 articles were published in the last 5 years, the development of a multi-risk framework required both the use of a systematic search and screening protocol and multiple methodologies to ensure both methodological rigor and comprehensive coverage.
Based on this, this study used a three-pronged approach to capture the unique structural and flow-based vulnerabilities of the global fresh produce trade system by integrating (a) a typological risk mapping of structural vulnerabilities, (b) a network analysis of trade structure and flow sensitivities, and (c) a gravity-based trade simulation model under multi-risk disruption scenarios. This triangulated approach ensured the proper (both descriptive and predictive) identification of systemic chokepoints, a suitable quantification of the flow sensitivity, and the ability to simulate the potential impacts of compounding events, leading to a clearer image of how trade shocks may reverberate through the global fresh produce system.
2.1. The Methodology for the Literature-Informed Typological Risk Mapping
The first step was a literature-informed typological risk mapping. This method is used increasingly in research pertaining to agri-food systems due to its ability to enhance the interpretability of network-based models [see studies using similar methodological approaches in [13,14,15,16,17]. This step consisted of a systematic review of the literature on the topic, from which relevant disruptions were extracted and coded for the global food network and, more specifically, for the fresh produce trade. The resulting typology was not an end in itself. This step acted as a filter for identifying relevant compound risks to be modeled and tested in the simulation step.
Through referring to previous work [9], we grouped risks into three categories:
- Climate-related risks (e.g., heat stress, water scarcity, postharvest spoilage);
- Policy shocks (e.g., export bans, SPS restrictions, tariff volatility);
- Geopolitical disruptions (e.g., conflict-induced route closures, trade embargoes).
For this, between February and March 2025, we retrieved a set of 500 articles and expert reports from various databases (Scopus, Semantic Scholar, and other sources: the FAO, WTO, USDA) using hybrid keyword strings (e.g., “fresh produce trade AND network analysis”, “gravity model AND agricultural shocks”, “food trade resilience AND climate change”), starting with the research question. We included studies based on their relevance to the international fresh produce trade, application of gravity or network models, and coverage of climate, policy, or geopolitical disruptions and excluded those focused solely on domestic trade or non-agricultural commodities, and the screening questions, examining the research holistically, were the following:
- Does the study analyze international (rather than purely domestic) trade networks of agricultural products or fresh produce?
- Is the primary focus on agricultural/fresh produce supply chains?
- Does it include the analysis of fresh/unprocessed agricultural products?
- Does it employ gravity models and/or network analysis methods with the potential for integrated analysis?
- Does it include quantitative analysis rather than purely descriptive analysis?
- Does it refer to at least one of the following risks: climate change, trade policy, or geopolitical events?
The final selection of 150 papers related to global food trade issues and 40 related to the fresh produce trade covered various methodological approaches and included both theoretical and empirical contributions, mapping the state of the art and highlighting critical gaps motivating the hybrid gravity–network model proposed in this paper. Only those studies explicitly referenced in this paper are included in the list of references, and a list of reviewed supplementary papers is found in Appendix A.
To create a risk typology matrix, these risks were cross-tabulated against known sensitivity indicators, such as the import dependence, supply concentration, perishability, and cold chain reliance, to investigate multi-risk exposure. The matrix built upon a methodology from the cybersecurity field, the vulnerability prioritization framework [18].
2.2. The Methodology for the Network Analysis and Gephi Visualizations
The second step was focused on identifying the structural topology of the global fresh produce trade and used a network based on 2024 bilateral trade data from UN Comtrade, using HS-4-level product codes corresponding to fresh fruit and vegetable categories. Nodes represented countries; edges represented the trade volumes in USD. The network was visualized using Gephi ver. 0.10.1, and specific filtering methods and algorithms were applied to identify core–periphery structures. The hypothesis was that, consistent with the literature [6,8], the network would exhibit scale-free and small-world properties. This method is widely used in the identification of agri-food trade vulnerabilities [19,20]. The aim of this step was not to run a formal network simulation but to understand how the architecture of trade, particularly the structural centrality of major trade hubs, sets the stage for vulnerability, especially in a multi-risk context (paired with a permacrisis background).
The methods we used for this purpose were the following:
- A visualization of the structural typology for the global fresh produce trade using Gephi and 2024 bilateral trade data from UN Comtrade, using HS-4-level product codes corresponding to fresh fruit and vegetable categories. The results from this are presented in Section 4.1.
- A gravity model, stress-tested with a compounded risk made up of a climate event + a trade policy shock. The results from this are presented in Section 4.2.
The results obtained using the two methods informed a discussion on the impact on sustainability and the interconnection between this topic and the systemic risks (see Section 5) across three dimensions: (i) the environmental (e.g., increased emissions and food waste); (ii) economic (e.g., price volatility, supply instability); and (iii) social (e.g., reduced access to affordable, nutritious food) dimensions.
To properly use the Gephi visualization software, data related to the fresh produce trade had to be collected for 2024 from UN Comtrade using HS-4-level product codes corresponding to fresh fruit and vegetable categories, as follows:
- Vegetables (fresh): the entire HS 0701 to 0709 range.
- Fruits (fresh): the entire HS 0803 to 0811 range (nuts were excluded).
For analytical tractability, we limited the dataset to the top 20 exporters and top 20 importers of fresh produce and all its categories (vegetables and fruits, HS4 level), as ranked by their total FOB trade value in 2024. We removed duplicates from the list of 40 and added China and Mexico. Thus, we included the following countries:
- For vegetables, there were 25 countries: Argentina, Australia, Belgium, Brazil, Canada, Czechia, Denmark, Germany, Ireland, Italy, Japan, Malaysia, Myanmar, the Netherlands, Poland, Portugal, Spain, Sweden, Switzerland, Thailand, Türkiye, the United Kingdom, the USA, and Uzbekistan, plus the People’s Republic of China and Mexico.
- For fruits, there were 29 countries: Argentina, Australia, Azerbaijan, Belgium, Brazil, Canada, Czechia, Denmark, Germany, Greece, Israel, Italy, Japan, Malaysia, the Netherlands, New Zealand, Norway, Poland, Portugal, South Africa, Spain, Sweden, Switzerland, Thailand, Türkiye, the United Kingdom, the USA, and Uzbekistan, plus the People’s Republic of China and Mexico.
The Gephi visualizations were thus built based on data at the HS-4 level for the following 32 countries: Argentina, Australia, Azerbaijan, Belgium, Brazil, Canada, China, Czechia, Denmark, Germany, Greece, Ireland, Israel, Italy, Japan, Malaysia, Mexico, Myanmar, the Netherlands, New Zealand, Norway, Poland, Portugal, South Africa, Spain, Sweden, Switzerland, Thailand, Türkiye, the United Kingdom, the USA, and Uzbekistan.
The Gephi visualizations consisted of nodes and edges. The nodes were the countries involved, and the edges were directed trade relationships, represented by the trade volume (FOB value for exports and CIF value for imports). The larger the node, the bigger the importance of that particular country in the analyzed trade. This means that larger nodes indicated countries with a more central role or higher total trade volumes, either as major exporters, importers, or both. The edge thickness reflected the strength of bilateral trade flows between countries, with thicker edges indicating higher trade values. The thicker the edge, the larger the trade flow, allowing us to trace the dominant bilateral relationships. The node color represented the modularity class, which allowed us to detect communities. Each color showed a cluster of countries that traded more intensely among themselves than with others.
2.3. The Methodology for the Gravity-Based Simulation
The third step was the development of a gravity model of trade flows meant to assess the flow-based sensitivity of the global fresh produce trade. It was of particular importance in this step to stress that fresh produce markets, due to fresh produce’s perishability and trade concentration, are particularly sensitive to cost changes.
To stress-test the network, we used a scenario based on a single exogenous policy shock which evaluated the ripple effects of a major policy intervention by a central actor, more specifically, a 10% across-the-board tariff imposed by the United States of America on all fresh produce imports, increased to 25% for shipments from Mexico and Canada. The scenario was based on the real baseline tariff imposed by President Donald Trump on 2 April 2025, and it encapsulated a plausible geopolitical and protectionist policy shock with global systemic ramifications, mainly due to the central role of the country in global produce flows. This central role had already been indicated in the two previous steps. This trade shock (which built on the work of [21] based on the measures from the first Trump administration) was treated both as a standalone disruption and in a compound scenario alongside climate-related production losses. The simulation used a modified gravity model, with trade volume responses estimated using elasticity values [21], treated as heuristic parameters, not calibration outputs.
For this, we estimated a basic log-linear gravity model using the following equation:
where
ln(T_iUS) = b0 + b1*ln(GDP_i) + b2*ln(Distance_iUS) + b3*Border_iUS + b4*Tariff_iUS + b5*SPS_iUS + e_iUS
- -
- T_iUS: The value of fresh produce exports from country i to the United States. Data source: UN Comtrade (HS 07–08, USA imports only).
- -
- GDP_i: The Gross Domestic Product of the exporter. Data source: World Bank WDI.
- -
- Distance_iUS: The geographic distance between country i and the USA. Data source: CEPII GeoDist (to the U.S. only).
- -
- Border_iUS: A dummy variable indicating a shared border. Manual: 1 for Mexico and Canada; 0 otherwise.
- -
- Tariff_iUS: An applied ad valorem tariff rate on fresh produce exports from country i to the US. Data source: MacMap (to the U.S., HS6).
- -
- SPS_iUS: A dummy variable for the presence of non-tariff SPS measures that constrain the trade in perishables (1 = SPS restriction in place; 0 = otherwise). Data source: the WTO SPS IMS database.
- -
- b1–b5: Estimated coefficients.
- -
- e_iUS: An error term.
The data were collected for 2024 to eliminate the shock effects of the pandemic and the war in Ukraine, both extremely significant events in the agri-food trade as exhibited in the literature. The simulation used a modified gravity model, with trade volume responses estimated using elasticity values [21], treated as heuristic parameters, not calibration outputs. The simulation of the 10% across-the-board tariff imposed by the United States used the following method:
- We assumed baseline trade values. For this, we estimated a basic log-linear gravity model following Equation (3) and calculated baseline trade values corresponding to the exponentiated results of the log-linear equation.
- We assumed the elasticity of the trade to tariff shocks to be −0.95 [21]:
- ○
- The baseline elasticity values used ranged from −0.8 to −1.2, depending on the commodity and source country, with the demand-side price sensitivity assumed to remain constant across scenarios.
- ○
- The chosen value aligned with that in [21] and other empirical simulations assessing the impact of U.S. import demand shifts. This held in particular for Latin American exporters.
- ○
- The elasticity was applied as a heuristic parameter, imposed based on credible external research. Thus, it allowed us to simulate policy scenarios based on plausible behavioral responses.
- The model output a predicted reduction in trade volumes and identified the most affected exporters.
- We presumed no retaliatory measures from the exporters:
- ○
- This may have simplified the analysis and isolated the sensitivity to U.S. tariff shocks.
- ○
- However, it was in line with current (as of April 2025) exporter behavior looking to reduce the probability of a global trade war.
- ○
- In a theoretical context, though, this assumption may have underestimated the systemic feedback loops in a real-world geopolitical scenario, as has been the case with China, for instance.
- ○
- This also represents a direction for future research.
- We revised the trade flows following this equation:
T^_{iUS}^{tariff} = T_{iUS}^{baseline} × (1 + Δτ_{iUS})^ε,
- -
- T^_{iUS}^{tariff} is the adjusted trade volume after the tariff shock;
- -
- T_{iUS}^{baseline} is the predicted trade flow from the gravity model (from Equation (1));
- -
- Δτ_{iUS} is the change in the tariff rate (e.g., from 0% to 10% or 25%);
- -
- ε is the price elasticity of the trade (e.g., −0.95).
The reason for choosing this third step of the methodology resided in the fact that gravity models are a traditional method in policy analysis and have proven effective in modeling tariff effects [22]. Moreover, the scenario design allowed for basic sensitivity testing and showed whether trade volumes declined linearly or exponentially under dual-stress conditions.
Lastly, building on these three steps, in the final analytical step, we linked these potential shocks to sustainability impacts across three dimensions: (a) the environmental (e.g., increased emissions and food waste); (b) economic (e.g., price volatility, supply instability); and (c) social (e.g., reduced access to affordable, nutritious food) dimensions. These impacts were qualitatively assessed and, where applicable, supported by secondary data estimates, in view of highlighting where systemic shocks may erode long-term sustainability in disproportionate ways.
3. Understanding Fresh Produce Trade Networks: A Critical Literature Review
Based on the entire corpus of 150 papers on global food trade networks, we identified three thematic clusters, (1) structural vulnerabilities in global produce networks, (2) flow-based sensitivities to systemic risk, and (3) adaptive capacities and resilience mechanisms, moving in a linear way from why some countries and flows are at risk to how disruptions impact them and to what can be done about it. A conceptual synthesis of these clusters is presented in Figure 1. While they emerged from the broader literature on global food trade networks, they are still relevant for fresh produce, given its sensitivity to disruption and dependence on concentrated trade flows. Basically, we inferred that fresh produce networks are more fragile versions of larger global food trade systems.
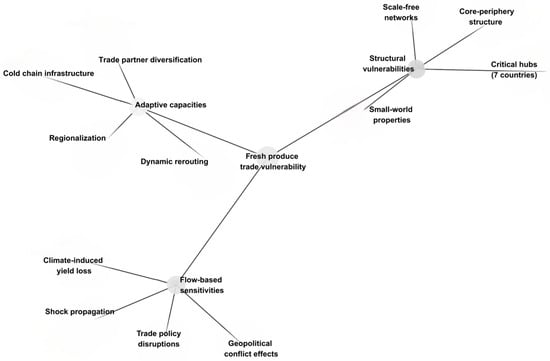
Figure 1.
Conceptual clusters adapted from the global food trade literature, applied to fresh produce.
The first thematic cluster refers to the structural risks related to global food and fresh produce trade networks, more specifically derived from their core–periphery topology. A detailed insight mapping may be found in Table 1 and Table 2. The findings reflect that in the context of this particular commodity, a few central exporters act as systemic hubs, and numerous others function as peripheral, import-reliant nations. Seven entities (countries and supranational economic unions) form the core of the International Food Trade Network. They collectively engage with over 77% of global trade partners and account for nearly a third of the trade volume [6], a status quo that has held for more than a decade.

Table 1.
Structural vulnerabilities in global food trade networks.
These hub-and-spoke networks exhibit scale-free and small-world properties, meant to enhance efficiency (provided the conditions are stable) with short average path lengths, high clustering, and power law distributions of the trade flow [20]. The same characteristics also become risk factors and intensify fragility under systemic stress. This fragility may be quantified by using network metrics, such as the network density (which [32] found to reflect limited redundancy), clustering coefficients (moderate, as per [32]), or chokepoints and exposure pathways [31]. These metrics may also inform sub-national and regional insights, such as in the case of identifying bridging countries that connect modular trade regions [34]. Along the same lines, studies have also highlighted that community clustering can either buffer or amplify shocks, depending on the geographic configuration and the commodity in question [29].
The core–periphery topology as a structural vulnerability is based on asymmetric dependencies between exporting and importing countries. Regions such as sub-Saharan Africa and the Middle East rely heavily on a narrow set of suppliers, having an increased sensitivity to even modest trade flow perturbations [11,43]. This systemic exposure has intensified with the pandemic-era trade dynamics [25]. It is to be noted that both these regions are also affected by significant geopolitical risks not directly related to food networks, and hence, this (latent) risk factor may rapidly trigger cascading failures under compound disruptions.
Even if the referenced studies referred to the entire food network, the structural traits hold for fresh produce, with a certain number of distinctive vulnerabilities being applied solely to it. These are mapped in Table 2. Their investigation started with the foundational studies of [45,46], which modeled the effects of spoilage and inventory decay and showed that perishability is a systemic constraint on trade flow flexibility. Reference [47] showed that fresh produce is more infrastructure-dependent than most dry goods by simulating logistics networks where temperature control and cold chain reliability are essential for system resilience. Adding to the landscape are regional trade agreements (such as the NAFTA or the Chinese–Myanmar melon link) that shape the topology and path dependence of produce exports through a linkage of structural trade flows and regulatory frameworks [48]. Lastly, work such as [49] has shown that regions like the U.S. Southwest are structurally exposed to risk due to water-intensive production under climatic stress, highlighting the position of fresh produce within the broader Food–Energy–Water (FEW) nexus.
Table 2.
Structural vulnerabilities in global fresh produce trade networks.
Table 2.
Structural vulnerabilities in global fresh produce trade networks.
| Structural Element | Empirical Evidence/Metrics | Key Interpretation | Implications for Vulnerability | Key Studies Referenced |
|---|---|---|---|---|
| Cold chain dependency | Cold chain failures account for up to 30% of postharvest losses in perishables (especially fruits and leafy greens). | High reliance on temperature-controlled logistics. | Breakdowns cause large-scale spoilage and supply loss. | [50,51,52] |
| Postharvest decay and perishability | Spoilage rates are exponentially time-sensitive, with up to 40% loss within 3–5 days if not refrigerated or delayed in transit. | Perishability acts as hard constraint on trade flexibility. | Supply chain rigidities amplify effects of shocks. | [45,46,51] |
| Climate exposure in yield zones | Berry and lettuce production show strong correlation with climate volatility. Yield drops by 10–15% under high-heat or drought conditions. | Climate-sensitive crops cluster in vulnerable geographies. | Climate volatility disrupts both production and flow stability. | [49,53] |
| Regional trade dependencies | The U.S. imports ~70% of its fresh vegetables from Mexico and 25% of its fresh fruit from Mexico and Chile. | A highly asymmetric dependency on a few partners. | Exposure to bilateral shocks and seasonal bottlenecks. | [54,55] |
| Seasonality and NAFTA corridors | Fresh produce trade shows seasonal surges tied to trade agreements like NAFTA. Regulatory shifts cause disproportionate seasonal impact. | Seasonality and path dependency increase systemic sensitivity. | Disruptions coincide with peak demand, increasing systemic fragility. | [48,52,53] |
| Homogenization of supply sources | The export concentration in a few hubs (e.g., Mexico, Chile) has intensified since 2000, especially for off-season produce like berries, peppers, and tomatoes. | Trade centralization reduces adaptive capacity. | Risk of synchronized disruption and limited substitution options. | [49,50,55] |
In a nutshell, similarly to the global food network, the fresh produce supply chain is fragilized by an unbalanced supply and demand, transport bottlenecks, and seasonal cycles [56]. Certain countries, despite being hubs, rely heavily on imports for certain produce (for instance, China and soybeans), thus becoming vulnerable to trade disruptions like tariffs and other types of trade frictions and policy changes [28,57,58]. Lastly, the governance structure of the value chain in some regions (see the Myanmar–China melon trade in which brokers control the chain instead of retailers [48]) significantly affects the risk–reward distribution and may possibly inhibit upgrades and technological innovation and, consequently, increase risk.
If the first thematic cluster allowed for the identification of high-risk nodes and flows, which were further assessed in the network modeling phase of the hybrid framework, the second thematic cluster demonstrated the link between flow-based sensitivities and systemic risk. The former refers to how external shocks, such as climate events, geopolitical instability, or policy shifts, affect the movement of fresh produce across global supply chains. A detailed insight mapping may be found in Table 3.
Table 3.
Flow-based sensitivities in fresh produce trade networks.
In the literature, the most interest is given to climate change and how climate-induced yield loss poses a major disruption risk for the trade in fresh vegetables and fruits. This is mainly true for vulnerable production zones like the U.S. Southwest, northern China, and parts of sub-Saharan Africa [59,60]. The second largest impact comes from trade policy disruptions (for instance, Brexit or the emergence of other trade regimes, like the AfCFTA) [61,62], which cause reductions in flow volumes of up to 30%, hence highlighting the high sensitivity of the fresh produce trade to regulatory volatility. This is the main reason why the simulation scenario we tested the network on involved a combination of both these risks. Particular attention must be given to the importance of shock propagation beyond isolated shocks, causing a non-linear cascading impact of dual disruptions (such as climate change + tariffs), which is even more significant for time-sensitive perishables [64,65].
Other elements mentioned in the literature included the role of geopolitical conflicts (such as the Ukraine war) in connection with transport bottlenecks and limited dual-channel flexibility as risk amplifiers and the lack of mitigation measures such as rerouting alternatives due to rigid logistics [40] or substitution being less agile than that for non-perishable commodities [69,70]. Another significant trigger linked to adaptive innovation was the COVID-19 pandemic [69,72,74]. Lastly, other underlying environmental constraints (such as water stress, which arguably may be lumped in with the broader climate change risks), demand stochasticity, and seasonal factors contribute to systemic fragility [48,60,74,76].
The third and last thematic cluster related to the adaptive capacity of fresh produce networks. If previous clusters related to why some countries (or flows) are at risk and how disruptions impact them, this last cluster related to what can be done about it by mapping the strategic responses and resilience-enhancing mechanisms identified in the literature on the fresh produce trade. Five main strategies were identified, with four others being secondary mitigation mechanisms: the enhancement of cold chain infrastructure, trade partner diversification, regionalization, dynamic rerouting, and the overall system responsiveness. As in the case of interconnected risks, these “solutions” are often discussed in conjunction as interdependent elements that may help reduce the sensitivity to disruptions. An example in respect to this comes from the robustness of the cold chain, which is a prerequisite for employing rerouting as a mitigation measure [51,52] but which also hinges on the logistical and contractual flexibility of suppliers [61,66]. Another potential mitigator is regionalization by shifting the trade dependency to neighbors (geographically proximate) [49,57,60]. This was yet another reason to test the resulting framework using the USA case, as the USA functioned more or less under this logic but decided to go against the flow and tax its neighbors more. The mapped insights for this thematic cluster are presented in Table 4, which shows a structured synthesis of resilience building in perishable commodity systems.
Table 4.
Adaptive capacity in fresh produce trade networks.
The three clusters often were analyzed using diverse methodologies, but often in a siloed manner, by referring to a geographical area or to a type of constraint or using a certain research method. However, there have also been studies that have addressed them in a more holistic manner. For instance, ref. [83] developed a synthetic modeling framework to simulate commodity flows under compound stress scenarios and linked, albeit with limited empirical validation, structural bottlenecks to systemic disruptions. Similarly, ref. [84] proposed a multi-objective optimization model that captured the trade-offs between environmental constraints and food availability, which was limited by its theoretical framing of data-constrained contexts. The adaptive capacity (mentioned in thematic cluster 3) may be advanced through technological implementation with, for example, AI-based risk prediction tools tailored to green logistics [85], but its effects are still to be proven in reality. Similarly, institutional arrangements and smallholder configurations were proven, albeit qualitatively, by [86] to shape both the systemic fragility and adaptive potential and, thus, contributed to thematic clusters 1 and 3. Finally, thematic cluster 2 was enhanced by the work of [87], who highlighted the compounding effect of social and environmental risks in China. Our study enriches this landscape of interconnectedness and provides a multi-risk view of the plethora of complexly linked pain points described previously.
The development of the thematic clusters was foundational work for the creation of a risk typology map, required for filtering the relevant compound risks to be modeled and tested in the simulation step. By referring to previous work [9], we grouped risks into three categories:
- Climate-related risks (e.g., heat stress, water scarcity, postharvest spoilage);
- Policy shocks (e.g., export bans, SPS restrictions, tariff volatility);
- Geopolitical disruptions (e.g., conflict-induced route closures, trade embargoes).
We cross-tabulated them against several sensitivity indicators, as follows:
- Four core indicators: the import dependence, supply concentration, perishability, and cold chain reliance;
- Five additional indicators (relevant for the case chosen to stress-test the framework, the USA): regulatory exposure [48,50,53], contamination sensitivity [2,47,48], labor fragility [49,69,72], demand volatility [48,54,59], and transport system reliance [47,49,54].
The resulting risk typology matrix, developed using a simplified version of the vulnerability prioritization framework [18], is detailed in Table 5 and visually represented in Figure 2.
Table 5.
Risk typology matrix: fresh produce trade.
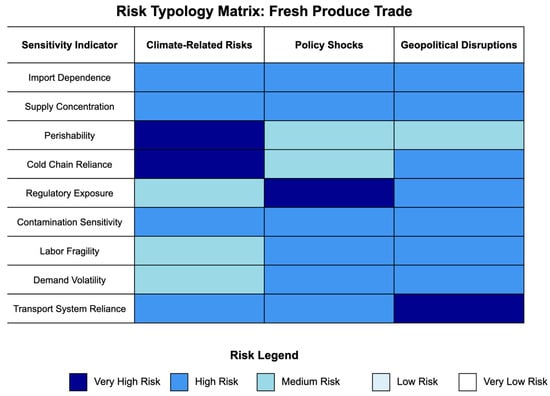
Figure 2.
A visual representation of the risk typology matrix for the fresh produce trade.
From the risk typology and based on the literature, we derived a rudimentary risk matrix (see Figure 3), connecting the probability with the impact at a global level. This risk matrix is highly general, as it must be adjusted for each country and region as well as each type of produce. However, it depicts a dire situation in which even siloed risks are significant and the potential of them functioning in conjunction and, hence, leading to cascading effects is rather large, as evidenced in the previously discussed thematic clusters.
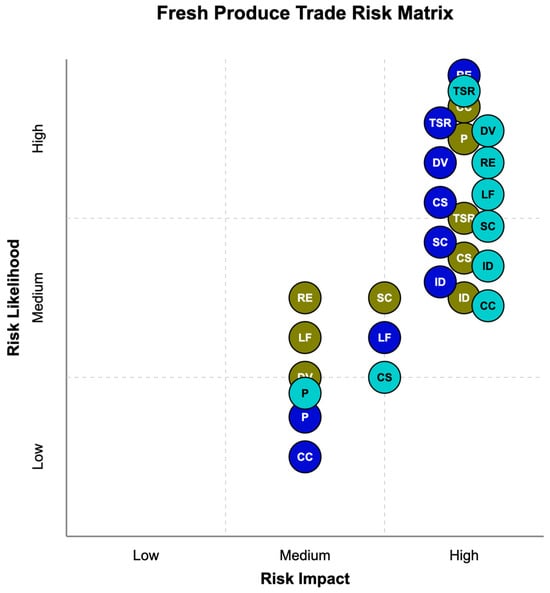
Figure 3.
A rudimentary version of a literature-informed risk matrix for the fresh produce trade.
Legend for the figure: climate-related risks—olive (color code: #808000); policy shocks—blue (color code: #0000CD); geopolitical disruptions—cyan (greenish blue; color code: #00CCCC). ID—import dependence; SC—supply concentration; P—perishability; CC—cold chain reliance; RE—regulatory exposure; CS—contamination sensitivity; LF—labor fragility; DV—demand volatility; and TSR—transport system reliance.
This first methodological insight, derived from the typological risk mapping, tells us what and how, leading to the next two questions: where and how much.
4. Results
Building on the findings from the previous section (a), we moved towards proposing a multi-risk management approach that would allow us to (b) analyze the flow-based sensitivities under compound, systemic shocks and (c) simulate responses to multi-risk scenarios.
4.1. The Structural Typology of the Global Fresh Produce Trade—Network Analysis Results
First, using Gephi, we analyzed the situation for the 32 countries for vegetables. The initial visualization included 229 nodes and 1751 edges. As the initial visualization had too much noise, first, we filtered out the edges (bilateral trade) lower than USD 1 million to allow for a focus on structurally significant relationships. This resulted in 163 nodes and 662 edges. We ran a modularity report to identify communities using the Gephi-suggested algorithm [88], and we implemented the Yifan Hu graph drawing method [89] to generate the graph shown in Figure 4.
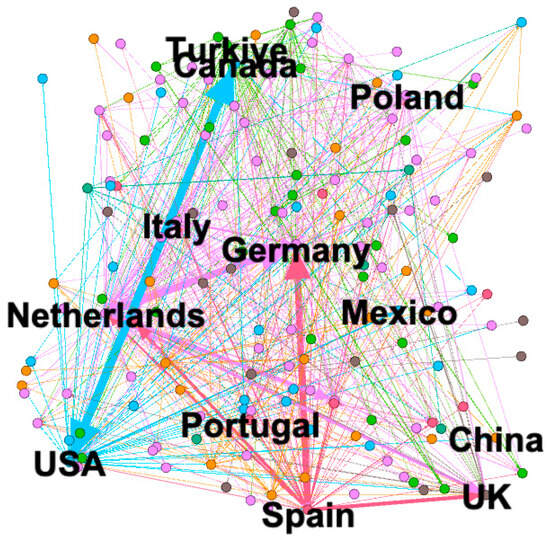
Figure 4.
Global trade network of fresh vegetables (HS07) based on FOB values (2024). Note: Node size reflects total trade volume for each country; larger nodes are more central exporters or importers. Edge thickness denotes strength of bilateral trade flows, and colors indicate modularity clusters (regions with stronger internal trade ties).
As can be noticed from the figure, key actors in the vegetable trade are the USA, Germany, Spain, and the Netherlands, with the USA–Mexico and Spain–Germany representing a large trade flow. The pink cluster was Europe-centric (e.g., Spain, Portugal, Italy, the Netherlands), the blue cluster was the North American trade block (e.g., the USA, Canada, Mexico), and the other colors, like green and orange, represented other regional or structural clusters. Other insights derived from the visualization included the following:
- The USA is most likely the largest fresh vegetable importer and is connected to multiple clusters;
- Spain and the Netherlands may act as re-export hubs in Europe;
- Mexico, Türkiye, and Poland showed up as being likely to be strong regional suppliers;
- Germany appeared as a central node with a high intensity of imports from southern Europe.
We implemented the same algorithm to generate the graph for fruits shown in Figure 5. It initially contained 230 nodes and 2324 edges. After filtering to ensure trade flows of larger than USD 1 million, the number of nodes was 171, and the number of edges was 929.
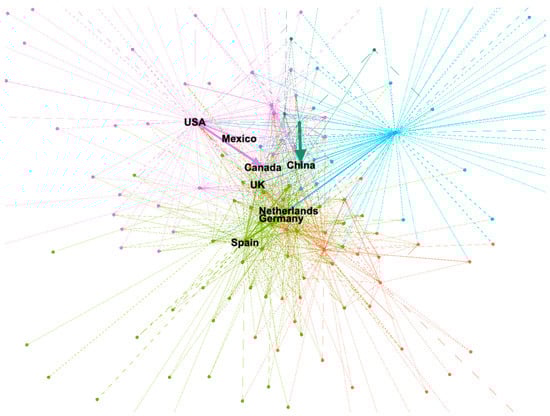
Figure 5.
Global trade network of fresh fruits (HS08) based on FOB values (2024). Note: Node size reflects total trade volume for each country; larger nodes are more central exporters or importers. Edge thickness denotes strength of bilateral trade flows, and colors indicate modularity clusters (regions with stronger internal trade ties).
The graph shows the following:
- The USA, Germany, the Netherlands, and Spain are highly key connected players;
- Some countries (like Mexico and Canada) serve as bridge nodes between clusters, and they are structurally significant even if smaller in size;
- Trade is not random but regionally or geopolitically clustered, as shown by the clear community structures (unlike the vegetable trade, shown in Figure 4);
- More central nodes (like Germany or the Netherlands) have many high-volume connections and are likely hubs;
- Peripheral nodes are either low-volume traders or specialized exporters/importers with limited partners;
- The green cluster indicates a strong intra-European or EU-centric fruit trade (including Germany, the Netherlands, and Spain);
- The purple cluster (which includes the USA) shows a different group of high-volume bilateral links (esp. with Mexico and Canada).
By analyzing the two images comparatively, it is easily noticeable that the fruit network is more radially structured and centralized (visible hub-and-spoke structure) around countries like the USA, Spain, and the Netherlands. In contrast, the vegetable network is denser and more interconnected, suggesting a more multipolar system. It has overlapping clusters and shorter path lengths, which may mean it is more regionally connected via medium-sized hubs such as Germany, Poland, or Türkiye. While the fruit network highlights sharper regional segmentation, the vegetable network indicates a more globalized, interwoven flow. The reasons for these significant differences may reside in perishability profiles, regional production specialization, or tariff/non-tariff trade dynamics.
To present a clearer image of the situation for fresh produce (considering both vegetables and fruits), we ran the algorithm again for the aggregate data, resulting in the map shown in Figure 6. After filtering to ensure initial values for both the vegetable and fruit trades of above USD 1 million, the network presented 170 nodes and 1003 edges.
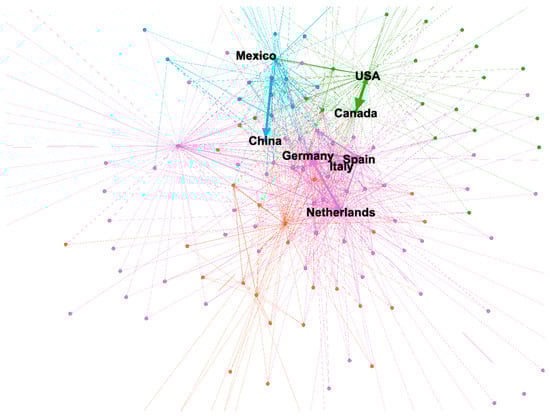
Figure 6.
Global trade network of fresh produce (fruits and vegetables) (HS07 and HS08) based on FOB values (2024). Note: Node size reflects total trade volume for each country; larger nodes are more central exporters or importers. Edge thickness denotes strength of bilateral trade flows, and colors indicate modularity clusters (regions with stronger internal trade ties).
The purple and orange communities represent areas with high intraregional trade: Europe and South America. The green nodes are Southeast Asian and Oceanian countries with niche roles but less connectivity. The clear radial structures indicate dependency for smaller nodes which rely heavily on one or two hubs.
It is easily noticeable that there are several core hubs: the Netherlands, Spain, Germany, and Italy, made up of exporting powers (Spain and the Netherlands) as well as importing and redistribution hubs (Germany, Italy). These hubs also act as cross-cluster bridges, linking different global communities. They are all part of the European Union.
Also noticeable is the North American cluster, in which the USA, Canada, and Mexico form a distinct modular North American community, supported by the USMCA trade agreement. Moreover, the USA acts as both an importer from and a significant intermediary for Latin America and Asia, as seen in its extended network.
Albeit close to the core, China has moderate connectivity, while it interacts with multiple communities (Europe, North America, Asia). This status quo reflects its diverse sourcing and export relationships.
In terms of the vulnerability of the networks, and, as a consequence, the risks associated with them, the following takeaways are relevant:
- The fruit network:
- ○
- The fruit network has a highly centralized hub-and-spoke structure centered around Spain, the Netherlands, and the USA. If any of these central nodes were disrupted (e.g., due to climate events, trade bans, or a logistics breakdown), entire communities would be cut off, especially those with few alternative partners.
- ○
- Many nodes rely heavily on a single or few connections, indicating less resilience to shocks. More precisely, if a key edge is removed, rerouting may not be possible without major costs or delays.
- ○
- The communities are segmented, showing less inter-community spillover. This is both a positive (as it is good for the contaiment of contamination and disease) and a negative (less flexibility), as a shock in one module may not be absorbed easily by others.
- ○
- All these aspects make the fruit network rather fragile.
- The vegetable network:
- ○
- The vegetable network has more overlapping connections, equating to multiple trade routes and redundancies. This makes the network more adaptable when individual countries or links are disrupted.
- ○
- Trade appears to be more distributed across several medium-sized hubs (Germany, Poland, Türkiye), rather than over-reliant on one node. This reduces systemic fragility. Moreover, most of these hubs are in the EU, so policy shocks are less probable.
- ○
- There is more entanglement in the visualization, meaning there is greater interdependence, which may prove beneficial for rapid rerouting and resilience.
- ○
- All these aspects make the vegetable network more robust (at least in comparison to the fruit network).
- The aggregated fresh produce network:
- ○
- The aggregated fresh produce network has moderate redundancy and therefore increased resilience.
- ○
- Overall, the central nodes (the Netherlands, Spain, the USA) are single points of failure. Disruption in them could cascade across clusters.
- ○
- Geographic clustering is evident: countries mostly trade within regional blocs, but key global intermediaries link these blocs and act as both facilitators and bottlenecks/chokepoints.
- ○
- The existence of many peripheral nodes highlights the limited integration of some producers or importers in global flows.
- ○
- The network is globally integrated but asymmetrically dependent on key hubs, amongst which is the USA.
- ○
- Its resilience is uneven—some regions are very well-connected and more robust, with the potential for rerouting, while others rely on a few bridges.
The findings obtained using this method served as a foundation, alongside the literature-informed typological risk mapping, for the simulation of compound risks based on a gravity model, described in the following section. They underscore the crucial role the United States of America plays in the fresh produce landscape and, thus, the risk associated with this particular country throughout the entire network.
4.2. The Results of the Simulation of a Compound Risk Based on a Gravity Model
4.2.1. “The Gravity Model”—Baseline Gravity Model Results
The first step prior to constructing the simulation was the development of the gravity model, according to the methodology.
The following data were collected:
- T_iUS: The value of fresh produce exports from country i to the United States. Data source: UN Comtrade (HS 07–08, USA imports only).
- GDP_i: The Gross Domestic Product of the exporter. Data source: World Bank WDI.
- Distance_iUS: The geographic distance between country i and the USA. Data source: CEPII GeoDist (to the U.S. only).
- Border_iUS: A dummy variable indicating a shared border. Manual: 1 for Mexico and Canada; 0 otherwise.
- Tariff_iUS: The applied ad valorem tariff rate on fresh produce exports from country i to the US. Data source: MacMap (to the U.S., HS6).
- SPS_iUS: A dummy variable for the presence of non-tariff SPS measures that constrain the trade in perishables (1 = SPS restriction in place; 0 = otherwise). Data source: the WTO SPS IMS database.
We collected UN Comtrade data for 2024 related to the fresh produce trade and more precisely to US imports. The data were HS-4-level product codes corresponding to fresh fruit and vegetable categories, as follows:
- Vegetables (fresh): the entire HS 0701 to 0709 range.
- Fruits (fresh): the entire HS 0803 to 0811 range (nuts were excluded).
This data collection ensured comparability with the results in Section 4.1. The initial insights into the data showed the following:
- There are 50 countries from which the USA imports fresh produce.
- Only nine countries account for more than 1% of the total imports (see Table 6), and they are all in North and South America, proving the assertation about the regional focus of the US hub. They make up for 93.2% of the total imports of fresh produce by the US.
Table 6. Top sources for fresh produce imports in the USA in 2024.
The second variable was the GDP: data for 2024 were not available for all countries at the time of writing. As such, 2023 GDP values were used as proxies, assuming continuity in the economic output (except for New Caledonia, with 2022 data being the latest available). For three sources of fresh produce imports there were no available data for the GDP: Syria, Tonga, and other Asian countries (nes).
For the third variable, the distances, we use the weighted distance, population-adjusted with CEPII standard corrections, as it accounted for the distribution of the population across the country and reflected the actual economic geography.
For the fifth variable, tariffs, we relied on MAcMap-HS6 data for 2018 (sources: WITS and [90]). We used the Effectively Applied Rates, which reflect the actual tariff in force during trade, including preferences under trade agreements. This was the most realistic input for the model simulating tariff shocks. The data were for the USA as an importer with the list of analyzed countries as exporters for the year 2024. After data collection, a significant number of values were missing; therefore we used a simplified version, grouping countries as per US trade preferences and assigning tariff rate groups, extrapolated at the country level, as follows:
- USMCA countries (Mexico, Canada): 0%;
- GSP or bilateral FTAs (e.g., Chile, Peru, Colombia): 0–1% (avg);
- WTO MFNs (e.g., EU, China, India): 4.3%;
- Least Developed Countries (some of Africa, etc.): 0% or reduced due to the GSP;
- Others (fallback): 5%.
This approach both ensured methodological clarity, as the US trade policy is (often) applied through structured trade regimes (e.g., the USMCA, the GSP, MFNs), and allowed for WTO-compliant treatments. Moreover, as the gravity model simulated responses to relative price shifts, instead of pure regulatory texts, grouping the tariff rates permitted a reduction in the noise from marginal tariff differences without a significant behavioral impact. Lastly, differentiating between 0%, reduced, and MFN rates allowed us to account for the trade cost tiers that influence flows most, as per the literature cited in Section 3. Similar approaches are found in WTO impact assessments, GTAP-based models, and FAO trade resilience work and in research modeling general equilibrium shocks or climate–tariff compound risks [91,92,93].
This approach emphasized systemic vulnerability, which was the main goal of this study, instead of granular tariff precision. From a sustainability perspective, this simplified mechanism refocused the study on what matters most: the exposure to structural trade costs, not the prediction of the exact losses per country. This is in line with the extremely volatile trade environment as per April 2025 in the United States.
For the last variable in the gravity model, the SPS dummy variable, keeping in line with the focus on the overall vulnerability perspective, we created it heuristically (following recent practice in agri-trade modeling under data constraints, as in [84] or [94]) based on whether the exporting country was known to face explicit SPS restrictions or complex protocols for importing perishables into the U.S, as follows:
- Non-USMCA developing countries: SPS_iUS- = 1 if they exported fresh fruits/vegetables and were frequently flagged in USDA/APHIS alerts or required complex phytosanitary certification.
- LDCs or countries with emerging markets: SPS_iUS- = 1 if they were not covered by streamlined FTA phytosanitary frameworks.
- Others (EU, USMCA countries, Chile, etc.): SPS_iUS = 0 if they employed harmonized or aligned SPS standards.
The SPS dummy variable was cross-checked against public USDA/APHIS inspection alerts and WTO SPS notifications for the selected countries. This cross-check confirmed that higher values generally aligned with stricter or more complex phytosanitary protocols.
The gravity model was created by applying a regression to this constructed database in Excel, and its results are shown in Table 7.
Table 7.
Gravity model regression results for U.S. fresh produce imports (2024).
An R square = 0.347 and a significant F = 2.705 × 10⁻⁸ indicated that the model as a whole was highly statistically significant, and it explained 34.7% of the variation in trade flows.
The rather limited influence may have been affected by the application of cross-country gravity models, especially with limited variables and heuristic inputs. Nonetheless, it may be considered a valid influence, as it was within the expected range for cross-country gravity models in agriculture, especially in the case that non-linear effects (e.g., SPS constraints) are included. As mentioned in [22], policy simulations often prioritize a balance between interpretability and fit over the maximization of predictive power. We adhered to this perspective, focusing on the vulnerabilities and shock simulations instead of actual causal inference.
The GDP and distance behaved as expected, with bigger and closer economies trading more; the SPS dummy variable was not statistically significant (probably also due to the heuristic construction, which may represent a future work direction). The border effect may have been weaker because Canada and Mexico already trade at high levels, approaching saturation. Lastly, the tariff variable was close to significance and could have been more impactful if modeled in more granularity (this again representing a future line of work). The interpretation for each coefficient is shown in Table 8.
Table 8.
Gravity model regression results for U.S. fresh produce imports (2024)—interpretation.
Model limitations and robustness considerations:
- The model used trade values to predict trade outcomes. This may have triggered an endogeneity risk and possibly led to circular reasoning, as, for instance, countries with high trade flows might negotiate lower tariffs or harmonize their SPS rules. However, the model was heuristic and aimed at a scenario-based sensitivity analysis instead of causal inference. This means that this particular limitation is unlikely to have undermined the interpretive value of the results, as the potential for reverse causality does not impair the use of the model to simulate the relative impacts under different policy shocks. It is also in line with similar literature [92,93,94].
- The use of 2023 GDP data as a proxy for 2024 may be another limitation. However, given the historical continuity, the validation in the previous two steps of this methodology, and the limited year-on-year variation for most exporters, we can assume that this substitution is not expected to have biased the estimates significantly.
- Multicollinearity: markets with high tariffs may also impose non-tariff barriers. Considering the analysis was run on a small sample size and used some regressors with a categorical nature, a formal Variance Inflation Factor (VIF) analysis was not conclusive. However, no instability was detected in the estimated coefficients. We consider this to be a structural limitation and will address it in future work.
- Due to data constraints, the residual patterns were not formally tested but are acknowledged as a potential source of bias.
That being considered, we defined the gravity model as
where
ln(T_iUS) = 11.62 + 0.851*ln(GDP_i) − 1.965*ln(Distance_iUS) + 1.294*Border_iUS − 0.310*Tariff_iUS + −0.244*SPS_iUS + e_iUS
- -
- T_iUS: The value of fresh produce exports from country i to the United States;
- -
- GDP_i: The Gross Domestic Product of the exporter;
- -
- Distance_iUS: The geographic distance between country i and the USA;
- -
- Border_iUS: A dummy variable indicating a shared border;
- -
- Tariff_iUS: The applied ad valorem tariff rate on fresh produce exports from country i to the US;
- -
- SPS_iUS: A dummy variable for the presence of non-tariff SPS measures that constrain the trade in perishables;
- -
- e_iUS: An error term.
4.2.2. “The Scenario” Simulation Results
The scenario used to stress-test the network based on a multi-risk management approach was based on a single exogenous policy shock, allowing for the evaluation of the ripple effects of a major policy intervention by a central actor, more specifically, a 10% across-the-board tariff imposed by the United States of America on all fresh produce imports, increased to 25% for shipments from Mexico and Canada. The scenario was based on the real baseline tariff imposed by President Donald Trump on April 2nd, 2025, and it encapsulated a plausible geopolitical and protectionist policy shock with global systemic ramifications, mainly due to the central role of the country in global produce flows.
This trade shock (which built on the work of [21] based on the measures from the first Trump administration) was treated both as a standalone disruption and in a compound scenario alongside climate-related production losses.
By using this algorithm, we found that in the first case (solely a tariff shock, as per the real geopolitical event on 2 April 2025), there was a substantial decline in the total import volumes (see Figure 7).
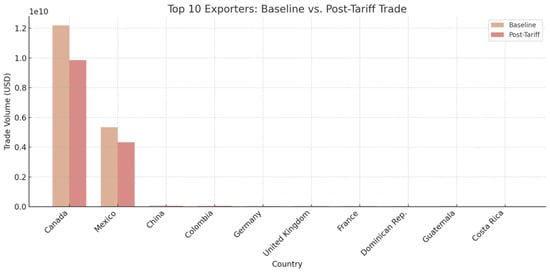
Figure 7.
Baseline vs. post-tariff trade volumes for the top 10 exporters to the US under the tariff shock scenario.
On average, countries saw a reduction in trade ranging between ~9% and 21%, depending on their tariff exposure. Countries with the highest tariffs (Mexico and Canada), as expected, showed the most substantial absolute declines in their trade volume, 18% and 20%, respectively. Notably, Mexico, which accounts for 59% of U.S. imports of fresh produce, experienced a sharp absolute contraction due to both its tariff increase and central position. Moreover, the declines in the trade volume were valid all over the map, consistently, and even if the model had a general structural sensitivity to tariff changes for all exporters, for high-volume trading partners, their impact was even more severe. For instance, both China and Colombia experienced a reduction of 9%, which was a sizable contraction, albeit less impactful due to their limited trade volume. This effect was an important supply-side shock, with a substitution capacity, as the percentage of imports predominantly from Mexico is close to two-thirds of the overall US market. Taking into consideration perishability, the trade concentration, and, in part, the diplomatic complications in securing an alternative supplier, the impact on the US national market may be considered as having severe effects on societal resilience. To conclude, the tariffs were an important supply-side stressor, particularly for highly integrated trade relationships; thus, resilient sourcing strategies in the U.S. fresh food sector are mandatory if the country would prefer not to go through a produce shortage post-tariff implementation.
This blunt protectionist measure was considered in the second stage of our scenario in conjunction with a climate change-induced drought in Mexico. This risk was informed by [95] and resided in this context: “Mexico’s 2025 dry season could last around six months, according to predictions by the National Water Commission (Conagua)—from late November 2024 to May 2025—meaning a potentially difficult year ahead in states by no means fully recuperated from drought conditions in 2024. ‘The water crisis in Mexico is severe and represents a paradox because although torrential rains have occurred in recent months, drought persists in large areas of the country’” [95].
We assumed that this localized climate change shock induced a 20% export loss for Mexico. This was another heuristic approximation, and it was reductionist, as it assumed that all other countries were not affected. However, in reality, there are shifts in export capacities due to climate change that are not easily mitigated by technology. Thus, the two scenarios forming the compound multi-risk one were Scenario 1, a new tariff = 10% (all) or 25% (Mexico, Canada), and Scenario 2, the same tariff + a reduction of 20% in Mexico’s exports (climate shock). The algorithm indicated that the reduction in trade was even more significant for Mexico under the constraints of a limited number of alternative routes or substitutions (see Figure 8).
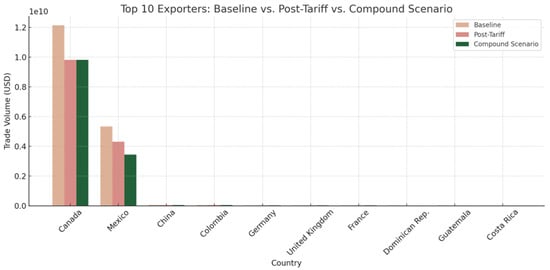
Figure 8.
Baseline vs. post-tariff vs. compound scenario trade volumes for the top 10 exporters to the US under the multi-risk scenario.
The trade volume from Mexico (the country affected by the second stressor) exhibited a sharper contraction, as compared to the first stage of the scenario, with a decline of over 34% from the baseline. This was to be expected, as multiple stressors have a compounding effect and can amplify vulnerabilities in fresh produce supply chains. This holds even truer in the case of key suppliers like Mexico that lack immediately substitutable alternatives. Fresh fruit and vegetables, like any crop, take time to be produced. A crop must be planted at least half a year in advance, even when this is not possible in a certain country. Therefore, an overnight stressor (such as a tariff), combined with a longer-term stressor (such as climate change), will lead to a short-term lack of alternatives. It is to be mentioned that, in this reductionist scenario, the climate impact had a localized nature. This simplification highlights that even geographically localized climate shocks can generate significant systemic consequences when compounded by trade frictions. In reality, however, the situation is more dire, as climate-induced disruptions are rarely confined to a single country. They usually affect multiple producers simultaneously, across regions, and the global supply chain is more severely affected and fragile.
With the resulting data from this scenario, we returned to Gephi to respond to a series of questions meant to determine the resilience and reconfiguration of the trade network in the case of a compounded risk scenario for Mexico (a key exporter): Does Mexico’s centrality drop? Does the influence of another node rise (e.g., Costa Rica or Chile may gain influence as alternative routes)? Are communities more fragmented? Does the US lose its power as a hub? The new Gephi map, post-compound scenario, is shown in Figure 9.
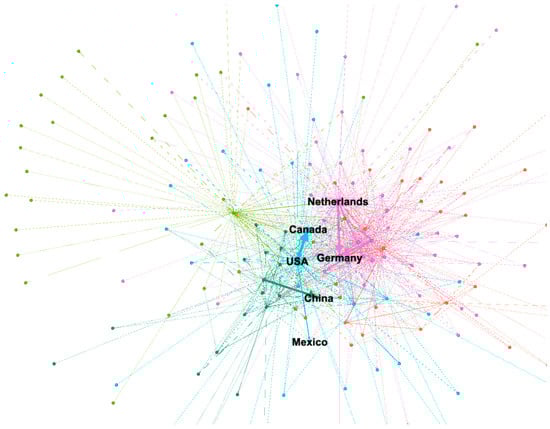
Figure 9.
Global trade network of fresh produce (fruits and vegetables) (HS07 and HS08) based on FOB values (2024) under the multi-risk scenario. Note: Node size reflects total trade volume for each country; larger nodes are more central exporters or importers. Edge thickness denotes strength of bilateral trade flows, and colors indicate modularity clusters (regions with stronger internal trade ties).
The following insights may be observed: Mexico’s weighted degree centrality dropped significantly as it exported much less fresh produce to the U.S. There was no single replacement for Mexico as a supplier for the US market, but a redistribution of trade flows strengthened secondary hubs, such as Chile, Costa Rica, Colombia, and Peru. However, this assumed that the US market retained its purchase power and no other risks were compounded to reduce it. Mexico had a role as a hub linking Latin America to North America, and its weakening reduced intermodular connectivity, leading to slightly more fragmented or regionalized clusters. The U.S. retained centrality due to its global trade volume but suffered a decline in the strength of its connectivity with key partners, especially in Latin America. This assumption was, of course, based on this reductionist compound scenario, in which no other elements affected the situation.
It is important to note here, as a research design component, that the focus in the Gephi diagrams was not on the precise granularity of each percentage shift, but rather on the broader structural trends described above. Additionally, as a research limitation, these findings responded to a reductionist scenario that is also currently dynamic: the climate disruption was a single isolated shock, localized in a single country, and the tariff levels used have changed significantly in a single month and remain highly volatile due to the political context. Thus, revisiting this analysis with updated real data in subsequent years may yield significantly different outcomes. The purpose of the analysis was to simply highlight the growing systemic pressure on the resilience of the fresh produce supply chain due to compounding (and often random) events.
5. Sustainability Implications and Other Conclusions
This study offers a multi-risk management integrative method to analyze the structural vulnerabilities and flow-based sensitivities in the global produce trade system. It worked towards demonstrating that the current configurations of the fruit and vegetable trade flows are highly sensitive to exogenous shocks, as they are structurally centralized and increasingly fragile. The research used the United States of America as a simulation case due to its position as a global hub but also due to its current trade policy volatility, as the main focus of the study was to focus on governance issues, rather than technical fixes (such as SPS harmonization or food reserve systems). The vulnerability induced in the system results from the fact that a global trade hub like the USA imports over 90% of its fresh produce from a tightly clustered group of Latin American countries (at climate change risk) and, moreover, behaves erratically in terms of its trade policy. The structural dependency is exacerbated by perishability and cold chain reliance, as proven in the literature, just to make the interconnectedness of risks even greater, and was underscored by the simulation scenarios. Even unilateral protectionist moves, when compounded with climate-induced localized risk events, depress trade flows and fragment the network’s connectivity.
This fragility has sustainability, resilience, and governance implications:
- It is almost a truism that sustainability in food systems depends on both environmental and logistical resilience, and diversifying sourcing strategies should become part of a sustainability agenda. This is underlined by the risks raised by, for instance, the U.S.’s current import dependence on a narrow set of regional suppliers.
- The poli-crisis and multi-risk VUCA nature of the world (volatile, uncertain, complex, and ambiguous) reveals a high risk for critical supply chains’ destabilization, caused by converging events in a “perfect storm” scenario. In this context, it is crucial to develop integrative governance frameworks that address multiple risks in conjunction.
- In all disruption scenarios, small exporters are at risk. This raises questions about local and global societal resilience and how mitigation mechanisms may come into play.
- Another truism comes from the need for redundancy as a multi-risk mitigator. Particularly in terms of fresh produce, this translates into multiple overlapping supply routes with proper cold chain infrastructure.
Risk-informed governance, including anticipatory policy tools, and data-driven decision-making represent other significant risk mitigators, and this study aimed to assist with achieving these. It offers a tool for anticipatory governance and allows policymakers to assess system-wide trade-offs before shocks occur. It provides evidence that the fresh produce trade is facing a convergence of risks that cannot be adequately addressed through siloed approaches. This particular range of products in global trade is essential for human well-being and, thus, its adequate provision in all countries is more than fundamental for societal resilience.
Specific recommendations to increase the resilience of the global fresh produce supply chain are as follows. However, it is crucial to stress the importance of collaboration amongst stakeholders:
- -
- Governments: These may implement anticipatory governance through scenario-based stress testing and/or develop cold chain infrastructure via public investment and/or support trade diversification through bilateral trade agreements and/or not act randomly and erratically in regard to public policies related to supply chains (i.e., tariff policies):
- -
- International Organizations (e.g., the FAO, WTO): These may coordinate global early warning systems for produce supply risks and/or facilitate the harmonization of SPS standards and/or fund research into climate-resilient agri-logistics:
- -
- Supply Chain Managers: These may invest in providing digital supply chain visibility (IoT, blockchains) and/or diversify their supplier base and logistics pathways and/or develop cold chain contingency plans. It is to be noted that these are all actions already in place as common risk mitigation measures.
- ○
- Supporting evidence from the study for this recommendation: The decline in the trade volume under the compound scenario stresses the need for proactive mitigation (Figure 8), and the limited substitutability post-shock highlights the need for flexible logistics systems.
Albeit ambitious, this study suffers from a heuristic approach and several reductionist decisions, focusing on policy rather than causal inference. Future research should address these challenges and, for instance, refine the compound scenario modeling by incorporating dynamic elasticity values, differentiated by the product type and seasonality. Another potential direction is to integrate climate foresight models with network-based trade analytics and/or to combine the investigated risk factors with other risk factors from sources such as trade finance, logistics chokepoints, or geopolitical risk indices.
Fresh produce is where a multi-risk context becomes tangible, both for countries and for people, so this is why this is the perfect spot to start properly addressing societal resilience, by whichever means necessary.
Funding
This research received no external funding.
Institutional Review Board Statement
Not applicable.
Informed Consent Statement
Not applicable.
Data Availability Statement
Data are contained within the article.
Conflicts of Interest
The author declares no conflicts of interest.
Abbreviations
The following abbreviations are used in this manuscript:
| AfCFTA | African Continental Free Trade Area |
| CAGR | Compound Annual Growth Rate |
| CEPII | Centre d’Études Prospectives et d’Informations Internationales |
| FAO | Food and Agriculture Organization |
| FOB | Free on Board |
| GSP | Generalized System of Preferences |
| HS | Harmonized System (tariff classification) |
| LDC | Least Developed Country |
| MFN | Most Favored Nation |
| NAFTA | North American Free Trade Agreement |
| SPS | Sanitary and Phytosanitary Measures |
| SDG | Sustainable Development Goal |
| UN Comtrade | United Nations Commodity Trade Statistics Database |
| USMCA | United States–Mexico–Canada Agreement |
| VUCA | Volatile, uncertain, complex, and ambiguous |
| WTO | World Trade Organization |
Appendix A
The consulted literature not directly cited in this paper:
- Adamopoulos et al. “Trade Risk and Food Security ∗,” n.d.
- Adams et al. “Climate Risks to Trade and Food Security: Implications for Policy,” 2021.
- Aguiar. “The Role of International Trade in Climate Change,” 2020.
- Al-Abdelmalek et al. “Transforming Challenges into Opportunities for Qatar’s Food Industry: Self- Sufficiency, Sustainability, and Global Food Trade Diversification.” 2023
- Arreyndip. “Identifying Agricultural Disaster Risk Zones for Future Climate Actions”. 2021.
- Baker et al. “Evaluating the Effects of Climate Change on US Agricultural Systems: Sensitivity to Regional Impact and Trade Expansion Scenarios.” 2018.
- Baldos et al. “The Biophysical and Economic Geographies of Global Climate Impacts on Agriculture,” 2018.
- Baldos et al. “Understanding the Spatial Distribution of Welfare Impacts of Global Warming on Agriculture and Its Drivers.” 2019.
- Baum et al. “Adaptive Shock Compensation in the Multi-Layer Network of Global Food Production and Trade,” 2024.
- Beach & Cai “Assessing Climate Change Impacts on Global Agricultural Production and Trade,” 2013.
- Bozzola et al. “Impacts of Climate Change on Global Agri-Food Trade.” 2023.
- Breukers et al. “Sustainable Sourcing: How to Anticipate Climate Change?: Guidance in Identifying Risks and Opportunities of Climate Change for Sustainable Import of Fruits and Vegetables,” 2016.
- Brgm et al. “Climate Change and the Water Capability to Export Agricultural Goods,” 2020.
- Brooks et al. “Bilateral Trade and Food Security,” 2013.
- Cai & Song. “The State’s Position in International Agricultural Commodity Trade: A Complex Network,” 2016.
- Chepeliev et al. “Climate Change Impacts on Agriculture Using Improved Multi-Region Input-Output Framework,” 2018.
- Chepeliev et al. “U. S. Trade Policies and Their Impact on Domestic Vegetables, Fruits and Nuts Sector: Application of the GTAP-HS Modelling Framework,” 2020.
- Civín & L. Smutka. “Vulnerability of European Union Economies in Agro Trade.” 2020.
- Cox et al. “Risk-Sharing with Network Transaction Costs.” 2023.
- Coyle et al. “Understanding the Determinants of Structural Change in World Food Markets.” 1998.
- Dadakas et al. “Global Agricultural Trade Impact of the 2011 Triple Disaster in Japan: A Gravity Approach*.” s, 2021.
- Dalin et al. “Modeling Past and Future Structure of the Global Virtual Water Trade Network,” 2012.
- Distefano et al. “Shock Transmission in the International Food Trade Network.” 2017.
- Distefano et al. “Tools for Reconstructing the Bilateral Trade Network: A Critical Assessment.” 2019.
- Dumortier et al. “Impacts of Geopolitics and Policy on Latin American Biodiversity and Water Resources.” 2024.
- Elimbi Moudio et al. “Data-Driven Planning in the Face of Supply Disruption in Global Agricultural Supply Chains.” 2021.
- Eun et al. “Study of Trade Network Among Agricultural Product and Export Attribute Effect Using Social Network Analysis,” 2016.
- Fair et al. “Dynamics of the Global Wheat Trade Network and Resilience to Shocks.” 2017.
- Ferguson & Gars. “Measuring the Impact of Agricultural Production Shocks on International Trade Flows.” 2018.
- Ferike Thom et al. “EU Agriculture Under an Import Stop for Food and Feed.” 2023.
- Foong et al. “Supply Chain Disruptions Would Increase Agricultural Greenhouse Gas Emissions.” 2023.
- Gaskin et al. “Modelling Global Trade with Optimal Transport.” 2024.
- Ghazalian. “The New Tomato Suspension Agreement: What Are the Implications for Trade Flows?” 2015.
- Golding et al. “Trade Strategies to Mitigate the Global Impact of Regional Wheat Production Shocks.”, 2021.
- Grassia et al. “Insights into Countries’ Exposure and Vulnerability to Food Trade Shocks from Network-Based Simulations.” 2022.
- Gunasekera. “Potential Effects of Variation in Agriculture Sector Response to Climate Change: An Integrated Assessment,” 2011.
- Hakobyan. “Divided We Fall: Differential Exposure to Geopolitical Fragmentation in Trade.” 2023.
- Hassani et al. “A Multiperiod, Multicommodity, Capacitated International Agricultural Trade Network Equilibrium Model with Applications to Ukraine in Wartime.”, 2024.
- Hedlund et al. “Impacts of Climate Change on Global Food Trade Networks”, 2022.
- Heerman & Sheldon. “Increased Economic Integration in the Asia-Pacific Region: What Might Be the Potential Impact on Agricultural Trade?” 2018.
- Hussein & Knol. “The Ukraine War, Food Trade and the Network of Global Crises.” 2023.
- Jafari et al. “The Multiple Dimensions of Resilience in Agricultural Trade Networks.” 2024.
- Karapinar & Tanaka. “How to Improve World Food Supply Stability Under Future Uncertainty: Potential Role of WTO Regulation on Export Restrictions in Rice,” 2013.
- Karov. “Trade Barriers or Trade Catalysts? The Effects of Phytosanitary Measures on U.S. Fresh Fruit and Vegetable Imports,” 2009.
- Khadka et al. “Friendshoring in Global Food Supply Chains.” 2025.
- Konar et al. “Water for Food: The Global Virtual Water Trade Network,” 2011.
- Krivko et al. “Rebalancing Agri-Food Trade Flows Due to Russian Import Ban: The Case of Direct Neighbors.” 2024.
- Kubiczek et al.“Modeling Sub-Annual Price and Trade Flow Anomalies in Agricultural Markets: The Dynamic Agent-Based Model Agrimate.”. 2023.
- L’Her et al. “Transport Resilience and Adaptation to Climate Impacts—A Case Study on Agricultural Transport in Brazil.” 2023.
- Laber et al. “Shock Propagation from the Russia–Ukraine Conflict on International Multilayer Food Production Network Determines Global Food Availability.” 2022.
- Laber et al. “Shock Propagation in International Multilayer Food-Production Network Determines Global Food Availability: The Case of the Ukraine War,” 2022.
- Larue et al. “Climate Change, Production and Trade in Apples.” 2024.
- Lee & Kennedy. “Analyzing Collective Trade Policy Actions in Response to Cyclical Risk in Agricultural Production: The Case of International Wheat,” 2016.
- Leibovici & Adamopoulos. “Trade Risk and Food Security,” 2024.
- Li et al. “Unpacking the Global Rice Trade Network: Centrality, Structural Holes, and the Nexus of Food Insecurity.” 2024.
- Lybbert et al. “Weather Shocks And Inter-Hemispheric Supply Responses: Implications For Climate Change Effects On Global Food Markets,” 2014.
- Marchand et al. “Reserves and Trade Jointly Determine Exposure to Food Supply Shocks,” 2016.
- Monit et al. “Linking Material Flow Analysis with Resilience Using Rice: A Case Study in Global, Visual MFA of a Key Food Product,” 2016.
- Nagurney et al. “Multicommodity International Agricultural Trade Network Equilibrium: Competition for Limited Production and Transportation Capacity Under Disaster Scenarios with Implications for Food Security.” 2023.
- Naqvi & Monasterolo. “Assessing the Cascading Impacts of Natural Disasters in a Multi-Layer Behavioral Network Framework.” 2021.
- Naqvi & Monasterolo. “Natural Disasters, Cascading Losses, and Economic Complexity: A Multi-Layer Behavioral Network Approach,” 2019.
- Natalini et al. “Global Food Security and Food Riots—an Agent- Based Modelling Approach.” 2019.
- Nath et al. “Using Network Reliability to Understand International Food Trade Dynamics.” 2018.
- Nes et al. “Extreme Weather Events, Climate Expectations, and Agricultural Export Dynamics.” 2025.
- Popp et al. “Network Analysis for the Improvement of Food Safety in the International Honey Trade,” 2018.
- Porfirio et al. “Economic Shifts in Agricultural Production and Trade Due to Climate Change.” 2018.
- Qin et al. “Snowmelt Risk Telecouplings for Irrigated Agriculture.” 2022.
- Reimer. “Agricultural Trade and Freshwater Resources,” 2012.
- Rezitis et al. “Investigating Factors Affecting Trade Flows in Pork and Poultry Global Markets Using Gravity Models.” 2024.
- Rosenberger. “Measuring Community Significance and State Vulnerability After Nuclear Winter,” n.d.
- Sandström et al. “Dependency on Imported Agricultural Inputs—Global Trade Patterns and Recent Trends.” 2024.
- Sartori & Schiavo. “Virtual Water Trade and Country Vulnerability: A Network Perspective,” 2014.
- Sartori. “Connected We Stand: A Network Perspective on Global Food Security,” 2015.
- Schletz. “Rice Trade in a Changing Climate of National Adaptation Plans,” 2014.
- Seekell et al. “Food, Trade, and the Environment.” 2018.
- Seville. “A Visual Analytics Process for Exploring Risk and Vulnerability in International Food Trade Networks,” 2017.
- Sixt & Strzepek. “Assessing the Food Security Implications of Climate Change on Global Food Trade.” 2022.
- Steinbach. “Exchange Rate Volatility and Global Food Supply Chains.” 2021.
- Stokeld et al. “Climate Change, Crops and Commodity Traders: Subnational Trade Analysis Highlights Differentiated Risk Exposure.”, 2020.
- Stokeld et al. “Stakeholder Perspectives on Cross-Border Climate Risks in the Brazil-Europe Soy Supply Chain.” 2023.
- Sun et al. “The Influence of Country Risks on the International Agricultural Trade Patterns Based on Network Analysis and Panel Data Method.” 2022.
- Suweis et al. “Structure and Controls of the Global Virtual Water Trade Network,” 2011.
- Talebian et al. “Solutions for Managing Food Security Risks in a Rapidly Changing Geopolitical Landscape,” 2024.
- Tamea et al. “Propagation of Crises in the Virtual Water Trade Network,” 2015.
- Tamea et al. “Global Effects of Local Food-Production Crises: A Virtual Water Perspective.” 2016.
- Verschuur et al. “The Risk of Large-Scale Trade Bottlenecks Due to Simultaneous Port Disruptions,” 2021.
- Villoria et al. “The Roles of Agricultural Trade and Trade Policy in Climate Change Adaptation and Mitigation.” 2024.
- Vishwakarma et al. “Wheat Trade Tends to Happen Between Countries with Contrasting Extreme Weather Stress and Synchronous Yield Variation.” 2022.
- Wang et al. “Quantifying Global Food Trade: A Net Caloric Content Approach to Food Trade Network Analysis,” 2024.
- Wang et al. “Trade for Food Security: The Stability of Global Agricultural Trade Networks.” 2023.
- Willenbockel et al. “Climate Policy and the Energy-Water-Food Nexus: A Model Linkage Approach,” 2016.
- Wu & Guclu. “Global Maize Trade and Food Security: Implications from a Social Network Model.” 2013.
- Xia & Yan. “Energy-Food Nexus Scarcity Risk and the Synergic Impact of Climate Policy: A Global Production Network Perspective.” 2022.
- Xie & Ali. “How Domestic and International Policies Affect the Outcome of Climate Change On China’s Grain Production? A CGE Model Analysis,” 2017.
- Xie et al. “Response of Food Production and Trade to the Global Socio-Ecological System Network.” Land, 2023.
- Yarlagadda et al., “Trade and Climate Mitigation Interactions Create Agro-Economic Opportunities With Social and Environmental Trade-Offs in Latin America and the Caribbean.” 2023.
- Yu et al. “Evolution of the Spatial Patterns of Global Egg Trading Networks in the 21 Century.” 2023.
- Zhang & Zhou. “Quantifying the Status of Economies in International Crop Trade Networks: A Correlation Structure Analysis of Various Node-Ranking Metrics.” 2023.
- Zhang et al. “Agriculture, Bioenergy, and Water Implications of Constrained Cereal Trade and Climate Change Impacts.” 2023.
- Zhang et al. “Global Environmental Impacts of Food System from Regional Shock: Russia-Ukraine War as an Example.” 2024.
- Zhang et al. “Impact of the Russia-Ukraine Conflict on the International Staple Agrifood Trade Networks,” 2024.
- Zhao et al. “Global Agricultural Responses to Interannual Climate and Biophysical Variability.” 2021.
- Zhao et al. “Natural Disasters and Agricultural Trade in China: Analyzing the Role of Transportation, Government and Diplomacy.” 2024.
References
- World Health Observatory. Available online: https://www.who.int/data/gho/indicator-metadata-registry/imr-details/3417 (accessed on 12 March 2025).
- FDA—US Food and Drug Administration. Available online: https://www.fda.gov/regulatory-information/search-fda-guidance-documents/guidance-industry-guide-minimize-microbial-food-safety-hazards-fresh-fruits-and-vegetables#i (accessed on 12 March 2025).
- Statista—Fresh Vegetables. Available online: https://www.statista.com/outlook/cmo/food/vegetables/fresh-vegetables/worldwide (accessed on 12 March 2025).
- Statista—Fresh Fruit. Available online: https://www.statista.com/outlook/cmo/food/fruits-nuts/fresh-fruits/worldwide (accessed on 12 March 2025).
- Ji, G.; Zhong, H.; Nzudie, H.L.F.; Wang, P.; Tian, P. The Structure, Dynamics, and Vulnerability of the Global Food Trade Network. J. Clean. Prod. 2024, 434, 140439. [Google Scholar] [CrossRef]
- Ercsey-Ravasz, M.; Toroczkai, Z.; Lakner, Z.; Baranyi, J. Complexity of the International Agro-Food Trade Network and Its Impact on Food Safety. PLoS ONE 2012, 7, e37810. [Google Scholar] [CrossRef]
- Burkholz, R.; Schweitzer, F. International Crop Trade Networks: The Impact of Shocks and Cascades. Environ. Res. Lett. 2019, 14, 114013. [Google Scholar] [CrossRef]
- Xu, H.; Niu, N.; Li, D.; Wang, C. A Dynamic Evolutionary Analysis of the Vulnerability of Global Food Trade Networks. Sustainability 2024, 16, 3998. [Google Scholar] [CrossRef]
- Puma, M.J.; Bose, S.; Chon, S.Y.; Cook, B.I. Assessing the Evolving Fragility of the Global Food System. Environ. Res. Lett. 2015, 10, 024007. [Google Scholar] [CrossRef]
- Kunimitsu, Y.; Sakurai, G. Systemic Risks Caused by Worldwide Simultaneous Bad and Good Harvests in Agricultural Market and Trade under Future Climate Change: Stochastic Simulation by the Computable General Equilibrium Model. Presented at the 2021 Conference of the Australian Agricultural and Resource Economics Society (AARES), Virtual Conference, 23–25 June 2021; Available online: https://ageconsearch.umn.edu/record/333228 (accessed on 4 March 2025).
- d’Amour, C.B.; Wenz, L.; Kalkuhl, M.; Steckel, J.C.; Creutzig, F. Teleconnected Food Supply Shocks. Environ. Res. Lett. 2016, 11, 035007. [Google Scholar] [CrossRef]
- d’Amour, C.B.; Anderson, W. International Trade and the Stability of Food Supplies in the Global South. Environ. Res. Lett. 2020, 15, 074005. [Google Scholar] [CrossRef]
- Jacinto, M. Assessing the Stability of the Core/Periphery Structure and Mobility in the Post-2008 Global Crisis Era: A World-Systems Analysis of the International Trade Network. J. World-Syst. Res. 2023, 29, 401–430. [Google Scholar] [CrossRef]
- Zhao, G.; Liu, S.; Lopez, C.; Chen, H.; Lu, H.; Mangla, S.K.; Elgueta, S. Risk analysis of the agri-food supply chain: A multi-method approach. Int. J. Prod. Res. 2020, 58, 4851–4876. [Google Scholar] [CrossRef]
- Rosales, F.; Batalha, M.; Raimundo, L.; Mazuchelli, J.A. Agri-food supply chain: Mapping particular risks. In Proceedings of the EurOMA Conference, Neuchatel, Switzerland, 26 June–1 July 2015; Available online: https://www.researchgate.net/publication/279925596_Agri-food_supply_chain_mapping_particular_risks (accessed on 4 March 2025).
- Zhao, G.; Olan, F.; Liu, S.; Hormazabal, J.H.; Lopez, C.; Zubairu, N.; Zhang, J.; Chen, X. Links between risk source identification and resilience capability building in agri-food supply chains: A comprehensive analysis. IEEE Trans. Eng. Manag. 2022, 71, 13362–13379. [Google Scholar] [CrossRef]
- Kuizinaitė, J.; Morkūnas, M.; Volkov, A. Assessment of the most appropriate measures for mitigation of risks in the agri-food supply chain. Sustainability 2023, 15, 9378. [Google Scholar] [CrossRef]
- Jiang, Y.; Oo, N.; Meng, Q.; Lim, H.W.; Sikdar, B. A survey on vulnerability prioritization: Taxonomy, metrics, and research challenges. arXiv 2024, arXiv:2502.11070. [Google Scholar] [CrossRef]
- Karakoc, D.B.; Konar, M. A Complex Network Framework for the Efficiency and Resilience Trade-Off in Global Food Trade. Environ. Res. Lett. 2021, 16, 105003. [Google Scholar] [CrossRef]
- Gutiérrez-Moya, E.; Adenso-Díaz, B.; Lozano, S. Analysis and vulnerability of the international wheat trade network. Food Secur. 2020, 13, 113–128. [Google Scholar] [CrossRef]
- Mnatsakanyan, H.; Lopez, J.A. An empirical investigation of U.S. demand for fresh-fruit imports. J. Agribus. 2019, 37, 117–140. [Google Scholar] [CrossRef]
- Anderson, J.E.; Van Wincoop, E. Trade costs. J. Econ. Lit. 2004, 42, 691–751. [Google Scholar] [CrossRef]
- Kostoska, O.; Mitikj, S.; Jovanovski, P.; Kocarev, L. Core-Periphery Structure in Sectoral International Trade Networks: A New Approach to an Old Theory. PLoS ONE 2020, 15, e0229547. [Google Scholar] [CrossRef]
- Smith, M.; Sarabi, Y. How Does the Behaviour of the Core Differ from the Periphery?–An International Trade Network Analysis. Soc. Netw. 2022, 70, 1–15. [Google Scholar] [CrossRef]
- Hu, Q.; Guo, M.; Wang, F.; Shao, L.; Wei, X. External Supply Risk of Agricultural Products Trade Along the Belt and Road under the Background of COVID-19. Front. Public Health 2023, 11, 1122081. [Google Scholar] [CrossRef]
- Suweis, S.; Carr, J.A.; Maritan, A.; Rinaldo, A.; D’Odorico, P. Resilience and reactivity of global food security. Proc. Natl. Acad. Sci. USA 2015, 112, 6902–6907. [Google Scholar] [CrossRef]
- Liu, K.; Wang, P.; Zhang, B.; Yan, K.; Shao, L. Network structures and mitigation potential of trade linked global agricultural greenhouse gas emissions. Sci. Rep. 2024, 14, 30973, Erratum in Sci. Rep. 2025, 15, 5138. https://doi.org/10.1038/s41598-025-89353-x. [Google Scholar] [CrossRef] [PubMed]
- Wang, M.; Liu, D.; Wang, Z.; Li, Y. Structural Evolution of Global Soybean Trade Network and the Implications to China. Foods 2023, 12, 1550. [Google Scholar] [CrossRef]
- Torreggiani, S.; Mangioni, G.; Puma, M.J.; Fagiolo, G. Identifying the community structure of the international food-trade multi network. Environ. Res. Lett. 2018, 13, 054026. [Google Scholar] [CrossRef]
- Clemente, G.P.; Cornaro, A.; Della Corte, F. Unraveling the key drivers of community composition in the agri-food trade network. Sci. Rep. 2023, 13, 13966. [Google Scholar] [CrossRef]
- Aleskerov, F.T.; Dutta, S.D.; Egorov, D.S.; Tkachev, D.S. Networks under deep uncertainty concerning food security. J. New Econ. Assoc. 2024, 64, 12–29. [Google Scholar] [CrossRef]
- Erdőháti-Kiss, A.; Naár-Tóth, Z.; Erdei-Gally, S. The impact of Russian import ban on the international peach trade network. Acta Polytech. Hung. 2023, 20, 181–198. [Google Scholar] [CrossRef]
- Odey, G.; Adelodun, B.; Lee, S.; Adeyemi, K.A.; Choi, K.-S. Assessing the impact of food trade centric on land, water, and food security in South Korea. J. Environ. Manag. 2023, 332, 117319. [Google Scholar] [CrossRef]
- Raj, S.; Brinkley, C.; Ulimwengu, J. Connected and extracted: Understanding how centrality in the global wheat supply chain affects global hunger using a network approach. PLoS ONE 2022, 17, e0269891. [Google Scholar] [CrossRef]
- Robu, R.G.; Alexoaei, A.P.; Cojanu, V.; Miron, D. The cereal network: A baseline approach to current configurations of trade communities. Agric. Food Econ. 2024, 12, 24. [Google Scholar] [CrossRef]
- Liu, L.; Wang, W.; Yan, X.; Shen, M.; Chen, H. The cascade influence of grain trade shocks on countries in the context of the Russia-Ukraine conflict. Humanit. Soc. Sci. Commun. 2023, 10, 449. [Google Scholar] [CrossRef]
- Bajaj, K.; Mehrabi, Z.; Kastner, T.; Jägermeyr, J.; Müller, C.; Schwarzmüller, F.; Hertel, T.W.; Ramankutty, N. Current food trade helps mitigate future climate change impacts in lower-income nations. PLoS ONE 2025, 20, e0314722. [Google Scholar] [CrossRef] [PubMed]
- Scheelbeek, P.F.D.; Moss, C.; Kastner, T.; Alae-Carew, C.; Jarmul, S.; Green, R.; Taylor, A.; Haines, A.; Dangour, A.D. United Kingdom’s fruit and vegetable supply is increasingly dependent on imports from climate-vulnerable producing countries. Nat. Food 2020, 1, 705–712. [Google Scholar] [CrossRef]
- Heslin, A.; Puma, M.J.; Marchand, P.; Carr, J.A.; Dell’Angelo, J.; D’Odorico, P.; Gephart, J.A.; Kummu, M.; Porkka, M.; Rulli, M.C.; et al. Simulating the cascading effects of an extreme agricultural production shock: Global implications of a contemporary US Dust Bowl event. Front. Sustain. Food Syst. 2020, 4, 26. [Google Scholar] [CrossRef]
- Zhang, Z.; Abdullah, M.J.; Xu, G.; Matsubae, K.; Zeng, X. Countries’ vulnerability to food supply disruptions caused by the Russia–Ukraine war from a trade dependency perspective. Sci. Rep. 2023, 13, 16591. [Google Scholar] [CrossRef] [PubMed]
- Tanaka, T.; Geyik, Ö.; Karapinar, B. Short-term implications of climate shocks on wheat-based nutrient flows: A global “nutrition at risk” analysis through a stochastic CGE model. Foods 2021, 10, 1414. [Google Scholar] [CrossRef]
- Horn, B.; Ferreira, C.; Kalantari, Z. Links between food trade, climate change and food security in developed countries: A case study of Sweden. Ambio 2022, 51, 943–954. [Google Scholar] [CrossRef]
- Duan, J.-N.; Xu, Y.; Jiang, H. Trade vulnerability assessment in the grain-importing countries: A case study of China. PLoS ONE 2021, 16, e0255300. [Google Scholar] [CrossRef]
- Key, R.; Parrado, R.; Delpiazzo, E.; King, R.; Bosello, F. Potential climate-induced impacts on trade: The case of agricultural commodities and maritime chokepoints. J. Shipp. Trade 2024, 9, 11. [Google Scholar] [CrossRef]
- Wijngaard, J. Decision Systems for Inventory Management and Production Planning: Rein Peterson and Edward A. Silver Wiley, New York, 1979. J. Oper. Res. Soc. 1981, 32, 469–470. [Google Scholar]
- de Keizer, M.; Haijema, R.; van der Vorst, J.G.A.J.; Bloemhof-Ruwaard, J.M. Hybrid simulation and optimization approach to design and control fresh product networks. In Proceedings of the 2012 Winter Simulation Conference, Berlin, Germany, 9–12 December 2012; Laroque, C., Himmelspach, J., Pasupathy, R., Rose, O., Uhrmacher, A.M., Eds.; IEEE: Piscataway, NJ, USA, 2012; pp. 1–12. [Google Scholar] [CrossRef]
- MacKenzie, C.A.; Apte, A. Modeling disruption in a fresh produce supply chain. Int. J. Logist. Manag. 2017, 28, 656–679. [Google Scholar] [CrossRef]
- Palma, M.A.; Ribera, L.A.; Bessler, D.A.; Paggi, M.S.; Knutson, R.D. Potential impacts of foodborne illness incidences on market movements and prices of fresh produce in the U.S. J. Agric. Appl. Econ. 2010, 42, 731–741. [Google Scholar] [CrossRef]
- Berardy, A.J.; Chester, M. Climate change vulnerability in the food, energy, and water nexus: Concerns for agricultural production in Arizona and its urban export supply. Environ. Res. Lett. 2017, 12, 035004. Available online: https://iopscience.iop.org/article/10.1088/1748-9326/aa5e6d/meta (accessed on 26 February 2025). [CrossRef]
- Uyttendaele, M.; Jacxsens, L.; Van Boxstael, S. Issues surrounding the European fresh produce trade: A global perspective. In Global Safety of Fresh Produce: A Handbook of Best Practice, Innovative Commercial Solutions and Case Studies; Hoorfar, J., Ed.; Woodhead Publishing: Cambridge, UK, 2014; pp. 33–51. [Google Scholar] [CrossRef]
- Seshadri, N.M.; Palanisamy, A.S.; Mohanavelu, T.; McDermott, O. Minimization of losses in postharvest of fresh produce supply chain. J. Agribus. Dev. Emerg. Econ. 2024, 14, 23–45. [Google Scholar] [CrossRef]
- Yu, M.-N.; Nagurney, A. Competitive food supply chain networks with application to fresh produce. Eur. J. Oper. Res. 2012, 224, 273–282. [Google Scholar] [CrossRef]
- Woods, M.; Thornsbury, S.; Raper, K.C.; Weldon, R.N. Regional trade patterns: The impact of voluntary food safety standards. Can. J. Agric. Econ. 2006, 54, 531–546. [Google Scholar] [CrossRef]
- Cook, R. The U.S. Fresh Produce Industry: An Industry in Transition. UC Davis, n.d. 2002. Available online: https://ageconsearch.umn.edu/record/9089/files/aer626.pdf (accessed on 27 February 2025).
- Mwebaze, P.; Monaghan, J.; Spence, N.; MacLeod, A.; Hare, M.; Revell, B. Modelling the risks associated with the increased importation of fresh produce from emerging supply sources outside the EU to the UK. J. Agric. Econ. 2010, 61, 97–121. [Google Scholar] [CrossRef]
- Yang, J.; Liu, H. Research of Vulnerability for Fresh Agricultural-Food Supply Chain Based on Bayesian Network. Math. Probl. Eng. 2018, 2018, 6874013. [Google Scholar] [CrossRef]
- Ma, J.; Zhao, P.; Li, M.; Niu, J. The Evolution of Global Soybean Trade Network Pattern Based on Complex Network. Appl. Econ. 2024, 56, 3133–3149. [Google Scholar] [CrossRef]
- Qiao, C.; Cheng, C.; Ali, T. How Climate Change and International Trade Will Shape the Future Global Soybean Security Pattern. J. Clean. Prod. 2023, 422, 138603. [Google Scholar] [CrossRef]
- Van Hoyweghen, K.; Fabry, A.; Feyaerts, H.; Wade, I.; Maertens, M. Resilience of global and local value chains to the Covid-19 pandemic: Survey evidence from vegetable value chains in Senegal. Agric. Econ. 2021, 52, 423–440. [Google Scholar] [CrossRef]
- Hess, T.M.; Sutcliffe, C. The exposure of a fresh fruit and vegetable supply chain to global water-related risks. Water Int. 2018, 43, 746–761. [Google Scholar] [CrossRef]
- Mahfouz, A.; Allen, D.; Arisha, A.; Elbert, R.; Gleser, M. A Post-Brexit Transportation Scenario Analysis for an Agri-Fresh Produce Supply Chain. In Proceedings of the Online World Conference on Soft Computing in Industrial Applications, Online, 8–11 December 2019; Available online: https://ieeexplore.ieee.org/abstract/document/9004790 (accessed on 25 February 2025). [CrossRef]
- Carrico, C.; Cui, H.D.; Tabeau, A. Disaggregating underlying drivers of fruit and vegetables trade: An HS-level modelling analysis of the AfCFTA. In Proceedings of the 24th Annual Conference on Global Economic Analysis, Virtual Conference, 15–17 June 2021; Available online: https://ageconsearch.umn.edu/record/333288/?v=pdf (accessed on 26 February 2025).
- Gephart, J.A.; Rovenskaya, E.; Dieckmann, U.; Pace, M.L.; Brännström, Å. Vulnerability to shocks in the global seafood trade network. Environ. Res. Lett. 2016, 11, 035008. Available online: https://iopscience.iop.org/article/10.1088/1748-9326/11/3/035008/meta (accessed on 11 March 2025). [CrossRef]
- Esteso, A.; Alemany, M.; Ottati, F.; Ortiz, Á. System dynamics model for improving the robustness of a fresh agri-food supply chain to disruptions. Oper. Res. 2023, 23, 28. Available online: https://link.springer.com/article/10.1007/s12351-023-00769-7 (accessed on 26 February 2025). [CrossRef]
- Nagurney, A.; Besik, D.; Yu, M.-N. Dynamics of quality as a strategic variable in complex food supply chain network competition: The case of fresh produce. Chaos 2018, 28, 043124. [Google Scholar] [CrossRef]
- Rossi, R.; Rijpkema, W.A.; van der Vorst, J.G.A.J. The impact of dual sourcing on food supply chain networks: The case of Egyptian strawberries. In Proceedings of the 10th Wageningen International Conference on Chain and Network Management (WICaNeM 2012), Wageningen, The Netherlands, 23–25 May 2012; pp. 1–10. Available online: https://www.academia.edu/download/49126806/The_impact_of_dual_sourcing_on_food_supply_chain_networks_the_case_of_Egyptian_20strawberries.pdf (accessed on 27 February 2025).
- Hong, J.; Quan, Y.; Tong, X.; Lau, K.H. A hybrid ISM and fuzzy MICMAC approach to modeling risk analysis of imported fresh food supply chain. J. Bus. Ind. Mark. 2023, 38, 1304–1320. [Google Scholar] [CrossRef]
- Zhao, G.; Liu, S.; Wang, Y.; Lopez, C.; Zubairu, N.; Chen, X.; Xie, X.; Zhang, J. Modelling enablers for building agri-food supply chain resilience: Insights from a comparative analysis of Argentina and France. Prod. Plan. Control 2022, 35, 283–307. [Google Scholar] [CrossRef]
- Nagurney, A. Perishable Food Supply Chain Networks with Labor in the Covid-19 Pandemic. In Dynamics of Disasters; Springer: Cham, Switzerland, 2021. [Google Scholar]
- Yang, M.; Qu, S.; Ji, Y.; Abdoulrahaman, D. Vulnerability of fresh agricultural products supply chain: Assessment, interrelationship analysis and control strategies. Socio-Econ. Plan. Sci. 2024, 94, 101928. [Google Scholar] [CrossRef]
- Villalobos, J.R.; Soto-Silva, W.E.; González-Araya, M.C.; González-Ramírez, R.G. Research directions in technology development to support real-time decisions of fresh produce logistics: A review and research agenda. Comput. Electron. Agric. 2019, 167, 105092. [Google Scholar] [CrossRef]
- Shanker, S.; Barve, A.; Muduli, K.; Kumar, A.; Garza-Reyes, J.A.; Joshi, S. Enhancing resiliency of perishable product supply chains in the context of the COVID-19 outbreak. Int. J. Logist. Res. Appl. 2021, 25, 1219–1243. [Google Scholar] [CrossRef]
- Suryawanshi, P.; Dutta, P. Distribution planning problem of a supply chain of perishable products under disruptions and demand stochasticity. Int. J. Prod. Perform. Manag. 2021, 72, 246–278. [Google Scholar] [CrossRef]
- Li, Z.; Liu, Q.; Ye, C.; Dong, M.; Zheng, Y. Achieving resilience: Resilient price and quality strategies of fresh food dual-channel supply chain considering the disruption. Sustainability 2022, 14, 6645. [Google Scholar] [CrossRef]
- Orjuela-Castro, J.A.; Jaimes, W.A. Evaluating the supply chain design of fresh food on food security and logistics. In Proceedings of the 5th Workshop on Engineering Applications (WEA 2018), Medellín, Colombia, 17–19 October 2018; Springer: Cham, Switzerland, 2018; pp. 14–25. Available online: https://link.springer.com/chapter/10.1007/978-3-030-00350-0_22 (accessed on 8 March 2025).
- Anand, S.; Barua, M.K. Modeling the key factors leading to post-harvest loss and waste of fruits and vegetables in the agri-fresh produce supply chain. Comput. Electron. Agric. 2022, 198, 106936. [Google Scholar] [CrossRef]
- Zuurbier, P.J.P. Supply chain management in the fresh produce industry: A mile to go? J. Food Distrib. Res. 1999, 30, 20–30. Available online: https://ageconsearch.umn.edu/record/26781/?v=pdf (accessed on 2 March 2025). [CrossRef]
- Li, Z.; Zhao, P. Designing a resilient retail supply network for fresh products under disruption risks. Front. Public Health 2023, 11, 1099227. [Google Scholar] [CrossRef]
- Orjuela-Castro, J.A.; Adarme-Jaimes, W. Dynamic impact of the structure of the supply chain of perishable foods on logistics performance and food security. J. Ind. Eng. Manag. 2017, 10, 687–710. [Google Scholar] [CrossRef]
- Altendorf, S. Strengthening the resilience of agricultural supply chains—The case of fresh fruits and vegetables. In FAO Commodity and Trade Policy Research Working Paper; No. 55; FAO: Rome, Italy, 2023. [Google Scholar] [CrossRef]
- García-Flores, R.; Allen, S.; Gaire, R.; Johnstone, P.; Yi, D.; Johnston, J.; White, T.; Scotland, D.; Lim-Camacho, L. Understanding and building resilience in food supply chains. In Food Engineering Innovations Across the Food Supply Chain; Elsevier: Amsterdam, The Netherlands, 2022; pp. 1–14. [Google Scholar] [CrossRef]
- Namany, S.; Govindan, R.; Al-Fagih, L.; McKay, G.; Al-Ansari, T. Sustainable food security decision-making: An agent-based modelling approach. J. Clean. Prod. 2020, 255, 120296. [Google Scholar] [CrossRef]
- Adiga, A.; Palmer, N.; Sinha, S.; Waghalter, P.; Dave, A.; Lazarte, D.P.; Brévault, T.; Apolloni, A.; Mortveit, H.; Baek, Y.Y.; et al. Realistic commodity flow networks to assess vulnerability of food systems. In Proceedings of the International Workshop on Complex Networks & Their Applications, Madrid, Spain, 2021; Available online: https://link.springer.com/chapter/10.1007/978-3-030-93409-5_15 (accessed on 25 February 2025).
- Hassna, B.; Namany, S.; Alherbawi, M.; Elomri, A.; Al-Ansari, T. Multi-objective optimization for food availability under economic and environmental risk constraints. Sustainability 2024, 16, 4336. [Google Scholar] [CrossRef]
- Zhang, G.; Li, G.; Peng, J. Risk assessment and monitoring of green logistics for fresh produce based on a support vector machine. Sustainability 2020, 12, 7569. [Google Scholar] [CrossRef]
- Perdana, T.; Tjahjono, B.; Kusnandar, K.; Sanjaya, S.; Wardhana, D.; Hermiatin, F.R. Fresh agricultural product logistics network governance: Insights from small-holder farms in a developing country. Int. J. Logist. Res. Appl. 2022, 26, 1761–1784. [Google Scholar] [CrossRef]
- Bian, X.; Yao, G.; Shi, G. Social and natural risk factor correlation in China’s fresh agricultural product supply. PLoS ONE 2020, 15, e0232836. [Google Scholar] [CrossRef]
- Blondel, V.D.; Guillaume, J.-L.; Lambiotte, R.; Lefebvre, E. Fast unfolding of communities in large networks. J. Stat. Mech. Theory Exp. 2008, 2008, P10008. [Google Scholar] [CrossRef]
- Hu, Y. Efficient, high-quality force-directed graph drawing. Math. J. 2005, 10, 37–71. [Google Scholar]
- Orefice, G.; Fontagné, L.; Guimbard, H. Tariff-Based Product-Level Trade Elasticities. In Mendeley Data; Elsevier Inc.: Amsterdam, The Netherlands, 2024; Volume 10. [Google Scholar] [CrossRef]
- World Trade Organization (WTO). Structural Gravity. Available online: https://www.wto.org/english/res_e/reser_e/structural_gravity_e.htm (accessed on 7 March 2025).
- Global Trade Analysis Project (GTAP). Data & Models. Available online: https://www.gtap.agecon.purdue.edu/about/data_models.asp (accessed on 7 March 2025).
- Food and Agriculture Organization (FAO). Managing Risks to Build Climate-Smart and Resilient Agrifood Value Chains: The Role of Climate Services; FAO: Rome, Italy, 2022. [Google Scholar] [CrossRef]
- Disdier, A.-C.; Fontagné, L.; Mimouni, M. The impact of regulations on agricultural trade: Evidence from the SPS and TBT agreements. Am. J. Agric. Econ. 2008, 90, 336–350. [Google Scholar] [CrossRef]
- MND Staff. Drought Watch: Mexico’s 2025 Dry Season could Last 6 Long Months. Mexico News Daily, 8 January 2025. Available online: https://mexiconewsdaily.com/news/drought-mexico-2025/ (accessed on 8 March 2025).
Disclaimer/Publisher’s Note: The statements, opinions and data contained in all publications are solely those of the individual author(s) and contributor(s) and not of MDPI and/or the editor(s). MDPI and/or the editor(s) disclaim responsibility for any injury to people or property resulting from any ideas, methods, instructions or products referred to in the content. |
© 2025 by the author. Licensee MDPI, Basel, Switzerland. This article is an open access article distributed under the terms and conditions of the Creative Commons Attribution (CC BY) license (https://creativecommons.org/licenses/by/4.0/).