1. Introduction
In today’s world, desktop and laptop computers are widely used by both individuals and organizations for a variety of tasks. The environmental impact and cost associated with these devices are considerable. It is important to understand the distinctions between desktops and laptops to make well-informed technological purchasing decisions.
Life cycle assessment (LCA) is a systematic methodology for evaluating the environmental impacts associated with all stages of a product’s life cycle, from resource extraction to disposal [
1,
2,
3,
4]. According to ISO 14040:2006 [
5] and ISO 14044:2006 [
6], LCA provides a framework for assessing potential environmental effects, enabling informed decision-making in sustainability practices. The procedure consists of several essential stages that guarantee thorough examination and comparison of products or systems. While LCA is a powerful tool for sustainability assessment, it faces challenges, such as methodological inconsistencies and the need for updates to remain relevant in evolving environmental contexts [
3].
LCA has been increasingly applied to computers, reflecting a growing awareness of their environmental impact throughout their life cycle. These assessments were aimed at evaluating the sustainability of computers from production to disposal, highlighting areas for improvement in design and waste management. While traditional desktop computers (DPCs) have significant environmental impacts throughout their life cycle, alternative computing devices such as Raspberry Pi 4 single-board computers (SBCs) and all-in-one PCs (APCs) offer substantial reductions in environmental impacts, with SBCs reducing the impact by up to 92% and APCs having half the impact of DPCs [
7,
8]. Additionally, proper e-waste management and recycling can significantly mitigate the environmental consequences of computing devices, as demonstrated by the positive effects of official disposal channels in India and a recommended recycling rate of at least 63% for end-of-life PCs [
4,
9].
Schischke et al. [
7] applied LCA to computers and laptops, focusing on product carbon footprint calculations to guide design decisions and track climate policy progress, although current methodologies require advancement and harmonization for better comparability. They recognized the need for the harmonization of LCA and the draft methodology developed for advanced LCA practices.
The authors conducted a comprehensive review of life cycle assessment studies concerning computers and electronic devices, which included the product carbon footprint (PCF) of brands such as HP, Asus, Dell, and Lenovo, as demonstrated in a recent study [
9]. All computers met the same specifications in terms of processor, random access memory (RAM), solid-state drive (SSD) storage, and laptops with 16″ displays. The main findings revealed that desktop computers (central processing unit only) emitted between 396 and 719 kg CO
2eq, with Lenovo being the highest emitter at 719 kg CO
2eq, whereas ASUS recorded the lowest emissions at 396 kg CO
2eq. For laptops, the emissions ranged from 325 to 585 kg CO
2eq, with ASUS having the highest emissions at 585 kg CO
2eq and HP the lowest at 325 kg CO
2eq. The study also highlighted inconsistencies in the methodologies and assumptions used by different manufacturers, emphasizing the importance of establishing standardized practices for carbon footprint assessments across the industry.
Life cycle costing (LCC) is a technique that can be used to estimate the total cost of ownership of IT equipment (and possibly some environmental externalities). It is a method for making effective, long-term investment decisions because some cost aspects may not be immediately apparent to the decision-maker. For example, a higher initial investment may be required to achieve lower life cycle costs, more durable portable equipment, and lower repair and upgrading costs. When externalities are considered, LCC is particularly relevant for improving environmental performance. The costs typically considered in an LCC calculation are acquisition costs, delivery and installation costs, maintenance and service costs, operation costs (energy consumption), fees, taxes, and other costs, as well as externalities (CO
2 emissions linked to energy consumption) [
10].
Previous research has explored the environmental impact of various electronic devices, but few studies have specifically compared desktops and laptop computers from environmental and cost perspectives. Addressing this knowledge gap is important for individuals and organizations to make environmentally and financially responsible technological choices.
This study aims to answer the following question: “What are the environmental and cost implications of using desktops instead of laptops and how do these two types of devices compare from a Life Cycle Assessment (LCA) and Life Cycle Costing (LCC) perspective?”. These answers can help people and businesses make better choices when buying computers, considering both the environmental and cost factors.
2. Materials and Methods
LCA screening is typically performed using readily accessible data. Because the aim is to identify the most important processes, data quality is less important than that in a full LCA [
11]. However, it is important to include all processes and materials that can be of major importance. If the processes or materials are known to be of minor importance, they can be excluded.
The attributional LCA study was conducted using the methodology prescribed in the ISO 14040/44:2006 standards [
5,
6] with the help of SimaPro software. The process involved the following key phases that ensure a comprehensive analysis and comparison of products or systems: (1) goal and scope definition, which establishes the purpose of the assessment and the boundaries of this study; (2) inventory analysis, which involves quantifying all inputs and outputs related to the product system, including materials, energy, and emissions; (3) impact assessment, which translates inventory data into potential environmental impacts, allowing for the evaluation of trade-offs across different impact categories; (4) interpretation, which involves drawing conclusions and providing recommendations based on the findings, facilitating decision-making under uncertainty.
SimaPro is among the most extensively used tools for life cycle assessment (LCA). Despite this high regard, several potential biases and limitations exist when processing specific types of data. For instance, SimaPro employs commercial databases, such as Ecoinvent, which may lack regional specificity or be outdated for certain sectors. If the data are not tailored to a specific geographical context (e.g., European versus Chinese), the results may not accurately reflect the actual environmental impacts. Additionally, SimaPro may utilize average data over an extended time range, potentially leading to underrepresentation or mischaracterization of emerging technologies or recent innovations in computers and devices. To address the limitations of SimaPro, a sensitivity analysis was conducted, considering the geography where the primary devices (desktop, LCD, and laptop) were manufactured and utilized.
The LCC was elaborated using the life cycle costing tool for the green public procurement (GPP) of computers and monitors developed by the European Union [
10]. The LCC tool considers all the costs incurred during the lifetime of the product, work, or service: initial acquisition costs (purchase and installation); operating and maintenance costs (especially energy, as computers are energy-consuming products with considerable operating costs); other costs (such as residual value); and costs of environmental externalities (e.g., CO
2 emissions due to energy consumption during operation).
The EU Green Public Procurement life cycle costing (LCC) tool was specifically developed to assist public-sector procurement officers in making environmentally and economically sustainable decisions regarding the acquisition of computers and monitors. While the tool enhances the usability of LCC by simplifying its application, it may inadvertently oversimplify cost structures and fail to fully support comprehensive environmental-economic modeling.
2.1. Life Cycle Assessment
2.1.1. Goal and Scope
The objective of this study was to evaluate and compare the environmental and economic implications of desktop- and laptop-based computing solutions throughout their life cycles (cradle to grave). These devices have similar processing power, memory, and graphics capabilities, making them suitable for everyday personal and light business use. Both solutions should be suitable for the user, with the following functionalities: accessing websites, searching for information, and general web navigation; easy checking of and interacting with various social media platforms; supporting web-based email services; allowing users to send, receive, and organize emails; enabling users to perform fundamental home and small-business productivity tasks, such as handling basic office applications such as Word, Excel, and PowerPoint for document creation and editing; watching online videos, TV shows, and movies; managing libraries of music and photos; being suitable for basic-to-intermediate school coursework and research; handling multiple basic applications simultaneously; and being suitable for video calls and online meetings.
Functional Unit (FU)
The functional unit was defined as the “use of one computer to perform fundamental home and small-business productivity tasks for 4 years”. The two systems studied and the associated reference flows that satisfy the functional unit are as follows:
System 1: one desktop computer, one LCD screen, one keyboard, and one mouse.
System 2: one laptop computer and one power adaptor for the laptop.
The results of this study are intended to be transmitted to those responsible for purchasing IT equipment at home or in small businesses who are looking to make environmentally and financially responsible technological choices.
Systems Limits
The system boundaries of this study are shown in a simplified manner in
Figure 1. This means that the LCA encompasses the entire product life cycle from cradle to grave, including the stages of production/manufacturing (with assembly), as well as the use and end-of-life phases.
System S1 represents the product system (a desktop computer) comprising the production, use, and end-of-life (EoL) stages, which include a desktop computer (main unit), LCD screen (21.4″), keyboard, and mouse. The desktop (main unit) consists of a chassis, processor (Intel® Core™ i3 14100 Intel Corporation, Santa Clara, CA, USA), graphics (Intel® UHD Graphics 730 Intel Corporation, Santa Clara, CA, USA), memory (8 GB), storage (256 GB SSD), expansion cards, and a power supply, including various types of cables, diverse drivers, cooling fans, and heat sinks.
System S2 represents the product system (laptop computer), comprising the production, use, and EoL processes, including the chassis, battery, display (15.6″), processor (i3-1315U), graphics (Intel® 13th-Generation i3-1315U Intel Corporation, Santa Clara, CA, USA), memory (8 GB), storage (256 GB), power supply unit, and power adapter.
The usage phases of both systems were modeled according to the data obtained from the manufacturer.
The end-of-life of both systems was modeled: 27% of the devices were dismantled, and 77% were mechanically treated, as assumed in the ecoinvent database available in the SimaPro 9.6.01 software [
12].
2.1.2. Life Cycle Inventory (LCI)
According to ISO 14040:2006, the life cycle inventory is the LCA phase that involves the quantified compilation of inputs and outputs that occur in the process being studied. The LCI data of the foreground system for the two systems were based on data published on the Dell website and are presented in
Table 1. They are related to the production, use, and end-of-life of different devices, along with the associated ecoinvent processes used to model them. Choosing the same brand helps isolate the environmental impact differences that arise from the product type (desktop vs. laptop), not the manufacturer. This results in a cleaner and more reliable comparison. All ecoinvent datasets for the devices were considered with the geography “global” (GLO) if available and “Rest of the World” (RoW) or Swiss (CH) if not available. Using the SimaPro 9.6.01 software, the life cycle inventory data were calculated, which served as the basis for further impact assessments, as described later.
For each device, it was assumed that the inputs and outputs of the process were directly extracted from the standard ecoinvent process. This extraction was determined by a ratio calculated using the mass of each specific device compared with the mass of the device modeled in the ecoinvent database [
13].
Table 1.
Inventory data for the devices and their associated ecoinvent processes.
Table 1.
Inventory data for the devices and their associated ecoinvent processes.
| Process | Component | Quantity | Cost | Ecoinvent Process |
|---|
| Production | Desktop (a),(b) | 5.678 kg | EUR 433.83 | Computer, desktop, without screen {GLO}|market for|APOS, U |
| | LCD (screen size 21.4″) (c),(d) | 4.11 kg | EUR 83.07 | Display, liquid crystal, 17 inches {GLO}|market for|APOS, U |
| | Keyboard (e) | 0.503 kg | EUR 18.45 | Keyboard {GLO}| market for|APOS, U |
| | Mouse (f) | 0.09 kg | EUR 18.45 | Pointing device, optical mouse, with cable {GLO}|market for|APOS |
| | Laptop (screen size 15.6″) (g),(h) | 2.57 kg | EUR 580.61 | Computer, laptop {GLO}|market for|APOS, U |
| | Power adapter for laptop | 1 un
(0.37 kg) | Included with the laptop | Power adapter, for laptop {GLO}|market for|APOS, U |
| Use (4 yr)—Energy Demand (ETEC) | Desktop (a) | 50.5 KWh/yr | | Electricity, low voltage {GLO}|market group for|APOS, U |
| | LCD (c) | 34.7 KWh/yr | | Electricity, low voltage {GLO}|market group for|APOS, U |
| | Laptop (g) | 20.7 KWh/yr | | Electricity, low voltage {GLO}|market group for|APOS, U |
| End of life | Desktop mechanical treatment | 77% | | Used desktop computer {GLO}|treatment of, mechanical treatment|APOS, U |
| Laptop mechanical treatment | 77% | Used laptop computer {GLO}|treatment of, mechanical treatment|APOS, U |
| LCD mechanical treatment | 77% | Used liquid-crystal display {GLO}|treatment of used liquid-crystal display, mechanical treatment|Cut-off, U |
| Remaining devices—mechanical treatment | 100% | Used IT accessory {GLO}|treatment of used IT accessory, mechanical treatment|APOS, U |
| | Desktop manual dismantling | 23% | | Used desktop computer {RoW}| treatment of, manual dismantling|APOS, U |
| Laptop manual dismantling | 23% | Used laptop computer {CH}|treatment of, manual dismantling|APOS, U |
| LCD manual dismantling | 23% | Used liquid-crystal display {RoW}|treatment of used liquid crystal display, manual dismantling|Cut-off, U |
2.1.3. Life Cycle Impact Assessment (LCIA)
The LCIA categorizes and characterizes life cycle inventory data to evaluate their impact across one or more categories. The evaluation of the product carbon footprint was conducted using SimaPro 9.6.01 software, in combination with the IPCC 2021 GWP100 V1.03 method. This method is based on the final government distribution version of the IPCC report AR6 Climate Change [
22]. The GWP 100 (time horizon of 100 years) was used as the default. The results were cumulatively calculated as GWP100.
2.2. Life Cycle Costing
The costs considered in this LCC calculation were acquisition costs, operational costs (energy consumption), and externalities (CO2 emissions linked to energy consumption). LCC help organizations and individuals make cost-effective decisions by considering long-term expenses rather than the initial purchase price.
An LCC tool for computers and monitors developed by the European Commission [
23] was used to estimate the total cost of the computer systems.
The following assumptions were made regarding LCC costs:
- -
Evaluation period = 4 years for all devices.
- -
Discount rate = 0.
- -
Electricity price = USD 0.151 (0.139 EUR)/kWh (global average for residential users in 2024) according to Globalpetrolprices.com [
24].
- -
Electricity annual price increase = 0.
- -
CO2eq emissions of electricity = 0.718 kg CO2eq/KWh (calculated in SimaPro for electricity, low voltage, in global geography).
- -
Cost of CO
2eq = USD 32 (29,54 EUR)/ton CO
2eq (global average in 2024) according to Visualcapitalist [
25].
- -
The acquisition cost and energy consumption (ETEC values) of devices are given in
Table 1.
3. Results
3.1. LCA Results
Figure 2 illustrates a comparative analysis of the carbon footprint of two types of computer systems: a desktop (including the main unit, LCD, keyboard, and mouse) and a laptop (accompanied by its power adaptor). The evaluation was conducted using the IPCC 2021 GWP100 V1.03 method. This figure categorizes the carbon footprint according to various stages of the product life cycle and its components.
The desktop system exhibited an overall carbon footprint of 679.1 kg CO2eq, of which 113.2 kg CO2eq was associated with the central unit production, 400.2 kg CO2eq with the LCD, 13 kg CO2eq with keyboard, and 4.8 kg CO2eq with the mouse. The overall carbon footprint of the laptop system was 286.1 kg CO2eq, of which 218.7 kg CO2eq was attributable to the main unit production, 59.4 kg CO2eq was attributable to the use phase, and 4.5 kg CO2eq was attributable to the power adaptor. The laptop demonstrated a higher production footprint (218.7 kg CO2eq) than the main desktop unit (113.2 kg CO2eq). The desktop exhibited a significantly higher use phase footprint (145 kg CO2eq) than the laptop (59.4 kg CO2eq). Both systems displayed relatively low disposal footprints, with the laptop’s being marginally higher (3.5 kg CO2eq) than the desktop’s (3 kg CO2eq), suggesting that end-of-life management may be less carbon intensive than the production and use phases.
3.2. LCC Results
The LCC results for the two computer systems are shown in
Figure 3.
The LCC for the desktop system was EUR 608.4, of which EUR 466.19 was due to the desktop (unit), EUR 105.31 to the LCD, and EUR 18.45 to each of the remaining pieces of equipment (keyboard and mouse). Investment costs (EUR 553.80) represented the majority of these costs, followed by operating costs (EUR 47.37), and externality costs (EUR 7.22). The LCC of the laptop was EUR 593.88, of which EUR 580.61 was investment costs, and EUR 11.51 and EUR 1.76 were operating and externality costs, respectively. Although the laptop computer had a higher investment cost than the desktop computer (+ EUR 26.81), the LCC was lower (−EUR 14.52) because the operating and external costs were lower.
The total electricity use was 340.8 KWh for the desktop system (202 KWh for the desktop unit and 138.8 KWh for the display), while it was 82.8 KWh for the laptop.
The total CO2eq emissions during the use phase were 244.7 kg CO2eq for the desktop system (145.04 kg CO2eq for the desktop unit and 99.66 kg CO2eq for the display), while they were 59.45 kg CO2eq for the laptop.
3.3. Sensitivity Analysis
3.3.1. LCA
A sensitivity analysis was performed to assess how geographical differences in the manufacturing and use locations of the main devices (desktop, LCD, and laptop) affected the results. Three scenarios were analyzed:
- -
Scenario 1: Refers to this initial study, in which process modeling in SimaPro software was performed for global geography. It was considered that the devices were manufactured, used, and treated at the end of their lives at a global level.
- -
Scenario 2: In this scenario, during process modeling in the SimaPro software, electricity (Global) was replaced by electricity (China) in the equipment manufacturing phase and by European electricity (ENTSO-E) in the use phase. It was considered that the devices were manufactured in China and used in Europe.
- -
Scenario 3: Refers to the same geography as Scenario 2, but the values were obtained from LCA studies of equipment manufacturers [
14,
16,
20]. These studies were created using DELL’s Product Carbon Footprint Calculator Version 1, an ISO14040-certified parametric LCA modeling tool powered by Sphera’s LCA Calculator. The selected impact assessment methodology for the life cycle impact assessment (LCIA) was “EF 3.0 Climate Change—total”, using the indicator global warming potential 100 (GWP100) measured in CO
2eq.
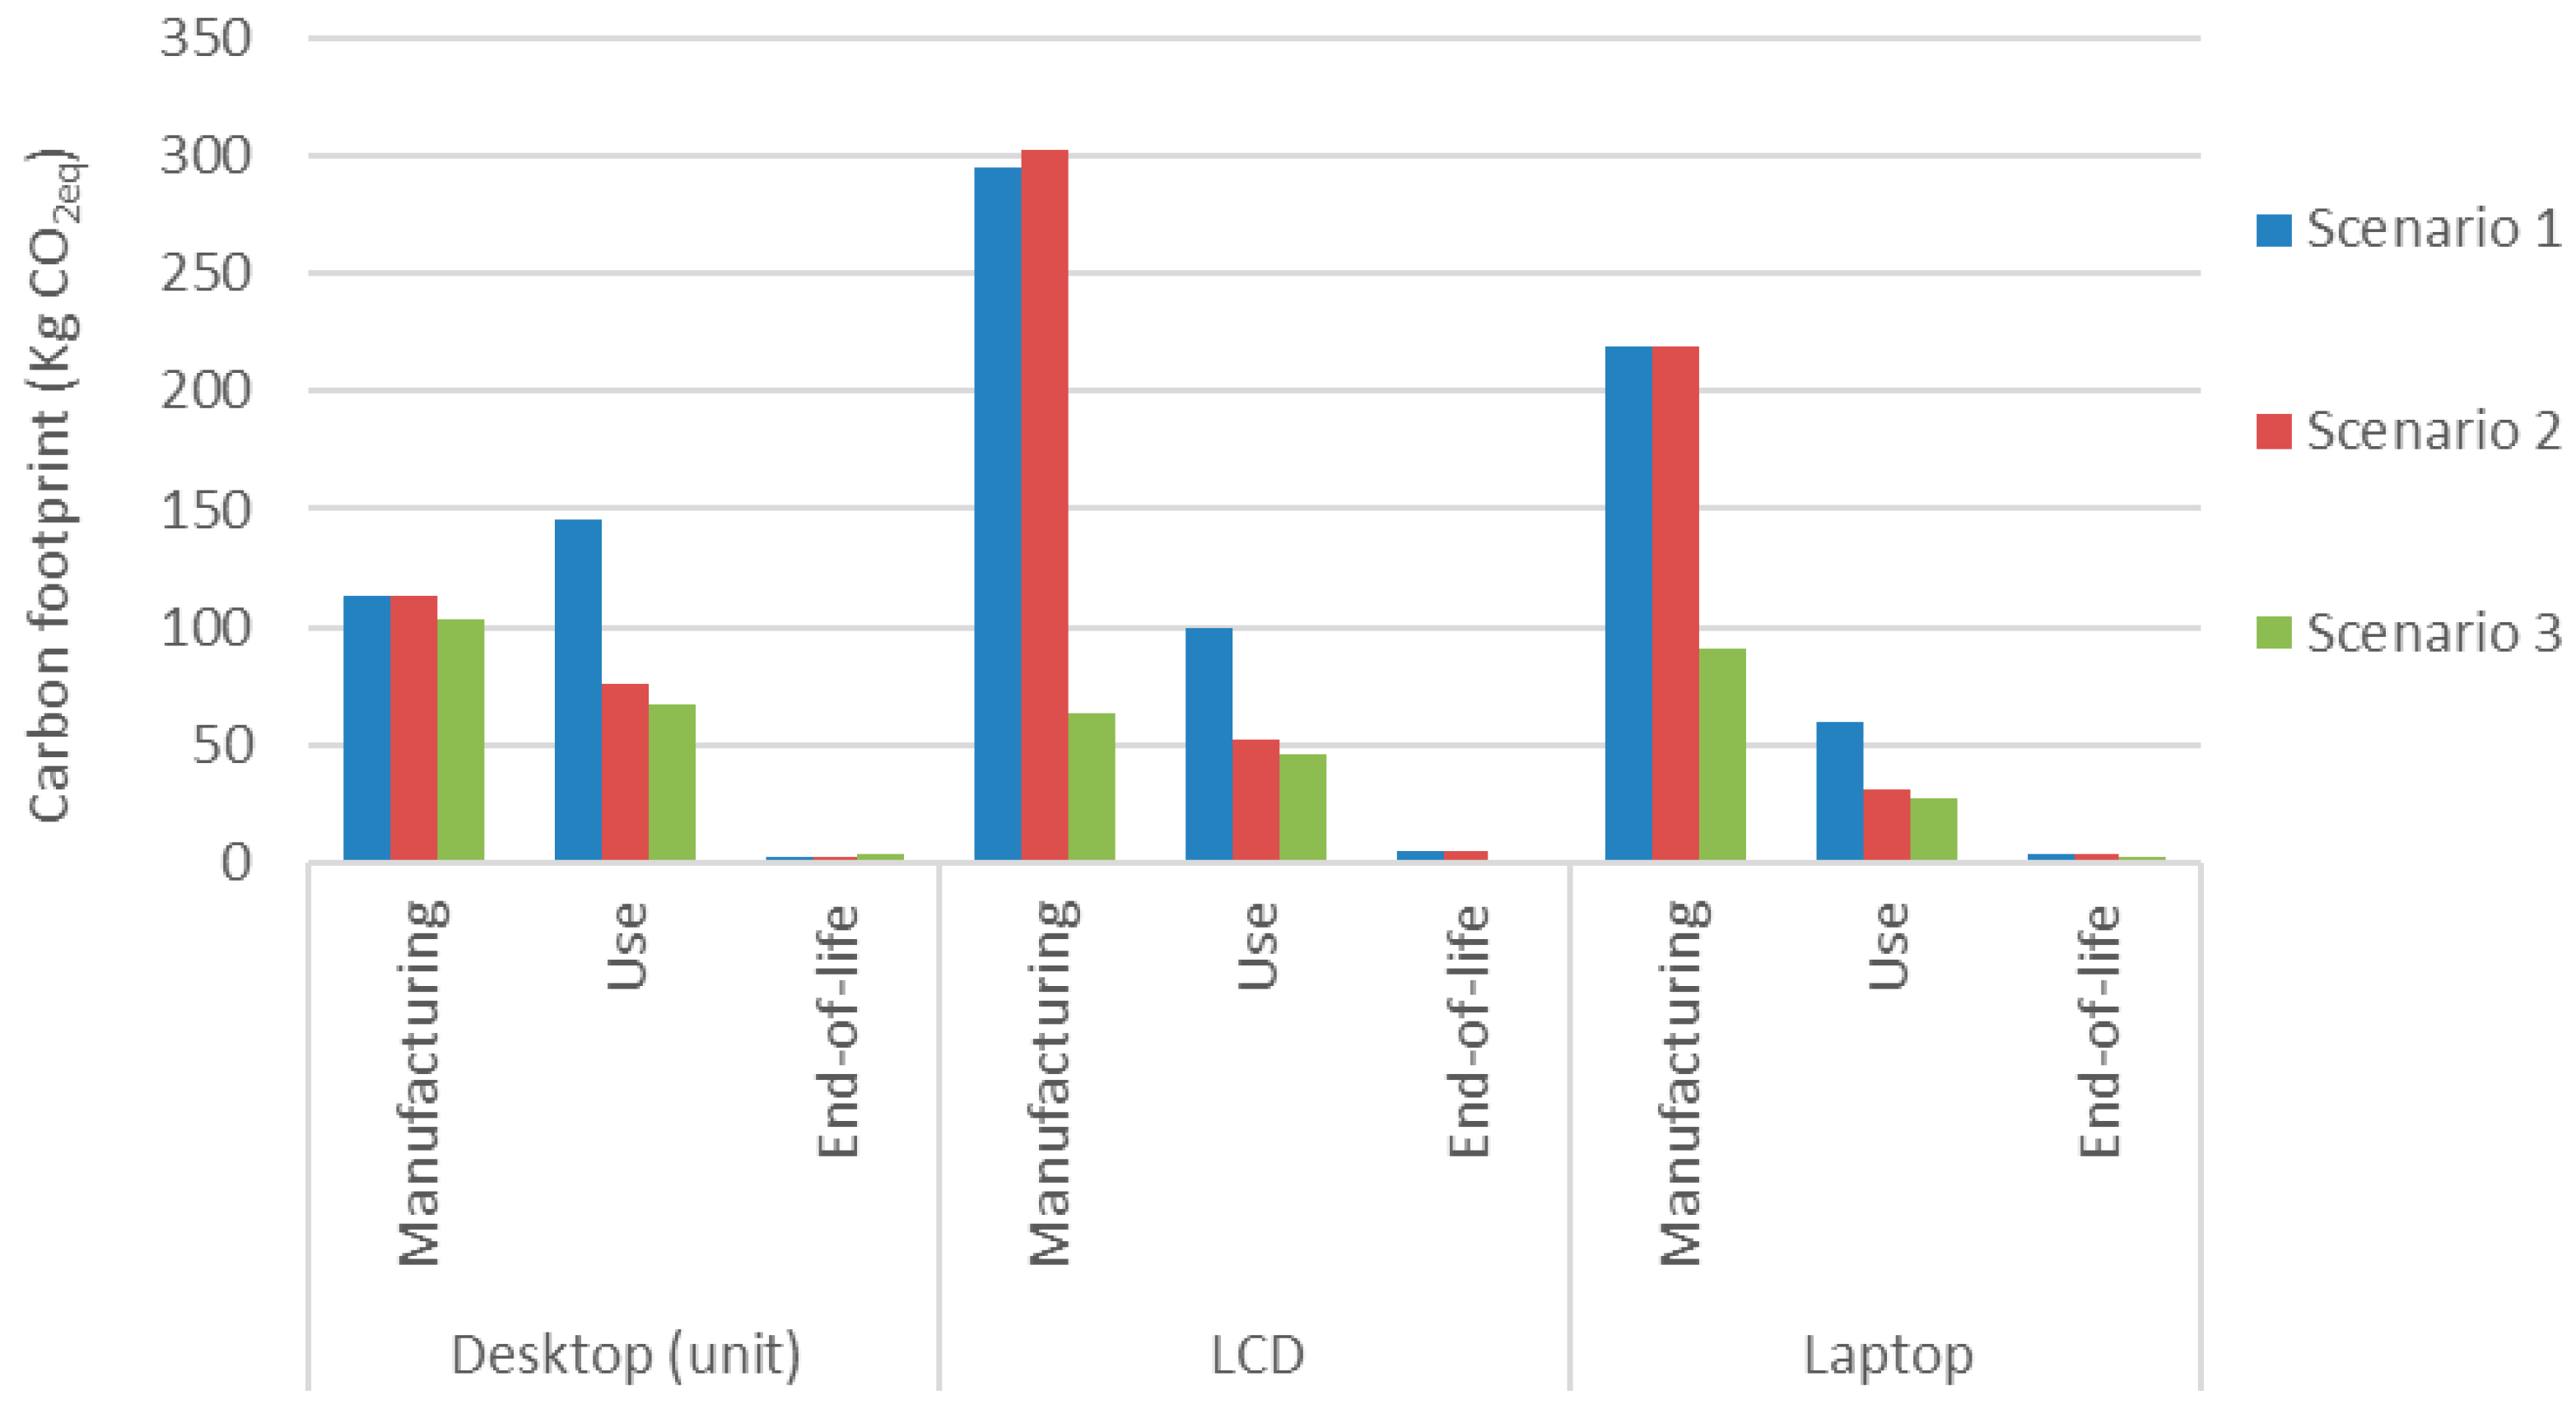
The results of the LCA sensitivity analysis are shown in
Figure 4. To allow comparison between Scenario 3 and Scenarios 1 and 2, the carbon footprints of desktop and LCD manufacturing corresponded to the manufacturing + distribution, and the carbon footprint of LCD use was corrected from five to four years of the product lifetime.
Figure 4 shows that Scenario 1 presented the highest values for the carbon footprint for all devices and life cycle phases, except for LCD manufacturing, where Scenario 2 was the most relevant. It is also noted that for all devices and scenarios, the manufacturing phase had the largest carbon footprint, except in Scenario 1 and for desktop (unit) manufacturing, where the usage phase was the most impactful.
The desktop (unit) in the manufacturing phase had a relatively consistent carbon footprint in Scenarios 1 and 2 (113.2 and 113.6 kg CO2eq) but a lower footprint in Scenario 3 (103 kg CO2eq). In the use phase, there was a significant decrease from Scenario 1 (145.0 kg CO2eq) to Scenarios 2 (75.7 kg CO2eq) and 3 (67 kg CO2eq). For end of life, similar results were obtained for Scenarios 1 and 2 (3.0 kg CO2eq), and slightly higher values were obtained for Scenario 3 (4 kg CO2eq).
For the LCD in the manufacturing phase, Scenarios 1 and 2 showed high values (295.2 and 301.7 kg CO2eq), while Scenario 3 showed a dramatically lower value (63.8 kg CO2eq). For the use phase, a decreasing trend was seen from Scenario 1 (99.6 kg CO2eq) to Scenario 2 (52.0 kg CO2eq) and Scenario 3 (45.9 kg CO2eq).
The manufacturing phase for the laptop showed similar results for Scenarios 1 and 2 (218.7 and 219.4 kg CO2eq) but much lower values for Scenario 3 (91 kg CO2eq). For the use phase, a decreasing trend from Scenario 1 (59.4 kg CO2eq) to Scenario 2 (31.0 kg CO2eq) to Scenario 3 (27 kg CO2eq) was observed. For end of life, the values were similar for Scenarios 1 and 2 (3.5 kg CO2eq) and lower for Scenario 3 (2 kg CO2eq).
3.3.2. LCC
Regarding the sensitivity analysis of LCC, the following assumptions were adopted for Scenarios 2/3:
- -
Electricity price = 0.2889 EUR/kWh (average for European residential users), according to the EU [
26].
- -
CO2eq emissions of electricity = 0.375 kg CO2eq/KWh (calculated in SimaPro for electricity, low voltage, in Europe (ENTSO-E) geography).
- -
Cost of CO
2eq = 65.14 EUR/ton CO
2eq (EU average in 2024), according to Trading Economics [
27].
From Scenario 1 to Scenarios 2/3, the LCC of the desktop system went from EUR 608.40 to EUR 660.58 (+8.6%), and that of the laptop system went from EUR 593.88 to EUR 606.55 (+2.1%), which means an increase in the difference in the LCC of the two systems being compared. While investment costs remained the same, operating costs for the desktop system increased from EUR 47.37 to EUR 98.46%, and externality costs increased from EUR 7.22 to EUR 8.32. For the laptop system, operating costs increased from EUR 11.51 to EUR 23.92, and the externality costs increased from EUR 1.76 to EUR 2.02.
3.4. Assumptions and Limitations of This Study
This study on life cycle assessment (LCA) and life cycle costing (LCC) is based on several foundational assumptions and is subject to specific limitations. It exclusively examines desktop and laptop computers used in home and small-business settings over a four-year timeframe, thereby omitting other device categories and longer usage periods. The analysis depends on published data and standard ecoinvent processes, which may not fully capture the latest manufacturing techniques or specific product details. Furthermore, the use of global and regional averages for certain calculations may not accurately reflect the local variations in manufacturing processes, energy sources, or waste disposal practices. This study presumes fixed percentages for dismantling and mechanical treatment, which might not fully represent the intricacies of e-waste management. The LCC analysis considers only acquisition costs, energy consumption costs, and CO2 emission externalities, neglecting other potential expenses such as maintenance or upgrades. Additionally, some ecoinvent datasets related to electronic components, as utilized in the SimaPro software, were compiled in the 2000s and may not reflect current data.
4. Discussion
This study revealed that the manufacturing carbon footprint of devices (desktops, LCDs, and laptops) is generally the highest, followed by that of the use phase, while the end-of-life phase has the lowest impact. Similar results were obtained by Loubet et al. [
8] and Choi et al. [
28], who emphasized the significance of the manufacturing stage of personal desktop computers. In a study by Loubet et al. [
8], equipment manufacturing accounted for approximately 70% of global warming for all-in-one computers (APCs) and desktop computers (DPCs), followed by the use phase. Choi et al. [
28] identified pre-manufacturing (raw materials, components, and part production) as a primary contributor to environmental burden, underscoring the need for more sustainable manufacturing practices. However, for Scenario 1 (global manufacturing and use phase), the desktop (unit) carbon footprint was larger in the use phase than in the manufacturing phase. Similar results were obtained by Duan et al. [
29], who emphasized that the environmental impact of the use phase is largely due to energy consumption, with China’s energy mix heavily reliant on coal and oil, leading to significant SO
2 and greenhouse gas emissions.
Although laptops are often marketed as more energy-efficient because of their smaller size, they exhibit a higher carbon footprint during the production phase than desktops (main unit). This discrepancy can be attributed to the inclusion of screens and lithium-ion batteries in laptops, which are carbon-intensive because of their mining, chemical processing, and energy consumption. Additionally, the use of lightweight materials, such as aluminum, magnesium alloys, or composites, to reduce weight further increases the energy demand during processing. To mitigate the carbon footprint of laptops and, to some extent, desktops during the design and manufacturing stages, a strategic emphasis on materials, energy consumption, product architecture, and supply chains is essential.
The significant variation between Scenarios 1, 2, and 3 indicates that geographic location plays an important role, mainly because of differences in energy sources and efficiency in different regions. Global geography (Scenario 1) consistently showed higher carbon footprint values, especially in the use phase. The substantial reduction in the carbon footprint during the use phase in Scenario 2 proves that the energy mix or energy efficiency in Europe is more favorable in terms of carbon emissions compared to the global average. As an illustration, the application of SimaPro software for determining the carbon emissions of 1 MJ of electricity (low voltage, market group for) resulted in findings of 0.104 kg CO2eq for electricity sourced from Europe and 0.199 kg CO2eq for electricity on a global scale. This is because of factors such as a higher proportion of renewable energy sources in the electricity grid, more efficient power generation and distribution systems, and stricter energy efficiency regulations for electronic devices. The small divergence in the carbon footprint values for the use phase between Scenarios 2 and 3, despite both considering use in Europe, could be attributed to several factors: Scenario 2 uses modeled data from SimaPro software in combination with the IPCC 2021 GWP100 V1.03 method, while Scenario 3 uses a specific tool (DELL’s Product Carbon Footprint Calculator) and methodology (EF 3.0 Climate Change—total). This difference in data sources and calculation methodologies could lead to variations in the calculated carbon footprint. While both scenarios consider European use, there might be differences in how they account for the specific energy mix in Europe.
The regional energy structure significantly influences the carbon footprint associated with the production and utilization of computer equipment. A sensitivity analysis revealed that manufacturing in regions with high carbon emissions, such as China, and usage in areas with carbon-intensive energy grids, such as the global average, can substantially elevate emissions. Conversely, the implementation of policies promoting renewable energy and advancements in clean technology can reduce emissions by more than 50%, as demonstrated in Scenario 3. Comprehensive strategies that integrate clean energy policies, low-carbon design, and life cycle assessment (LCA)-based procurement are crucial for mitigating the environmental impacts associated with information and communication technology (ICT).
Based on the data provided in this study, it is evident that the manufacturer’s data (Scenario 3) generally showed lower carbon footprint values than those of Scenarios 1 and 2, particularly during the manufacturing phase. This trend is consistent across devices, such as desktops, LCDs, and laptops. The most striking difference was observed in the manufacturing phase of the LCD and laptop, where Scenario 3 reported a significantly lower value than the other scenarios. Possible reasons could include the more efficient materials and manufacturing processes used by manufacturers compared to those used in the ecoinvent database available in the SimaPro software, where Scenarios 1 and 2 were modeled. Loubet et al. [
8] emphasized the necessity of updating electronic life cycle inventory (LCI) models to enhance data representativeness as the industry is rapidly evolving. The ecoinvent datasets related to electronic components were outdated as they were collected in the 2000s.
Electricity consumption is a critical factor in the usage phase. It was evident that laptops utilized less electricity than desktops, thereby mitigating environmental impacts during this phase. This observation also indicates that manufacturers are persistently striving to develop products that are more energy-efficient than traditional models.
This study indicated a frequent positive correlation between cost and carbon footprint, particularly during the use phase, in which energy consumption influences both factors. Nevertheless, this relationship was not invariably straightforward, as exemplified by laptops, which exhibited higher initial costs but lower overall life cycle costs and carbon footprints. This highlights the necessity of considering the entire life cycle in both the environmental and economic evaluations of computer systems.
Users can contribute significantly to mitigating the environmental impact of computers during their operational phases. Practical and impactful strategies include utilizing the “sleep”, “hibernate”, or “eco” settings to minimize energy consumption when the device is idle. Given that screens are among the largest powerful consumers, adjusting their brightness can lead to energy savings. Additionally, leaving a laptop continuously plugged in not only wastes electricity but also potentially degrades battery life.
5. Conclusions
This study presents an innovative integration of life cycle assessment (LCA) with life cycle costing (LCC) to comprehensively evaluate desktop and laptop computers. It incorporates geographical sensitivity analysis, compares modeled scenarios with actual manufacturer data, and underscores the critical necessity for updated life cycle inventory data in electronics LCA. This study offers significant insights into the environmental and economic impacts across diverse regional contexts, elucidating the environmental consequences of electronic devices throughout various life cycle stages and geographical settings. Generally, the manufacturing phase is the primary contributor to the carbon footprint of desktops, LCDs, and laptops, followed by the usage phase, whereas the end-of-life stage has the least impact. This emphasizes the necessity for ongoing attention to sustainable manufacturing practices, updating life cycle inventory models, and enhancing the energy efficiency of electronic devices to minimize their overall carbon emissions. The notable differences in the carbon footprint values among Scenarios 1, 2, and 3 underscore the significance of considering geographical factors, energy sources, and specific manufacturer data when evaluating the carbon footprint of electronic devices.
Future research should broaden its scope to encompass a wider range of brands, regions, and countries, thereby facilitating a more comprehensive understanding of the environmental and economic performance of computer equipment in diverse geographical, economic, and policy contexts. Concurrently, the application of a multi-criteria decision analysis method is recommended to incorporate various environmental impact factors and economic indicators, thus offering decision-makers a more robust reference framework. Given the continuous technological advancements and rapid evolution of computer equipment, it is imperative to consider the potential impacts of emerging technologies, such as artificial intelligence and quantum computing, on the environmental and economic aspects of computer equipment. Additionally, attention should be directed towards achieving sustainable development goals during the development of these new technologies.


