Article

AI-Enabled Digital Twin Framework for Safe and Sustainable Intelligent Transportation

Department of Civil and Environmental Engineering, University of Wisconsin, Madison, WI 53705, USA
*
Author to whom correspondence should be addressed.
Sustainability 2025, 17(10), 4391; https://doi.org/10.3390/su17104391
Submission received: 13 April 2025 / Revised: 3 May 2025 / Accepted: 7 May 2025 / Published: 12 May 2025

Abstract

:
This study proposes an AI-powered digital twin (DT) platform designed to support real-time traffic risk prediction, decision-making, and sustainable mobility in smart cities. The system integrates multi-source data—including static infrastructure maps, historical traffic records, telematics data, and camera feeds—into a unified cyber–physical platform. AI models are employed for data fusion, anomaly detection, and predictive analytics. In particular, the platform incorporates telematics–video fusion for enhanced trajectory accuracy and LiDAR–camera fusion for high-definition work-zone mapping. These capabilities support dynamic safety heatmaps, congestion forecasts, and scenario-based decision support. A pilot deployment on Madison’s Flex Lane corridor demonstrates real-time data processing, traffic incident reconstruction, crash-risk forecasting, and eco-driving control using a validated Vehicle-in-the-Loop setup. The modular API design enables integration with existing Advanced Traffic Management Systems (ATMSs) and supports scalable implementation. By combining predictive analytics with real-world deployment, this research offers a practical approach to improving urban traffic safety, resilience, and sustainability.

1. Introduction

As vehicle numbers continue to rise, traffic congestion, safety, and environmental impacts have become pressing challenges for transportation agencies worldwide. In pursuit of more sustainable and efficient mobility, the transportation industry has adopted Advanced Traffic Management Systems (ATMSs), which leverage data management and analytical tools to disseminate real-time traffic information via electronic signs, mobile apps, and other channels [1]. ATMSs typically comprise multiple components such as traffic signal control systems [2,3], monitoring and surveillance equipment, incident detection and management tools, and information dissemination mechanisms [4].
However, traditional ATMSs generally focus on collecting and broadcasting traffic data [5] rather than forming a continuous, adaptive model of the transportation network. As transportation infrastructure and vehicles become increasingly instrumented and interconnected, a vast number of real-time and historical data are becoming available. While such data can potentially fuel more sophisticated analytics and more proactive responses, existing ATMSs often lack the mechanisms to integrate, simulate, and predict future traffic scenarios in a holistic manner [6].
Digital twin (DT) technology addresses these gaps by bridging the physical transportation network with a dynamic virtual counterpart [7,8,9]. Originating from product lifecycle management and later expanded by NASA for aircraft maintenance [10], DTs have evolved into cyber–physical systems that synchronize real-world conditions with computational models [11]. This virtual representation not only ingests large volumes of data but also processes, simulates, and learns from them, thereby enabling real-time and predictive insights. First, it continuously synchronizes with evolving physical conditions, creating a near-real-time mirror of the road network [12]. Second, it can predict and test future traffic states—such as congestion pockets and incident evolution—under varying scenarios [13]. It allows practitioners to optimize operations by identifying effective interventions (e.g., signal control, traffic rerouting, or emergency service deployment) before conditions worsen. Finally, DTs support proactive intervention by simulating emergency scenarios in a risk-free virtual environment, enhancing urban resilience [14].
In Advanced Traffic Management Systems (ATMSs), this proactive DT approach significantly enhances operational efficiency. Integrating technologies such as computer vision, sensor networks, real-time data processing, and predictive analytics enables instant responses to changing traffic conditions, while radar–camera fusion further refines monitoring accuracy [15,16]. Cameras in a DT system yield insights into traffic patterns and incidents, and by combining real-time, static, and historical information, the system supports faster and more accurate decision-making. Data platforms like WisTransPortal (https://transportal.cee.wisc.edu/ (accessed on 1 May 2025)) augment these capabilities with extensive historical records of speed, occupancy, and incidents, fostering deeper predictive analytics and event detection. Overall, the integration of these emerging technologies within a DT framework creates a dynamic, responsive ATMS capable of adapting to fluctuating conditions, reducing congestion, and enhancing road safety. Indeed, every aspect of modern transportation, from vehicle operation and traffic control to infrastructure maintenance, stands to benefit from a well-developed digital twin ecosystem.
Various road traffic DT systems are explored and implemented to enhance traffic management systems. Figure 1 presents a conceptual roadmap of road traffic digital twin systems, illustrating how diverse data types and modeling approaches—from historical records to real-time sensor streams—can be integrated to support safety analysis [17,18,19] and mobility decisions across multiple temporal layers. Here are some specific examples: (1) Integrated Corridor Management (ICM) in the U.S. [20]: ICM initiatives in the U.S. use DTs to create comprehensive models of transportation corridors. These virtual models integrate various data sources, including traffic sensors and public transportation systems, to enhance traffic flow and efficiency. (2) New York City’s Traffic Optimization [21]: In New York City, an initiative to create a digital replica of the entire city was undertaken to improve transportation and travel systems. By building this DT, engineers could develop digital road systems underground and predict how these new systems would integrate with existing roads. This approach allows for better planning and management of infrastructure, including predicting maintenance needs for new underground roads. (3) Smart City Initiative [22]: The U.S. conducted research on utilizing DT technology to optimize city traffic. This project aimed to create virtual replicas of urban areas to analyze traffic patterns, predict congestion points, and optimize traffic flow. (4) Traffic Signal Optimization [23]: In various cities across the U.S., DT technology is being employed to optimize traffic signal timings. By creating a virtual model of the traffic system, engineers can test and implement the most efficient signal patterns, reducing congestion and improving flow during peak times. These examples showcase the diverse ways in which DT technology is being used to address traffic management challenges in the U.S., highlighting its potential to enhance urban mobility, safety, and sustainability. At a macro-level, DTs can facilitate the coordinated perception of traffic situations, the dynamic timing of traffic lights, traffic flow statistics, and congestion alerts at intersections. By connecting the physical infrastructure of cities with information technology facilities, and based on integrated data modeling, DTs enable intelligent prediction and decision-making for smart traffic and smart cities. At a micro-level, DTs can detect and send alerts about traffic incidents, providing drivers with static information about road infrastructure and dynamic operational information, thereby ensuring and enhancing safety.
The immense volumes of data that DT platforms collect, transmit, and process also make them attractive, high-value cyber targets. False-data injection, man-in-the-middle, and denial-of-service attacks aimed at the physical layer, vehicle-to-DT links, or supporting cloud micro-services can distort the twin’s situational awareness, trigger unsafe control actions, and cascade through networked corridors [24]. Recent research systematically probes these risks—dissecting attacks on connected and automated vehicles (CAVs) [25,26,27], exposing vulnerabilities in vehicle-to-digital twin communication links [28], and developing in-vehicle intrusion detection and defense schemes [29].
Consequently, for the state of Wisconsin, an ATMS empowered by DT technology can effectively utilize roadside cameras to capture real-time traffic conditions as reported on the 511 Wisconsin website [30]. By employing a DT system that utilizes traffic data, this initiative could strengthen traffic monitoring and provide real-time decision support. In the long term, these advancements are poised to enhance the safety, mobility, resilience, and sustainability of Wisconsin’s highways.
This study proposes a DT-based traffic management system that integrates AI-driven analytics, real-time data fusion, and predictive modeling to enhance Advanced Traffic Management Systems. By leveraging both historical and real-time traffic data, the system enables more effective decision-making for traffic professionals. The research aims to demonstrate the feasibility and potential of this approach through an initial deployment on Flex Lane in Madison, showcasing how DT can improve traffic monitoring, incident response, and operational efficiency.
The main contributions of this AI-enabled DT framework are as follows:
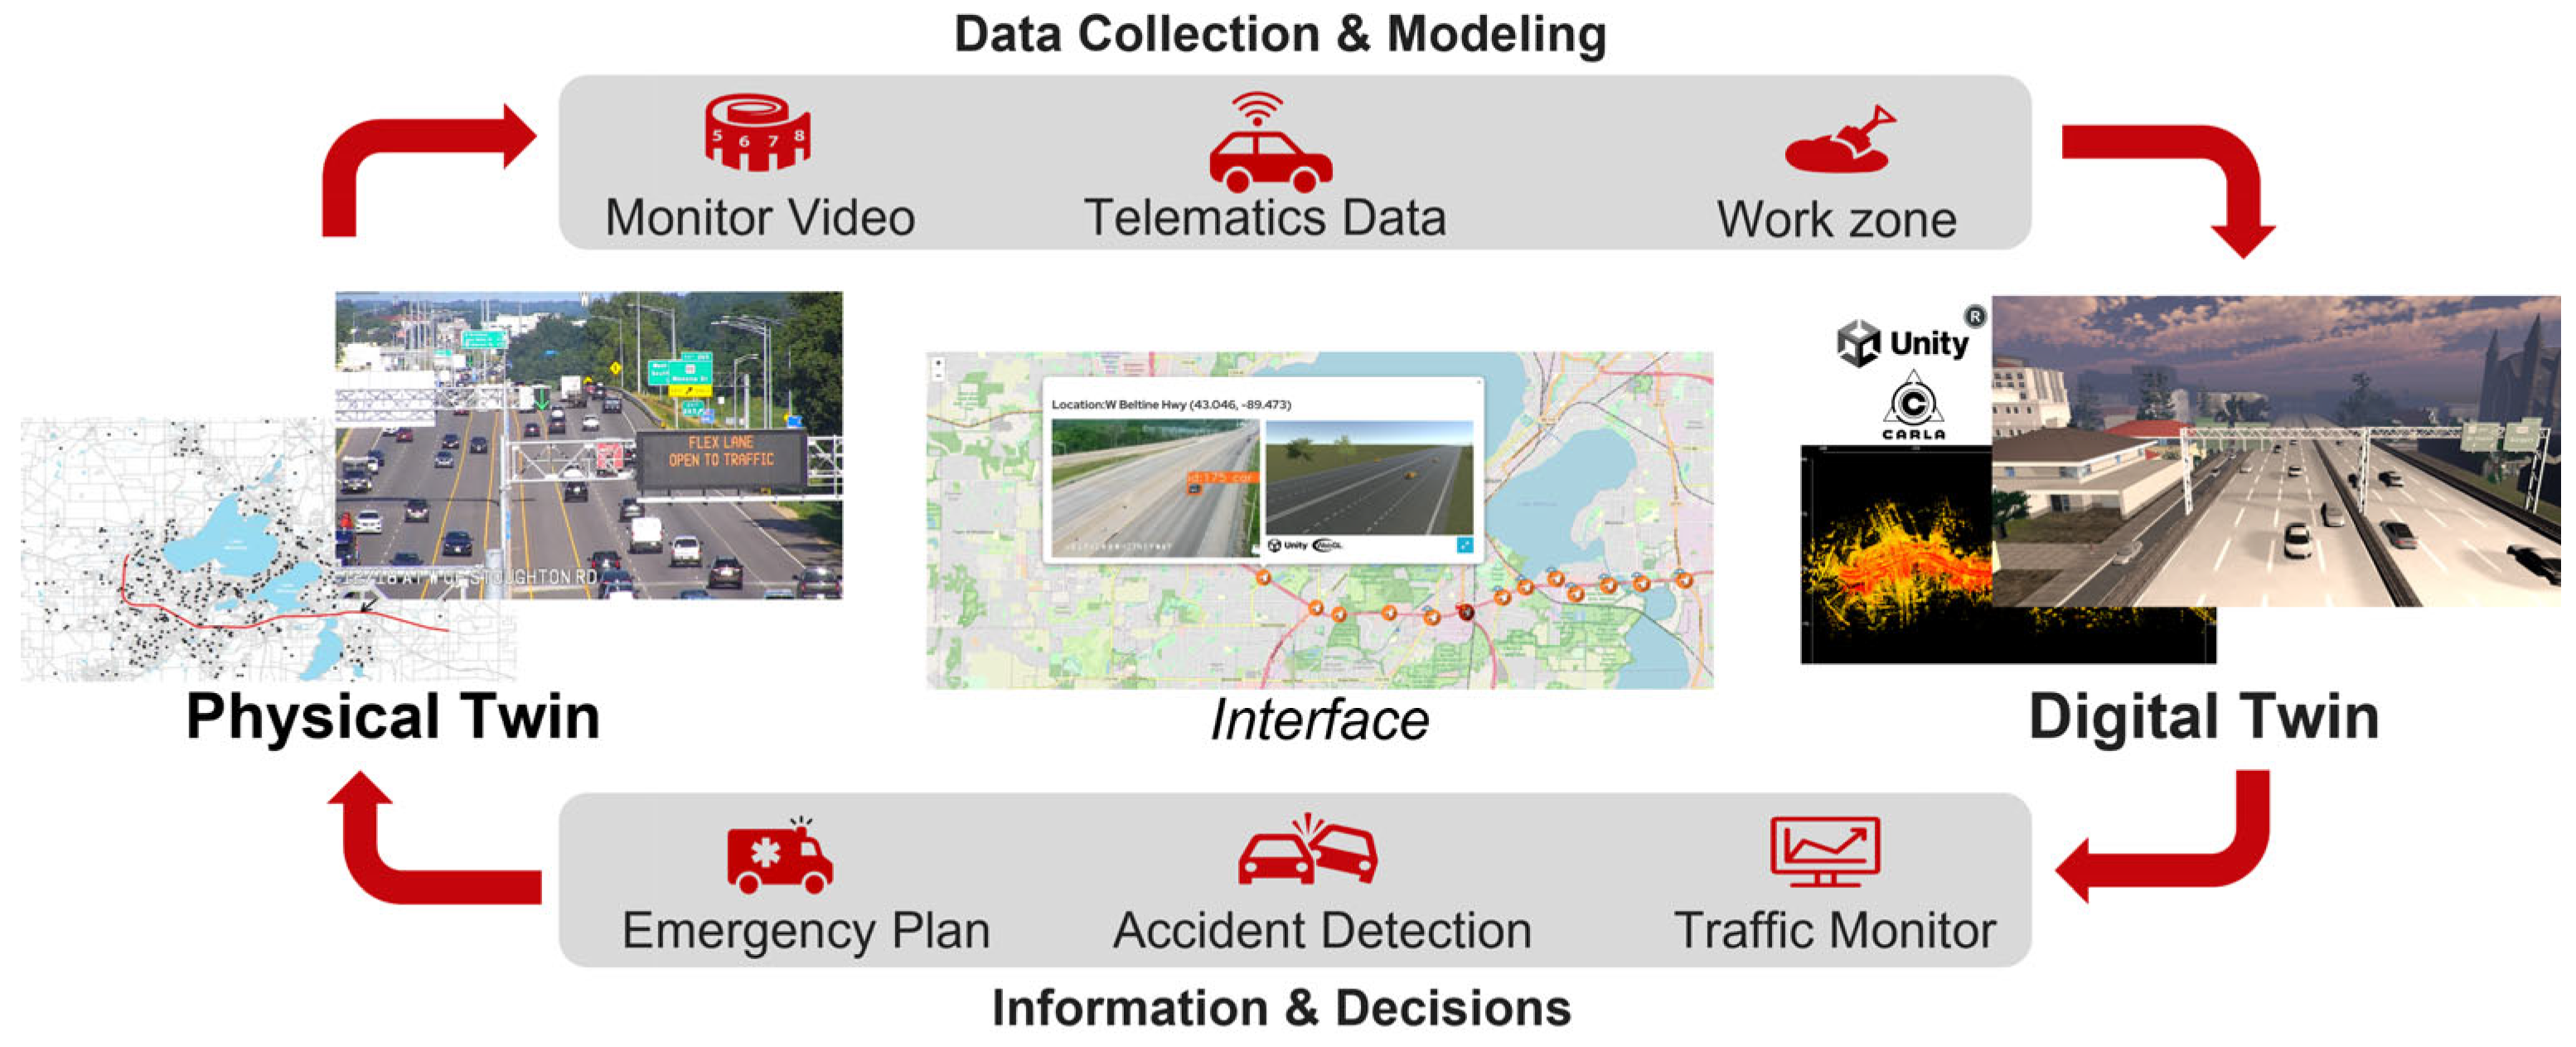
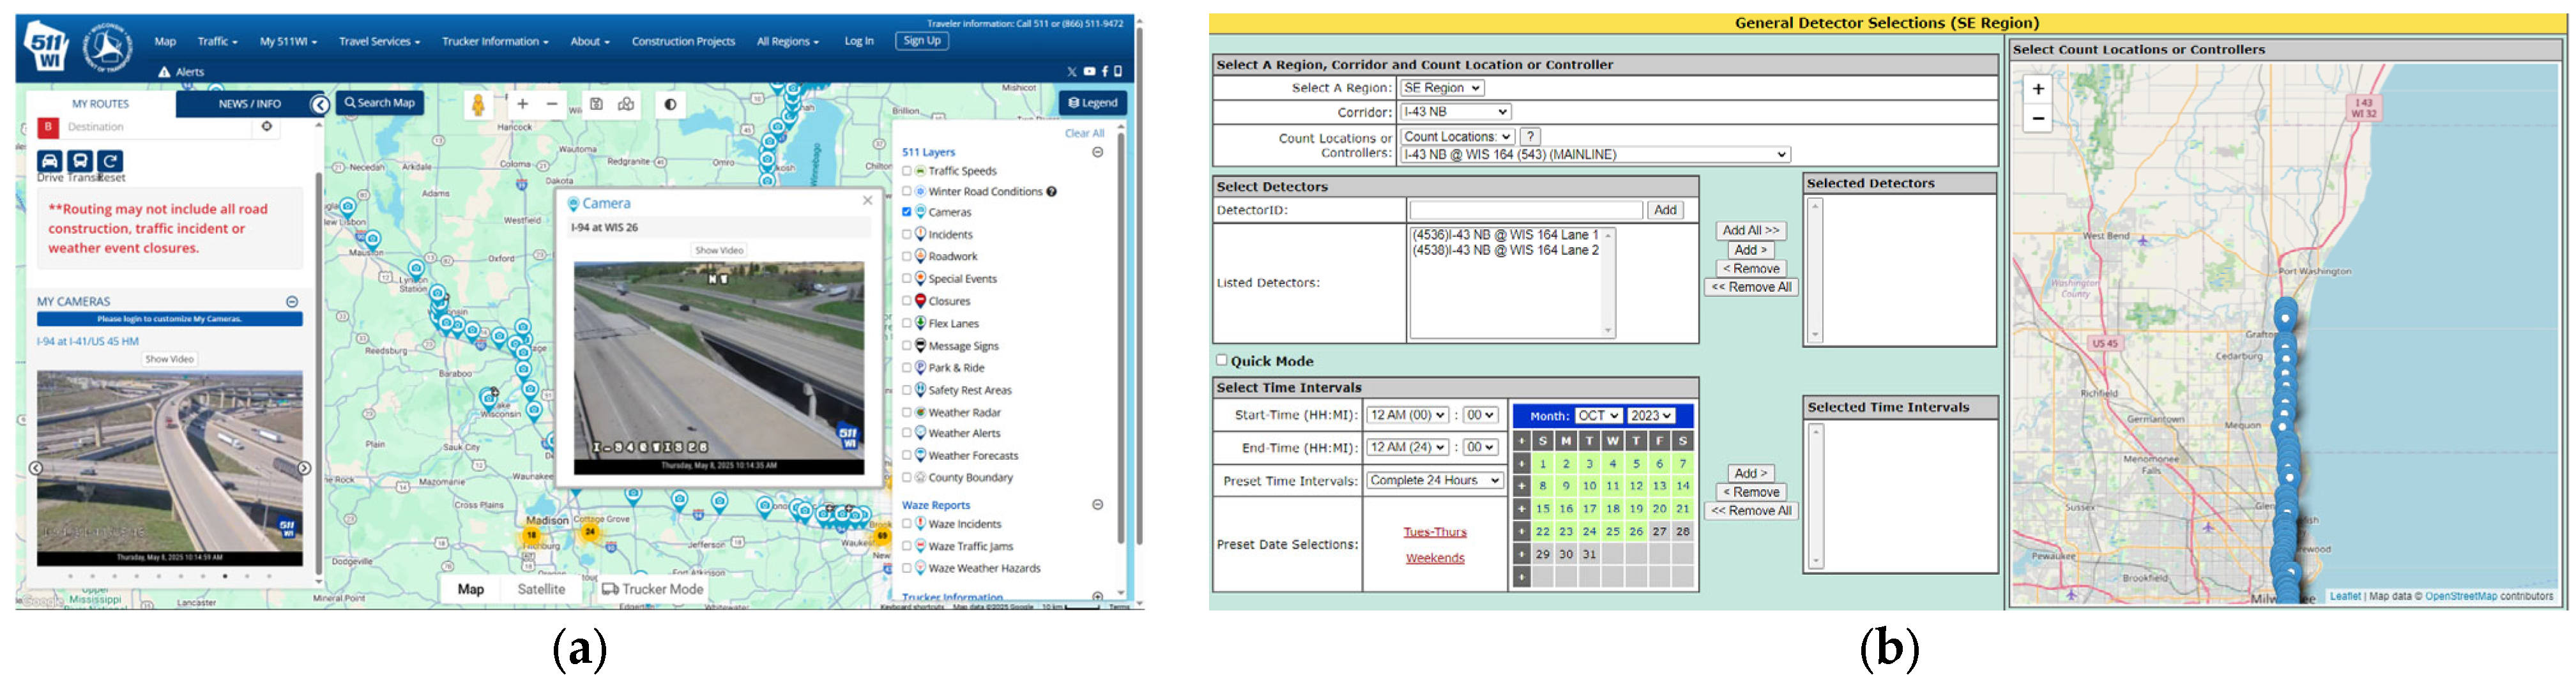
  • Integration with existing ATMS platforms. The proposed DT framework ingests heterogeneous data inputs (camera, Lidar, telematics, etc) and directly hooks into WisDOT 511 and WisTransPortal live streams.
  • Real-world implementation. Complete DT pipeline is deployed on Madison’s Beltline Flex Lane corridor, where it mirrors field conditions, reconstructs incidents, and drives edge–cloud AI models for traffic monitoring and predictive analytics.
  • Exploration of future applications such as eco-driving, where the DT platform could support optimized vehicle control.
The rest of the paper is organized as follows: Section 2 overviews the DT system. Section 3 introduces the platform structure. Section 4 shows the deployment at Flex Lane in Madison. Section 5 concludes the research and discusses future research.

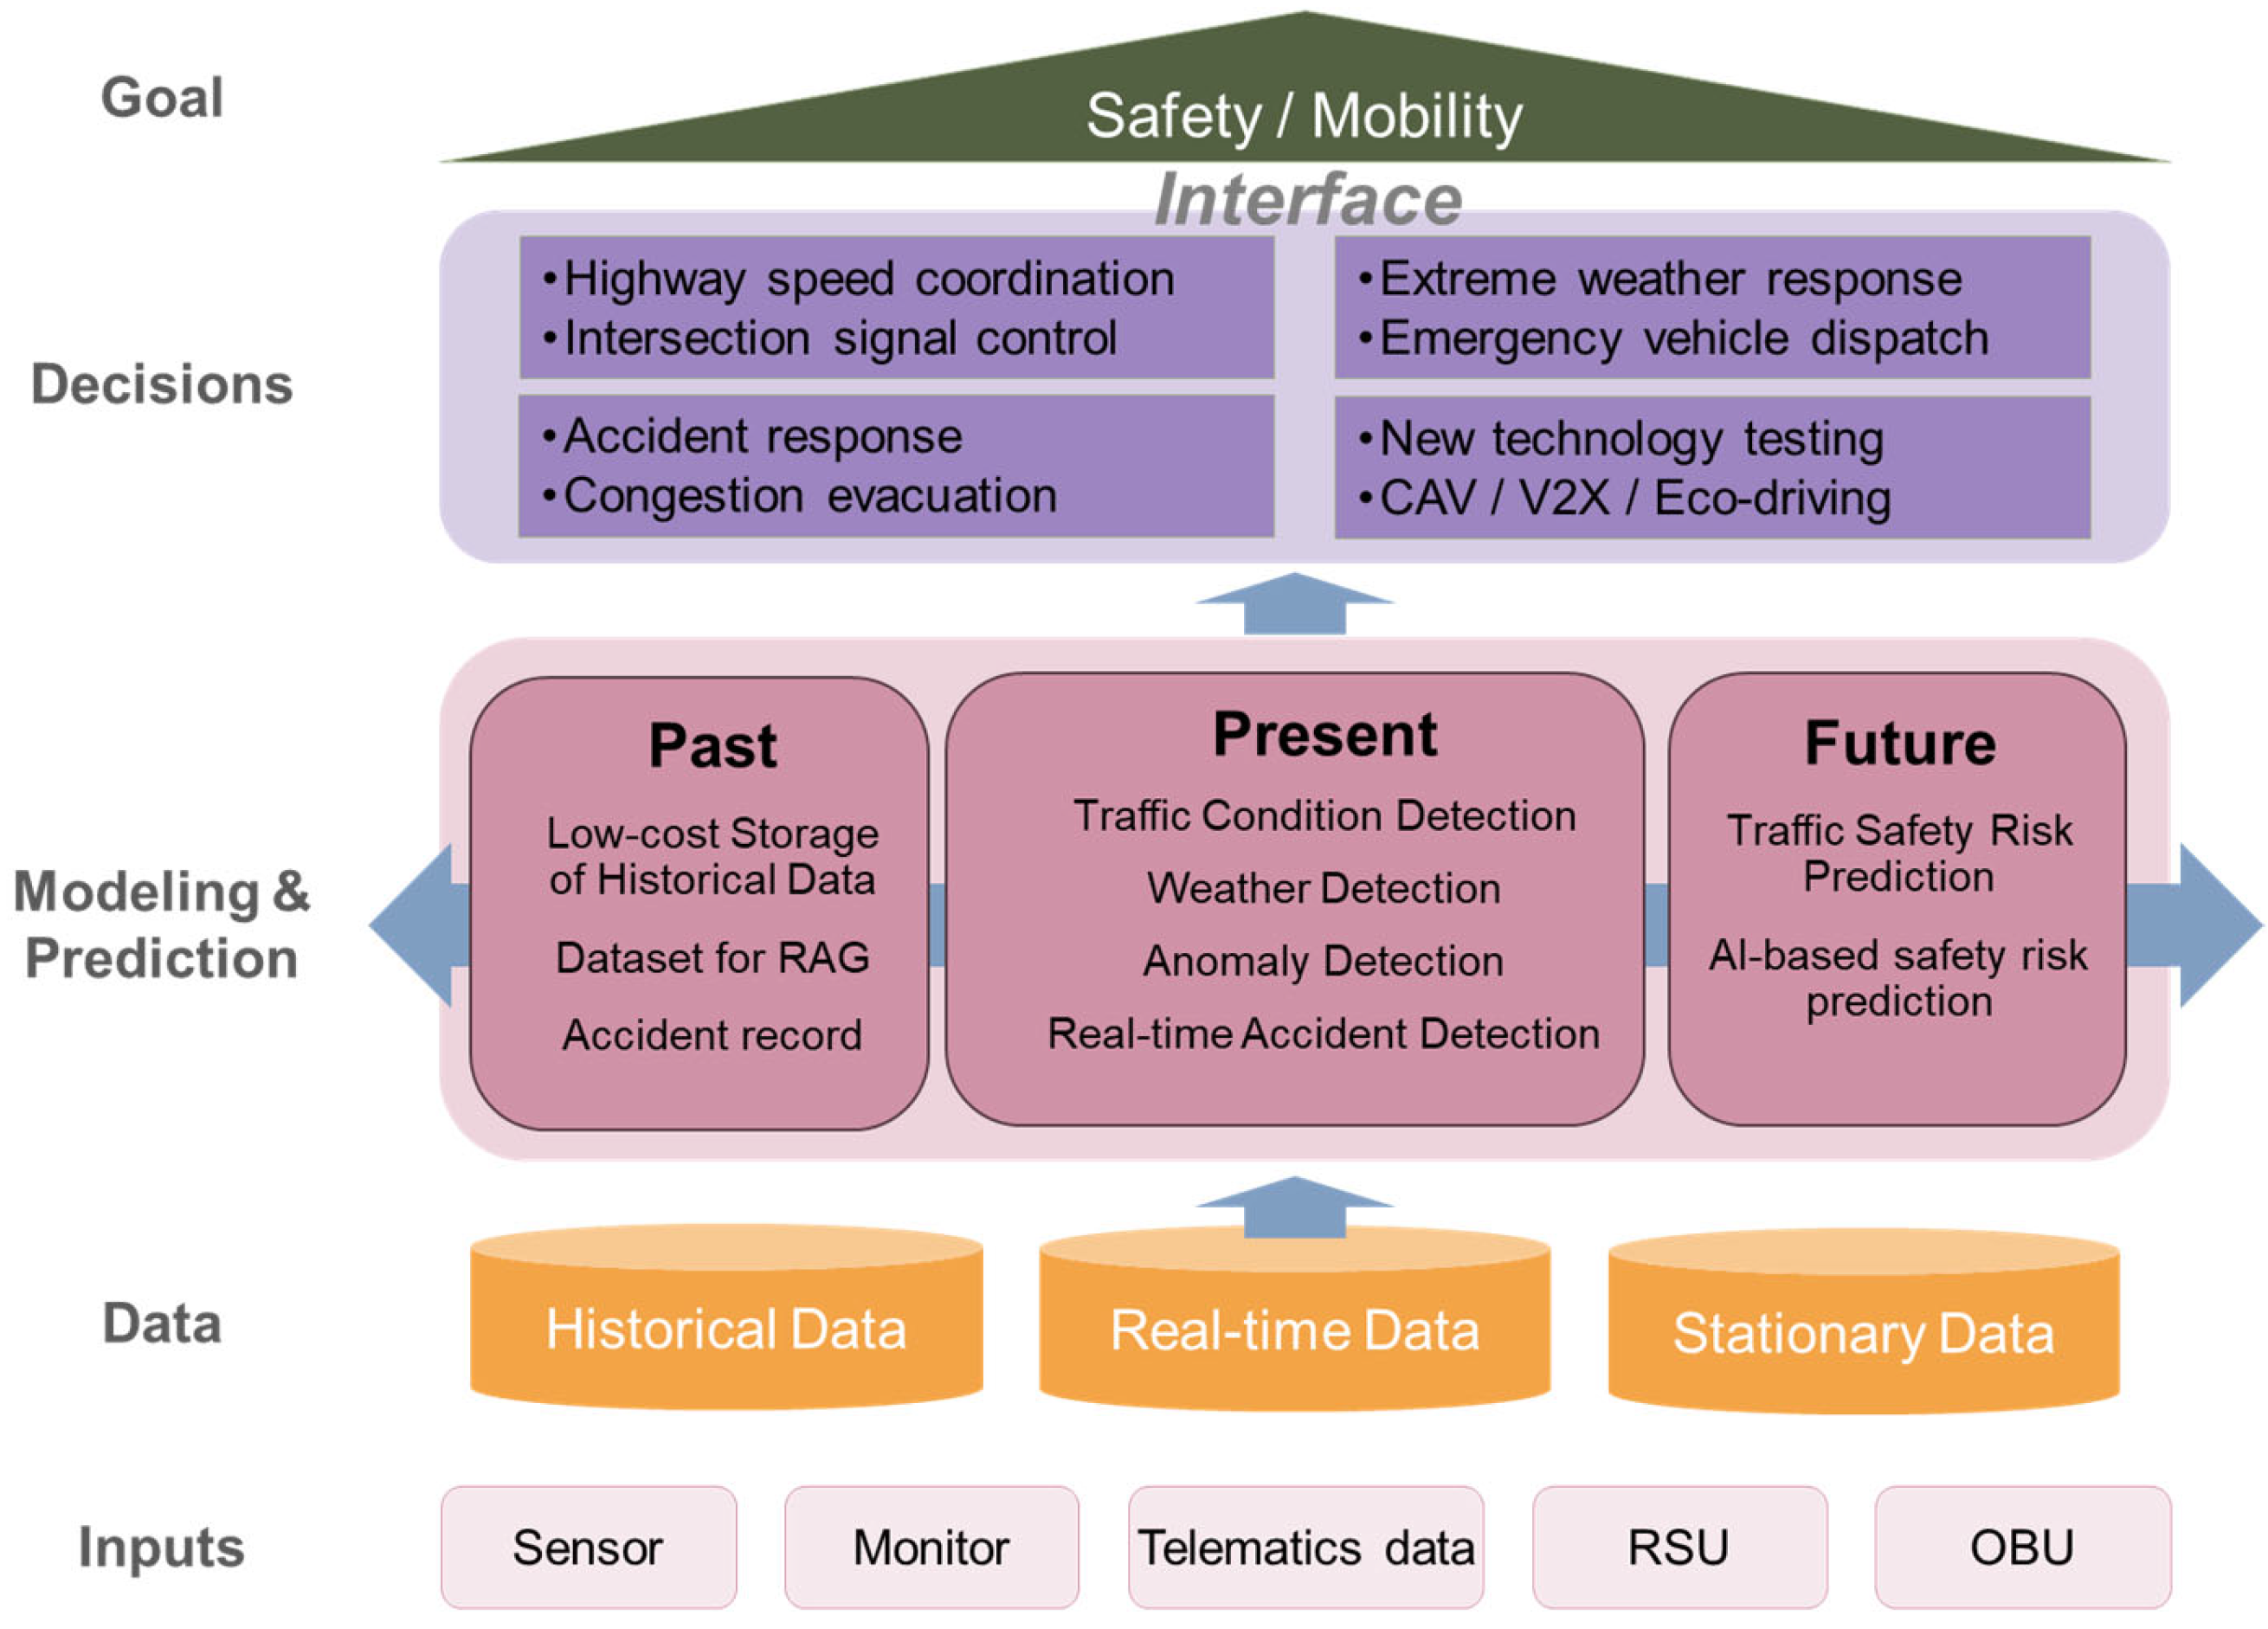
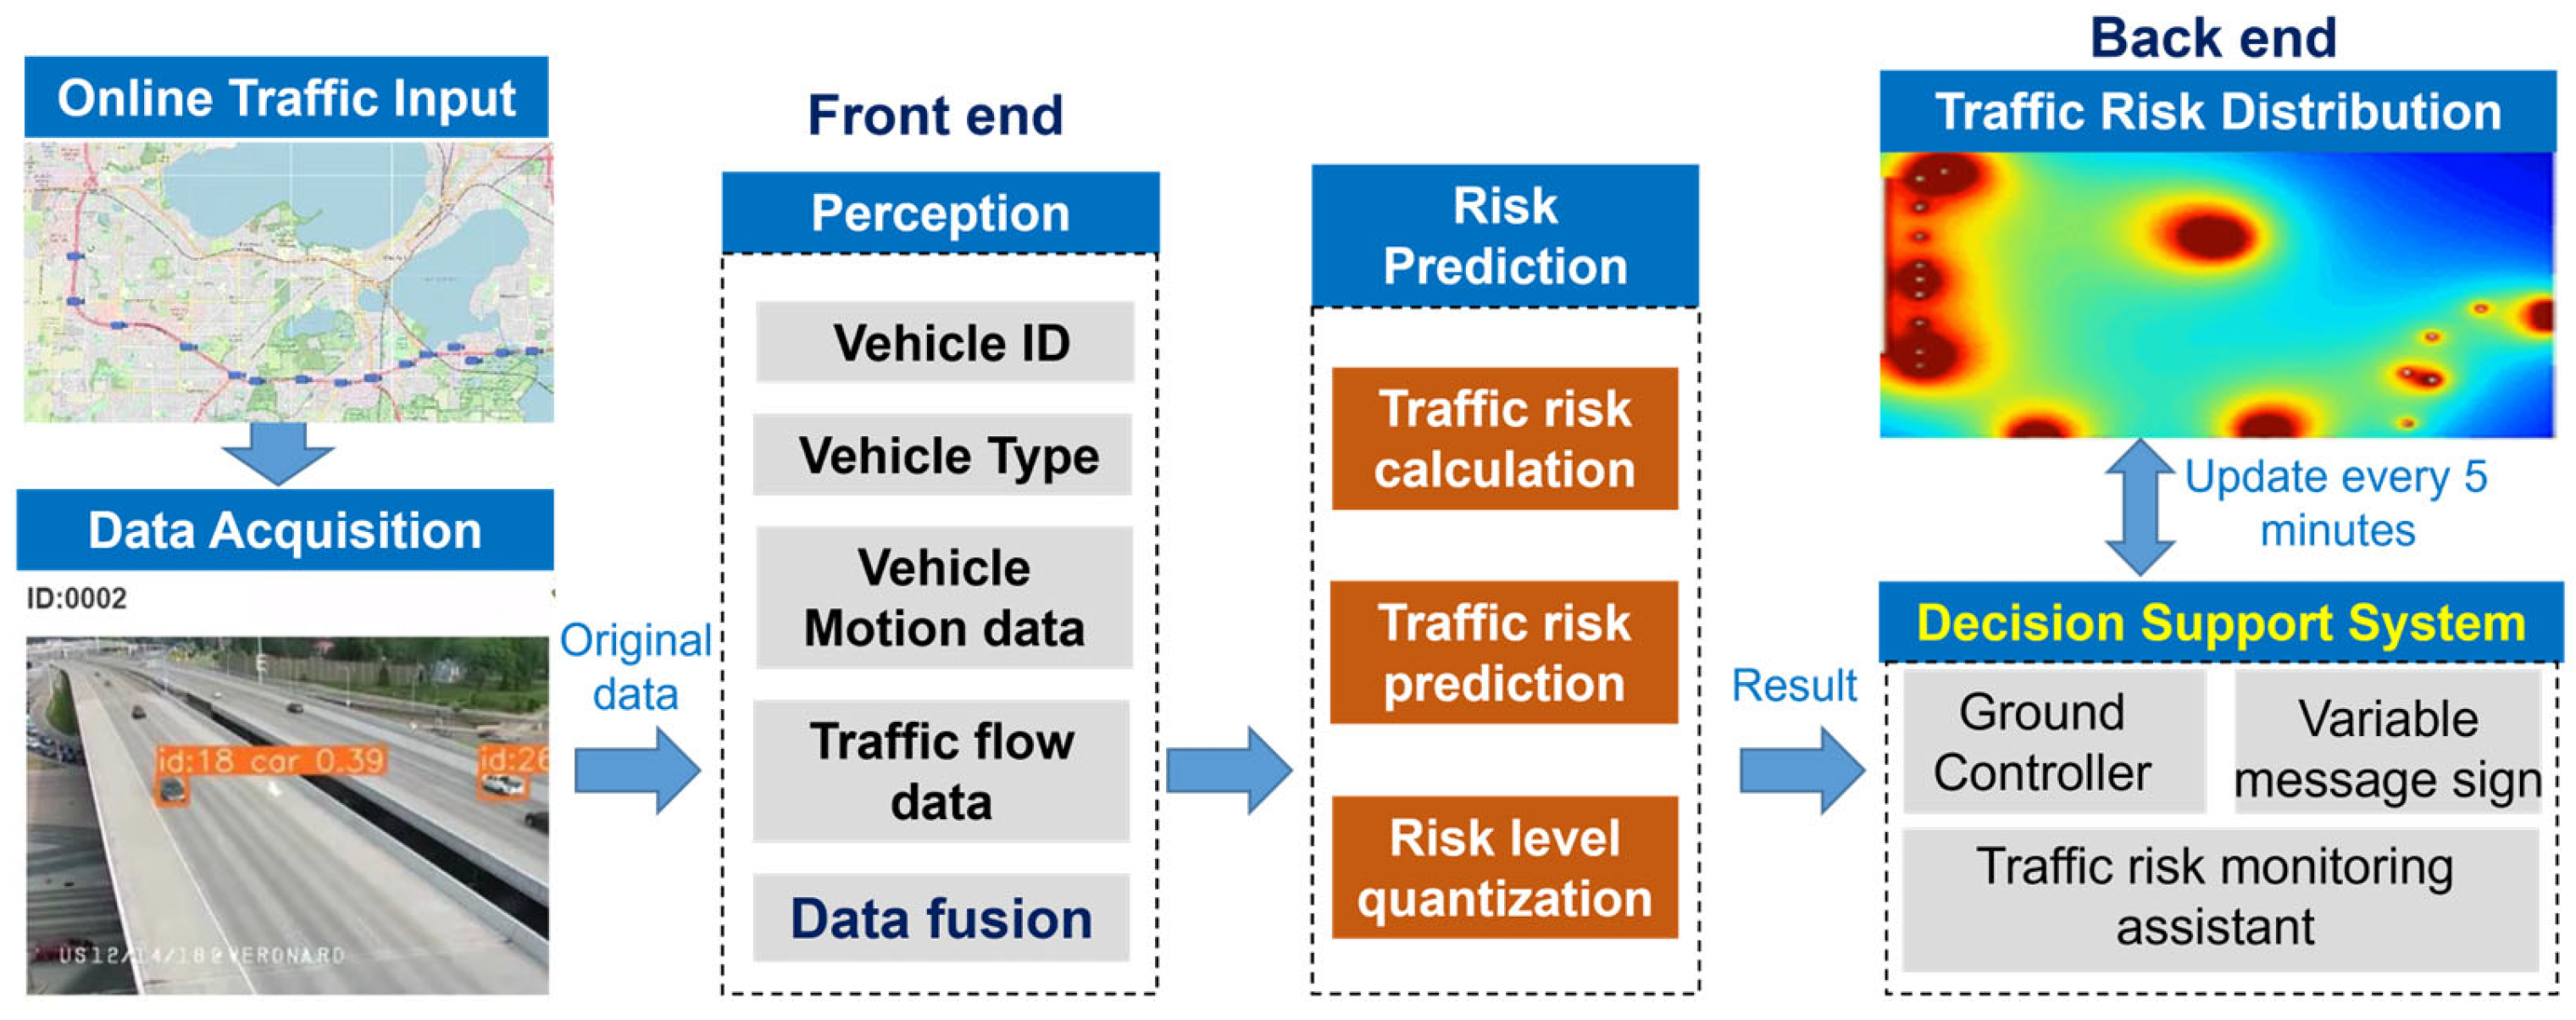
2. Digital Twin System Overview

The primary objectives of this DT platform are twofold: (1) Enhance traffic management and decision-making processes. (2) Develop APIs to seamlessly integrate DT’s capabilities into existing platforms, including WisDOT ATMS systems and existing data platforms such as WisTransPortal. The integration of these platforms can further enhance decision-making processes and real-time management capabilities for traffic professionals, especially the local Traffic Management Center. The capabilities of the proposed DT platform span three temporal dimensions, offering a comprehensive approach to traffic management. The general structure of the DT platform is shown in Figure 2.

3. Platform Architecture
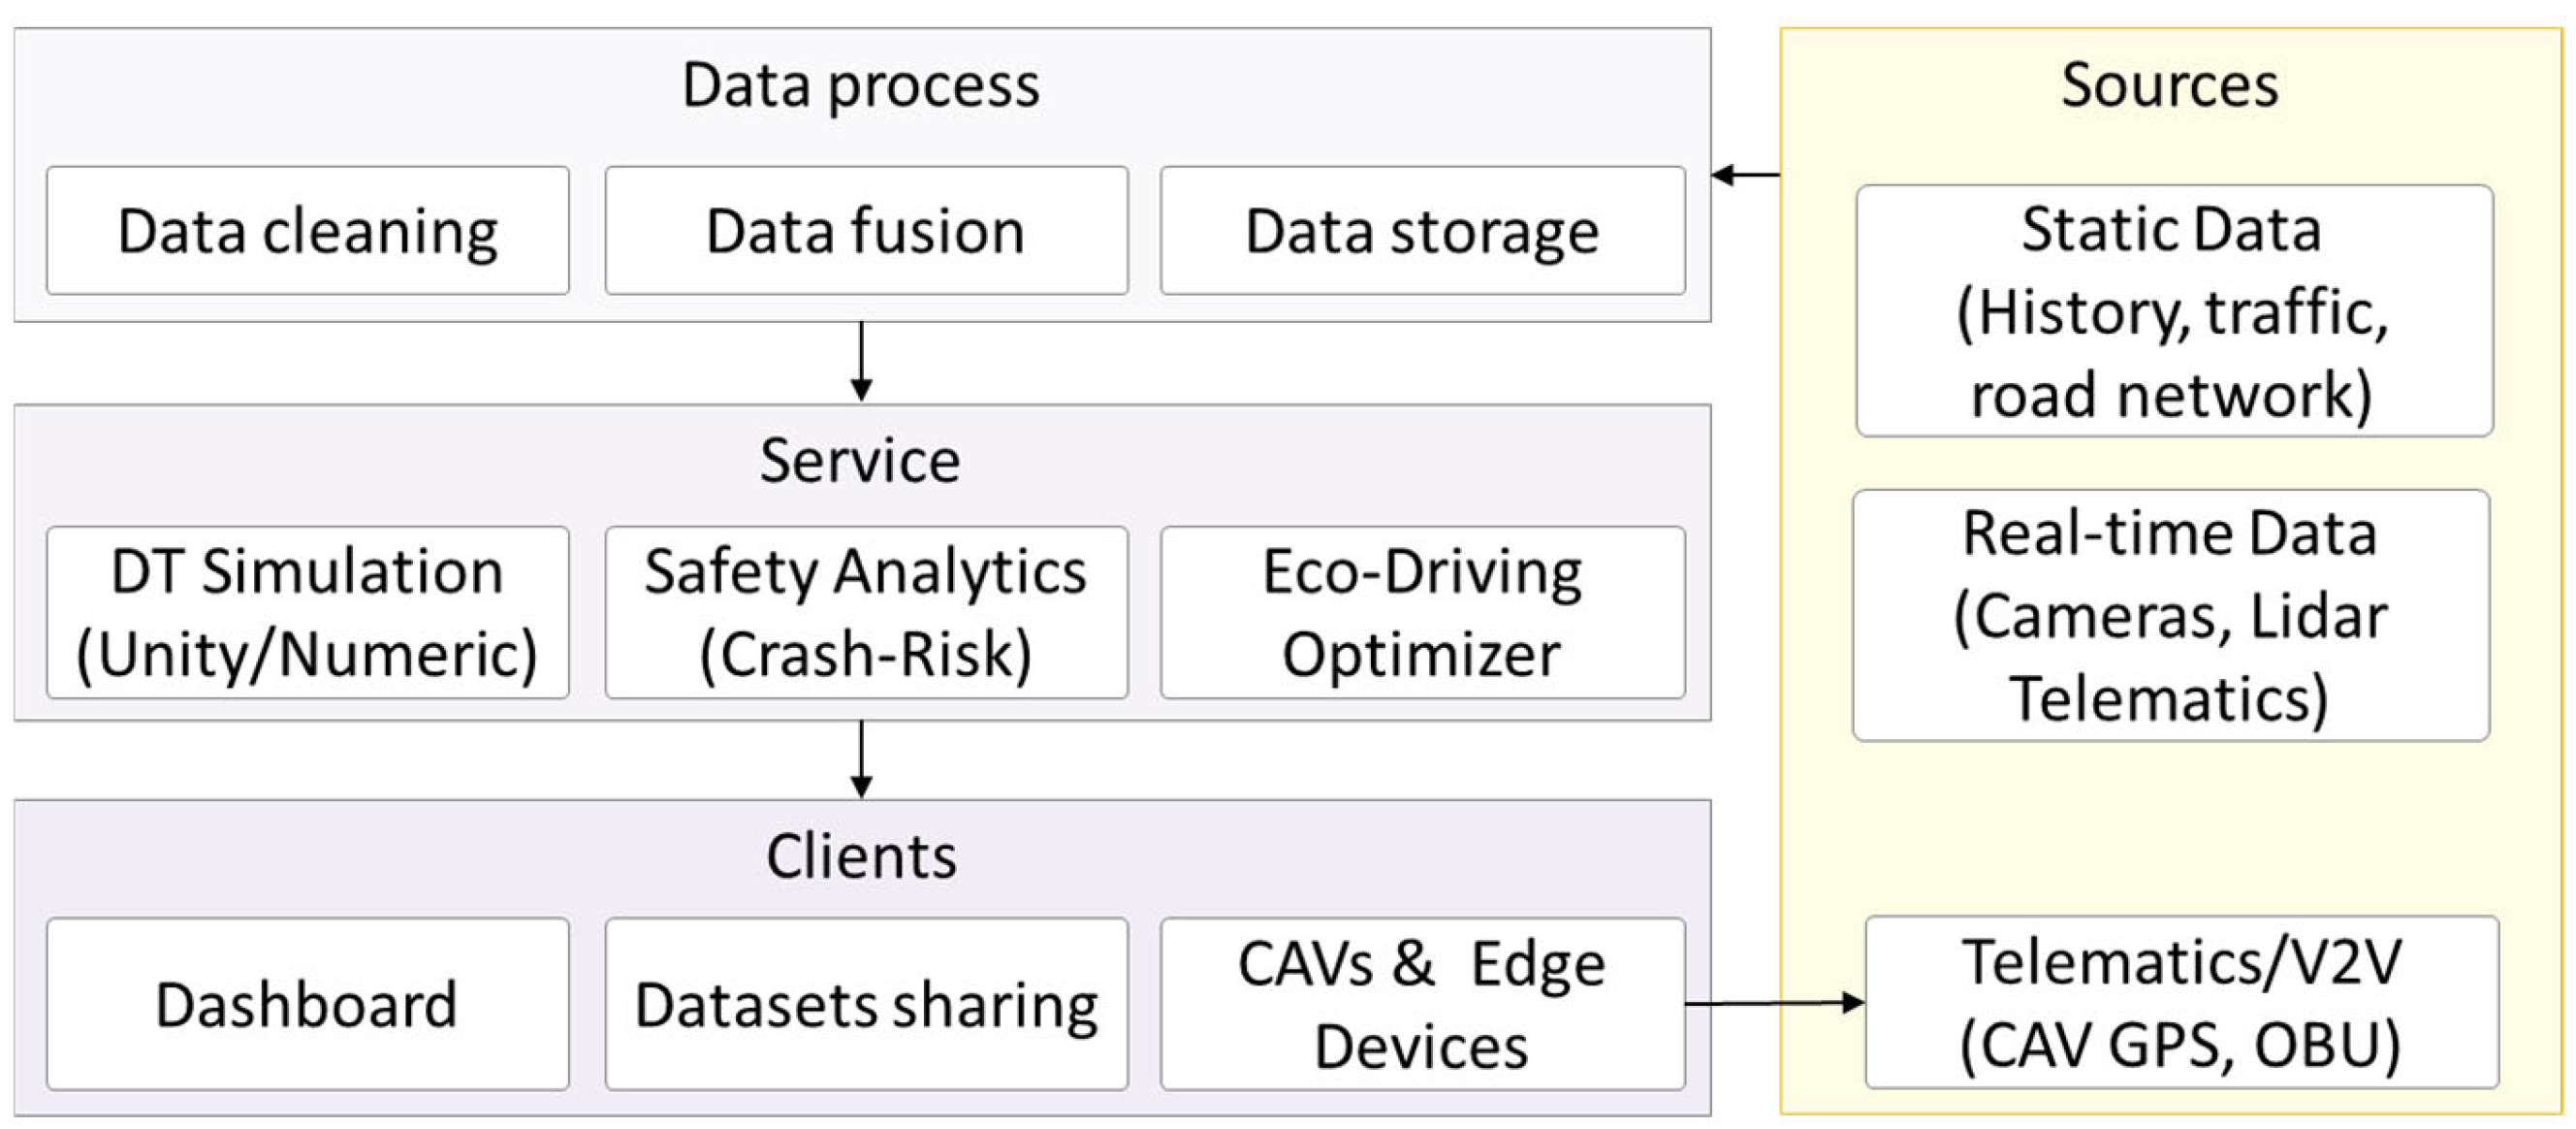
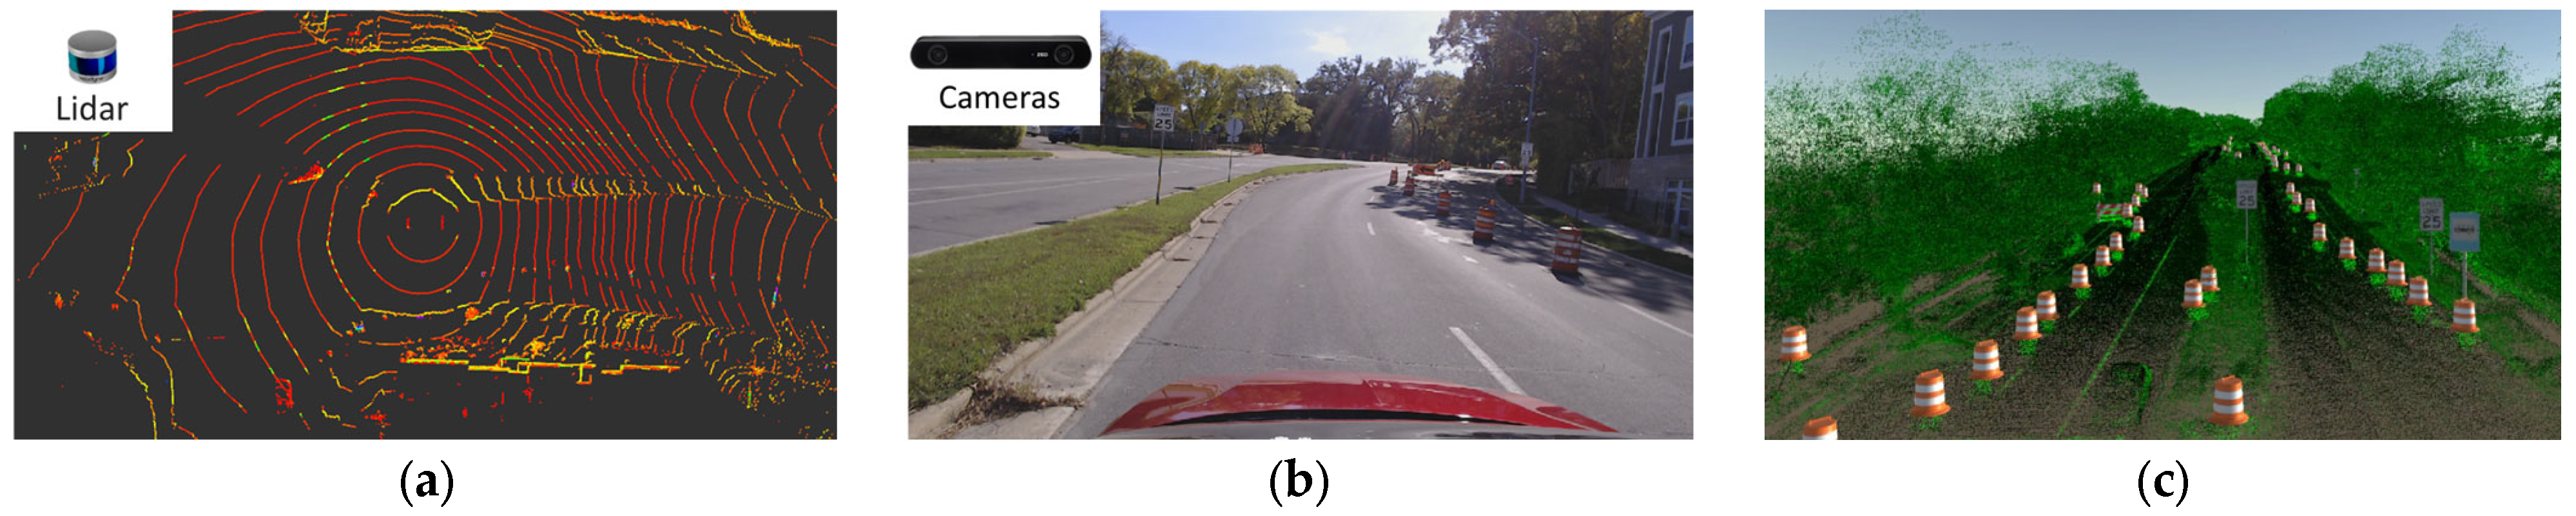
The architecture is divided into three parts: data architecture, system components, and API and user interface integration.

3.1. Data Layer

The DT system integrates both static (historical) and real-time data to provide a holistic view of traffic dynamics.

3.1.1. Static Data

Static data provide the foundational information required for traffic modeling, simulation, and predictive analytics in a DT system. This dataset consists of four key components: road network and infrastructure data, historical traffic flow data, accident and incident records, and regulatory constraints. By integrating these diverse sources, the DT system constructs a comprehensive and data-driven representation of road traffic conditions. Figure 3 illustrates the process of stationary data collection using a full-scale Level 3 autonomous vehicle and the resulting high-definition mapping.
Road network and infrastructure data: These data include road geometry, lane configurations, and the spatial distribution of traffic control elements such as traffic signals and speed limits. Additionally, high-definition maps, generated from LiDAR and camera-based sensing, provide a detailed three-dimensional reconstruction of road environments.
Historical traffic flow data: These data capture long-term variations in vehicle movement and congestion patterns, forming the basis for demand analysis and capacity planning.
Accident records: These datasets contain information on past crash events, including their locations, severity levels, and contributing factors such as weather conditions or driver behavior. These data help analyze high-risk areas, model potential accident scenarios, and evaluate the effectiveness of various mitigation measures. Integrating accident data with road network features and historical traffic conditions enables a deeper understanding of how roadway characteristics influence crash frequency and severity.
Regulatory and policy data. These datasets encompass speed regulations, lane usage restrictions, toll pricing mechanisms, and land-use zoning policies that shape mobility patterns, which help the DT system adhere to real-world constraints.
This dataset supports model training, providing baseline traffic conditions and helping to simulate potential future scenarios.

3.1.2. Real-Time Data

Real-time data enable dynamic traffic monitoring, immediate anomaly detection, and rapid response to evolving traffic conditions. Key sources include the following:
Traffic monitoring systems, including roadside cameras, loop detectors, and radar-based sensors, provide live feeds of traffic conditions, congestion levels, and unexpected disruptions such as accidents or roadwork.
Telematics data: Onboard sensors in connected vehicles transmit information on speed, acceleration, braking behavior, and fuel consumption, contributing to a more detailed understanding of driving patterns [31].
IoT-enabled and GPS-based traffic monitoring data: These are data from smart traffic signals, mobile navigation applications, and GPS-equipped vehicles.

3.1.3. Data Fusion and Processing

To integrate, clean, and store the data in a structured manner, the DT system establishes a cohesive and comprehensive traffic perception framework that enables cooperative situational awareness. The fusion and processing pipeline consists of three key components: data integration, anomaly detection, and efficient data storage.
Data Cleaning and Anomaly Detection. Traffic data are inherently noisy, often affected by missing sensor readings, transmission errors, or outlier values resulting from malfunctioning devices. Automated anomaly detection algorithms are employed to identify inconsistencies, such as abrupt speed changes, sensor discrepancies, or traffic congestion patterns that deviate from expected norms. These anomaly detection methods help uncover operational irregularities, such as unintended lane deviations, illegal maneuvers, or bottlenecks caused by accidents.
Data Fusion and Integration. Since the data originate from multiple sources—cameras, IoT-enabled infrastructure, V2X communication, and GPS—geospatial synchronization techniques are applied to map all data points accurately onto a unified road network model. Additionally, machine learning-based time series fusion allows the system to combine past trends with real-time fluctuations, generating accurate traffic forecasts and congestion predictions. This multi-source integration also supports cooperative perception, where vehicles, infrastructure, and traffic control centers share synchronized traffic state information for enhanced decision-making.
Data Storage and Retrieval. Given the continuous influx of high-volume traffic data, scalable database architectures—such as distributed cloud storage and time-series databases—are implemented to support fast retrieval and efficient querying.
In consideration of privacy and data security, the DT stores aggregated traffic information (e.g., flow rates, congestion indices, and anonymized trajectories) that do not involve personally identifiable information. Under routine traffic analysis conditions, the system explicitly avoids capturing sensitive individual-level details, including license plates and facial features. For safety-critical scenarios such as real-time accident detection and emergency response, the platform may temporarily capture identifiable details (e.g., license plates) to support immediate interventions and follow-up procedures. In such cases, privacy protection guidelines will be strictly followed to promptly anonymize or remove sensitive information once the incident response is complete, ensuring compliance with applicable privacy regulations and maintaining minimal storage of personal data. Additionally, real-time data exchanges between the DT platform and external data providers utilize Transport Layer Security (TLS) protocols for secure transmission. The data management processes of the platform aim to align with internationally recognized privacy standards, including principles similar to the General Data Protection Regulation (GDPR), particularly regarding the anonymization of personal data and the minimization of sensitive information storage.

3.2. Function Layer

The DT platform integrates real-time monitoring, simulation-based analysis, and AI-driven decision-making, ensuring efficient traffic flow optimization and incident response.

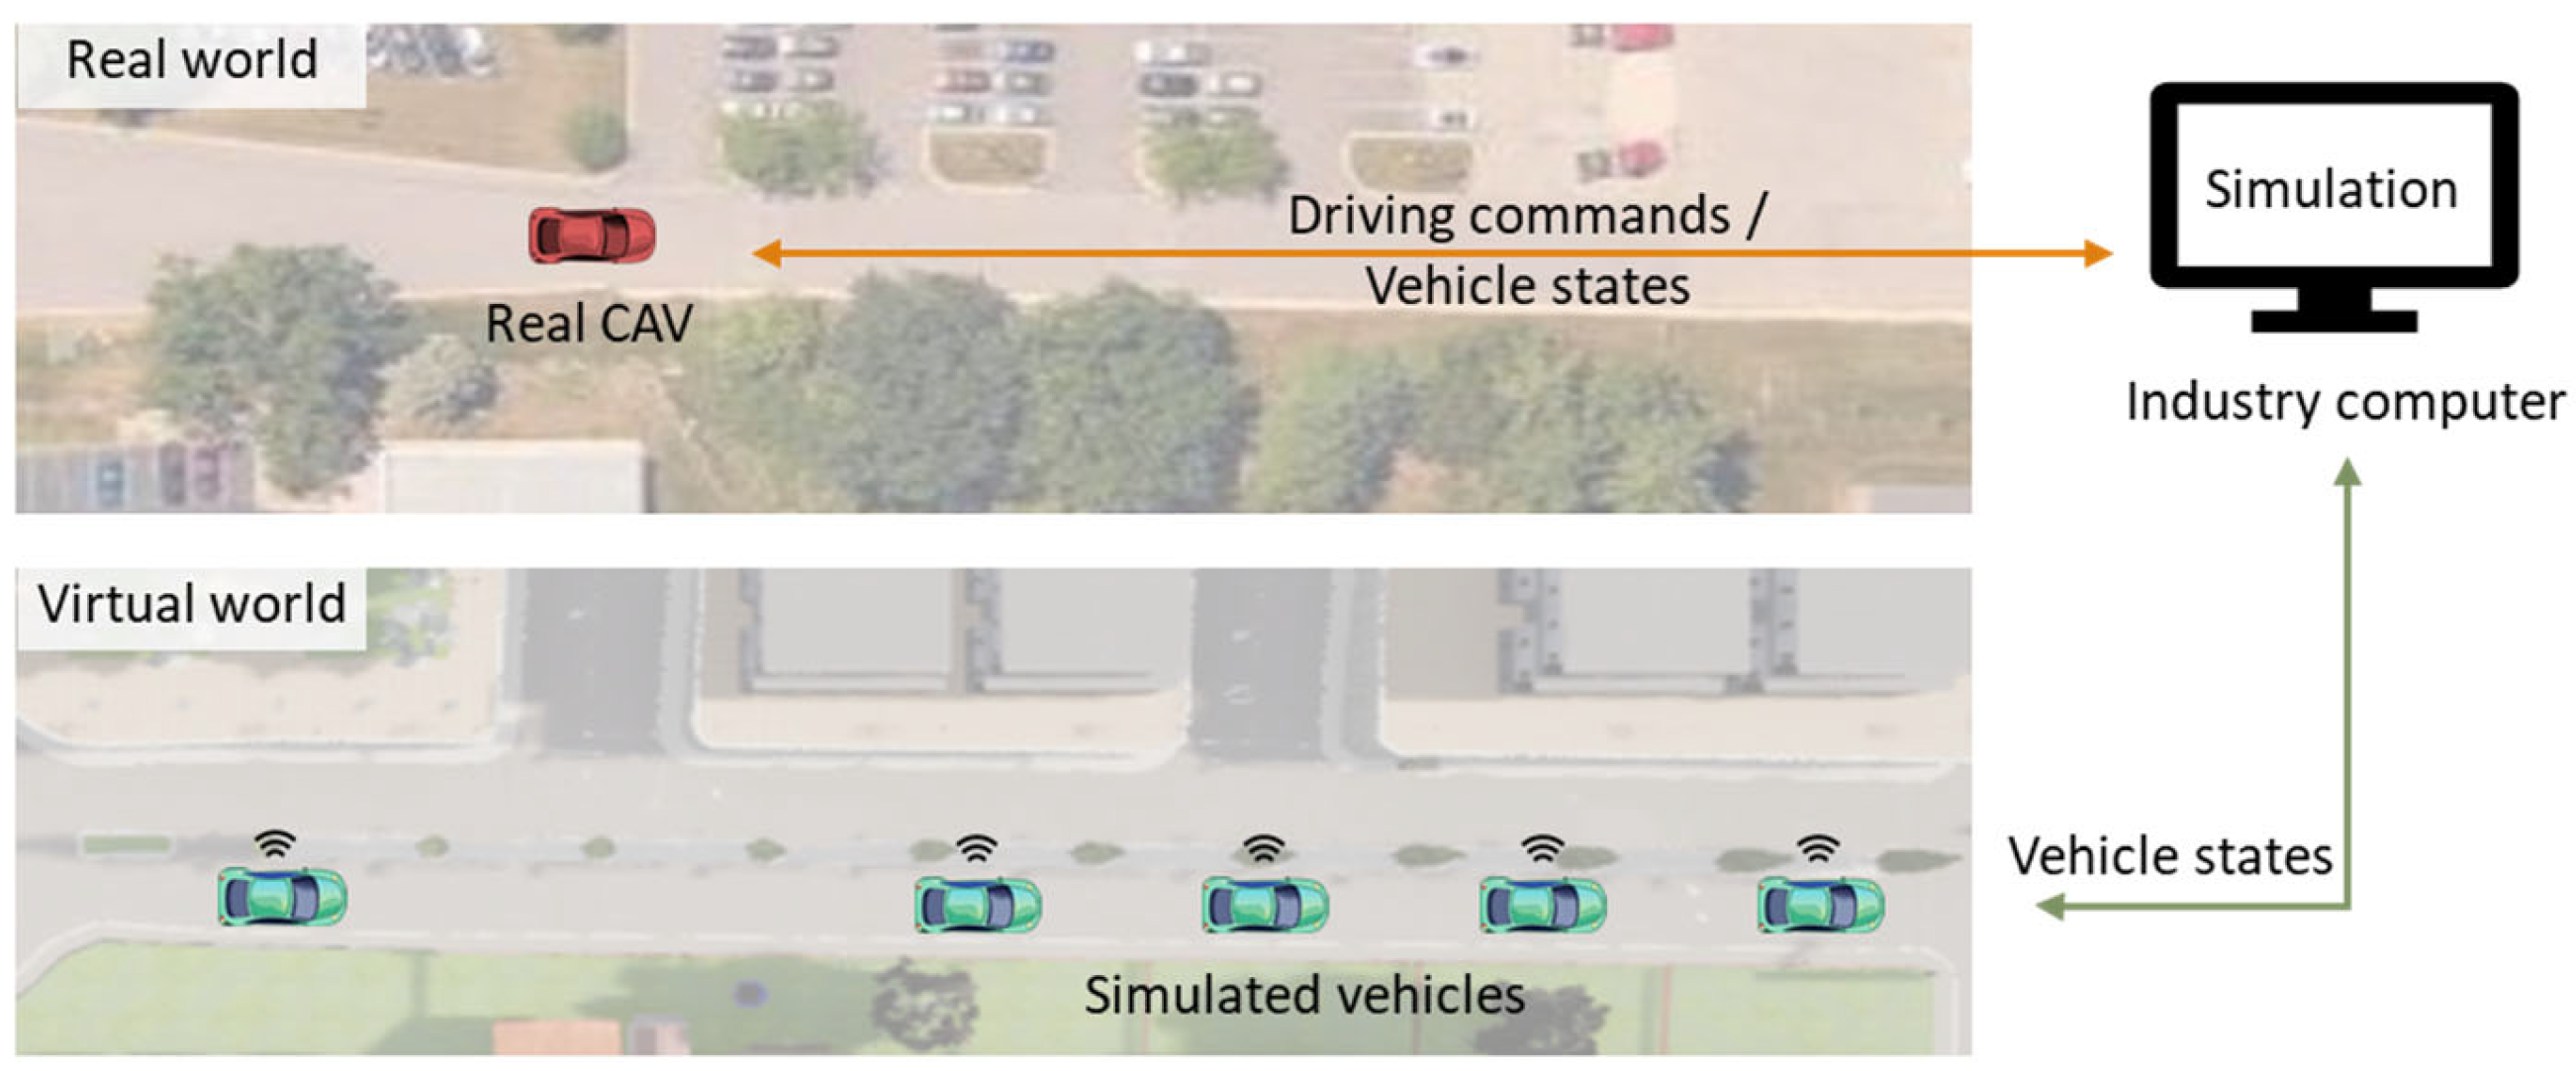
3.2.1. DT Core and Simulation Engine

As the primary processing engine, digital space constructs a virtual representation of real-world traffic conditions using simulation platforms such as CARLA [32], SUMO [33], and Unity [34]. It generates a real-time digital replica of traffic conditions, enabling dynamic interactions between vehicles, infrastructure, and environmental factors. The simulation platform can support event reconstruction, allowing for post-accident analysis and improvement. Table 1 summarizes the key features of several candidate platforms. Unity was selected due to its superior support for agent diversity, the real-time interactions of multi-agents, and extensibility, making it more suitable for city-scale DT applications.

3.2.2. Prediction and Analysis Module

This module enables scenario testing, allowing transportation planners to evaluate different traffic management strategies before implementing them in real-world conditions. Scenario-based simulation models the effects of interventions such as lane closures, adaptive signal control, and detour strategies, providing a risk-free environment to assess their impact. Predictive analytics, powered by AI models, estimates accident risks, congestion patterns, and travel times, enabling proactive decision-making. Furthermore, advanced decision-support methodologies (e.g., optimization and data-driven approaches) are integrated into fine-tuning traffic signal timings and routing strategies, enhancing overall network efficiency. These optimization capabilities support downstream applications such as adaptive signal control, crash risk mitigation, and eco-driving.

3.2.3. Decision-Making Module

The decision-making module centers on functions that have been verified in our Flex Lane deployment while leaving room for future enhancements. The first function is incident awareness. Crash detections produced by the fusion pipeline reach the operator panel within five seconds. The panel shows the location, lane blockage, and speed impact so that staff can issue Wisconsin 511 alerts without delay. The second function is eco-driving support. The PERL-based controller streams an energy-optimal speed profile to the Vehicle-in-the-Loop test car, and the recorded performance data are stored in the digital twin for data cleaning and merging. This closed loop connects simulation with field practice.

3.3. Interface Layer

Seamless integration with existing transportation management platforms is essential for maximizing the effectiveness of the DT system. By leveraging APIs from local traffic management systems and other traffic data providers, the system ensures robust real-time data exchange, reducing redundancy and making full use of available infrastructure. Additionally, an intuitive user interface enables traffic professionals to monitor conditions, analyze trends, and make informed decisions based on both historical and real-time insights.

3.3.1. API Development and System Integration

To enhance interoperability, the DT system directly integrates with existing platforms. By utilizing standardized APIs from government and private sector sources, the system minimizes the need for additional sensor deployment and maximizes the use of established traffic-monitoring infrastructure. While our current implementation focuses on integrating traffic APIs and sensor feeds, future versions will consider aligning with transportation communication standards such as NTCIP and TMDD. This would improve interoperability with signal controllers, dynamic message signs, and other field devices commonly used in ATMS deployments.

3.3.2. User Interface and Decision Support

A comprehensive dashboard interface enables traffic operators, city planners, and emergency responders to visualize traffic conditions, monitor system alerts, and access decision-support tools. The Visual Traffic Twin provides an interactive, real-time representation of road network conditions. The alert system generates automated notifications for critical events, including accidents, severe congestion, and weather-related hazards. These alerts are synchronized with traffic management platforms, allowing traffic control centers to take immediate action. For data-driven analysis, the system offers customizable reporting tools, enabling users to extract insights from historical trends and real-time updates. These reports support policy evaluation, infrastructure planning, and traffic safety assessments. The layered architecture of the digital twin platform, including data sources, processing pipelines, core services, and client interfaces, is illustrated in Figure 4.

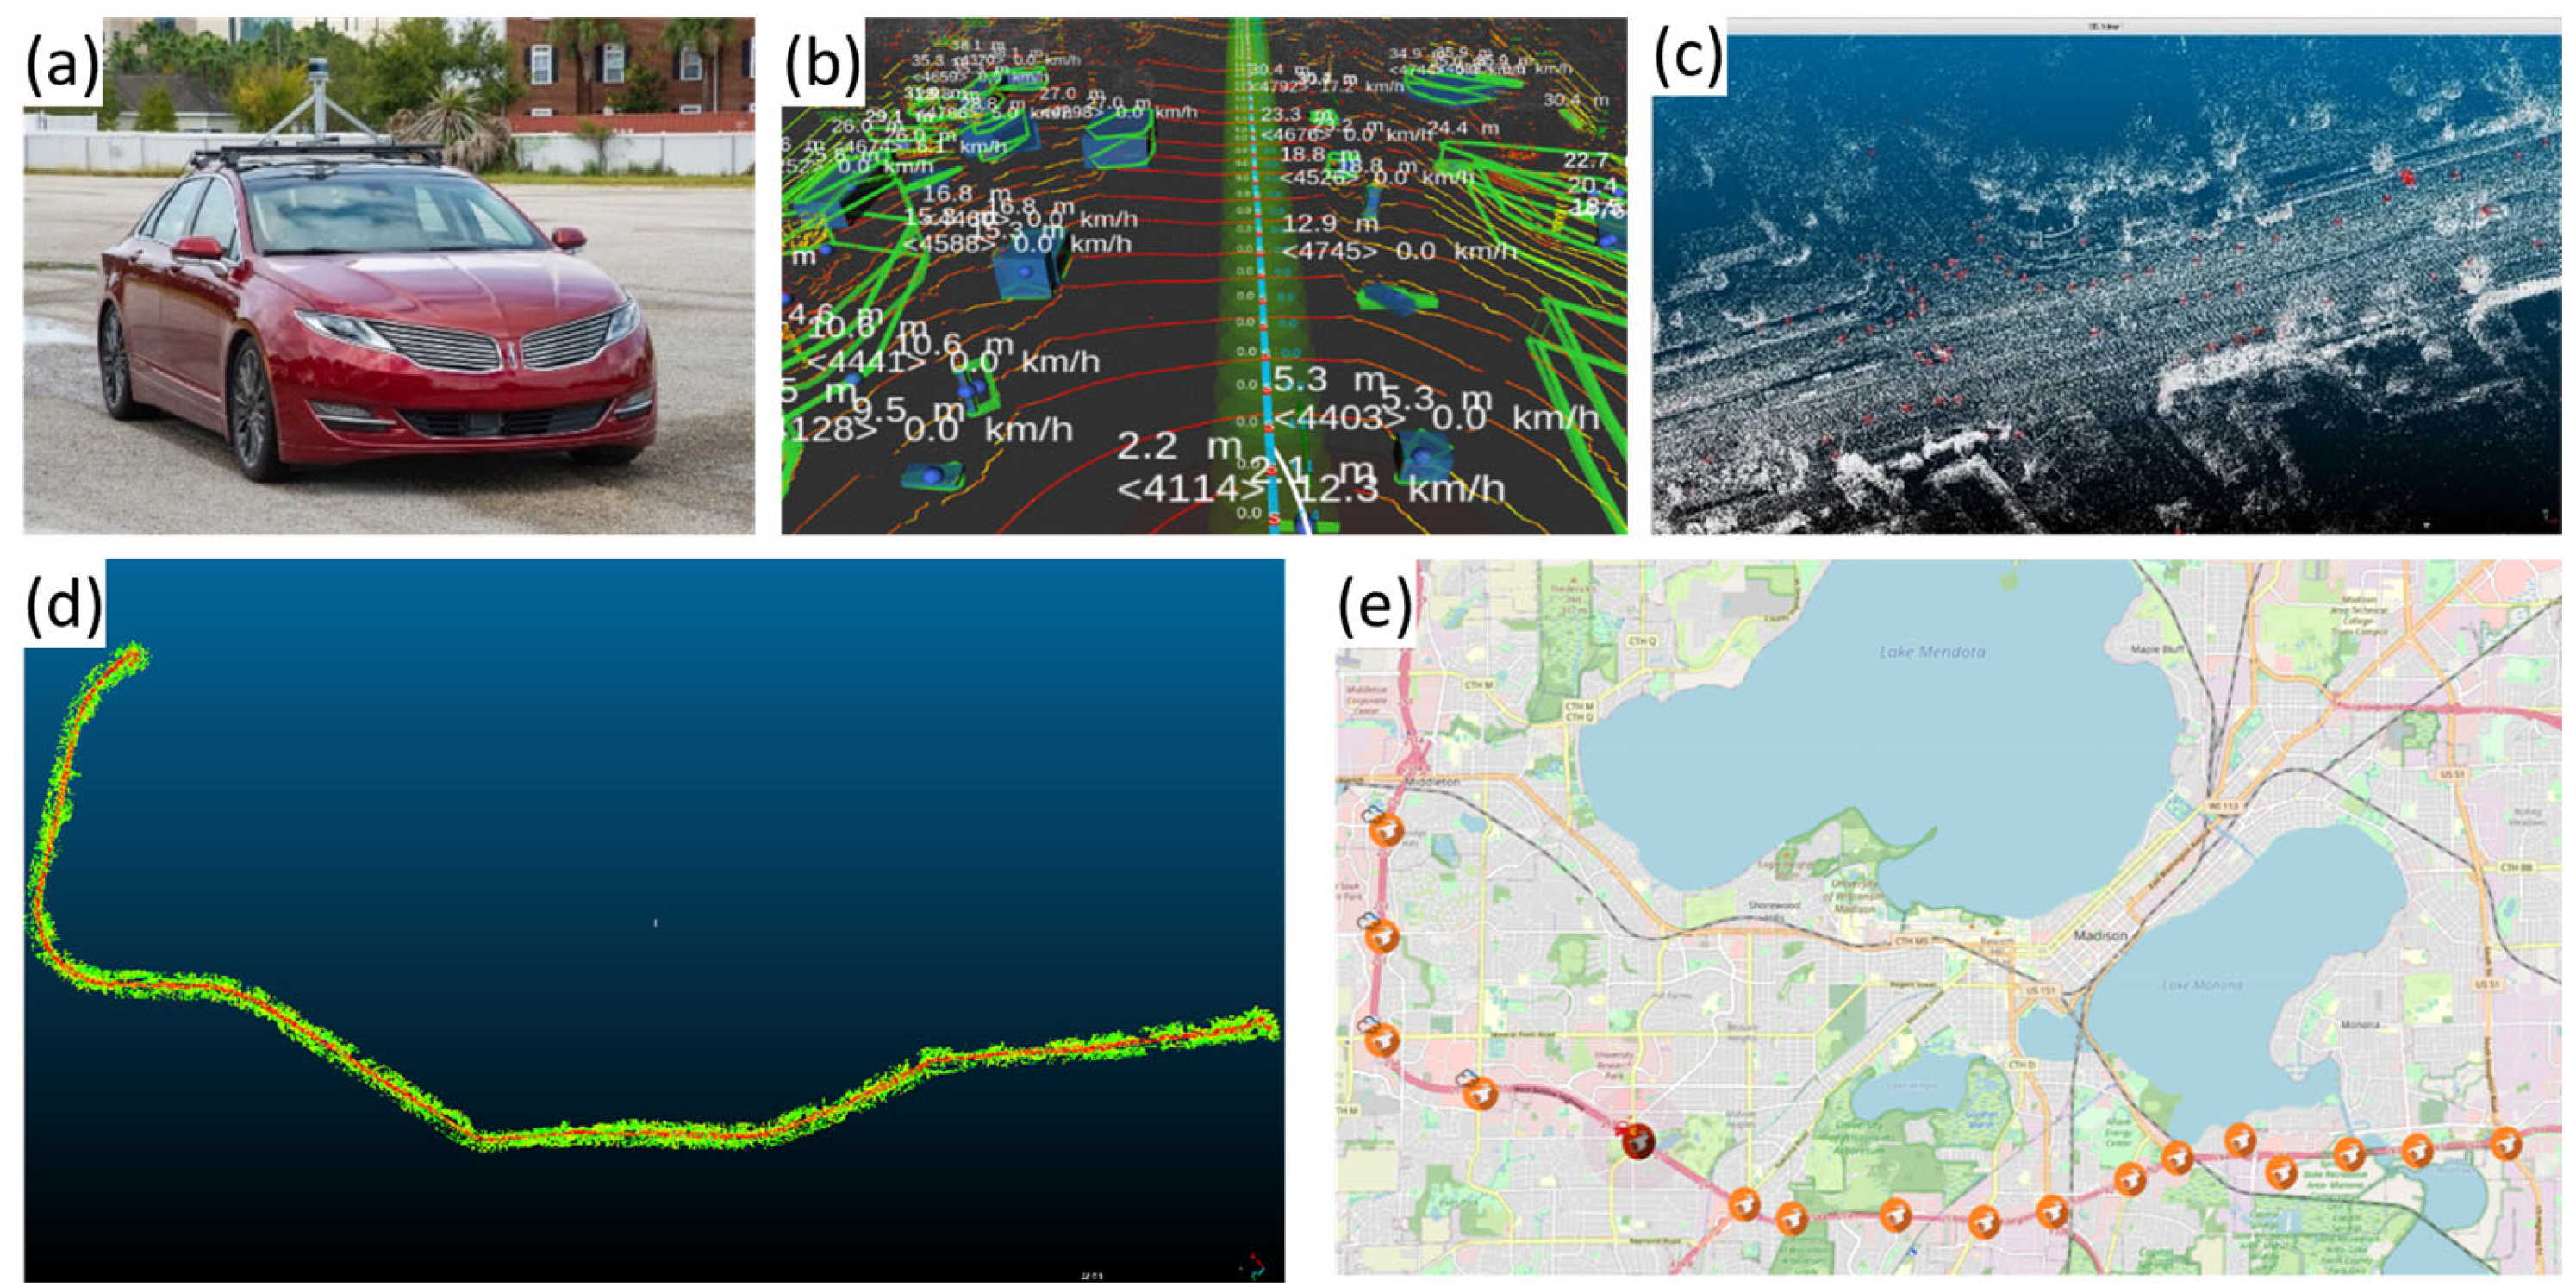
4. Case Study: Flex Lane Deployment

Based on the framework above, the UW-Madison team has developed a preliminary demonstration of the DT concept on Madison’s Flex Lane, Wisconsin’s first initiative of this kind, situated along the Beltline in Dane County. The specific work related to the data processing, digital twinning, and decision-making modules in our project is detailed as follows:

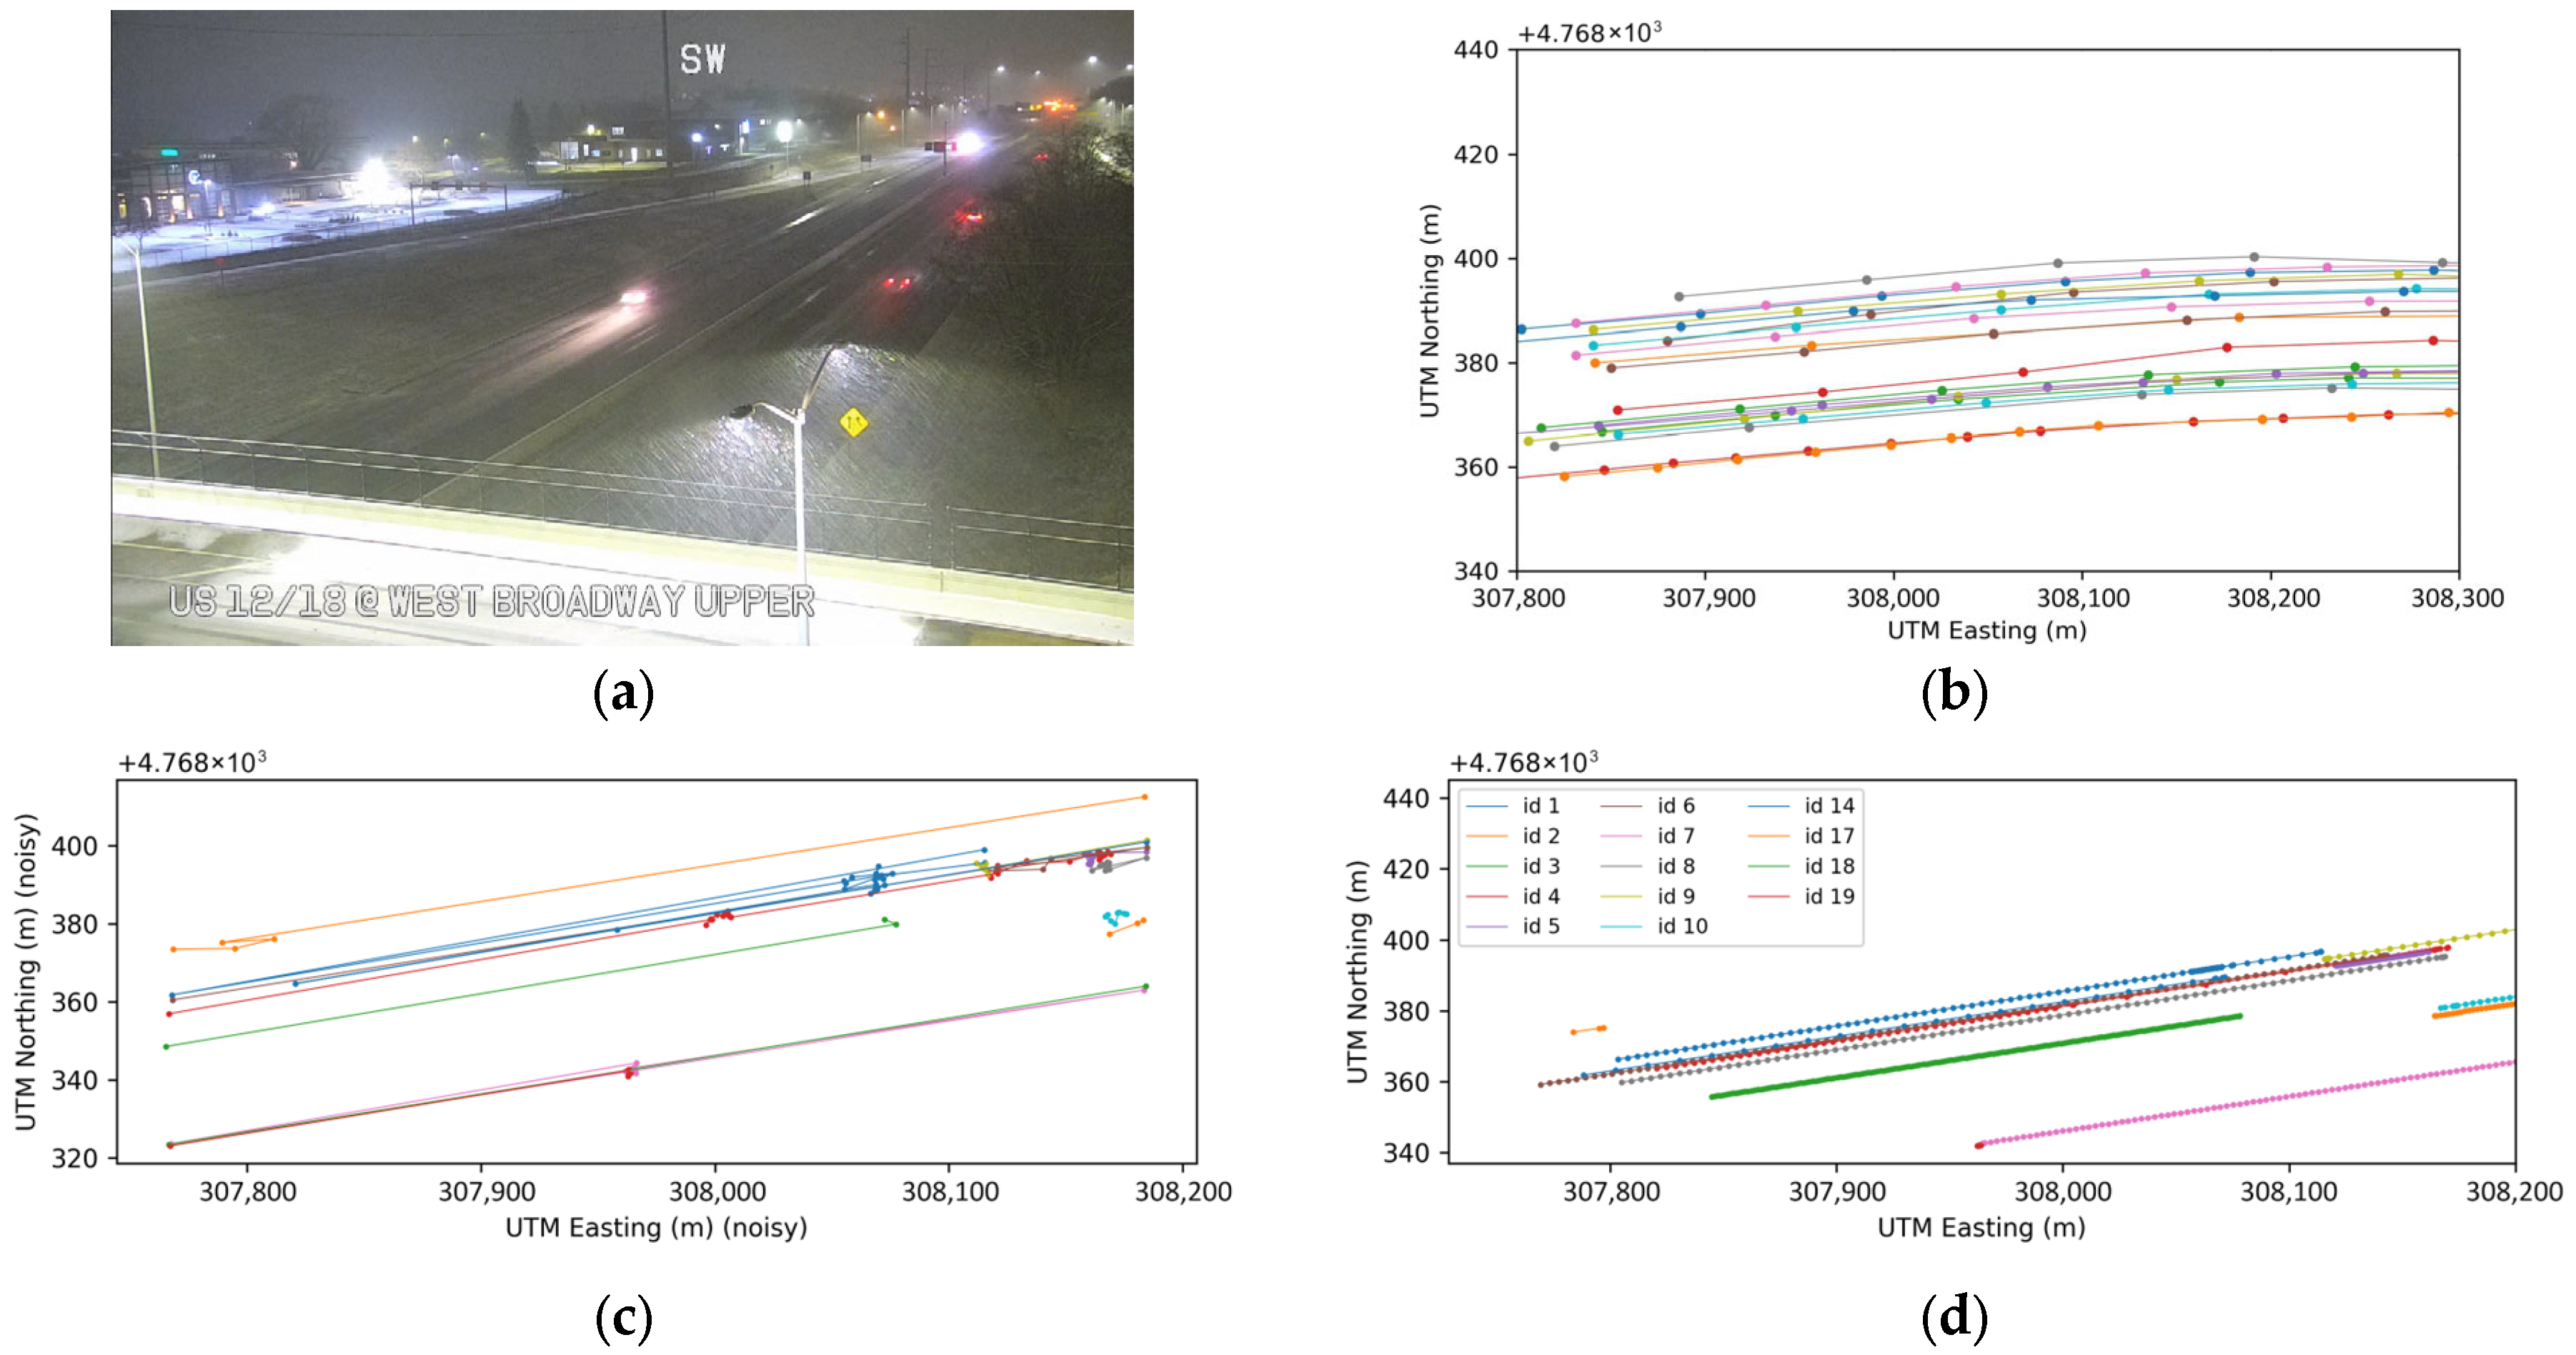
4.1. Data Processing

The road traffic digital twin system employs advanced data fusion techniques, including temporal alignment, spatial correlation, and feature extraction, to integrate real-time data from the WisDOT 511 platform [30] with historical information from existing data platforms. Temporal alignment synchronizes timestamps, ensuring accurate integration, while spatial correlation harmonizes spatial attributes. Feature extraction identifies relevant attributes, creating a unified dataset. To enhance data quality, the system utilizes data cleaning solutions, such as outlier detection, imputation strategies for missing values, and noise reduction through signal-processing algorithms. This comprehensive approach ensures the reliability of the integrated dataset, forming the basis for advanced analytics. The WisTransPortal API [35] provides access to historical traffic data, including vehicle volume, speed records, and incident reports, supporting longitudinal analysis and predictive modeling. The WisDOT 511 API facilitates the real-time ingestion of traffic incidents, road closures, and congestion updates, allowing the DT to reflect current network conditions with minimal latency, as shown in Figure 5.
In addition to numerical sensor data, video-based traffic analysis plays a crucial role in real-time vehicle detection, tracking, and classification. The system utilizes computer vision techniques to extract vehicle information from surveillance cameras. Object detection models (e.g., YOLO [36]) and multi-frame tracking techniques (e.g., DeepSORT [37]) are employed to identify and track vehicles, pedestrians, and other road users.
Although camera-based object detection and tracking have reached maturity and widespread use, their accuracy in capturing vehicle trajectories can still be compromised due to various factors. Challenges include poor visibility in adverse weather conditions such as rain or fog [38,39], as well as inherent camera limitations like perspective distortion and reduced detection accuracy in distant regions. These issues can result in fragmented trajectories, unrealistic estimates of speed and acceleration, and significant data gaps.
To align video-based detection results with real-world coordinates, we first project each pixel point ( u , v ) from the image plane to geographic space using a homography matrix, H , under a ground-plane assumption:
P w o r l d = H · u v 1
The matrix, H R 3 × 3 , is computed through feature-point calibration by solving
H = arg min H i = 1 N H · ρ i i m g ρ i u t m
where ρ i i m g and ρ i u t m are the i t h pair of corresponding points in the image and UTM coordinate system, respectively.
Even with this mapping, video-based trajectories are still affected by noise and data dropouts. We model the observed trajectory as a noisy estimate of the true one:
P ^ t v i d e o = P t t r u e + ε t
where P ^ t v i d e o is the video-detected position at time t , and ε t captures noise and distortion.
Telematics data offer essential complementary support, providing continuous and reliable trajectory information such as the average speed, v t e l ; the precise location; and a consistent travel direction, θ t e l . While telematics data do not directly replace missing camera detections, they effectively constrain predicted vehicle trajectories within realistic bounds, correcting inaccuracies and smoothing irregularities. For instance, during frames where the video signal is lost or unreliable, we estimate the vehicle’s updated position based on telematics cues:
P ~ t + t f u s e d = P ^ t v i d e o + v t e l · t · cos θ t e l sin θ t e l
Thus, the final fused trajectory is
P t f u s e d = P ^ t v i d e o ,     if   confidence   is   hight P ~ t + t f u s e d ,   otherwise
In this way, telematics data constrain and correct the vehicle trajectory within realistic bounds, smoothing irregularities and ensuring trajectory continuity. Integrating telematics data with video-based detections thus significantly enhances data reliability across diverse environmental and technical conditions. A data fusion example under a rainy nighttime scenario is shown in Figure 6. In such low-visibility conditions, the standalone video-based detection pipeline achieved only a 23% vehicle detection success rate, with estimated speeds showing deviations as high as 214   m / s due to intermittent tracking and misidentification. After integrating telematics data, the system was able to constrain speed and acceleration estimates within realistic physical limits and successfully reconstruct 95% of the missing or misclassified detection frames.
Furthermore, high-definition mapping data are collected using autonomous vehicles (AVs) with radar and cameras from our lab. These data serve as a static backdrop against which real-time events are analyzed.
Figure 7 depicts our LiDAR–camera fusion workflow for work-zone mapping. A test vehicle equipped with a roof-mounted 32-beam LiDAR and an industry camera is driven through an active work zone, simultaneously acquiring dense point clouds (Figure 7a) and high-definition video frames (Figure 7b). After extrinsic calibration, each LiDAR sweep is time-synchronized with its corresponding image. A vision pipeline detects cones, drums, speed-limit boards, and other traffic-control devices in the image. To assign semantic labels to 3D LiDAR points, we project each LiDAR point, P L , into the image using:
p = K T C L P L ,   X , Y , Z T = X Z , Y Z
where T C L is the extrinsic transformation from LiDAR to camera, and K is the camera-intrinsic matrix. If the projected pixel, p , falls within the segmentation mask, S l , of class l , the point is assigned that label. The final annotated point cloud is P F = x i , y i , z i , l i i = 1 N , which is an accurately geo-referenced, semantically annotated point cloud (Figure 7c).
The fused 3D model enables three key applications. First, it can be loaded into simulators to create a digital twin for rapid Vehicle-in-the-Loop tests and traffic-flow studies. Second, because every cone, sign, and taper is metrically geo-referenced, the software can automatically compare offsets, buffer lengths, and device spacing with MUTCD or state rules, eliminating most field surveys. Third, overlaying observed or simulated vehicle paths on the annotated map lets analysts evaluate sight-line obstructions, merge conflicts, and speed–control effectiveness, pinpointing segments where crash risk is highest.

4.2. Digital Twinning

Another function of the proposed system is digital twinning, involving the creation of a virtual environment using Unity, shown in Figure 8. This environment serves as a dynamic replica of the real-world traffic scenario, enabling synchronous modeling and reconstruction. Utilizing video recognition technologies, road users are identified and tracked, and their trajectories can be integrated into the virtual environment. Notably, the digital twinning process facilitates the continuous recording of historical traffic conditions in a cost-effective manner. By employing vectorization techniques, the system transforms intricate video data into a simplified and manageable format, reducing storage requirements and enabling efficient retrieval for extensive historical data analysis.
It is worth noting that the digital twinning process enables the permanent recording of historical traffic conditions at a low cost. Through vectorization techniques, the system transforms complex video data into a simpler, more manageable format. This not only significantly reduces the storage requirements but also allows for easy retrieval and analysis of historical data for long-term planning and evaluation.

4.3. Decision Making

The processed outputs of the digital twin system—such as risk indicators, traffic state forecasts, and anomaly alerts—lay the foundation for future decision-making modules. These insights can support adaptive signal control, emergency response coordination, and strategic traffic rerouting. With the modular architecture in place, the system is designed to accommodate decision-support tools in future deployments, ensuring that analysis results are actionable and seamlessly integrated with existing traffic management workflows.

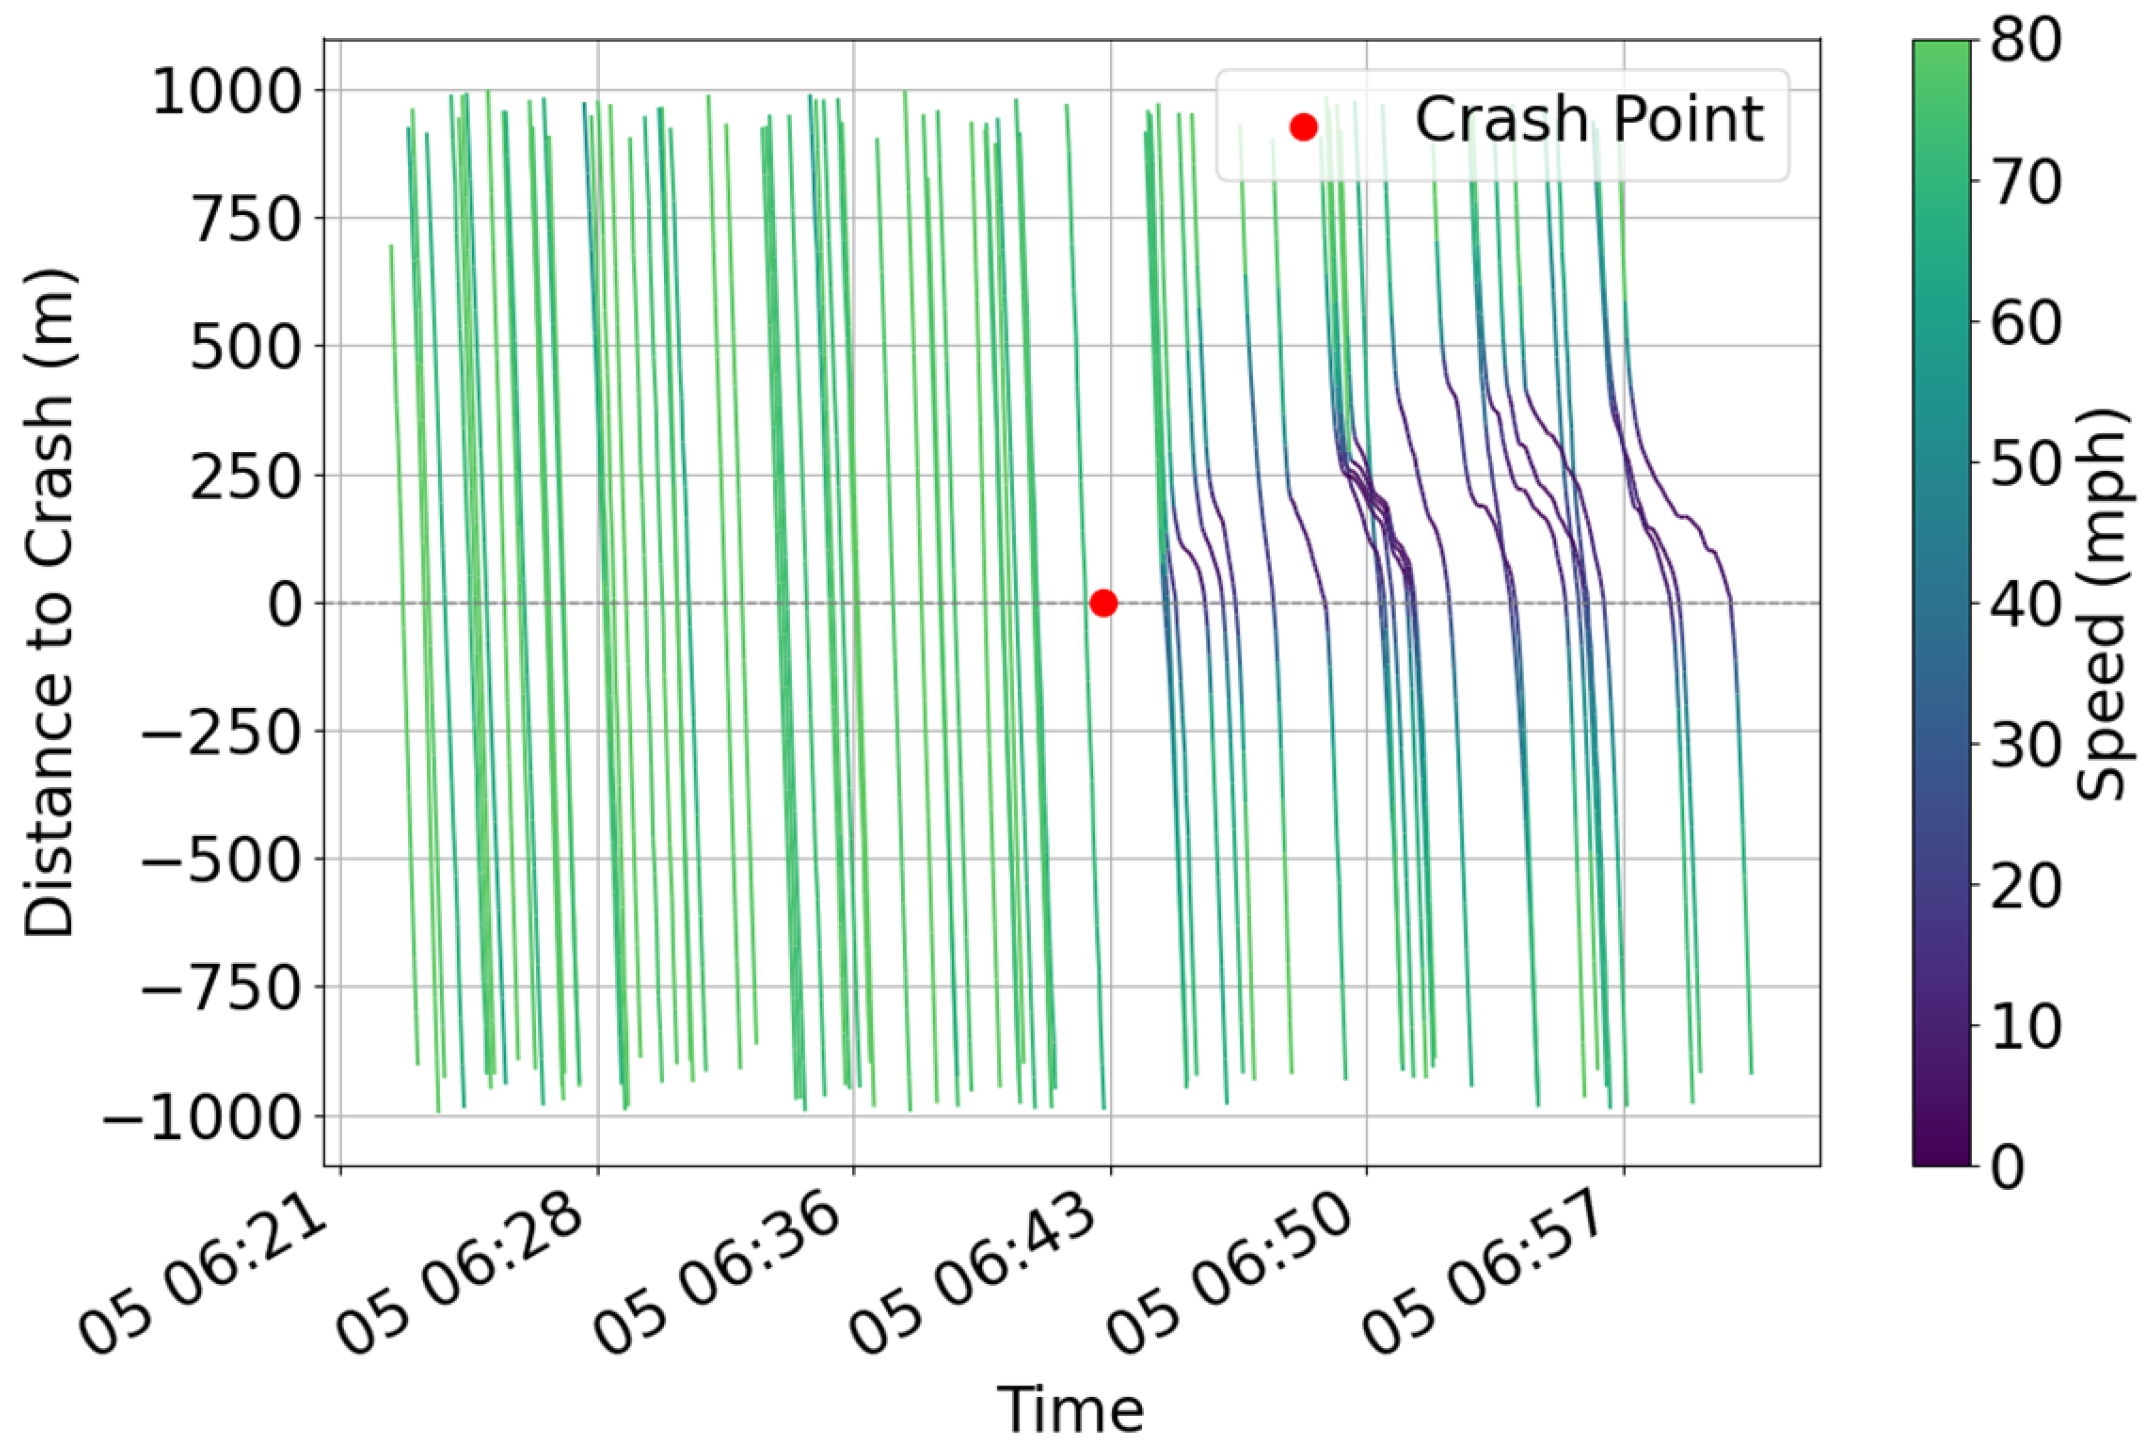
4.4. Application Case 1: Crash Monitoring and Handling

The digital twin system provides a proactive approach to crash monitoring and response by detecting potential accident risks and identifying actual crash incidents in real time. This capability is primarily realized through detailed trajectory data analysis, leveraging connected vehicle telematics and real-time traffic dynamics. Accurate crash risk prediction is crucial for timely interventions, emergency preparedness, and efficient traffic management.
As a basic instance of our learning framework, we implement a lightweight Spatio-Temporal Convolutional Neural Network (ST-CNN) to demonstrate how crash risk can be inferred directly from local trajectory dynamics. To model spatio-temporal risk patterns from trajectory data, we discretize the study area into a two-dimensional grid of spatio-temporal cells. Each cell, denoted as c e l l i , j , corresponds to a time interval, i , and a spatial segment, j . The spatial dimension is divided by road segments or fixed-length spatial bins (e.g., 50 m), and the temporal dimension is divided by uniform time windows (e.g., 7 s).
The input data are represented as a discretized traffic tensor, denoted as X R T × S × C , where T represents the number of temporal intervals; S the number of spatial segments; and C = 3 the channel dimension corresponding to average speed, average acceleration, and traffic flow. Each spatio-temporal cell ( i , j ) thus stores the local feature vector x i , j = [ v i , j , a i , j , q i , j ] , where v i , j and a i , j are the average speed and average acceleration of all vehicles observed in cell ( i , j ) , respectively. q i , j is the traffic flow, defined as the number of vehicles passing through the cell during the interval.
In the model selection process, we considered the trade-off between comprehensiveness and training complexity. While more advanced models and richer feature sets can incorporate additional influencing factors, they require significantly longer training time and more tuning effort. Moreover, due to the inherent randomness in traffic systems, increased model complexity does not always lead to more stable or accurate predictions.
To effectively capture both the local and broader spatio-temporal propagation patterns of crash risks, the ST-CNN applies convolutional operations across this structured grid. A spatio-temporal kernel parameterized by W R ( 2 h t + 1 ) × ( 2 h s + 1 ) × C and bias, b , is used to perform the convolution. The forward mapping for each cell ( i , j ) is calculated as
z i j = m , n N i , j W m , n · x m , n + b
where N i , j is the local neighborhood of c e l l i , j . W m , n is the convolution weight for c e l l m , n . σ(⋅) is a sigmoid activation function that maps the result to a probability score.
Subsequently, the predicted crash probability, y ^ i , j , for each cell is obtained through a sigmoid activation function:
y ^ i , j = σ z i j = 1 1 + e z i j
The goal of this convolutional structure is to learn how abnormal dynamics in surrounding cells contribute to increased crash risk in a specific location and time window.
As illustrated in the example trajectory heatmap in Figure 9, the cell highlighted in the grid exhibits a high predicted crash probability of 0.82. This risk level is inferred by aggregating the local traffic dynamics within the cell and its surrounding neighborhood.
The digital twin will next integrate a safety–risk forecasting module that goes beyond crash detection, as shown in Figure 10. The module will train spatio-temporal models—such as bidirectional LSTMs and lightweight transformers—on historical crashes, traffic volume, weather, and roadway geometry. It will stream the model’s probability scores into a live heatmap layer, giving operators a color-coded view of segments that are likely to experience a crash in the next five to ten minutes. These early warnings will allow the Traffic Management Center to post dynamic speed advisories, adjust signal timing, or stage emergency crews in advance. This proactive layer will turn the current crash-monitoring workflow into a full closed-loop system that predicts, verifies, and mitigates safety risks in real time.

4.5. Application Case 2: Eco-Driving

The digital twin platform facilitates eco-driving strategies aimed at reducing fuel consumption and emissions by optimizing vehicle speed and acceleration patterns in real-world traffic conditions. Eco-driving can be implemented in two primary ways: driver advisory systems, which provide real-time speed recommendations to human drivers, and direct vehicle control, where CAVs autonomously adjust their trajectories for maximum energy efficiency.
The fuel benefit of any eco-driving strategy depends on the surrounding traffic. A preceding vehicle constrains safe headway, and the ego CAV’s motion propagates to the following vehicles. A rigorous evaluation must, therefore, include the full micro-platoon, not a lone test car. A DT solves the scale problem. Other vehicles run in the simulation, where their states are updated at each step. The simulated states stream to the industrial PC onboard the real CAV that drives on the test track. The onboard planner uses those states to generate an energy-optimal trajectory, executes it, and returns the ego vehicle’s measured position to the simulation, which then advances every surrounding vehicle to the next step. In this experiment, the CAV trajectory is generated using a Physics-Enhanced Residual Learning (PERL) predictive model [40]. The PERL model combines a physically interpretable shockwave-based car-following model with a data-driven residual learner based on a convolutional LSTM (CLSTM). Given the historical states of upstream vehicles, it predicts the future acceleration of preceding vehicle K over a time window, t T f , as:
a ^ P E R L = a ^ K t P h y + r ^ K t R L t T f
where a ^ K t P h y is the predicted future acceleration computed by Newell’s model, and r ^ K t R L is the predicted acceleration residual by the CLSTM model.
Then, the predicted behavior of the preceding vehicle is combined with a model-predictive controller (MPC) to optimize the CAV control sequence, u k k = 0 N 1 , over horizon N :
min u k k = 0 N 1   J = k = 0 N 1 ( α 1 d + α 2 v + α 3 F u e l ( v k , a k ) )
where F u e l ( · ) is the VT-Micro instantaneous consumption map. Positive weights. α 1 , α 2 , α 3 , balance distance-keeping, smoothness, and economy.
This model is validated in the Vehicle-in-the-Loop (ViL) architecture for eco-driving testing, as shown in Figure 11. Six twenty-second trips covering acceleration, cruising, and deceleration were run. The VT-Micro model measured fuel use. Table 1 lists the results. Average consumption fell by about 3.4% relative to an uncontrolled human-driven baseline while keeping Time-to-Collision above three seconds and damping speed oscillations, as shown in Table 2. The experiment confirms that the DT, coupled with PERL prediction, can deliver verifiable fuel savings in a mixed virtual–physical traffic scene.

5. Conclusions and Future Challenges

This study presents a data-driven DT system that merges heterogeneous traffic data with AI analytics to extend conventional ATMSs. The DT provides real-time situational awareness, forecasts traffic states, and closes the loop with control-oriented applications—illustrated by incident response, crash-risk prediction, and energy-optimal eco-driving. A prototype on Madison’s Flex Lane confirms the framework’s practicality and its ability to carry simulation insights into field operations. Because it can virtually test new regulations, tolls, and infrastructure upgrades, the DT also serves as a low-risk sandbox for policy evaluation. The validated eco-driving module demonstrates how predictive DT analytics can be translated into real-world energy savings, bridging simulation with deployment and supporting sustainable mobility policies.
Despite these advancements, several key challenges remain. One major challenge is the integration of AI into DT systems. Generative AI holds the potential for simulating alternative traffic scenarios and assisting decision-making, but ensuring robustness, interpretability, and generalization remains difficult. AI-driven models must also be validated against real-world constraints. Cybersecurity risks are another critical concern, as real-time data exchange makes DT systems vulnerable to cyber threats and data breaches. Protecting AI models, securing data transmission, and implementing privacy-preserving measures will be essential for large-scale deployment.
Another challenge lies in the computational infrastructure required for real-time DT operations. The increasing complexity of these systems demands a distributed edge–cloud architecture that balances real-time computation at the edge (e.g., roadside units, connected vehicles) with large-scale simulations in the cloud. The efficient allocation of computational resources is necessary to ensure low latency, scalability, and robust real-time response capabilities.
Closing the sim-to-real gap is another critical issue. Reducing the residual error between simulated and real-world traffic behaviors is crucial for ensuring that management strategies derived in the digital environment can be effectively applied in practice. Future work should focus on quantifying and minimizing deviations between simulated and actual traffic flow dynamics, using continuous real-world validation to refine DT models.
Lastly, standardization and interoperability remain major barriers to widespread adoption. DT systems rely on integrating data from multiple sources, but without standardized data exchange protocols, interoperability between different platforms is limited. Establishing common data formats, communication standards, and APIs will enable seamless integration with existing traffic management infrastructures. Future DT implementations should be designed with cross-platform compatibility in mind, allowing for broader collaboration among stakeholders and facilitating the growth of sustainable, intelligent transportation initiatives.

Author Contributions

Conceptualization, C.M.; software, H.S., Z.H. and P.L.; visualization, K.L., Z.L., Z.S., and L.S., investigation, H.L. and H.H., writing—original draft preparation, K.L.; writing—review and editing, C.M., project administration, C.M., X.L. and S.C.; funding acquisition, X.L. All authors have read and agreed to the published version of the manuscript.”

Funding

This research received no external funding.

Institutional Review Board Statement

Not applicable.

Informed Consent Statement

Not applicable.

Data Availability Statement

The data are available from the corresponding author upon reasonable request.

Acknowledgments

This work was supported by the National Science Foundation Cyber–Physical Systems (CPS) program. Award Number: 2343167.

Conflicts of Interest

The authors declare no conflict of interest.

References

  1. Nezamuddin, N.; Jiang, N.; Ma, J.; Zhang, T.; Waller, S.T. Active Traffic Management Strategies: Implications for Freeway Operations and Traffic Safety. 2011. Available online: https://trid.trb.org/View/1092841 (accessed on 16 February 2025).
  2. De Souza, A.M.; Brennand, C.A.; Yokoyama, R.S.; Donato, E.A.; Madeira, E.R.; Villas, L.A. Traffic Management Systems: A Classification, Review, Challenges, and Future Perspectives. Int. J. Distrib. Sens. Netw. 2017, 13, 1550147716683612. [Google Scholar] [CrossRef]
  3. Soleimaniamiri, S.; Li, X.S.; Yao, H.; Ghiasi, A.; Vadakpat, G.; Bujanovic, P.; Lochrane, T.; Stark, J.; Racha, S.; Hale, D. FHWA Cooperative Automation Research: CARMA Proof-of-Concept Transportation System Management and Operations Use Case 3–Traffic Signal Optimization with CDA at Signalized Intersections; United States Federal Highway Administration: Washington, DC, USA, 2022. Available online: https://rosap.ntl.bts.gov/view/dot/61035 (accessed on 16 February 2025).
  4. Djahel, S.; Doolan, R.; Muntean, G.-M.; Murphy, J. A Communications-Oriented Perspective on Traffic Management Systems for Smart Cities: Challenges and Innovative Approaches. IEEE Commun. Surv. Tutor. 2015, 17, 125–151. [Google Scholar] [CrossRef]
  5. Hussain, O.; Ghiasi, A.; Li, X.; Qian, Z. Freeway Lane Management Approach In Mixed Traffic Environment with Connected Autonomous Vehicles. arXiv 2016, arXiv:1609.02946. [Google Scholar]
  6. Wang, L.; Abdel-Aty, M.; Lee, J. Implementation of Active Traffic Management Strategies for Safety on Congested Expressway Weaving Segments. Transp. Res. Rec. 2017, 2635, 28–35. [Google Scholar] [CrossRef]
  7. Ersan, M.; Irmak, E.; Colak, A.M. Applications, Insights and Implications of Digital Twins in Smart City Management. In Proceedings of the 2024 12th International Conference on Smart Grid (icSmartGrid), Setubal, Portugal, 27–29 May 2024; pp. 378–383. [Google Scholar]
  8. Aloupogianni, E.; Doctor, F.; Karyotis, C.; Maniak, T.; Tang, R.; Iqbal, R. An AI-Based Digital Twin Framework for Intelligent Traffic Management in Singapore. In Proceedings of the 2024 International Conference on Electrical, Computer and Energy Technologies, Sydney, Australia, 25–27 July 2024; pp. 1–6. [Google Scholar]
  9. Gao, Y.; Qian, S.; Li, Z.; Wang, P.; Wang, F.; He, Q. Digital Twin and Its Application in Transportation Infrastructure. In Proceedings of the 2021 IEEE 1st International Conference on Digital Twins and Parallel Intelligence (DTPI), Beijing, China, 15 July–15 August 2021; pp. 298–301. [Google Scholar]
  10. Glaessgen, E.; Stargel, D. The Digital Twin Paradigm for Future NASA and U.S. Air Force Vehicles. In 53rd AIAA/ASME/ASCE/AHS/ASC Structures, Structural Dynamics and Materials Conference; American Institute of Aeronautics and Astronautics: Honolulu, HI, USA, 2012. [Google Scholar]
  11. Tao, F.; Qi, Q.; Wang, L.; Nee, A.Y.C. Digital Twins and Cyber–Physical Systems toward Smart Manufacturing and Industry 4.0: Correlation and Comparison. Engineering 2019, 5, 653–661. [Google Scholar] [CrossRef]
  12. Kušić, K.; Schumann, R.; Ivanjko, E. A Digital Twin in Transportation: Real-Time Synergy of Traffic Data Streams and Simulation for Virtualizing Motorway Dynamics. Adv. Eng. Inform. 2023, 55, 101858. [Google Scholar] [CrossRef]
  13. Hu, C.; Fan, W.; Zeng, E.; Hang, Z.; Wang, F.; Qi, L.; Bhuiyan, M.Z.A. Digital Twin-Assisted Real-Time Traffic Data Prediction Method for 5G-Enabled Internet of Vehicles. IEEE Trans. Ind. Inform. 2022, 18, 2811–2819. [Google Scholar] [CrossRef]
  14. Chang, X.; Zhang, R.; Mao, J.; Fu, Y. Digital Twins in Transportation Infrastructure: An Investigation of the Key Enabling Technologies, Applications, and Challenges. IEEE Trans. Intell. Transp. Syst. 2024, 25, 6449–6471. [Google Scholar] [CrossRef]
  15. Li, Y.; Zhang, W. Traffic Flow Digital Twin Generation for Highway Scenario Based on Radar-Camera Paired Fusion. Sci. Rep. 2023, 13, 642. [Google Scholar] [CrossRef]
  16. Irfan, M.S.; Dasgupta, S.; Rahman, M. Toward Transportation Digital Twin Systems for Traffic Safety and Mobility: A Review. IEEE Internet Things J. 2024, 11, 24581–24603. [Google Scholar] [CrossRef]
  17. Fang, J.; Yan, D.; Qiao, J.; Xue, J.; Yu, H. DADA: Driver Attention Prediction in Driving Accident Scenarios. IEEE Trans-Actions Intell. Transp. Syst. 2022, 23, 4959–4971. [Google Scholar] [CrossRef]
  18. Hu, J.; Wang, S.; Zhang, Y.; Wang, H.; Liu, Z.; Cao, G. Safety-aware human-lead vehicle platooning by proactively re-acting to uncertain human behaving. Transp. Res. Part C: Emerg. Technol. 2025, 170, 104941. [Google Scholar] [CrossRef]
  19. Ma, C.; Li, X.; Ma, K.; Zhang, P.; Long, K.; Chen, S. Trajectory-Based Performance Ranking System of Low-Level Auto-mated Vehicles. In Proceedings of the in 2023 IEEE 26th International Conference on Intelligent Transportation Systems (ITSC), Bizkaia, Spain, 24–28 September 2023; pp. 5649–5654. [Google Scholar] [CrossRef]
  20. Alexiadis, V. Integrated Corridor Management in the U.S.—Analysis, Modeling and Simulation. In Proceedings of the 2011 14th International IEEE Conference on Intelligent Transportation Systems (ITSC), Washington, DC, USA, 5–7 October 2011; pp. 218–223. [Google Scholar] [CrossRef]
  21. Dasgupta, S.; Rahman, M.; Lidbe, A.D.; Lu, W.; Jones, S. A Transportation Digital-Twin Approach for Adaptive Traffic Control Systems. arXiv 2023, arXiv:2109.10863. [Google Scholar] [CrossRef]
  22. Taylor, J.; Culligan, P.; Derrible, S.; Jain, R.; Lam, D. Smart City Digital Twin Convergence Workshop. 2019. Available online: https://www.researchgate.net/profile/Patricia-Culligan/publication/374951291_Smart_City_Digital_Twin_Convergence_Work-shop_FINAL_REPORT/links/6539440124bbe32d9a6f0402/Smart-City-Digital-Twin-Convergence-Workshop-FINAL-REPORT.pdf (accessed on 16 February 2025).
  23. Botín-Sanabria, D.M.; Mihaita, A.-S.; Peimbert-García, R.E.; Ramírez-Moreno, M.A.; Ramírez-Mendoza, R.A.; Lozoya-Santos, J. de J. Digital Twin Technology Challenges and Applications: A Comprehensive Review. Remote Sens. 2022, 14, 1335. [Google Scholar] [CrossRef]
  24. Alcaraz, C.; Lopez, J. Digital Twin: A Comprehensive Survey of Security Threats. IEEE Commun. Surv. Tutor. 2022, 24, 1475–1503. [Google Scholar] [CrossRef]
  25. Aljohani, T.; Almutairi, A. A Comprehensive Survey of Cyberattacks on EVs: Research Domains, Attacks, Defensive Mechanisms, and Verification Methods. Def. Technol. 2024, 42, 31–58. [Google Scholar] [CrossRef]
  26. Sun, Z.; Liu, R.; Hu, H.; Liu, D.; Yan, Z. Cyberattacks on Connected Automated Vehicles: A Traffic Impact Analysis. IET Intell. Transp. Syst. 2023, 17, 295–311. [Google Scholar] [CrossRef]
  27. Lai, J.; Hu, J.; Cui, L.; Chen, Z.; Yang, X. A generic simulation platform for cooperative adaptive cruise control under partially connected and automated environment. Transp. Res. Part C: Emerg. Technol. 2020, 121, 102874. [Google Scholar] [CrossRef]
  28. Jabeen Siddiqi, S.; Alobaidi, A.H.; Ahmad Jan, M.; Tariq, M. Securing Vehicle-to-Digital Twin Communications in the Internet of Vehicles. ACM Trans. Multimed. Comput. Commun. Appl. 2025. [Google Scholar] [CrossRef]
  29. Grasselli, C.; Melis, A.; Girau, R.; Callegati, F. A Digital Twin for Enhanced Cybersecurity in Connected Vehicles. In Proceedings of the 2023 23rd International Conference on Transparent Optical Networks (ICTON), Bucharest, Romania, 2–6 July 2023; pp. 1–4. [Google Scholar]
  30. 511WI. Available online: https://511wi.gov/511wi.gov (accessed on 16 February 2025).
  31. Xu, Z.; Wei, T.; Easa, S.; Zhao, X.; Qu, X. Modeling Relationship between Truck Fuel Consumption and Driving Behav-ior Using Data from Internet of Vehicles. Comput. Aided Civ. Eng. 2018, 33, 209–219. [Google Scholar] [CrossRef]
  32. Dosovitskiy, A.; Ros, G.; Codevilla, F.; Lopez, A.; Koltun, V. CARLA: An Open Urban Driving Simulator. In Proceedings of the 1st Annual Conference on Robot Learning, Mountain View, CA, USA, 13–15 November 2017; pp. 1–16. [Google Scholar]
  33. Lopez, P.A.; Behrisch, M.; Bieker-Walz, L.; Erdmann, J.; Flötteröd, Y.-P.; Hilbrich, R.; Lücken, L.; Rummel, J.; Wagner, P.; Wiessner, E. Microscopic Traffic Simulation Using SUMO. In Proceedings of the 2018 21st International Conference on Intelligent Transportation Systems (ITSC), Maui, HI, USA, 4–7 November 2018; pp. 2575–2582. [Google Scholar]
  34. Technologies, U. Unity-Manual: Unity User Manual 2022.2. Available online: https://docs.unity3d.com/2022.2/Documentation/Manual/UnityManual.html (accessed on 14 April 2025).
  35. The WisTransPortal System. Available online: https://transportal.cee.wisc.edu/applications/vspoc.html (accessed on 22 February 2025).
  36. Jocher, G.; Chaurasia, A.; Qiu, J. Ultralytics YOLO. 2023. Available online: https://github.com/ultralytics/ultralytics (accessed on 16 February 2025).
  37. Wojke, N.; Bewley, A.; Paulus, D. Simple Online and Realtime Tracking with a Deep Association Metric. arXiv 2017, arXiv:1703.07402. [Google Scholar] [CrossRef]
  38. Li, J.; Xu, R.; Ma, J.; Zou, Q.; Ma, J.; Yu, H. Domain adaptive object detection for autonomous driving under foggy weather. In Proceedings of the IEEE/CVF Winter Conference on Applications of Computer Vision; 2023; pp. 612–622. Available online: https://openaccess.thecvf.com/content/WACV2023/html/Li_Domain_Adaptive_Object_Detection_for_Autonomous_Driving_Under_Foggy_Weather_WACV_2023_paper.html (accessed on 6 May 2025).
  39. Li, B.; Liu, P.; Fu, L.; Li, J.; Fang, J.; Xu, Z.; Yu, H. Enhancing Vehicle Re-identification by Pair-flexible Pose Guided Vehicle Image Synthesis. Green Energy Intell. Transp. 2025, 100269. [Google Scholar] [CrossRef]
  40. Long, K.; Liang, Z.; Shi, H.; Shi, L.; Chen, S.; Li, X. Traffic Oscillation Mitigation with Physics-Enhanced Residual Learning (PERL)-Based Predictive Control. Commun. Transp. Res. 2024, 4, 100154. [Google Scholar] [CrossRef]
Figure 1. Roadmap overview of road traffic DT system.
Sustainability 17 04391 g001
Figure 2. DT system overview.
Sustainability 17 04391 g002
Figure 3. Autonomous vehicle for the stationary data collection and resulting high-definition mapping. (a) Full-scale Level 3 autonomous vehicle for data collection. (b) High-definition mapping precepted by vehicle. (c) Reconstructed high-definition mapping. (d) Reconstructed highway corridor. (e) Map of the highway corridor.
Sustainability 17 04391 g003
Figure 4. Layered architecture of the proposed digital twin platform.
Sustainability 17 04391 g004
Figure 5. Two key data platforms. (a) Real-time traffic conditions on the WisDOT 511 platform (https://511wi.gov/ (accessed on 1 May 2025)) and (b) historical traffic state information in WisTransPortal.
Sustainability 17 04391 g005
Figure 6. Merging of camera-based trajectory data and telematics data approach under a rainy nighttime scenario. (a) Camera view under poor visibility from WisDOT 511 platform (https://511wi.gov/). (b) Historical telematics data. (c) Video-based detected trajectory, (d) Enhanced trajectory combining camera-based and telematics data.
Sustainability 17 04391 g006
Figure 7. LiDAR–camera fusion for work-zone mapping and semantic point-cloud annotation: (a) raw LiDAR point cloud, (b) synchronized camera view, and (c) annotated 3D work-zone model.
Sustainability 17 04391 g007
Figure 8. Video recognition and Unity-based DT model. (a) Physics world video. (b) Digital simulation.
Sustainability 17 04391 g008
Figure 9. Traffic safety risk prediction process.
Sustainability 17 04391 g009
Figure 10. Traffic safety–risk prediction process.
Sustainability 17 04391 g010
Figure 11. Vehicle-in-the-Loop (ViL) experimental architecture: a closed loop formed by one physical CAV and multiple simulated vehicles, with an industrial computer closing the perception–prediction–control loop.
Sustainability 17 04391 g011
Table 1. Comparison of candidate simulation platforms for digital twin implementation.
FeatureCARLASUMOUnity
Primary FocusHigh-fidelity autonomous-vehicle research and developmentMacro-/micro-scale traffic flow modeling and policy evaluationGeneral-purpose 3D engine used to build interactive elements
Agent DiversityTypical traffic participants: vehicles, pedestrians, cyclists, static obstacles, etc.Vehicles and pedestriansVirtually unlimited (vehicles, robots, machinery, etc.)
Real-Time InteractionYes: real-time single-user interactionNoYes: real-time multi-user interaction
Visual FidelityPhotorealistic UE 5 graphics; dynamic weather/lighting2D or minimalist 3DReal-time rendering (HDRP/URP, VR/AR ready)
Sensor-Suite SimulationCamera, LiDAR, Radar, GNSS, etc.None built-inThird-party or custom plug-ins
Data Integration and APIsPython/C++ API, ROS 2 bridge, Digital-Twin Tool imports OSM and live map dataTraCI for stepwise control and telemetry streamingReal-time IoT stream support (REST, WebSockets, etc.)
GIS/Map ImportOne-click OSM, Unreal digital twin tool, and procedural meshing of real city blocksNative OSM importer; supports SUMO-net-convert for custom shapefilesGIS plug-ins or custom pipeline
Table 2. Fuel-consumption comparison between human-driver baseline and PERL-MPC eco-driving (unit: L · 100 km−1, VT-Micro estimate).
Vehicle 0Vehicle 1Average of Two Vehicles
BaselineProposedBaselineProposedBaselineProposed
Fuel consumption (L/100 km)6.986.7247.4737.2857.2276.985
Decrease (%) −3.7% −3.1% −3.4%
Disclaimer/Publisher’s Note: The statements, opinions and data contained in all publications are solely those of the individual author(s) and contributor(s) and not of MDPI and/or the editor(s). MDPI and/or the editor(s) disclaim responsibility for any injury to people or property resulting from any ideas, methods, instructions or products referred to in the content.

