Article

Spatiotemporal Evolution Characteristics and Drivers of TROPOMI-Based Tropospheric HCHO Column Concentration in North China

1
Key Laboratory of Beijing on Regional Air Pollution Control, Beijing University of Technology, Beijing 100124, China
2
Linyi Meteorological Bureau of Shandong Province, Linyi 276000, China
3
Department of Forestry Engineering, Shandong Agriculture and Engineering University, Jinan 250100, China
*
Author to whom correspondence should be addressed.
These authors contributed equally to this work.
Sustainability 2025, 17(10), 4386; https://doi.org/10.3390/su17104386
Submission received: 10 March 2025 / Revised: 6 May 2025 / Accepted: 7 May 2025 / Published: 12 May 2025

Abstract

:
The long-term nature of and heterogeneity in industrialization has led to high formaldehyde (HCHO) concentrations with seasonal and regional variation in North China, and this is highly influenced by changes in meteorological and population conditions. Here, we analyzed the spatial and temporal distribution characteristics of tropospheric HCHO VCD (vertical column density) and their key drivers in North China from 2019 to 2023 based on the HCHO daily dataset from TROPOMI. The results showed that the spatial distribution of tropospheric HCHO VCD in North China presented similar variation characteristics in the past 5 years, with the highest in the center, followed by the east and the lowest in the west. Seasonal variations were characterized, with the highest tropospheric HCHO VCD concentrations in summer and the lowest ones in spring. In addition, the effects of meteorological elements on HCHO VCD were analyzed based on the ERA5 dataset, and the correlation of HCHO VCD with temperature and wind was strong. In contrast, the correlation with precipitation and surface solar radiation was low, and the effects were different between the growing and non-growing seasons (the growing season, i.e., March–November, is defined as the period when the plant or a part of it actually grows and produces new tissues, while the non-growing season refers to December–the following February). Population density is directly proportional to tropospheric HCHO VCD. In this study, a higher-resolution spatial and temporal distribution model of tropospheric HCHO VCD in North China is obtained based on TROPOMI, which effectively characterizes the driving factors of HCHO VCD. Our study provides an important reference for developing of air pollution control measures in North China.

1. Introduction

Long-term high ozone concentrations in urban and industrial areas worldwide have caused serious air quality problems, which could cause neurotoxic reactions, respiratory infections, or direct damage to the immune systems of human beings. They can also inhibit plant growth and lead to reduced crop yields [1,2,3,4,5,6]. In the troposphere, volatile organic compounds (VOCs), which are the main precursors of ozone and secondary organic aerosols, can seriously affect air quality and climate [7]. The short life cycle of highly reactive VOCs accelerates photochemical oxidation in the atmosphere to produce formaldehyde (HCHO). Hence, emissions of VOCs can be inferred from HCHO concentrations [8,9,10]. Understanding the spatial and temporal variability of HCHO and its driving elements is important for quantifying the long-term emission trends of VOCs, addressing climate change and controlling air quality [11,12,13]. Previous studies [14,15] have shown that HCHO can be treated as an indicator of total VOCs. Shen et al. [15] applied space-based tropospheric HCHO columns to infer the long-term trend of VOC emissions in China throughout 2005–2016. In addition to being an important precursor of ozone, HCHO is itself a seriously hazardous air pollutant. HCHO is listed as one of the main hazardous air pollutants by the U.S. Environmental Protection Agency (EPA), and short-term exposure to low concentrations of HCHO increases the risk of death from non-accidental, circulatory, and respiratory diseases [16,17]. The EPA found that long-term exposure to 0.08 µg m−3 HCHO concentrations over a human lifetime increases the odds of developing cancer by one in a million [18,19,20,21,22,23]. HCHO is produced not only by human activities such as transportation, solvent use, industrial processes, and coal combustion [16] but also by the photochemical oxidation of VOCs (e.g., isoprene emitted from natural vegetation) in the outer atmosphere [24,25,26].
Ground-based measurements and monitoring are valuable methods but often limited in terms of spatial and temporal coverage, making it difficult to monitor systematically and comprehensively [27,28,29]. However, the rapid development of satellite remote sensing has made up for the shortcomings of ground monitoring. Compared with ground observation, satellite remote sensing has the advantages of day-by-day observation, high spatial resolution, wide spatial coverage, etc., and avoids many interfering factors, so satellite remote sensing can obtain a wide range of long time series of observational data, which provides a scientific data basis for HCHO monitoring [30]. Researchers have carried out satellite observations of HCHO using a series of satellite instruments since 1996 [9]. Among them, the newest TROPOMI satellite observations have unprecedented spatial accuracy compared to previous satellite observations (e.g., GOM-2 and OMI, etc.) [31], which has an initial spatial resolution of 3.5 km × 7.5 km, and after 6 August 2019, upgraded to 3.5 km × 5.5 km [32,33,34]. Compared to previous sensors such as OMI, it has a higher signal-to-noise ratio and the TROPOMI and MAX-DOAS chromatographic column correlation is much better than that of OMI [35]. TROPOMI, on board the Sentinel-5 satellite, was launched on 13 October 2017, and operates in a near-polar solar orbit of 824 km, where it scans the globe daily at 13:30 local time. The high-resolution satellite measurements allow us to analyze HCHO spatial and temporal features at finer scales. The Tropospheric Monitoring Instrument TROPOMI builds on the great success of OMI [36], and its pixel resolution and instrumental stability are more advantageous for observing urban-scale HCHO pollution. Its pixel resolution and instrument stability are more advantageous for observing HCHO pollution at the urban scale. The high spatial resolution of TROPOMI makes it an excellent instrument for observing HCHO pollution on several small scales, e.g., within cities, near power plants [37], near ships, and wildfires [7], as well as in oil and gas operations [38,39].
The North China Plain (NCP) is well known for its densely populated, highly industrialized, and economically developed, with four distinct seasons, a warm temperate semi-humid monsoon climate, and northeasterly and southwesterly winds throughout the year [40,41,42]. It covers Hebei, Henan, Shandong, Anhui, and northern Jiangsu, as well as most of the megacities of Beijing and Tianjin, with Beijing, Tianjin, and Hebei forming a large cluster of megacities within the NCP, known as the JJJ (Jing Jin Ji) region. The large number of industries, coupled with transportation emissions, has led to a significant increase in anthropogenic emissions of VOCs (a prerequisite for HCHO). The NCP region is bounded by the Bohai and Yellow Seas to the east and the Taihang Mountains to the west. The north–south boundary is delineated by the Yanshan Mountains, the Dabie Mountains, and the Yangtze River. The main part of the NCP region is shown in Figure 1. In recent years, the concentration of HCHO in China has been on the rise, with the NCP being one of the more severe regions [43]. In addition, the extreme heat during 2016–2017 led to more severe ozone pollution in the NCP, which in turn influenced the long-term ozone trend [1]. According to a report by the Department of Environmental Protection, the air pollution problem in the NCP has become more severe due to the accumulation of high levels of HCHO.
Long-term and large-scale HCHO concentrations can be effectively obtained using satellite remote sensing technology, which provides necessary data support for understanding the causes of pollution and pollution prevention in North China. In this study, we analyzed the spatial and temporal distribution of HCHO and the interannual variation and seasonal characteristics of HCHO in North China from 2019 to 2023 based on TROPOMI observations. The impacts of meteorological conditions, vegetation cover, and population density on the concentration of HCHO in the tropospheric column were explored, with a view to providing basic data support for the improvement of air quality in North China.

2. Materials and Methods
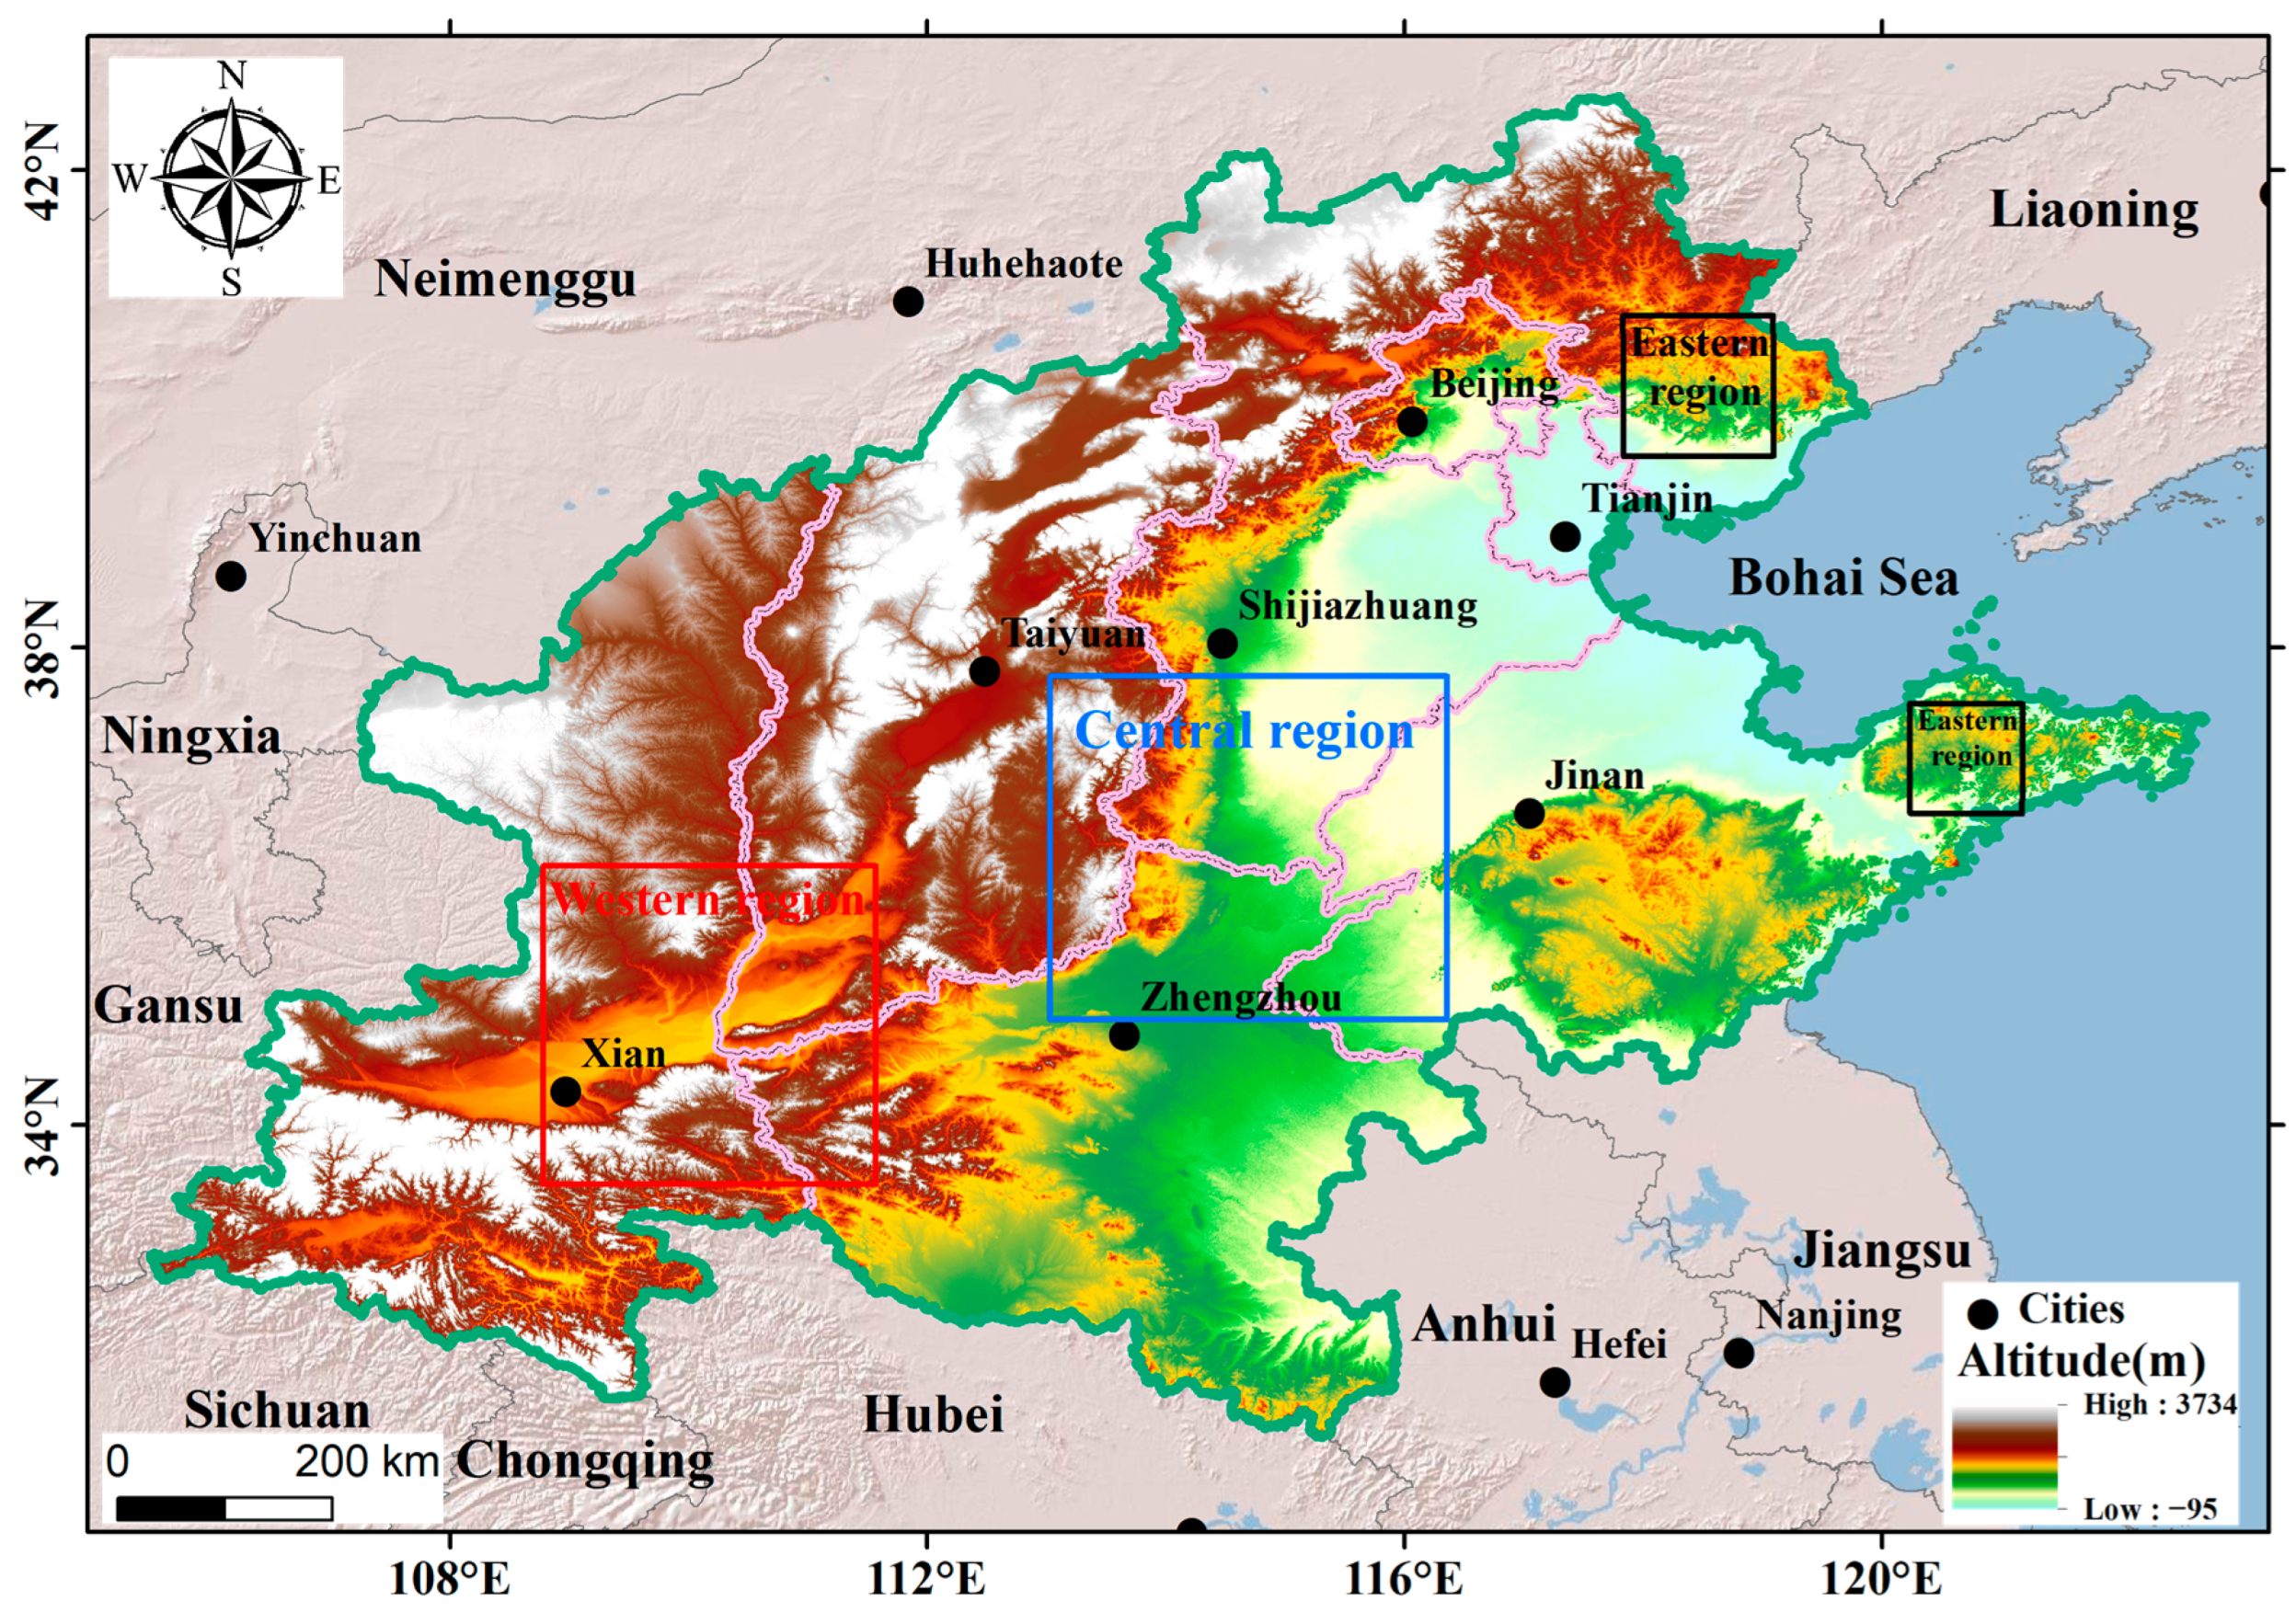
2.1. Data Sources

This study uses the 2019–2023 HCHO dataset from TROPOMI, derived from the European Space Agency Copernicus Open Access Center (Copernicus Open Access Hub) (https://dataspace.copernicus.eu/, accessed on 9 March 2025). TROPOMI consists of UV, UV–visible, NIR, and short-wave IR, with 8 non-overlapping and discontinuous spectral bands (270 nm–2385 nm). HCHO is obtained by spectral inversion in band 3, which is acquired by a UV–visible spectrometer with a spectral resolution of 0.5 nm. The wavelengths in band 3 range from 320 to 405 nm, and the minimum signal-to-noise ratios in this band are 800 to 1000 nm, and the lowest signal-to-noise ratios in this band are all 800~1000. Regarding the uncertainties of the above products, previous studies have carried out comprehensive and in-depth theoretical analyses and comparative validations. To further reduce the relevant impact, this study filters the relevant data with the following filtering criteria: quality control coefficient (qa_value) > 0.6, solar zenith angle (SZA) < 70°, and atmospheric mass factor (AMF) > 0.1. This study covers the period of 2019–2023, and the spatial accuracy of the corresponding data is 3.5 km × 5.5 km~3.5 km × 7.5 km. In this study, annual and seasonal mean data with a spatial accuracy of 0.01° × 0.01° were constructed based on the daily observation data by applying the oversampling method. To analyze the seasonal variation characteristics, the seasonal mean was calculated based on the following criteria: March–May for spring, June–August for summer, September–November for autumn, and December–the following February for winter. The growing season (March–November), is defined as the period when the plant or a part of it actually grows and produces new tissues, and vice versa, the non-growing season (December–the following February) [44].
The newest global reanalysis dataset of the European Center for Medium-Range Weather Forecasts (ECMWF) (https://landscan.ornl.gov/, accessed on 9 March 2025), i.e., ECMWF Reanalysis v5 (ERA5), is based on the 4D-Var data assimilation method and the 41r2 cycle of the Integrated Forecasting System (IFS). It can provide a large amount of long-term global meteorological data, such as temperature, wind speed, etc., for selectable regions, and it replaces ERA-Interim. Its unique advantage is the relatively high spatial and temporal resolution, with a spatial resolution of 31 × 31 km and a temporal resolution of 1 h. This provides more details of atmospheric parameters. In this study, in order to investigate the effects of temperature, precipitation, and wind speed on HCHO column concentrations, monthly mean surface temperature, monthly cumulative precipitation, and monthly mean wind speed from ERA5 were spatially correlated with monthly mean tropospheric formaldehyde column concentrations for the period 2019–2023. The ERA5 data were resampled onto a grid with the same spatial resolution as the formaldehyde column concentrations (0.01° × 0.01°), and thematic maps of the spatial distribution were generated based on the calculated correlation coefficients.
The Normalized Difference Vegetation Index (NDVI) data are derived from the MODIS terrestrial tertiary product system developed by the National Aeronautics and Space Administration (NASA), and the MOD13A3 dataset was used in this study. The data were collected and generated by the Terra polar-orbiting environmental remote sensing satellite, constructed by sinusoidal projection with 1000 m spatial resolution and monthly temporal resolution, and belong to the global scale standardized processing products. The dataset significantly improves the characterization accuracy of the surface vegetation information through the unified algorithm of radiometric correction, geometric correction, and the elimination of atmospheric interferences (including aerosols, clouds, water vapor, etc.) on the original observation data. Thanks to its multispectral characteristics, global coverage, timeliness, and open access, this product has become an important data source for vegetation cover dynamics monitoring studies. The time series data of this study were selected from January 2019 to December 2023, totaling 60 months of continuous observation series.
The LandScan dataset is a comprehensive, high-resolution global population distribution dataset that utilizes state-of-the-art spatial modeling techniques and advanced geospatial data sources. LandScan provides detailed information on population size and density at a resolution of 30 arc-seconds, enabling timely and accurate access to human settlement patterns on a global scale. With its accuracy and granularity, LandScan supports a wide range of fields such as urban planning, disaster response, epidemiology, and environmental research, making it an important tool for policymakers and researchers to understand and address social and environmental challenges on a global scale. In this study, year-by-year population data from 2019 to 2023 were selected to analyze the distribution of population density and HCHO column concentration in different regions.

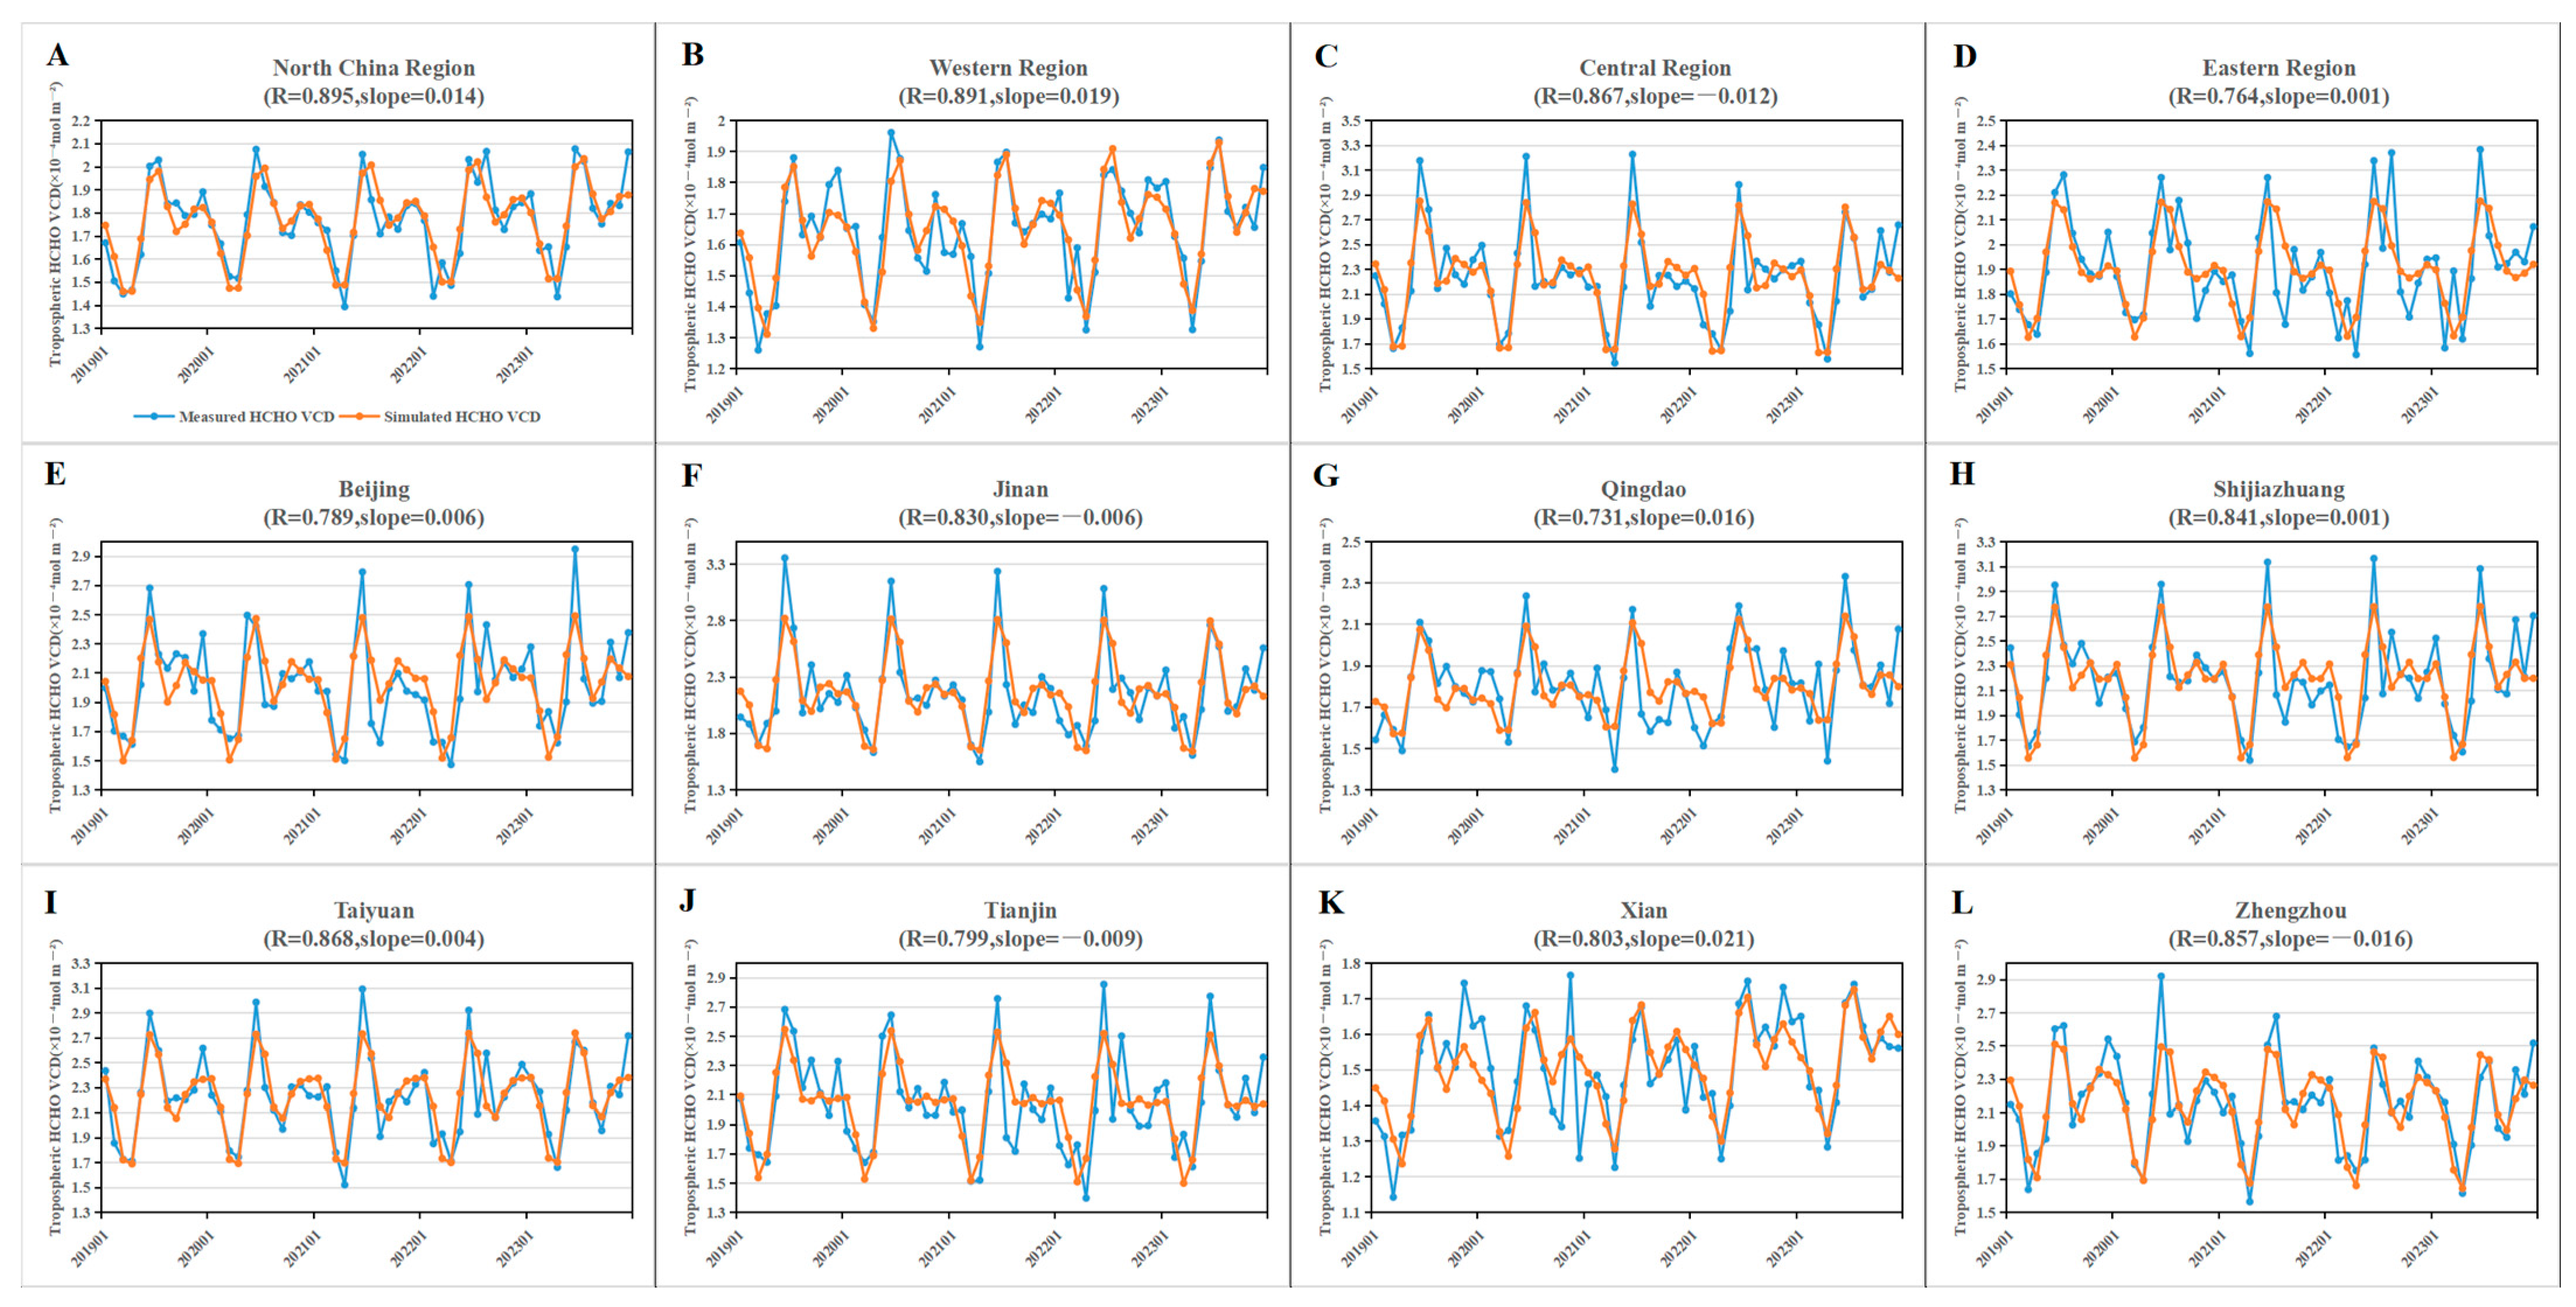
2.2. Modeling of Interannual Variability

In this study, a model was constructed to simulate the annual growth rate of tropospheric HCHO column concentration in North China:
Y = A n / 12   +   B + i = 1 3 a i sin 2 π i n 12 + i = 1 3 b i cos 2 π i n 12
where Y is the monthly mean of tropospheric HCHO concentration, n denotes the number of months from 2019 to 2023, A n / 12   +   B indicates a linear trend in tropospheric HCHO column concentration, A is the annual growth rate of HCHO, B represents the intercept, i = 1 3 a i sin 2 π i n 12 + i = 1 3 b i cos 2 π i n 12 indicates the trend in the seasonal cycle of monthly average HCHO column concentrations, and a i and b i are the coefficients of variation of the seasonal cycle.
In addition, to measure the merit of the model, the following two equations were used in this study to calculate the correlation coefficients, R (2) and RMSE (3), between the measured HCHO column concentration and the simulated HCHO column concentration:
R = n = 1 N V m e a , n V m e a ¯ V s i m , n V s i m ¯ n = 1 N V m e a , n V m e a ¯ 2 n = 1 N V s i m , n V s i m ¯ 2
R M S E = n = 1 N V s i m , n V m e a , n 2 N
where Vmea denotes the measured HCHO column concentration, Vsim denotes the simulated HCHO column concentration, and N is the total number of months from 2019 to 2023.

2.3. Calculation of Correlation Between Each Influencing Factor and HCHO Column Concentration

In this study, a spatially gridded analysis method was used to carry out a spatial correlation study on a month-by-month scale throughout 2019–2023 by integrating the ERA5 data and HCHO column concentration data were unified to a 0.01° × 0.01° spatial grid by bilinear interpolation, which was based on the monthly mean surface temperature, monthly cumulative precipitation, and monthly mean wind speed data from the ERA5 and the monthly mean products of HCHO column concentration from the TROPOMI satellite inversion. The grid-point-by-grid-point Pearson correlation coefficient method was used for correlation calculation:
r i , j = t = 1 n ( T i , j , t T i , j ¯ ) ( H i , j , t H i , j ¯ ) t = 1 n ( T i , j , t T i , j ¯ ) 2 t = 1 n ( H i , j , t H i , j ¯ ) 2
where Ti,j,t and Hi,j,t denote the ERA5 data with HCHO column concentration at month t of the grid point (i,j), respectively, and the variable with a horizontal line above it denotes the mean value of the variable, n = 60 months.

3. Results and Discussion

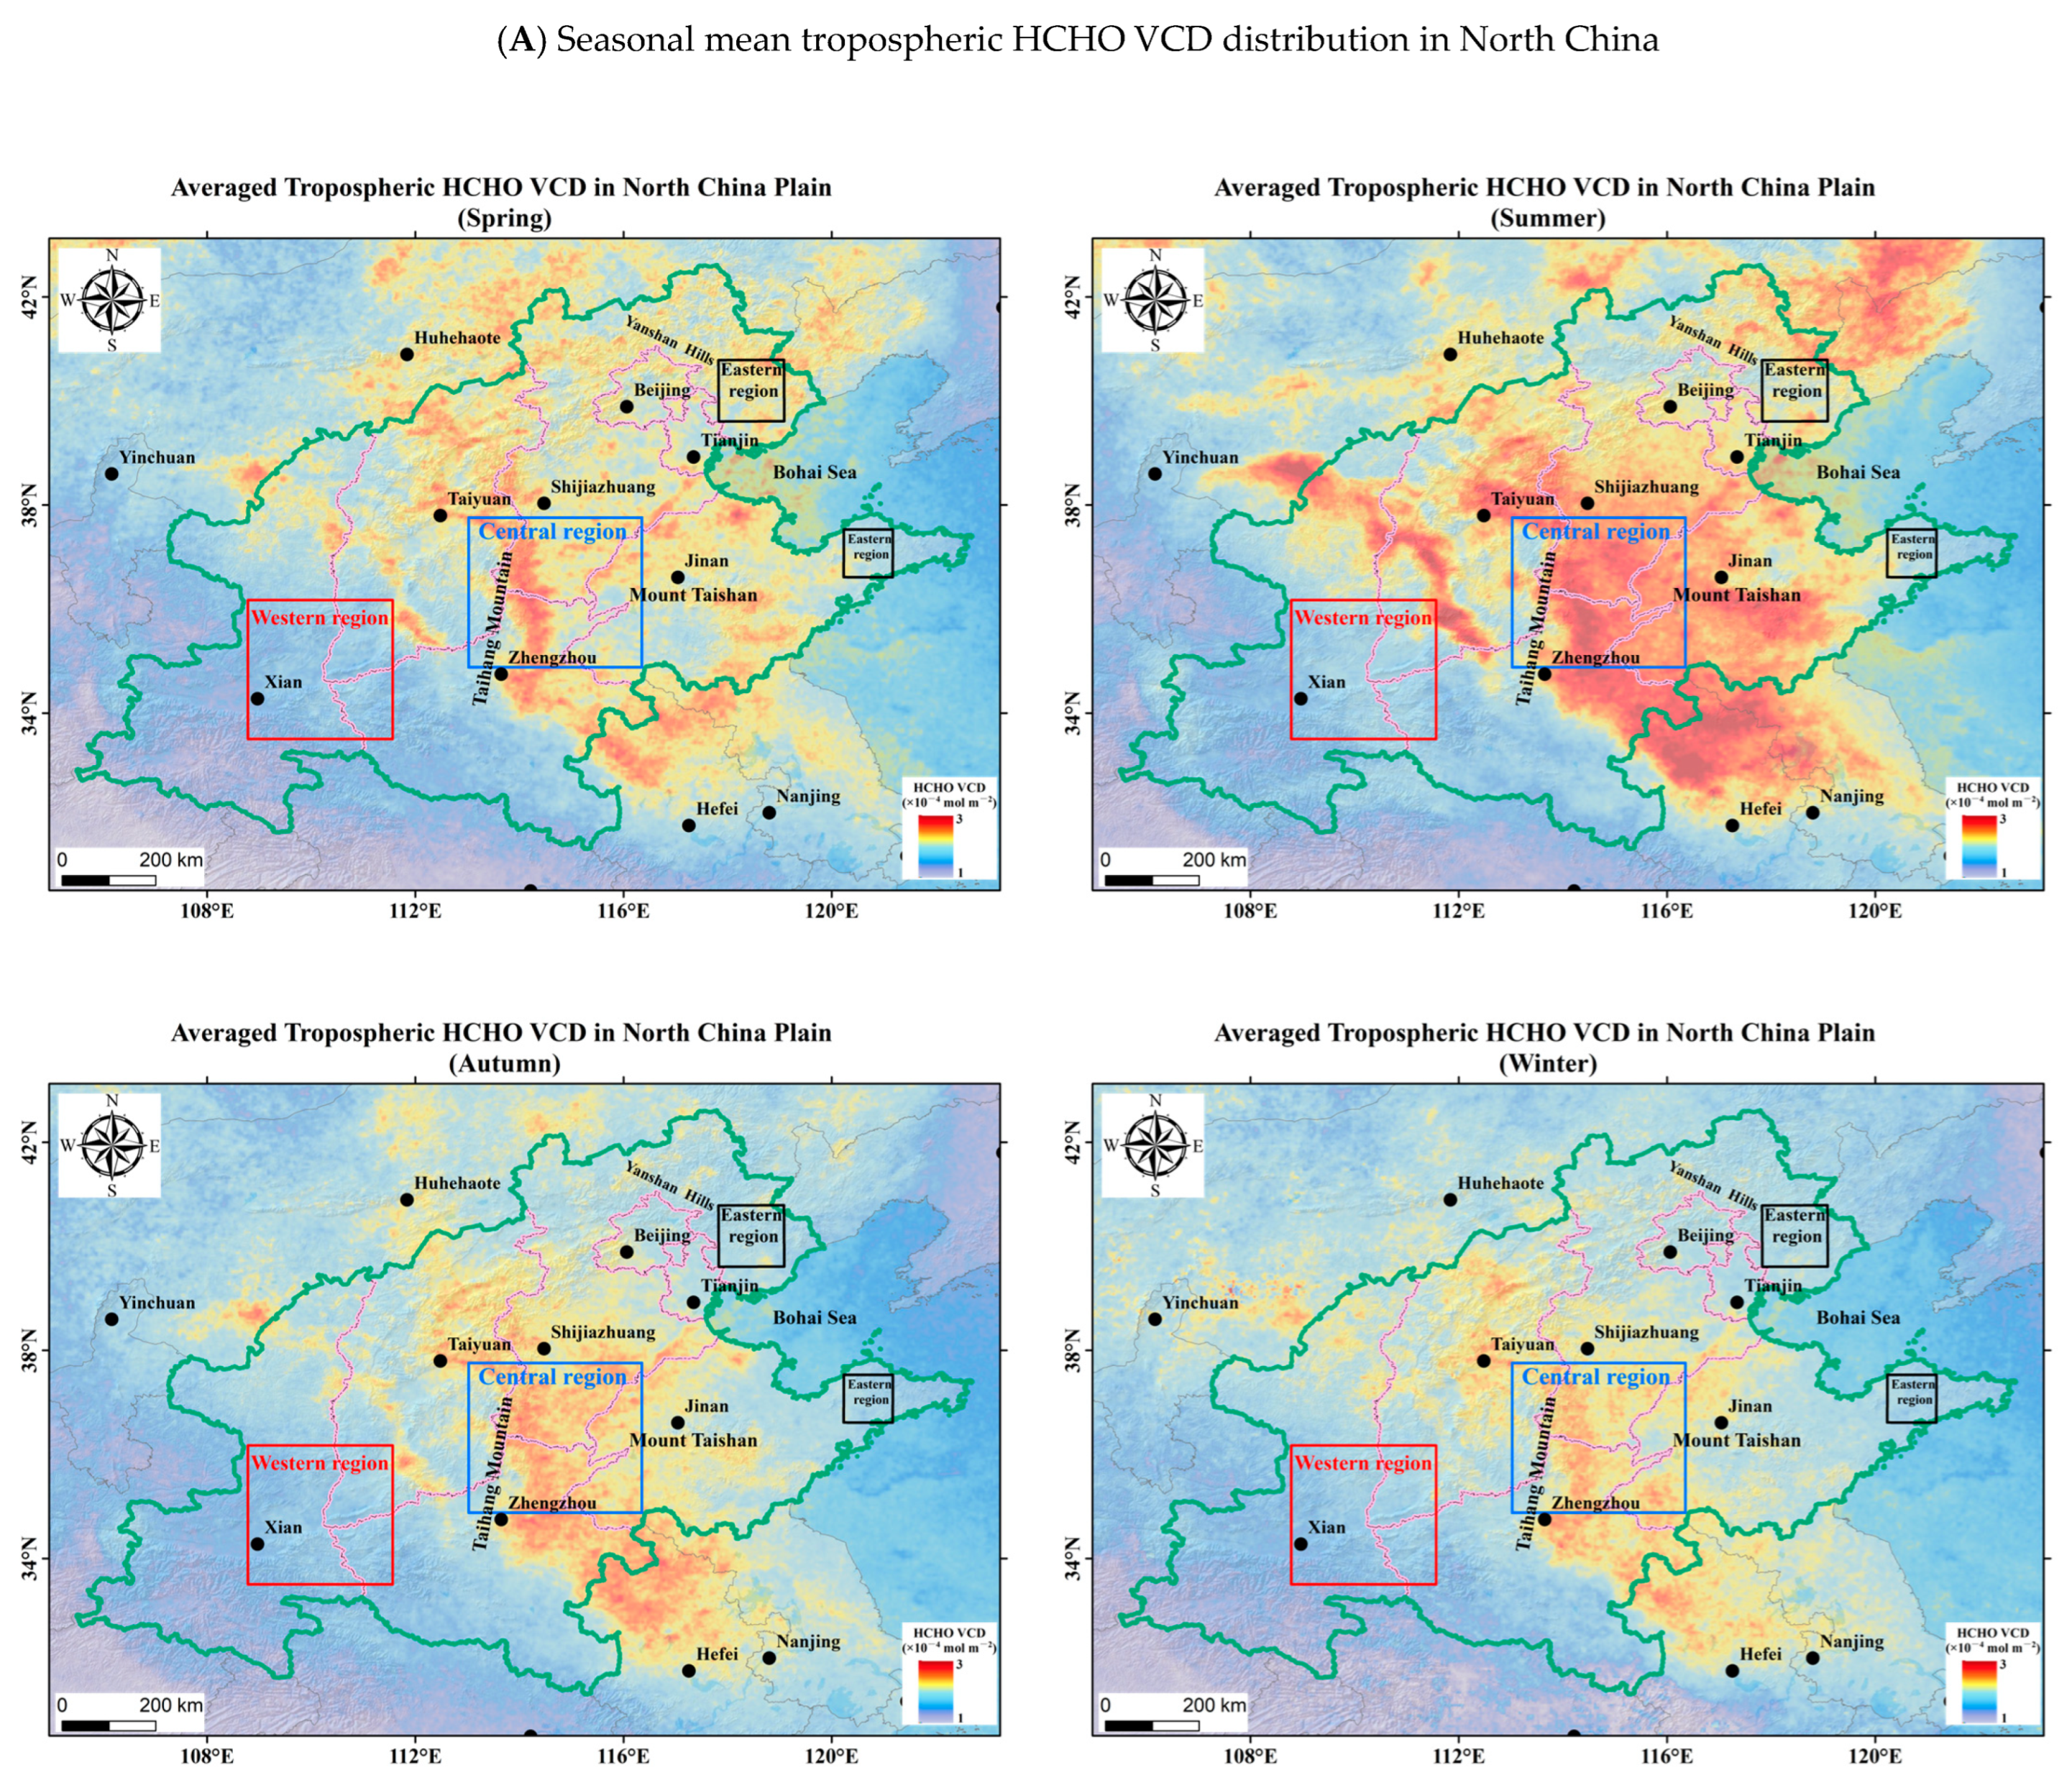
3.1. Spatial and Temporal Distribution Characteristics of Formaldehyde in North China

The tropospheric column concentrations of HCHO in North China for the last five years from 2019 to 2023 were observed based on the Sentinel-5P satellite TROPOMI sensor. As shown in Figure 2, from 2019 to 2023, the tropospheric HCHO column concentration in North China was 1.76 × 10⁻⁴ mol m−2 in the last five years, which was significantly higher than that in the neighboring provinces, such as Henan, Anhui, Gansu, and Inner Mongolia. In an overall consideration of geographic location, the economic development level and population, three typical regions are listed: the western region, the central region, and the eastern region (as shown in Figure 1). Significant differences in the distribution of HCHO column concentrations were observed among the three regions. The western region is located along the Loess Plateau and Qinling Mountains, sparsely populated, industrially underdeveloped, and economically underdeveloped, and has the lowest tropospheric column concentration of HCHO, with a 5-year average of 1.65 × 10⁻⁴ mol m−2. The central region and the eastern region is dominated by the Taihang Mountains, the North China Plain, and mountainous hills, with the most concentrated populations and relatively high tropospheric column concentrations of HCHO, which are, respectively, 2.23 × 10⁻⁴ mol m−2, and 1.90 × 10⁻⁴ mol m−2.
From 2019 to 2023, the spatial distribution of HCHO tropospheric column concentrations in and around North China remains largely unchanged, with the central region consistently maintaining the highest HCHO tropospheric column concentrations (Figure 3). The tropospheric HCHO column concentration in North China showed an overall increasing trend; however, that in the central and eastern regions of North China presented a decreasing and then increasing trend over the past 5 years, while that in the western region increased steadily. To investigate the monthly and interannual variation characteristics in North China, this study calculated the monthly average of tropospheric HCHO column concentrations in North China from 2019 to 2023 (Figure 4A). Statistically, the percentage of valid data in each month was above 70%, which was sufficient to ensure the accuracy of the time series of tropospheric HCHO column concentration. The HCHO tropospheric column concentrations in North China showed significant and regular monthly variations, with a maximum in June–August and a minimum in February–April, and the peak patterns were slightly different from the general variations in a previous study [18]. To quantify the interannual variability of tropospheric HCHO column concentrations, we fit monthly mean HCHO data using linear equations with seasonally varying sine and cosine functions (Equation (1)). The fitting parameter A of the modeling function showed the slope and was used to estimate the growth rate of the HCHO tropospheric column concentration. As shown in Figure 4A, the model captured the monthly averaged trend of tropospheric HCHO column concentration in North China. The modeled tropospheric HCHO column concentrations and the monitored HCHO data were strongly correlated with a correlation coefficient R of 0.895 and RMSE of 0.079 (Table 1). The fitting results showed that the HCHO tropospheric column concentration in North China presented a significant positive trend, with a growth rate of 1.37 × 10⁻⁶ mol m−2 yr−1, or about 3.70% yr−1, from 2019 to 2023, which was much higher than the growth rate of HCHO in North China from 2005 to 1.80% yr−1 in 2016 [15]. The anomalous increase in the tropospheric column concentration of HCHO in North China was unexpected because most regions of the world were broadly on a downward trend in the tropospheric HCHO column concentration.
Similarly, the same methodology was used to investigate the variation characteristics of HCHO tropospheric column concentrations in the western region, central region and eastern region over the last 5 years. As shown in Figure 4B–D, the tropospheric column concentrations of HCHO in both the central and eastern regions follow a similar monthly variation pattern, reaching a maximum in June–July and a minimum in March–April. In contrast, a bimodal distribution was observed in the western region, with the first peak occurring in June–July, the second peak in November–December, and the minimum in March–April, which was consistent with the trend in North China. The simulated HCHO tropospheric column concentrations were closely correlated with satellite monitoring data, with correlation coefficient R-values of 0.90, 0.89, 0.87, and 0.76 for North China, the western region, the central region, and the eastern region, respectively. The fitting results showed that the tropospheric HCHO column concentrations in the western region of North China showed an increasing trend from 2019 to 2023, with an annual growth rate of 1.93 × 10⁻⁶ mol m−2 yr−1, while the central region showed a clear decreasing trend with an annual growth rate of −1.22 × 10⁻⁶ mol m−2 yr−1, and the eastern region showed little change with a 5-year annual growth rate of only 0.15 × 10⁻⁶ mol m−2 yr−1, as shown in Figure 3. However, as shown in Figure 2, the annual mean HCHO tropospheric column concentration from 2019 to 2023 was highest in the central region at 2.23 × 10⁻⁶ mol m−2 yr−1, followed by 1.90 × 10⁻⁶ mol m−2 yr−1 in the eastern region, and the lowest was 1.65 × 10⁻⁶ mol m−2 yr−1 in the western region.
In addition, the 5-year time evolution characteristics of the tropospheric HCHO column concentrations in eight typical cities in North China, including Beijing, Jinan, Qingdao, Shijiazhuang, Taiyuan, Tianjin, Xi’an, and Zhengzhou, were also studied (Figure 4E–L). The HCHO column concentration of the city was the tropospheric HCHO column concentration within the latitude and longitude ±0.5° of the city center range. Xi’an, located in the western region, has the largest annual growth rate of 2.13 × 10⁻⁶ mol m−2 yr−1 but the lowest 5-year mean tropospheric HCHO VCD of 1.51 × 10⁻⁴ mol m−2. The highest 5-year mean tropospheric HCHO VCD was observed in Taiyuan and Shijiazhuang, with values of 2.22 × 10⁻⁴ mol m−2 and 2.19 × 10⁻⁴ mol m−2, respectively. However, their annual growth rates were the lowest, with values of 0.35 × 10⁻⁶ mol m−2 yr−1 and 0.14 × 10⁻⁶ mol m−2 yr−1, respectively. The 5-year mean tropospheric HCHO VCD of Jinan, Tianjin, and Zhengzhou were higher than that of North China (1.76 × 10⁻⁴ mol m−2), which were 2.15 × 10⁻⁴ mol m−2, 2.04 × 10⁻⁴ mol m−2, and 2.15 × 10⁻⁴ mol m−2, respectively, with annual growth rates of −0.55 × 10⁻⁶ mol m−2 yr−1, −0.94 × 10⁻⁶ mol m−2 yr−1, and −1.59 × 10⁻⁶ mol m−2 yr−1, respectively. The tropospheric HCHO VCD in Beijing increased slowly from 2019 to 2023, with an annual growth rate of 0.61 × 10⁻⁶ mol m−2 yr−1 and a mean tropospheric HCHO VCD of 2.02 × 10⁻⁴ mol m−2. We list the 5-year mean tropospheric HCHO VCD in North China, the annual growth rate, the correlation coefficient R and the RMSE of the simulated and measured values in Table 2.
Previous studies have shown that HCHO VCD generally has significant seasonal characteristics [11,18,45,46,47,48]. The distribution and boxplots of the 5-year tropospheric HCHO VCD seasonal averages in North China from 2019 to 2023 are shown in Figure 5A and 5B, respectively. As shown in Figure 5, the tropospheric HCHO VCD showed similar seasonal variation characteristics in different regions of North China, all of which reached a maximum in summer and a minimum in spring and remained basically flat in fall and winter. Similarly, the typical urban areas also maintained similar seasonal variation characteristics, i.e., the maximum value was observed in summer, the minimum value was observed in spring, and the values of the tropospheric HCHO VCD values in autumn and winter varied between that in spring and summer.

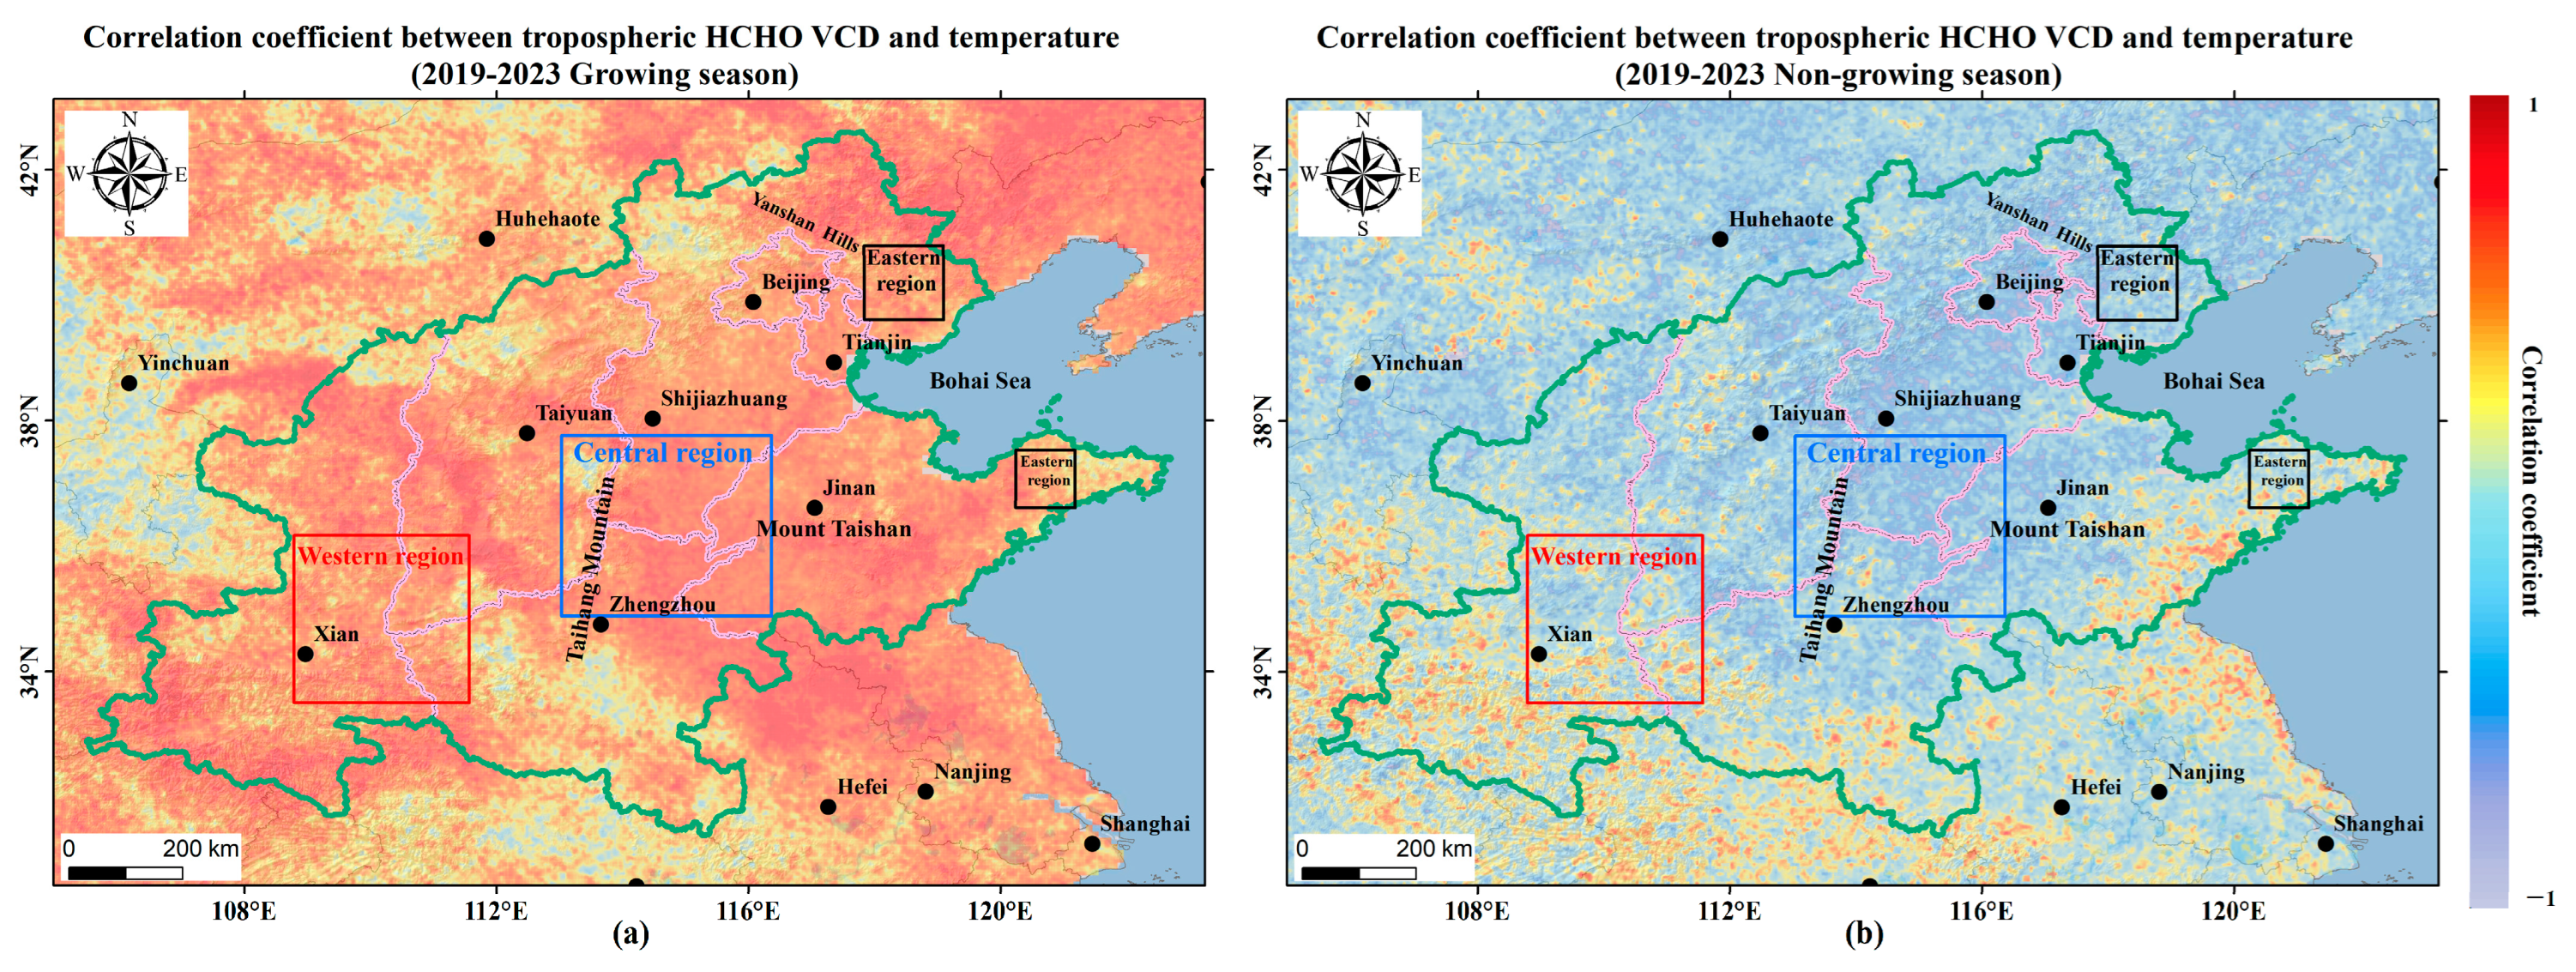
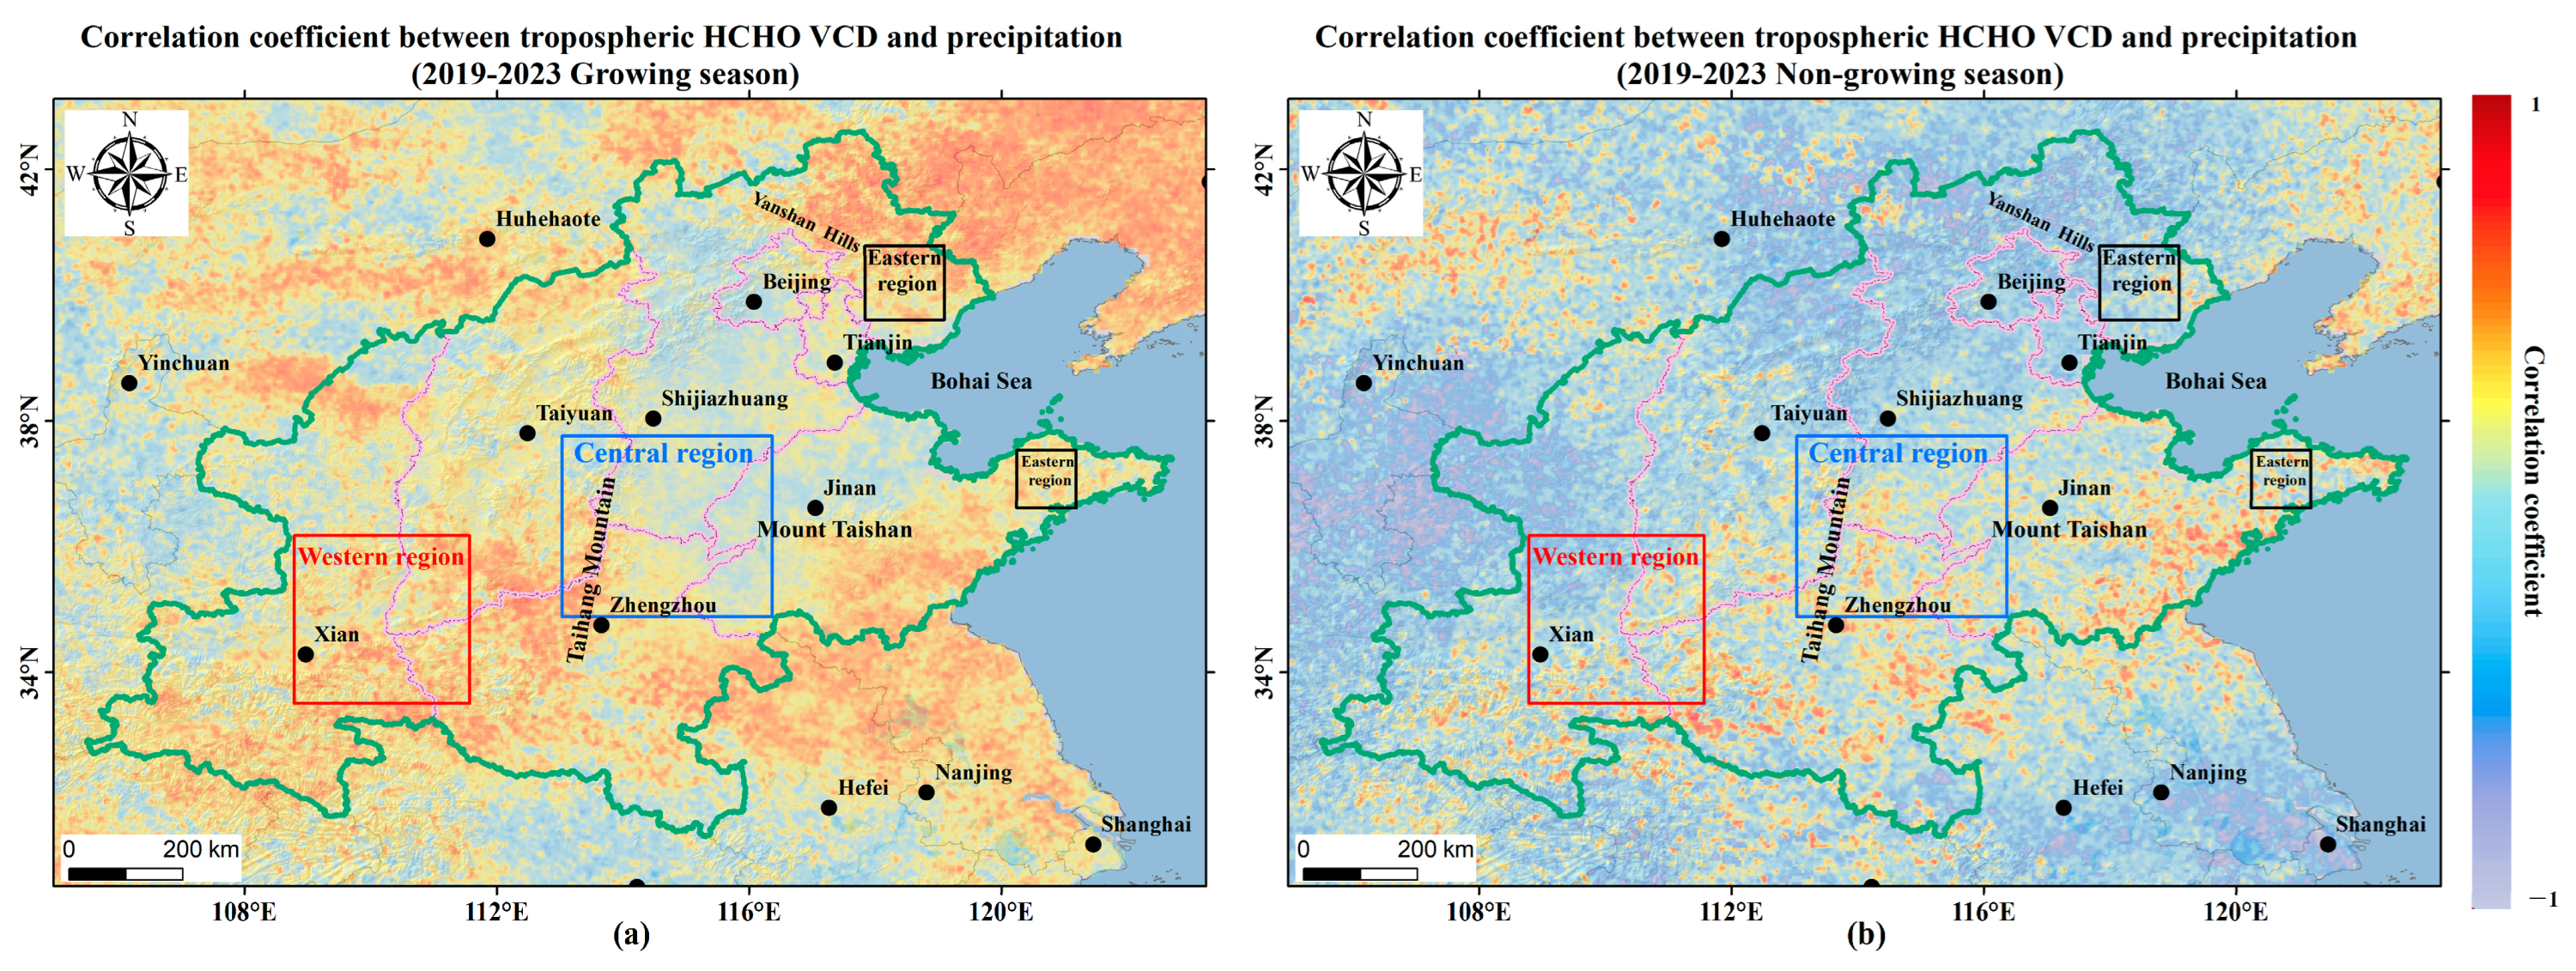
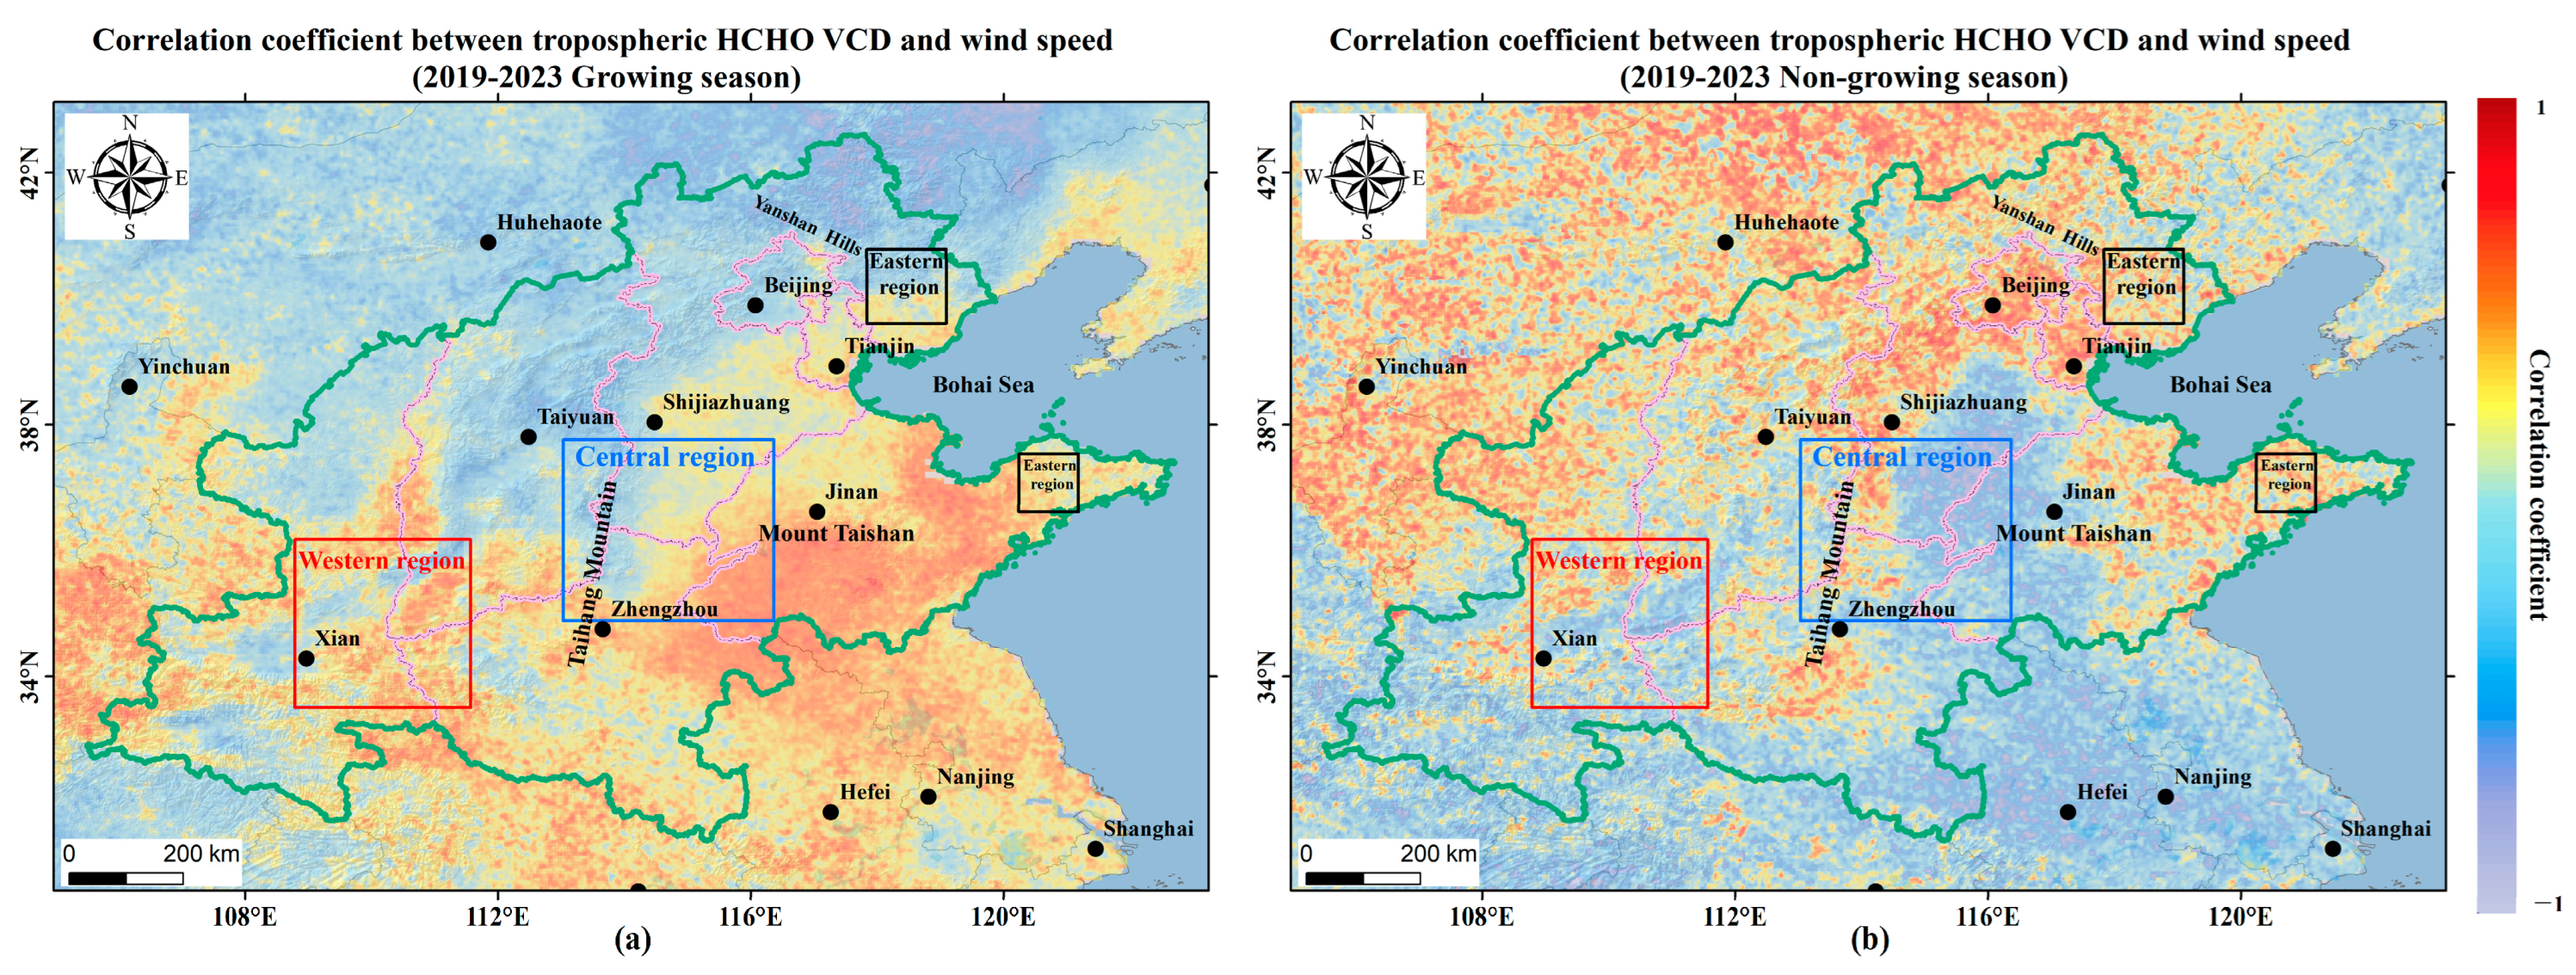
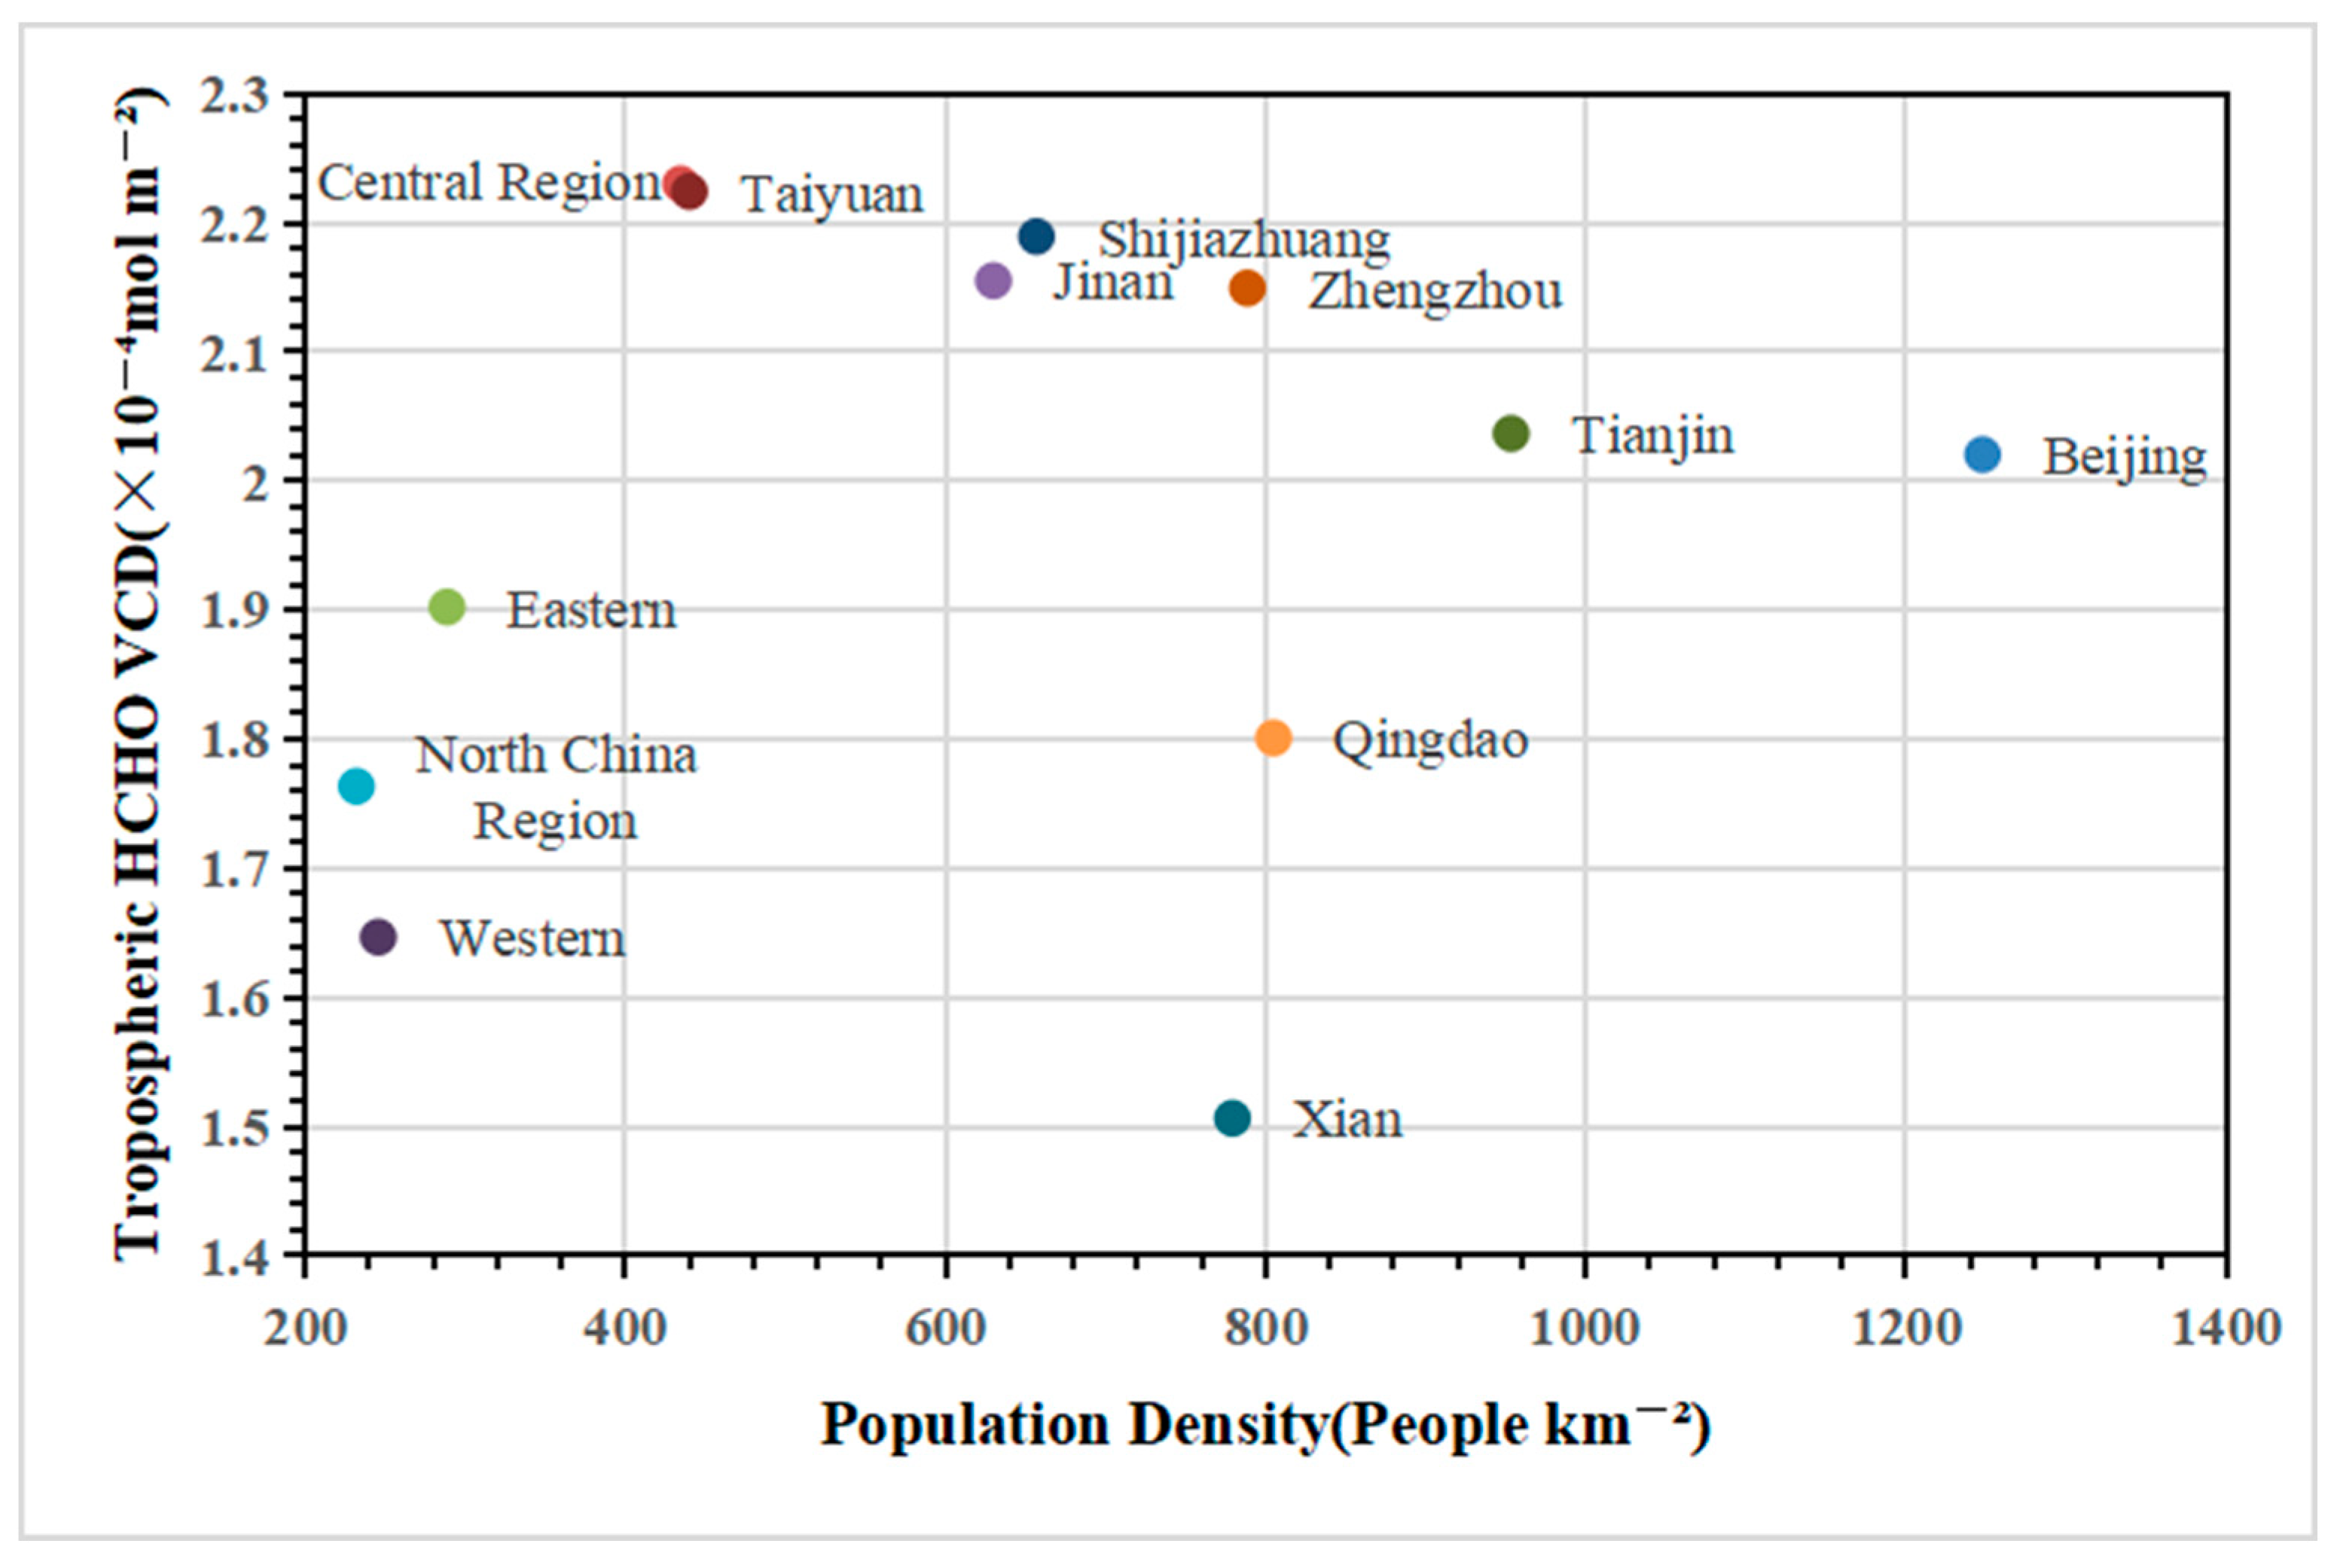
3.2. Factors Affecting Tropospheric HCHO Column Concentrations in North China

Many factors can affect the concentration of HCHO in the atmosphere [46,49,50,51]. Based on previous studies, the influencing factors that may affect HCHO VCD in North China were selected for this study.
Firstly, the effects of temperature on HCHO concentrations were explored. Monthly surface temperature data from ERA5 were selected for correlation analysis with monthly mean tropospheric HCHO VCD data from 2019 to 2023, and this operation was performed on a grid per 0.01° × 0.01°. We divided the study period into the growing season (March–November) and non-growing season (December–February) and generated spatial distribution maps of the correlation coefficients between temperature and HCHO VCD in Figure 6a (the growing season) and Figure 6b (the non-growing season), respectively. The results (Table 2) showed that in the growing season, temperature and HCHO VCD were positively correlated, and the correlation coefficient R was high, with a mean value of 0.50, with the highest value of 0.63 in Jinan, followed by 0.61 in Shijiazhuang and 0.59 and 0.58 in Tianjin and Taiyuan, respectively, while in the non-growing season, they were negatively correlated to varying degrees, with a mean value of −0.1, with the R-value in Beijing and Shijiazhuang reaching −0.41. This might be attributed to the fact that high temperatures in the growing seasons favored the oxidation of VOCs [37], which increased the atmospheric concentration of HCHO. For the non-growing season, central heating in North China consumed a large amount of fossil fuels such as coal and could lead to the emission of VOCs such as HCHO.
Secondly, the effects of precipitation on HCHO concentration were analyzed. The spatial distribution of correlation coefficients between HCHO concentration and precipitation in North China from 2019 to 2023 is shown in Figure 7a (the growing season) and 7b (the non-growing season). Overall, the R-values were low, all less than 0.4 (Table 2). Moderate precipitation favored the release of the VOCs produced through promoting vegetation growth, which could not be easily purified by water. Therefore, these VOCs might be converted into HCHO [52]. At the same time, precipitation has an obvious scavenging effect on atmospheric HCHO, and the atmospheric HCHO content after precipitation is generally lower than that before precipitation. However, precipitation increases air humidity and promotes the hydrolysis of HCHO polymers over time, which leads to an increase in the concentration of HCHO columns [37].
Next, we explored the effects of wind on HCHO concentration, and the results are shown in Figure 8. The correlation coefficients between HCHO concentration and wind speed in North China from 2019 to 2023 were extremely low (Table 2), with R-values of 0.07 and 0.04 for the growing and non-growing seasons, respectively. This indicated that the overall correlation between HCHO concentration and wind was weak in North China. However, Qingdao and Tianjin, which are located in the coastal area, had relatively high R-values. This is consistent with the fact that the coastal area is mainly affected by sea–land breeze, which transports wet sea vapors to the land and has a certain dilution effect on HCHO [37]. The wind may directly affect the direction of HCHO diffusion. As shown in Figure 8, the R-value was higher in the southern part of North China during the growing season, whereas during the non-growing season, the R-value was higher in the northern part, which might be related to the difference in wind direction in different seasons.
The correlation between HCHO column concentration and net surface solar radiation in North China from 2019 to 2023 is shown in Figure 9. During the growing season, HCHO column concentration was weakly and positively correlated with net surface solar radiation (Table 2). In contrast, during the non-growing season, HCHO column concentration was negatively correlated with net surface solar radiation, with overall higher R-values in most areas (Table 2).
Another important driving factor is the NDVI, and the spatial distribution of correlation coefficients between HCHO column concentrations and the NDVI are shown in Figure 10 and Table 2. During the growing season, the HCHO column concentrations in the western region and eastern region were positively correlated with the NDVI and this correlation was high, whereas the correlation with the NDVI in the central region was low, presumably related to the existence of other more influential factors such as the concentration of heavy industries such as copper-processing plants, mining plants, and steel plants in this region. The correlation coefficients between HCHO column concentrations and the NDVI were similar and lower in most areas during the non-growing season.
Finally, we calculated the mean population density within the same urban +0.5° grid as above based on the LandScan population dataset and plotted it against the mean tropospheric HCHO VCD for 2019–2023 (Figure 11). The results showed that overall the population density and the mean tropospheric HCHO column concentration were positively proportional in North China. For example, the highest population density (434.43 persons km−2) and the highest mean tropospheric HCHO column concentration (2.23 × 10⁻⁴ mol m−2) were observed in the central region, followed by the eastern region with a population density of 288.54 persons km−2 and a mean tropospheric HCHO column concentration of 1.90 × 10⁻⁴ mol m−2 (Figure 11). The lowest population density (245.56 people km−2) and the lowest mean tropospheric HCHO column concentration (1.65 × 10⁻⁴ mol m−2) were observed in the western region. However, the above pattern was not applicable to the typical cities specifically, and population density was not the main factor affecting these cities (Figure 11).
Table 3 shows the correlation analysis between the relevant driving factors and HCHO VCD in North China. Six indicators are counted in the table, and among them, the correlation coefficient between 5-year HCHO VCD and population density in North China was the highest, which reached 0.70, showing a significant positive correlation. This indicated that HCHO VCD was greatly influenced by human activities, followed by the NDVI. The correlations between other factors and HCHO VCD were relatively weak.

4. Conclusions

In this study, the temporal and spatial trends of tropospheric HCHO VCD in North China from 2019 to 2023 were investigated based on the HCHO dataset from the TROPOMI sensor of the Sentinel-5 satellite. The annual mean value of tropospheric HCHO VCD in North China showed an overall increasing trend, with that in the central and eastern regions showing a downward and then upward trend and that in the western region showing a steady upward trend. The tropospheric HCHO VCD in North China showed a spatial distribution trend of being lowest in the western and highest in the center region. The seasonal variation in HCHO VCD in North China is obvious, with the highest annual mean value of HCHO VCD observed in summer, and the lowest one was observed in spring. During the growing season, temperature was positively correlated to HCHO VCD because high temperatures were favorable for VOCs to undergo oxidation and increase HCHO VCD, while during the non-growing season, temperature was negatively correlated to the change in HCHO VCD. The correlation coefficients of precipitation, wind, and net surface solar radiation with HCHO VCD were lower than those of temperature, whereas the NDVI was positively correlated with HCHO VCD and this correlation was high during the growing season. Human activities also have some influence on HCHO VCD, and the population density in North China was proportional to the mean tropospheric HCHO column concentration. Our study helps to understand the spatiotemporal patterns in tropospheric HCHO VCD and the main drivers of HCHO VCD, which can provide an important reference for developing air pollution control measures in North China.

Author Contributions

Conceptualization, L.L. and X.M.; methodology, L.L. and X.M.; software, L.L. and X.M.; validation, L.L. and X.M.; formal analysis, L.L. and X.M.; investigation, L.L. and X.M.; resources, L.L. and X.M.; data curation, L.L. and X.M.; writing—original draft preparation, L.L. and X.M.; writing—review and editing, L.L., X.M. and D.C.; visualization, L.L. and X.M.; supervision, D.C.; project administration, L.L. and X.M.; funding acquisition, L.L. and X.M. All authors have read and agreed to the published version of the manuscript.

Funding

This research was funded by the Shandong Agriculture and Engineering University Start-Up Fund for Talented Scholars, grant number 2024GCCZR, and commercial research funds, grant number 317200229.

Institutional Review Board Statement

Not applicable.

Informed Consent Statement

Not applicable.

Data Availability Statement

Data are contained within the article.

Conflicts of Interest

The authors declare no conflicts of interest.

References

  1. Zhang, X.; Sun, J.; Lin, W.; Xu, W.; Zhang, G.; Wu, Y.; Dai, X.; Zhao, J.; Yu, D.; Xu, X. Long-term variations in surface ozone at the Longfengshan Regional Atmosphere Background Station in Northeast China and related influencing factors. Environ. Pollut. 2024, 348, 123748. [Google Scholar] [CrossRef] [PubMed]
  2. Wang, T.; Xue, L.; Brimblecombe, P.; Lam, Y.F.; Li, L.; Zhang, L. Ozone pollution in China: A review of concentrations, meteorological influences, chemical precursors, and effects. Sci. Total Environ. 2017, 575, 1582–1596. [Google Scholar] [CrossRef] [PubMed]
  3. Feng, Z.; Hu, E.; Wang, X.; Jiang, L.; Liu, X. Ground-level O3 pollution and its impacts on food crops in China: A review. Environ. Pollut. 2015, 199, 42–48. [Google Scholar] [CrossRef]
  4. Li, T.; Yan, M.; Ma, W.; Ban, J.; Liu, T.; Lin, H.; Liu, Z. Short-term effects of multiple ozone metrics on daily mortality in a megacity of China. Environ. Sci. Pollut. Res. 2015, 22, 8738–8746. [Google Scholar] [CrossRef]
  5. Brauer, M.; Freedman, G.; Frostad, J.; Van Donkelaar, A.; Martin, R.V.; Dentener, F.; Dingenen, R.v.; Estep, K.; Amini, H.; Apte, J.S. Ambient air pollution exposure estimation for the global burden of disease 2013. Environ. Sci. Technol. 2016, 50, 79–88. [Google Scholar] [CrossRef]
  6. Yu, R.; Lin, Y.; Zou, J.; Dan, Y.; Cheng, C. Review on atmospheric ozone pollution in China: Formation, spatiotemporal distribution, precursors and affecting factors. Atmosphere 2021, 12, 1675. [Google Scholar] [CrossRef]
  7. Zhao, T.; Mao, J.; Simpson, W.R.; De Smedt, I.; Zhu, L.; Hanisco, T.F.; Wolfe, G.M.; St. Clair, J.M.; González Abad, G.; Nowlan, C.R.; et al. Source and variability of formaldehyde (HCHO) at northern high latitudes: An integrated satellite, aircraft, and model study. Atmos. Chem. Phys. 2022, 22, 7163–7178. [Google Scholar] [CrossRef]
  8. Hong, Q.; Liu, C.; Hu, Q.; Zhang, Y.; Xing, C.; Su, W.; Ji, X.; Xiao, S. Evaluating the feasibility of formaldehyde derived from hyperspectral remote sensing as a proxy for volatile organic compounds. Atmos. Res. 2021, 264, 105777. [Google Scholar] [CrossRef]
  9. Su, W.; Liu, C.; Chan, K.L.; Hu, Q.; Liu, H.; Ji, X.; Zhu, Y.; Liu, T.; Zhang, C.; Chen, Y.; et al. An improved TROPOMI tropospheric HCHO retrieval over China. Atmos. Meas. Tech. 2020, 13, 6271–6292. [Google Scholar] [CrossRef]
  10. Qin, D.; Guo, B.; Zhou, J.; Cheng, H.; Chen, X. Indoor air formaldehyde (HCHO) pollution of urban coach cabins. Sci. Rep. 2020, 10, 332. [Google Scholar] [CrossRef]
  11. Zhao, T.; Mao, J.; Ayazpour, Z.; González Abad, G.; Nowlan, C.R.; Zheng, Y. Interannual variability of summertime formaldehyde (HCHO) vertical column density and its main drivers at northern high latitudes. Atmos. Chem. Phys. 2024, 24, 6105–6121. [Google Scholar] [CrossRef]
  12. Javed, Z.; Liu, C.; Khokhar, M.F.; Tan, W.; Liu, H.; Xing, C.; Ji, X.; Tanvir, A.; Hong, Q.; Sandhu, O.; et al. Ground-Based MAX-DOAS Observations of CHOCHO and HCHO in Beijing and Baoding, China. Remote Sens. 2019, 11, 1524. [Google Scholar] [CrossRef]
  13. Surl, L.; Palmer, P.I.; González Abad, G. Which processes drive observed variations of HCHO columns over India? Atmos. Chem. Phys. 2018, 18, 4549–4566. [Google Scholar] [CrossRef]
  14. Sillman, S. The use of NOy, H2O2, and HNO3 as indicators for ozone-NOx-hydrocarbon sensitivity in urban locations. J. Geophys. Res. Atmos. 1995, 100, 14175–14188. [Google Scholar] [CrossRef]
  15. Shen, L.; Jacob, D.J.; Zhu, L.; Zhang, Q.; Zheng, B.; Sulprizio, M.P.; Li, K.; De Smedt, I.; González Abad, G.; Cao, H.; et al. The 2005–2016 Trends of Formaldehyde Columns Over China Observed by Satellites: Increasing Anthropogenic Emissions of Volatile Organic Compounds and Decreasing Agricultural Fire Emissions. Geophys. Res. Lett. 2019, 46, 4468–4475. [Google Scholar] [CrossRef]
  16. Su, W.; Hu, Q.; Chen, Y.; Lin, J.; Zhang, C.; Liu, C. Inferring global surface HCHO concentrations from multisource hyperspectral satellites and their application to HCHO-related global cancer burden estimation. Environ. Int. 2022, 170, 107600. [Google Scholar] [CrossRef]
  17. Bozem, H.; Pozzer, A.; Harder, H.; Martinez, M.; Williams, J.; Lelieveld, J.; Fischer, H. The influence of deep convection on HCHO and HO in the upper troposphere over Europe. Atmos. Chem. Phys. 2017, 17, 11835–11848. [Google Scholar] [CrossRef]
  18. Xu, Y.; Su, W.; Hu, Q.; Zhang, C.; Javed, Z.; Tian, Y.; Hou, H.; Liu, C. Unexpected HCHO transnational transport: Influence on the temporal and spatial distribution of HCHO in Tibet from 2013 to 2021 based on satellite. npj Clim. Atmos. Sci. 2024, 7, 102. [Google Scholar] [CrossRef]
  19. Vaughan, T.L.; Strader, C.; Davis, S.; Daling, J.R. Formaldehyde and cancers of the pharynx, sinus and nasal cavity: I. Occupational exposures. Int. J. Cancer 1986, 38, 677–683. [Google Scholar] [CrossRef]
  20. Hayes, R.B.; Blair, A.; Stewart, P.A.; Herrick, R.F.; Mahar, H. Mortality of U.S. Embalmers and funeral directors. Am. J. Ind. Med. 1990, 18, 641–652. [Google Scholar] [CrossRef]
  21. Hauptmann, M.; Lubin, J.H.; Stewart, P.A.; Hayes, R.B.; Blair, A. Mortality from Solid Cancers among Workers in Formaldehyde Industries. Am. J. Epidemiol. 2004, 159, 1117–1130. [Google Scholar] [CrossRef] [PubMed]
  22. Hauptmann, M.; Lubin, J.H.; Stewart, P.A.; Hayes, R.B.; Blair, A. Mortality From Lymphohematopoietic Malignancies Among Workers in Formaldehyde Industries. JNCI J. Natl. Cancer Inst. 2003, 95, 1615–1623. [Google Scholar] [CrossRef]
  23. ARC Working Group on the Evaluation of Carcinogenic Risks to Humans, International Agency for Research on Cancer. Formaldehyde, 2-Butoxyethanol and 1-tert-Butoxypropan-2-ol; WHO: Geneva, Switzerland, 2006; p. 478. [Google Scholar]
  24. Cheng, S.; Cheng, X.; Ma, J.; Xu, X.; Zhang, W.; Lv, J.; Bai, G.; Chen, B.; Ma, S.; Ziegler, S.; et al. Mobile MAX-DOAS observations of tropospheric NO2 and HCHO during summer over the Three Rivers’ Source region in China. Atmos. Chem. Phys. 2023, 23, 3655–3677. [Google Scholar] [CrossRef]
  25. Feng, S.; Jiang, F.; Qian, T.; Wang, N.; Jia, M.; Zheng, S.; Chen, J.; Ying, F.; Ju, W. Constraining non-methane VOC emissions with TROPOMI HCHO observations: Impact on summertime ozone simulation in August 2022 in China. Atmos. Chem. Phys. 2024, 24, 7481–7498. [Google Scholar] [CrossRef]
  26. Chang, L.-S.; Ahn, S.; Bae, M.-S.; Park, S.-M.; Gil, J.; Kim, K.-R.; Lee, G.; Lee, T.; Woo, J.-H.; Park, R.; et al. Role of factors controlling diurnal variation of cold-season formaldehyde during Satellite Integrated Joint Monitoring of Air Quality 2021 campaign. Sci. Total Environ. 2025, 960, 178283. [Google Scholar] [CrossRef] [PubMed]
  27. Kanaya, Y.; Pochanart, P.; Liu, Y.; Li, J.; Tanimoto, H.; Kato, S.; Suthawaree, J.; Inomata, S.; Taketani, F.; Okuzawa, K.; et al. Rates and regimes of photochemical ozone production over Central East China in June 2006: A box model analysis using comprehensive measurements of ozone precursors. Atmos. Chem. Phys. 2009, 9, 7711–7723. [Google Scholar] [CrossRef]
  28. Kar, J.; Fishman, J.; Creilson, J.K.; Richter, A.; Ziemke, J.; Chandra, S. Are there urban signatures in the tropospheric ozone column products derived from satellite measurements? Atmos. Chem. Phys. 2010, 10, 5213–5222. [Google Scholar] [CrossRef]
  29. Sharma, S.; Kumar, P.; Vaishnav, R.; Shukla, K.K.; Phanikumar, D.V. Analysis of total column ozone, water vapour and aerosol optical thickness over Ahmedabad, India. Meteorol. Appl. 2018, 25, 33–39. [Google Scholar] [CrossRef]
  30. Baruah, U.D.; Robeson, S.M.; Saikia, A.; Mili, N.; Sung, K.; Chand, P. Spatio-temporal characterization of tropospheric ozone and its precursor pollutants NO(2) and HCHO over South Asia. Sci. Total Environ. 2022, 809, 151135. [Google Scholar] [CrossRef]
  31. De Smedt, I.; Theys, N.; Yu, H.; Danckaert, T.; Lerot, C.; Compernolle, S.; Van Roozendael, M.; Richter, A.; Hilboll, A.; Peters, E.; et al. Algorithm theoretical baseline for formaldehyde retrievals from S5P TROPOMI and from the QA4ECV project. Atmos. Meas. Tech. 2018, 11, 2395–2426. [Google Scholar] [CrossRef]
  32. Ren, H.H.; Cheng, Y.; Wu, F.; Gu, Z.L.; Cao, J.J.; Huang, Y.; Xue, Y.G.; Cui, L.; Zhang, Y.W.; Chow, J.C.; et al. Spatiotemporal characteristics of ozone and the formation sensitivity over the Fenwei Plain. Sci. Total Environ. 2023, 881, 163369. [Google Scholar] [CrossRef] [PubMed]
  33. Oomen, G.M.; Müller, J.F.; Stavrakou, T.; De Smedt, I.; Blumenstock, T.; Kivi, R.; Makarova, M.; Palm, M.; Röhling, A.; Té, Y.; et al. Weekly-derived top-down VOC fluxes over Europe from TROPOMI HCHO data in 2018–2021. EGUsphere 2023, 2023, 1–40. [Google Scholar] [CrossRef]
  34. Goldberg, D.L.; Harkey, M.; de Foy, B.; Judd, L.; Johnson, J.; Yarwood, G.; Holloway, T. Evaluating NOx emissions and their effect on O3 production in Texas using TROPOMI NO2 and HCHO. Atmos. Chem. Phys. 2022, 22, 10875–10900. [Google Scholar] [CrossRef]
  35. De Smedt, I.; Pinardi, G.; Vigouroux, C.; Compernolle, S.; Bais, A.; Benavent, N.; Boersma, F.; Chan, K.L.; Donner, S.; Eichmann, K.U.; et al. Comparative assessment of TROPOMI and OMI formaldehyde observations and validation against MAX-DOAS network column measurements. Atmos. Chem. Phys. 2021, 21, 12561–12593. [Google Scholar] [CrossRef]
  36. Levelt, P.F.; Joiner, J.; Tamminen, J.; Veefkind, J.P.; Bhartia, P.K.; Stein Zweers, D.C.; Duncan, B.N.; Streets, D.G.; Eskes, H.; van der A, R.; et al. The Ozone Monitoring Instrument: Overview of 14 years in space. Atmos. Chem. Phys. 2018, 18, 5699–5745. [Google Scholar] [CrossRef]
  37. Huang, C.; Ju, T.; Li, B.; Wang, J.; Zhang, J.; Lei, S.; Li, C. Analysis on the Influencing Factors and Future Trend of HCHO Pollution in Brazil. Water Air Soil Pollut. 2023, 234, 518. [Google Scholar] [CrossRef]
  38. Ialongo, I.; Stepanova, N.; Hakkarainen, J.; Virta, H.; Gritsenko, D. Satellite-based estimates of nitrogen oxide and methane emissions from gas flaring and oil production activities in Sakha Republic, Russia. Atmos. Environ. X 2021, 11, 100114. [Google Scholar] [CrossRef]
  39. Dix, B.; Francoeur, C.; Li, M.; Serrano-Calvo, R.; Levelt, P.F.; Veefkind, J.P.; McDonald, B.C.; de Gouw, J. Quantifying NOx Emissions from U.S. Oil and Gas Production Regions Using TROPOMI NO2. ACS Earth Space Chem. 2022, 6, 403–414. [Google Scholar] [CrossRef]
  40. Yang, Y.; Zhao, C.; Wang, Y.; Zhao, X.; Sun, W.; Yang, J.; Ma, Z.; Fan, H. Multi-Source Data Based Investigation of Aerosol-Cloud Interaction Over the North China Plain and North of the Yangtze Plain. J. Geophys. Res. Atmos. 2021, 126, e2021JD035609. [Google Scholar] [CrossRef]
  41. Yin, Z.; Wang, H. Seasonal prediction of winter haze days in the north central North China Plain. Atmos. Chem. Phys. 2016, 16, 14843–14852. [Google Scholar] [CrossRef]
  42. Xin, Y.; Tao, F. Developing climate-smart agricultural systems in the North China Plain. Agric. Ecosyst. Environ. 2020, 291, 106791. [Google Scholar] [CrossRef]
  43. Wang, Y.; Dörner, S.; Donner, S.; Böhnke, S.; De Smedt, I.; Dickerson, R.R.; Dong, Z.; He, H.; Li, Z.; Li, Z.; et al. Vertical profiles of NO2, SO2, HONO, HCHO, CHOCHO and aerosols derived from MAX-DOAS measurements at a rural site in the central western North China Plain and their relation to emission sources and effects of regional transport. Atmos. Chem. Phys. 2019, 19, 5417–5449. [Google Scholar] [CrossRef]
  44. Körner, C.; Möhl, P.; Hiltbrunner, E. Four ways to define the growing season. Ecol. Lett. 2023, 26, 1277–1292. [Google Scholar] [CrossRef]
  45. Bauwens, M.; Stavrakou, T.; Müller, J.-F.; De Smedt, I.; Van Roozendael, M.; Van Der Werf, G.R.; Wiedinmyer, C.; Kaiser, J.W.; Sindelarova, K.; Guenther, A. Nine years of global hydrocarbon emissions based on source inversion of OMI formaldehyde observations. Atmos. Chem. Phys. Discuss. 2016, 2016, 1–45. [Google Scholar] [CrossRef]
  46. Fan, J.; Ju, T.; Wang, Q.; Gao, H.; Huang, R.; Duan, J. Spatiotemporal variations and potential sources of tropospheric formaldehyde over eastern China based on OMI satellite data. Atmos. Pollut. Res. 2021, 12, 272–285. [Google Scholar] [CrossRef]
  47. Bhatt, U.S.; Walker, D.A.; Raynolds, M.K.; Bieniek, P.A.; Epstein, H.E.; Comiso, J.C.; Pinzon, J.E.; Tucker, C.J.; Steele, M.; Ermold, W. Changing seasonality of panarctic tundra vegetation in relationship to climatic variables. Environ. Res. Lett. 2017, 12, 055003. [Google Scholar] [CrossRef]
  48. Wasti, S.; Wang, Y. Spatial and temporal analysis of HCHO response to drought in South Korea. Sci. Total Environ. 2022, 852, 158451. [Google Scholar] [CrossRef] [PubMed]
  49. Zhang, Y.; Li, R.; Min, Q.; Bo, H.; Fu, Y.; Wang, Y.; Gao, Z. The Controlling Factors of Atmospheric Formaldehyde (HCHO) in Amazon as Seen From Satellite. Earth Space Sci. 2019, 6, 959–971. [Google Scholar] [CrossRef]
  50. Zhu, S.; Li, X.; Yu, C.; Wang, H.; Wang, Y.; Miao, J. Spatiotemporal Variations in Satellite-Based Formaldehyde (HCHO) in the Beijing-Tianjin-Hebei Region in China from 2005 to 2015. Atmosphere 2018, 9, 5. [Google Scholar] [CrossRef]
  51. Lui, K.H.; Ho, S.S.H.; Louie, P.K.K.; Chan, C.S.; Lee, S.C.; Hu, D.; Chan, P.W.; Lee, J.C.W.; Ho, K.F. Seasonal behavior of carbonyls and source characterization of formaldehyde (HCHO) in ambient air. Atmos. Environ. 2017, 152, 51–60. [Google Scholar] [CrossRef]
  52. Atkinson, R. Atmospheric chemistry of VOCs and NOx. Atmos. Environ. 2000, 34, 2063–2101. [Google Scholar] [CrossRef]
Figure 1. Elevation distribution of North China (3D view). The North China region framed by the thick green line represents North China. Three typical regions are delimited based on geographic location, the economic development level, and population, i.e., the western region (red rectangle), the central region (blue rectangle), and the eastern region (black rectangle).
Sustainability 17 04386 g001
Figure 2. Spatial distribution of 5-year mean column concentrations of HCHO in the troposphere in North China, 2019–2023.
Sustainability 17 04386 g002
Figure 3. Annual average spatial distribution of HCHO tropospheric column concentrations in North China, 2019–2023.
Sustainability 17 04386 g003
Figure 4. Time series of monthly mean tropospheric column concentrations of HCHO in total (A), western (B), central (C), and eastern (D) region, and eight typical cities, i.e., Beijing (E), Jinan (F), Qingdao (G), Shijiazhuang (H), Taiyuan (I), Tianjin (J), Xian (K), Zhengzhou (L) of North China, 2019–2023.
Sustainability 17 04386 g004
Figure 5. Seasonal mean of tropospheric HCHO VCD in North China.
Sustainability 17 04386 g005aSustainability 17 04386 g005b
Figure 6. Spatial distribution of tropospheric HCHO VCD and temperature dependence in North China during growing season (a) and non-growing season (b), 2019–2023.
Sustainability 17 04386 g006
Figure 7. Relationship between spatial distribution of tropospheric HCHO VCD with precipitation during growing season (a) and non-growing season (b) in North China, 2019–2023.
Sustainability 17 04386 g007
Figure 8. Relationship between spatial distribution of tropospheric HCHO VCD with wind speed during growing season (a) and non-growing season (b) in North China, 2019–2023.
Sustainability 17 04386 g008
Figure 9. The relationship between the spatial distribution of tropospheric HCHO VCD with net surface solar radiation during the growing season (a) and the non-growing season (b) in North China, 2019–2023.
Sustainability 17 04386 g009
Figure 10. Relationship between spatial distribution of tropospheric HCHO VCD with NDVI during growing season (a) and non-growing season (b) in North China, 2019–2023.
Sustainability 17 04386 g010
Figure 11. Relationship between population density and mean tropospheric HCHO column concentration in major regions and cities in North China, 2019–2023.
Sustainability 17 04386 g011
Table 1. Mean tropospheric HCHO column concentrations, annual growth rates, and direct correlation coefficients (R) between measured and modeled HCHO data for eight typical cities in North China and its three regions, 2019–2023.
Region and City NameMean Tropospheric HCHO VCD (10−4 mol m−2)Annual Growth Rate of Tropospheric HCHO VCD (10−6 mol m−2 yr−1)RRMSE (10−4 mol m−2)
North China Region1.76 1.37 0.90 0.08
Western Region1.65 1.93 0.89 0.08
Central Region2.23 −1.22 0.87 0.18
Eastern Region1.90 0.15 0.76 0.13
Beijing2.02 0.61 0.79 0.20
Jinan2.15 −0.55 0.83 0.21
Qingdao1.80 1.63 0.73 0.13
Shijiazhuang2.19 0.14 0.84 0.20
Taiyuan2.22 0.35 0.87 0.17
Tianjin2.04 −0.94 0.80 0.20
Xian1.51 2.13 0.80 0.09
Zhengzhou2.15 −1.59 0.86 0.14
All correlation coefficients (R) are significant (p < 0.01).
Table 2. Spatial distribution of tropospheric HCHO VCD and its correlation coefficients (R) with different influencing factors in growing and non-growing seasons in North China, 2019–2023.
Region and City NameTemperaturePrecipitationWindNet Surface Solar RadiationNDVI
gsngsgsngsgsngsgsngsgsngs
North China Region0.50−0.100.22−0.110.070.040.09−0.330.300.11
Western Region0.54−0.040.30−0.060.24−0.010.03−0.290.400.24
Central Region0.60−0.300.160.050.18−0.140.19−0.530.050.24
Eastern Region0.53−0.160.31−0.050.090.270.14−0.420.370.25
Beijing0.49−0.410.03−0.22−0.180.460.15−0.560.320.24
Jinan0.63−0.290.120.050.39−0.190.30−0.530.150.20
Qingdao0.480.160.190.290.400.230.10−0.400.230.09
Shijiazhuang0.61−0.410.12−0.180.060.280.23−0.550.170.20
Taiyuan0.58−0.250.19−0.10−0.210.160.22−0.500.460.23
Tianjin0.59−0.330.15−0.220.280.440.24−0.540.330.24
Xian0.520.030.28−0.040.120.030.04−0.130.280.09
Zhengzhou0.53−0.110.320.150.370.010.07−0.470.070.18
Note: gs stands for growing season and ngs stands for non-growing season.
Table 3. Correlation matrix between HCHO VCD and various driving factors in North China, 2019–2023.
TemperaturePrecipitationWindNet Surface Solar RadiationNDVIPopulation Density
HCHO VCD0.350.350.070.020.420.70
Disclaimer/Publisher’s Note: The statements, opinions and data contained in all publications are solely those of the individual author(s) and contributor(s) and not of MDPI and/or the editor(s). MDPI and/or the editor(s) disclaim responsibility for any injury to people or property resulting from any ideas, methods, instructions or products referred to in the content.

