Article

Does Green Finance Facilitate the Upgrading of Green Export Quality? Evidence from China’s Green Loan Interest Subsidies Policy

by
Jinming Shi
*,
Jia Li
*,
Shuai Jiang
,
Yingqian Liu
and
Xiaoyu Yin
School of Economics, Shandong Normal University, Jinan 250014, China
*
Authors to whom correspondence should be addressed.
Sustainability 2025, 17(10), 4375; https://doi.org/10.3390/su17104375
Submission received: 8 April 2025 / Revised: 6 May 2025 / Accepted: 7 May 2025 / Published: 12 May 2025
(This article belongs to the Topic Sustainable and Green Finance)

Abstract

:
In the global pursuit of sustainable development and climate change mitigation, reconciling export growth with environmental protection has emerged as a universal challenge. As the world’s largest developing economy, China has traditionally relied on a resource-intensive development model to fuel rapid foreign trade growth. However, this extensive growth pattern has not only led to environmental pollution domestically but has also encountered hurdles from international green trade barriers. Finance, as a key driver of stable economic growth, plays a pivotal role in achieving high-quality trade development. Against this backdrop, the Chinese government has introduced the green credit interest subsidies policy. This policy aims to coordinate government financial resources and guide capital toward green production, alleviating financing constraints and fostering the upgrading of export product quality. Utilizing data from the World Bank, China Customs statistics, and provincial panels from 2011 to 2020, this study employs a multi-period difference-in-differences (DID) model to examine the causal impact of the green credit subsidies policy on efforts to upgrade the export quality of green products across China’s regions. The benchmark regression results indicate that the green credit interest subsidies policy has significantly improved the export quality of green products across China’s manufacturing industries. Heterogeneity analysis shows that this policy has had a more pronounced positive impact on green product quality in industries with quality-based competition strategies, in regions with well-coordinated local finance and financial policies, as well as in countries that have concluded environmental clauses with China. Mechanism analysis reveals that, on the export side, the policy enhances green product quality by easing financing constraints, increasing green credit, boosting productivity, and upgrading industrial structures. On the import side, the policy promotes green product quality by expanding the scale, variety, and quality of green intermediate goods. This research offers valuable insights for developing countries aiming to establish export-oriented green transformation and upgrading strategies.

1. Introduction

Over the past four decades since its reform and the opening of trade links, China’s export trade has been pivotal in driving its rapid economic growth. According to World Bank data, Chinese merchandise exports surged from USD 9.955 billion in 1978 to USD 3.38 trillion in 2023, with their contribution to GDP increasing from 6.66% to 18.99% during the same period. However, this remarkable achievement was accompanied by significant environmental costs, as the traditional extensive development model prioritized economic expansion over environmental protection. This approach not only resulted in domestic pollution but also exposed China to increasing challenges from international green trade barriers [1]. In recent years, global consensus on environmental protection has strengthened through agreements such as the Paris Climate Agreement and the United Nations Sustainable Development Goals, placing additional pressure on China’s export trade. In addition, in an effort to reduce greenhouse gas emissions and advance the United Nations Sustainable Development Goals, the European Union introduced the Carbon Border Adjustment Mechanism (CBAM) in 2023. This mechanism requires importers to pay a carbon tariff equivalent to the EU’s domestic carbon pricing, thereby increasing the import costs of Chinese products entering the European market and potentially undermining their competitiveness in the international market. In response, there is an urgent need to prioritize green transformation and upgrading as a central strategy to reshape China’s export competitiveness. Consequently, promoting the quality of its green products has become an intrinsic driver for China to cultivate new international competitive advantages, adapt to changing global trade environments, and fulfill its commitments to the United Nations Sustainable Development Goals.
Green finance, as a collaborative endeavor between governments and financial institutions, encompasses not only financial services tailored to sustainable development projects but also institutional frameworks, national initiatives, and policy guidance from governmental bodies [2,3,4]. A well-functioning green finance system plays a pivotal role in driving green transformation and the upgrading of export enterprises by efficiently allocating savings to the most productive sectors [5]. Nevertheless, existing research has predominantly focused on green finance policies as executed by a single entity, such as the financial sector’s green credit policies or the fiscal department’s subsidy policies [6,7]. Some studies have confirmed the positive economic impact of these individual policies on enterprises’ green product exports. However, other research has revealed the potential drawbacks of standalone green finance policies. For example, under green credit policies, banks and other financial institutions may lack sufficient motivation to implement these policies effectively due to green projects’ long-term financing needs, high investment risks, low returns, and maturity mismatches [8,9]. Similarly, under government-implemented green project subsidy policies, some export enterprises may develop policy dependency or engage in moral hazards like falsifying green production information to fraudulently obtain government subsidies [10]. It is clear that different policy entities show differences in information transmission, influence scope, and incentive levels when promoting green transformation and the upgrading of export enterprises. Thus, to effectively drive such a transformation, it is vital to coordinate the strengths of various policy entities and enhance policy effectiveness. The green loan interest subsidies policy, which involves both fiscal and financial departments, represents a combination of government financial subsidies and green loans. This paper focuses on the green loan interest subsidies policy implemented by local Chinese governments, aiming to provide a fresh perspective and provide empirical evidence for green transformation and the upgrading of export enterprises by analyzing the coordination effects of fiscal and financial policies.
The green loan interest subsidies policy is a green finance initiative implemented by the Chinese government, combining centralized planning with local government incentives to support green project investment and financing activities. Specifically, this policy provides either partial or full interest subsidies for green loans, as obtained by enterprises engaged in green projects from banks and other financial institutions, with such subsidies administered by local government finance departments. The policy was first introduced in the 2016 Guiding Opinions on Building a Green Financial System, jointly issued by the People’s Bank of China, the Ministry of Finance, and seven other ministries. In response, local governments at various levels actively implemented supporting policy documents to promote green credit subsidies. By the end of July 2024, 22 provinces had enacted relevant supporting policies (For further details, please refer to Table A1). Compared to a single green economic policy, the green loan interest subsidies policy offers two main advantages. On the one hand, relative to a standalone green credit policy, this policy—implemented by local government finance departments—can subsidize green loan interest rates below the market level. This reduces the risk and cost for financial institutions, thereby increasing their willingness to provide loans and further promoting the development of green finance. In this process, green production manufacturing export enterprises can obtain green credit at a lower cost, enabling them to invest in green technology R&D, equipment upgrades, and production-line transformation. These efforts help improve environmental performance and product quality, ultimately enhancing their international competitiveness. On the other hand, compared to a single financial subsidy policy, this wider-ranging policy effectively leverages the banks’ role in verifying enterprises’ production information, thereby preventing firms from using false green claims to fraudulently obtain green credit. By disclosing authentic green production information to financial institutions, green production manufacturing enterprises can then access government financial support more effectively. This promotes their transformation toward green, low-carbon, and high-efficiency development, further strengthening their position in the global market.
Based on this finding, the main purpose of this study is to explore how the green loan interest subsidies policy—characterized by coordination between government bodies and financial institutions—affects the upgrading of green product export quality in China’s manufacturing sector. The innovations of this study are reflected in the following three aspects. First, in terms of research focus, while the existing literature primarily investigates the impact of green finance on firms’ green export performance from a single-dimensional perspective, this study takes an innovative approach by emphasizing the coordinated attributes of green finance involving both government and financial institutions. Using the above policy, which has been gradually implemented across various regions of China since 2017, as a quasi-natural experiment, this study empirically identifies the causal effect of policy coordination on the upgrading of green product export quality. Furthermore, it reveals the transmission mechanisms employed, from both the export and import perspectives, thereby providing new theoretical insights and empirical evidence to support China’s green export transformation. Second, in terms of research methodology, this study utilizes the most recent statistics released by China Customs to measure, in detail, the quality of HS6-level products exported from different Chinese regions to various destination countries over the years. Based on these data, a multi-period difference-in-differences (DID) model is employed to identify the causal impact of the policy on the export quality of green products. Compared with traditional OLS estimation, the multi-period DID model can more effectively control for the influence of unobservable factors on regression outcomes, thereby improving the credibility and precision of the results. Third, in terms of mechanism testing, this study comprehensively analyzes the mechanisms through which this subsidy influences the export quality of green products in the manufacturing industry, from both export and import dimensions. Specifically, on the export side, the policy promotes the upgrading of export quality by expanding the scale of green credit, enhancing productivity, and accelerating industrial upgrading. On the import side, the policy facilitates improvements in export quality by increasing the scale, diversity, and quality of imported green intermediate goods. This multi-dimensional mechanism analysis not only reveals the internal transmission pathways through which this fiscal instrument drives the upgrading of green product export quality in the manufacturing sector, but also provides firms with clearer guidance on how to implement quality upgrading techniques in practice. It offers more targeted, strategic insights for enterprises pursuing green development. In conclusion, this study fills a critical gap in the literature by linking policy coordination to the green transformation and upgrading of manufacturing exports in developing countries. It also contributes to the exploration of feasible pathways for export-oriented green transformation in developing economies and offers Chinese experience and solutions to support sustainable global economic development.
The remainder of this paper is organized as follows. Section 2 presents a literature review and our research hypotheses. Section 3 describes the variable construction and research design. Section 4 presents the empirical results and analyses. Section 5 provides a detailed discussion of the findings. Finally, Section 6 concludes the study and offers policy recommendations.

2. Literature Review and Research Hypotheses

2.1. The Basic Relationship Between the Green Credit Subsidies Policy and the Export Quality of Green Products

Financing constraints are a critical factor influencing export quality, particularly in China’s bank credit-dominated external financing environment, where stable credit funding is essential for upgrading export quality. Fan et al. [11] highlight the issue that firms exporting goods rely more heavily on credit support than domestic firms. When faced with stringent credit constraints, exporting firms will often opt to produce lower-quality products to optimize the allocation of internal resources. Specifically, financing constraints exacerbate operational risks in technology R&D, manufacturing, and marketing, forcing liquidity-constrained exporters to allocate limited funds to operational maintenance and debt repayment, thereby reducing incentives for upgrading export quality [12]. Furthermore, financing constraints limit investments in fixed assets and intermediate goods imports, which are crucial for product quality improvement. Cash-strapped exporters tend to invest in lower-risk, low-quality products, thereby reducing the production of high-quality export goods [13].
In the context of green finance development, some firms resort to expanding their collateralized assets or falsifying green production information to alleviate financing constraints and secure credit support from financial institutions, potentially leading to environmental pollution [14]. The green loan interest subsidies policy addresses these issues by innovating the traditional green credit model. It enhances green credit authorization guidelines to meet conventional collateral requirements while streamlining bank approval processes and offering subsidized loan rates that are below market levels through local financial departments. Under the green loan interest subsidies policy, innovative financing models have emerged across various regions in China. In Chongqing’s Liangping District, a novel mortgage loan scheme was introduced, leveraging “forest land management rights + ecological product value” as collateral. Through this approach, the Shuanggui Group successfully transformed its ecological assets into a “green certificate of creditworthiness”, securing a loan of CNY 45 million from the Liangping Branch of Chongqing Bank to support the development of green industries. Similarly, in the Huangpu District of Guangzhou City, Guangdong Province, the local government implemented a policy providing a three-year interest subsidy at an annual rate of 1% for green projects financed by banks and other financial institutions. These local practices illustrate how the policy can effectively expand corporate financing channels, reduce financial burdens through targeted government support, and accelerate the development of green industries. This approach effectively mitigates excessive investments or fraudulent green production practices by exporters who are seeking to ease financing constraints. In response, the policy’s financial subsidy function provides implicit guarantees for firms, facilitating access to financial support from banks and other institutions, thereby alleviating these financing constraints [15]. Huzhou City, Zhejiang Province, has developed an innovative local evaluation system for green finance financing entities. This system evaluates enterprises based on 24 indicators across four dimensions, including environmental and climate impact, as well as sustainable development. Enterprises are classified into three categories: “dark green”, “medium green”, and “light green”, with corresponding loan interest subsidies of 12%, 9%, and 6% of the benchmark rate, respectively. This initiative effectively guides financial institutions to allocate more resources to green industry, promoting the growth of sustainable enterprises. Consequently, the policy reduces information asymmetry between exporters and financial institutions, improves the efficiency of financial resource allocation, and directs credit funds toward green projects.
Green credit interest subsidy policies can serve as an implicit guarantee for green product export enterprises by alleviating their financing constraints, thereby creating favorable conditions for upgrading export product quality. Based on this, the present study systematically examines the impact pathways of green credit interest subsidy policies on green product export quality, using methods grounded in the ESG (Environmental, Social, and Governance) theoretical framework.
From the perspective of environmental protection (E), green credit subsidies provide targeted financial support to export enterprises that perform well in terms of environmental protection. This directly empowers firms promoting activities such as green product R&D, clean production processes, and the construction of eco-friendly distribution networks. These improvements enhance their total factor productivity, reduce both the fixed and variable trade costs associated with green exports, and expand the scale of green product exports [16]. As the export scale increases, firms benefit from economies of scale and scope, which reduce marginal costs and free up resources for further product optimization and quality upgrades. Ma et al. [6] conducted an empirical analysis based on provincial panel data from China (2005–2019), revealing that green innovation and investment are critical drivers of export product quality improvement under green finance initiatives.
From the social responsibility (S) perspective, green credit interest subsidies not only ease financial constraints for green projects through fiscal support but also send a strong policy signal, backed by government endorsement via the “green label”. This encourages firms to pay closer attention to fulfilling their social responsibilities in order to gain market recognition and receive enhanced financial support. Specifically, in response to green credit incentives, firms are more likely to adopt socially responsible practices in areas such as environmental sustainability, employee welfare, product safety, and consumer protection. These efforts improve their green image and social credibility, thereby enhancing the international reputation and attractiveness of their green products. As an environmental regulatory financial instrument, green credit subsidies effectively transmit positive product signals to the market, significantly influencing consumer preferences and investment decisions [17]. With the growing public awareness of environmental issues, consumers increasingly favor energy-efficient and environmentally friendly products and services. In response, firms not only drive green innovation at the technical level but also focus on building a responsible and sustainable corporate image. Through brand development, regulatory compliance, increased transparency, and the fulfillment of social commitments, firms establish higher standards of green credibility, enabling them to stand out in competitive international markets [18]. In this context, green credit interest subsidy policies strengthen firms’ internal motivation and external incentives to fulfill social responsibilities through both resource-based and reputational mechanisms, thereby encouraging a more systematic approach to improving green export quality and facilitating a shift in export structure toward “green and high-quality” development.
From the governance (G) perspective, ESG theory emphasizes the importance of sound corporate governance in areas such as governance structure, decision-making transparency, internal control, risk management, and information disclosure. Strong corporate governance not only improves operational efficiency and resource allocation but also enhances the confidence of external financial institutions in the firm’s green financing projects. Under the implementation of green credit interest subsidies, export firms with sound governance are more inclined to proactively disclose their green business practices, which increases their chances of meeting the evaluation standards of financial institutions and obtaining subsidized loans. A robust governance mechanism ensures the efficient allocation of green credit funds, directing them toward key areas such as technological R&D, production line upgrades, and export quality enhancement. This synergy between policy tools and internal governance capacity enables sustained improvements in export product quality.
Based on these insights, this paper proposes Hypothesis 1 (Figure 1).
Hypothesis 1. 
The green loan interest subsidies policy effectively promotes the export quality upgrading of green products in the manufacturing sector.

2.2. The Green Credit Subsidies Policy and Green Product Export Quality Upgrading: Export Level

The green loan interest subsidies policy facilitates the improvement of export quality for green products in the manufacturing sector by expanding green credit availability, enhancing productivity, and promoting upgrades of the industrial structure.
First, the implementation of green financial policies incentivizes financial institutions to strengthen their environmental risk management and strategic decision-making, thereby increasing funding for the enterprise’s green development [19]. In regions where the policy is enacted, government financial departments provide implicit guarantees for green projects by subsidizing all or part of the loan interest. This encourages banks and other financial institutions to allocate more resources to green projects, thereby expanding the scale of green credit and directly enhancing the ability of green product exporters to access credit funds. For example, in the context of the policy in Beijing, China, the Beijing Municipal Government awarded a transformation subsidy of RMB 1.5 million to Beijing Tiandetai Technology Co., Ltd., located at E401, 4th Floor, Building 6, Ronghui Garden, Core Area of Lingkong Economic Zone, Shunyi District, in recognition of its exceptional contributions to supporting the development of green industries. Subsequently, by leveraging the implicit guarantee provided by the government’s financial subsidy, the company secured exclusive green financial services from the Bank of Beijing, which facilitated the expansion of its green credit portfolio.
Second, in areas implementing the policy, local governments ensure the precise allocation and effective utilization of credit funds by engaging third-party organizations to conduct green assessments and certify those enterprises and projects that are receiving green credit. If financial institutions misallocate green funds to non-compliant projects due to subjective errors, resulting in negative externalities such as environmental pollution, local governments will then impose stringent legal penalties [20]. In this context, consistent with Porter’s hypothesis, green product exporters with sufficient credit funds can invest in R&D and innovation. This not only offsets the cost burdens associated with internalizing environmental costs but also drives productivity improvements and export quality upgrades through technological innovation [21]. Huang et al. [22] further demonstrate, through a tripartite game model involving banks, governments, and enterprises, that green finance and government subsidies jointly enhance enterprise innovation levels. As an illustration, under the implementation of the policy in Anhui Province, Anhui Chengfei Integration Ruohu Auto Mold Co., Ltd., located at No. 19 Changshan Road, Wuhu Area, Anhui Free Trade Zone, Anhui Province, China, utilized green loans from banks and government interest subsidies to construct new factory buildings, phase out outdated equipment, and replace it with intelligent machinery. As a result, the precision and efficiency of automotive mold production have been enhanced, driving the company’s productivity growth and fostering an upgrade in export quality.
Finally, according to financial resource theory, financial resources possess both the scarcity attribute of social resources and the allocation capacity of strategic resources [23]. The scarcity of green finance is reflected in its stringent bank audit processes, while its strategic resource allocation function is manifested in the government’s ability to direct financial resources toward green projects through green financial policies, thereby promoting sustainable economic development. Wang and Wang [24] argue that green finance, as a critical tool for financial development, effectively channels funds to green industries, optimizing resource allocation and fostering green industry growth, ultimately contributing to sustainable economic development. This subsidy, as an innovative integration of central-level green financial policies and local financial measures, embodies both the scarcity attribute of financial resources and their strategic allocation capacity. Under resource constraints, this policy effectively redirects financial resources from resource-intensive projects to genuinely green projects, thereby promoting optimal resource allocation and industrial structure transformation. To secure credit support, green product exporters continuously advance their industrial structures toward greener and higher-end development, unlocking the dividends of industrial restructuring and achieving productivity and export quality improvements.
Therefore, from an export perspective, this paper proposes Hypothesis 2 (Figure 1).
Hypothesis 2. 
The green loan interest subsidies policy promotes the upgrading of export quality for green products in the manufacturing sector by expanding green credit availability, enhancing productivity, and facilitating industrial structure upgrades.

2.3. The Green Credit Subsidies Policy and Upgrading Green Product Export Quality: Import Level

The green loan interest subsidies policy enhances the quality of export products by increasing the scale, variety, and quality of intermediate imports. Within the global value-chain-dominated international division of labor model, the Chinese government actively promotes the import of advanced technologies and components to produce high-quality products that meet international technical standards for export. This has led to the phenomenon of “exporting for the sake of importing” in China’s trade growth [25]. Importing intermediate goods is crucial for enhancing export competitiveness, as trade liberalization in intermediate goods significantly boosts the quality of enterprise exports [11]. Similar to export activities, importing intermediate goods also involves fixed and variable trade costs. Firms must bear the fixed costs related to searching for suppliers, maintaining overseas relationships, and adjusting contracts, as well as variable costs such as transportation, warehousing, and tariffs [26]. Additionally, overseas suppliers often require payment methods like bank guarantees or direct payments to mitigate transaction risks and ensure security, further increasing the financing pressure on exporting firms [27]. For green product exporters, the policy alleviates financing constraints, meets the financial needs for importing green intermediates, and overcomes the fixed and variable trade costs, thereby facilitating export quality upgrades through the technological spillover, variety, and quality effects of green intermediate imports. For example, in the context of the implementation of the green credit interest subsidies policy in Hebei Province, the Great Wall Motor Company Limited in Baoding, Hebei, leveraged green credit funds to import advanced foreign battery management systems, intelligent driving chips, sensors, and other key intermediate products. This strategic move facilitated the upgrading of the company’s new energy business industrial structure and enhanced its export competitiveness.
The first consequence of the policy at the import level is the technological spillover effect of green intermediate imports. Compared to domestic green intermediates, those from developed countries often contain higher levels of green technology [28]. By importing these intermediates, firms can learn and absorb cutting-edge green technologies, applying them to energy management, improving energy efficiency, and achieving productivity and export quality enhancements.
Second, there is the variety effect of green intermediate imports. Due to the imperfect substitutability of green intermediates globally, exporters can diversify their sourcing in the global market, enhancing supply chain resilience and security while reducing production costs [29]. This variety effect enables firms to lower production costs, expand production scale, and benefit from economies of scale. Consequently, firms allocate more resources to production process transformation and green technology innovation, driving export quality upgrading.
Third, there is the quality effect of green intermediate imports. Higher-quality green intermediates often represent the most advanced foreign green technologies, requiring a highly skilled workforce to assimilate and apply. According to endogenous growth theory, human capital is central to sustained economic growth, playing a critical role in productivity enhancement and the high-end, green development of the manufacturing sector [30]. As the quality of imported green intermediates increases, firms invest more heavily in highly skilled labor for technological learning, leading to rising human capital levels. This not only mitigates the diminishing marginal returns from long-term imitation but also optimizes factor input structures, enhances resource allocation efficiency, and promotes green technological innovation and the upgrading of export quality. Furthermore, from an industrial chain perspective, firms must search out and match technologies based on raw material and intermediate goods needs, establishing stable production divisions. Advanced technologies, intelligent equipment, and the data embedded in high-quality green intermediates can disrupt existing supply chain relationships, generating significant resource allocation effects, greening the industrial chain, and driving productivity and export quality improvements [31].
Therefore, from an import perspective, this paper proposes Hypothesis 3 (Figure 1).
Hypothesis 3. 
The green loan interest subsidies policy facilitates the upgrading of export quality for green products in the manufacturing sector by increasing the scale, variety, and quality of green intermediate imports.

2.4. Heterogeneity Analysis of Green Credit Interest Subsidy Policies

Regarding the heterogeneity analysis of competitive strategies in industry, prior studies suggest that export enterprises can gain competitive advantages in international markets, either through quality competition strategies, by enhancing product quality and value, or through cost competition strategies by reducing prices and production costs [32,33]. As a key green financial instrument, the green credit interest subsidies policy aims to lower the financing costs associated with green production, thereby encouraging firms to pursue green transformation and improve the quality of their exports. Enterprises that adopt quality competition strategies typically demonstrate strong capabilities in terms of R&D and brand development, and their exports are often targeted at environmentally demanding markets such as Europe and North America [34]. For these firms, the green credit interest subsidy policy can effectively ease the financial constraints related to upgrading their production equipment and obtaining green export certifications, thereby facilitating the upgrading of green product quality. In contrast, firms that rely on cost competition strategies primarily gain in terms of market share through low prices and reduced costs [35]. Although the policy alleviates their financing constraints to some degree, the extent of their motivation for investing in high-risk green innovation is generally limited. These firms tend to meet only the minimum environmental standards required for export and lack the internal drive to pursue substantial quality improvements. Accordingly, the green credit interest subsidy policy has a more pronounced effect on promoting the export quality of green products among quality-oriented enterprises, while its impact is relatively weaker for cost-oriented firms. It is worth noting that, due to data confidentiality concerns, the General Administration of Customs of China ceased publishing firm-level trade data after 2016. As a result, this study constructs its measures of export competition strategies at the regional and industry levels to conduct the heterogeneity analysis.
Thus, heterogeneity analysis of regional financial support intensity is performed. According to Samuelson’s theory of public goods, green projects exhibit characteristics of non-rivalry and non-excludability, making them classic examples of public goods [36]. Due to the difficulty in capturing direct private returns from such projects, the private sector often tends to underinvest in green initiatives. In this context, fiscal support from local governments can play a crucial role by reducing the cost burden associated with green transformation, internalizing negative environmental externalities, and promoting sustainable development among enterprises. In regions with strong fiscal support, local governments are better equipped to subsidize interest payments on green loans, thereby enhancing the effectiveness of the green credit interest subsidy policy. These subsidies help lower the financing costs for enterprises engaged in green production, strengthening the policy’s incentive effect. Conversely, in regions with limited fiscal capacity, local governments often lack sufficient funds to support green loan subsidies. As a result, firms in these regions find it more difficult to reduce their financing costs, and the incentive effect of the policy is significantly weakened. Moreover, fiscal support itself serves as a policy signal, reflecting the local government’s commitment to green transformation. In regions with weak fiscal support, investors may interpret this as a lack of political will or policy continuity, leading to greater caution regarding green investment prospects and reduced investment in sustainable development projects [37]. Therefore, regional disparities in fiscal support intensity can significantly influence the effectiveness of green credit interest subsidy policies in enhancing the export quality of green products. The stronger the fiscal support in a region, the greater the policy’s promotional impact on upgrading green product quality.
Finally, heterogeneity analysis of the export destination countries is conducted. Environmental protection clauses in free trade agreements (FTAs) represent a potential form of green trade barriers, which are often established by importing countries under the justification of protecting public health, natural resources, and the environment. These international environmental regulations are typically highly binding for exporting firms. Enterprises that fail to meet the prescribed standards within a given timeframe often face higher trade costs or even risk losing their export market access [38]. A prominent example is the European Union’s Carbon Border Adjustment Mechanism (CBAM), which serves as a typical embodiment of such regulatory measures. According to the Porter hypothesis, well-designed environmental regulations can generate an “innovation offset” or “innovation complement” effect, incentivizing firms to engage in green technological innovation, which, in turn, enhances productivity and export quality [21]. Supporting this view, Olasehinde-Williams and Folorunsho [39] found that stringent environmental regulations can stimulate green innovation and foster sustainable development in European countries through their interaction with green trade. However, other scholars such as Palmer et al. [40] argue that the internalization of environmental compliance costs may crowd out firms’ R&D investments, thereby hindering productivity growth. To mitigate the adverse cost effects of such regulations, the green credit interest subsidies policies—which reduce the interest costs associated with green production financing through fiscal subsidies—can play a critical role. By lowering the financial burden, the policy helps firms offset the costs of compliance with environmental standards and encourages the optimization of green production and export structures. Therefore, the stringency of environmental regulations in export destination countries influences the effectiveness of green credit interest subsidy policies in promoting export quality. Specifically, in countries that incorporate environmental protection clauses into their free trade agreements, these subsidy policies have a more pronounced positive impact on the export quality of China’s green products (Figure 1).
Hypothesis 4. 
The green loan interest subsidies policy has a more pronounced positive impact on green product quality in industries with quality-based competition strategies, in regions with well-coordinated local finance and financial policies, and in countries that have concluded environmental clauses with China.

3. Research Design

3.1. Model Setting and Descriptions of the Variables

In this study, we use a multi-period DID model to explore the impact of the green loan interest subsidies policy on China’s export product quality. The difference-in-differences (DID) method is widely used in econometrics for policy evaluation and causal inference [41]. It identifies policy effects by comparing changes in outcomes between treatment and control groups before and after an intervention. As an extension, the multi-period DID is better-suited for settings with multiple time periods or treatment groups, allowing for a more comprehensive analysis of dynamic policy effects and regional heterogeneity, thereby enhancing the precision and robustness of causal estimates.
ln q u a l i t y i d k t = β 0 + β 1 d i d i d t + β n n = 2 6 C o n p r o i d i t + β m m = 7 11 C o n c o u n t r y d t + λ i + λ j + λ d + λ k + λ t + λ t k + λ i k d + ε i j d k t
Here, subscripts i, j, d, k, and t represent the region, industry, destination country, product, and year, respectively. The explanatory variable ln q u a l i t y i d k t is the export quality of HS6-digit product k, exported by region i to country d in year t; the core explanatory variable d i d i d t is the interaction term between the dummy variable and the product grouping variable before and after the implementation of the green loan interest subsidies policy; C o n p r o i d i t is the set of control variables at the regional level, and C o n c o u n t r y d t is the set of control variables at the country level. λ i , λ j , λ k , λ d , and λ t denote the fixed variables at the level of region, industry, product, country of destination, and year, respectively; λ t k is the joint fixed effects at the year and product levels; λ i k d is the joint fixed effects at the region, product, and destination country levels; and ε i j d k t is the randomized disturbance term.

3.1.1. Explained Variables

The explanatory variable in this study is the quality of those products classified under HS6 codes exported from each region to various destination countries. This variable is quantified by employing the KSW methodology proposed by Khandelwal et al. [42]. The full name of the KSW method is the demand information inversion method. It derives a demand function incorporating product quality under the assumption that consumers have heterogeneous preferences and aim to maximize utility. Based on this framework, product quality is inferred using data on export prices and export volumes. The core idea of the method is that, given the same export price, a larger export volume indicates higher product quality.

3.1.2. Explanatory Variable

The core explanatory variable ( d i d i d t ) in this study is the interaction term between the policy dummy variable ( p o l i c y i t ), which captures the implementation of the green loan interest subsidies policy, and the product grouping variable ( g r o u p _ h s d t ). The policy dummy variable is constructed based on a comprehensive review of green finance policy documents that have been published on the official websites of Chinese regional governments (see Table A1). Specifically, if a green finance policy document issued by a local government in a given year includes incentives such as “interest subsidies”, the policy dummy variable in the panel dataset is assigned a value of 1 for that year and all subsequent years; otherwise, it is set to 0. For instance, the Beijing Municipal Bureau of Finance and other relevant departments jointly released their Implementation Program on Building the Capital’s Green Financial System in 2017, which includes interest subsidy provisions. Accordingly, the policy dummy variable for Beijing is coded as 1 from 2017 onward and 0 for the years prior to 2017. This setup allows the DID framework to exploit both the temporal variation in policy rollout and the geographic heterogeneity across regions for robust causal identification. For the product grouping variable, this study employs a multi-step approach. First, six pollution indicators—wastewater, solid waste, sulfur dioxide, carbon dioxide, dust, and soot—are compiled for the manufacturing sector (based on CIC two-digit industry codes) using data from the China Environmental Statistics Yearbook and the database of key enterprises surveyed to determine China’s industrial pollution sources. A comprehensive pollution emission intensity index for the manufacturing sector is then calculated using the deviation standardization method. Second, the manufacturing sector is categorized into either polluting or environmentally friendly industries, based on the median value of the comprehensive pollution emission intensity index. Finally, the CIC industry codes are mapped to HS Customs product codes, using the CIC-HS conversion table provided by Brandt et al. [43]. The product grouping variable (For further details, please refer to Table A2) is coded as 1 if a region’s exports belong to environmentally friendly industries (i.e., green products), and 0 if they belong to environmentally polluting industries (i.e., brown products).

3.1.3. Control Variables

In addition to the core explanatory variables, this study is based on Anderson’s [44] classic trade gravity model and incorporates control variables at both the regional and destination country levels in the empirical model to account for potential factors influencing the quality of manufacturing export products. The gravity model is a theoretical framework derived from the law of universal gravitation in physics, suggesting that trade flowing between two economies is positively proportional to their GDPs and inversely proportional to the geographical distance between them. At the regional level ( C o n p r o i d i t ), the control variables include regional GDP, regional openness, regional FDI levels, regional e-commerce development, and regional green innovation capacity. The set of control variables at the regional level is intended to reflect the export potential of each region in China. Existing studies have generally found that larger economic size, greater openness to international markets, higher levels of foreign investment, and stronger green innovation and e-commerce development are associated with the greater international competitiveness of export products [45,46,47]. At the national level ( C o n c o u n t r y d t ), the control variables encompass the destination country’s GDP, national openness, geographical distance, the presence of free trade agreements, and exchange rate volatility. Country-level control variables capture market demand, trade facilitation, and trade costs in the destination country. Existing studies generally find that larger market size, greater openness to international trade, and the presence of free trade agreements tend to promote export quality upgrading, while greater geographic distance and exchange rate volatility tend to hinder it [25,48,49]. Detailed definitions of all variables, along with their descriptive statistics, are provided in Table A3.

3.2. Data Description

The data on the quality of manufacturing export products were sourced from the product trade database of China’s General Administration of Customs, spanning the years 2011 to 2020. The customs data were processed as follows: (1) Records with missing export quantity or export value were removed. (2) Eight-digit product codes were aggregated to the six-digit HS level, and product codes across different years were harmonized to ensure consistency. Based on this process, the product codes were matched with China’s national industrial classification, using the concordance table provided by Brandt et al. (2017) [43], and only manufacturing-sector data were retained. (3) Export values and quantities were then aggregated by year, product (six-digit code), region, and destination country, and were used to construct a measure of export product quality. Regional-level control variables were obtained from the China Statistical Yearbook and the China Environmental Statistics Yearbook. Destination country-level control variables were derived from CEPII’s BACI database and the World Bank’s World Development Indicators (WDI) database. Data for omitted variables were collected from multiple sources, including China’s Technical Trade Measures Network (TBT), the China Technical Trade Measures Network (CTMN), the WTO Tariff Database, and the annual lists of products with adjusted export tax rebate rates, as issued by China’s State Administration of Taxation (SAT).

4. Empirical Analysis

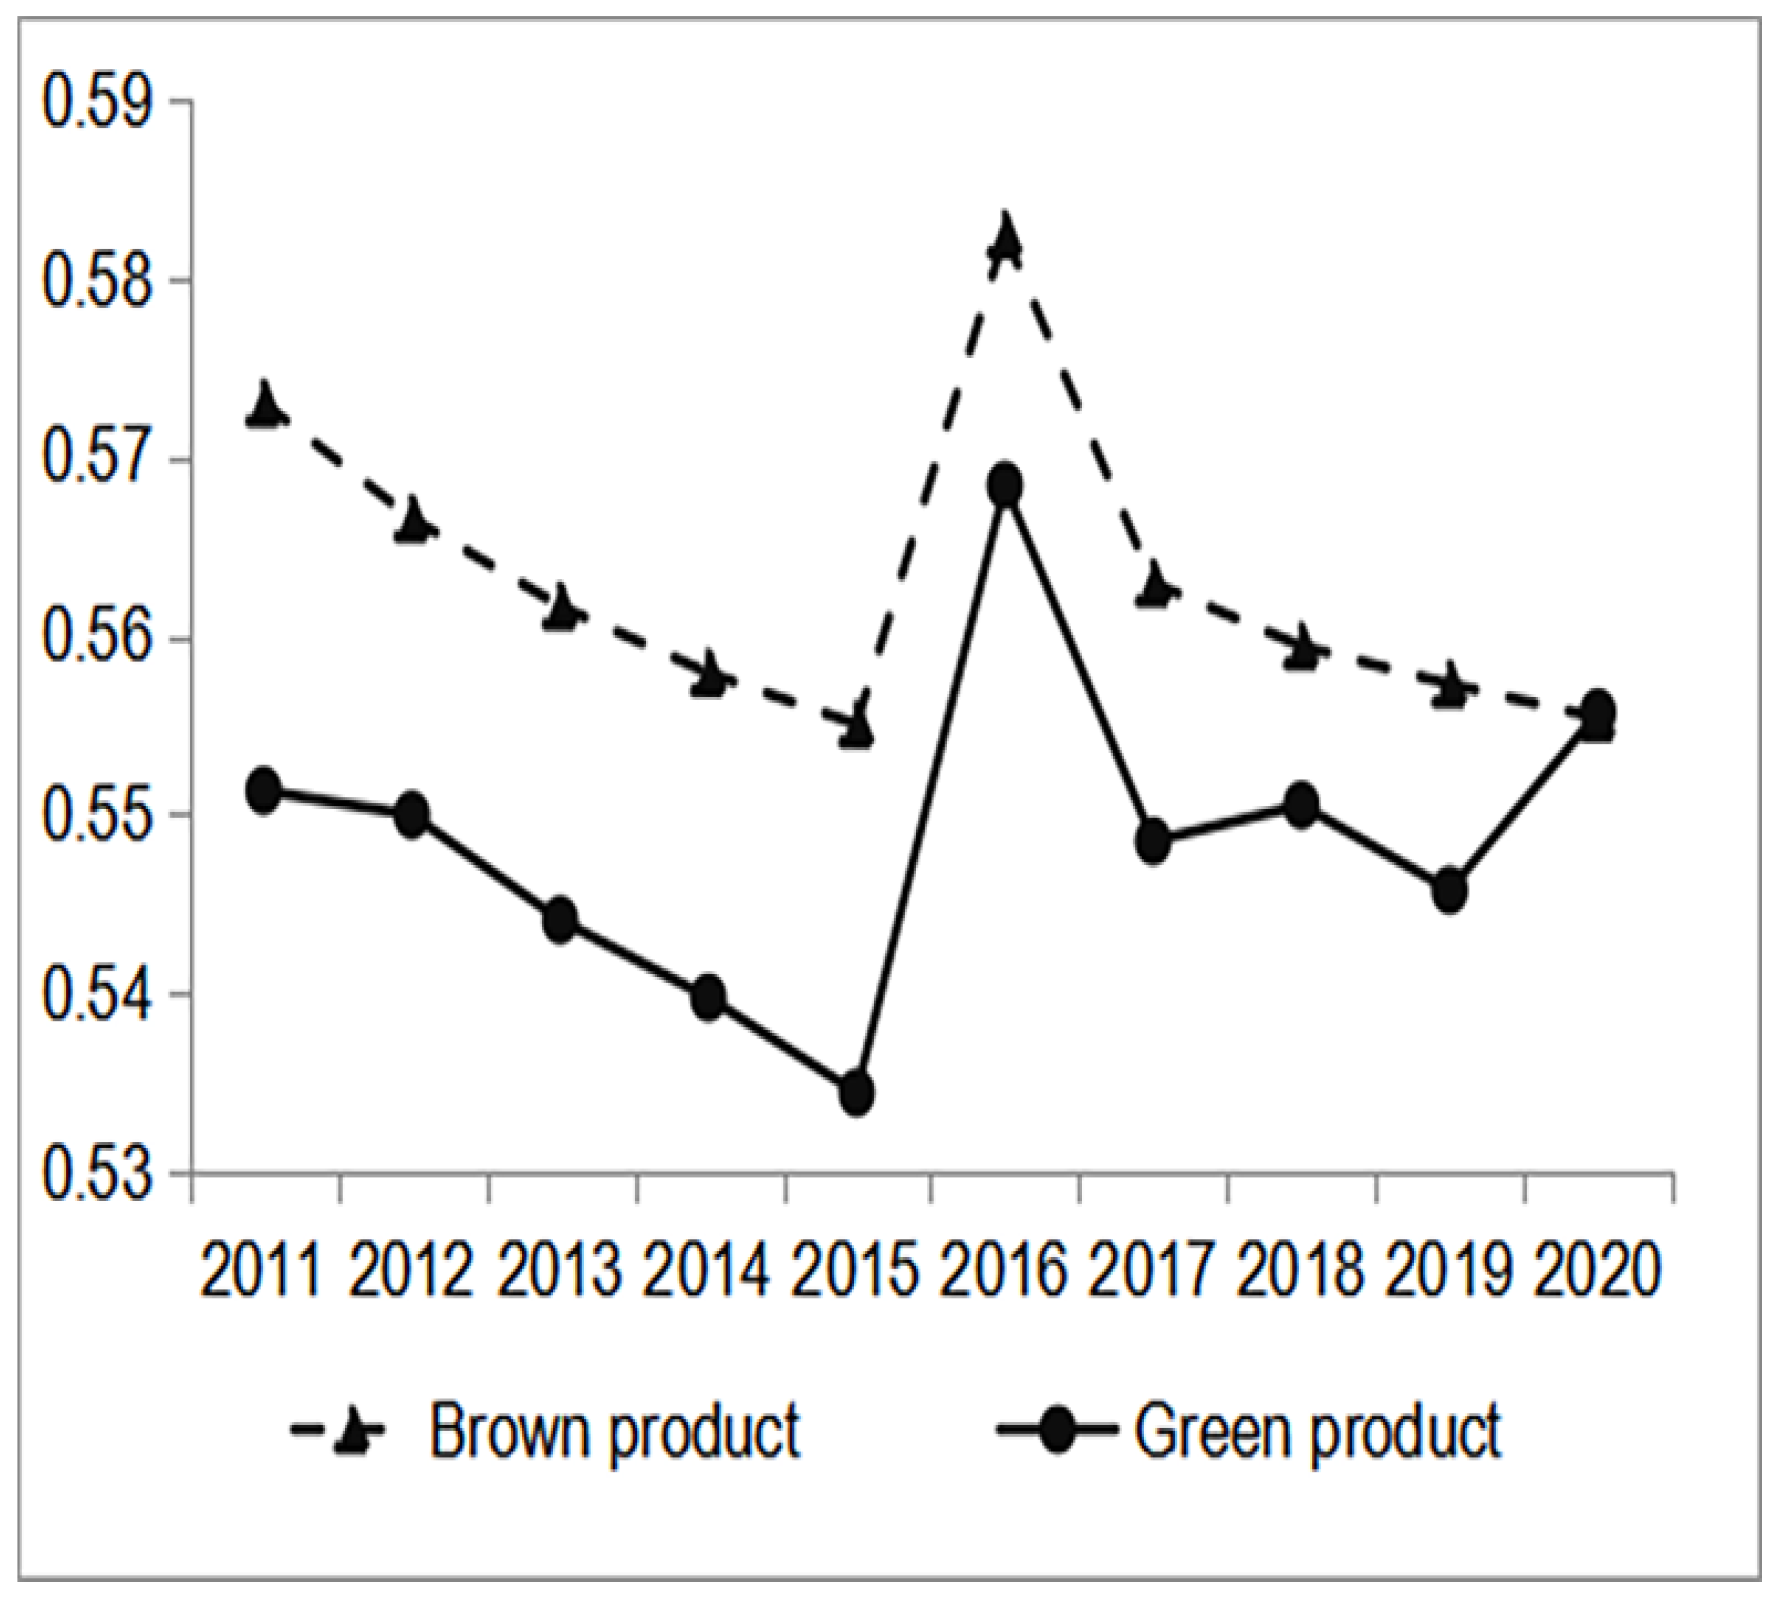
4.1. Characterization Facts Analysis

To explore the fundamental relationship between the green loan interest subsidies policy and product quality across different levels, this study analyzes the trends in export quality for green and brown products in China from 2011 to 2020, as illustrated in Figure 2. Prior to 2016, the export quality of green and brown products exhibited similar trends. However, following the initial implementation of the policy, a divergence emerged: the export quality of green products demonstrated a clear upward trajectory, while that of brown products experienced a decline. This preliminary evidence suggests a positive effect of the policy on promoting the export quality of green products, highlighting its potential effectiveness in driving sustainable trade practices.
To better understand the regional heterogeneity of the green loan interest subsidies policy’s impact, this study compares the export quality trends of green and brown products between regions with and without the policy being enacted. As shown in Figure 3, both green and brown products exhibit a fluctuating upward trend in regions where the policy is implemented. Specifically, exporters of green products leverage the financial support provided by the policy to ensure the targeted allocation of funds, which not only stimulates research and innovation but also enhances productivity and export quality. Simultaneously, exporters of brown products actively transition toward greener and more high-end industrial structures to qualify for financial support, thereby releasing the benefits of industrial restructuring and achieving improvements in productivity and export quality. In contrast, as shown in Figure 3, in regions without the policy being enacted, exporters of non-environmentally friendly products often resort to questionable practices, such as misrepresenting their environmental practices, to secure green credit support and maintain their competitive edge. For instance, according to the typical cases of ecological and environmental law enforcement released by the Liaoning Provincial Department of Ecology and Environment, prior to the implementation of the green credit interest subsidies policy in Liaoning Province, a motor vehicle inspection company in Shenyang was found to have been engaged in morally hazardous behavior by using external simulation devices to tamper with vehicle emission data. This manipulation enabled vehicles to pass environmental inspections fraudulently and allowed the company to illicitly obtain government green subsidies. Meanwhile, exporters of green products, despite demonstrating a temporary improvement in export quality following the nationwide green finance policy framework introduced by the Central Bank of China in 2016, faced declining export quality over time due to insufficient local government supervision and incentives. These findings highlight the critical role of localized policy implementation and oversight in driving sustainable export quality improvements.
The descriptive analysis indicates that the green loan interest subsidies policy has generally contributed to the improvement of green product export quality. In regions where the policy has been implemented, the export quality of green products has improved significantly, whereas no such improvement is observed in regions without policy implementation. Building on this, the paper employs a multi-period difference-in-differences model to examine the causal effect of the green credit interest subsidies policy on the export quality of green products.

4.2. Regression to Baseline

The results of the benchmark regression are shown in Table 1. Columns (1)–(3) present robust standard-error calculations, while columns (4)–(6) show robust standard errors for the two-way clustering of regions and industries, which is done to control the problem of heteroskedasticity in different dimensions. The regression coefficient of the interaction term between the green loan interest subsidies policy and the product grouping variable is 0.0964 and is positively significant at the 1% level, indicating that the implementation of the policy has significantly enhanced the export quality of green products in the manufacturing industry by approximately 9.64%. These findings provide strong empirical support for Hypothesis 1.
The benchmark regression results indicate that the green credit interest subsidies policy significantly promotes the export quality of green products. To further verify the robustness of these results, this paper presents a series of robustness checks from multiple dimensions.

4.3. Robustness Analyses

4.3.1. Expected Effects Test

To address the potential concern that enterprises may have taken measures to improve export product quality prior to the implementation of the green loan interest subsidies policy, which could bias the policy assessment, a robustness check is conducted by advancing the policy implementation time by 1 year across regions and reconstructing the interaction term with the grouping variables. As shown in column (1) of Table 2, the regression coefficient for the anticipated pre-policy effect ( p r e _ d i d i d t ) is statistically insignificant, while the significance and direction of the interaction term remain consistent with the baseline regression results. This confirms the robustness of the baseline findings and alleviates concerns about pre-existing trends influencing policy evaluation.

4.3.2. Parallel Trend Testing

The multi-period difference-in-differences (DID) approach requires satisfaction of the parallel trends assumption, which posits that the difference in export quality between green and brown products remains stable prior to the policy’s implementation. Following the methodology of Beck et al. [50], this study employs an event study framework to test the parallel trends assumption, using the following model specification:
ln q u a l i t y i d k t = α 0 + α z z = 8 4 d i d i d t * d u m m y z + α n n = 5 9 C o n p r o i d i t + α m m = 10 14 C o n c o u n t r y d t + λ i + λ j + λ d + λ k + λ t + λ t k + λ i k d + ε i j d k t
where d u m m y z is a year dummy variable, α z is the difference between the export quality of green products and other products during the z year of the green loan interest subsidies policy implementation, and the other variables are consistent with baseline regression. As shown in Figure 4, in the 8 years before the implementation of the policy (z = −8, −7, −6, −5, −4, −3, −2, −1), the 95% confidence intervals of the interaction term ( d i d i d t * d u m m y z ) all contain 0, whereas in the five years after the implementation of the policy (z = 0, 1, 2, 3, 4, 5), the 95% confidence intervals of the interaction term ( d i d i d t * d u m m y z ) do not contain 0 in most of the years, which indicates that the difference in export quality between green and brown products before the implementation of the policy was unchanged over time. Meanwhile, the upward fluctuation parallel trend line also indicates that the policy had a long-term effect on improving green products’ export quality.
The existing literature highlights the fact that multi-period difference-in-differences (DID) estimators may suffer from heterogeneous treatment effect bias, where the estimated effects for earlier-treated units, serving as controls, may not accurately capture the treatment’s impact on the experimental group over time [51]. To address this concern, this study adopts the approach proposed by De Chaisemartin and D’Haultfoeuille [52] to assess potential heterogeneous treatment effects by calculating the number and proportion of positive and negative weights. The analysis reveals that the negative weight is negligible, suggesting that the heterogeneous treatment effect bias is minimal in this study and does not significantly affect the validity of the estimated results.

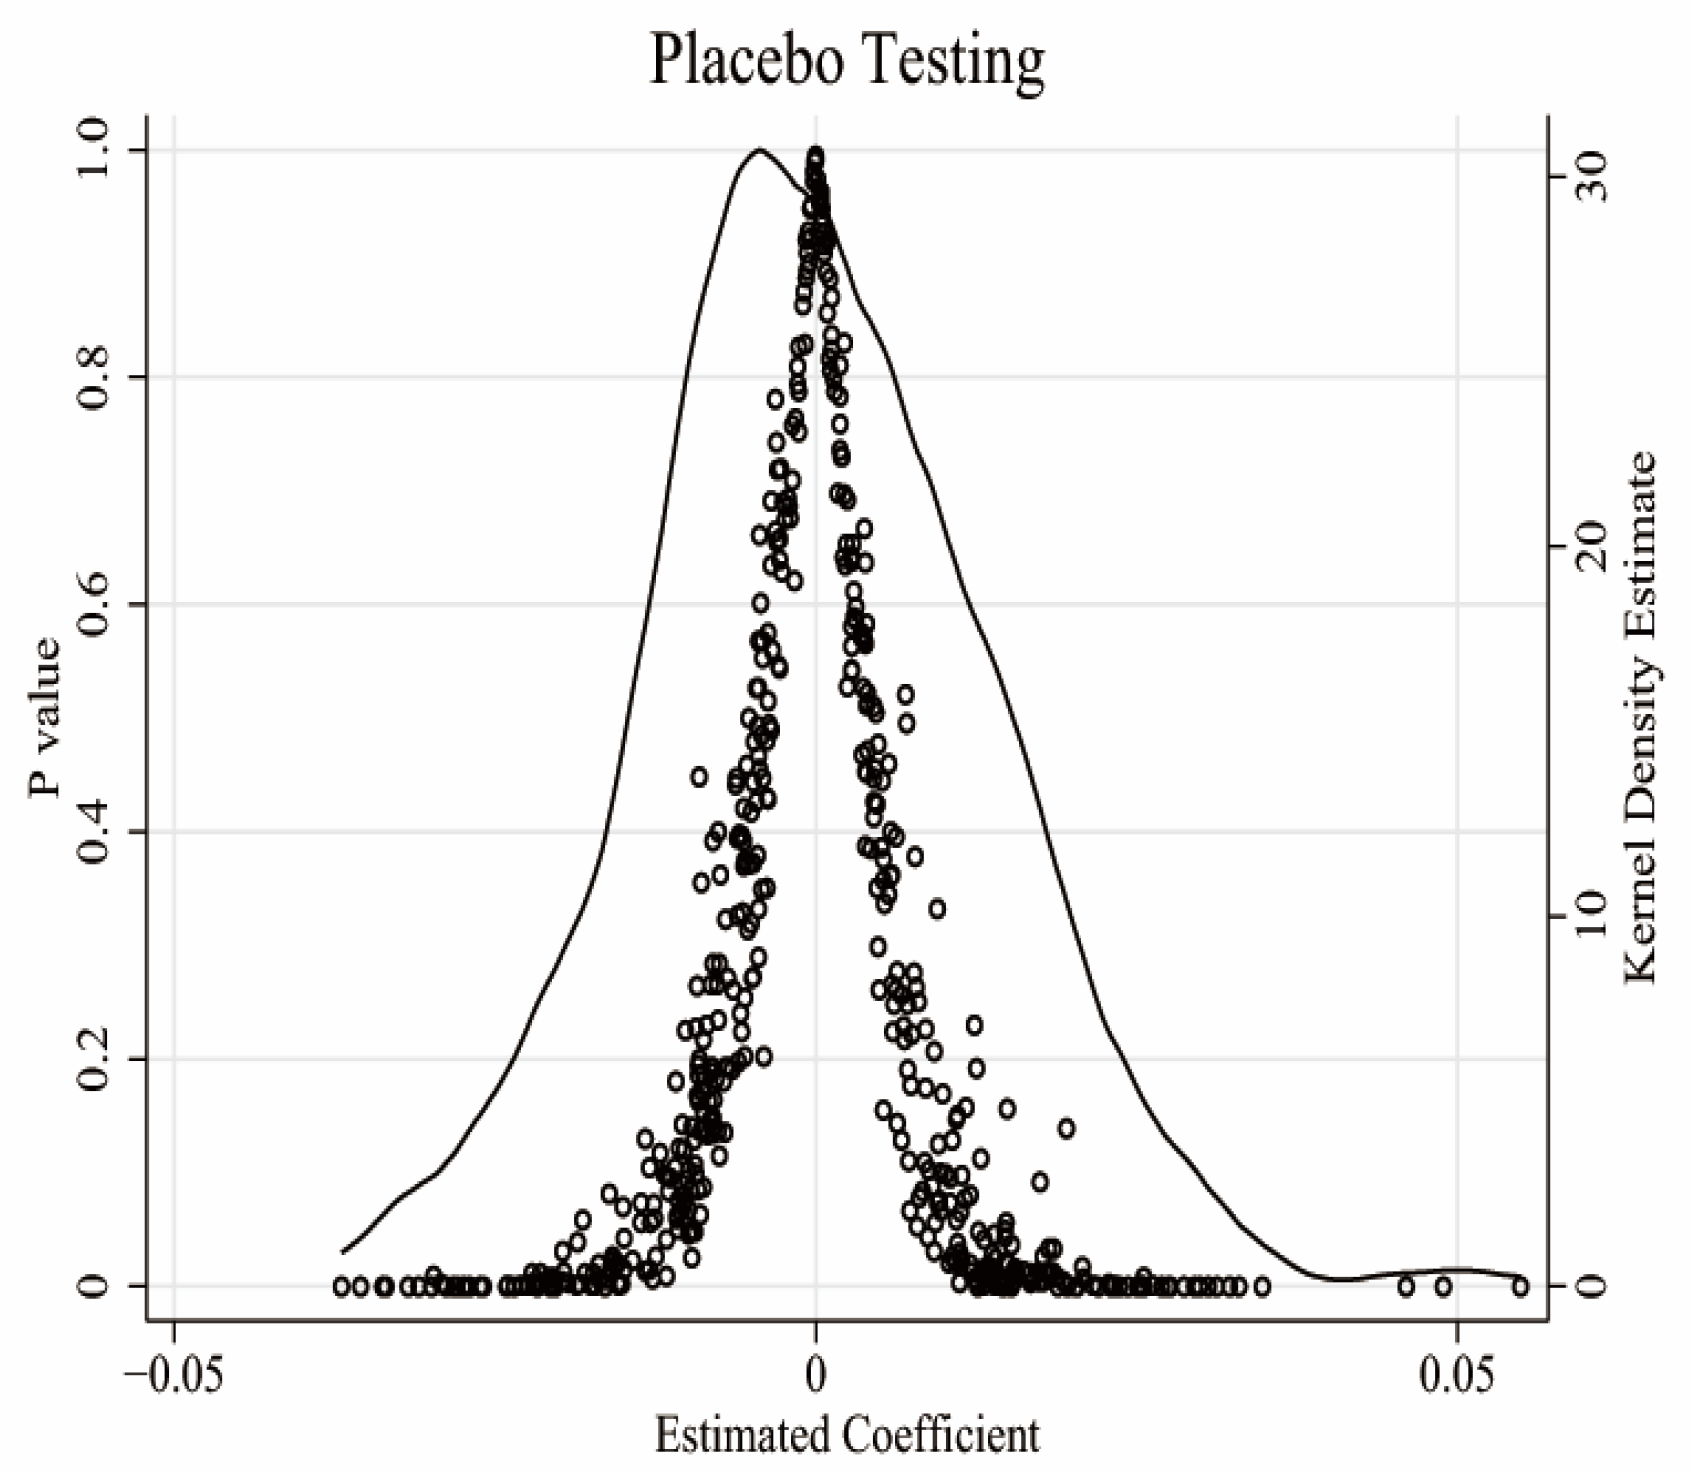
4.3.3. Placebo Testing

To mitigate the potential influence of random factors on the regression results, a placebo test is conducted by randomizing both treatment groups and policy implementation years. Specifically, 16 regions and the corresponding years are randomly selected from the 31 regions in China over the period 2011–2020 to generate pseudo green loan interest subsidy variables. Additionally, 2142 products are randomly chosen from the 4283 manufacturing export products listed, to serve as the pseudo-treatment group. The interaction term between the pseudo-policy and pseudo-treatment group variables is then constructed and incorporated into the baseline regression model. This process is repeated 1000 times. As illustrated in Figure 5, the distribution of pseudo-regression coefficients is tightly clustered around zero, which is significantly distinct from the benchmark regression coefficient of 0.0964. This finding confirms that the benchmark results are robust and are not driven by random factors.

4.3.4. Other Robustness Tests

This study further examines the robustness of the benchmark regression results through multiple approaches, drawing on established methodologies in the literature.
(1) Substitution of Explanatory Variables. In the benchmark regression, export product quality is measured using the average price of the same products exported from the same region to other markets. However, this approach may introduce bias by excluding products without reference prices in other markets. To address this limitation, the robustness analysis employs the closest distance from each Chinese region to the export destination market as an instrumental variable to measure product quality. As shown in column (2) of Table 2, the interaction term ( d i d i d t ) remains significantly positive, confirming the robustness of the benchmark regression results.
(2) Re-identification Processing Group. This study re-screens the treatment group samples according to the “Green Bond-Supported Projects Catalogue (2015 Edition)” issued by the People’s Bank of China. If a manufacturing sector is included in the supported green industries, the grouping variable (group 2) is set to 1; otherwise, it is set to 0. Based on this, an interaction term ( d i d s i d t ) with the green credit interest subsidies policy is constructed. The regression results in column (3) of Table 2 show that the coefficient of the interaction term ( d i d s i d t ) remains significantly positive, confirming the robustness of the baseline regression results.
(3) Balancing the Panel. Given the rise of unilateralism in recent years, China’s product exports face increasing uncertainties that may affect export quality. To mitigate this problem of balance, the analysis removes those products that are not continuously exported during the sample period, retaining only a robust and balanced panel of regional product data at the destination country level from 2011 to 2020. Column (4) of Table 2 demonstrates that the interaction term remains significantly positive under this balanced panel approach.
(4) Omitted Variables. To ensure the validity of the regression results, this study controls for potential omitted variables at the product level, including foreign green trade barriers ( ln b a r r i e r s k t ), product trade liberalization ( ln d u t y k t ), and export tax refunds ( T a x k t ). As shown in column (5) of Table 2, the interaction term remains significantly positive after accounting for these factors, further supporting the robustness of the findings. Additionally, to mitigate the potential confounding effects of local governments’ environmental governance measures in China (such as industrial policies and environmental regulations) on the regression results, this study draws on the methodology of Chen et al. [53]. Specifically, we use the frequency of environment-related terms appearing in the government work reports of various regions (gov) as a proxy variable for environmental governance efforts by local governments in China. As shown in column (6) of Table 2, the interaction term remains significantly positive even after accounting for these factors, thereby further confirming the robustness of our regression results.
(5) Sample Selection Bias. To address the potential sample selection bias, the study employs a year-by-year matching approach to identify those samples similar to the treatment group and conducts a multi-period DID analysis on this refined sample. Column (7) of Table 2 shows that the interaction term remains significantly positive, indicating that the results are robust regarding sample selection concerns.
(6) Spatial Spillover Effects. To eliminate the potential bias in the regression results caused by geographical spatial proximity, this study employs spatial econometric methods to examine the spatial spillover effects of the green credit interest subsidy policy. Given that the data used in this study are unbalanced panel data at the regional, product, and country levels, while spatial econometric models typically require balanced panel data, this study aggregates the quality of green products and brown products to the regional and annual levels, based on export values. As shown in Table 3, both green product quality and brown product quality exhibit significant spatial clustering characteristics across regions, meaning that this analysis meets the prerequisite for spatial econometric analyses.
Table 4 reports the spatial spillover effects of the green credit interest subsidy policy on the export quality of green products and brown products. The results show that the spatial lag coefficients (ρ) for both green and brown products are significantly positive, indicating a clear correlation in export quality among the neighboring regions. The regression coefficient for the green credit interest subsidy policy (policy) is also significantly positive, suggesting that even after accounting for the spatial spillover effects of the policy, its implementation still has a significant positive impact on the upgrading of product export quality, confirming the robustness of the baseline regression results. Additionally, the interaction term between the green credit interest subsidy policy and the spatial geographic matrix (W × policy) is significantly positive, indicating that the implementation of the policy has a positive signaling effect on the export quality upgrading of neighboring regions.
After a series of robustness tests—including the expected effect, parallel trend, placebo test, replacement of explanatory variables, changes in product grouping criteria, use of a balanced panel, control for omitted variables, sample selection bias, and spatial spillover effects—the benchmark regression results remain robust. To further examine the transmission mechanisms proposed in Hypotheses 2–4, this paper conducts empirical analysis using heterogeneous subgroup regressions and a mediation effect model.

4.4. Heterogeneity Analysis

Through heterogeneity analysis, this study investigates the differential impact of the green loan interest subsidies policy across three dimensions: product characteristics, regional attributes, and exporting country features.
(1) Heterogeneity in Industry Export Strategies. This study employs the classification method of Eckel et al. [32] to identify export strategies across regions and industries by examining the regression coefficients between export prices and sales rankings. A positive coefficient indicates a cost-based competition strategy, where firms compete through low prices and lower quality levels. A negative coefficient suggests a quality-based competition strategy, characterized by investment upgrades and by higher prices and quality. As shown in columns (1)–(2) of Table 5, the green credit interest subsidies policy has a more significant impact on the export quality of green products in industries using quality-based strategies, and the SUR test rejects the null hypothesis. This indicates that the policy effectively supports firms’ green investments and promotes the quality upgrade of green product exports.
(2) Heterogeneity in Regional Fiscal–Financial Policy Coordination. The degree of coordination between regional fiscal and financial policies is assessed based on the annual ratio of fiscal revenue to expenditure in each region. Regions are divided into strong and weak policy coordination groups, using the median ratio as the threshold. Columns (3)–(4) of Table 5 reveal that the policy significantly improves the export quality of green products in regions with strong fiscal–financial policy coordination, with the irrelevance test rejecting the null hypothesis. In these regions, enterprises are more likely to adopt green production practices and secure green credit, thereby accelerating upgrades to the quality of exported green products.
(3) Heterogeneity in Environmental Protection Clauses in Free Trade Agreements (FTAs). This study identifies the countries with environmental protection clauses among those that have signed FTAs with China, including South Korea, Thailand, Vietnam, Indonesia, Australia, Malaysia, Singapore, the Philippines, Cambodia, Myanmar, Brunei, Laos, Switzerland, Iceland, Peru, Chile, New Zealand, and Costa Rica. The analysis demonstrates that in countries with such clauses, the green loan interest subsidies policy significantly enhances the export quality of manufacturing green products, with the irrelevance test rejecting the null hypothesis. The synergy between FTA environmental clauses and the green loan policy provides a dual mechanism for guiding and regulating green transformation, amplifying their combined impact on upgrading the export quality of green products.

4.5. Mechanism Analysis

In this paper, we test the existence of the mechanism channel through a mediated effects model, which is set up as follows:
M i t = β 0 + β 1 d i d i d t + β n n = 2 6 C o n p r o i d i t + β m m = 7 11 C o n c o u n t r y d t + λ i + λ j + λ d + λ k + λ t + λ t k + λ i k d + ε i j d k t
ln q u a l i t y i d k t = β 0 + β 1 M i t + β n n = 2 6 C o n p r o i d i t + β m m = 7 11 C o n c o u n t r y d t + λ i + λ j + λ d + λ k + λ t + λ t k + λ i k d + ε i j d k t
ln q u a l i t y i d k t = β 0 + β 1 d i d i d t + β n n = 2 6 C o n p r o i d i t + β m m = 7 11 C o n c o u n t r y d t + β 12 M i t + λ i + λ j + λ d + λ k + λ t + λ t k + λ i k d + ε i j d k t
where M i t denotes the relevant mechanism variables, including regional green credit scale ( G r e e n _ c r e d i t i t ), regional productivity ( ln t f p i t ), regional industrial structure upgrading ( I S U P i t ), regional green intermediate imports scale ( ln v a l u e _ b e c i t ), regional green intermediate imports type ( ln s i z e _ b e c i t ) and regional green intermediate imports quality ( ln q u a l i t y _ b e c i t ); other variables are consistent with the benchmark regression.
To examine the export-side mechanism, this paper first defines the regional credit scale, total factor productivity, and industrial structure upgrading as mechanism variables (see Table A3). Then, using a mediation effect model, we test these mechanisms empirically. For example, in columns (1)–(3) of Table 6, the coefficient of the interaction term ( d i d i d t ) in column (1) is significantly positive at the 1% level, indicating that the green loan interest subsidies policy expands green credit. In column (2), the green credit scale ( G r e e n _ c r e d i t i t ) also shows a significant positive impact at 1%, suggesting that it meets capital needs for export quality improvements in green manufacturing. Both coefficients in column (3) are significantly positive at 1%, further confirming the role of credit capital in enhancing export quality. The Sobel Z-value is 2.735, and bootstrap sampling (500 iterations) excludes zero from the confidence interval, validating the mediating effect of the green credit scale on export quality. The paper similarly tests total factor productivity (columns (4)–(6)) and industrial structure upgrading (columns (7)–(9)), with all results supporting Hypothesis 2: the green loan interest subsidies policy upgrades green product export quality by expanding green credit, boosting productivity, and promoting structural upgrades.
This paper examines the import-side mechanisms by defining regional variables for the scale, type, and quality of green intermediate inputs (see Table A3). It tests these mechanisms using a mediation effect model, focusing on the scale of green intermediate imports as an example. In columns (10)–(12) of Table 6, the interaction term ( d i d i d t ) in column (10) shows a significant positive coefficient at the 1% level, indicating that the green loan interest subsidies policy effectively expands green intermediate imports. The scale of green intermediates ( ln v a l u e _ b e c i t ) in column (11) is also significantly positive at the 1% level, confirming its role in meeting financial needs for upgrading export quality in green manufacturing. The coefficients for the interaction term and green intermediate imports in column (12) are significantly positive at the 1% level, suggesting that the policy enhances import scale and facilitates export quality upgrades through technology spillovers. The Sobel Z-value of 3.554 is significant at the 1% level, and the bootstrap sampling (500 iterations) shows a confidence interval that excludes zero, validating the mediating effect. The paper also tests those mechanisms related to the types (columns (13)–(15)) and quality (columns (16)–(18)) of green intermediates. Overall, the results in columns (10)–(18) indicate that the green loan interest subsidies policy has upgraded the export quality of green products in manufacturing by enhancing the scale, type, and quality of green intermediate imports, thereby supporting Hypothesis 3.

4.6. Overview of the Empirical Findings

In the empirical analysis, this paper utilizes data from Chinese Customs, provincial-level panel data from China, and World Bank open data spanning the period from 2011 to 2019 to examine the causal effect of the green loan interest subsidies policy on upgrading the export quality of green products in the manufacturing sector. The results indicate that the policy has significantly enhanced the export quality of green products in those regions where it has been implemented. Moreover, the baseline regression results remain robust after a series of robustness checks, including tests for expected policy effects, parallel trends, placebo treatments, alternative explanatory variables, different product grouping standards, balanced panel estimation, omitted variable bias, sample selection bias, and spatial spillover effects. The heterogeneity analysis shows that this policy has a more pronounced positive impact on green product quality in industries with quality-based competition strategies, in regions with well-coordinated local fiscal and financial policies, and in countries that have concluded environmental clauses with China. The mechanism analysis shows that on the export side, the policy has expanded access to green credit, improved firm productivity, and facilitated industrial upgrading. On the import side, the policy has increased the scale, variety, and quality of imported green intermediate goods, thereby contributing to an overall improvement in export quality. As a result, Hypotheses 1–4, proposed above in the theoretical framework, are empirically validated.

5. Discussion

Firstly, in terms of research perspectives, this study examines the impact of the green credit interest subsidies policy on the export quality of green products. The benchmark regression results indicate that the policy has significantly improved the export quality of green products in those regions where it has been implemented. Further mechanism analysis reveals that the policy has enhanced the efficiency of financial resource allocation and alleviates firms’ financing constraints by reducing information asymmetries between exporting enterprises and financial institutions, thereby creating favorable conditions for upgrading export product quality. This finding is broadly aligned with the conclusions of Zhou et al. [19], who argue that China’s green financial policies have strengthened financial institutions’ risk assessment and strategic decision-making capabilities, thereby facilitating green development through improved capital support. However, Zhou et al.’s work primarily focuses on the financial supply side of green credit, without sufficiently addressing the structural financing challenges of green projects [19]. Green projects are typically characterized by long financing cycles, high investment risks, and delayed returns, which often result in a “maturity mismatch” for banks and, consequently, diminish their willingness to issue green loans. In this context, the introduction of a government fiscal subsidy mechanism—embedded in the green credit interest subsidies policy—serves not only as a form of implicit guarantee but also as an effective risk-sharing tool. This significantly enhances banks’ lending incentives, increases enterprises’ access to green credit, and provides robust financial support for companies that are improving the export quality of their green products. By incorporating the fiscal support dimension, this study concretizes the concept of fiscal and financial policy coordination in green finance. It further examines its causal effect on the export quality of China’s green products using a multi-period difference-in-differences model. This approach offers a novel empirical lens by which to evaluate how coordinated policy instruments can jointly facilitate the upgrading of export product quality.
Secondly, in terms of research methodology, this study leverages the latest statistical data released by China Customs and applies the KSW method to accurately measure the quality of HS6-level products exported from different regions of China to various destination countries over time [42]. Building on this method, a multi-period difference-in-differences (DID) model is employed to identify the causal impact of the green credit interest subsidy policy on the export quality of green products. Compared with prior studies that mainly rely on OLS regressions to test the relationship between green finance and export performance [6], the DID approach offers a more rigorous identification strategy by comparing changes in the outcome variable between the treatment and control groups before and after policy implementation. A key methodological innovation of this paper lies in its use of region-specific policy issuance timing and content to operationalize the concept of fiscal–financial policy coordination. This allows for a concrete examination of how such coordinated policies contribute to upgrading the export quality of green products. Furthermore, to ensure the robustness and credibility of the empirical findings, the regression models incorporate an extensive set of fixed effects—including year, product, industry, region, and destination country—as well as multiple-interaction fixed effects (e.g., year × product or region × product × country). Compared with existing studies employing multi-period difference-in-differences models to investigate environmental governance in the context of international trade [54], this paper incorporates these multidimensional fixed effects to mitigate potential biases from unobserved confounding factors and to improve the precision of causal estimation. Taken together, this study not only refines the methodological approach to evaluating green finance policies but also offers a practical framework for assessing the effects of fiscal and financial policy coordination. By anchoring the analysis in a robust empirical strategy, this paper advances the frontier of research on green development policy evaluation in emerging economies.
Finally, in terms of impact mechanisms, the above mechanism analysis demonstrates that the policy has significantly upgraded the export quality of green products through both export and import channels. Specifically, on the export side, the policy has enhanced the quality of green product exports in manufacturing by expanding the scale of green credit, boosting productivity, and promoting industrial upgrading. This finding is consistent with Gu et al. [7], who argue that green finance can optimize financial resource allocation and drive industrial structure upgrades. On the import side, the policy has also upgraded green product export quality by increasing the scale, variety, and quality of imported green intermediate products. This conclusion aligns with that of Chen et al. [55], who show that China’s integration into the global value chain has improved energy efficiency and supported green development. Distinguishing itself from prior research, this study systematically traces the pathways through which coordinated fiscal and financial policies—specifically the green credit subsidies interest policy—promote export quality upgrading from both the export and import perspectives. Beyond the empirical identification of these mechanisms, the study also incorporates firm-level case analyses to reinforce the explanatory depth and practical relevance of the findings. In practical terms, the mechanism results provide evidence-based guidance for local governments aiming to formulate more targeted and synergistic policy mixes in support of regional green transformation. For enterprises, the findings offer a reference framework for designing green-oriented upgrading strategies under evolving policy environments. Overall, by linking policy coordination with the green transformation of manufacturing exports in developing countries, this study addresses a critical gap in the literature. It also contributes to identifying viable pathways for export-led green transformation in developing economies and offers concrete lessons from China’s experience to inform global sustainable development efforts.
Although the green credit interest subsidies policy has clear advantages over traditional green fiscal subsidies or standalone green credit programs, it may also face several challenges in practice. However, some potential drawbacks remain. First, long-term reliance on interest subsidies may weaken firms’ internal motivations to innovate. Enterprises may become overly dependent on external incentives when making strategic decisions. Second, if banks fail to properly assess firms’ green credentials, rent-seeking behavior could emerge. Firms with political or market advantages may be more likely to have access to green credit, leading to inequality in terms of policy benefits. Finally, local fiscal constraints may create regional disparities in terms of subsidy access. This could affect both the fairness and sustainability of the policy. Therefore, in future policy design, governments should not only continue to support corporate green transitions but also focus on building robust institutional safeguards. For example, clearer standards for green project evaluation and improved transparency could help ensure more equitable and lasting policy outcomes.
In light of the Chinese government’s increased emphasis on corporate privacy protection, the General Administration of Customs ceased releasing detailed enterprise-level import and export data in 2017. While this measure has effectively enhanced data security, it has also constrained the timeliness and availability of micro-level data for empirical research. Concurrently, the green credit interest subsidies policy, officially introduced in 2016, is explicitly oriented toward promoting green development within enterprises. However, due to the unavailability of firm-level trade data, this study is unable to directly identify or quantify the specific behavioral responses of enterprises to the policy. This limitation restricts a deeper exploration of the policy’s underlying mechanisms and the accurate identification of heterogeneous effects. To address these challenges, future research can be expanded in two directions. Therefore, future research will be further expanded in the following two aspects. On the one hand, we will consider choosing suitable proxy variables or alternative datasets—such as the list of green factory enterprises released by the government or the data regarding listed companies engaged in export activities—to indirectly verify the relationship between the policy and the export performance of enterprises. On the other hand, we will adopt the approach of enterprise case studies by selecting representative firms and conducting in-depth analyses of the specific pathways through which the policy contributes to upgrading the quality of these firms’ green product exports at the enterprise level.

6. Research Findings and Policy Recommendations

Leveraging data from the World Bank Open Data, China Customs, and provincial panel data spanning 2011 to 2020, this study examines the impact and underlying mechanisms of green loan interest subsidies on the export quality of green products in the manufacturing sector. The results demonstrate that green loan interest subsidies significantly elevate the export quality of green products within the manufacturing industry. The mechanisms are twofold: on the export side, the policy scales up green credit availability, enhances productivity, and propels industrial upgrading. On the import side, it expands the scale, variety, and quality of imported green intermediate products, thereby driving overall quality improvement. This research provides critical insights for governments globally, in order to better coordinate fiscal and financial policies and accelerate the green transformation of exports.
The coordinated interplay between fiscal and financial policies is essential for catalyzing the green transformation and quality enhancement of corporate exports. This study concretizes the concept of coordination between fiscal and financial policies in the context of green policies and deeply examines the practical effects of coordinated green financial policies on the quality improvement of green product exports. From a global perspective, the development of green loan interest subsidies signifies China’s pioneering role in establishing a comprehensive green financial system, which helps mitigate global climate change and provides Chinese wisdom and solutions for sustainable global economic development. From the government’s perspective, the development of green loan interest subsidies enables regions to establish green policy systems that are coordinated with the central government’s top-level design, leveraging the guiding function of fiscal funds to create conditions for the quality upgrade of green product exports. From the banking perspective, the development of green loan interest subsidies enhances banks’ ability to identify information, ensures the accurate allocation of green credit funds, and alleviates the financing constraints of green product exporting enterprises, thereby facilitating the quality improvement of green product exports. Overall, the development of green loan interest subsidies has gradually provided an endogenous driving force for China to achieve green export transformation and upgrading, respond to changes in the external trade environment, and implement the United Nations Sustainable Development Goals.

Author Contributions

Conceptualization, J.S.; methodology, J.S. and J.L.; software, J.S.; validation, J.L.; formal analysis, J.S.; investigation, S.J., Y.L. and X.Y.; resources, X.Y.; data curation, X.Y.; writing—original draft preparation, J.S.; writing—review and editing, S.J., Y.L. and X.Y.; visualization, J.L.; supervision, J.L.; funding acquisition, J.L. All authors have read and agreed to the published version of the manuscript.

Funding

The authors declare that financial support was received for this article’s research, authorship, and publication. This work was supported by the Shandong Province Social Science Planning Research Program [Project Name: Study on the Optimization of Shandong’s New Productivity Layout by the Cycle of “Science and Technology and Industrial Finance”; Project No.: 24CJJJ36].

Institutional Review Board Statement

Not applicable.

Informed Consent Statement

Not applicable.

Data Availability Statement

All data can be obtained by email from the corresponding author.

Conflicts of Interest

The authors declare no conflicts of interest.

Appendix A

Table A1. Information on the implementation of the green loan interest subsidies policy.
AreaPolicy Implementation TimeName of Policy DocumentLink
Qinghai31 August 2016“General Program for the Construction of the Information Sharing System on Financial Support for Green Economic Development in Qinghai”https://dfjrj.qinghai.gov.cn/index.php?m=content&c=index&a=show&catid=33&id=2352 (accessed on 12 March 2025)
Hebei7 March 2017“The 13th Five-Year Plan for Ecological Environmental Protection in Hebei Province”https://hbepb.hebei.gov.cn/hbhjt/zwgk/fdzdgknr/guihuazongjie/guihua/101633000446767.html (accessed on 12 March 2025)
Xinjiang1 July 2017“Implementing Opinions on Building a Green Financial System in the Autonomous Region”https://www.xinjiang.gov.cn/xinjiang/gfxwj/201707/b2fc3507faa14247888e619a56b342ab.shtml (accessed on 12 March 2025)
Anhui23 August 2017“Opinions of the People’s Government of Anhui Province on Promoting Stable and Healthy Economic Development”https://www.gov.cn/xinwen/2017-04/17/content_5186347.htm#1 (accessed on 12 March 2025)
Beijing11 September 2017“Implementation Program on Building the Capital’s Green Financial System”https://www.beijing.gov.cn/zhengce/zhengcefagui/201905/t20190522_60487.html (accessed on 12 March 2025)
Chongqing7 November 2017“Chongqing Green Finance Development Plan (2017–2020) “https://www.docin.com/p-2052724305.html (accessed on 12 March 2025)
Hunan29 December 2017“Implementation Opinions on Promoting Green Financial Development in Hunan Province”https://lyj.hunan.gov.cn/ztzl/lshn_77586/201712/t20171229_4913612.html (accessed on 12 March 2025)
Gansu3 January 2018“Opinions of the General Office of Gansu Provincial People’s Government on Building a Green Financial System”https://www.gansu.gov.cn/gsszf/c100055/201801/100337/files/530a837943534be2b972d5a84da88ddb.pdf (accessed on 12 March 2025)
Sichuan18 January 2018“Sichuan Green All-Inclusive Development Plan”https://www.sc.gov.cn/10462/c103046/2018/1/23/3bb4ad88ea4e47e8abc70f7afde2122e.shtml (accessed on 12 March 2025)
Hainan29 March 2018“Hainan Province Green Full Integration Reform and Development Implementation Program”https://www.hainan.gov.cn/hainan/szfbgtwj/201804/29b3cc223a7143d888fb155f89b2385c.shtml (accessed on 12 March 2025)
Guizhou24 July 2018“Guidance on Green Finance to Facilitate Forestry Reform and Development”https://www.sino-gf.com.cn/3007/ (accessed on 12 March 2025)
Guangxi25 July 2018“Guangxi Zhuang Autonomous Region Finance Office and Other Departments on Building Green Financial System Implementation Opinions”http://www.gxzf.gov.cn/zfgb/2018nzfgb_35273/d15q_35326/zzqrmzfbgtwj_35327/t1512643.shtml (accessed on 12 March 2025)
Fujian29 September 2018“Implementation Opinions on Strengthening the Linkage of Green Finance and Environmental Credit Evaluation to Boost High-Quality Development”https://sthjj.quanzhou.gov.cn/xxgk/zfxxgkzl/zfxxgkml/fgwj/201809/t20180929_2148882.htm (accessed on 12 March 2025)
Jiangsu10 October 2018“Implementing Opinions on Further Promoting Green Financial Services and Ecological Environment for High Quality Development”https://czt.jiangsu.gov.cn/art/2018/10/10/art_51172_7836535.html (accessed on 12 March 2025)
Tibet14 November 2018“Tibet Autonomous Region “13th Five-Year” Energy Conservation and Emission Reduction Plan and Implementation Program”https://www.xizang.gov.cn/zwgk/xxfb/ghjh_431/201902/t20190223_61946.html (accessed on 12 March 2025)
Jilin4 November 2019“Several Opinions of the General Office of the Jilin Provincial People’s Government on Promoting the Development of Green Finance”https://xxgk.jl.gov.cn/szf/gkml/201911/t20191107_6134293.html (accessed on 12 March 2025)
Shanxi11 June 2020“Management Measures for the Use of Subsidized Funds for Clean Development Commissioned Loans in the Financial Sector”https://www.shanxi.gov.cn/zfxxgk/zfxxgkzl/zc/xzgfxwj/bmgfxwj1/szfzcbm_76475/sczt_76483/202211/t20221117_7445923.shtml (accessed on 12 March 2025)
Zhejiang27 July 2020“Zhejiang Provincial Department of Economy and Information Technology on accelerating the green development of manufacturing industry guidance”https://jxt.zj.gov.cn/art/2020/7/27/art_1582899_22232.html (accessed on 12 March 2025)
Shandong16 December 2020“Several measures on deepening the scientific and technological reform and attack”http://kjt.shandong.gov.cn/art/2020/12/18/art_13361_10164730.htl (accessed on 12 March 2025)
Guangdong24 June 2022“Circular of the General Office of the People’s Government of Guangdong Province on the Issuance of the Implementation Plan for the Development of Green Finance in Guangdong Province to Support Carbon Peak Action”https://www.gd.gov.cn/gdywdt/zwzt/kdyxtz/zcsd/content/post_4001599.html (accessed on 12 March 2025)
Ningxia1 February 2023“Notice of the General Office of the People’s Government of the Autonomous Region on the Issuance of the Implementation Program for the Year of Improving the Quality and Efficiency of Financial Services for the Real Economy”https://www.nx.gov.cn/zwgk/gfxwj/202302/t20230207_3946515.html (accessed on 12 March 2025)
Liaoning9 June 2024“Liaoning Provincial Implementation Program to Promote Large-Scale Equipment Replacement and Consumer Goods Trade-In”https://sthj.ln.gov.cn/sthj/zwdt/snyw/2024061211373772732/index.shtml (accessed on 12 March 2025)
Table A2. Green and brown product groupings.
Product ClassificationHS2002
Green product2402, 2403, 2716, 3902, 40, 41, 42, 43, 4820, 49, 62, 64, 65, 6601, 67, 73, 7411-7419, 7507, 7508, 7608–7616, 7805, 7806, 7906, 7907, 8006, 8007, 82, 83, 8401–8420, 8450, 8452, 8456–8468, 8480–8485, 8417, 8421, 8422, 8423, 8424–8449, 8451, 8453–8455, 8469, 8470, 8472, 8471, 8474–8479, 8501–8529, 8540–8543, 8573, 8530–8539, 8544–8548, 86–89, 9001–9033, 91, 92, 9401, 9402, 9403, 9404, 9405, 9406, 9506
Brown product1006, 15, 1518, 1520, 16, 17, 18, 19, 02, 20, 21, 23, 2209, 22, 2618, 2619, 2704, 2706–2715, 28, 29, 30, 31–38, 3901, 4002, 04, 44, 4503, 4504, 46, 47, 48, 50, 51, 52, 54, 55, 53, 56, 57, 58, 59, 68, 69, 70, 710, 711, 712, 72, 7401–7410, 7501–7506, 7601–7607, 7801–7804, 7901–7905, 8001–8005, 811, 812, 814, 902, 910, 9003, 9004
Notes: In HS2002 Customs product codes, the two-digit code is the Customs chapter classification code, and the three and four-digit codes are the Customs item classification codes.
Table A3. Variable definitions and descriptive statistics.
Variable NamesVariable SymbolsVariable DefinitionsObsMeanSDMinMax
Regression to baselineProduct quality of manufacturing exports ln q u a l i t y i d k t Logarithmic value of product quality plus 0.0001 for standardized manufacturing exports18,520,289−0.69840.6510−9.21030.0001
Policy implementation variable d i d i d t Interaction term between the green loan interest subsidies policy implementation variables and product grouping variables18,520,8490.11460.318501
GDP at the regional level ln g d p _ p r o i d i t Logarithmic value of GDP by region18,520,84910.39280.72066.415911.6187
Regional openness to the outside world ln o p e n _ p r o i d i t Logarithmic value of the ratio of total exports and imports to regional GDP by region18,520,849−1.11300.8483−2.87390.4042
Level of regional FDI ln f d i i t Logarithmic value of total FDI by region18,520,8499.57391.27295.979311.9153
Regional level of e-commerce ln E C i t Logarithmic value of e-commerce level in each region constructed by entropy weight method18,489,373−1.31940.7700−3.4567−0.2044
Regional level of green innovation g r e e n _ i n n o v a t i o n i t Green Innovation Efficiency across Regions as Measured by the Undesired Output Super-Efficiency SBM Model18,520,8490.66010.45140.04901.8238
GDP at the national level ln g d p _ c o u n t r y d t Logarithmic value of GDP per destination country17,971,2179.48261.95930.851914.2414
Level of openness to the outside world at the national level ln o p e n _ c o u n t r y d t Logarithm of the ratio of total exports and imports of each destination country to the gross domestic product of each destination country17,970,979−0.57710.5963−1.71001.0164
Country distance ln d i s i d t Logarithm of geographical distance from region to destination country weighted by regional export value18,476,6833.50741.5629−0.97377.1593
Free trade agreement R T A d t Free Trade Agreement with China dummy variable18,499,1960.25110.433601
Exchange rate fluctuations ln r a t e d t Exchange rates expressed in RMB, indirect method of valuation17,955,3721.15852.9754−2.91098.2752
Robustness analysesProduct quality of manufacturing exports (geographic distance instrumental variable) ln q u a l i t y _ d i s i d k t Logarithmic value of standardized manufacturing export product quality plus 0.0001 (geographic distance instrumental variable)18,520,287−0.76200.8596−6.90780.0010
Products’ green barriers to trade ln b a r r i e r s k t Logarithmic value of the number of foreign notifications of product-level technical barriers to trade plus one.18,520,8490.26840.470503.5323
Export tariffs on products ln d u t y k t Logarithmic value of export tariffs on products18,520,8492.14260.743204.1897
Product export tax rebate rate T a x k t Product export tax rebate rate18,520,8490.00940.034400.1976
Government environmental governance g o v i t The frequency of occurrence of environment-related words in regional government work reports in China and multiplied by 100.18,520,8490.95740.25680.36701.6761
Mechanism analysisScale of green credit G r e e n _ c r e d i t i t The inverse of the ratio of interest payments in energy-intensive industries to total interest payments in industrial industries in each region.18,520,8490.19660.33460.00021.8757
Total factor productivity ln t f p i t Logarithmic value of the DEA-Malmquist productivity index18,489,3730.05350.0235−0.27350.1155
Upgrading of industrial structure I S U P i t Ratio of tertiary sector to GDP by region18,520,8490.04610.083700.4882
Scale of imports of green intermediates ln v a l u e _ b e c i t Logarithmic value of import value of green intermediates by region16,707,23520.64182.88882.995725.3426
Types of green intermediates imported ln s i z e _ b e c i t Logarithmic value of import types of green intermediates by region16,707,2354.25521.344206.6425
Green intermediate import quality ln q u a l i t y _ b e c i t Logarithmic value of import quality of green intermediates plus 0.0001 for each region16,707,070−7.87331.0864−9.2103−4.5897

References

  1. Wang, S.; Tang, Y.; Du, Z.; Song, M. Export trade, embodied carbon emissions, and environmental pollution: An empirical analysis of China’s high-and new-technology industries. J. Environ. Manag. 2020, 276, 111371. [Google Scholar] [CrossRef]
  2. Campiglio, E. Beyond carbon pricing: The role of banking and monetary policy in financing the transition to a low-carbon economy. Ecol. Econ. 2016, 121, 220–230. [Google Scholar] [CrossRef]
  3. Dikau, S.; Volz, U. Central Banking, Climate Change and Green Finance; Working Paper 867; Asian Development Bank Institute: Tokyo, Japan, 2018. [Google Scholar]
  4. Khan, M.A.; Riaz, H.; Ahmed, M.; Saeed, A. Does green finance really deliver what is expected? An empirical perspective. Borsa Istanb. Rev. 2022, 22, 586–593. [Google Scholar] [CrossRef]
  5. Bordo, M.D.; Rousseau, P.L. Historical evidence on the finance-trade-growth nexus. J. Bank. Financ. 2012, 36, 1236–1243. [Google Scholar] [CrossRef]
  6. Ma, D.; Zhu, Y.; Yang, Y. How green finance affects export production quality: Fresh evidence from China. Energy Econ. 2024, 131, 107381. [Google Scholar] [CrossRef]
  7. Gu, B.; Chen, F.; Zhang, K. The policy effect of green finance in promoting industrial transformation and upgrading efficiency in China. Environ. Sci. Pollut. Res. 2021, 28, 47474–47491. [Google Scholar] [CrossRef]
  8. Taghizadeh-Hesary, F.; Yoshino, N. Sustainable solutions for green financing and investment in renewable energy projects. Energies 2020, 13, 788. [Google Scholar] [CrossRef]
  9. Tian, C.; Li, X.; Xiao, L.; Zhu, B. Exploring the impact of green credit policy on green transformation of heavy polluting industries. J. Clean. Prod. 2022, 335, 130257. [Google Scholar] [CrossRef]
  10. Zhao, S.; Abbassi, W.; Hunjra, A.I.; Zhang, H. How do government R&D subsidies affect corporate green innovation choices? Int. Rev. Econ. Financ. 2024, 93, 1378–1396. [Google Scholar]
  11. Fan, H.; Lai, E.L.C.; Li, Y.A. Credit constraints, quality, and export prices: Theory and evidence from China. J. Comp. Econ. 2015, 43, 390–416. [Google Scholar] [CrossRef]
  12. Santos, A.; Cincera, M. Determinants of financing constraints. Small Bus. Econ. 2022, 58, 1427–1439. [Google Scholar] [CrossRef]
  13. Konte, M.; Ndubuisi, G. Financial constraint, trust, and export performances: Firm-level evidence from Africa. J. Inst. Econ. 2021, 17, 583–605. [Google Scholar] [CrossRef]
  14. Andersen, D.C. Do credit constraints favor dirty production? Theory and plant-level evidence. J. Environ. Econ. Manag. 2017, 84, 189–208. [Google Scholar] [CrossRef]
  15. Azhgaliyeva, D.; Kapsaplyamova, Z.; Low, L. Implications of Fiscal and Financial Policies for Unlocking Green Finance and Green Investment; Working Paper 865; Asian Development Bank Institute: Tokyo, Japan, 2018. [Google Scholar]
  16. Manova, K.; Yu, Z. Multi-product firms and product quality. J. Int. Econ. 2017, 109, 116–137. [Google Scholar] [CrossRef]
  17. Cui, H.; Wang, R.; Wang, H. An evolutionary analysis of green finance sustainability based on multi-agent game. J. Clean. Prod. 2020, 269, 121799. [Google Scholar] [CrossRef]
  18. Liu, Z.; Zheng, S.; Zhang, X.; Mo, L. The impact of green finance on export technology complexity: Evidence from China. Sustainability 2023, 15, 2625. [Google Scholar] [CrossRef]
  19. Zhou, C.; Qi, S.; Li, Y. Can the green finance improve export green-sophistication? New insights from China. Environ. Sci. Pollut. Res. 2023, 30, 82927–82937. [Google Scholar] [CrossRef]
  20. Xu, L.; Tian, T. Blockchain-enabled enterprise bleaching green regulation banking evolution game analysis. Environ. Dev. Sustain. 2024, 26, 27457–27483. [Google Scholar] [CrossRef]
  21. Porter, M.E.; Linde, C. Toward a new conception of the environment-competitiveness relationship. J. Econ. Perspect. 1995, 9, 97–118. [Google Scholar] [CrossRef]
  22. Huang, Z.; Liao, G.; Li, Z. Loaning scale and government subsidy for promoting green innovation. Technol. Forecast. Soc. Change 2019, 144, 148–156. [Google Scholar] [CrossRef]
  23. Beck, T.; Levine, R.; Loayza, N. Finance and the sources of growth. J. Financ. Econ. 2000, 58, 261–300. [Google Scholar] [CrossRef]
  24. Wang, X.; Wang, Q. Research on the impact of green finance on the upgrading of China’s regional industrial structure. Resour. Policy 2021, 74, 102436. [Google Scholar] [CrossRef]
  25. Bas, M.; Strauss-Kahn, V. Input-trade liberalization, export prices and quality upgrading. J. Int. Econ. 2015, 95, 250–262. [Google Scholar] [CrossRef]
  26. Bas, M.; Berthou, A. The decision to import capital goods in India: Firms’ financial factors matter. World Bank Econ. Rev. 2012, 26, 486–513. [Google Scholar] [CrossRef]
  27. Nguyen, P.-H.; Dang, T.-T.; Nguyen, K.-A.; Pham, H.-A. Spherical fuzzy WASPAS-based entropy objective weighting for international payment method selection. Comput. Mater. Contin. 2022, 72, 2055–2075. [Google Scholar] [CrossRef]
  28. Wan, L.; Mao, Y.; Fu, Y.; Wan, X. The impact of intermediate product imports on industrial pollution emissions. PLoS ONE 2023, 18, e0292347. [Google Scholar] [CrossRef]
  29. Berthet, E.; Fusacchia, I. Navigating the complexity: The sustainability challenges in global value chains. Annu. Rev. Resour. Econ. 2024, 16, 349–377. [Google Scholar] [CrossRef]
  30. Romer, P.M. Endogenous technological change. J. Polit. Econ. 1990, 98 Pt 2, S71–S102. [Google Scholar] [CrossRef]
  31. Chen, J.; Siddik, A.B.; Zheng, G.-W.; Masukujjaman, M.; Bekhzod, S. The effect of green banking practices on banks’ environmental performance and green financing. Energies 2022, 15, 1292. [Google Scholar] [CrossRef]
  32. Eckel, C.; Iacovone, L.; Javorcik, B.; Neary, J.P. Multi-product firms at home and away: Cost-versus quality-based competence. J. Int. Econ. 2015, 95, 216–232. [Google Scholar] [CrossRef]
  33. Xu, M.; Zhong, T.; Xie, Q.; Liu, H. Foreign demand, competition strategy, and export markups: Evidence from Chinese multi-product exporters. China World Econ. 2022, 30, 187–209. [Google Scholar] [CrossRef]
  34. Wei, H.; Tu, Y.; Zhou, P. Technical barriers to trade and export performance: Comparing exiting and staying firms. Econ. Model. 2023, 126, 106439. [Google Scholar] [CrossRef]
  35. Wang, S.; Zhu, H. The adoption of international standards and export behavior of multi-product firms: A perspective based on differentiated competitive strategies. Econ. Anal. Policy 2025, 86, 351–362. [Google Scholar] [CrossRef]
  36. Buchanan, J.M. Public goods in theory and practice: A note on the Minasian-Samuelson discussion. J. Law Econ. 1967, 10, 193–197. [Google Scholar] [CrossRef]
  37. Yang, W.E.; Lai, P.W.; Han, Z.Q.; Tang, Z.P. Do government policies drive institutional preferences on green investment? Evidence from China. Environ. Sci. Pollut. Res. 2023, 30, 8297–8316. [Google Scholar] [CrossRef]
  38. Chen, X.; He, J.; Qiao, L. Does environmental regulation affect the export competitiveness of Chinese firms? J. Environ. Manag. 2022, 317, 115199. [Google Scholar] [CrossRef]
  39. Olasehinde-Williams, G.; Folorunsho, A. Environmental policy, green trade and sustainable development in Europe: New perspective on the Porter hypothesis. Energy Environ. 2023, 0958305X231193870. [Google Scholar] [CrossRef]
  40. Palmer, K.; Oates, W.E.; Portney, P.R. Tightening environmental standards: The benefit-cost or the no-cost paradigm? J. Econ. Perspect. 1995, 9, 119–132. [Google Scholar] [CrossRef]
  41. Card, D.; Krueger, A.B. Minimum wages and employment: A case study of the fast food industry in New Jersey and Pennsylvania. Am. Econ. Rev. 1993, 84, 772–793. [Google Scholar]
  42. Khandelwal, A. The long and short (of) quality ladders. Rev. Econ. Stud. 2010, 77, 1450–1476. [Google Scholar] [CrossRef]
  43. Brandt, L.; Whiting, S.H.; Zhang, L.; Zhang, T. Changing property-rights regimes: A study of rural land tenure in China. China Q. 2017, 232, 1026–1049. [Google Scholar] [CrossRef]
  44. Anderson, J.E. A theoretical foundation for the gravity equation. Am. Econ. Rev. 1979, 69, 106–116. [Google Scholar]
  45. Anwar, S.; Sun, S. Foreign direct investment and export quality upgrading in China’s manufacturing sector. Int. Rev. Econ. Financ. 2018, 54, 289–298. [Google Scholar] [CrossRef]
  46. Chai, J.W. The impact of green innovation on export quality. Appl. Econ. Lett. 2023, 30, 1279–1286. [Google Scholar] [CrossRef]
  47. Li, J.; Shi, J.; Cao, R.; Wu, J.; Liu, J. How e-commerce can boost China’s high-quality agricultural exports. Front. Sustain. Food Syst. 2024, 8, 1372129. [Google Scholar] [CrossRef]
  48. Sun, J.; Luo, Y.; Zhou, Y. The impact of regional trade agreements on the quality of export products in China’s manufacturing industry. J. Asian Econ. 2022, 80, 101456. [Google Scholar] [CrossRef]
  49. Jiang, W.; Sun, C. Exchange rate fluctuations and the quality of products imported by Chinese manufacturing firms. Emerg. Mark. Financ. Trade 2022, 58, 2751–2763. [Google Scholar] [CrossRef]
  50. Beck, T.; Levine, R.; Levkov, A. Big bad banks? The winners and losers from bank deregulation in the United States. J. Financ. 2010, 65, 1637–1667. [Google Scholar] [CrossRef]
  51. Goodman-Bacon, A. Difference-in-differences with variation in treatment timing. J. Econom. 2021, 225, 254–277. [Google Scholar] [CrossRef]
  52. De Chaisemartin, C.; d’Haultfoeuille, X. Two-way fixed effects estimators with heterogeneous treatment effects. Am. Econ. Rev. 2020, 110, 2964–2996. [Google Scholar] [CrossRef]
  53. Chen, Z.; Kahn, M.E.; Liu, Y.; Wang, Z. The consequences of spatially differentiated water pollution regulation in China. J. Environ. Econ. Manag. 2018, 88, 468–485. [Google Scholar] [CrossRef]
  54. Du, M.; Huang, C.; Liao, L. Trade liberalization and energy efficiency: Quasi-natural experiment evidence from the pilot free trade zones in China. Econ. Anal. Policy 2025, 85, 1739–1751. [Google Scholar] [CrossRef]
  55. Chen, G.; Cheng, S.; Gao, Q.; Li, B. How dual value chain embedding affects energy efficiency in China. Front. Environ. Sci. 2022, 10, 967470. [Google Scholar] [CrossRef]
Figure 1. Policy mechanism flowchart.
Sustainability 17 04375 g001
Figure 2. Trends in the quality of green versus brown product exports.
Sustainability 17 04375 g002
Figure 3. Trends in the export quality of green and brown products in areas where the green loan interest subsidies policy is implemented (left), versus areas where it is not implemented (right).
Sustainability 17 04375 g003
Figure 4. Parallel trend test.
Sustainability 17 04375 g004
Figure 5. Placebo test chart.
Sustainability 17 04375 g005
Table 1. Benchmark regression.
Robust Standard ErrorRegion and Industry Bidirectional
Clustering Robust Criterion Error
(1)(2)(3)(4)(5)(6)
Variableslnqualitylnqualitylnqualitylnqualitylnqualitylnquality
did0.1024 ***0.0958 ***0.0964 ***0.1024 ***0.0958 ***0.0964 ***
(0.0006)(0.0006)(0.0006)(0.0069)(0.0064)(0.0064)
lngdp_proid 0.1280 ***0.1200 *** 0.1280 ***0.1200 ***
(0.0040)(0.0041) (0.0432)(0.0433)
lnopen_proid 0.0403 ***0.0391 *** 0.0403 ***0.0391 ***
(0.0013)(0.0014) (0.0100)(0.0100)
lnfdi 0.0218 ***0.0217 *** 0.0218 ***0.0217 ***
(0.0007)(0.0007) (0.0057)(0.0057)
lnEC 0.0364 ***0.0358 *** 0.0364 ***0.0358 ***
(0.0014)(0.0014) (0.0085)(0.0086)
green_innovation 0.0070 ***0.0069 *** 0.00700.0069
(0.0008)(0.0008) (0.0061)(0.0062)
lngdp_country 0.0355 *** 0.0355 ***
(0.0011) (0.0038)
lnopen_country 0.0218 *** 0.0218 ***
(0.0009) (0.0022)
lndis −0.0077 *** −0.0077 *
(0.0007) (0.0039)
RTA 0.0091 *** 0.0091 ***
(0.0015) (0.0020)
lnrate −0.0115 *** −0.0115 ***
(0.0005) (0.0011)
year/product/industry/province/country
fixed effects
YYYYYY
year-product fixed effectsYYYYYY
province-product-country fixed effectsYYYYYY
Constant−0.7101 ***−2.1609 ***−2.3665 ***−0.7101 ***−2.1609 ***−2.3665 ***
(0.0001)(0.0420)(0.0437)(0.0008)(0.4390)(0.4346)
Observations18,520,28918,488,82317,767,87918,520,28918,488,82317,767,879
R-squared0.6480.6480.6480.6480.6480.648
Notes: *, **, *** denote significance at the 10%, 5%, and 1% statistical levels, respectively (the same apply in the table below). Robust standard errors are in parentheses in columns (1)–(3), and clustered robust standard errors at the region and industry levels are in parentheses in columns (4)–(6). Clustered robust standard errors at the region and industry levels are used in the table unless otherwise noted.
Table 2. Robustness analysis.
Expected EffectsQuality RecalculationRe-Identification Processing GroupBalance PanelOmitted VariablesPsm_did
(1)(2)(3)(4)(5)(6)(7)
Variableslnqualitylnquality_dlnqualitylnqualitylnqualitylnqualitylnquality
did_pre0.0207
(0.0140)
did0.0815 ***0.0186 ** 0.0663 ***0.0971 ***0.1014 ***0.1186 ***
(0.0111)(0.0092) (0.0013)(0.0063)(0.0059)(0.0153)
dids 0.0578 ***
(0.0086)
lnbarriers 0.0225 ***
(0.0046)
lnduty −0.0118 ***
(0.0021)
Tax −0.0420
(0.0280)
gov −0.0326 ***
(0.0049)
control variablesYYYYYYY
year/product/industry/province/country
fixed effects
YYYYYYY
year-product fixed effectsYYYYYYY
province-product-country fixed effectsYYYYYYY
Constant−2.3227−0.7641 ***−2.8867 ***−1.8192 ***−2.3326 ***−2.5013 ***−1.5942 ***
(1.3725)(0.0011)(0.4568)(0.0948)(0.4333)(0.4362)(0.3385)
Observations17,767,87918,520,28717,767,8795,211,33917,767,87917,767,8793,161,643
R-squared0.6480.6530.6470.5820.6480.6480.804
Notes: *, **, *** denote significance at the 10%, 5%, and 1% statistical levels, respectively. Clustered robust standard errors at the region and industry levels are used in the table.
Table 3. Spatial autocorrelation test.
Yearlnquality_Green_Productlnquality_Brown_Product
Moran’s IZMoran’s IZ
20110.0943.6670.1064.041
20120.0863.4340.1134.200
20130.0703.0080.1013.852
20140.0542.5750.0743.300
20150.0472.3390.0582.778
20160.0723.1210.0833.576
20170.1033.9970.1104.312
20180.1194.5660.1204.584
20190.1094.2830.1184.553
20200.1485.3060.1244.839
Table 4. Spatial spillover effect test (two-way fixed-effects spatial Durbin model).
Variableslnquality_Green_Productlnquality_Brown_Product
(1)(2)
ρ0.4108 ***0.4699 ***
(0.1436)(0.1317)
policy0.1207 **0.0842 ***
(0.0504)(0.0317)
W × policy0.7960 **0.5831 **
(0.3582)(0.2294)
control variablesYY
year/provinceYY
fixed effectsYY
Direct Effect0.1534 **0.1135 **
(0.0627)(0.0442)
Indirect Effect1.5745 *1.2942 *
(0.9014)(0.7712)
Total Effect1.7279 *1.4076 *
(0.0859)(0.8049)
N310310
R-squared0.44970.2155
Notes: *, **, *** denote significance at the 10%, 5%, and 1% statistical levels, respectively. Clustered robust standard errors at the region and industry levels are used in the table.
Table 5. Heterogeneity analysis.
Cost Competition StrategyQuality Competition StrategyWeak Policy Coordination GroupStrong Policy Coherence GroupCountries That Do Not Have Environmental Protection Clauses with ChinaCountries with Which China Has Signed Environmental Protection Clauses
(1)(2)(3)(4)(5)(6)
Variableslnqualitylnqualitylnqualitylnqualitylnqualitylnquality
did0.0970 ***0.2204 **0.0808 ***0.0987 ***0.0899 ***0.1230 ***
(0.0064)(0.0834)(0.0196)(0.0062)(0.0059)(0.0092)
control variablesYYYYYY
year/product/industry/province/country
fixed effects
YYYYYY
year-product fixed effectsYYYYYY
province-product-country fixed effectsYYYYYY
χ228.53136.14163.17
p-value0.00000.00000.0000
Constant−2.3969 ***−1.5622 ***−2.9735 ***−0.7436−2.3206 ***−2.4808 ***
(0.4489)(0.4969)(0.4970)(0.4875)(0.4003)(0.5880)
Observations16,983,616784,2634,139,48813,628,39114,305,6593,462,220
R-squared0.6470.6820.6940.6490.6550.639
Notes: *, **, *** denote significance at the 10%, 5%, and 1% statistical levels, respectively. Clustered robust standard errors at the region and industry levels are used in the table.
Table 6. Mechanism analysis.
Scale of Green Credit Total Factor Productivity Upgrading of Industrial Structure
(1) (2) (3) (4) (5) (6) (7) (8) (9)
Variables Green_credit lnquality lnquality lntfp lnquality lnquality ISUP lnquality lnquality
did0.0176 *** 0.0938 ***0.0024 * 0.0960 ***0.0046 ** 0.0939 ***
(0.0064) (0.0064)(0.0013) (0.0063)(0.0023) (0.0065)
Green_credit 0.1510 ***0.1453 ***
(0.0057)(0.0063)
lntfp 0.1989 ***0.1627 ***
(0.0559)(0.0563)
ISUP 0.5587 ***0.5369 ***
(0.0230)(0.0273)
control variablesYYYYYYYYY
year/product/industry/province/country
fixed effects
YYYYYYYYY
year-product fixed effectsYYYYYYYYY
province-product-country fixed effectsYYYYYYYYY
Constant−0.2898−3.3150 ***−2.3244 ***−0.0313−3.3757 ***−2.3614 ***0.0732−3.4006 ***−2.4058 ***
(0.3052)(0.4690)(0.4249)(0.0433)(0.4723)(0.4297)(0.0830)(0.4633)(0.4224)
Observations17,768,38317,767,87917,767,87917,768,38317,767,87917,767,87917,768,38317,767,87917,767,879
R-squared0.9220.6470.6480.6650.6470.6480.9150.6470.648
Sobel |Z|2.7352.1852.025
p-value0.00620.02890.0429
Bootstrap (50 times) confidence intervals[0.0025, 0.0026][0.0004, 0.0005][0.0021, 0.0022]
Scale of Imports of Green IntermediatesTypes of Green Intermediates ImportedGreen Intermediate Import Quality
(10)(11)(12)(13)(14)(15)(16)(17)(18)
Variableslnvalue_beclnqualitylnqualitylnsize_beclnqualitylnqualitylnquality_beclnqualitylnquality
did0.0147 *** 0.0966 ***0.1230 *** 0.0982 ***0.0234 *** 0.0967 ***
(0.0037) (0.0067)(0.0275) (0.0069)(0.0027) (0.0068)
lnvalue_bec 0.2451 ***0.2048 ***
(0.0292)(0.0262)
lnsize_bec 0.0280 ***0.0114 *
(0.0072)(0.0061)
lnquality_bec 0.2734 ***0.1264 ***
(0.0459)(0.0341)
control variablesYYYYYYYYY
year/product/industry/province/country
fixed effects
YYYYYYYYY
year-product fixed effectsYYYYYYYYY
province-product-country fixed effectsYYYYYYYYY
Constant5.4969 ***−4.8684 ***−3.5204 ***25.1027 ***−4.2261 ***−2.6797 ***1.4218 ***−3.8768 ***−2.5744 ***
(0.2489)(0.4975)(0.4599)(1.1211)(0.5339)(0.4948)(0.1713)(0.4972)(0.4716)
Observations16,189,96416,189,51516,189,51516,189,96416,189,51516,189,51516,189,96416,189,51516,189,515
R-squared0.9810.6440.6450.9920.6440.6450.9180.6440.645
Sobel |Z|3.5541.7103.416
p-value0.00040.08730.0006
Bootstrap (50 times) confidence intervals[0.0009, 0.0012][0.0007, 0.0008][0.0045, 0.0048]
Notes: *, **, *** denote significance at the 10%, 5%, and 1% statistical levels, respectively. Clustered robust standard errors at the region and industry levels are used in the table.
Disclaimer/Publisher’s Note: The statements, opinions and data contained in all publications are solely those of the individual author(s) and contributor(s) and not of MDPI and/or the editor(s). MDPI and/or the editor(s) disclaim responsibility for any injury to people or property resulting from any ideas, methods, instructions or products referred to in the content.

