
Investigating Subcontracting Partnership in Sustainable Urban Transportation System Design


Abstract
1. Introduction
2. Literature Review
2.1. The Role of Partnership in the Project Design

| Success Factor | References |
|---|---|
| 1. Effective Communication | [27,28] |
| 2. Technical Expertise | [29,30] |
| 3. Win-Win Attitude | [18,31] |
| 4. Goal Alignment | [21,32] |
| 5. Commitment to Quality | [30,33] |
| 6. Mutual Trust | [26,34] |
| 7. Continuous Improvement | [19,26] |
| 8. Flexibility to Change | [19,27] |
| 9. Good Cultural Fit | [35,36] |
| 10. Questioning Attitude | [19,31] |
| 11. Resource Sharing | [27,30] |
| 12. Top Management Support | [37,38] |
| 13. Clear Definition of Responsibilities | [18,28] |
| 14. Generation of Innovative Ideas | [18,39] |
| 15. Effective Problem Solving | [26,40] |
| 16. Risk Sharing | [19,41] |
| 17. Long-Term Perspective | [28,38] |
| 18. Performance Measurement | [17,42] |
| 19. Cost Reduction | [19,43] |
2.2. Performance Assessment of Design Work
2.3. Evaluation Methods for Partnerships in the Construction Industry
3. Methodology
3.1. Data Collection Methods
3.1.1. Questionnaire Design
3.1.2. Pilot Survey and Final Distribution
3.1.3. Regional Coverage
3.1.4. Cultural Diversity Considerations
3.2. Data Analysis Methods
3.2.1. Basics of Factor Analysis Methods
3.2.2. Hypothetical Path Model Construction
3.2.3. Structural Equation Modeling (SEM) Analysis
- Measurement model analysis
- Structural model analysis
4. Results
4.1. Survey Results
4.2. Factor Analysis
4.3. Hypothetical Path Model
4.4. SEM Analysis
4.4.1. Measurement Model Analysis
4.4.2. Structural Model Analysis
5. Discussion
5.1. Interpretation of Key Findings
5.2. Practical Implications for Urban Transportation Projects
5.3. Theoretical Contributions
5.4. Limitations
6. Conclusions
Author Contributions
Funding
Institutional Review Board Statement
Informed Consent Statement
Data Availability Statement
Acknowledgments
Conflicts of Interest
Abbreviations
| AGFI | Adjusted Goodness-of-Fit Index |
| AVE | Average Variance Extracted |
| BIM | Building Information Modeling |
| CFI | Comparative Fit Index |
| CR | Composite Reliability |
| CSFs | Critical Success Factors |
| CV | Collaborative Vision |
| Dual Carbon | Carbon Peak and Carbon Neutrality |
| EQ | Excellence Quality |
| GFI | Goodness-of-Fit Index |
| IC | Interactive Collaboration |
| IFI | Incremental Fit Index |
| KMO | Kaiser-Meyer-Olkin |
| M | Performance Metric |
| NFI | Normed Fit Index |
| RFI | Relative Fit Index |
| RMSEA | Root Mean Square Error of Approximation |
| RS | Risk Strategy |
| SEM | Structural Equation Modeling |
| SI | Strategic Innovation |
| SV | Success Variable |
| TLI | Tucker-Lewis Index |
References
- Lin, D.; Nelson, J.D.; Beecroft, M.; Cui, J. Understanding China’s Metro Development: A Comparative Regional Analysis. Res. Transp. Bus. Manag. 2023, 47, 100940. [Google Scholar] [CrossRef]
- Lu, K.; Zhang, L.; Li, S.; Huang, Y.; Ding, X.; Hao, J.; Huang, S.; Li, X.; Lu, F.; Zhang, H. Urban Rail Transit in China: Progress Report and Analysis (2015–2023). Urban Rail Transit 2025, 11, 1–27. [Google Scholar] [CrossRef]
- Chen, B.; Su, M. Complex Characteristics and Robustness Analysis of Urban Rail Transit Network. In Proceedings of the International Conference on Smart Transportation and City Engineering (STCE 2023), Chongqing, China, 16–18 December 2023; Mikusova, M., Ed.; SPIE: Bellingham, WA, USA, 2024; p. 115. [Google Scholar]
- Pan, Z.W. Research on the Construction Cost Overrun Problem and Countermeasures of Metro Construction Project in China. Master’s Thesis, Suzhou University of Science and Technology, Suzhou, China, 2019. [Google Scholar]
- Yuan, Z.; Yuan, X.; Yang, Y.; Chen, J.; Nie, Y.; Cao, M.; Chen, L. Greenhouse Gas Emission Analysis and Measurement for Urban Rail Transit: A Review of Research Progress and Prospects. Digit. Transp. Saf. 2023, 2, 36–51. [Google Scholar] [CrossRef]
- Bragança, L.; Vieira, S.M.; Andrade, J.B. Early Stage Design Decisions: The Way to Achieve Sustainable Buildings at Lower Costs. Sci. World J. 2014, 2014, 365364. [Google Scholar] [CrossRef] [PubMed]
- Zhang, Y. A Brief Discussion on Subcontract Management in Urban Rail Transit Engineering Design General Contract Projects. Build. Mater. Decor. 2022, 105–108. [Google Scholar] [CrossRef]
- Zhang, S.B.; Chen, J.; Fu, Y. Contract Complexity and Trust in Construction Project Subcontracting. Eng. Constr. Arch. Manag. 2020, 27, 2477–2500. [Google Scholar] [CrossRef]
- ENR Global Best Projects 2020 Award of Merit, Rail: Universal Studios Station of the Extension Line of Beijing Metro Line 7. Available online: https://www.enr.com/articles/50081-award-of-merit-rail-universal-studios-station-of-the-extension-line-of-beijing-metro-line-7 (accessed on 1 April 2025).
- Jia, C.; Wang, X.; Qian, C.; Cao, Z.; Zhao, L.; Lin, L. Quantitative Study on the Environmental Impact of Beijing’s Urban Rail Transit Based on Carbon Emission Reduction. Sci. Rep. 2025, 15, 2380. [Google Scholar] [CrossRef]
- Aglietta, M. The 14th Five-Year Plan in the New Phase of Chinese Reform. GREEN 2021, 1, 28–33. [Google Scholar]
- Zheng, C.; Ning, Y.; Yuan, J.; Zhao, X.; Zhang, Y. Partnering Research within the Construction Industry (1990-2018): A Scientometric Review. Int. J. Technol. Manag. 2020, 82, 97–131. [Google Scholar] [CrossRef]
- Huth, M. Residential Construction Academy: Basic Principles for Construction, 4th ed.; Cengage Learning: Independence, KY, USA, 2012; pp. 5–25. [Google Scholar]
- Lahdenperä, P. Making Sense of the Multi-Party Contractual Arrangements of Project Partnering, Project Alliancing and Integrated Project Delivery. Constr. Manag. Econ. 2012, 30, 57–79. [Google Scholar] [CrossRef]
- Manley, T.; Shaw, W.; Manley, R. Project Partnering: A Medium for Private and Public Sector Collaboration. IEEE Eng. Manag. Rev. 2008, 19, 14. [Google Scholar] [CrossRef]
- Du, L.; Tang, W.; Liu, C.; Wang, S.; Wang, T.; Shen, W.; Huang, M.; Zhou, Y. Enhancing Engineer–Procure–Construct Project Performance by Partnering in International Markets: Perspective from Chinese Construction Companies. Int. J. Proj. Manag. 2016, 34, 30–43. [Google Scholar] [CrossRef]
- Meng, X. The Effect of Relationship Management on Project Performance in Construction. Int. J. Proj. Manag. 2012, 30, 188–198. [Google Scholar] [CrossRef]
- Chan, A.P.C.; Chan, D.W.M.; Chiang, Y.H.; Tang, B.S.; Chan, E.H.W.; Ho, K.S.K. Exploring Critical Success Factors for Partnering in Construction Projects. J. Constr. Eng. Manag. 2004, 130, 188–198. [Google Scholar] [CrossRef]
- Black, C.; Akintoye, A.; Fitzgerald, E. An Analysis of Success Factors and Benefits of Partnering in Construction. Int. J. Proj. Manag. 2000, 18, 423–434. [Google Scholar] [CrossRef]
- Fong, P.S.W.; Lung, B.W.C. Interorganizational Teamwork in the Construction Industry. J. Constr. Eng. Manag. 2007, 133, 157–168. [Google Scholar] [CrossRef]
- Szewczyk, B.; Radziszewska-Zielina, E. IT-Based Control and Assessment of Partnering Relations in Construction Projects—ScienceDirect. Autom. Constr. 2020, 116, 103201. [Google Scholar] [CrossRef]
- Tan, Y.; Xue, B.; Cheung, Y.T. Relationships between Main Contractors and Subcontractors and Their Impacts on Main Contractor Competitiveness: An Empirical Study in Hong Kong. J. Constr. Eng. Manag. 2017, 143, 05017007. [Google Scholar] [CrossRef]
- Da Fonseca-Soares, D.; Eliziário, S.A.; Galvinicio, J.D.; Ramos-Ridao, A.F. Life-Cycle Greenhouse Gas (GHG) Emissions Calculation for Urban Rail Transit Systems: The Case of Pernambuco Metro. Appl. Sci. 2023, 13, 8965. [Google Scholar] [CrossRef]
- Barsam, J.-M.; Harris, D.; Hooper, A. Crossrail Project: Engineering Design Management on the Elizabeth Line, London. Proc. Inst. Civ. Eng. Civ. Eng. 2017, 170, 15–22. [Google Scholar] [CrossRef]
- Nguyen, T.; Chileshe, N.; Ho, D.T.; Nguyen, V.T.; Tran, Q.P. Significant Risks That Trigger Cost Overruns and Delays in Urban Rail Projects: A Typical Case Study of Vietnam. Built Environ. Proj. Asset Manag. 2024, 14, 278–295. [Google Scholar] [CrossRef]
- Tang, W.; Duffield, C.F.; Young, D.M. Partnering Mechanism in Construction: An Empirical Study on the Chinese Construction Industry. J. Constr. Eng. Manag. 2006, 132, 217–229. [Google Scholar] [CrossRef]
- Chen, W.T.; Chen, T.-T.; Sheng Lu, C.; Liu, S.-S. Analyzing Relationships among Success Variables of Construction Partnering Using Structural Equation Modeling: A Case Study of Taiwan’s Construction Industry. J. Civ. Eng. Manag. 2012, 18, 783–794. [Google Scholar] [CrossRef]
- Doğan, S.Z.; Çalğici, P.K.; Arditi, D.; Günaydin, H.M. Critical Success Factors of Partnering in the Building Design Process. METU J. Fac. Archit. 2016, 32, 61–78. [Google Scholar] [CrossRef]
- Vijayabanu, C.; Vignesh, T. Critical Factors Determining the Success of Public-Private Partnership in Construction Projects: An Indian Context. J. Mod. Proj. Manag. 2018, 5, 24–39. [Google Scholar] [CrossRef]
- Chen, W.T.; Chen, T.-T. Critical Success Factors for Partnering in Taiwan. Int. J. Proj. Manag. 2007, 25, 475–484. [Google Scholar] [CrossRef]
- Awodele, O.A.; Ogunsemi, D.R. An Assessment of Success Factors and Benefits of Project Partnering in Nigerian Construction Industry. Available online: https://www.irbnet.de/daten/iconda/CIB_DC24253.pdf (accessed on 1 April 2025).
- Nevstad, K.; Børve, S.; Karlsen, A.T.; Aarseth, W. Understanding How to Succeed with Project Partnering. Int. J. Manag. Proj. Bus. 2018, 11, 1044–1065. [Google Scholar] [CrossRef]
- Garbharran, H.; Govender, J.; Msani, T. Critical Success Factors Influencing Project Success in the Construction Industry. Acta Structilia 2012, 19, 90–108. [Google Scholar] [CrossRef]
- Khan, A. Global Outsourcing in Landscape Architecture: A Study of Current and Future Trends and Effects. Master’s Thesis, The University of Texas at Arlington, Arlington, TX, USA, 2007. [Google Scholar]
- Chen, T.-T.; Kao, C.-H. A Study of Identifying Success Variables for Construction Partnering via SEM Framework. J. Mar. Sci. Technol. 2010, 18, 629–636. [Google Scholar] [CrossRef]
- Rahman, S.H.A.; Endut, I.R.; Faisol, N.; Paydar, S. The Importance of Collaboration in Construction Industry from Contractors’ Perspectives. Procedia Soc. Behav. Sci. 2014, 129, 414–421. [Google Scholar] [CrossRef]
- Cheng, E.W.L.; Li, H. Construction Partnering Process and Associated Critical Success Factors: Quantitative Investigation. J. Manag. Eng. 2002, 18, 194–202. [Google Scholar] [CrossRef]
- Cheng, E.W.L.; Li, H.; Love, P.E.D. Establishment of Critical Success Factors for Construction Partnering. J. Manag. Eng. 2000, 16, 84–92. [Google Scholar] [CrossRef]
- Abdul Nifa, F.A. Development of a Framework for Partnering Through Aligning Organizational Cultures in the Malaysian Construction Industry. Ph.D. Thesis, The University of Salford, Salford, UK, 2013. [Google Scholar]
- Bygballe, L.E.; Jahre, M.; SwäRd, A. Partnering Relationships in Construction: A Literature Review. J. Purch. Supply Manag. 2010, 16, 239–253. [Google Scholar] [CrossRef]
- Eren, K. Critical Success Factors for Partnering in the Turkish Construction Industry. In Proceedings of the 24th Annual ARCOM Conference, Cardiff, UK, 1–3 September 2008; pp. 1013–1022. [Google Scholar]
- Thomas, G.; Thomas, M. Construction Partnering and Integrated Teamworking, 1st ed.; Blackwell Publishing Ltd.: Oxford, UK, 2008; pp. 11–15. [Google Scholar]
- Bresnen, M.; Marshall, N. Partnering in Construction: A Critical Review of Issues, Problems and Dilemmas. Constr. Manag. Econ. 2000, 18, 229–237. [Google Scholar] [CrossRef]
- He, X.; Tim, B.; Selçuk, Ç.M. Trust and Collaboration Problems in Building Information Modelling (BIM): A Systematic Literature Review. In Proceedings of the European Group for Intelligent Computing in Engineering (EG-ICE), London, UK, 4–7 July 2023. [Google Scholar]
- Waqar, A.; Mateen Khan, A.; Othman, I. Blockchain Empowerment in Construction Supply Chains: Enhancing Efficiency and Sustainability for an Infrastructure Development. J. Infrastruct. Intell. Resil. 2024, 3, 100065. [Google Scholar] [CrossRef]
- Monga, M.H. Factors Affecting the Successful Completion of Projects. Master’s Thesis, University of Johannesburg, Johannesburg, South Africa, 2018. [Google Scholar]
- Mokoena, T.S.; Pretorius, J.H.C.; Van Wyngaard, C.J. Triple Constraint Considerations in the Management of Construction Projects. In Proceedings of the 2013 IEEE International Conference on Industrial Engineering and Engineering Management, Bangkok, Thailand, 10–13 October 2013. [Google Scholar] [CrossRef]
- Nevstad, K.; Madsen, T.K.; Eskerod, P.; Aarseth, W.K.; Karlsen, A.S.T.; Andersen, B. Linking Partnering Success Factors to Project Performance-Findings from Two Nation-Wide Surveys. Proj. Leadersh. Soc. 2021, 2, 100009. [Google Scholar] [CrossRef]
- Müller, R.; Jugdev, K. Critical Success Factors in Projects: Pinto, Slevin, and Prescott–the Elucidation of Project Success. Int. J. Manag. Proj. Bus. 2012, 5, 757–775. [Google Scholar] [CrossRef]
- Albert, M.; Balve, P.; Spang, K. Evaluation of Project Success: A Structured Literature Review. Int. J. Manag. Proj. Bus. 2017, 10, 796–821. [Google Scholar] [CrossRef]
- Othman, A.A.E. An International Index for Customer Satisfaction in the Construction Industry. Int. J. Constr. Manag. 2015, 15, 33–58. [Google Scholar] [CrossRef]
- Budawara, N. Key Performance Indicators to Measure Design Performance in Construction. Ph.D. Thesis, Concordia University, Montreal, QC, Canada, 2009. [Google Scholar]
- Alanazi, F.; Alenezi, M. Interoperability for Intelligent Traffic Management Systems in Smart Cities. Int. J. Electr. Comput. Eng. (IJECE) 2024, 14, 1864. [Google Scholar] [CrossRef]
- Atalay, H.; Zeren Gülersoy, N. Developing Social Sustainability Criteria and Indicators in Urban Planning: A Holistic and Integrated Perspective. Iconarp Int. J. Arch. Plan. 2023, 11, 1–23. [Google Scholar] [CrossRef]
- Roberts, M.; Allen, S.; Coley, D. Life Cycle Assessment in the Building Design Process—A Systematic Literature Review. Build. Environ. 2020, 185, 107274. [Google Scholar] [CrossRef]
- Kim, S.-Y.; Nguyen, V.T. An AHP Framework for Evaluating Construction Supply Chain Relationships. KSCE J. Civ. Eng. 2018, 22, 1544–1556. [Google Scholar] [CrossRef]
- Noorizadeh, A. Supplier Evaluation and Development in Construction: Data-Driven Analyses. Ph.D. Thesis, Aalto University, Espoo, Finland, 2021. [Google Scholar]
- Zhang, X.; Goh, M.; Bai, S.; Wang, Q. Green, Resilient, and Inclusive Supplier Selection Using Enhanced BWM-TOPSIS with Scenario-Varying Z-Numbers and Reversed PageRank. Inf. Sci. 2024, 674, 120728. [Google Scholar] [CrossRef]
- Yang, J.; Thuc, L.D.; Kim, S.Y. Critical Success Factors of Public–Private Partnership Infrastructure Projects from a Middle-Income Country: A Comparison with Countries in Asia. J. Urban Plann. Dev. 2024, 150, 05024023. [Google Scholar] [CrossRef]
- Malik, S.; Taqi, M.; Martins, J.M.; Mata, M.N.; Pereira, J.M.; Abreu, A. Exploring the Relationship between Communication and Success of Construction Projects: The Mediating Role of Conflict. Sustainability 2021, 13, 4513. [Google Scholar] [CrossRef]
- Faris, H.; Gaterell, M.; Hutchinson, D. Investigating Underlying Factors of Collaboration for Construction Projects in Emerging Economies Us. Int. J. Constr. Manag. 2019, 22, 514–526. [Google Scholar] [CrossRef]
- Adu Gyamfi, T.; Aigbavboa, C.O.; Thwala, W.D. Risk Resources Management Influence on Public–Private Partnership Risk Management in Construction Industry. Confirmatory Factor Analysis Approach. J. Eng. Des. Technol. 2024, 22, 1544–1569. [Google Scholar] [CrossRef]
- Sun, J.; Ren, X.; Anumba, C.J. Analysis of Knowledge-Transfer Mechanisms in Construction Project Cooperation Networks. J. Manag. Eng. 2019, 35, 04018061. [Google Scholar] [CrossRef]
- Almarri, K.; Boussabaine, H. Critical Success Factors for Public–Private Partnerships in Smart City Infrastructure Projects. Constr. Innov. 2025, 25, 224–247. [Google Scholar] [CrossRef]
- Hai, D.T. Critical Success Factors for Implementing PPP Infrastructure Projects in Developing Countries: The Case of Vietnam. Innov. Infrastruct. Solut. 2022, 7, 89. [Google Scholar] [CrossRef]
- Liu, H.; Liu, Y.; Hua, J.; Chen, C.; Xie, S. Research on Key Success Factors of China’s Urban Rail Transit PPP Project Based on SEM. In Proceedings of the ICCREM 2023, Xi’an, China, 23–24 September 2023; American Society of Civil Engineers: Reston, VA, USA, 2023; pp. 1090–1099. [Google Scholar]
- Lawley, D.N.; Maxwell, A.E. Factor Analysis as a Statistical Method. J. R. Stat. Soc. Ser. D (Stat.) 1962, 12, 209–229. [Google Scholar] [CrossRef]
- Hoyle, R.H. Handbook of Structural Equation Modeling, 1st ed.; The Guilford Press: New York, NY, USA, 2012; pp. 361–690. [Google Scholar]
- Liu, B.; Sun, X. Application Analysis of BIM Technology in Metro Rail Transit. IOP Conf. Ser. Earth Environ. Sci. 2018, 128, 012028. [Google Scholar] [CrossRef]
- North, D.C. Institutions, Institutional Change and Economic Performance, 1st ed.; Cambridge University Press: Cambridge, UK, 1990; pp. 90–110. [Google Scholar]
- Cheng, M.; Chong, H.-Y.; Xu, Y. Blockchain-Smart Contracts for Sustainable Project Performance: Bibliometric and Content Analyses. Environ. Dev. Sustain. 2023, 26, 8159–8182. [Google Scholar] [CrossRef]
- Lee, K.-T.; Ahn, H.; Kim, J.-H. Project Coordinators’ Perceptions According to the Organization Structure to Reduce Communication Risks in Multinational Project. KSCE J. Civ. Eng. 2023, 27, 915–929. [Google Scholar] [CrossRef]
- Paul, S.; Cao, C. Brief Introduction of ISO 19650 Series-the Latest International Standard for BIM. J. Inf. Technol. Civ. Eng. Archit. 2019, 11, 134–138. [Google Scholar]


| Category | Indicator Description | Number of Respondents | Percentage (%) |
|---|---|---|---|
| Age | 20–30 years | 55 | 24.6% |
| 31–40 years | 77 | 34.5% | |
| 41–50 years | 68 | 30.5% | |
| Over 50 years | 23 | 10.4% | |
| Gender | Male | 151 | 67.7% |
| Female | 72 | 32.3% | |
| Position | Management of Design Institutes | 81 | 36.3% |
| Project Managers | 69 | 30.9% | |
| Designers | 73 | 32.8% | |
| Education Level | High School/Technical Secondary School | 0 | 0 |
| College | 27 | 12.1% | |
| Bachelor | 147 | 65.9% | |
| Graduate and Above | 49 | 22.0% | |
| Work Experience | 0–5 years | 38 | 17.0% |
| 6–10 years | 76 | 34.1% | |
| 11–20 years | 68 | 30.5% | |
| Over 21 years | 41 | 18.4% | |
| Regional Cultural Background | Eastern coastal areas | 58 | 26.0% |
| Central regions | 60 | 26.9% | |
| Western regions | 53 | 23.8% | |
| Northeast regions | 52 | 23.3% | |
| Educational Cultural Background | Mainland China | 173 | 77.6% |
| Hong Kong, Macao, and Taiwan regions of China | 23 | 10.3% | |
| European and American countries | 22 | 9.9% | |
| Other countries | 5 | 2.2% |
| Category | Factor | Mean Value | Standard Deviation |
|---|---|---|---|
| Partnership Variables | Effective Communication (SV1) | 3.79 | 1.019 |
| Technical Expertise (SV2) | 3.71 | 1.139 | |
| Win-Win Attitude (SV3) | 3.50 | 1.048 | |
| Goal Alignment (SV4) | 3.69 | 0.995 | |
| Commitment to Quality (SV5) | 3.54 | 1.025 | |
| Mutual Trust (SV6) | 3.65 | 1.075 | |
| Continuous Improvement (SV7) | 3.77 | 1.165 | |
| Flexibility to Change (SV8) | 3.63 | 1.086 | |
| Good Cultural Fit (SV9) | 3.80 | 1.130 | |
| Questioning Attitude (SV10) | 3.82 | 0.985 | |
| Resource Sharing (SV11) | 3.77 | 1.118 | |
| Top Management Support (SV12) | 4.00 | 1.038 | |
| Clear Definition of Responsibilities (SV13) | 3.52 | 1.056 | |
| Generation of Innovative Ideas (SV14) | 3.91 | 0.933 | |
| Effective Problem Solving (SV15) | 3.70 | 1.101 | |
| Risk Sharing (SV16) | 3.66 | 1.056 | |
| Long-Term Perspective (SV17) | 3.86 | 1.017 | |
| Performance Measurement (SV18) | 3.53 | 1.122 | |
| Cost Reduction (SV19) | 4.04 | 0.967 | |
| Design Performance | Design Quality (M1) | 3.87 | 1.003 |
| Design Schedule (M2) | 3.93 | 1.050 | |
| Cost-Effectiveness (M3) | 3.96 | 0.990 |
| Factor | Initial Eigenvalues | Rotation Sum of Squared Loadings | ||||
|---|---|---|---|---|---|---|
| Total | Variance Percentage | Cumulative % | Total | Variance Percentage | Cumulative % | |
| F1 | 5.710 | 30.053 | 30.053 | 3.366 | 17.714 | 17.714 |
| F2 | 2.667 | 14.037 | 44.090 | 2.762 | 14.538 | 32.253 |
| F3 | 1.866 | 9.821 | 53.911 | 2.712 | 14.271 | 46.524 |
| F4 | 1.638 | 8.620 | 62.531 | 2.193 | 11.544 | 58.068 |
| F5 | 1.246 | 6.559 | 69.090 | 2.094 | 11.022 | 69.090 |
| Variables | Principal Factor | ||||
|---|---|---|---|---|---|
| F1 | F2 | F3 | F4 | F5 | |
| SV1 | 0.251 | 0.764 | 0.261 | 0.025 | 0.152 |
| SV2 | 0.156 | 0.203 | 0.226 | 0.115 | 0.762 |
| SV3 | 0.087 | 0.048 | 0.754 | 0.205 | 0.132 |
| SV4 | −0.016 | 0.166 | 0.781 | 0.134 | −0.026 |
| SV5 | 0.779 | 0.233 | 0.079 | 0.139 | −0.016 |
| SV6 | 0.215 | 0.737 | 0.151 | 0.063 | 0.030 |
| SV7 | 0.794 | 0.057 | −0.037 | 0.093 | 0.033 |
| SV8 | 0.048 | 0.052 | 0.807 | 0.084 | 0.103 |
| SV9 | 0.156 | 0.786 | 0.080 | 0.017 | 0.135 |
| SV10 | 0.793 | 0.136 | 0.081 | 0.027 | 0.203 |
| SV11 | 0.090 | 0.821 | 0.029 | 0.126 | 0.083 |
| SV12 | 0.127 | 0.059 | −0.048 | 0.056 | 0.811 |
| SV13 | 0.092 | 0.057 | 0.234 | 0.820 | −0.001 |
| SV14 | 0.029 | 0.093 | 0.110 | −0.013 | 0.839 |
| SV15 | 0.820 | 0.147 | −0.011 | 0.031 | 0.091 |
| SV16 | 0.102 | 0.028 | 0.250 | 0.773 | 0.074 |
| SV17 | 0.102 | 0.246 | 0.777 | 0.285 | 0.079 |
| SV18 | 0.771 | 0.173 | 0.146 | 0.091 | 0.081 |
| SV19 | 0.107 | 0.116 | 0.114 | 0.837 | 0.070 |
| Indicator | Loading | α | CR | AVE |
|---|---|---|---|---|
| F1 | 0.872 | 0.874 | 0.581 | |
| SV5 | 0.780 | |||
| SV7 | 0.714 | |||
| SV10 | 0.771 | |||
| SV15 | 0.781 | |||
| SV18 | 0.762 | |||
| F2 | 0.834 | 0.836 | 0.561 | |
| SV1 | 0.838 | |||
| SV6 | 0.692 | |||
| SV9 | 0.730 | |||
| SV11 | 0.728 | |||
| F3 | 0.834 | 0.881 | 0.651 | |
| SV3 | 0.710 | |||
| SV4 | 0.699 | |||
| SV8 | 0.679 | |||
| SV17 | 0.884 | |||
| F4 | 0.801 | 0.803 | 0.577 | |
| SV13 | 0.802 | |||
| SV16 | 0.722 | |||
| SV19 | 0.752 | |||
| F5 | 0.770 | 0.770 | 0.532 | |
| SV2 | 0.858 | |||
| SV12 | 0.616 | |||
| SV14 | 0.693 | |||
| M | 0.856 | 0.857 | 0.666 | |
| M1 | 0.846 | |||
| M2 | 0.808 | |||
| M3 | 0.794 |
| Factors | F1 | F2 | F3 | F4 | F5 | M |
|---|---|---|---|---|---|---|
| F1 | 0.762 | |||||
| F2 | 0.413 * | 0.749 | ||||
| F3 | 0.191 * | 0.333 * | 0.747 | |||
| F4 | 0.242 * | 0.217 * | 0.456 * | 0.760 | ||
| F5 | 0.251 * | 0.311 * | 0.249 * | 0.176 * | 0.729 | |
| M | 0.443 * | 0.488 * | 0.285 * | 0.376 * | 0.354 * | 0.816 |
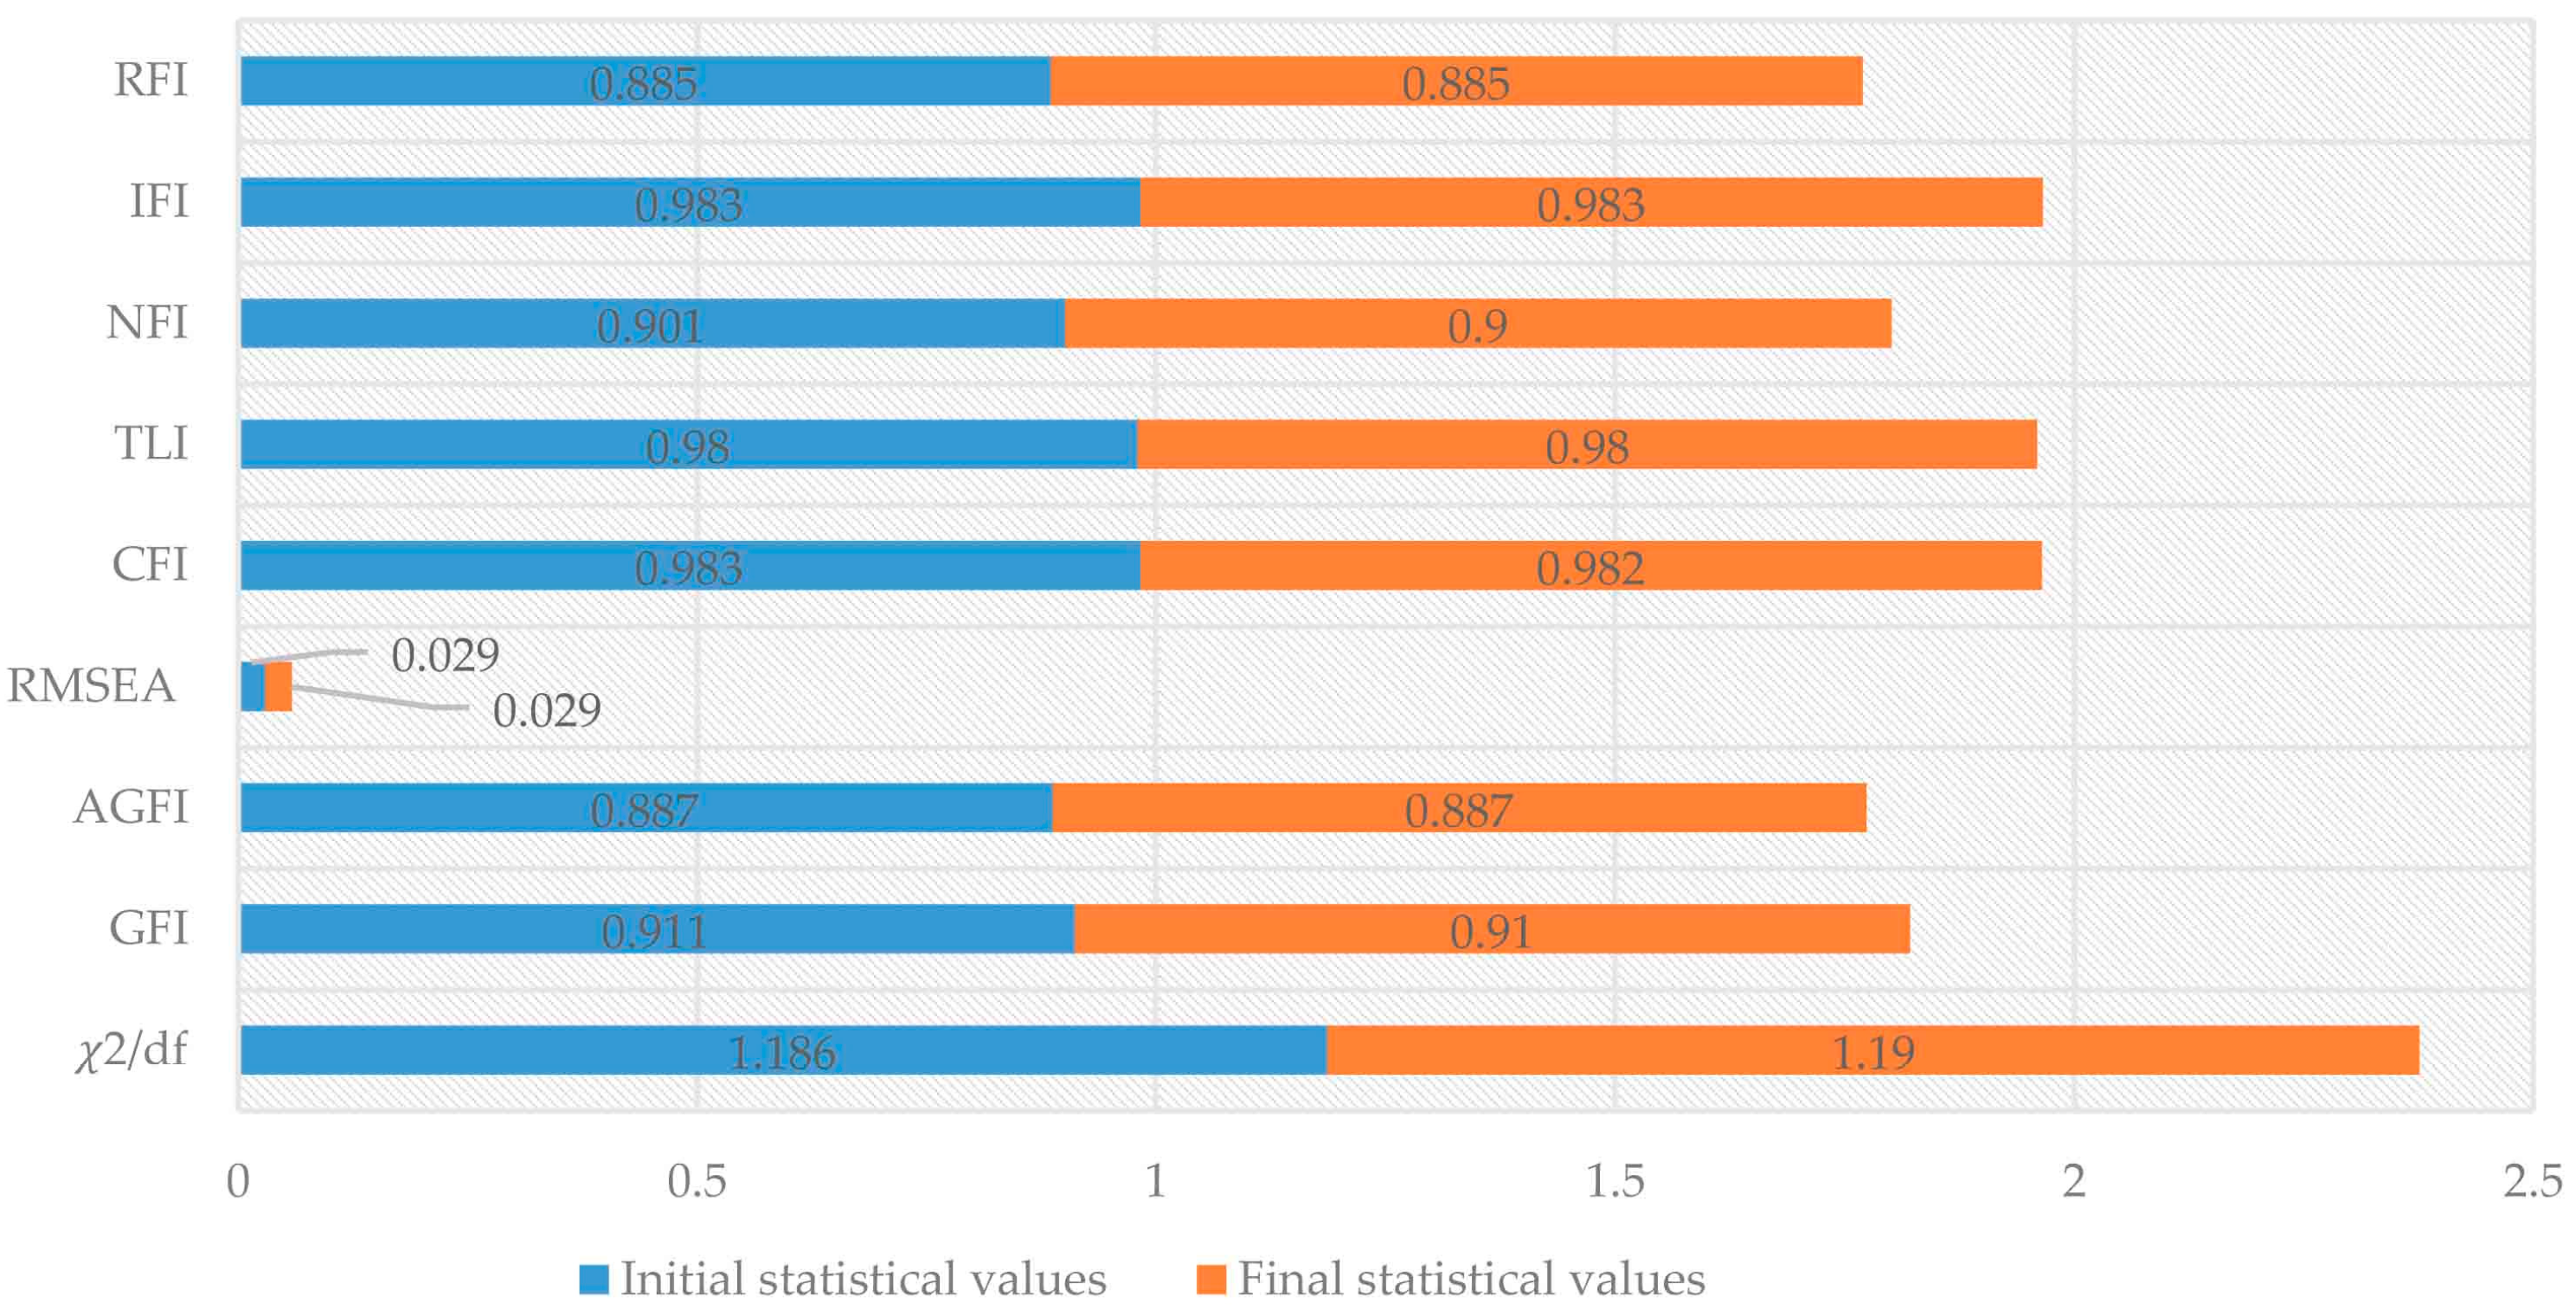
| Goodness-of-Fit Measures | Recommended Level of GOF Measure | Initial Statistical Values (11-Path Model) | Final Statistical Values (10-Path Model) |
|---|---|---|---|
| ) | 1 to 2 | 1.186 | 1.190 |
| Goodness-of-fit index (GFI) | 0 (no fit)–1 (perfect fit) | 0.911 | 0.910 |
| Adjusted Goodness-of-fit index (AGFI) | 0.887 | 0.887 | |
| Root mean sq. error of approx (RMSEA) | <0.05 (very good)–0.1 (threshold) | 0.029 | 0.029 |
| Comparative fit index (CFI) | 0 (no fit)–1 (perfect fit) | 0.983 | 0.982 |
| Tucker–Lewis index (TLI) | 0 (no fit)–1 (perfect fit) | 0.980 | 0.980 |
| Normal fit index (NFI) | 0 (no fit)–1 (perfect fit) | 0.901 | 0.900 |
| Incremental fit index (IFI) | 0 (no fit)–1 (perfect fit) | 0.983 | 0.983 |
| Relative fit index (RFI) | 0 (no fit)–1 (perfect fit) | 0.885 | 0.885 |
| Path | Standardized Coefficient Estimate | S.E. | t-Value | Sig. |
|---|---|---|---|---|
| F2←F3 | 0.53 | 0.092 | 5.718 | *** |
| F4←F3 | 0.65 | 0.097 | 6.727 | *** |
| F5←F3 | 0.28 | 0.114 | 2.457 | * |
| F1←F2 | 0.47 | 0.074 | 6.423 | *** |
| F5←F2 | 0.37 | 0.101 | 3.665 | *** |
| M←F2 | 0.32 | 0.092 | 3.520 | ** |
| M←F4 | 0.32 | 0.087 | 3.677 | *** |
| M←F1 | 0.25 | 0.081 | 3.122 | ** |
| M←F5 | 0.18 | 0.067 | 2.690 | ** |
| M←F3 | −0.14 | 0.106 | −1.339 |
| Path | Standardized Coefficient Estimate | S.E. | t-Value | Sig. |
|---|---|---|---|---|
| F2←F3 | 0.52 | 0.092 | 5.671 | *** |
| F4←F3 | 0.65 | 0.097 | 6.670 | *** |
| F5←F3 | 0.27 | 0.113 | 2.413 | * |
| F1←F2 | 0.47 | 0.074 | 6.421 | *** |
| F5←F2 | 0.37 | 0.101 | 3.700 | *** |
| M←F2 | 0.28 | 0.087 | 3.231 | ** |
| M←F4 | 0.25 | 0.069 | 3.640 | *** |
| M←F1 | 0.26 | 0.081 | 3.260 | ** |
| M←F5 | 0.16 | 0.066 | 2.495 | * |
Disclaimer/Publisher’s Note: The statements, opinions and data contained in all publications are solely those of the individual author(s) and contributor(s) and not of MDPI and/or the editor(s). MDPI and/or the editor(s) disclaim responsibility for any injury to people or property resulting from any ideas, methods, instructions or products referred to in the content. |
© 2025 by the authors. Licensee MDPI, Basel, Switzerland. This article is an open access article distributed under the terms and conditions of the Creative Commons Attribution (CC BY) license (https://creativecommons.org/licenses/by/4.0/).
Share and Cite
Li, B.; Wang, S.; Chen, J. Investigating Subcontracting Partnership in Sustainable Urban Transportation System Design. Sustainability 2025, 17, 4371. https://doi.org/10.3390/su17104371
Li B, Wang S, Chen J. Investigating Subcontracting Partnership in Sustainable Urban Transportation System Design. Sustainability. 2025; 17(10):4371. https://doi.org/10.3390/su17104371
Chicago/Turabian StyleLi, Baoyu, Shouqing Wang, and Jiayu Chen. 2025. "Investigating Subcontracting Partnership in Sustainable Urban Transportation System Design" Sustainability 17, no. 10: 4371. https://doi.org/10.3390/su17104371
APA StyleLi, B., Wang, S., & Chen, J. (2025). Investigating Subcontracting Partnership in Sustainable Urban Transportation System Design. Sustainability, 17(10), 4371. https://doi.org/10.3390/su17104371