
Study on the Early Warning Mechanism for Industrial Land Redevelopment in High-Tech Zones: A Multi-Dimensional Evaluation Based on Enterprise Life Cycle, Park Compatibility, and Land Use Efficiency


Abstract
1. Introduction
2. Literature Review
2.1. Development of High-Tech Zones and Industrial Land Redevelopment
2.2. Enterprise Life Cycle, Park Compatibility, and Industrial Land Use Efficiency
2.3. Application of Early Warning Mechanisms in Industrial Land Management
2.4. Definition of Core Concepts
3. Materials and Methods
3.1. Materials
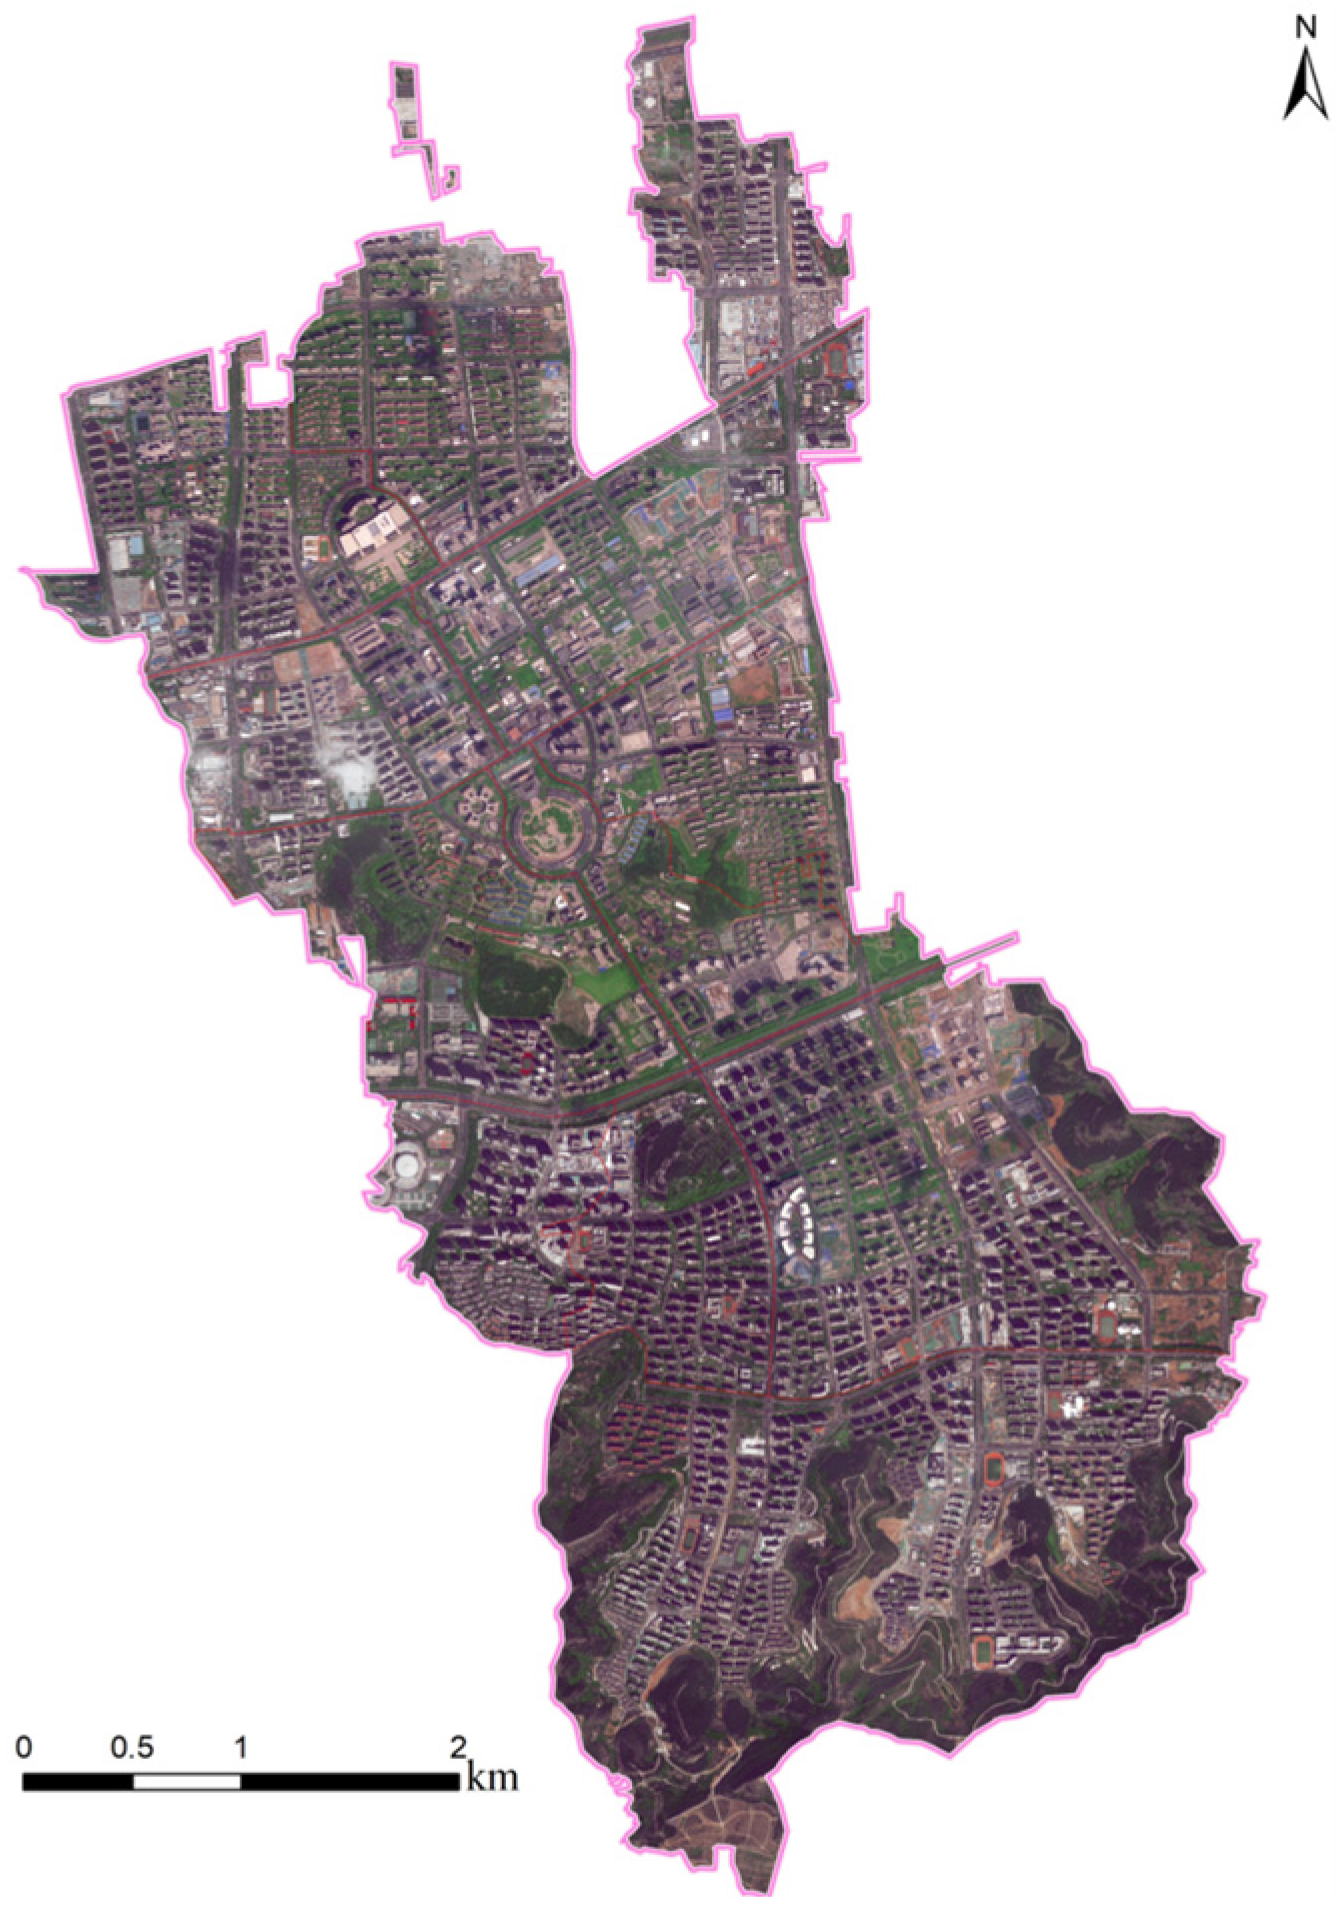
3.1.1. Study Area
3.1.2. Data Sources
- (1)
- Some enterprises, although qualified as high-tech firms, are still in incubation stages, lacking complete business data or stable output, thus making them unsuitable for evaluating lifecycle stages or land use performance;
- (2)
- Many parcels exhibit “multi-tenant” or “shared-office” patterns, where multiple micro or small enterprises occupy the same building or floor. This leads to ambiguous spatial attribution and blurred performance boundaries, making it difficult to establish a valid parcel–enterprise mapping;
- (3)
- Certain firms operate in non-industrial sectors (e.g., education or training) that fall outside the scope of industrial land performance evaluation, thereby affecting the internal consistency and generalizability of the model.
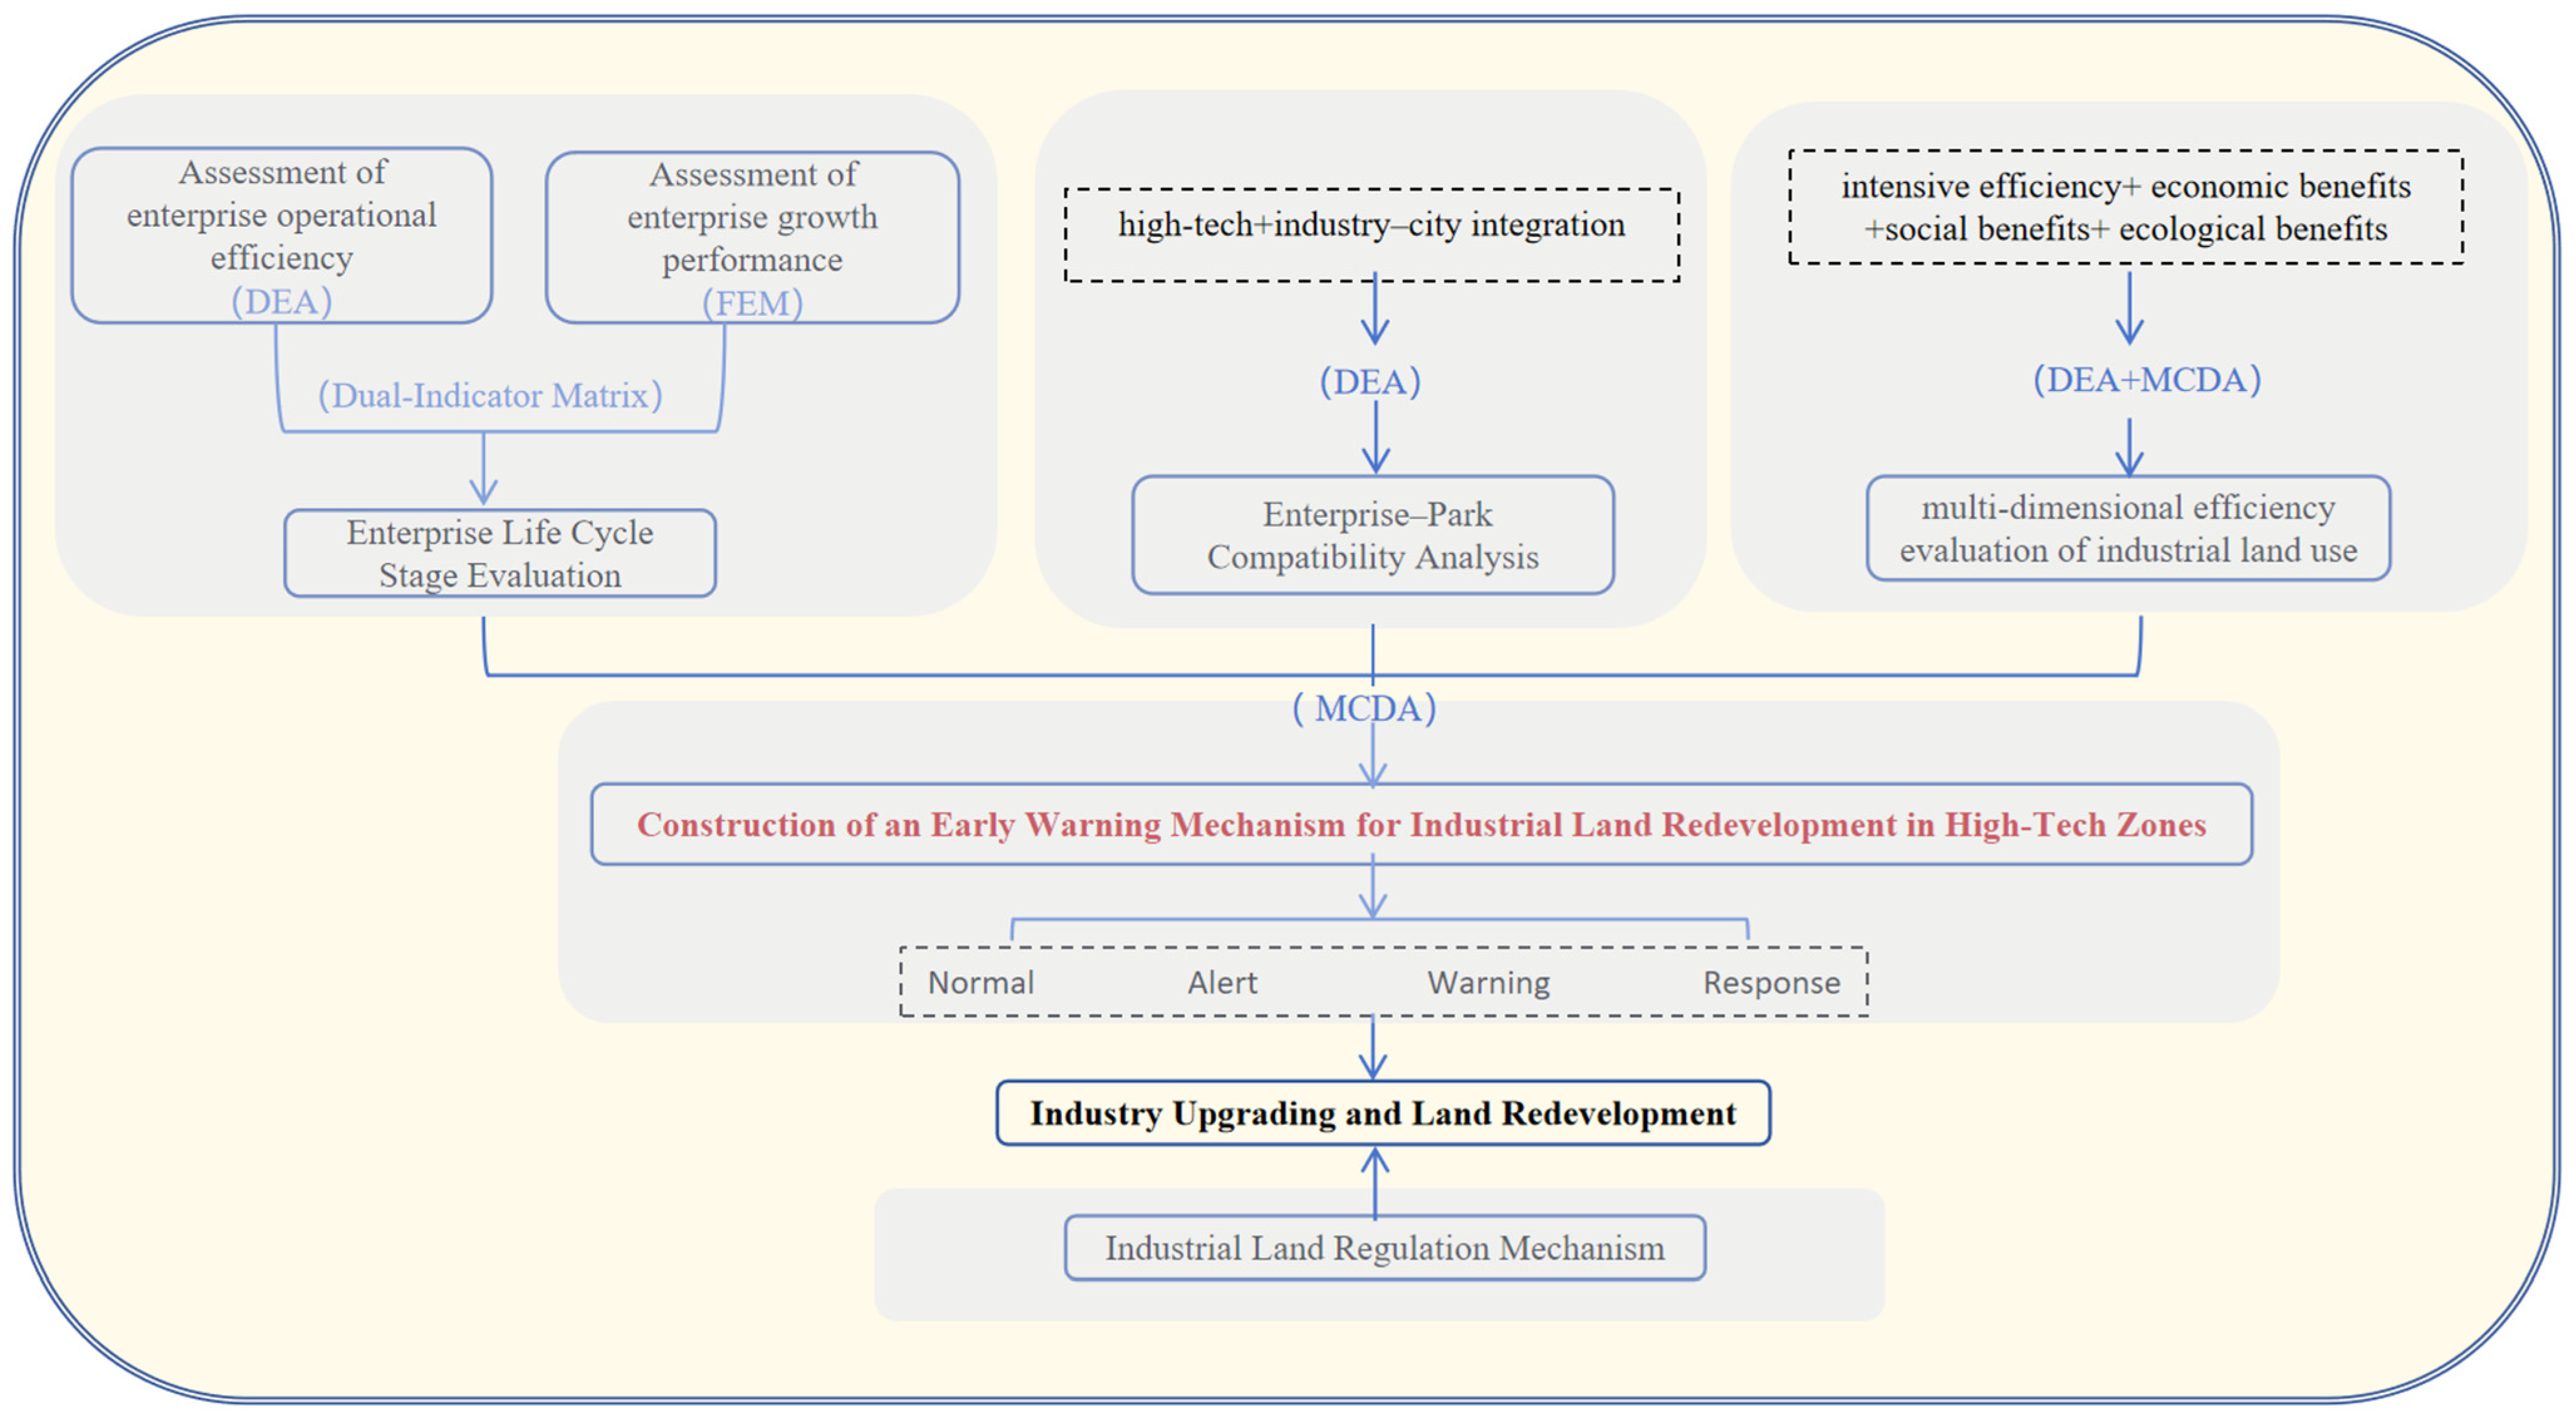
3.2. Methods
3.2.1. Data Envelopment Analysis (DEA)
3.2.2. Fixed Effects Model
3.2.3. Multi-Criteria Decision Analysis (MCDA)
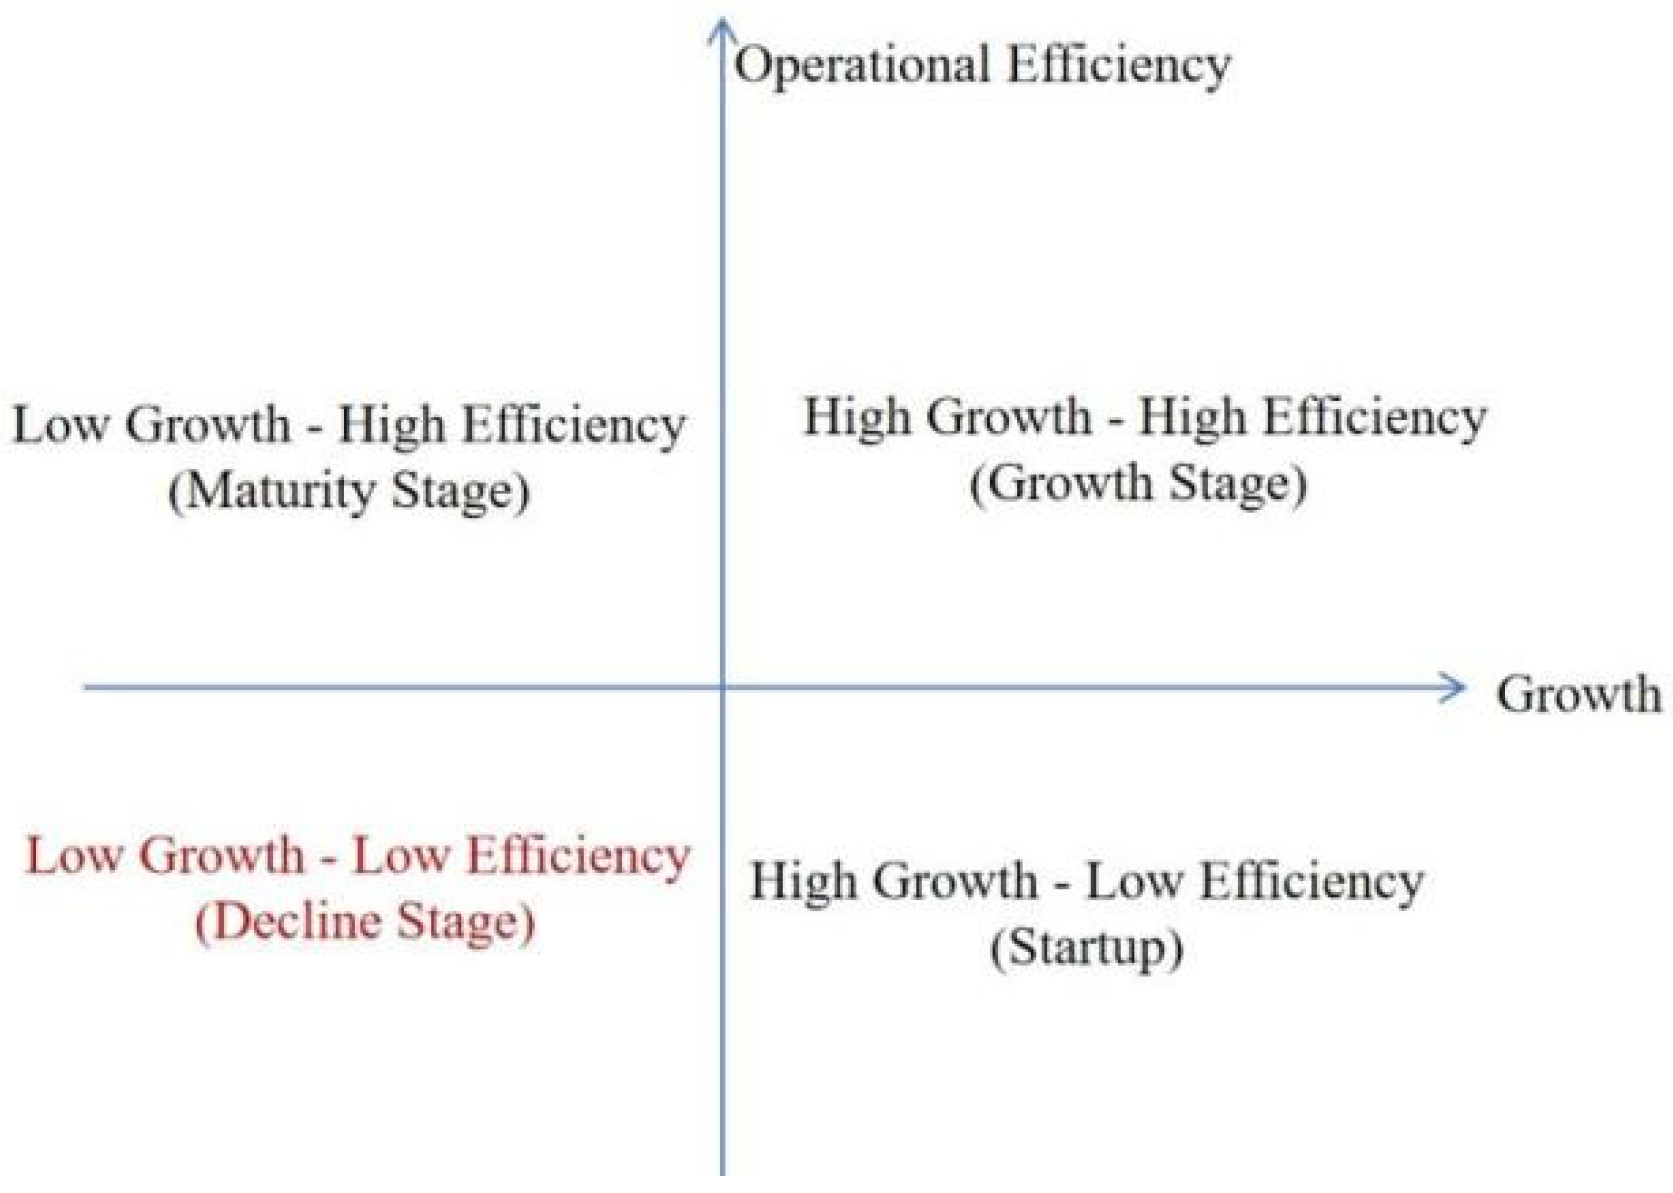
3.2.4. Dual-Indicator Matrix
4. Results
4.1. Evaluation of Enterprise Life Cycle in High-Tech Zones Based on DEA and Dual-Indicator Matrix
4.1.1. Analysis of Enterprise Operational Efficiency
- (1)
- Enterprise Operational Efficiency Indicator System
- (2)
- Evaluation Results and Analysis of Enterprise Operational Efficiency
4.1.2. Enterprise Growth Analysis
- (1)
- Enterprise Growth Analysis Index System
- (2)
- Evaluation of Enterprise Growth Performance
4.1.3. Enterprise Life Cycle Assessment and Analysis Based on the Dual-Indicator Matrix
- (1)
- Dual-Indicator Vector Matrix
- (2)
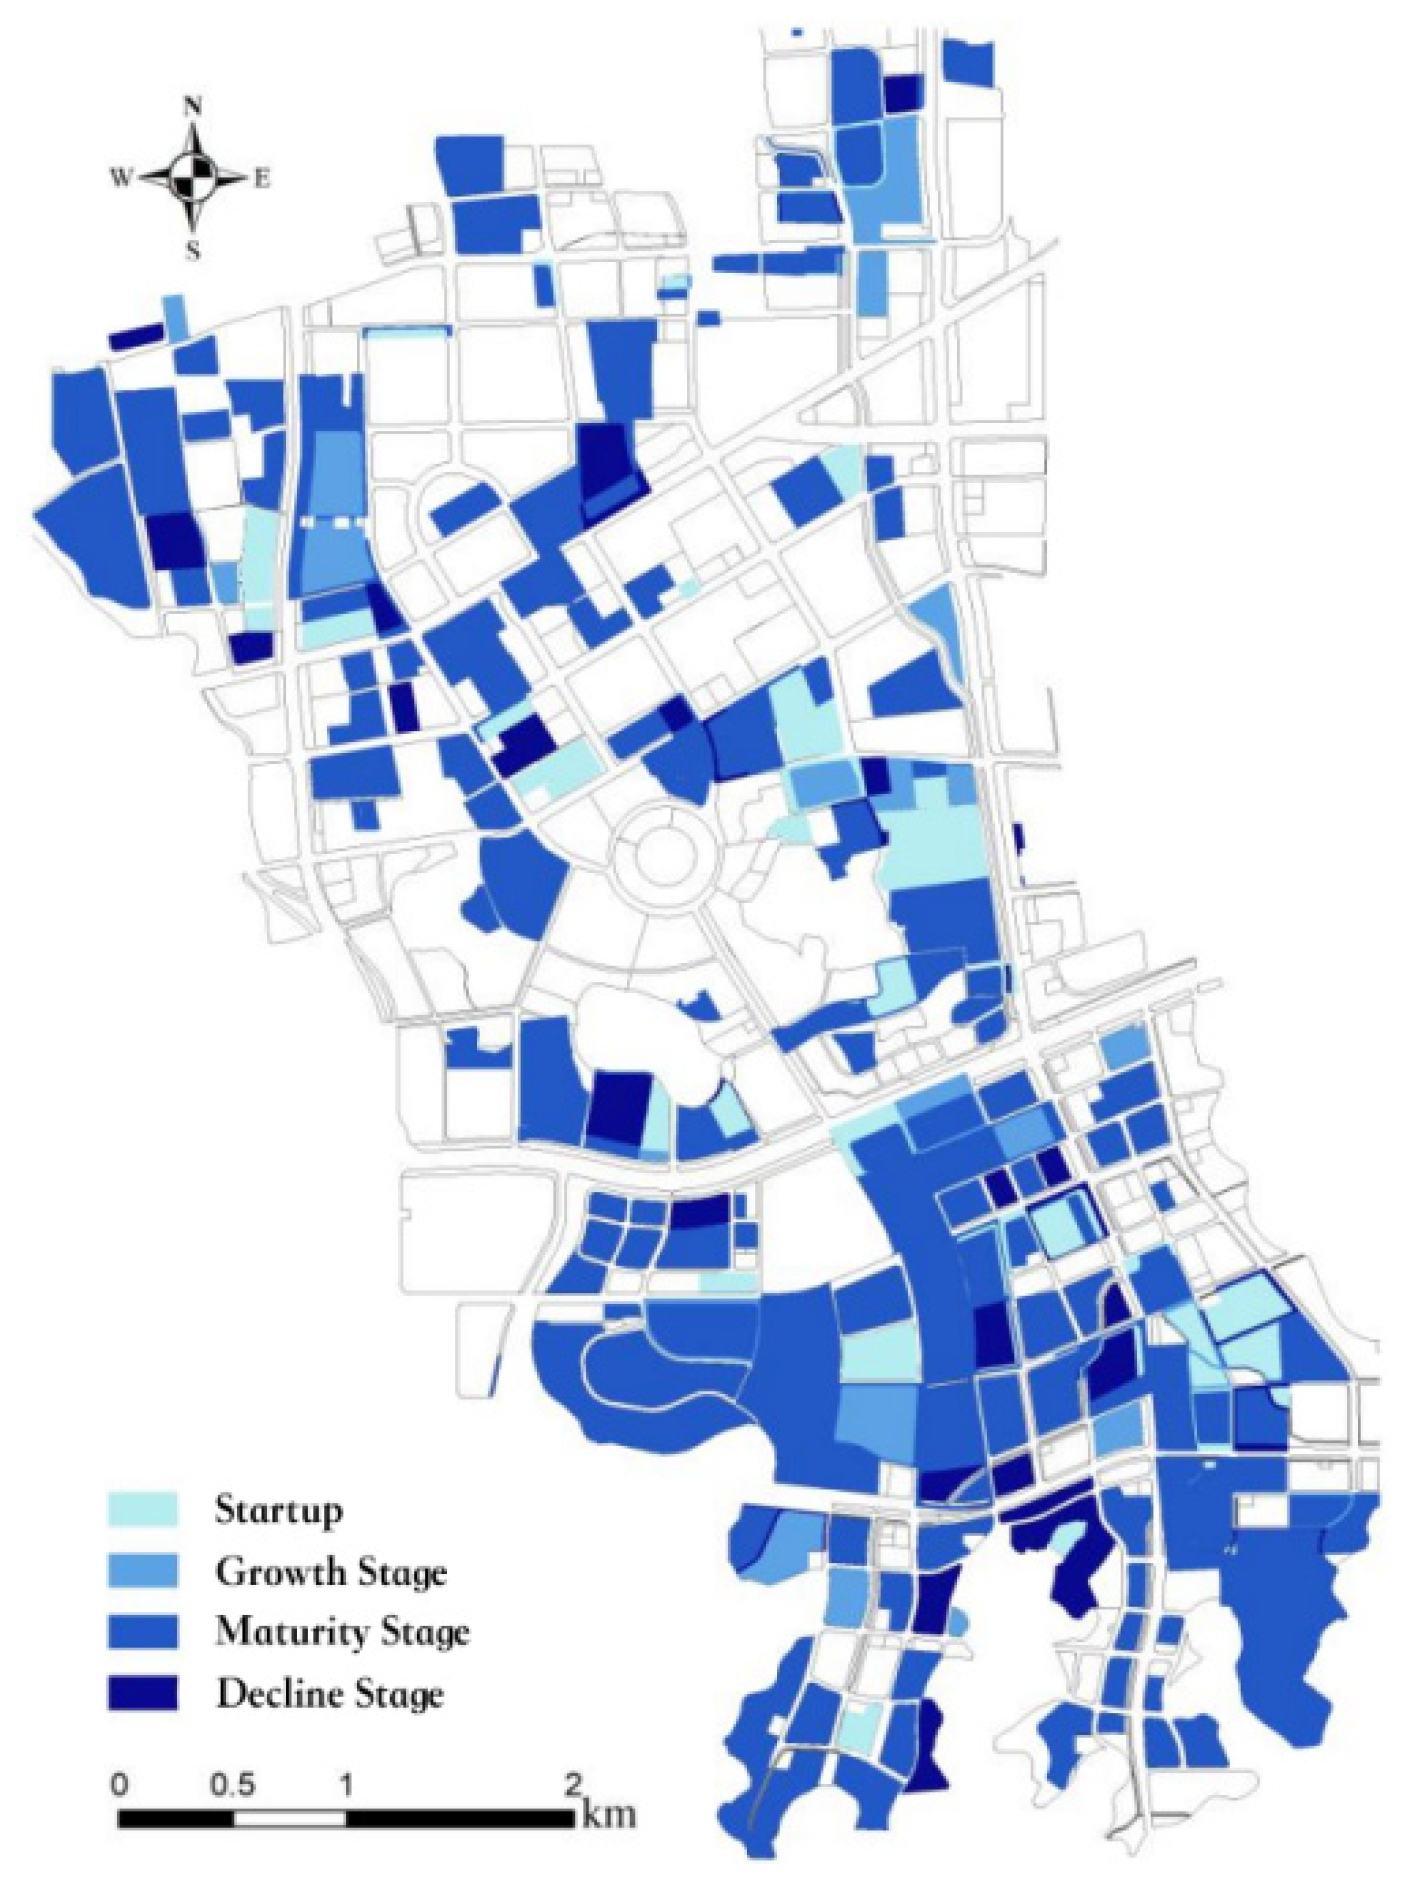
- Enterprise Life Cycle Assessment Results
4.2. Evaluation and Analysis of Enterprise–Park Compatibility
4.3. Evaluation of Industrial Land Use Efficiency and Identification of Inefficient Land in High-Tech Zones
4.3.1. Definition of Industrial Land Use Efficiency and Inefficient Land
4.3.2. Evaluation Method for Industrial Land Use Efficiency in High-Tech Zones
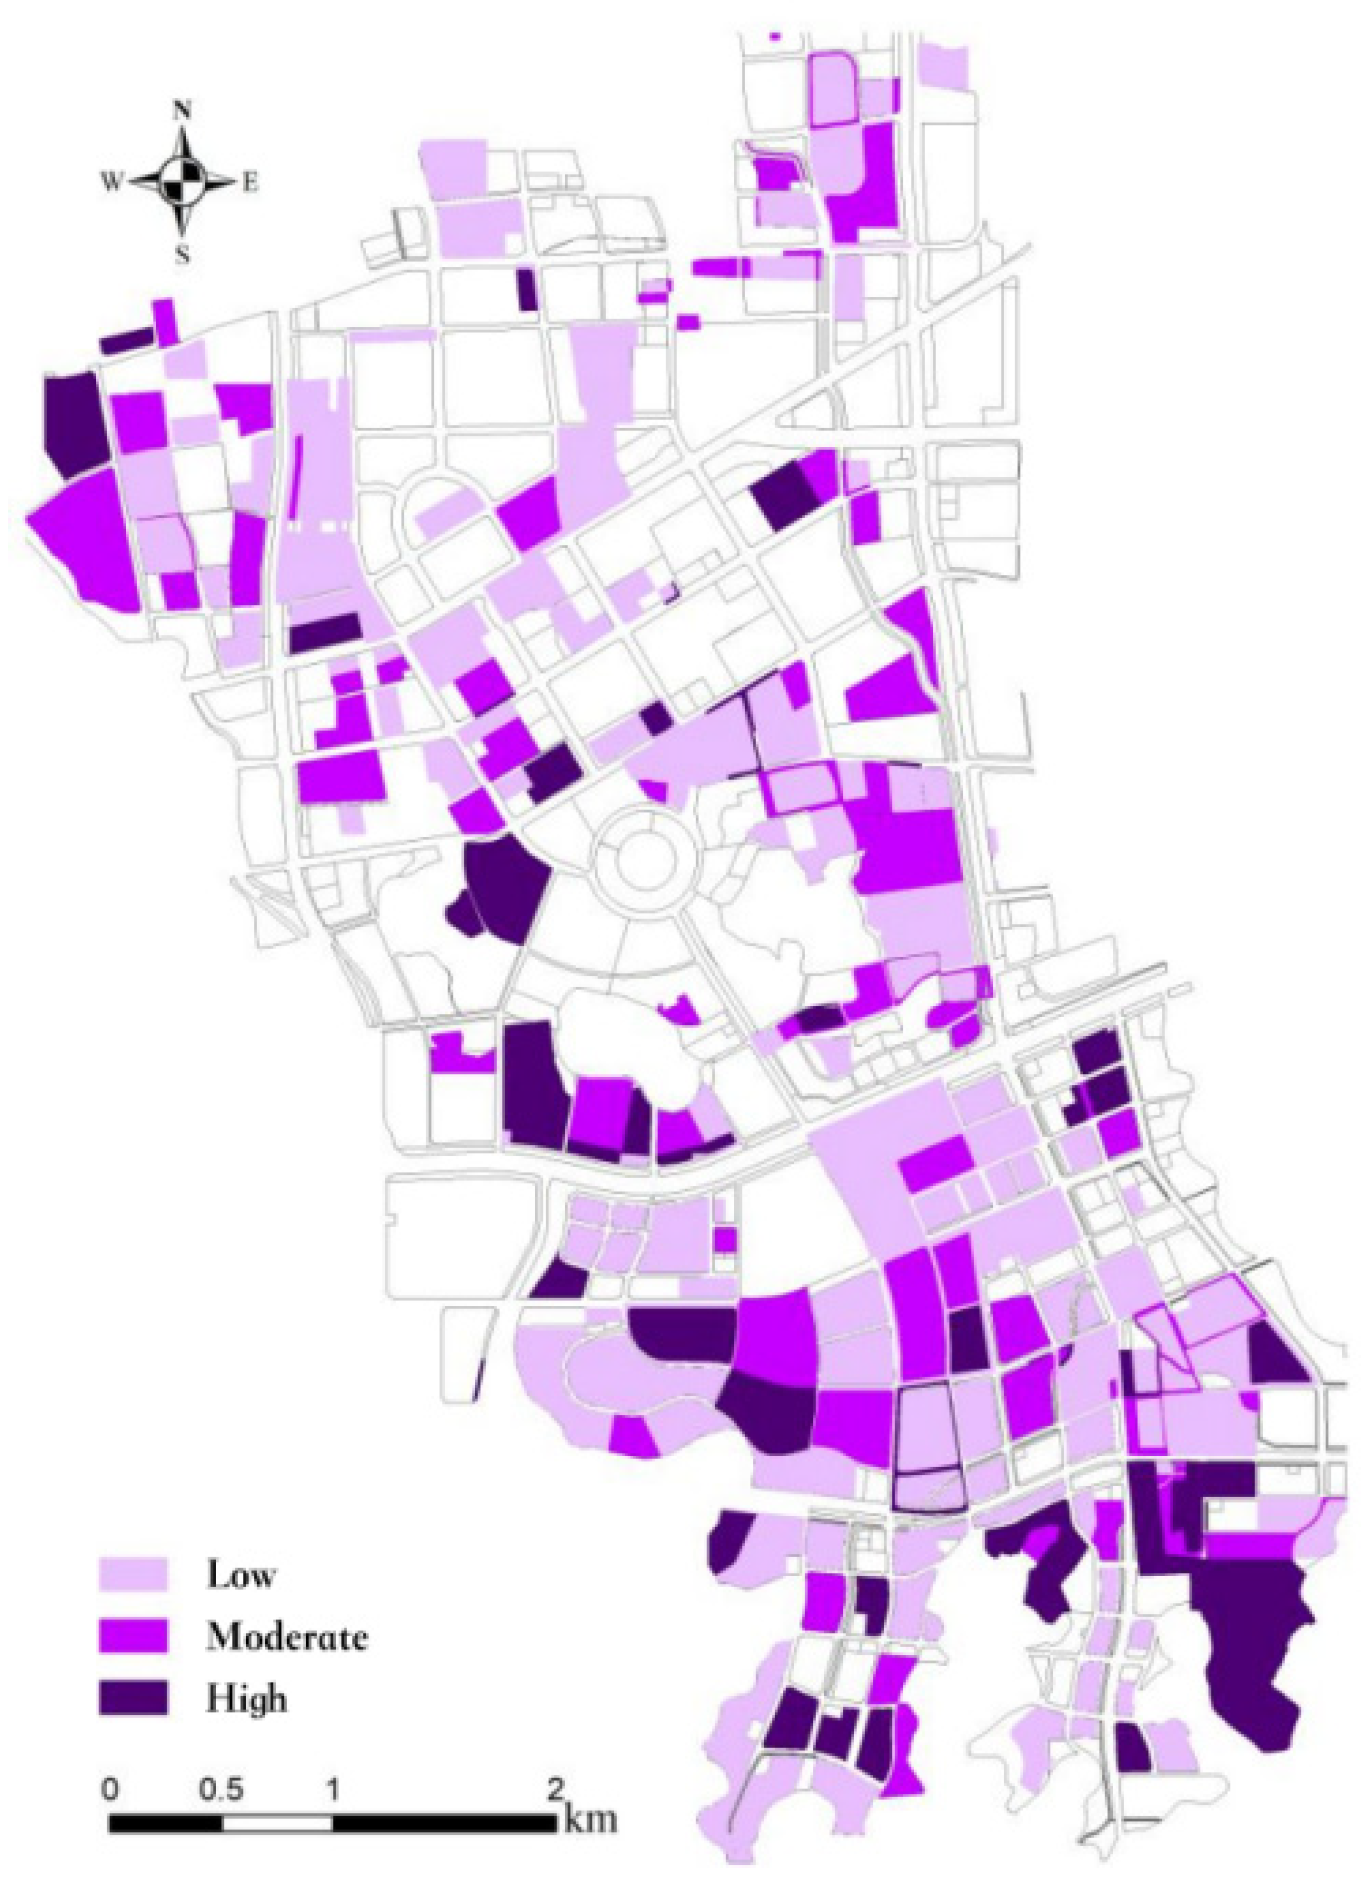
4.3.3. Evaluation Results of Industrial Land Use Efficiency in High-Tech Zones
4.4. Construction and Application of the Early Warning Mechanism for Industrial Land Redevelopment in High-Tech Zones
4.4.1. Indicator System and Weight Allocation for the Early Warning Mechanism of Industrial Land Redevelopment in High-Tech Zones
- (1)
- Construction of the Indicator System
- (2)
- Weight Assignment in the Early Warning Mechanism for Industrial Land Redevelopment Using the AHP Method
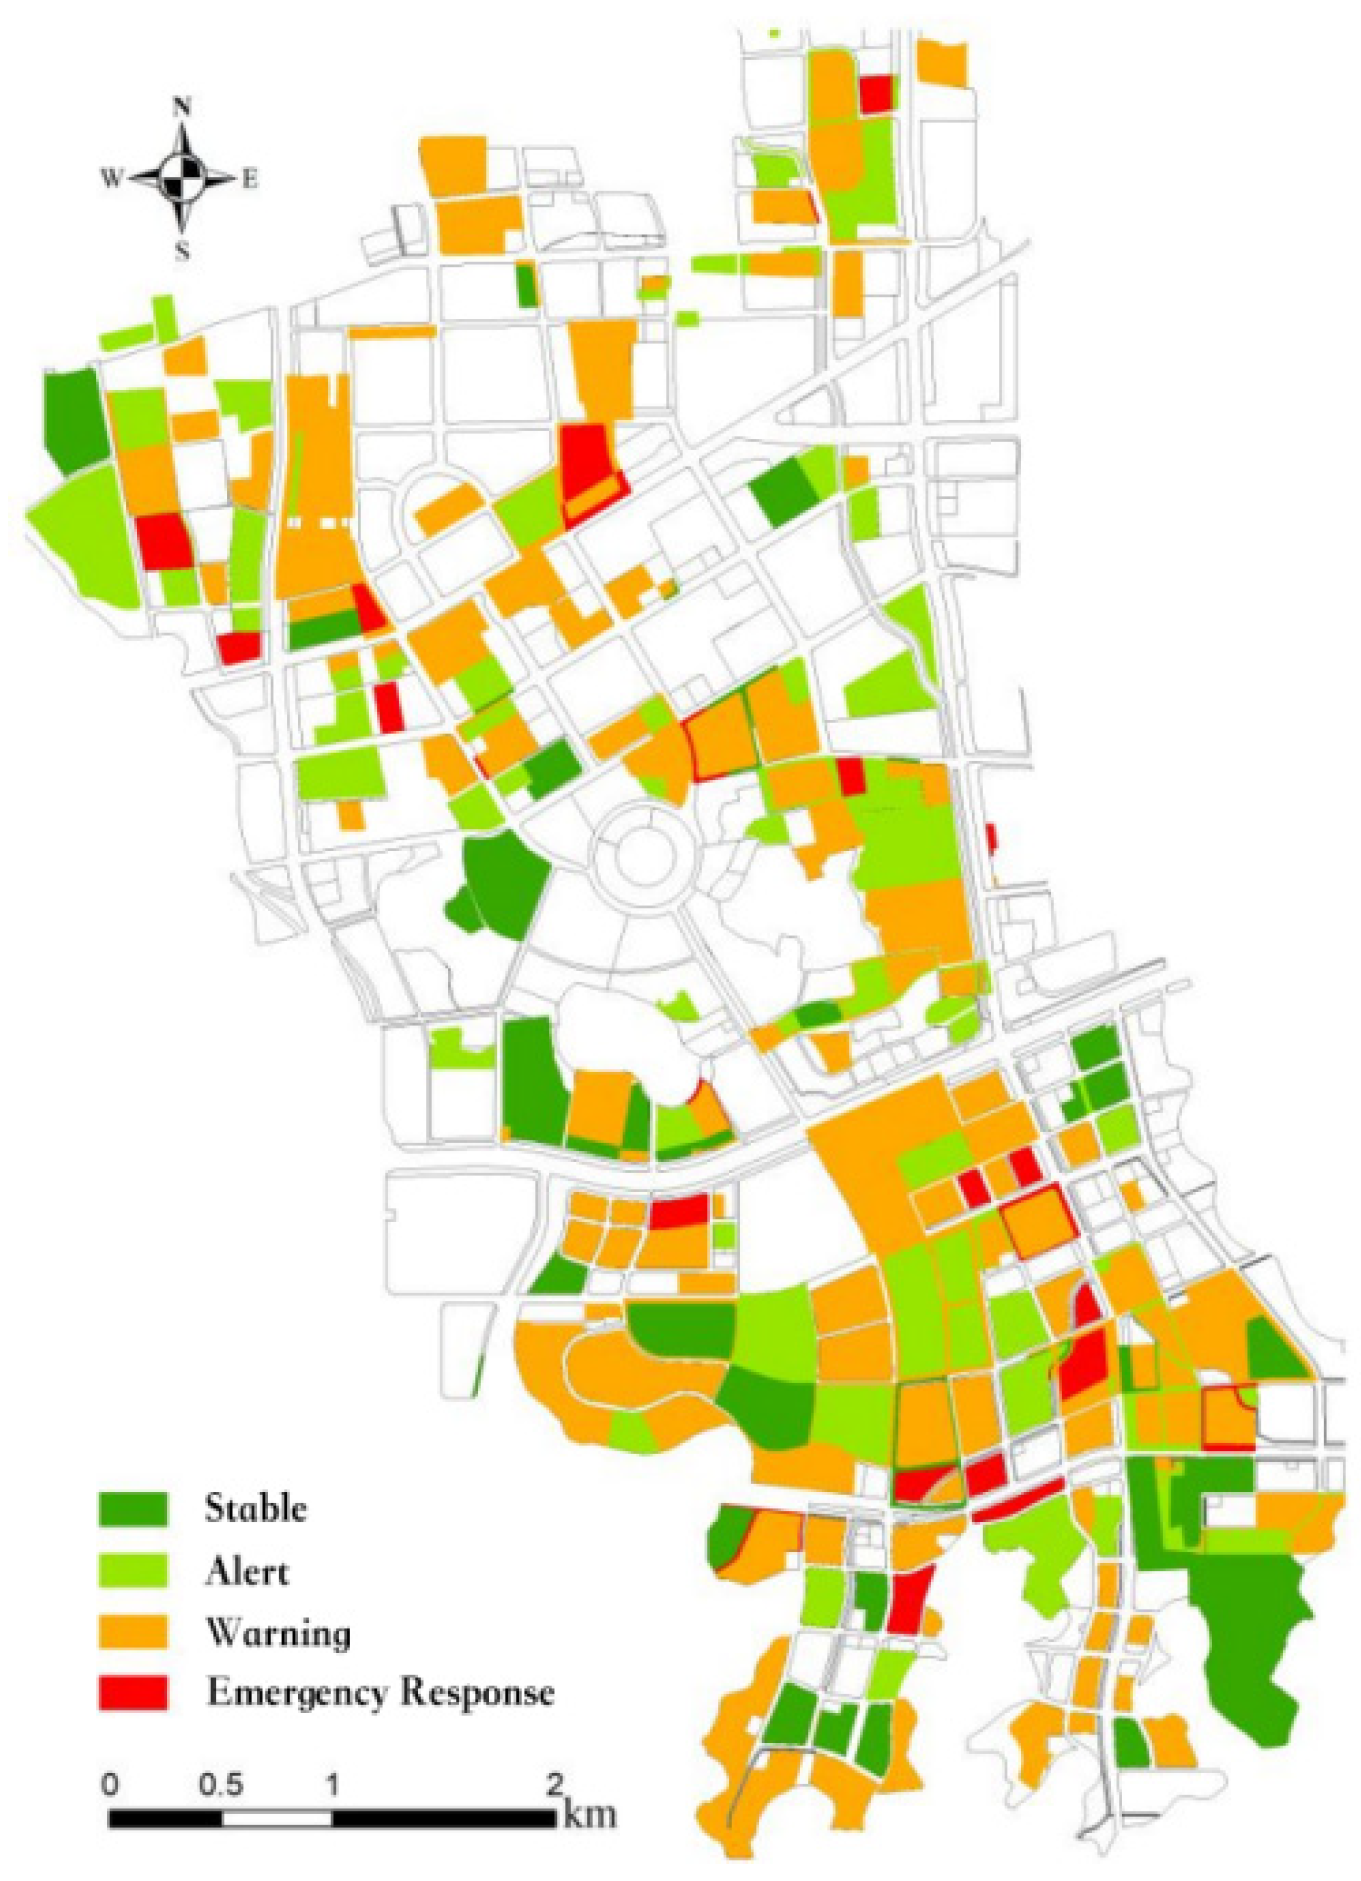
4.4.2. Design and Implementation of the Comprehensive Early Warning Mechanism
5. Discussion
6. Conclusions
Author Contributions
Funding
Institutional Review Board Statement
Informed Consent Statement
Data Availability Statement
Conflicts of Interest
References
- Ouyang, Y.; Xie, B. Spatial spillover effects and mechanism testing of national high-tech zones in promoting high-quality economic development. Seek. Truth 2025, 52, 40–57. [Google Scholar] [CrossRef]
- Zhang, J.; Bi, Y.; Jin, Y. The incentive effect of China’s “promotion-based construction” policy on enterprise innovation in high-tech zones. Manag. World 2021, 37, 76–91. [Google Scholar] [CrossRef]
- Mo, Z.X.; Ye, Q.; Zhao, Y. Policy, theoretical, and practical evolution of stock construction space utilization in China. Econ. Geogr. 2022, 42, 156–167. [Google Scholar] [CrossRef]
- Chen, Y.; Huang, X.J.; Chen, Z.G. Study on intensive land use in development zones during urbanization—A case study of Suzhou High-Tech Zone. China Land Sci. 2008, 6, 11–16. [Google Scholar] [CrossRef]
- Jia, J.; Bai, S.; Wang, X.; Li, S. Measurement and evaluation of industrial-urban integration in national high-tech industrial development zones in Henan Province. Reg. Res. Dev. 2019, 38, 30–34. [Google Scholar]
- Deng, C.; Wan, Y. Measurement, spatial-temporal characteristics, and driving factors of industrial-urban integration in the Yangtze River Delta: A study based on the modified coupling coordination model. Urban Dev. Res. 2023, 30, 18–24. [Google Scholar] [CrossRef]
- Wang, B.; Chen, Z.; Zhu, J.; Peng, S.; Liu, Z.; Li, Y.; Wang, X. Regional comparison and performance evaluation of China’s industrial-urban integration demonstration zones. Resour. Environ. Yangtze Basin 2022, 31, 2608–2620. [Google Scholar] [CrossRef]
- Ma, S.Y.; Zhao, Z.X.; Wang, G.L. Spatiotemporal pattern characteristics and influencing factors of China’s national high-tech industrial development zones. Econ. Geogr. 2022, 42, 95–102+239. [Google Scholar] [CrossRef]
- Zhang, L. Comparative study of urban renewal governance models and transformation paths under the “new normal”. Urban Dev. Res. 2015, 22, 57–62. [Google Scholar]
- Tan, Y.; Xu, W.; Han, X.; Tang, T. Evaluation of economical and intensive land use in regional construction under the new era: A case study of Changsha Meixi Lake International New City. Econ. Geogr. 2008, 38, 200–205. [Google Scholar] [CrossRef]
- Wang, B.; Zheng, J. Study on the evaluation of intensive land use in major cities in China. Econ. Geogr. 2006, 22, 24–28. [Google Scholar] [CrossRef]
- Yang, J.; Huang, X.J.; Wang, Z.Q. A re-examination of issues in urban land intensification in China under the new era. China Land Sci. 2020, 34, 31–37. [Google Scholar] [CrossRef]
- Zhao, H.; Zhang, Y.; Shang, M.; Ma, C. Research on spatial planning strategies for high-tech zones under the guidance of industrial-urban integration: A case study of the eastern district of Zaozhuang High-Tech Zone. Urban Dev. Res. 2022, 29, 15–21. [Google Scholar] [CrossRef]
- Li, C.; Zhang, F.; Wang, F.; Hu, Y. Analysis of spatial security early warning for construction land during rapid urbanization. China Land Sci. 2015, 29, 49–56. [Google Scholar] [CrossRef]
- Meng, P.; Hao, J.; Zhou, N.; Shuang, W.; Hong, S. Evaluation of intensive industrial land use under the background of new urbanization: A case study of Beijing Yizhuang New Town. China Land Sci. 2014, 28, 83–89. [Google Scholar] [CrossRef]
- Yang, Q.; Wang, L.; Zhao, J.; Li, Y.; Zhu, G.; Wang, Y. Evaluation of urban land use efficiency and development potential enhancement based on the SFA model. Res. Soil Water Conserv. 2024, 31, 328–343. [Google Scholar] [CrossRef]
- Sun, L.; Lei, L.H.; Li, N. Does a national high-tech zone promote regional innovation development more effectively than an economic development zone? Evidence from a quasi-natural experiment. Manag. Rev. 2023, 35, 77–88. [Google Scholar] [CrossRef]
- Wang, F. Research on the evolution and development trends of China’s high-tech zone policies: An investigation based on China’s high-tech zone policies from 1984 to 2011. Sci. Technol. Progress Policy 2013, 30, 31–36. [Google Scholar] [CrossRef]
- Ouyang, Y.; Xie, B. Industrial agglomeration in China’s high-tech parks: Typical characteristics and theoretical analysis. J. Soc. Sci. Hunan Norm. Univ. 2025, 54, 84–95. [Google Scholar] [CrossRef]
- Feng, F. Industry-city integration and high-quality development of national new areas: Mechanism interpretation and promotion strategies. Economist 2021, 50–57. [Google Scholar] [CrossRef]
- Wang, J.J.; Zhou, J. Establishment of national high-tech zones, agglomeration of innovation elements, and regional innovation performance. Stat. Decis. 2024, 40, 184–188. [Google Scholar] [CrossRef]
- Zhang, X.Y.; Wang, Z.J.; Wang, H. Urban renewal strategies from a commercial operation perspective: A case study of the redevelopment of Hong Kong Island East. Urban Plan. Forum 2022, 186–192. [Google Scholar] [CrossRef]
- Li, J.X.; Du, M.G.; Sun, Z.Y.; Peng, Z.; Zhou, M.S. Path characteristics and social impacts of inner-city renewal in Tianjin during the transformation period. J. Nat. Resour. 2025, 40, 231–248. [Google Scholar] [CrossRef]
- Hu, Z.L.; Liao, G.M.; Wu, B. High-tech industrial agglomeration and manufacturing core competitiveness: A case study of national high-tech zone construction. Econ. Issues Explor. 2024, 7, 104–118. [Google Scholar]
- Lou, J.J.; Zhao, X.F.; Wang, L.M.; Zhu, F.; Jin, P. Industrial land supply based on enterprise life cycle: A case study of Jiangsu Province. Mod. Urban Res. 2017, 18–24. [Google Scholar]
- Luo, L.H.; Wang, Y. Does entering a national high-tech zone enhance the development quality of technology enterprises? Macro Qual. Res. 2024, 12, 72–85. [Google Scholar] [CrossRef]
- Shi, J.G.; Xu, T.H. Evaluation of land use efficiency in industrial parks based on the VRS-DEA model and Malmquist index: A case study of 16 industrial parks in the Yangtze River Delta urban agglomeration. Resour. Sci. 2017, 39, 1026–1036. [Google Scholar] [CrossRef]
- Chen, H.Z.; Shu, L.L. Evaluation of input-output efficiency in China’s high-tech industrial parks based on the DEA model. Sci. Sci. Manag. Sci. Technol. 2013, 34, 104–109. [Google Scholar]
- Li, J.; Wu, H.; Wang, L. A Robust DEA Model with Common Weights under Uncertainty and Its Application. Chin. J. Manag. Sci. 2024, 1–16. [Google Scholar] [CrossRef]
- Zheng, X.J.; Hao, Q.; Kuang, W. Key issues and optimization strategies in monitoring, evaluation, and early warning systems for territorial spatial planning. J. Nat. Resour. 2024, 39, 2869–2880. [Google Scholar] [CrossRef]
- Ma, Z.; Zhang, C. A Globally-Oriented Parallel Network DEA Model. Syst. Eng. Theory Pract. 2024, 44, 2059–2074. [Google Scholar] [CrossRef]
- Ke, X.; Li, J.; Li, C. Spatiotemporal Characteristics and Influencing Factors of Urban Renewal Performance in Guangdong Province. China Land Sci. 2022, 36, 44–55. [Google Scholar] [CrossRef]
- Li, C.; Hu, J. Spatiotemporal Differences and Influencing Factors of Urban Land Use Efficiency Based on DEA: A Case Study of Nine Cities in Jilin Province. Resour. Environ. Yangtze Basin 2020, 29, 678–686. [Google Scholar] [CrossRef]
- Wu, W.; Feng, Y. Digital Economy, Consumption Upgrading, and Urban Land Use Efficiency: An Empirical Study Based on the Wuhan Urban Circle. Stat. Decis. 2022, 38, 107–110. [Google Scholar] [CrossRef]
- Feng, L.; Li, C. The Impact of Comprehensive Land System Reform on the Urban–Rural Income Gap. China Land Sci. 2025, 38, 50–59. [Google Scholar] [CrossRef]
- Luo, S.; Tan, Y.; Mou, Y.; Wang, Q. Land Use Functional Zoning Based on MCDA in Longquan City. China Land Sci. 2011, 25, 47–51+97. [Google Scholar] [CrossRef]
- Liang, H.; An, D.; Yang, Y.; Wang, Y.; Xi, B.; Wu, M.; Zhang, B. Groundwater Pollution Risk Classification of Hazardous Waste Landfills Based on the MCDA Model. Res. Environ. Sci. 2016, 29, 131–137. [Google Scholar] [CrossRef]
- Guo, C. Quantile Method-Based Measurement of Risk Margins in Life Insurance. Insur. Stud. 2017, 7, 35–48. [Google Scholar] [CrossRef]
- Sun, H.; Lü, J.; Su, Z.; Song, S.; Wang, Y. The Role of Quantile Method in Enhancing the Consistency of Multi-Indicator Drought Classification. J. Catastrophol. 2017, 32, 13–17+53. [Google Scholar]
- Yao, S.; Jiang, Y. Digital Infrastructure and the Formation of New Productive Forces in Enterprises: Theory and Empirical Evidence. J. Northeast Norm. Univ. Philos. Soc. Sci. Ed. 2024, 1–12. [Google Scholar] [CrossRef]
- Chen, Y.; Huang, C. Performance Evaluation of Intensive Land Use in Wuhan (1998–2010). J. Huazhong Agric. Univ. Soc. Sci. Ed. 2014, 112–118. [Google Scholar] [CrossRef]
- Xu, M.; Liu, C. Early Warning Evaluation and Trend Analysis of Resource and Environmental Carrying Capacity in Hunan Province. Econ. Geogr. 2020, 40, 187–196. [Google Scholar] [CrossRef]
- Xiao, H.; Chen, Y.; Gao, Y. Environmental and Social Risk Characteristics of Industrial Parks and Coping Strategies. Chin. J. Environ. Manag. 2024, 16, 141–149+159. [Google Scholar] [CrossRef]
- Tan, M.; Kong, X.; Duan, J.; Fan, W.; Yu, Q.; Zhang, Q. Spatial Early Warning of Urban-Rural Construction Land from the Perspective of Ecological Security: A Case Study of Fangshan District, Beijing. China Land Sci. 2010, 24, 3–37. [Google Scholar] [CrossRef]
- Cheng, Q.; Jiang, S.; Wang, H. The Impact of Policy Instruments on Firms’ Original Innovation Capabilities: Evidence Based on Provincial Panel Data of Industrial R&D Activities. Manag. Rev. 2024, 36, 75–88. [Google Scholar] [CrossRef]
- Liu, J. Macro-Efficiency Analysis and Evaluation of Fixed Asset Investment. Econ. Manag. 2008, 32–35. [Google Scholar] [CrossRef]
- Shi, Y.; Zhou, Z.; Su, R.; Duan, Y. Evaluation of the Coupling and Coordinated Development of Scientific and Industrial Innovation: A Case Study of National High-Tech Zones in Guangdong Province. Sci. Technol. Manag. Res. 2024, 44, 84–91. [Google Scholar] [CrossRef]
- Liu, W.; Kuang, X.; Chen, Y. Innovation Elements and Optimization Strategies of Their Interrelationships in Domestic Innovation-Oriented Urban Districts Under High-Quality Development: A Case Study of Hangzhou High-Tech Zone (Binjiang). Urban Plan. Forum 2024, 119–126. [Google Scholar] [CrossRef]
- Xiong, X.; Wei, X. Evaluation of Innovation Capacity in National Indigenous Innovation Demonstration Zones: A Case Study of Ten Pilot Zones in China. Econ. Geogr. 2016, 36, 33–38. [Google Scholar] [CrossRef]
- Fu, S.; Zhao, X.; Huang, X. The Impact of Industrial Enterprises Entering Parks on Intensive Land Use: A Case Study of Jiangsu Province. Resour. Environ. Yangtze Basin 2023, 32, 905–915. [Google Scholar] [CrossRef]
- Zhang, G.; Zhang, H.; Yang, S.; Zhou, J.; Huang, J.; Cai, S.; Yan, H. Exploration and Application of the “Enterprise Innovation Tax Index”: Based on a Survey in Xiamen Torch High-Tech Zone. Taxation Res. 2024, 108–114. [Google Scholar] [CrossRef]
- Zhou, K.; Wang, F. Research on the Social Benefits Evaluation of Land Use Systems: A Case Study of Banan District, Chongqing. China Population. Resour. Environ. 2017, 27, 166–169. [Google Scholar]
- Lin, J.; Ye, Z.J.; Yang, H. Reflections on the Redevelopment of Inefficient Urban Land in the Era of Stock Planning. China Land Sci. 2019, 33, 1–8. [Google Scholar] [CrossRef]
- Yang, X.; Zhou, R. Can the Establishment of National High-Tech Zones Drive Urban Green Development? Empirical Evidence Based on the Difference-in-Differences Method. Chin. J. Environ. Manag. 2023, 15, 51–61. [Google Scholar] [CrossRef]
- Li, J.; Xu, K.; Fu, S.; Pang, P. How Can National High-Tech Zones in the Yangtze River Economic Belt Achieve Green and Low-Carbon Development? A Configuration Study Based on the TOE Framework. China Soft Sci. 2024, 94–103. [Google Scholar]
- Zhou, W.; Xie, J. Organic renewal approach to the redevelopment of inefficient industrial land in urban areas: A case study of Wenzhou. Planners 2014, 30, 203–207. [Google Scholar] [CrossRef]
- Xu, H.; Li, C.F. Problems and countermeasures in the reutilization of stock construction land in China. Planners 2022, 38, 95–100. [Google Scholar]
- Tan, Y.; He, J.; Li, N. Innovative pathways for the reuse of stock industrial land under the background of new-type urbanization. J. Jishou Univ. Soc. Sci. Ed. 2020, 41, 48–55. [Google Scholar] [CrossRef]


| Indicator Type | Indicator Name | Indicator Definition |
|---|---|---|
| Input Indicators | Land Supply Area [41] | Total land area occupied by the enterprise (m2) |
| Fixed Asset Investment | Total capital invested in fixed asset acquisition (CNY) | |
| Number of Employees | Total number of employees in the enterprise or park (persons) | |
| Floor Area Ratio (FAR) [42] | Ratio of total building area to land area | |
| Building Density [43] | Ratio of built-up area to total land area | |
| Energy Consumption per Output | Energy consumed per unit of output (kWh per 10,000 CNY) | |
| Pollution Control Investment [44] | Total funds invested in environmental protection (CNY) | |
| Output Indicators | Total Industrial Output Value | Total value of industrial production activities (CNY) |
| Input–Output Ratio | Output generated per unit of input | |
| Land Profit Output Ratio | Profit per unit land area (CNY/m2) | |
| Tax Contribution per Unit Area | Tax revenue per unit land or building area (CNY/m2) | |
| Energy Consumption Reduction Rate [45] | Reduction percentage in energy use per unit output (%) | |
| Revenue per Unit Area | Revenue generated per unit land or building area (CNY/m2) |
| Index Type | Indicator Name | Indicator Definition |
|---|---|---|
| Dependent Variable | Main Business Revenue Growth Rate [47] | The percentage increase in a company’s main business revenue compared to the previous period (%) |
| Independent Variables | Profit | The difference between a company’s total revenue and total expenses over a given period (CNY) |
| Industrial Added Value | The value added during the production process (CNY) | |
| Fixed Asset Investment [48] | The total investment in fixed assets made by a company or region over a given period (CNY) | |
| Employment per Unit Output | The number of employees required per unit of output (persons per CNY 10,000) |
| Index Type | Index Name | Index Description |
|---|---|---|
| Input Indicators | Number of Patents Granted per 10,000 People [49] | Number of patents granted per 10,000 people (units/10,000 people) |
| Employee Settlement Rate | Percentage of enterprise employees settling in the local area (%) | |
| Pension Insurance Coverage Rate | Percentage of enterprise employees covered by pension insurance (%) | |
| Infrastructure Support Level | Degree of infrastructure development and service provision in the park | |
| R&D Investment as a Percentage of Revenue [49] | Proportion of enterprise revenue allocated to R&D (%) | |
| Enterprise Consumption in the Tertiary Sector | Proportion of enterprise spending on tertiary sector services (%) | |
| Employee Housing Subsidy Ratio | Percentage of employees receiving housing subsidies from the enterprise (%) | |
| Output Indicators | High-Tech Industry Output as a Share of Total Industrial Output [50] | Proportion of high-tech industry output in the park’s total industrial output (%) |
| Proportion of Employees with a Master’s Degree or Higher [51] | Percentage of employees with a master’s degree or higher (%) | |
| Per Capita Disposable Income of Urban Employees | Average disposable income of urban employees (CNY/year) | |
| Percentage of Employees with a Commute of Less Than 30 min | Proportion of employees whose commute time is under 30 min (%) |
| Index Type | Intensive Efficiency | Economic Benefits | Social Benefits | Ecological Benefits |
|---|---|---|---|---|
| Input Indicators | Land supply area | Total investment | Employment per unit of output value [52] | Energy consumption per unit of output value [53] |
| Fixed asset investment | Number of employees | Per capita built-up area | Pollution treatment investment per unit of land | |
| Floor area ratio | Investment intensity per unit area [54] | Proportion of public facility land in built-up areas | — | |
| Building density | — | — | — | |
| Output Indicators | Land development rate [54] | Business revenue per unit area [55] | Per capita retail sales of consumer goods | Sewage treatment rate |
| Input–output ratio | Tax contribution per unit area | Pension insurance coverage rate [52] | Green coverage rate | |
| Land profit output rate | Net value added | Medical insurance coverage rate | Energy consumption reduction per unit [56] | |
| Industrial gross output per unit area | Profit | Unemployment insurance coverage rate | Industrial wastewater discharge per unit area [56] | |
| — | Growth rate of main business revenue | — | — | |
| — | Sales revenue of products or services | — | — |
| First-Tier Indicator | Second-Tier Indicator | Third-Tier Indicator | Fourth-Tier Indicator |
|---|---|---|---|
| Comprehensive Early Warning Indicator System for Industrial Land Redevelopment in High-Tech Zones | Enterprise Life Cycle | Enterprise Operational Efficiency | Input–Output Ratio, Fixed Asset Investment, Unit Area Business Revenue, etc. |
| Enterprise Growth Potential | Main Business Growth Rate, Industrial Added Value, Profit, etc. | ||
| Enterprise–Park Compatibility | Park–City Integration | Employee Settlement Ratio, High-Tech Industry Output as a Percentage of Total Industrial Output, Per Capita Disposable Income of Urban Employees | |
| Industrial Land Use Efficiency | Intensive Utilization | Land Supply Area, Floor Area Ratio, Unit Area Profit Output, etc. | |
| Economic Benefits | Unit Area Investment Intensity, Unit Area Tax Contribution, Net Value Added, etc. | ||
| Social Benefits | Unit Output Employment Rate, Pension Insurance Coverage, Per Capita Retail Sales, etc. | ||
| Ecological Benefits | Green Coverage Rate, Sewage Treatment Rate, Unit Output Energy Consumption Reduction Rate, etc. |
| Early Warning Level | Score Range (S) | Implications | Policy Recommendations |
|---|---|---|---|
| Normal | S ≥ 2.55 | Optimal land use and enterprise stability with high compatibility between firms and the industrial park. | Maintain current policies and support innovation. |
| Alert | 2.00 ≤ S < 2.55 | Potential efficiency decline or mismatched industries, requiring close monitoring. | Strengthen monitoring and optimize resource allocation. |
| Warning | 1.60 ≤ S < 2.00 | Significant inefficiencies, such as low land productivity or declining enterprises. | Adjust policies, promote industrial upgrades, and enhance land use strategies. |
| Response | S < 1.60 | Severe inefficiencies or high-risk enterprises, leading to resource wastage. | Implement urgent interventions, phase out inefficient enterprises, and initiate land redevelopment. |
Disclaimer/Publisher’s Note: The statements, opinions and data contained in all publications are solely those of the individual author(s) and contributor(s) and not of MDPI and/or the editor(s). MDPI and/or the editor(s) disclaim responsibility for any injury to people or property resulting from any ideas, methods, instructions or products referred to in the content. |
© 2025 by the authors. Licensee MDPI, Basel, Switzerland. This article is an open access article distributed under the terms and conditions of the Creative Commons Attribution (CC BY) license (https://creativecommons.org/licenses/by/4.0/).
Share and Cite
Tan, Z.; Dong, L.; Zhang, Z.; Li, H. Study on the Early Warning Mechanism for Industrial Land Redevelopment in High-Tech Zones: A Multi-Dimensional Evaluation Based on Enterprise Life Cycle, Park Compatibility, and Land Use Efficiency. Sustainability 2025, 17, 4256. https://doi.org/10.3390/su17104256
Tan Z, Dong L, Zhang Z, Li H. Study on the Early Warning Mechanism for Industrial Land Redevelopment in High-Tech Zones: A Multi-Dimensional Evaluation Based on Enterprise Life Cycle, Park Compatibility, and Land Use Efficiency. Sustainability. 2025; 17(10):4256. https://doi.org/10.3390/su17104256
Chicago/Turabian StyleTan, Zhiwen, Likuan Dong, Zhanlu Zhang, and Hao Li. 2025. "Study on the Early Warning Mechanism for Industrial Land Redevelopment in High-Tech Zones: A Multi-Dimensional Evaluation Based on Enterprise Life Cycle, Park Compatibility, and Land Use Efficiency" Sustainability 17, no. 10: 4256. https://doi.org/10.3390/su17104256
APA StyleTan, Z., Dong, L., Zhang, Z., & Li, H. (2025). Study on the Early Warning Mechanism for Industrial Land Redevelopment in High-Tech Zones: A Multi-Dimensional Evaluation Based on Enterprise Life Cycle, Park Compatibility, and Land Use Efficiency. Sustainability, 17(10), 4256. https://doi.org/10.3390/su17104256